Embed Size (px)
Citation preview

July 13, 2015
Initiating Coverage
ICICI Securities Ltd | Retail Equity Research
Health consciousness, capex to drive growth GSK Consumer Healthcare (GCHL) is one of the largest malt beverage companies in India with strong brands like Horlicks, Boost, Maltova & Viva. Over the years, it has been a leader in the malt beverage market with a combined volume market share of 66%. The company is also involved in selling & distributing some OTC products like Crocin, Eno, Sensodyne, Iodex & Breathe Right of GlaxoSmithKline Asia Pvt Ltd and GlaxoSmithKline Pharmaceuticals and generates auxiliary income. The brand equity of Horlicks & Boost, rapid pace of growth of OTC products & introduction of newer OTC products has led to revenue and PAT CAGR of 17.5% & 20.2%, respectively, in CY09-FY15. We believe the malt beverage industry in India is poised to witness swift growth led by higher disposable income, increase in rural penetration & premiumisation. We expect the company will witness a revenue & PAT CAGR of 15.3% & 17.7%, respectively, in FY15-17E. We initiate coverage on the company with a BUY recommendation. Undisputed market leadership GCHL has been a market leader in the HFD business with a market share of 58% by value (66% by volume) in a ~| 6000 crore industry. The malt based beverage market is estimated to have grown 2.7x from ~| 2200 crore in 2009 to ~| 6000 crore in 2014 and is expected to reach | 7800 crore by 2016. GCHL, being the established player in this segment, has benefitted as a result of this growth in the HFD industry. Auxiliary income augurs well GCHL also earns auxiliary income apart from the sale of products manufactured by it (Horlicks, Boost, Maltova, Viva). The company earns business auxiliary service commission from certain group companies for services rendered towards selling and distribution of the latter’s products. Auxiliary income witnessed strong CAGR of 27.1% from | 46.7 crore in CY09 to | 154.9 crore in FY15. We expect it to grow at 18.9% CAGR to | 219 crore in FY17E. Strong parentage with renowned global brands Strong brands of GlaxoSmithKline Plc, parent of GSK Consumer Healthcare, have always been an added advantage for the company. It has launched many products in India with similar brand names (Sensodyne, Parodontax). We believe it would continue to launch new products from its parent’s product portfolio and would continue to leverage its existing brand equity. Earnings growth justifies valuation Currently, the stock is trading at 31.5x its FY17E earnings of | 192.2/share, 15% premium to its historical average. With strong growth in revenue & earnings at 15.3% & 17.7%, respectively, during FY15-17E, we have valued the stock on a triangulated value of P/E, P/sales and DCF methodology, assigning a target price of | 7193/share.
Exhibit 1: Key financials (| Crore) CY12 FY14 FY15 FY16E FY17ENet Sales 3,187.5 4,868.6 4,307.6 4,775.6 5,505.6 EBITDA 573.4 872.8 730.1 880.2 1,033.3 Net Profit 436.7 674.7 583.6 690.8 808.3 EPS (|) 103.8 160.4 138.8 164.3 192.2 P/E (x) 58.4 37.8 43.7 36.9 31.5 Price / Book (x) 18.7 14.1 12.1 10.3 8.7 EV/EBITDA (x) 41.9 27.1 31.8 26.3 22.4 RoCE (%) 39.5 44.7 31.6 31.6 31.4 RoE (%) 32.1 37.2 27.6 27.8 27.7
Source: Company, ICICIdirect.com Research FY14 numbers are for 15 months
GSK Consumer Healthcare (SMIBC)| 6062
Rating Matrix
Rating : BuyTarget : | 7193Target Period : 12-15 monthsPotential Upside : 19%
YoY Growth (%) (YoY Growth) FY14 FY15 FY16E FY17ENet Sales 52.7 (11.5) 10.9 15.3 EBITDA 52.2 (16.3) 20.6 17.4 Net Profit 54.5 (13.5) 18.4 17.0 EPS (Rs) 54.5 (13.5) 18.4 17.0
* FY14 numbers are for 15 months
Current & target multiple FY14 FY15 FY16E FY17E
P/E 37.8 43.7 36.9 31.5 Target P/E 42.4 49.0 41.4 35.4 EV / EBITDA 27.1 31.8 26.3 22.4 P/BV 14.1 12.1 10.3 8.7 RoNW (%) 37.2 27.6 27.8 27.7 RoCE (%) 44.7 31.6 31.6 31.4
* FY14 numbers are for 15 months
Stock Data Bloomberg/Reuters Code SKB IN / GLSM.BOSensex 27,661.4 Average volumes 1,224.0 Market Cap (Rs crore) 25,494.4 52 week H/L 6575 / 4620Equity Capital (Rs crore) 42.1 Promoter's Stake (%) 72.5 FII Holding (%) 10.6 DII Holding (%) 2.4
Comparative return matrix (%) Return % 1M 3M 6M 12MGSK Consumer (1.9) (3.7) 5.8 29.1 Nestle India (1.5) (15.8) (6.7) 20.0 HUL 9.8 (3.2) 4.3 42.6 Colgate 4.9 (7.2) 3.7 29.3
Price movement
01,0002,0003,0004,0005,0006,0007,000
Jun-
10N
ov-1
0A
pr-1
1A
ug-1
1Ja
n-12
Jun-
12N
ov-1
2A
pr-1
3A
ug-1
3Ja
n-14
Jun-
14N
ov-1
4A
pr-1
5
0
2,000
4,000
6,000
8,000
10,000
Price (L.H.S) Nifty (R.H.S)
Research Analyst
Sanjay Manyal [email protected]
Parineeta Rajgarhia [email protected]

Page 2ICICI Securities Ltd | Retail Equity Research
Company background GlaxoSmithKline Consumer Healthcare (GCHL), headquartered in Gurgaon, is one of the leading consumer healthcare companies in India. The company traces its roots to Beecham (India) Pvt Ltd. in 1948. Institutions hold 12.95% of its shares, Horlicks Ltd holds 43.16% of its shares while GlaxoSmithKline Pte Ltd holds 29.29% of the shares. This translates to a promoter holding of 72.46% in the company. The public shareholding is at 14.59%, as on FY15. GCHL serves the Indian market as well as international markets of Sri Lanka, Bangladesh, Nepal, Middle East, Kenya, Malaysia, Myanmar and Pakistan. In its early years, Beecham (India) Pvt Ltd manufactured products like Brylcreem hair cream, Eno fruit salt, Pure Silvikrin, Silvikrin hair dressing, Macleans toothpaste and Macleans brand indigestion powder with technical and marketing know-how from Beecham Group Ltd, UK. After beginning its India operations as early as 1948, the company used to import its now ubiquitous health drink ‘Horlicks’ (manufactured by Horlicks Ltd, England), bottle it and sell it in India. The year 1955 saw a change in the import policy following which the import of Horlicks was stopped. It was in 1958 that the company started manufacturing Horlicks in India under the name Hindustan Milkfood Manufacturers Pvt Ltd, promoted by Horlicks Ltd.
GCHL is currently the largest player in the health food drinks (HFD) category. The company has been able to build a leadership position in the nutritional food segment with its product offerings viz. Horlicks, Boost, Maltova and Viva. GCHL also has Crocin, Eno and Iodex in its over the counter (OTC) portfolio. The company is also present in the premium toothpaste category with Sensodyne. GCHL also has Breathe Right nasal strips in its portfolio. The company manufactures and sells only products in its nutritional food segment. Also, GCHL derives business auxiliary service commission from certain group companies for services rendered towards selling and distribution of the latter’s products.
HFD has been the core competency of GCHL in India. The company’s flagship brand, Horlicks, commands a market share of 52.6% while Boost enjoys 13.4% market share. The nearest competitor, Cadbury’s Bournvita, has a market share of ~17% by volume in the above category. Thus, overall, the company occupies a dominant market position with 66% share by volume and 58% by value in FY15. The company had generated more than 90% of its revenues from malt based beverages alone in FY14.
Boost is one of the leading malt based HFDs available in chocolate flavour. It was developed by the company's R&D team in 1974 and launched in 1975-76. In south India, Boost has a market share of ~26%. In FY00, the company acquired two new brands Viva and Maltova along with their patents and trademarks from Jagatjit Industries for | 86.25 crore. This was done to consolidate its presence in the HFD segment and help it provide greater choice to its customers. The company has zero debt on its books. GCHL has its own manufacturing facilities at Nabha in Punjab, Rajahmundry in Andhra Pradesh and Sonepat in Haryana. The company’s strong position across its business has led its total operating income to grow at a CAGR of 17.5% from | 1921.5 crore in CY09 to | 4307.6 crore in FY15. Profitability for the same period grew at a CAGR of 20.2% from | 232.8 crore to | 583.6 crore.
Shareholding pattern (FY15)
Shareholding Pattern Holding (%)
Promoters 72.5
Institutional investors 13.0
Others 14.6
Institutional holding trend (%)
11.7 12.0 11.7 11.510.6
0.8 0.8 1.2 1.6 2.4
0.02.04.06.08.0
10.012.014.0
Q4FY14 Q1FY15 Q2FY15 Q3FY15 Q4FY15
FII DII

Page 3ICICI Securities Ltd | Retail Equity Research
Exhibit 2: Estimated GSK Consumer Healthcare revenue break-up (FY15)
GSK Consumer Healthcare Gross Sales (|4531 crore)
Malt-based foods ~91% of the Sales (|4126 crore)
Packaged foods~5% of the Sales
(|229 crore)
Horlicks ~76% of malt-based foods
sales (~|3150 crore)
Maltova & Vivaconstitute rest of malt-
based foods sales
Boost~21% of malt-based foods
sales (~|850 crore)
Business aux income & misc. income~4% of the Sales
(|176 crore)
Source: Company, ICICIdirect.com Research
Exhibit 3: Evolution of the company
Source: Company, ICICIdirect.com Research The years in the figure pertain to calendar year ending
Name of the company changed to HMM Ltd
1948 1949 1955 1958 1976 1979 1991 1994 2000 2002 2003 2008 2013
Involved primarily in dairy and milk products and toiletries business
Incorporated as Beecham (India) Pvt. Ltd
Launch of malt-based health food drink Boost
Name again changed to SmithKline Beecham Consumer Brands Ltd.
Introduced Women’s Horlicks
Import of Horlicks was stopped followed by India visit of team from Horlicks Ltd, UK
Horlicks manufactured in India by Hindustan Milkfood Manufacturers Pvt Ltd, promoted by Horlicks Ltd
Renamed as SmithKline Beecham Consumer Healthcare Ltd
Acquires Maltova and Viva brands from Jagatjit Industries Ltd
Manufactured Brylcreem, Eno, Silvikrin, Macleans while imported Horlicks in India
Rechristened as GlaxoSmithKline Consumer Healthcare Ltd.
Relaunched Horlicks, new flavours introduced in the market
Promoter company raises its stake in GSK Consumer Healthcare Ltd. to 72.5% from 43.16%

Page 4ICICI Securities Ltd | Retail Equity Research
Investment Rationale Enjoys undisputed market leadership currently Over the years, GSK Consumer Healthcare (GCHL) has been a market leader in the HFD business with a market share of 58% by value (66% by volume) in a ~| 6000 crore industry. The malt-based drinks category contributes ~91% of the revenues of the company. The malt based beverage market is estimated to have grown 2.7x from ~| 2200 crore in 2009 to ~| 6000 crore in 2014 and is expected to reach ~| 7800 crore by 2016. With higher health consciousness, large youth population, growing urbanisation & rising discretionary consumption, HFD remains one of the high growth segments. India is the largest malt based drinks market globally accounting for ~22% of retail volume sales. GSK, being the established player in this segment, has benefited with 17.5% CAGR in total operating income in CY09-FY15 along with volume CAGR of 9.4%. Going forward, we expect revenues to grow at 15.3% in FY15-17E backed by volume CAGR of 9.7%. GCHL’s nearest competition is from Mondelez’ Bournvita (~17% and 13.9% share by volume and value, respectively) and Heinz’s Complan (~11% and 10.1% share by volume and value, respectively). We believe the company’s strong brand equity in the segment, significant lead in market share compared to its competitors, comprehensive health drink portfolio and revival of urban discretionary demand, going forward, would maintain its leadership position in the HFD industry.
Exhibit 4: Total operating income growth of 15.3% expected in FY15-17E
1922 2306 2765 3187
48694308
49605725
0
1000
2000
3000
4000
5000
6000
CY09 CY10 CY11 CY12 FY14* FY15 FY16E FY17E
CAGR of 17.5%
CAGR of 15.3%
Source: Company, ICICIdirect.com Research * FY14 numbers are for 15 months
1) Over 2 billion cups of Horlicks are
consumed every year in India
2) India accounts for over 80% of
Horlicks’ global sales
3) According to a Nielsen study,
Horlicks was chosen as the Most
Trusted hot beverage in 2012
Source: Company, ICICIdirect.com Research

Page 5ICICI Securities Ltd | Retail Equity Research
Horlicks: Shining star in portfolio The fact that Horlicks has been present in India for more than 100 years has created a strong recall value for the brand in the minds of consumers. Horlicks, a white malt drink, remains the flagship brand for the company contributing more than 70% of sales. It occupies a leadership position in the domestic HFD category with a market share of 52.6% by volume and 46.6% by value. Horlicks is ~| 3000 crore brand while its variant Women’s Horlicks crossed the | 100 crore sales mark in 2013. With its strong brand equity, GCHL has been able to clock consistent double digit revenue growth since 2006.
Exhibit 5: Volume market share (%) - FY15E
Horlicks52.6%
Bournvita17%
Boost13.4%
Complan11%
Others6%
Source: Company, ICICIdirect.com Research
Exhibit 6: Value market share (%) - FY15E
Horlicks46.6%
Bournvita13.9%
Boost11.3%
Complan10.1%
Others18.1%
Source: Company, ICICIdirect.com Research
Boost: Firmly ensconced in third position In the brown malted food drinks, chocolate-flavoured Boost is GSK’s key brand and is positioned against competitors like Bournvita. It is ranked third in the overall HFD category with 13.4% market share by volume and 11.3% share by value. However, in south India, Boost enjoys a market share of 26%. It has enabled the company to cater to consumers (especially in the northern and western parts of India) who do not prefer white malted food drinks, which are more popular in south and east India. GCHL has invested in advertisement and promotion (A&P) expenditure in the Boost brand over the years. The company has promoted the brand with advertisements featuring its brand ambassadors (Kapil Dev in 1980s and Sachin Tendulkar in 1990s). Virender Sehwag and Mahendra Singh Dhoni joined as brand ambassadors in 2001 and 2008 respectively. Currently, Virat Kohli has been the brand ambassador for Boost since 2013. According to our estimates, in the brown malted drink category, Mondelez’ Bournvita remains a market leader with ~40% market share. Boost remains a close second with ~32% market share.
Sturdy volume growth GCHL’s HFD category witnessed robust volume growth at 8.1% CAGR in CY02-07 and 9.4% CAGR in CY07-FY15E. Being the market leader, GCHL was the main beneficiary of the HFD category performing well in the past decade due to increasing health consciousness. It posted strong overall volume growth at 9.4% CAGR in CY09-FY15. As urban demand contributes 74% of GCHL’s revenues, the company witnessed muted volume growth in 2014 as urban demand itself was subdued during this period. Moreover, we believe that in Q4FY15, the overall HFD industry suffered a volume contraction. However, the company was able to increase its market share by 130 bps while Horlicks and Boost gained 120 bps and 20 bps, respectively, in market share during Q4FY15. After static volume growth in Q4FY15, we believe that with a revival in urban discretionary consumption, going forward, volume growth for the company may see an improvement. We expect overall volume growth of 9.5% in FY16E and 9.9% in FY17E.
Malt is one of the most diuretic beverages

Page 6ICICI Securities Ltd | Retail Equity Research
Exhibit 7: HFD volume, realisation growth trend for GCHL (%)
-5%
0%
5%
10%
15%
20%
25%
CY03 CY04 CY05 CY06 CY07 CY08 CY09 CY10 CY11 CY12 FY14* FY15E FY16E FY17E
Volume growth (%) Realization growth (%)
Source: Company, ICICIdirect.com Research *FY14 numbers are annualised
Exhibit 8: Overall volume growth for GCHL (%)
02468
1012141618
Q2CY
11
Q3CY
11
Q4CY
11
Q1CY
12
Q2CY
12
Q3CY
12
Q4CY
12
Q1FY
14
Q2FY
14
Q3FY
14
Q4FY
14
Q5FY
14
Q1FY
15
Q2FY
15
Q3FY
15
Q4FY
15
Average ~7% growth
Average ~9.4% growth
Average ~2.5% growth
Source: Company, ICICIdirect.com Research
Focus on innovation to offer wider assortment GSK has been at the forefront in responding to the demands of consumers and launched innovative products in the market. The company drove line extensions for the Horlicks base brand, which was primarily promoted as the family health drink with the launch of Horlicks Junior for toddlers in the age group of 1-3 years in 1995 (there are ~11.7 crore children in the age group 0-4 years as per Census 2011), Mother’s Horlicks for the nutritional needs of pregnant and breastfeeding women (launched in 1997), Horlicks Lite with no added sugar for diabetics (launched in 2005) and Women’s Horlicks (launched in 2008). By successfully launching variants from time to time, GSK has strengthened its core brand values, apart from addressing new consumer needs, thus bringing such consumers into its fold. These variants have helped the base brand to capture and retain market share.
According to our estimates, GCHL’s malt-based foods
portfolio witnessed volume growth of 8.9% CAGR in CY02-
FY15

Page 7ICICI Securities Ltd | Retail Equity Research
Exhibit 9: Horlicks base brand & variants’ contribution in Horlicks sales
84 77 75
16 23 25
0102030405060708090
100
2007 2011 2014
Base brand Variants & product extensions
Source: Company, ICICIdirect.com Research
Leveraging premiumisation, non-malted food drink category to its advantage GCHL took the premiumisation route in 2011 with the launch of Horlicks Gold. In FY14, the company launched 11 new or restage products including Horlicks ProMind, Horlicks Kesar Badam (60% premium to basic Horlicks), Boost biscuit and Horlicks Nutribic, premium nutrition biscuits. In FY15, GCHL launched seven new or restage products. Although the foods business contributes ~5% to revenues, it has been growing at more than 20% in the last 10 quarters. Horlicks Oats, which marked the company’s foray into the breakfast category in 2011, more than doubled its business during FY14 and captured second position in terms of market share in South India. Under the foods portfolio, the company expects 15% sustainable growth in Horlicks biscuits, going ahead. GCHL plans to launch ‘Instant Horlicks’ that can be consumed with cold water rather than the usual practice of having it with hot/warm water/milk. This is basically to beat the company’s seasonality in sales. The company has expertise when it comes to R&D capabilities by looking at its products. It claims to have some innovative product offerings in development, thus making the innovation pipeline robust in the medium to long term. The management also believes that price hikes of 6-7% can be absorbed in the long run on the back of the pricing power it commands.
Exhibit 10: Variants of Horlicks, Boost & competitive brands Brand Variant Qty (|) Brand Variant Qty (|) Brand Variant Qty (|) Brand Variant Qty (|)
Horlicks Regular 1 kg 372 Boost 3x Stamina 750 g 315 Bournvita Cadbury 1 kg 380 Complan Plain 500 g 209
Chocolate 1 kg 370 Choco Éclair 450 g 225 L'il Champs 500 g 250 Chocolate 1 kg 445
Lite 450 g 250 Shakti 500 g 200 Kesar Badam 400 g 235
Mother's 500 g 450 5 Star 500 g 190 Pista Badam 400 g 235
Junior 500 g 245 Memory 400 g 245/275
Kesar Badam 400 g 240 NutriGro 400 g 275
Women's 400 g 260 Choco Royale 400 g 360
ProMind 400 g 245 Kulfi 400 g 235
Source: Company, ICICIdirect.com Research
GCHL has strategically launched different variants at the time of slowing of its base brand Horlicks. However, other variants of Horlicks are witnessing strong growth. Women’s Horlicks has been growing at 60-65% YoY, albeit on a small base. Thus, with the base brand witnessing a slowdown in growth, we expect these line extensions and premium offerings to support Horlicks and thereby, contribute in driving the next level of growth for the company.

Page 8ICICI Securities Ltd | Retail Equity Research
Exhibit 11: Revenue from malt-based food
1340 1633 1924 2284 2656 3056 4682 4126 4834 55990
1000
2000
3000
4000
5000
6000
CY07
CY08
CY09
CY10
CY11
CY12
FY14
*
FY15
FY16
E
FY17
E
Revenue from malt-based food (| crore)
Source: Company, ICICIdirect.com Research * FY14 numbers are for 15 months
Exhibit 12: Revenue from packaged foods
48 60 90136 169 200
273229 267
314
050
100150200250300350
CY07 CY08 CY09 CY10 CY11 CY12 FY14* FY15 FY16E FY17E
Revenue from packaged foods (| crore)
Source: Company, ICICIdirect.com Research * FY14 numbers are for 15 months
Auxiliary income augurs well GCHL also earns auxiliary income apart from the sale of products manufactured by it (Horlicks, Boost, Maltova, and Viva). The company earns business auxiliary service commission from certain group companies (GlaxoSmithKline Asia Pvt Ltd and GlaxoSmithKline Pharmaceuticals) for services rendered towards selling and distribution of the latter’s products (Crocin, Eno, Iodex, Breathe Right, Sensodyne). Auxiliary income witnessed strong CAGR of 26.4% from | 46.7 crore in CY09 to | 154.9 crore in FY15.
The digestive antacid market in India is estimated at ~ | 800 crore (2012-13). The liquid and tablet formats represent 55% of the total digestive antacid market in India while powders comprise the remaining 45%. GSK has cemented its position with Eno powder and has a 41% market share. The company introduced liquid and tablet versions of its Eno brand in 2013 to further strengthen its leadership position in the digestive antacid market in India. India is Eno’s second largest market after Brazil. Eno is currently growing at ~30%. This bodes well for GCHL.
Exhibit 13: Auxiliary income (| crore) trend
46.7 54.472.5
97.2
168.1154.9
183.9
219.0
0.0
50.0
100.0
150.0
200.0
250.0
CY09 CY10 CY11 CY12 FY14* FY15 FY16E FY17E
Auxiliary income (| crore)
CAGR of 27.1%
CAGR of 18.9%
Source: Company, ICICIdirect.com Research * FY14 numbers are for 15 months
Compared to the global oral hygiene market, which is expected to grow at 3-4% CAGR, India’s market is expected to grow at 14% CAGR. The size of the Indian oral hygiene industry is ~| 8000 crore of which toothpastes account for ~| 6000 crore. The broad segments in toothpaste category are germ and tooth decay, sensitivity, gel, gum, whitening and multi-benefits.
I-direct estimate of OTC Products Sales (FY14E)
Brand Sales (in | crore)
ENO 400
Crocin 120
Iodex 100
Sensodyne 240
Ostocalcium 42 Source: Company, ICICIdirect.com Research
Page 9ICICI Securities Ltd | Retail Equity Research
Sensitivity is the fastest growing segment with a growth rate of ~30% and estimated at ~| 950 crore. Sensodyne, launched by GSK in 2011, became the market leader within two years (26% share in 2014) by displacing Colgate Sensitive toothpaste in the premium sensitive toothpaste category. It has already become ~| 240 crore brand. OTC products do not require authorisation by medical practitioner unlike prescription medications. OTC products also have wider points of sale as they can be availed at retail outlets (~88 lakh retail outlets across India). However, prescription medicines can be accessed only through the chemist network (~8 lakh chemists across India). According to the company, there is no risk of the auxiliary income being re-negotiated with group companies. It expects auxiliary income to grow at 15-20% on a long term basis. It earned | 154.9 crore as auxiliary income in FY15. With Eno and Sensodyne performing well in their respective categories and growing at ~30% on a low base, we believe overall this augurs well for GCHL, going forward, with prospects of increased auxiliary income adding to the revenues. We expect auxiliary income to grow at 18.9% CAGR to | 219 crore in FY17E.
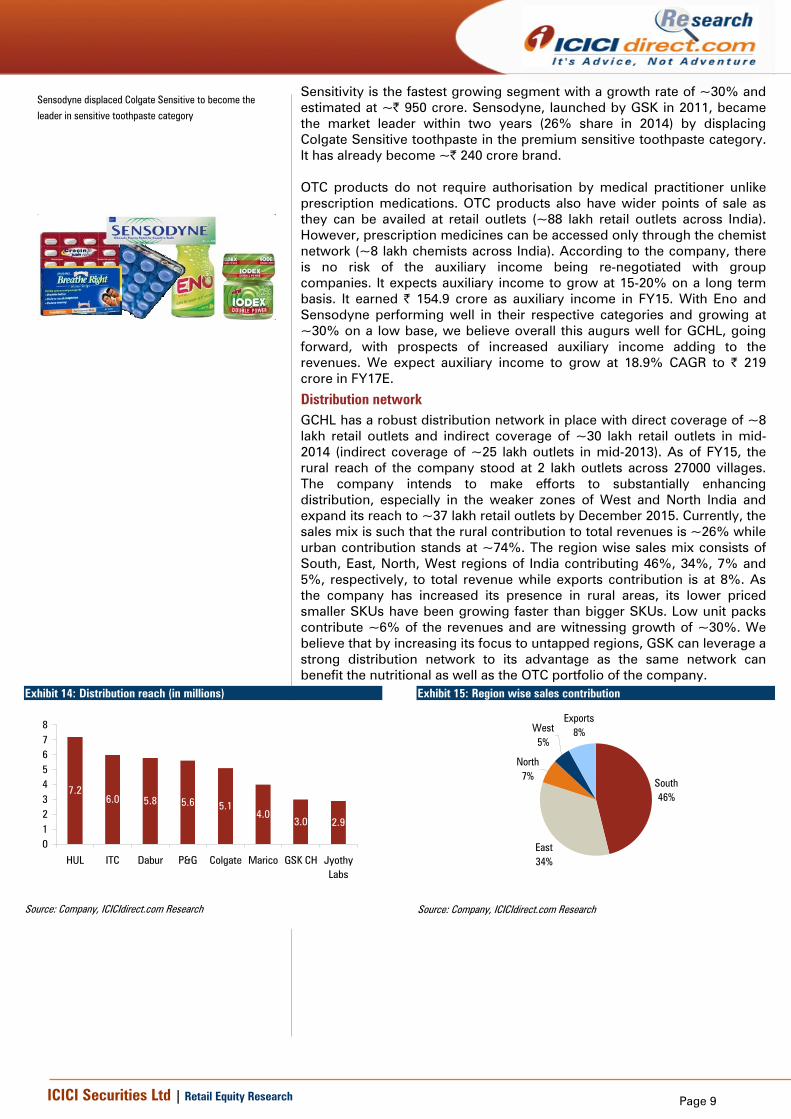
Distribution network GCHL has a robust distribution network in place with direct coverage of ~8 lakh retail outlets and indirect coverage of ~30 lakh retail outlets in mid-2014 (indirect coverage of ~25 lakh outlets in mid-2013). As of FY15, the rural reach of the company stood at 2 lakh outlets across 27000 villages. The company intends to make efforts to substantially enhancing distribution, especially in the weaker zones of West and North India and expand its reach to ~37 lakh retail outlets by December 2015. Currently, the sales mix is such that the rural contribution to total revenues is ~26% while urban contribution stands at ~74%. The region wise sales mix consists of South, East, North, West regions of India contributing 46%, 34%, 7% and 5%, respectively, to total revenue while exports contribution is at 8%. As the company has increased its presence in rural areas, its lower priced smaller SKUs have been growing faster than bigger SKUs. Low unit packs contribute ~6% of the revenues and are witnessing growth of ~30%. We believe that by increasing its focus to untapped regions, GSK can leverage a strong distribution network to its advantage as the same network can benefit the nutritional as well as the OTC portfolio of the company.
Exhibit 14: Distribution reach (in millions)
7.26.0 5.8 5.6 5.1
4.03.0 2.9
012345678
HUL ITC Dabur P&G Colgate Marico GSK CH JyothyLabs
Source: Company, ICICIdirect.com Research
Exhibit 15: Region wise sales contribution
South46%
East34%
North7%
West5%
Exports8%
Source: Company, ICICIdirect.com Research
Sensodyne displaced Colgate Sensitive to become the
leader in sensitive toothpaste category

Page 10ICICI Securities Ltd | Retail Equity Research
Higher A&P spend to help increase footprint, fuel growth for company The sales and promotion expenditure, as a percentage of total operating income, for GCHL has been on the higher side compared to its peers. By maintaining higher advertisement expenses (~60% of total A&P expenses), the company has been able to effectively drive penetration and the overall industry’s growth through increasing awareness of health benefits of HFD, thereby supporting its new launches. The A&P spend as a percentage of sales for GCHL has increased from 12.6% in CY08 to 16.7% in FY15. For the last five years, A&P expenditure has been consistently above 15.5% of its total operating income. The company re-launched Horlicks and ran an advertisement campaign in 2003 to change its positioning as a nutritional supplement designed specifically for growing children (there are ~35.7 crore children in the age group of 0-14 years as per Census 2011). This campaign was successful and the company benefited from this re-launch. Further, GCHL spends ~40% of its total A&P spend on promotional activities. The company has also introduced various campaigns like ‘5 Signs of Growth’, ‘Horlicks Swasthya Abhiyan’, ‘Village Level Entrepreneurs’ in order to achieve further market penetration in rural territories and at the same time strengthen its market share. Going ahead, A&P expenses estimated by the company are 16-17% of sales. They are also open to tweaking the same, on the higher side, to enhance productivity. We believe GCHL would continue to remain the dominant player. The company would benefit in terms of boost in volume growth on the back of sustained high A&P spend without any significant impact on margins, going forward.
Exhibit 16: GSK A&P spend (| crore)
303372
438 496
811717
831959
0
200
400
600
800
1000
CY09
CY10
CY11
CY12
FY14
*
FY15
FY16
E
FY17
E
14%15%15%16%16%17%17%18%18%
A&P spend (| crore) % of total operating income
Source: Company, ICICIdirect.com Research * FY14 numbers are for 15 months
Exhibit 17: FMCG companies A&P spend as % of net sales (FY15)
9.612.8
17.3
8.4
18.1
0
5
10
15
20
Nestle* HUL GSKConsumerHealthcare
Britannia Colgate
Source: Company, ICICIdirect.com Research *CY14 value
Huge capex planned GCHL has exhausted its current capacity. Considering the rising consumer demand for healthier products, the management has huge capital expansion plans. The company plans to set up a greenfield plant in south India. In a discussion we had with the company, they said they have been aggregating significant cash on their balance sheet with this purpose on mind. The cash on its balance sheet was at | 1838 crore in FY14 and | 2296 crore in FY15. The company is planning a capex of ~| 1500 crore in the next three to four years.
For the last five years, A&P expenditure as a percentage of
total operating income has been above 15.5% for GSK
Consumer Healthcare
Page 11ICICI Securities Ltd | Retail Equity Research
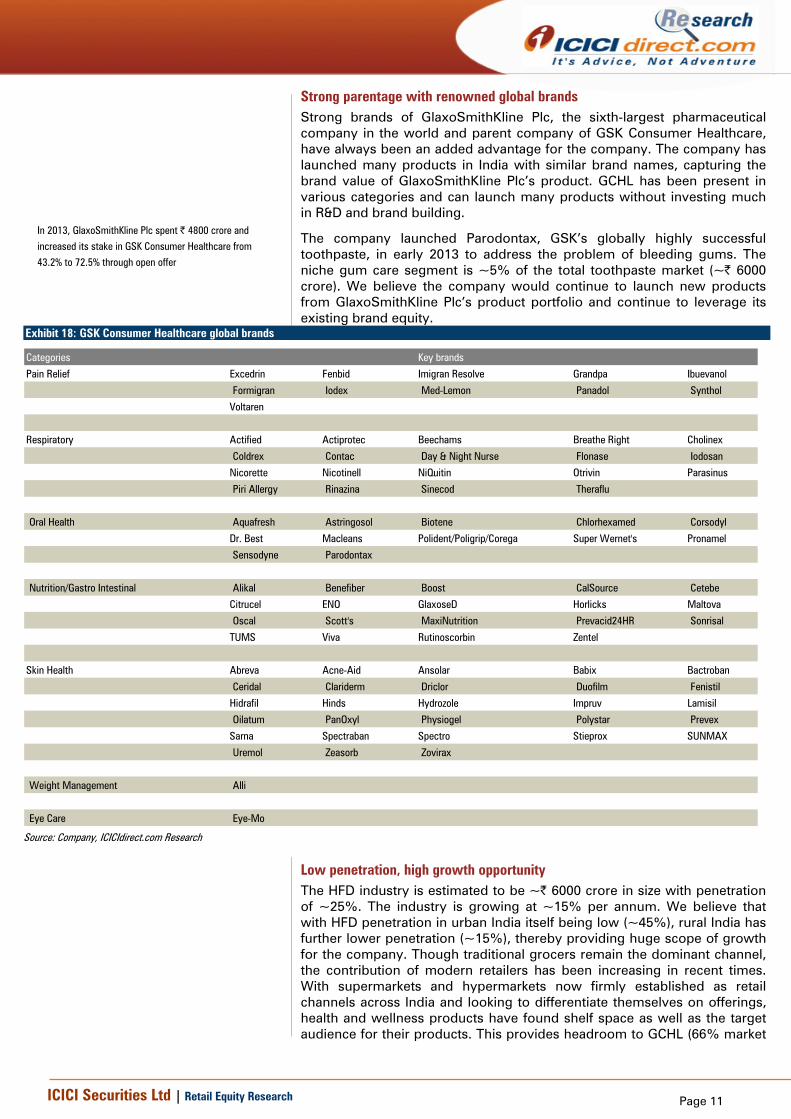
Strong parentage with renowned global brands Strong brands of GlaxoSmithKline Plc, the sixth-largest pharmaceutical company in the world and parent company of GSK Consumer Healthcare, have always been an added advantage for the company. The company has launched many products in India with similar brand names, capturing the brand value of GlaxoSmithKline Plc’s product. GCHL has been present in various categories and can launch many products without investing much in R&D and brand building.
The company launched Parodontax, GSK’s globally highly successful toothpaste, in early 2013 to address the problem of bleeding gums. The niche gum care segment is ~5% of the total toothpaste market (~| 6000 crore). We believe the company would continue to launch new products from GlaxoSmithKline Plc’s product portfolio and continue to leverage its existing brand equity.
Exhibit 18: GSK Consumer Healthcare global brands
Categories Key brands
Pain Relief Excedrin Fenbid Imigran Resolve Grandpa Ibuevanol
Formigran Iodex Med-Lemon Panadol Synthol
Voltaren
Respiratory Actified Actiprotec Beechams Breathe Right Cholinex
Coldrex Contac Day & Night Nurse Flonase Iodosan
Nicorette Nicotinell NiQuitin Otrivin Parasinus
Piri Allergy Rinazina Sinecod Theraflu
Oral Health Aquafresh Astringosol Biotene Chlorhexamed Corsodyl
Dr. Best Macleans Polident/Poligrip/Corega Super Wernet's Pronamel
Sensodyne Parodontax
Nutrition/Gastro Intestinal Alikal Benefiber Boost CalSource Cetebe
Citrucel ENO GlaxoseD Horlicks Maltova
Oscal Scott's MaxiNutrition Prevacid24HR Sonrisal
TUMS Viva Rutinoscorbin Zentel
Skin Health Abreva Acne-Aid Ansolar Babix Bactroban
Ceridal Clariderm Driclor Duofilm Fenistil
Hidrafil Hinds Hydrozole Impruv Lamisil
Oilatum PanOxyl Physiogel Polystar Prevex
Sarna Spectraban Spectro Stieprox SUNMAX
Uremol Zeasorb Zovirax
Weight Management Alli
Eye Care Eye-Mo Source: Company, ICICIdirect.com Research
Low penetration, high growth opportunity The HFD industry is estimated to be ~| 6000 crore in size with penetration of ~25%. The industry is growing at ~15% per annum. We believe that with HFD penetration in urban India itself being low (~45%), rural India has further lower penetration (~15%), thereby providing huge scope of growth for the company. Though traditional grocers remain the dominant channel, the contribution of modern retailers has been increasing in recent times. With supermarkets and hypermarkets now firmly established as retail channels across India and looking to differentiate themselves on offerings, health and wellness products have found shelf space as well as the target audience for their products. This provides headroom to GCHL (66% market
In 2013, GlaxoSmithKline Plc spent | 4800 crore and
increased its stake in GSK Consumer Healthcare from
43.2% to 72.5% through open offer

Page 12ICICI Securities Ltd | Retail Equity Research
share) with potential growth opportunity to cater to the untapped market. This allows the company further scope to penetrate the Indian market on the back of GCHL’s robust distribution network (direct coverage of ~8 lakh retail outlets and indirect coverage of ~30 lakh retail outlets in mid 2014). Benign commodity prices to further aid margins
GCHL’s key raw materials include malt and malt extract, milk powder and liquid milk. These materials together account for more than 60% of total cost incurred by the company on raw materials. With the recent downtrend in global commodity prices, we believe domestic prices would remain softer in the medium-term, consequently benefiting GCHL. It provides scope for a further improvement in margins, going forward.
Exhibit 19: Milk prices trend
20
25
30
35
40
45
Jun-
10
Oct-1
0
Feb-
11
Jun-
11
Oct-1
1
Feb-
12
Jun-
12
Oct-1
2
Feb-
13
Jun-
13
Oct-1
3
Feb-
14
Jun-
14
Oct-1
4
Feb-
15
Jun-
15
Milk prices (| per litre)
Source: Company, ICICIdirect.com Research
Exhibit 20: Global milk prices trend
0
5
1015
20
25
30
May
-09
Nov
-09
May
-10
Nov
-10
May
-11
Nov
-11
May
-12
Nov
-12
May
-13
Nov
-13
May
-14
Nov
-14
May
-15
Milk prices ($ per 100 pounds)
Source: Company, ICICIdirect.com Research
Exhibit 21: Milk powder prices trend
120
170
220
270
320
Jun-
10
Nov
-10
Apr-1
1
Sep-
11
Feb-
12
Jul-1
2
Dec-
12
May
-13
Oct-1
3
Mar
-14
Aug-
14
Jan-
15
Jun-
15
Milk powder prices (| per kg)
Source: Company, ICICIdirect.com Research
Exhibit 22: Barley prices trend
1011121314151617
Jun-
10
Dec-
10
Jun-
11
Dec-
11
Jun-
12
Dec-
12
Jun-
13
Dec-
13
Jun-
14
Dec-
14
Jun-
15Barley prices (| per kg)
Source: Company, ICICIdirect.com Research

Page 13ICICI Securities Ltd | Retail Equity Research
Robust balance sheet
Commanding a dominant market share in the HFD segment, GCHL has been able to consistently lower its working capital intensity through expansion in supplier credit while there has not been any significant increase in debtor days at the same time. This was possible mainly because GCHL enjoys significant buying power. This has enabled the company to register negative working capital with healthy cash flows. Also, GCHL has zero net debt on its books in FY15. The company plans to expand its capacity with a planned greenfield project. GCHL has specifically accumulated a cash pile for this purpose (| 1838 crore in FY14 and | 2296 crore in FY15). Going forward, with judicious utilisation of cash available on the balance sheet either by way of capex plans or by way of higher dividend payout, we expect return ratios to improve.
Exhibit 23: Negative working capital cycle
-158
-353 -376
-601
-683 -680
-584
-749
-800
-700
-600
-500
-400
-300
-200
-100
0
CY09 CY10 CY11 CY12 FY14* FY15 FY16E FY17E
Working capital excluding cash (| crore)
Source: Company, ICICIdirect.com Research * FY14 numbers are for 15 months

Page 14ICICI Securities Ltd | Retail Equity Research
Key Financials Strong revenue growth of 15.3% expected in FY15-17E
GSK Consumer Healthcare’s revenues have more than doubled in the past five years from | 1921.5 crore in CY09 to | 4307.6 crore in FY15 at a CAGR of 17.5%. This increase in revenues has been led by a mix of both volume growth (9.4% CAGR) and realisation growth (7.4% CAGR). With its strengthening distribution network (from direct coverage of 3.5 lakh retail outlets in 2009 to over 8 lakh retail outlets in 2014), significant lead in market share over rivals and launch of innovative variants to support base brand Horlicks, we believe GCHL would be able to maintain high volume growth of 9.7% along with 5.1% realisation growth. We estimate revenues will grow at healthy 15.3% CAGR during FY15-17E. Exhibit 24: Revenues (| crore) trend
19222306
27653187
48694308
4960
5725
0
1000
2000
3000
4000
5000
6000
CY09 CY10 CY11 CY12 FY14* FY15 FY16E FY17E
Total operating
Source: Company, ICICIdirect.com Research * FY14 numbers are for 15 months
Margins to post steady improvement to 18% by FY17E
GCHL’s operating margins increased from 16% in CY09 to 17.9% in FY14. A change in product mix and sustainable price hikes taken by the company have led to an uptick in operating margins. However, margins dipped to 16.9% in FY15 on the back of higher employee cost and persistently higher A&P expenses. We believe a further increase in A&P spends and expiry of tax benefits at the Baddi facility in May 2015 would impact margins negatively. The excise duty as percentage of net sales was at ~5.3% in CY09-FY14. Going forward, we expect excise duty as a percentage of net sales to increase to 6.5% in FY16E and 7% in FY17E. However, we expect benign raw material costs to more than offset the negative impact of higher A&P spend. We model operating margins of 17.7% in FY16E and 18% in FY17E.

Page 15ICICI Securities Ltd | Retail Equity Research
Exhibit 25: Operating margins (%) trend
16.0% 16.2%
18.1% 18.0% 17.9%
16.9%17.7% 18.0%
10%
12%
14%
16%
18%
20%
CY09 CY10 CY11 CY12 FY14* FY15 FY16E FY17E
Source: Company, ICICIdirect.com Research * FY14 numbers are for 15 months
Net profit to grow 17.7% in FY15-17E GCHL posted 20.2% CAGR increase in its profit during CY09-FY15 largely on the back of improved operating margins. We estimate depreciation will increase, going forward (| 95 crore in FY16E and | 117 crore in FY17E compared to | 62.1 crore in FY15) due to the capex plans of the company. We expect net profit growth at 17.7% CAGR during FY15-17E.
Exhibit 26: PAT (| crore) trend
233 300 355437
675584
691808
0
100
200300
400
500
600
700
800
900
CY09 CY10 CY11 CY12 FY14* FY15 FY16E FY17E
PAT (| crore)
CAGR of 20.2%
CAGR of 17.7%
Source: Company, ICICIdirect.com Research * FY14 numbers are for 15 months
Return ratios GCHL’s return ratios have been in the lower range (~35-40%) compared to other FMCG companies. This is because it has huge cash accumulated on its balance sheet (| 1464.1 crore in CY12, | 1838.7 crore in FY14 and | 2296.5 crore in FY15). However, we believe that once the company uses this cash for its capex plans, its return ratios would improve post-FY17E as some tangible improvement in return ratios would take some time to reflect after it has done the capex in FY16E-17E.

Page 16ICICI Securities Ltd | Retail Equity Research
Exhibit 27: Return ratios trend (%)
29.234.8
39.8 39.544.7
31.6 31.6 31.4
25.731.3 31.0 32.1
37.2
27.6 27.8 27.7
05
101520253035404550
CY09 CY10 CY11 CY12 FY14* FY15 FY16E FY17E
RoCE (%) RoNW (%)
Source: Company, ICICIdirect.com Research * FY14 numbers are for 15 months
Free cash flow GCHL has consistently delivered high cash flows (average of over | 400 crore since CY09) from its business operations. Due to such high free cash flows, the company can undertake capex plans using internal accruals without having to rely much on external sources of funds. We expect sustainable free cash flows of ~| 300-400 crore despite aggressive capex plans in next 3-4 years.
Exhibit 28: Free cash flow (| crore) trend
455.0417.2
338.2
622.9
771.4
425.3
339.6
432.2
200
300
400
500
600
700
800
900
CY09 CY10 CY11 CY12 FY14* FY15 FY16E FY17E
Free Cash Flow (| crore)
Source: Company, ICICIdirect.com Research * FY14 numbers are for 15 months

Page 17ICICI Securities Ltd | Retail Equity Research
Risk & concerns Regulatory risk With more than 70% of GCHL’s revenues being derived from sales of its flagship white malt drink Horlicks, the company is largely dependent on one product for a significant portion of revenues. There exists regulatory risk pertaining to failure to conform to quality standards and comply with procedures laid down by respective government authorities. We believe that any adverse impact witnessed in this product may hamper the company’s growth prospects.
Presence of competing MNCs in HFD category The HFD business contributes more than 90% to GCHL’s revenues. Though it currently enjoys a dominant position in the market, it faces competition in the form of Bournvita (Mondelez) and Complan (Heinz). Both products enjoy high brand equities. Cadbury and Heinz are both keen to further expand given the fact that the lucrative HFD market is still substantially under-penetrated and has high growth potential. Hence, the aggressive expansion plans of these MNCs may play spoilsport for GCHL’s growth prospects.
Expiry of tax benefits at Baddi may impact margins For the unit set up in Baddi in 2005 (Legacy Foods), GCHL enjoyed tax benefits in the form of excise duty exemption from the Central Government. This benefitted 55% of the company’s products. However, this tax exemption expired in May 2015 while a 7% excise duty is expected to come back. This may impact gross margins as the excise rate is likely to increase, going forward.
Commodity price volatility
Barley and milk are two key ingredients (more than 60% of total raw material cost), which reflects dominantly in the raw material cost sheet of the company. Being commodities, they are vulnerable to price fluctuations in the market, thereby impacting the operating margins of the company.
Threat of increase in royalty paid to parent firm
Formerly, there was a cap on ‘Royalty payable under technical collaboration’, which was set at 8% on export sales and 5% on domestic sales. The Government of India did away this limit on royalty payments in 2009. In Budget 2013, the government raised the tax rate on royalty and fee for technical services paid to overseas entities from 10% to 25%. However, in Budget 2015, the government reduced this tax rate from 25% to 10%. We believe currently GSK Consumer Healthcare pays royalty to its parent company towards the sale of Horlicks in India. We estimate that the royalty percentage is ~5% on sales of Horlicks while it is ~3.3% of total sales. We remain wary of the fact that a possible increase in royalty payments to the parent company may impact operating margins of GCHL.
Low return ratios may prove to be a drag
We believe that presence of significant cash (| 2296.5 crore in FY15) on the company’s balance sheet is a major reason behind lower return ratios as compared to its peers. Inability to utilise this cash either in the form of capacity expansion or by way of dividend payout may further pressurise the ratios, going forward.

Page 18ICICI Securities Ltd | Retail Equity Research
Valuation We have valued the stock on a triangulated value of P/E, P/sales & DCF methodology, assigning a target price of | 7193/share. Historically, GCHL has traded at~6% premium to the FMCG index. PE band At the CMP, the stock is trading at 36.9x its FY16E of | 164.3 and 31.5x its FY17E EPS of | 192.2, which is at a 15% premium to its historic average (average has been more than 27x one year forward P/E). We believe this premium is justified due to healthy growth in revenues (17.5% CAGR) and earnings (20.2% CAGR) from CY09-FY15, leadership position in the HFD market, strong free cash flows and visibility in earnings growth. Going ahead, we expect the revenue and earnings to post a CAGR of 15.3% and 17.7%, respectively, in FY15-17E. We assign the stock a P/E multiple of 35x its FY17E EPS of | 192.2 to arrive at a fair value of | 6803/share.
Exhibit 29: Price to earnings (x) trend
05
1015202530354045
Dec-
09
Jun-
10
Dec-
10
Jun-
11
Dec-
11
Jun-
12
Dec-
12
Jun-
13
Dec-
13
Jun-
14
Dec-
14
Source: Company, ICICIdirect.com Research
Exhibit 30: One year forward P/E (x)
010002000300040005000600070008000
Dec-
09
Jun-
10
Dec-
10
Jun-
11
Dec-
11
Jun-
12
Dec-
12
Jun-
13
Dec-
13
Jun-
14
Dec-
14
Jun-
15
Dec-
15
Close (|) 16x 22x 28x 34x 40x
Source: Company, ICICIdirect.com Research
Price to sales (P/Sales) At the CMP, the stock is trading at 5.3x its FY16E sales/share of | 1135.6 and 4.6x its FY17E sales/share of | 1309.1. Historically, the stock has traded in the range of 2.3-5.5x its sales per share. Using P/S valuation, assigning it a multiple of 6x its FY17E sales/share 1309.1, the fair value for GCHL would be | 8051/share.
Exhibit 31: Price to sales (x) trend
0
1
2
3
4
5
6
Dec-
09
Apr-1
0
Aug-
10
Dec-
10
Apr-1
1
Aug-
11
Dec-
11
Apr-1
2
Aug-
12
Dec-
12
Apr-1
3
Aug-
13
Dec-
13
Apr-1
4
Aug-
14
Dec-
14
Apr-1
5
Source: Company, ICICIdirect.com Research

Page 19ICICI Securities Ltd | Retail Equity Research
DCF valuation Using the DCF methodology, we have arrived at a fair value of | 6699/share, considering a terminal growth of 6% and weighted average cost of capital (WACC) of 9.5%. We have assumed the company would witness revenue growth (CAGR FY15-25E) of 16.5%, operating margins of 17.8% and average tax rate of 29.6% till 2025 given the corporate tax is likely to come down in the next decade.
Exhibit 32: DCF valuation | (crore) CY09 CY10 CY11 CY12 FY14 FY15 FY16E FY17E FY18E FY19E FY19E
EBITDA 306.6 374.1 501.0 573.4 872.8 730.1 696.4 814.2 1,122.4 1,307.7 1,307.7 Depreciation 42.0 39.7 46.0 36.1 62.5 62.1 95.0 116.9 83.4 97.1 97.1 Tax 121.1 152.0 185.1 211.9 341.3 305.5 349.6 390.9 332.5 375.3 375.3 NOPAT 143.5 182.4 269.9 325.4 468.9 362.5 251.8 306.4 706.6 835.3 835.3 Capital Expenditu 47.7 118.1 85.3 77.3 49.8 217.8 350.0 657.7 128.3 149.4 149.4 Change in Workin (227.9) (195.4) (22.3) (225.0) (82.8) 3.4 96.2 (164.7) (149.4) (148.2) (148.2) Free Cash Flow 365.7 299.5 252.9 509.1 564.5 203.4 (99.4) (69.7) 811.1 931.1 931.1
DCF Valuation | crorePV of firm 27,355.1 AssumptionsLess: Current Debt - WACC 9.5%Total present value of Equity 27,355.1 Revenue CAGR over CY09 - FY25E 16.4%Cash Per Share 194.9 Terminal Growth 6.0%Number of Equity Shares outstan 4.2 DCF - Target price (|) 6,699.5
Source: Company, ICICIdirect.com Research
Exhibit 33: DCF sensitivity analysis
8.5% 9.0% 9.5% 10.0% 10.5%5.0% 7,578 6,426 5,545 4,851 4,2925.5% 8,577 7,123 6,049 5,227 4,5796.0% 9,983 8,055 6,700 5,698 4,9306.5% 12,109 9,368 7,570 6,305 5,3707.0% 15,697 11,352 8,795 7,118 5,938
WACC %
Term
inal
Gr
owth
Rat
e %
Source: Company, ICICIdirect.com Research
Triangulated valuation We assign a weight of 0.33x to the value arrived at from DCF, P/E and P/sales valuation, respectively. We arrive at a target price of | 7193/share.
Exhibit 34: Triangulated valuation Multiple (x) Fair value (|) Weightage Value (|)
Mcap to sales 6.0 8,051.2 0.3 2,737.4 PE 35.0 6,803.6 0.3 2,245.2 DCF 6,699.5 0.3 2,210.8
Target Price 7,193.4 CMP 6,062.2
Upside (%) 19 Rating Buy
Source: Company, ICICIdirect.com Research

Page 20ICICI Securities Ltd | Retail Equity Research
Exhibit 35: Peer comparison
CMP M Cap(|) TP(|) Rating (| Cr) FY15E FY16E FY17E FY15E FY16E FY17E FY15E FY16E FY17E FY15E FY16E FY17E FY15E FY16E FY17E
Colgate (COLPAL) 1,989 2,036 Hold 27,525 41.1 45.5 49.8 48.4 44.8 40.0 7.0 6.6 5.8 97.0 82.5 77.1 72.5 62.2 56.6Dabur India (DABIND) 282 263 Hold 44,816 6.1 7.4 8.1 46.4 35.4 34.7 5.8 5.2 4.6 41.7 41.7 38.2 35.6 34.4 30.6GSK Consumer Healthcare 6,062 7,193 Buy 25,494 138.8 164.3 192.2 43.7 43.8 31.5 5.9 5.3 4.6 31.6 31.6 31.4 27.6 27.8 27.7Hindustan Unilever (HINLEV) 900 902 Hold 194,712 19.9 20.4 24.4 45.1 44.2 37.0 6.5 5.9 5.2 132.2 132.3 134.3 118.0 115.9 107.0ITC Limited (ITC) 310 387 Buy 252,116 12.1 12.6 13.7 25.7 30.8 22.6 7.0 6.4 5.9 40.5 41.1 43.4 33.5 31.3 31.8Jyothy Lab (JYOLAB) 301 272 Hold 4,724 6.7 10.5 11.6 45.0 25.9 25.9 3.1 2.8 2.5 10.6 13.9 15.8 11.1 15.5 21.7Marico (MARIN) 430 420 Hold 24,506 8.9 2.8 2.7 48.4 151.4 161.9 4.3 3.6 3.1 48.8 47.0 46.4 35.9 32.1 31.6Nestle (NESIND) 5,963 6,039 Hold 57,126 122.9 75.6 120.8 48.5 79.9 49.4 5.8 6.3 5.1 60.6 56.1 85.9 47.2 41.8 32.8Tata Global Bev (TATTEA) 135 158 Hold 9,029 4.0 6.3 7.4 33.6 25.1 18.3 1.2 1.1 1.0 8.1 8.0 8.6 8.2 4.2 6.3VST Industries (VSTIND) 1,693 1,700 Hold 2,674 99.3 88.2 106.3 17.1 19.3 15.9 3.2 3.2 2.9 59.3 52.5 60.3 45.8 43.2 37.5
Sector / CompanyRoE (%)EPS (|) P/E (x) Price/Sales (x) RoCE (%)
Source: Company, ICICIdirect.com Research

Page 21ICICI Securities Ltd | Retail Equity Research
Exhibit 36: Profit & loss account
(| Crore) CY12 FY14 FY15 FY16E FY17ENet Sales 3,187.5 4,868.6 4,307.6 4,775.6 5,505.6 Other Operating Income - - - 183.9 219.0 Total Operating Income 3,187.5 4,868.6 4,307.6 4,959.5 5,724.6 Other Income 113.8 206.9 221.9 255.2 282.9 Total Revenue 3,301.3 5,075.5 4,529.5 5,214.7 6,007.5
Raw Material Expenses 924.5 1,368.8 1,220.1 1,375.4 1,570.3 Employee Expenses 301.1 470.1 431.3 478.6 552.4 Marketing Expenses 496.5 810.6 717.1 830.7 958.9 Administrative Expenses 191.9 284.1 297.0 332.3 383.5 Packaging Exp 241.9 361.9 322.0 362.0 417.9 Manufacturing Exp 296.7 440.9 414.7 448.8 518.1 Power & Fuel 62.9 98.2 80.9 100.2 115.6 Royalty 105.6 156.8 134.4 158.7 183.2 Mis Exp 7.6 (4.4) 3.0 2.5 2.9 Total Operating Expenditure 2,614.1 3,995.8 3,577.5 4,079.3 4,691.3
EBITDA 573.4 872.8 730.1 880.2 1,033.3 Interest 2.4 1.1 0.7 - - PBDT 684.8 1,078.6 951.2 1,135.4 1,316.1 Depreciation 36.1 62.5 62.1 95.0 116.9 PBT 648.7 1,016.1 889.1 1,040.4 1,199.2 Total Tax 211.9 341.3 305.5 349.6 390.9 PAT 436.7 674.7 583.6 690.8 808.3
EPS 103.8 160.4 138.8 164.3 192.2 Source: Company, ICICIdirect.com Research * FY14 numbers are for 15 months

Page 22ICICI Securities Ltd | Retail Equity Research
Exhibit 37: Balance sheet
X
(| Crore) CY12 FY14 FY15 FY16E FY17EEquity Capital 42.1 42.1 42.1 42.1 42.1 Reserve and Surplus 1,318.8 1,770.7 2,070.9 2,439.7 2,876.4 Total Shareholders funds 1,360.9 1,812.8 2,112.9 2,481.7 2,918.4 Total Debt - - - - - Deferred Tax Liability - - - - - Other Non Current Liabilities - - 9.9 9.9 9.9
Liability side total 1,360.9 1,812.8 2,330.5 2,699.3 3,136.0
Total Gross Block 656.2 854.6 1,059.3 1,409.3 1,709.3 Less Total Accumulated Depreciation 462.4 514.7 567.5 662.6 779.5 Net Block 193.8 339.9 491.7 746.7 929.8 Total CWIP 197.2 38.5 42.3 42.3 400.0 Total Fixed Assets 391.1 378.4 534.1 789.0 1,329.8
Inventory 369.6 407.4 466.3 523.4 527.9 Debtors 112.6 299.3 313.4 287.8 331.8 Loans and Advances 66.8 75.5 85.2 238.8 275.3 Other Current Assets 43.8 132.9 144.0 119.4 137.6 Cash 1,464.1 1,838.7 2,296.4 2,334.0 2,394.7 Total Current Assets 2,057.0 2,753.8 3,305.3 3,503.4 3,667.4
Creditors 478.4 671.6 759.8 850.5 980.4 Provisions 352.1 394.0 395.1 425.2 490.2 Other Current Liabilities 363.0 533.0 534.1 477.6 550.6 Total Current Liabilities 1,193.5 1,598.6 1,689.0 1,753.2 2,021.2 Net Current Assets 863.5 1,155.2 1,616.3 1,750.2 1,646.1 Deferred Tax Assets 61.6 90.3 104.3 84.3 84.3 Long-term loans and advances 44.7 188.9 75.7 75.7 75.7
Assets side total 1,360.9 1,812.8 2,330.5 2,699.3 3,136.0
Source: Company, ICICIdirect.com Research * FY14 numbers are for 15 months

Page 23ICICI Securities Ltd | Retail Equity Research
Exhibit 38: Cash flow statement
(| Crore) CY12 FY14 FY15 FY16E FY17EProfit after Tax 436.7 674.7 583.6 690.8 808.3 Depreciation 36.1 62.5 62.1 95.0 116.9 Cash Flow before working capital cha 475.3 738.4 646.4 785.8 925.2 Inventory 0.3 (37.8) (58.8) (57.1) (4.6) Debtors (13.4) (186.7) (14.0) 25.5 (44.0) Loans and Advances (6.8) (8.7) (9.8) (153.5) (36.5) Other Current Assets (10.4) (89.1) (11.1) 24.6 (18.2) Net Increase in Current Assets (30.3) (322.3) (93.7) (160.5) (103.3) Creditors 119.1 193.2 88.2 90.7 130.0 Provisions 77.4 41.9 1.2 30.1 65.0 Other Current Liabilities 58.7 170.1 1.0 (56.5) 73.0 Net Increase in Current Liabilities 255.2 405.1 90.4 64.3 268.0 Net CF from operating activities 700.2 821.2 643.0 689.6 1,089.9
Deferred Tax Assets (21.7) (28.7) (14.0) 20.0 - Fixed assets - - - - - Long-term loans and advances 5.8 (144.2) 113.1 - - (Purchase)/Sale of Fixed Assets (77.3) (49.8) (217.8) (350.0) (657.7) Deferred Tax Liability - - - - - Other Non Current Liabilities - - 9.9 - - Net CF from investing activities (93.3) (222.7) 98.9 (330.0) (657.7)
Total Outflow on account of dividend (220.0) (222.9) (278.4) (322.0) (371.6) Net CF from financing activities (222.4) (223.9) (284.2) (322.0) (371.6)
Net Cash flow 384.6 374.5 457.7 37.6 60.6 Opening cash 1,079.6 1,464.1 1,838.7 2,296.4 2,334.0 Closing cash 1,464.1 1,838.7 2,296.4 2,334.0 2,394.7
Source: Company, ICICIdirect.com Research * FY14 numbers are for 15 months
Page 24ICICI Securities Ltd | Retail Equity Research
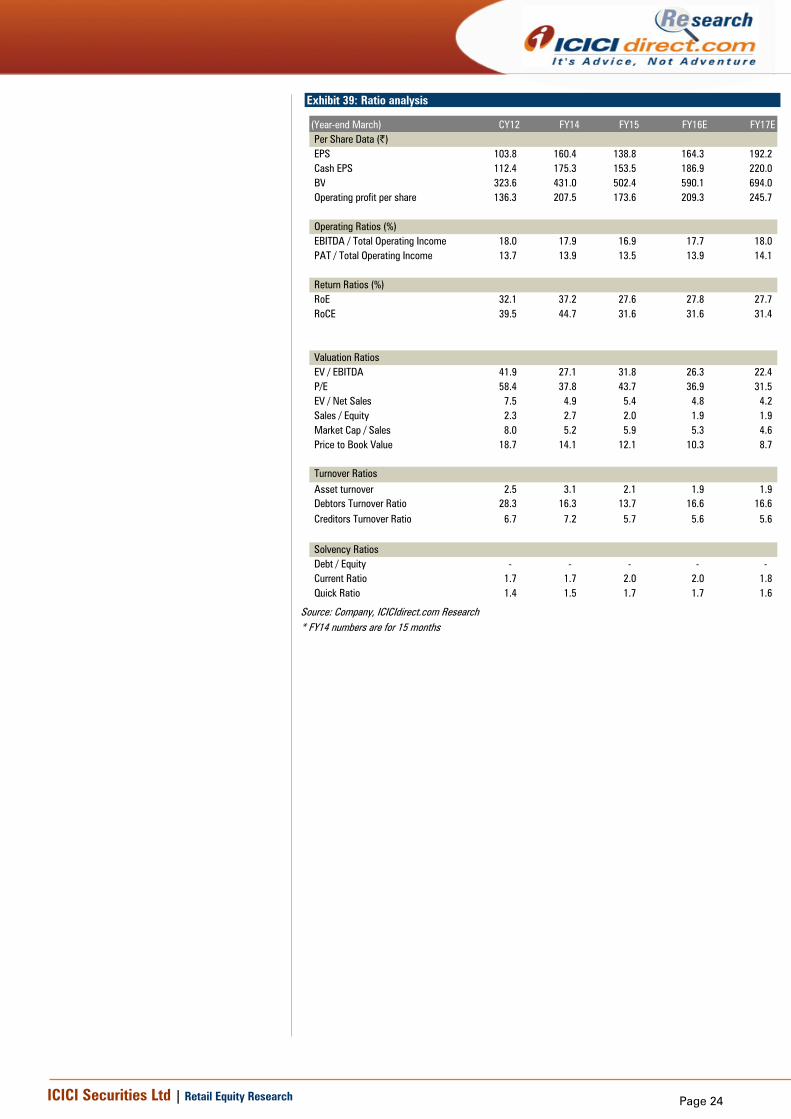
Exhibit 39: Ratio analysis
(Year-end March) CY12 FY14 FY15 FY16E FY17EPer Share Data (|)EPS 103.8 160.4 138.8 164.3 192.2 Cash EPS 112.4 175.3 153.5 186.9 220.0 BV 323.6 431.0 502.4 590.1 694.0 Operating profit per share 136.3 207.5 173.6 209.3 245.7
Operating Ratios (%)EBITDA / Total Operating Income 18.0 17.9 16.9 17.7 18.0 PAT / Total Operating Income 13.7 13.9 13.5 13.9 14.1
Return Ratios (%)RoE 32.1 37.2 27.6 27.8 27.7 RoCE 39.5 44.7 31.6 31.6 31.4
Valuation RatiosEV / EBITDA 41.9 27.1 31.8 26.3 22.4 P/E 58.4 37.8 43.7 36.9 31.5 EV / Net Sales 7.5 4.9 5.4 4.8 4.2 Sales / Equity 2.3 2.7 2.0 1.9 1.9 Market Cap / Sales 8.0 5.2 5.9 5.3 4.6 Price to Book Value 18.7 14.1 12.1 10.3 8.7
Turnover RatiosAsset turnover 2.5 3.1 2.1 1.9 1.9 Debtors Turnover Ratio 28.3 16.3 13.7 16.6 16.6 Creditors Turnover Ratio 6.7 7.2 5.7 5.6 5.6
Solvency RatiosDebt / Equity - - - - - Current Ratio 1.7 1.7 2.0 2.0 1.8 Quick Ratio 1.4 1.5 1.7 1.7 1.6
Source: Company, ICICIdirect.com Research * FY14 numbers are for 15 months

Page 25ICICI Securities Ltd | Retail Equity Research
ANALYST CERTIFICATION We /I, Abhishek Shindadkar, MBA and Hardik Varma, MBA, Research Analysts, authors and the names subscribed to this report, hereby certify that all of the views expressed in this research report accurately reflect our views about the subject issuer(s) or securities. We also certify that no part of our compensation was, is, or will be directly or indirectly related to the specific recommendation(s) or view(s) in this report.
Terms & conditions and other disclosures: ICICI Securities Limited (ICICI Securities) is a full-service, integrated investment banking and is, inter alia, engaged in the business of stock brokering and distribution of financial products. ICICI Securities is a wholly-owned subsidiary of ICICI Bank which is India’s largest private sector bank and has its various subsidiaries engaged in businesses of housing finance, asset management, life insurance, general insurance, venture capital fund management, etc. (“associates”), the details in respect of which are available on www.icicibank.com. ICICI Securities is one of the leading merchant bankers/ underwriters of securities and participate in virtually all securities trading markets in India. We and our associates might have investment banking and other business relationship with a significant percentage of companies covered by our Investment Research Department. ICICI Securities generally prohibits its analysts, persons reporting to analysts and their relatives from maintaining a financial interest in the securities or derivatives of any companies that the analysts cover. The information and opinions in this report have been prepared by ICICI Securities and are subject to change without any notice. The report and information contained herein is strictly confidential and meant solely for the selected recipient and may not be altered in any way, transmitted to, copied or distributed, in part or in whole, to any other person or to the media or reproduced in any form, without prior written consent of ICICI Securities. While we would endeavour to update the information herein on a reasonable basis, ICICI Securitiesis is under no obligation to update or keep the information current. Also, there may be regulatory, compliance or other reasons that may prevent ICICI Securities from doing so. Non-rated securities indicate that rating on a particular security has been suspended temporarily and such suspension is in compliance with applicable regulations and/or ICICI Securities policies, in circumstances where ICICI Securities might be acting in an advisory capacity to this company, or in certain other circumstances. This report is based on information obtained from public sources and sources believed to be reliable, but no independent verification has been made nor is its accuracy or completeness guaranteed. This report and information herein is solely for informational purpose and shall not be used or considered as an offer document or solicitation of offer to buy or sell or subscribe for securities or other financial instruments. Though disseminated to all the customers simultaneously, not all customers may receive this report at the same time. ICICI Securities will not treat recipients as customers by virtue of their receiving this report. Nothing in this report constitutes investment, legal, accounting and tax advice or a representation that any investment or strategy is suitable or appropriate to your specific circumstances. The securities discussed and opinions expressed in this report may not be suitable for all investors, who must make their own investment decisions, based on their own investment objectives, financial positions and needs of specific recipient. This may not be taken in substitution for the exercise of independent judgment by any recipient. The recipient should independently evaluate the investment risks. The value and return on investment may vary because of changes in interest rates, foreign exchange rates or any other reason. ICICI Securities accepts no liabilities whatsoever for any loss or damage of any kind arising out of the use of this report. Past performance is not necessarily a guide to future performance. Investors are advised to see Risk Disclosure Document to understand the risks associated before investing in the securities markets. Actual results may differ materially from those set forth in projections. Forward-looking statements are not predictions and may be subject to change without notice. ICICI Securities or its associates might have managed or co-managed public offering of securities for the subject company or might have been mandated by the subject company for any other assignment in the past twelve months. ICICI Securities or its associates might have received any compensation from the companies mentioned in the report during the period preceding twelve months from the date of this report for services in respect of managing or co-managing public offerings, corporate finance, investment banking or merchant banking, brokerage services or other advisory service in a merger or specific transaction. ICICI Securities or its associates might have received any compensation for products or services other than investment banking or merchant banking or brokerage services from the companies mentioned in the report in the past twelve months. ICICI Securities encourages independence in research report preparation and strives to minimize conflict in preparation of research report. ICICI Securities or its analysts did not receive any compensation or other benefits from the companies mentioned in the report or third party in connection with preparation of the research report. Accordingly, neither ICICI Securities nor Research Analysts have any material conflict of interest at the time of publication of this report. It is confirmed that Abhishek Shindadkar, MBA and Hardik Varma, MBA, Research Analysts of this report have not received any compensation from the companies mentioned in the report in the preceding twelve months. Compensation of our Research Analysts is not based on any specific merchant banking, investment banking or brokerage service transactions. ICICI Securities or its subsidiaries collectively or Research Analysts do not own 1% or more of the equity securities of the Company mentioned in the report as of the last day of the month preceding the publication of the research report. Since associates of ICICI Securities are engaged in various financial service businesses, they might have financial interests or beneficial ownership in various companies including the subject company/companies mentioned in this report. It is confirmed that Abhishek Shindadkar, MBA and Hardik Varma, MBA, Research Analysts do not serve as an officer, director or employee of the companies mentioned in the report. ICICI Securities may have issued other reports that are inconsistent with and reach different conclusion from the information presented in this report. Neither the Research Analysts nor ICICI Securities have been engaged in market making activity for the companies mentioned in the report. We submit that no material disciplinary action has been taken on ICICI Securities by any Regulatory Authority impacting Equity Research Analysis activities. This report is not directed or intended for distribution to, or use by, any person or entity who is a citizen or resident of or located in any locality, state, country or other jurisdiction, where such distribution, publication, availability or use would be contrary to law, regulation or which would subject ICICI Securities and affiliates to any registration or licensing requirement within such jurisdiction. The securities described herein may or may not be eligible for sale in all jurisdictions or to certain category of investors. Persons in whose possession this document may come are required to inform themselves of and to observe such restriction.
RATING RATIONALE ICICIdirect.com endeavours to provide objective opinions and recommendations. ICICIdirect.com assigns ratings to its stocks according to their notional target price vs. current market price and then categorises them as Strong Buy, Buy, Hold and Sell. The performance horizon is two years unless specified and the notional target price is defined as the analysts' valuation for a stock. Strong Buy: >15%/20% for large caps/midcaps, respectively, with high conviction; Buy: >10%/15% for large caps/midcaps, respectively; Hold: Up to +/-10%; Sell: -10% or more;
Pankaj Pandey Head – Research [email protected]
ICICIdirect.com Research Desk, ICICI Securities Limited, 1st Floor, Akruti Trade Centre, Road No 7, MIDC, Andheri (East) Mumbai – 400 093

Page 26ICICI Securities Ltd | Retail Equity Research
ANALYST CERTIFICATION We /I, Sanjay Manyal, MBA (Finance) and Parineeta Rajgarhia, MBA (Finance), Research Analysts, authors and the names subscribed to this report, hereby certify that all of the views expressed in this research report accurately reflect our views about the subject issuer(s) or securities. We also certify that no part of our compensation was, is, or will be directly or indirectly related to the specific recommendation(s) or view(s) in this report.
Terms & conditions and other disclosures: ICICI Securities Limited (ICICI Securities) is a full-service, integrated investment banking and is, inter alia, engaged in the business of stock brokering and distribution of financial products. ICICI Securities is a wholly-owned subsidiary of ICICI Bank which is India’s largest private sector bank and has its various subsidiaries engaged in businesses of housing finance, asset management, life insurance, general insurance, venture capital fund management, etc. (“associates”), the details in respect of which are available on www.icicibank.com. ICICI Securities is one of the leading merchant bankers/ underwriters of securities and participate in virtually all securities trading markets in India. We and our associates might have investment banking and other business relationship with a significant percentage of companies covered by our Investment Research Department. ICICI Securities generally prohibits its analysts, persons reporting to analysts and their relatives from maintaining a financial interest in the securities or derivatives of any companies that the analysts cover. The information and opinions in this report have been prepared by ICICI Securities and are subject to change without any notice. The report and information contained herein is strictly confidential and meant solely for the selected recipient and may not be altered in any way, transmitted to, copied or distributed, in part or in whole, to any other person or to the media or reproduced in any form, without prior written consent of ICICI Securities. While we would endeavour to update the information herein on a reasonable basis, ICICI Securitiesis is under no obligation to update or keep the information current. Also, there may be regulatory, compliance or other reasons that may prevent ICICI Securities from doing so. Non-rated securities indicate that rating on a particular security has been suspended temporarily and such suspension is in compliance with applicable regulations and/or ICICI Securities policies, in circumstances where ICICI Securities might be acting in an advisory capacity to this company, or in certain other circumstances. This report is based on information obtained from public sources and sources believed to be reliable, but no independent verification has been made nor is its accuracy or completeness guaranteed. This report and information herein is solely for informational purpose and shall not be used or considered as an offer document or solicitation of offer to buy or sell or subscribe for securities or other financial instruments. Though disseminated to all the customers simultaneously, not all customers may receive this report at the same time. ICICI Securities will not treat recipients as customers by virtue of their receiving this report. Nothing in this report constitutes investment, legal, accounting and tax advice or a representation that any investment or strategy is suitable or appropriate to your specific circumstances. The securities discussed and opinions expressed in this report may not be suitable for all investors, who must make their own investment decisions, based on their own investment objectives, financial positions and needs of specific recipient. This may not be taken in substitution for the exercise of independent judgment by any recipient. The recipient should independently evaluate the investment risks. The value and return on investment may vary because of changes in interest rates, foreign exchange rates or any other reason. ICICI Securities accepts no liabilities whatsoever for any loss or damage of any kind arising out of the use of this report. Past performance is not necessarily a guide to future performance. Investors are advised to see Risk Disclosure Document to understand the risks associated before investing in the securities markets. Actual results may differ materially from those set forth in projections. Forward-looking statements are not predictions and may be subject to change without notice. ICICI Securities or its associates might have managed or co-managed public offering of securities for the subject company or might have been mandated by the subject company for any other assignment in the past twelve months. ICICI Securities or its associates might have received any compensation from the companies mentioned in the report during the period preceding twelve months from the date of this report for services in respect of managing or co-managing public offerings, corporate finance, investment banking or merchant banking, brokerage services or other advisory service in a merger or specific transaction. ICICI Securities or its associates might have received any compensation for products or services other than investment banking or merchant banking or brokerage services from the companies mentioned in the report in the past twelve months. ICICI Securities encourages independence in research report preparation and strives to minimize conflict in preparation of research report. ICICI Securities or its analysts did not receive any compensation or other benefits from the companies mentioned in the report or third party in connection with preparation of the research report. Accordingly, neither ICICI Securities nor Research Analysts have any material conflict of interest at the time of publication of this report. It is confirmed that Sanjay Manyal, MBA (Finance) and Parineeta Rajgarhia, MBA (Finance), Research Analysts of this report have not received any compensation from the companies mentioned in the report in the preceding twelve months. Compensation of our Research Analysts is not based on any specific merchant banking, investment banking or brokerage service transactions. ICICI Securities or its subsidiaries collectively or Research Analysts do not own 1% or more of the equity securities of the Company mentioned in the report as of the last day of the month preceding the publication of the research report. Since associates of ICICI Securities are engaged in various financial service businesses, they might have financial interests or beneficial ownership in various companies including the subject company/companies mentioned in this report. It is confirmed Sanjay Manyal, MBA (Finance) and Parineeta Rajgarhia, MBA (Finance), Research Analysts do not serve as an officer, director or employee of the companies mentioned in the report. ICICI Securities may have issued other reports that are inconsistent with and reach different conclusion from the information presented in this report. Neither the Research Analysts nor ICICI Securities have been engaged in market making activity for the companies mentioned in the report. We submit that no material disciplinary action has been taken on ICICI Securities by any Regulatory Authority impacting Equity Research Analysis activities. This report is not directed or intended for distribution to, or use by, any person or entity who is a citizen or resident of or located in any locality, state, country or other jurisdiction, where such distribution, publication, availability or use would be contrary to law, regulation or which would subject ICICI Securities and affiliates to any registration or licensing requirement within such jurisdiction. The securities described herein may or may not be eligible for sale in all jurisdictions or to certain category of investors. Persons in whose possession this document may come are required to inform themselves of and to observe such restriction.