Embed Size (px)
Citation preview

Asia Pacific Equity Research
26 November 2010
Top StoriesHon Hai Precision (N), Taiwan Sunil GargPrice target reduced to NT$115 – too early to buy (852) 2800-8518
[email protected](Gokul Hariharan) Send me your feedback!Although Hon Hai has underperformed PC stocks in the last three months, we advise investors to wait until OP margins trough in 1Q/2Q11, or below 10x FY11 earnings. While growth from Apple is likely to remain strong, we believe margins need to stabilize for the stock to perform again. Buy closer to NT$100.
AM perspectiveAdrian Mowat, Chief Equity Strategist FDI in non-China Asia increases
Indo Malaysia Phil China Thail$ bn6.9 8.6 2.9 2007 138.4 11.39.3 7.2 1.5 2008 147.8 8.6Indika Energy (OW), Indonesia 4.9 1.4 1.9 6.02009 78.2
Initiate with OW and Rp5,000 PT – 35% upside Source: CEIC. (Stevanus Juanda) Higher labor costs, strengthening Renminbi and
tensions between Japan and China improve the attractiveness of other emerging markets for FDI. The main beneficiaries are ASEAN, Turkey and Mexico. A small change in China's share of FDI could lead to a large increase in FDI in ASEAN as shown in the table. We are overweight on ASEAN and Turkey. For more please see Asian Year Ahead 2011- Stock Ideas for the Year of the Rabbit, Mowat et al, 15 November 2010
We see Indika as one of the most attractively priced Indonesian coal companies with a promising growth profile. Strong earnings growth in FY10E (50.4%) and FY11E (54.1%) and the planned spin-off of Petrosea in FY11E will drive the share price’s outperformance vs. the JCI in the next 6-12 months, in our view.
Sinopac Financial Holdings (OW), Taiwan Trading gains boost 3Q results, but business could slow down(Dexter Hsu)3Q10 net income beat consensus and our full-year forecast due to strong stock trading gains. We expect the strong outlook for the broker business to provide upside potential; however, from historical experience, the recent management re-shuffle could lead to slow business growth which might not offset rising costs
Construction, Malaysia Major infrastructure project awards in sight(Mak Hoy Kit)The stocks within our construction sector universe have an attractive estimated two-year EPS CAGR of 22.3% on average. IJM (OW, PT: M$6.44) is our top large-cap construction pick, while WCT (OW, PT: M$3.80) is our top mid-cap pick. We are Neutral on Gamuda as MRT tunneling works are largely priced in, in our view.
Shipbuilding, South Korea Signs of a cyclical recovery(Jinmook Kim)According to Korea Economic Daily, DSME was selected as the preferred bidder of Maersk’s 20-container-ship order, worth $4B. Although this order is positive for DSME’s order book, we see more meaningful implications for the recovery cycle of the sector in 2011. We prefer Hyundai Heavy as a proxy to a cyclical recovery.
Click below for the: J.P. Morgan Daily ValuationsLatest Weekly AP Banks Analyzer (.xls)Daily Global Economic Briefing
Link to Other FTMs pageLink to Morgan Markets page
See the end pages of each individual note for analyst certification and important disclosures, including non-US analyst disclosures. J.P. Morgan does and seeks to do business with companies covered in its research reports. As a result, investors should be aware that the firm may have a conflict of interest that could affect the objectivity of this report. Investors should consider this report as only a single factor in making their investment decision.
渐飞研究报告 - http://bg.panlv.net
• Economy, TIP Markets (Matt Hildebrandt) Recommendation and Forecast Changes
Philippines: another weak Asian GDP report • Genting Plantations (Neutral), Malaysia (Simone Yeoh)
• Economy, TIPV Markets (Matt Hildebrandt) 3Q10 results in line; prefer Sime and KLK Vietnam: another disappointing trade report
• Hite Brewery (Underweight), South Korea (Jinah Lee) Imported beer penetration to accelerate Results and Company Views
• Hon Hai Precision (Neutral), Taiwan (Gokul Hariharan) • Genting (Overweight), Malaysia (Hoy Kit Mak) Stuck in transition; too early to buy Genting Singapore drives 3Q10 earnings - ALERT
• Indika Energy (Overweight), TIP Markets (Stevanus Juanda)
• Genting Malaysia (Overweight), Malaysia (Hoy Kit Mak)
Share price re-rating, attractive valuation and Petrosea spin-off - Initiating with OW
3Q10 results reveal weakness in operating trends - ALERT
• JSW Energy Ltd. (Neutral), India (Shilpa Krishnan) • Lee & Man Paper Manufacturing (Overweight), Hong Kong (Leon Chik, CFA)
Benefits of African coal mine acquisition will take awhile to play out - ALERT
Near term margin recovery and more aggressive expansion • MISC Berhad (Neutral), Malaysia (Simone Yeoh) • Vanguard International Semiconductor Corporation
(Underweight), Taiwan (Rick Hsu) 1HFY11 results and analyst briefing - ALERT
• Nestlé India Limited (Neutral), India (Latika Chopra, CFA)
Inventory correction could take longer
Strategy Analyst Meet Takeaways : On a high capex trajectory
• Siemens India (Neutral), India (Sumit Kishore) • Market Strategy, Asia Pacific (Adrian Mowat) Healthy execution and margin improvement in the Sep-q Consensus Asset Allocation: Emerging Markets Equity
Strategy Sector Research
• Market Strategy, Asia Pacific (Adrian Mowat) • Integrated Oils, Exploration & Production, China
(Brynjar Eirik Bustnes) China oil and gas demand: Expected drop in Chinese diesel exports not yet materialized
• Mining, India (Pinakin Parekh, CFA) India Iron ore: Oct exports decline 30% y/y; Export ban in Karnataka- While appeal likely in SC, Feb-11 next important date
Emerging Markets Strategy Dashboards
Economics • Economy, Hong Kong (Lu Jiang)
Exports slide further in October
• Economy, South Korea (James DH Lee) consumer sentiment advanced in November
渐飞研究报告 - http://bg.panlv.net

Asia Analyst Focus List Company Name Ticker Analyst Rating
Mkt. Cap (MM)
Mkt. Cap (US$ MM)
Focus List Add Date
Focus List Add Price
Close 11/25/10
Target Price
Date Target Price Set
Australia Aristocrat Leisure Limited (A$) ALL AU Stuart Jackson, CFA OW 1778 1744 30-Oct-09 4.52 3.33 4.60 11-Nov-10 Campbell Brothers Limited (A$) CPB AU Alexander Mees, ACA OW 2367 232 2
40 9-Sep-09 24.33 35.35 38.87
3.3 18-Nov-1 02-Aug-10 iiNet (A$) I AU IN L urent Horrut a O W 41 5 7 2-Aug-10 2. 78 2.7 3 3
China Baoshan Iron & Steel – A (Rmb) 600019 CH Nathan M. Zibilich, CFA OW 113478 17063 12-Oct-10 7.11 6.48 10.00 12-Oct-10 China Merchants Bank Co., Ltd - A (HK$) 600036 CH Samuel Chen OW 307690 46266 29-Apr-10 13.82 13.48 19.1 0
7. 8-Aug-10
Industrial and Commercial Bank of China - A (Rmb) 6 1398 CH 0 Samuel Chen O W 1599768 240549 30-O -09ct 4. 95 4.3 9 0 11-Nov-10 Hong Kong AAC Acoustic (HK$) 2018 HK Charles Guo OW 24806 3197 8-Sep-09 6.91 20.20 22.0 0
5.4 2-Nov-10
Bank of China 'H' (HK$) 3988 HK Samuel Chen OW 1105200 142443 4-Mar-09 2.16 4.16 27-Aug-10 Brilliance China Automotive (HK$) 1114 H K
998 HK Frank Li OW 35807 4615 15-Oct-10 6.42 7.17 9.60 15-Oct-10
China Citic Bank - H Share (HK$) Samuel Chen OW 244001 31448 23-Nov-09 6.73 5.62 8.80 10-Nov-10 China High Speed Transmission (HK$) 658 HK Boris Ka n
Lucy Liu OW 20626 2658 6-May-10 18.42 15.00 24.30 6-May-10
China Unicom (Hong Kong) Limited (HK$) 762 HK OW 250702 32311 2-Aug-10 10.22 10.64 12.90 1-Nov-10 Cosco Pacific (HK$) 1199 H K
175 HK Karen Li OW 33623 4333 26-Aug-08 10.64 12.40 16.10
6.20 10-Nov-10
Geely Automobile Holdings Ltd. (HK$) Frank Li OW 32702 4215 15-Oct-10 3.79 4.40 15-Oct-10 HSBC Holdings plc (HK$) 5 HK Sunil Garg OW 1415722 182464 24-May-10 71.65 80.05 115.0 0
3.8 22-Apr-10
K Wah International Holdings (HK$) 173 HK Amy Luk, CFA OW 7371 950 13-Apr-10 2.98 2.89 25-Aug-10 Longfor Properties Co. Ltd. (HK$) 960 HK Ryan Li OW 51344 6617 18-Nov-10 9.44 9.96 13.5 18-Nov-10 Mongolian Mining Corporation (HK$) 975 HK Nathan M. Zibilich, CFA OW 31493 4059 15-Nov-10 8.68 8.50 11.0
8.1 15-Nov-1 08-Sep-10 Shenzhen Expressway H Share (HK$) 548 HK Karen Li, CFA OW 12099 1559 8-Sep-10 3.90 4.42
The United Laboratories (HK$) 3933 HK Leon Chik, CFA OW 20876 2691 5-Nov-10 15.52 16.04 25.0 38.1
5-Nov-10 Wheelock & Company Ltd (HK$) 20 HK Benjamin Lo, CFA OW 57501 7411 19-Nov-10 28.85 28.30 19-Nov-10 Zhejiang Expressway (HK$) 5 6 HK 7 Karen Li, CFA O W 32182 4148 20-Apr-10 6. 83 7.4 1 9.1 0 21-Nov-10 India Apollo Hospitals Enterprise d. (Rs) LtBallarpur Industries Ltd (Rs)
APHS I NBILT IN
Princy Singh OW 58819 129 2506
5-Oct-10 463.15 476.0 035.05
575.0 50.0
5-Oct-10 Princy Singh OW 23032 20-Oct-10 35.30 20-Oct-10
Dish TV (Rs) DITV INI IN
Princy Singh OW 71900 1580 13-Sep-10 56.30 67.60 70.0 13-Sep-10 IndusI d Bank (Rs) n IB Seshadri K Sen, CFA O W 133405 2931 19-Nov-10 265 .15 287 .10 350 11-O -10 ctJapan Dainippon Screen Mfg. (¥) FUJIFILM Holdings (¥)
7735 JT Hisashi Moriyama OW 136384 1632 22-Jun-10 478 537.00 720.00 11-Aug-10 4901 JT Hisashi Moriyama OW 1461023 17486 26-Jan-10 2,942 2839.00 4,500.00 28-May-10
Hitachi (¥) 6501 JT Yoshiharu Izumi OW 1816298 21739 29-Jul-09 293 402.00 590.00 23-Apr-10 Honda Motor (¥) 7267 JT Kohei Takahashi OW 5588257 66884 19-Jan-10 3,370 3085.00 3,600.00 22-Oct-10 Inpex Corporation (¥) 1 05 JT 6 Brynjar Eirik Bustnes O W 1604900 19209 1-Sep-10 389, 00 0 439000.00 630,000.00 31-Au -10 gMalaysia RHB Capita (M$) l RHBC MK Harsh Wardhan Modi O W 17249 5497 18-Nov-10 7. 8 8.0 1 10. 0 6 16-Nov-10 Philippines International Container Terminal Services, Inc. (Php) ICT PM Jeanette Yutan OW 77239 175 1
26 8-Sep-10 39.9 39.90 49.00 20-Oct-10
Philippine ock Exchange Inc (Php) St PSE PM Harsh Wardhan Modi O W 11471 0 9-Oc 07t- 82 0 374 .00 605 .00 4-Oc 10 t-Singapore CapitaLand (S$) CAPL S P
DBS SP Christopher Gee OW 15898 12160 29-Sep-08 3.26 3.73 5.30 18-Jan-10
DBS Group (S$) Harsh Wardhan Modi OW 31949 24436 8-Aug-08 14.36 13.84 18.00 1-Aug-10 Global Logistic Properties Ltd (S$) GLP SP Christopher Gee OW 9960 7618 18-Nov-10 2.18 2.21 2.90 18-Nov-10 Noble Group Ltd (S$) NOBL SP Ajay Mirchandani OW 12292 9401 12-Nov-09 2.83 2.04 2.50 10-Nov-10 Olam International (S$) OLAM SP Ajay Mirchandani OW 6566 5022 2-Oct-08 1.80 3.09 3.70 10-Aug-09 Singapore Airlines (S$) S A SP I Corrine Png O W 18460 14119 23-May-10 14. 0 6 15. 2 4 20. 0 0 10-Nov-10 South Korea LG Chem Ltd (W) 051910 KS Samuel Lee, CFA OW 26143950 22839 14-Oct-10 327000 394500.00 430,000 14-Oct-10 LG Display (W) 034220 KS JJ Park OW 14956700 13066 15-Mar-10 35900.00 41800.00 55,000.00 16-Sep-10 LG Innotek (W) 011070 KS JJ Park OW 2736028 2390 23-Mar-10 115000.00 136000.00 240,000.00 15-Jul-10 Samsung SDI (W) 006400 KS JJ Park OW 7790477 6806 23-Jun-09 96100.0 0
147, 00 171000.00 220,000.00 28-Oct-10
SK Energy Co Ltd (W) 0 6770 KS 9 Brynjar Eirik Bustnes O W 15441750 13490 5-Oc 07t- 5 167000.00 165,000.00 13-Se -10 pTaiwan Chimei Innolux Corporation (NT$) 3481 TT JJ Park OW 329381 10842 10-Jan-10 54.1 40.95 48.00 21-Oct-10 E Ink Holdings Inc (NT$) 8069 TT Narci Chan g
Dexter Hsu OW 62786 2067 4-Mar-10 63.6 58.40 85.00 28-Nov-0 9
Aug-10 First Financial Holdin Co Ltd (NT$) g Pegatron Corp (NT$)
2892 TT OW 131803 4338 3-Sep-10 18.45 20.35 24.00 4938 TT Gokul Hariharan OW 95219 3134 24-Aug-10 40.15 42.20 52.00 24-Aug-1 0
3-Aug-10 Powertech Technology Inc (NT$) 6239 TT Cynthia Cho uAlvin Kwock
OW 69677 2294 2-Aug-10 101.5 97.40 130.00 68.00 Quanta Computer Inc. (NT$) 2382 TT OW 230332 7582 13-Oct-10 48.05 60.10 29-Oct-10
Unimicron Technology Corp. (NT$) 3037 TT Christopher Ma OW 80156 2638 18-Apr-10 40.75 51.80 60.00 18-Apr-10 Thailand Banpu Public (Bt) BANPU TB Sukit Chawalitakul OW 209789 6979 15-Oct-10 724.00 772.00 900.00 18-Nov-10 PTT Public Company (Bt) PTT TB Sukit Chawalitakul O W 859437 28591 23-Mar-10 256 .00 302 .00 395 .00 15-Sep-10 United States Focus Media (US$) FMCN Dick Wei OW 3496 3496 3-Jun-10 15.44 24.42 28.00 29-Sep-10
Source: Bloomberg, J.P. Morgan estimates. *Under applicable law and/or JPMorgan Chase & Co policy, all J.P. Morgan ratings and estimates for this company have been removed. For details on the AFL methodology, please see the Asia Cash Equities page on mm.jpmorgan.com or contact your J.P. Morgan salesperson/the covering analyst.
Your feedback can help us to make the FTM better. Please take a moment to tell us what you think. Click here to send comments Click here for the Blackberry version Click here to unsubscribe
渐飞研究报告 - http://bg.panlv.net
Asia Pacific Equity Research 25 November 2010
Hon Hai Precision
Neutral 2317.TW, 2317 TT
Stuck in transition; too early to buy ▼
Price: NT$112.00
Price Target: NT$115.00 Previous: NT$119.00
Taiwan Electronic Manufacturing Services
Gokul HariharanAC
(852) 2800-8564 [email protected]
J.P. Morgan Securities (Asia Pacific) Limited
William Chen (886-2) 2725-9871 [email protected]
J.P. Morgan Securities (Taiwan) Limited.
Charles Guo (852) 2800-8532 [email protected]
J.P. Morgan Securities (Asia Pacific) Limited
100
130
160
NT$
Nov-09 Feb-10 May-10 Aug-10 Nov-10
Price Performance
2317.TW share price (NT$TSE (rebased)
YTD 1m 3m 12m Abs -26.1% -5.5% -6.3% -18.2% Rel -27.8% -6.0% -14.2% -25.9%
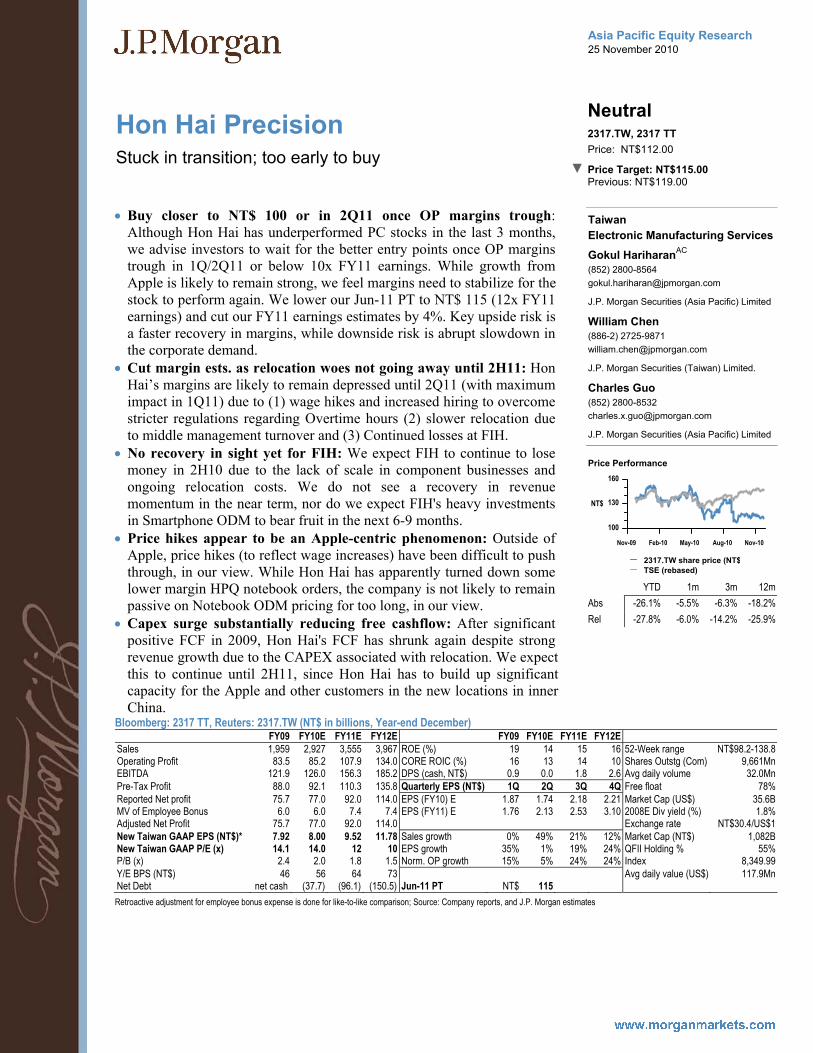
• Buy closer to NT$ 100 or in 2Q11 once OP margins trough: Although Hon Hai has underperformed PC stocks in the last 3 months, we advise investors to wait for the better entry points once OP margins trough in 1Q/2Q11 or below 10x FY11 earnings. While growth from Apple is likely to remain strong, we feel margins need to stabilize for the stock to perform again. We lower our Jun-11 PT to NT$ 115 (12x FY11 earnings) and cut our FY11 earnings estimates by 4%. Key upside risk is a faster recovery in margins, while downside risk is abrupt slowdown in the corporate demand.
• Cut margin ests. as relocation woes not going away until 2H11: Hon Hai’s margins are likely to remain depressed until 2Q11 (with maximum impact in 1Q11) due to (1) wage hikes and increased hiring to overcome stricter regulations regarding Overtime hours (2) slower relocation due to middle management turnover and (3) Continued losses at FIH.
• No recovery in sight yet for FIH: We expect FIH to continue to lose money in 2H10 due to the lack of scale in component businesses and ongoing relocation costs. We do not see a recovery in revenue momentum in the near term, nor do we expect FIH's heavy investments in Smartphone ODM to bear fruit in the next 6-9 months.
• Price hikes appear to be an Apple-centric phenomenon: Outside of Apple, price hikes (to reflect wage increases) have been difficult to push through, in our view. While Hon Hai has apparently turned down some lower margin HPQ notebook orders, the company is not likely to remain passive on Notebook ODM pricing for too long, in our view.
• Capex surge substantially reducing free cashflow: After significant positive FCF in 2009, Hon Hai's FCF has shrunk again despite strong revenue growth due to the CAPEX associated with relocation. We expect this to continue until 2H11, since Hon Hai has to build up significant capacity for the Apple and other customers in the new locations in inner China.
Bloomberg: 2317 TT, Reuters: 2317.TW (NT$ in billions, Year-end December) FY09 FY10E FY11E FY12E FY09 FY10E FY11E FY12E
Sales 1,959 2,927 3,555 3,967 ROE (%) 19 14 15 16 52-Week range NT$98.2-138.8 Operating Profit 83.5 85.2 107.9 134.0 CORE ROIC (%) 16 13 14 10 Shares Outstg (Com) 9,661Mn EBITDA 121.9 126.0 156.3 185.2 DPS (cash, NT$) 0.9 0.0 1.8 2.6 Avg daily volume 32.0Mn Pre-Tax Profit 88.0 92.1 110.3 135.8 Quarterly EPS (NT$) 1Q 2Q 3Q 4Q Free float 78% Reported Net profit 75.7 77.0 92.0 114.0 EPS (FY10) E 1.87 1.74 2.18 2.21 Market Cap (US$) 35.6B MV of Employee Bonus 6.0 6.0 7.4 7.4 EPS (FY11) E 1.76 2.13 2.53 3.10 2008E Div yield (%) 1.8% Adjusted Net Profit 75.7 77.0 92.0 114.0 Exchange rate NT$30.4/US$1 New Taiwan GAAP EPS (NT$)* 7.92 8.00 9.52 11.78 Sales growth 0% 49% 21% 12% Market Cap (NT$) 1,082B New Taiwan GAAP P/E (x) 14.1 14.0 12 10 EPS growth 35% 1% 19% 24% QFII Holding % 55% P/B (x) 2.4 2.0 1.8 1.5 Norm. OP growth 15% 5% 24% 24% Index 8,349.99 Y/E BPS (NT$) 46 56 64 73 Avg daily value (US$) 117.9Mn Net Debt net cash (37.7) (96.1) (150.5) Jun-11 PT NT$ 115 Retroactive adjustment for employee bonus expense is done for like-to-like comparison; Source: Company reports, and J.P. Morgan estimates
渐飞研究报告 - http://bg.panlv.net
Asia Pacific Equity Research 26 November 2010
Indika Energy Initiation
Overweight INDY.JK, INDY IJ
Share price re-rating, attractive valuation and Petrosea spin-off - Initiating with OW
Price: Rp3,825
Price Target: Rp5,000
Indonesia Mining
Stevanus JuandaAC
(62-21) 5291 8574 [email protected]
PT J.P. Morgan Securities Indonesia
3,500
4,500
5,500
Rp
Nov-09 Feb-10 May-10 Aug-10 Nov-10
Price Performance
INDY.JK share price (Rp)JCI (rebased)
YTD 1m 3m 12mAbs -1.9% -1.9% -1.9% -1.9%Rel -45.6% -3.5% -19.8% -52.3%
Indika Energy (Reuters: INDY.JK, Bloomberg: INDY IJ) Rp in bn, year-end Dec FY08A FY09A FY10E FY11E FY12E FY13ERevenue 2,314 2,487 3,793 4,419 4,657 5,106Net Profit 1,084.7 725.7 1,091.5 1,681.7 1,534.0 1,529.9EPS (Rp) 208.32 139.36 210.21 323.87 295.43 294.63DPS (Rp) 24 84 70 105 162 148Revenue growth (%) -1.0% 7.4% 52.5% 16.5% 5.4% 9.6%EPS growth (%) 309.4% -33.1% 50.8% 54.1% -8.8% -0.3%ROCE 3.5% 3.5% 0.8% 1.5% 1.2% 1.9%ROE 31.4% 13.8% 19.2% 25.4% 20.3% 18.5%P/E (x) 18.4 27.4 18.2 11.8 12.9 13.0P/BV (x) 3.8 3.7 3.3 2.8 2.5 2.3EV/EBITDA (x) 127.2 14.6 67.0 45.0 37.8 27.4Dividend Yield 0.6% 2.2% 1.8% 2.7% 4.2% 3.9%
Shares O/S (mn) 5,207Market cap (Rp mn) 19,917,318Market cap ($ mn) 2,222Price (Rp) 3,825Date Of Price 25 Nov 10Free float (%) 30.0%3mth Avg daily volume 19,732,550.003M - Average daily Value (Rp mn) 68,432.90Average 3m Daily Turnover ($ mn) 7.64JCI 3,702Exchange Rate 8,963.00Fiscal Year End Dec
Source: Company data, Bloomberg, J.P. Morgan estimates.
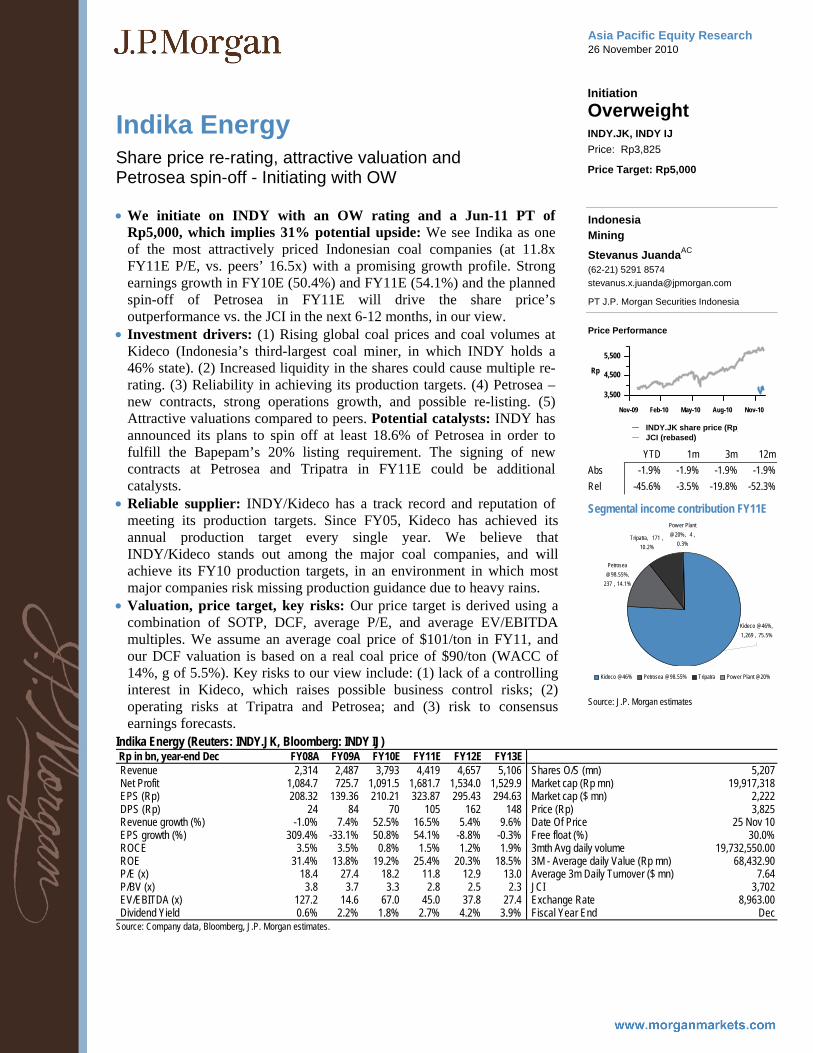
Segmental income contribution FY11E
Petrosea @98.55%,
237 , 14.1%
Tripatra, 171 , 10.2%
Pow er Plant @20%, 4 ,
0.3%
Kideco @46%, 1,269 , 75.5%
Kideco @46% Petrosea @98.55% Tripatra Pow er Plant @20%
Source: J.P. Morgan estimates
• We initiate on INDY with an OW rating and a Jun-11 PT of Rp5,000, which implies 31% potential upside: We see Indika as one of the most attractively priced Indonesian coal companies (at 11.8x FY11E P/E, vs. peers’ 16.5x) with a promising growth profile. Strong earnings growth in FY10E (50.4%) and FY11E (54.1%) and the planned spin-off of Petrosea in FY11E will drive the share price’s outperformance vs. the JCI in the next 6-12 months, in our view.
• Investment drivers: (1) Rising global coal prices and coal volumes at Kideco (Indonesia’s third-largest coal miner, in which INDY holds a 46% state). (2) Increased liquidity in the shares could cause multiple re-rating. (3) Reliability in achieving its production targets. (4) Petrosea – new contracts, strong operations growth, and possible re-listing. (5) Attractive valuations compared to peers. Potential catalysts: INDY has announced its plans to spin off at least 18.6% of Petrosea in order to fulfill the Bapepam’s 20% listing requirement. The signing of new contracts at Petrosea and Tripatra in FY11E could be additional catalysts.
• Reliable supplier: INDY/Kideco has a track record and reputation of meeting its production targets. Since FY05, Kideco has achieved its annual production target every single year. We believe that INDY/Kideco stands out among the major coal companies, and will achieve its FY10 production targets, in an environment in which most major companies risk missing production guidance due to heavy rains.
• Valuation, price target, key risks: Our price target is derived using a combination of SOTP, DCF, average P/E, and average EV/EBITDA multiples. We assume an average coal price of $101/ton in FY11, and our DCF valuation is based on a real coal price of $90/ton (WACC of 14%, g of 5.5%). Key risks to our view include: (1) lack of a controlling interest in Kideco, which raises possible business control risks; (2) operating risks at Tripatra and Petrosea; and (3) risk to consensus earnings forecasts.
渐飞研究报告 - http://bg.panlv.net

Asia Pacific Equity Research 25 November 2010
Sinopac Financial Holdings
Overweight 2890.TW, 2890 TT
Trading gains boost 3Q10 results, but business could slow down
Price: NT$11.00
Price Target: NT$14.00
Taiwan Banks
Dexter HsuAC
(886-2) 2725-9868 [email protected]
J.P. Morgan Securities (Taiwan) Limited.
Penny Lin (886-2) 2725-9870 [email protected]
J.P. Morgan Securities (Taiwan) Limited.
Sunil Garg (852) 2800-8518 [email protected]
J.P. Morgan Securities (Asia Pacific) Limited
9
11
13
NT$
Nov-09 Feb-10 May-10 Aug-10 Nov-10
Price Performance
2890.TW share price (NT$TSE (rebased)
YTD 1m 3m 12m Abs -13.4% -5.6% -3.9% -10.2% Rel -15.1% -6.1% -11.8% -17.9%
Sinopac Financial Holdings (Reuters: 2890.TW, Bloomberg: 2890 TT) Year-end Dec (NT$ in mn) FY09A FY10E FY11E FY12E FY13E Operating Profit 4,966 6,740 9,398 11,318 12,176 Net Profit 908 3,864 7,386 8,777 9,164 Cash EPS (NT$) 0.13 0.53 1.02 1.21 1.27 Fully Diluted EPS (NT$) 0.13 0.53 1.02 1.21 1.27 DPS (NT$) 0.00 0.12 0.41 0.74 0.82 EPS growth (%) (124.4%) 325.3% 91.2% 18.8% 4.4% ROE 1.1% 4.6% 8.4% 9.5% 9.6% P/E 87.6 20.6 10.8 9.1 8.7 BVPS (NT$) 11.84 12.25 12.89 13.41 13.90 P/BV 0.9 0.9 0.9 0.8 0.8 Div. Yield 0.0% 1.1% 3.8% 6.7% 7.4%
52-wk range (NT$) 12.95 - 9.24 Market cap (NT$ mn) 77,789 Market cap ($ mn) 2,555 Shares outstanding (mn) 7,072 Fiscal Year End Dec Price (NT$) 11.00 Date Of Price 25 Nov 10 Avg daily value (NT$ mn) 776.1 Avg daily value ($ mn) 25.5 Avg daily vol (mn) 51.3 TSE 8,350 Exchange Rate 30.45
Source: Company data, Bloomberg, J.P. Morgan estimates.
• 3Q10 net income was NT$2.2B (vs. NT$810MM in 2Q10). YTD earnings are NT$4B (or NT$0.57/share), beating consensus and our full-year forecast due to strong stock trading gains. We expect the strong outlook for the broker business to provide upside potential; however, from historical experience, the recent management re-shuffle could lead to slow business growth which might not offset rising costs (+12% Q/Q).
• Management guidance: The provision for the US subsidiary (FENB) was US$49.2MM in 9M10, while the NPL ratio declined to 13.9% in 3Q from 16.5% in 2Q with the coverage ratio rising to 56.9% from 34.7%. Management guided to a net loss of US$50MM by FENB in 2010 and the loss to narrow in 2011. Sinopac has set aside 51% reserves against the PEM exposure (or NT$4.8B) and further losses should be within the NT$300MM-500MM range.
• Group PPOP increases by +27% Q/Q and +5% Y/Y, driven by NII growth (+4% Q/Q, +26% Y/Y) and trading gains. NIM contraction (down to 1.25% in 3Q from 1.27% in 2Q) was offset by the growth of interest-bearing assets. Fee income growth (+4% Q/Q, -2% Y/Y) was slow in 3Q10, while brokerage fees (+18% Q/Q, -4% Y/Y) and credit card fees (+11% Q/Q, +11% Y/Y) offset the weakness in corporate fees (-10% Q/Q, -16% Y/Y) and WM (-2% Q/Q, +13% Y/Y) fees.
• Loan book contracted across-the-board (-3% Q/Q; +11% Y/Y). Unsecured personal loans were down 11% Q/Q, followed by corporates (-4% Q/Q), credit cards (-3% Q/Q) and mortgages (-1% Q/Q). As a result, LDR fell to 77% in 3Q from 80% in 2Q. Management targets SME loan growth, instead of pursuing volume. Overall, asset quality remains good—the bank NPL ratio declined to 0.60% in 3Q from 0.63% in 2Q with the coverage ratio up to 116% in 3Q from 103% in 2Q10.
• We remain OW with a Dec-11 PT of NT$14 (DDM-based): Risks to our PT are: (1) weaker domestic demand; (2) worse credit quality; and (3) unfavorable regulatory changes and M&A terms.
渐飞研究报告 - http://bg.panlv.net

Asia Pacific Equity Research 25 November 2010
Malaysia Construction
Major infrastructure project awards in sight
Malaysia Mak Hoy Kit
Hoy Kit MakAC
(60-3) 2270-4728 [email protected]
JPMorgan Securities (Malaysia) Sdn. Bhd. (18146-X)
Figure 1: Relative performance
2.02.53.03.54.0
Jan-10 Apr-10 Jul-10 Oct-10
Gamuda
WCTIJM
Source: Bloomberg
• Two recent positive developments: 1) Detailed study for the proposed M$47B MRT project is completed; 2) 95% of detailed design for the M$7B Kelana Jaya and Ampang light rail transit (LRT) extension line is completed, with land acquisitions concurrently being carried out.
• Positive Malaysia construction sector outlook. Budget 2011, 10th Malaysia Plan (10MP) and the recently launched M$1.4T Economic Transformation Programme (ETP) have one thing in common – they will provide a big boost to the construction sector. While there may be potential delays in implementation, rolling out infrastructure projects, mainly public funded, will be the government's top priority to kick start the ETP. Two largest infrastructure projects under the ETP are the M$47B MRT and M$16.5B High Speed Rail (HSR), targeted to commence in 2Q 2011 and 1Q 2012, respectively.
• WCT: Highest leverage effect; leads YTD on new construction order wins. WCT secured M$2.1B worth of new jobs YTD, surpassing IJM’s M$1.9B, and nil for Gamuda. WCT has the highest leverage to new construction order wins, mainly due to it being a smaller company. However, it is also a purer construction play, with construction earnings contributing 66% of group earnings, against Gamuda’s 19% and IJM’s 17.4%, based on one-year forward estimates. For every M$1B incremental construction orders in FY11E, we estimate WCT’s FY11E EPS will rise 9.1%. This compares favourably against Gamuda’s 3.6% and IJM’s 4.3%.
• Recommendation and valuation. We are positive on the Malaysian construction sector, given the expected flows of infrastructure projects that can drive a re-rating for the sector. The stocks within our construction sector universe have attractive estimated 2-year EPS CAGR of 22.3% on average. IJM (OW, PT: M$6.44) is our top large-cap construction pick, while WCT (OW, PT: M$3.80) is our top mid-cap pick. We are Neutral on Gamuda as MRT tunneling works is largely priced in, in our view. WCT’s share price has underperformed Gamuda and IJM YTD by 13.8% and 4.1%, respectively, on fears of new order book delivery, but which has met expectations in October. WCT is the cheapest among our construction universe, trading at 2011E P/E of 13.7x, against Gamuda’s CY11E P/E of 18.8x and IJM’s 17.6x.
Table 1: Peer comparison CY P/E Ticker Mkt Cap
M$MM Rating Price
2011E 2012E Net yield FY11E
P/NTA FY11E
ROE (%) FY11E
Price target
Upside (%)
WCT WCT MK Equity 2,324 OW 2.96 13.7 12.1 2.4 0.8 13.6 3.8 28.4% IJM IJM MK Equity 7,728 OW 5.72 17.6 13.8 2.1 1.4 8.4 6.44 12.6% Gamuda GAM MK Equity 7,420 N 3.63 18.8 14.6 2.2 2.2 10.7 3.8 4.7% Hock Seng Lee HSL MK Equity 1,049 NR 1.80 11.0 10.1 1.7 2.5 23.9 2.2 22.8% Source: J.P. Morgan estimates, Bloomberg estimates for non rated stock. Prices as at 24 November 2010.
渐飞研究报告 - http://bg.panlv.net

Asia Pacific Equity Research 25 November 2010
Korea Shipbuilding Monthly
Maersk placed 20-vessel order for 18,000 TEU containerships with DSME; evidence of cycle recovery
South Korea Ship Building & Repairs
Jinmook KimAC
(82-2) 758-5729 [email protected]
J.P. Morgan Securities (Far East) Ltd, Seoul Branch
One-year share price performance
6080
100120140160180200
N-09 F-10 M-10 A-10 N-10
HHI SHIDSME KOSPI
Source: Bloomberg.
Bloomberg JPMA KIM <GO>
• What’s new: According to Korea Economic Daily (Nov 25th), Daewoo Shipbuilding & Marine Engineering (DSME) was selected as the preferred bidder of Maersk’s 20-container-ship order, worth $4B in total. Each vessel is 18,000 TEU in size ($200MM building price), the largest container-ship order ever awarded. The report added that the contract consists of 10 vessels, while an additional 10 will follow as an option.
• Implications: We see this as clear evidence of improving demand for container shipbuilding beyond 2012 delivery when we expect excessive supply to normalize (fleet growth of 8% in 2012E) and depressed demand to recover (US GDP growth back to 4% level by 4Q11E). In particular, this order supports our bullish stance on super-size container ship demand (+8,000 TEU), with Korean yards capturing 100% market share (please see our featured analysis #1, #2 on pages 2-3 for details).
• What’s next: The new-building demand for larger container ships may spread to other owners. According to J.P. Morgan’s regional shipping analyst, Corrine Png, liner companies are considering whether to order large vessels for the future because of their lower unit costs, although the main constraints are port limitations. Of note, the main engine’s operating cost for a 16,000 TEU container ship is approximately 40% lower than for a 5,500 TEU container ship, on a savings-per-TEU box basis, according to Man Diesel.
• Reasons to be positive on Korean yards: (1) Competitive advantage of container ships for which new-order recovery is expected to be the highest in 2011. (2) Early-mover advantage in deepwater offshore where we have identified over 178 offshore projects underway for the next 24 months, including floating production and storage systems. (3) Availability of multiple ways to save cost. The big-3 yards in Korea are the largest buyers of heavy plates and ship-engines in Asia. Also, we assume that an increase in new orders will lead to further improvement in utilization rate, which is currently below 100%.
• We prefer HHI as a sector proxy: This order is in line with our 5MM CGT new-order assumption for container ships in 2011 (roughly $8.4B in value). Although this order is positive for DSME’s order book, we see more meaningful implications for the recovery cycle of the sector in 2011. We prefer Hyundai Heavy as a proxy to a cyclical recovery.
Korean shipbuilders: Valuation comparison Price as of Mkt Cap P/E (x) P/BV (x) EV/EBITDA (x) RoE (%) Company Currency 25-Nov-10 Rating (B) 2010E 2011E 2010E 2011E 2010E 2011E 2010E 2011E
HHI KRW 372,500 OW 28,310 8.2 7.8 2.1 1.7 8.0 7.1 29.6 23.8 SHI KRW 33,600 OW 7,757 9.3 8.9 2.2 1.8 7.4 7.1 26.0 22.0 DSME KRW 28,200 OW 5,397 6.4 7.6 1.4 1.2 5.3 5.9 23.4 17.0 Source: Bloomberg, J.P. Morgan estimates. Prices as of close on November 25.
渐飞研究报告 - http://bg.panlv.net

Asia Pacific Equity Research 25 November 2010
Genting Plantations
Neutral GENP.KL, GENP MK
3Q10 results in line; prefer Sime and KLK ▲
Price: M$8.77
Price Target: M$8.70 Previous: M$7.70
Malaysia Plantations
Simone YeohAC
(60-3) 2270-4710 [email protected]
JPMorgan Securities (Malaysia) Sdn. Bhd. (18146-X)
6.0
7.5
9.0
M$
Nov-09 Feb-10 May-10 Aug-10 Nov-10
Price Performance
GENP.KL share price (M$)FBMKLCI (rebased)
YTD 1m 3m 12m Abs 40.4% 2.7% 21.3% 41.3% Rel 23.7% 2.9% 15.4% 24.2%
Company data 52-wk range (M$) 5.98 - 9 Market cap (M$ mil) 6655.1 Market cap (US$ mil) 2124.2 Shares outstanding (mil) 758.8 Free float (%) 28.7 Avg daily volume (mil) 0.8 Liquidity (M$ mil) 6.6 Liquidity (US$ mil) 2.1 Exchange rate 3.13 KLCI Index 1496.5 Year-end 12/2009 Source: Blooomberg
Earnings and valuations 2010E 2011E Old EPS (M$) 0.45 0.55 New EPS (M$) 0.41 0.53 % change -8.9% -3.6% P/E (x) 21.2 16.5 P/B (x) 2.4 2.1 Div Yield (%) 1.1% 1.5% Dec 10 Fair Value 7.70 Source: J.P. Morgan estimates
• 3Q10 results in line, maintain N. Genting Plantations (GP) reported a 34% Y/Y rise in net profit for 9M10 (up 31% Y/Y in 3Q10). This was driven by a 9% Y/Y rise in FFB output from the low base last year due to adverse weather, and 16% Y/Y rise in CPO prices to M$2,581/t (M$2,638/t in 3Q10). Core net profit for 9M10 was at 68% of our full year forecast (67% of consensus). This is within expectations as we expect a stronger 4Q10 helped by stronger CPO prices (spot: M$3,286/t).
• Plantation prospects. Management is guiding for a moderation in CPO crop growth to 5-6% for FY10E due to signs of declines/poor growth in 4Q10 with impact of adverse weather (i.e. includes La Nina) to continue to early-2011, and hence will likely help keep CPO prices high up to 1Q11. Beyond this, management expects an upturn in the yield cycle to contribute to stronger output growth mainly by 2H11, in line with our view. Total planted land-bank for its Indonesian estates has risen to 27,147ha as at end-9M10 (40% of Indonesian land-bank) from 6,455ha in 2008. Management is guiding for the Indonesian estates to contribute materially by 2013.
• Biotech investments, property & Chelsea premium outlets. Biotech losses stood at M$12MM for 9M10 with guidance for total loss at M$15-20MM pa going forward. Property accounted for just 3% of profits for 9M10. The planned sale of 93 acres of industrial land in Johor to a single prospective buyer if completely sold we estimate will generate additional property profits of M$12-20MM over 30 months from FY11E on, and will help drive growth. Construction of the Chelsea premium outlets has started and will be completed by end-2011, with contributions expected to flow in by 2012. If we assume a conservative 6-8% rental yield on total investments of M$158MM for Chelsea, this could lift earnings by 2% pa from FY12E.
• PT raised to M$8.70. We roll forward our PT from Jun-11 to Dec-11 and raise it to M$8.70 based on 16x FY11E earnings (from 14x previously). The PE of 16x is close to +1SD to historical mean of 14x. This is fair we believe as we foresee limited downside risk to our CPO forecast of M$2,800/t for 2011-12E, which has greater risk of upside instead from any prolonged impact of adverse weather or further weakening of the US dollar. We maintain Neutral on GP, and prefer KLK and Sime.
Genting Plantations (Bloomberg: GENP MK; Reuters: GENP.KL) M$ mil, year end Dec 3Q10 3Q09 %Y/Y 2Q10 %Q/Q Revenue 249.1 195.7 27% 231.2 8% EBIT 108.9 79.9 36% 94.5 15% EBIT Margins 44% 41% 41% PBT 109.8 81.1 35% 95.6 15% Net Profit 80.8 61.4 32% 71.4 13% Core Net profit 80.6 61.4 31% 63.1 28% EPS (Sen) 10.7 8.1 31% 9.4 13% Source: Company
渐飞研究报告 - http://bg.panlv.net

Asia Pacific Equity Research 26 November 2010
Hite Brewery
Underweight 103150.KS, 103150 KS
Imported beer penetration to accelerate
Price: W125,000
Price Target: W120,000
South Korea Food, Beverage & Tobacco
Jinah LeeAC
(82-2) 758-5723 [email protected]
J.P. Morgan Securities (Far East) Ltd, Seoul Branch
120,000
150,000
180,000W
Nov-09 Feb-10 May-10 Aug-10 Nov-10
Price Performance
103150.KS share price (WKOSPI (rebased)
YTD 1m 3m 12m Abs -26.5% -2.7% -5.3% -22.8% Rel -40.2% -3.3% -16.4% -42.4%
• Imported beer likely to gain market share: We believe imported beer will continue to gain market share from domestic beer players. Between 1999 and 2009, imported beer volume rose by 19x, with a CAGR of 28% over the past four years, compared to a domestic beer market CAGR of 3.8%. However, imported beer penetration is still low at 4% of the Korean market.
• Main obstacles for beer importers are being overcome: These are better distribution and pricing, faster growth in off-premises and direct distribution through hypermarkets, distribution partnerships moving from domestic beer manufacturers to stand-alone or non-beer manufacturer partners, and rising possibility of lower import tax rate of 30% due to FTA.
• A number of Japanese breweries are either partnering with non-beer manufacturers or waiting to switch partners: Maeil Dairy will partner with Sapporo Brewery, while Kirin Brewery is expected to change its partner from Hite Brewery when its contract ends in 2012. Asahi Brewery has already set up a partnership with Lotte Asahi and now holds 20% of the imported beer market. New partners have significantly higher incentives to push products over domestic beer manufacturers.
• Import tax affects shipment prices: Korea levies a higher import tax of 30% on beer vs. 15% for wine and 20% for whiskey. As a result, shipment prices are at least 72% higher for imported beer than domestic beer. If the import tax is removed, the shipment price difference will significantly narrow to around 30%.
• Estimate revisions: We lower our 2010 and 2011 EPS estimates by 4.0% and 3.7%, respectively, to reflect the lower domestic industry growth rate. We maintain our Underweight rating and Jun-11 price target of W120,000, which is based on 10x 2011E earnings.
Bloomberg: 103150 KS; Reuters: 103150.KS Won in billions, year-end December
2009A 2010E 2011E 2012E Sales 1,018 1,051 1,117 1,109 52-week range W171,500-121,500 Operating Profit 183 161 186 191 Market cap W1,195B Net Income 99 87 110 118 Market cap US$1,051MM EPS (W) 10,376 9,105 11,531 12,317 Shares issued 9.6MM P/E (x) 12.0 13.7 10.8 10.1 Free float 51% ROE (%) 11.8% 11.4% 13.2% 12.9% Price (W) 125,000 BPS (Won) 84,693 76,970 84,263 83,184 Date of Price 25-Nov-10 P/B (x) 1.5 1.6 1.5 1.5 Avg daily value W2.9B EV/EBITDA 10.6 10.8 9.5 9.1 Avg daily value US$2.5MM DPS 3,500 3,900 3,900 3,900 Avg daily volume 0.02MM shares KOSPI 1,927.68 Exchange Rate W1,137.65/US$
Source: Company data, J.P. Morgan estimates.
渐飞研究报告 - http://bg.panlv.net

Asia Pacific Equity Research 25 November 2010
Lee & Man Paper Manufacturing
Overweight 2314.HK, 2314 HK
Near term margin recovery and more aggressive expansion
Price: HK$6.16
Price Target: HK$10.20
Hong Kong Packaging & Glass
Leon Chik, CFAAC
(852) 2800-8590 [email protected]
Andrew Hsu (852) 2800-8572 [email protected]
J.P. Morgan Securities (Asia Pacific) Limited
4.0
5.5
7.0
HK$
Nov-09 Feb-10 May-10 Aug-10 Nov-10
Price Performance
2314.HK share price (HK$HSI (rebased)
YTD 1m 3m 12m Abs 15.1% -9.0% 14.3% 20.2% Rel 9.7% -6.6% 2.6% 18.2%
Lee & Man Paper Manufacturing (Reuters: 2314.HK, Bloomberg: 2314 HK) HK$ in mn, year-end Mar FY08A FY09A FY10A FY11E FY12E Revenue 8,996 9,649 11,098 13,896 18,048 Net Profit 1,441.5 299.9 1,832.8 1,875.0 2,566.5 EPS (HK$) 0.32 0.06 0.39 0.40 0.54 DPS (HK$) 0.09 0.04 0.13 0.12 0.16 Revenue growth (%) 74.3% 7.3% 15.0% 25.2% 29.9% EPS growth (%) 29.7% -80.0% 511.2% 2.3% 36.9% ROCE 13.4% 3.5% 13.1% 12.6% 15.6% ROE 19.7% 3.6% 19.7% 17.3% 20.7% P/E (x) 19.4 96.8 15.8 15.5 11.3 P/BV (x) 3.5 3.3 2.8 2.4 2.1 EV/EBITDA (x) 17.1 34.0 10.9 10.1 7.4 Dividend Yield 1.5% 0.6% 2.1% 1.9% 2.6%
Shares O/S (mn) 4,690 Market cap (HK$ mn) 28,888 Market cap ($ mn) 3,723 Price (HK$) 6.16 Date Of Price 25 Nov 10 Free float (%) 27.6% 3-mth trading volume (mn) 14 3-mth trading value (HK$ mn) 109 3-mth trading value (US$) ($ mn) 14 HSI 23,055 Exchange Rate 7.76 Fiscal Year End Mar
Source: Company data, Bloomberg, J.P. Morgan estimates.
• Key takeaways from 1HFY11 roadshow . Lee & man Paper is the second largest producer of containerbaords in China with a market share of approximately 10%. The shares are down 12% following the release of selected interim results on 8th Nov (Hang Seng Index fell 7% over this period). We note that the 1HFY11 performance was impacted by a sharp correction in containerboard and OCC prices in the month of May and June which depressed margins as well as the closure of one production line for repairs during this period. We maintain our Overweight recommendation and target price of HK$10.2.
• Poor interim margins but rising prices in 2H. 1HFY11 gross profit margin (GPM) of 18.0% which compares with a GPM of 25.5% in 2HFY11 and a GPM of 24.6% in 1H10. In our view, the issues that depressed 1HFY11 GPM is not significant in 4Q10 (no major closure of production plants and a recovery of containerboard prices from HK$3,665 per ton in 1HFY11 to nearly HK$4,000 per ton now). We estimate that the GPM in 2HFY11 too have recovered to approximately 23.9%. In the long term, we expect LMP to follow an aggressive capacity expansion plan of 15-20% a year for the foreseeable future.
• Minor adjustments to earnings and maintaining our share price target of HK$10.2. We are lowering our FY11E and FY12E sales by 1.2% and 0.8% respectively to reflect slightly higher prices offset by lower production volumes. We have lowered FY11E and FY12E net profit estimates by 1.2% and 4.8% respectively. We are maintaining our DCF based Dec 11 target price of HK$10.2 after factoring in slightly lower earnings but offset by higher growth in the capacity in long term.
• LMP trades at a 12.1x CY 11E P/E, 25% higher than the 11E P/E of industrial SMID-Caps in HK/China. Our DCF-based price target (Dec-11) of HK$10.2 implies a CY12E P/E of 16x. The key risk to our PT is the surge in the cost of OCC which in the short term may not be passed on as higher prices to the customers.
渐飞研究报告 - http://bg.panlv.net

Asia Pacific Equity Research 25 November 2010
Vanguard International Semiconductor Corporation
Initiation Underweight 5347.TWO, 5347 TT
Inventory correction could take longer Price: NT$12.75
Price Target: NT$10.00
Taiwan Semiconductors
Rick HsuAC
(886-2) 2725-9874 [email protected]
J.P. Morgan Securities (Taiwan) Limited.
JJ Park (822) 758-5717 [email protected]
J.P. Morgan Securities (Far East) Ltd, Seoul Branch
Cynthia Chou (886-2) 2725-9898 [email protected]
J.P. Morgan Securities (Taiwan) Limited.
Rahul Chadha (91-22) 6157-3261 [email protected]
J.P. Morgan India Private Limited
12.5
14.0
15.5
NT$
Nov-09 Feb-10 May-10 Aug-10 Nov-10
Price Performance
5347.TWO share price (NT$TSE (rebased)
YTD 1m 3m 12m Abs -7.6% -1.2% -4.9% -7.6% Rel -8.9% -1.1% -9.4% -15.2%
We initiate coverage with UW and a June-11 price target of NT$10. History of inventory correction repeats, but we believe this time it will likely take longer for Vanguard to normalize production due to an asymmetric sales move against its customers in the LCD driver business. We expect another muted 1Q11 could disappoint the market and weigh on the shares. Vanguard is keen to reduce its single-product risk, but diversification takes time, in our opinion.
• High LCD driver exposure a double-sided sword. And it is the negative side of the sword that is at work, in our opinion. Key customers are busy working down inventory, which should harm Vanguard given its over 60% sales exposure in LCD driver foundries. Although management expects some 30% Q/Q sales drop for 4Q10, we think it may not be enough to normalize production; another muted 1Q11 likely.
• Diversification takes time. Vanguard has been keen in diversifying into power analog and CIS foundry works to reduce the single-product risk on LCD drivers, but the road looks bumpy. While CIS ramp may be capped at 5% sales range due to capacity constraint, we believe any significant ramp in power analog may need to wait until 2H11.
• Valuation, price target. Our PT is based on 0.8x ROE-adjusted P/BV – a method we apply to our SCM coverage, implying 22% downside. Catalysts to push the stock lower are: 1) another muted 1Q11, and 2) possible consensus earnings cut toward our more conservative forecast for FY11E. In the display semi space, our preference is Novatek.
• Risk to our call. We would see upside potential to our bearish call on: 1) stronger-than-expected end-demand, 2) faster-than-expected power analog diversification, and 3) TSMC’s order overflow potential. We see late 1Q11/early 2Q11 as possible timing to review our bearish call.
Vanguard - share price: NT$12.75 (24 Nov 10) (Reuters: 5347.TW, Bloomberg: 5347 TT) NT$M (Yr-end Dec) FY09 FY10E FY11E FY12E FY09 FY10E FY11E FY12E 52-wk range NT$10.8-17.5 Sales 12.6 15.9 14.5 16.3 P/E (x) nm 12.0 17.7 15.0 Shares outs'g 1,662M Operating profit 0.0 1.9 1.2 1.4 P/B (x) 1.1 1.0 1.0 1.0 Avg daily volume 3.6M EBITDA 3.5 4.9 4.5 4.9 EV/EBITDA (x) 4.0 3.1 2.7 2.9 Avg daily value US$1.6M MV of employee bonus 0.4 0.5 0.4 0.5 FCF/Mkt cap (%) 14.4 -0.8 19.5 -6.4 Free float 45% Adjusted net profit 0.1 1.8 1.2 1.4 Price target Local Exchange rate NT$30.4/US$1 Profit growth (%) -91.4 nm -32.1 17.8 DCF value (6/2011) NT$10.7 Market Cap (US$) 696M EPS (NT$) 0.05 1.06 0.72 0.85 PT (6/2011) NT$10.0 Index (TWSE) 8,338 BPS (NT$, yr-end) 11.92 12.49 12.51 12.86 Difference from consensus -30% Cash dividend yield (%) 3.1 3.1 5.5 3.9 Quarterly EPS (NT$) 1Q 2Q 3Q 4Q ROE (%) 0.4 8.5 5.8 6.6 FY09 -0.50 0.09 0.41 0.05 ROIC (net of cash, %) 0.4 13.3 7.8 11.6 FY10E 0.13 0.34 0.51 0.08 Net debt/equity (%) net cash net cash net cash net cash FY11E 0.04 0.19 0.28 0.21 Source: Bloomberg, Company, JP Morgan estimates
渐飞研究报告 - http://bg.panlv.net

Emerging Markets Equity Research 25 November 2010
Consensus Asset Allocation
Emerging Markets Equity Strategy
Emerging Markets Equity Strategy
Adrian MowatAC
(852) 2800-8599 [email protected]
J.P. Morgan Securities (Asia Pacific) Limited
Ben Laidler (1-212) 622-5252 [email protected]
J.P. Morgan Securities LLC
David Aserkoff, CFA (44-20) 7325-1775 [email protected]
J.P. Morgan Securities Ltd.
Deanne Gordon (27-21) 712-0875 [email protected]
J.P. Morgan Equities Ltd.
Rajiv Batra (91-22) 6157-3568 [email protected]
J.P. Morgan India Private Limited
Sanaya Tavaria (91-22) 6157-3312 [email protected]
J.P. Morgan India Private Limited
Figure 1: Emerging Equity Markets relative to the US and World
20
4060
80100
120140
160
96 98 00 02 04 06 08 10
vs USA
vs World
Source: MSCI, Bloomberg.
• In this report we review the asset allocation of major emerging market funds as at the end of October. We define a consensus OW market as one in which there are more funds meaningfully overweight relative to those that are meaningfully underweight (>2% below index weight).
• Russia and Indonesia retained the highest net overweights. However, net overweights in Russia reduced from eight to six and those in Indonesia reduced from seven to six. The net overweights in Brazil increased to two. We are neutral on all three markets.
• The net overweights in India increased from two to five. Fund managers reduced their net underweights in China from three to zero. We are overweight on India and neutral on China. See pages 7 and 8 for charts on the fund manager survey history.
• Managers remain underweight the Asian export economies of Taiwan, Korea and Malaysia. The net overweights in Mexico reduced from five to two.
• Among the smaller markets, consensus retained its highest overweight in Turkish equities. The net overweights in Thailand reduced from three to one. We remain overweight Turkey and Thailand.
• Emerging Markets net fund flows:
o 2009 CY: Net inflows US$64.4 billion
o 2010 YTD: Net inflows US$75.6 billion
Table 1: Survey of key EM managers positioning relative to MSCI EM – For major EMs Country > 2% OW < 2% UW OW-UW < 0.1% EM % JPM reco
Russia 15 (16) 9 (8) 6 (8) 4 (3) 6.1 N Indonesia 10 (11) 4 (4) 6 (7) 3 (4) 2.4 N India 12 (12) 7 (10) 5 (2) 1 (1) 8.1 OW Mexico 7 (10) 5 (5) 2 (5) 2 (3) 4.4 UW Brazil 11 (11) 9 (10) 2 (1) 0 (0) 16.2 N China+HK 13 (11) 13 (14) 0 (-3) 0 (0) 18.3 N South Africa 5 (6) 20 (19) -15 (-13) 2 (2) 7.3 N Malaysia 1 (2) 16 (18) -15 (-16) 12 (12) 2.9 OW China 6 (4) 21 (20) -15 (-16) 0 (0) 18.3 N Korea 4 (5) 23 (23) -19 (-18) 1 (1) 13.3 UW Taiwan 1 (1) 30 (28) -29 (-27) 1 (1) 10.6 N Source: EPFR Global, MSCI, J.P. Morgan calculations. The survey covers 46 fund managers. The calculation of OW is greater than 2% overweight versus the MSCI benchmark. UW is less than -2% of benchmark weighting. Fund weightings are as of 31 October 2010 and MSCI weightings as of 1 November 2010. Numbers in brackets are the previous month values. Potentially China stocks have been misclassified as Hong Kong, hence the combined weight for Hong Kong and China. Hong Kong investment may be providing non-China exposure
渐飞研究报告 - http://bg.panlv.net

Emerging Markets Equity Research 25 November 2010
Emerging Markets Strategy Dashboards
Emerging Markets Equity Strategy Team Country Recommendation Adrian MowatAC Emerging Markets [email protected] (852) 2800 - 8599 J.P.Morgan Securities (Asia Pacific) Limited OW: India, ASEAN, Turkey
Ben Laidler Latin America [email protected] (212) 622 - 5252 J.P. Morgan Securities LLC
David Aserkoff CEEMEA [email protected] (44-20) 7325-1775 J.P. Morgan Securities Ltd. UW: Korea, Mexico, Energy, Commodities
Deanne Gordon South Africa [email protected] (27-21) 712 0875 J.P.Morgan Equities Ltd.
Rajiv Batra Emerging Markets [email protected] (91-22) 6157-3568 J.P. Morgan India Private Limited KEY TRADES: CEMBI Surfers; OW India and Turkey
Sanaya Tavaria Emerging Markets [email protected] (91-22) 6157-3312 J.P. Morgan India Private Limited ABC of Real Estate - Anything but China, China economic rebalancing: UW SOEs and OW consumer,
Global Emerging Markets Research
Joyce Chang Global Emerging Markets [email protected] (1-212) 834-4203 J.P. Morgan Securities LLC Advantage ASEAN, Brazilian Consumer
Key Changes
Table of Contents Page #
Regional Summary 2 Market Performance 3 Liquidity Monitor 4 Monitoring Inflation 5 Market Drivers 6 Cross-section Earnings Growth 7 Earnings Revisions 8,9,10 Sector-Country PE Matrix 11 Valuation Distribution 12 Demand Classification 13 Equities relative to Bonds 14 Economic Momentum 15 Policy Rates Forecast 16 Currency Forecasts 17,18 Credit Risk 19 Emerging Market Balance Sheets 20 Emerging Market in Perspective 21 Emerging Capital Market 22 Index Weightings 23
Market performance to 24 November 2010
• Year to date: MSCI Emerging Markets 10.5% outperforming MSCI World by 5.8%
• Year to date: MSCI EM Asia 10.8% outperforming MSCI Emerging Markets by 0.3%
• Top three markets YTD in US$ terms: Argentina, Thailand and Colombia
• Bottom three markets YTD in US$ terms: Czech Republic, Hungary and Brazil
Sector performance
• Year to date: MSCI EM Consumer Discretionary 27.3% outperforming MSCI Emerging Markets by 16.8%
• Year to date: MSCI EM Energy -1.3% underperforming MSCI Emerging Markets by 11.8%
• Top three key market sectors YTD in US$ terms: Korea Consumer Discretionary, Turkey Financials and South Africa Consumer Discretionary
• Bottom three key market sectors YTD in US$ terms: Brazil Energy, Russia Energy and Korea Financials
Demand classification sector performance
• YTD: Global Consumer 14.7%, Domestic Demand 14.3%, Global Capex 10.7% and Global Price Takers 6.9%
J.P. Morgan's revisions to 2010 Real GDP growth for ecasts
• Positive: Global 3.7% [3.6%], Asia ex Japan 8.9% [8.8%], Taiwan 10.1% [9.9%], Peru 8.5% [8.2%]
J.P. Morgan's revisions to 2011 Real GDP growth for ecasts
• Positive: Poland 4.0% [3.8%]
• Negative: Taiwan 4.0% [4.1%]
J.P. Morgan's revisions to Central bank Policy rate forecasts
• Korea: Last change 16 Nov 10 +25bp, Next change 1Q11 +25bp, Current 2.5% [2.25%], Dec 10 2.5%, Mar 11 2.75%, Jun 11 3.0% [2.75%]
• Taiwan: Last change 30 Sep 10 +12.5bp, Next change 23 Dec 10 +12.5bp [3Q11 +12.5bp], Current 1.5%, Dec 10 1.625% [1.5%], Mar 11 1.75% [1.5%], Jun 11 1.875% [1.5%]
• Chile: Last change 16 Nov 10 +25bp, Next change 16 Dec Dec 10 +25bp, Current 3.0% [2.75%], Dec 10 3.25%, Mar 11 4.0%, Jun 11 4.25%
• South Africa: Last change 18 Nov 10 -50bp, Next change on hold, Current 5.5% [6.0%], Dec 10 5.5%, Mar 11 5.5%, Jun 11 5.5%
Please see Emerging Equity Markets Year Ahead: Stock Ideas for 2011, Mowat, Laidler, Gordon, et
al, 16 November 2010, for our latest emerging markets equity strategy.
渐飞研究报告 - http://bg.panlv.net

Asia Pacific Equity Research 26 November 2010
Genting
Overweight GENT.KL, GENT MK
Genting Singapore drives 3Q10 earnings - ALERT
Price: M$10.36
25 November 2010
Gaming
Hoy Kit MakAC
(60-3) 2270-4728 [email protected]
JPMorgan Securities (Malaysia) Sdn. Bhd. (18146-X)
Kenneth Fong , CFA (852) 2800-8597 [email protected]
J.P. Morgan Securities (Asia Pacific) Limited
Table 1: Company data 52-wk Range M$6.2-10.82 Mkt Cap (M$MM) 38466.0 Mkt Cap (US$MM) 12277.7 Share Outstanding(MM) 3712.9 Free Float (%) 60.0 Avg. daily volume(MM) 7.3 Liquidity(MM) 60.8 Exchange rate 3.1 Index 1495.5 Year-end 12/2009
Source: Bloomberg
• Core net profit rose 19% Y/Y: Genting reported 3Q10 net profit of M$1,223MM (+229% Y/Y) on revenues of M$3,909MM (+63%). Stripping out exceptionals, core net profit of M$2,390MM (+152% Y/Y) in 9M10 has surpassed our FY10 estimate of M$2,137.4MM. There was a net gain of M$413.6MM on deferred consideration, as Genting has attained cash upfront of US$136.5MM for a stream of income for its gas field, so long as the production of gas continues.
• 3Q10 core net profit of M$584.8MM rose 19% Y/Y on the back of the commencement of operations of GENS in 1Q10, and higher plantations earnings (+29% Y/Y) on the back of higher CPO prices. However, this was offset by a lower Resorts World Genting contribution due to lower casino spend, weaker luck factor in the VIP segment, and M$39MM in expenses due to start-up costs for the development and operation of a video lottery facility at the Aqueduck Racetrack in New York City.
• GENS 3Q10 slightly disappointed on lower margin and a normalized VIP hold: In our report dated 12 November Genting Singapore: Valuations fair, market growth expectations too high, GENS’ 3Q EBITDA came in at S$347MM (vs consensus of S$375MM), down 32% Q/Q on normalized VIP hold rate and thinner margin - down 6% Q/Q to 46%. Market share dipped to 53% from 60% in 2Q as a result of a normalized hold. The management outlook is positive, citing strong performance so far in 4Q. On the junket front, management believes the government will start to gradually approve junkets in early 2011.
• Power earnings slightly lower: EBITDA for the power division fell 2% Y/Y in 3Q10 to M$146.9MM. Genting is still in negotiations with Chinese authorities for a tariff increase for its Meizhou Wan power plant given higher coal costs.
Table 2: Genting Bhd (Bloomberg: GENT MK; Reuters: GENT.KL) M$MM, YE Dec 3Q10 3Q09 Y/Y % 2Q10 Q/Q % 9M10 9M09 Y/Y Turnover 3,909 2,402 63% 4085 -4.3% 11108.0 6573.5 69% Gross profit 1,485 1,012 47% 1984 25.1% 4797.6 2605.1 84% Gross margin (%) 38.0% 42.1% 49% 43.2% 39.6% EBITDA 1,910 1,026 86% 2049 -6.8% 4456.3 2653.9 68% EBITDA margin (%) 48.8% 42.7% 50% 40.1% 40.4% Associates 11 10 13% 19 42.9% 56.1 -12.2 -561% Net profit 1,223 371 229% 739 65.4% 1737.5 798.9 117% Core Net Profit 585 493 19% 774 24.5% 2390.0 949.7 152% FD Core EPS (M$sen) 20.62 9.99 106% 19.96 3.3% 46.8 21.5 118% Source: Company.
渐飞研究报告 - http://bg.panlv.net
Asia Pacific Equity Research 26 November 2010
Genting Malaysia
Overweight GENM.KL, GENM MK
3Q10 results reveal weakness in operating trends - ALERT
Price: M$3.38
25 November 2010
Gaming
Hoy Kit MakAC
(60-3) 2270-4728 [email protected]
JPMorgan Securities (Malaysia) Sdn. Bhd. (18146-X)
Kenneth Fong , CFA (852) 2800-8597 [email protected]
J.P. Morgan Securities (Asia Pacific) Limited
Table 1: Company data 52-wk Range M$2.46-3.72 Mkt Cap (M$MM) 19992.2 Mkt Cap (US$MM) 6381.2 Share Outstanding(MM) 5914.9 Free Float (%) 49.2 Avg. daily volume(MM) 8.5 Liquidity(MM) 25.5 Exchange rate 3.1 Index 1495.5 Year-end 12/2009 Source: Bloomberg
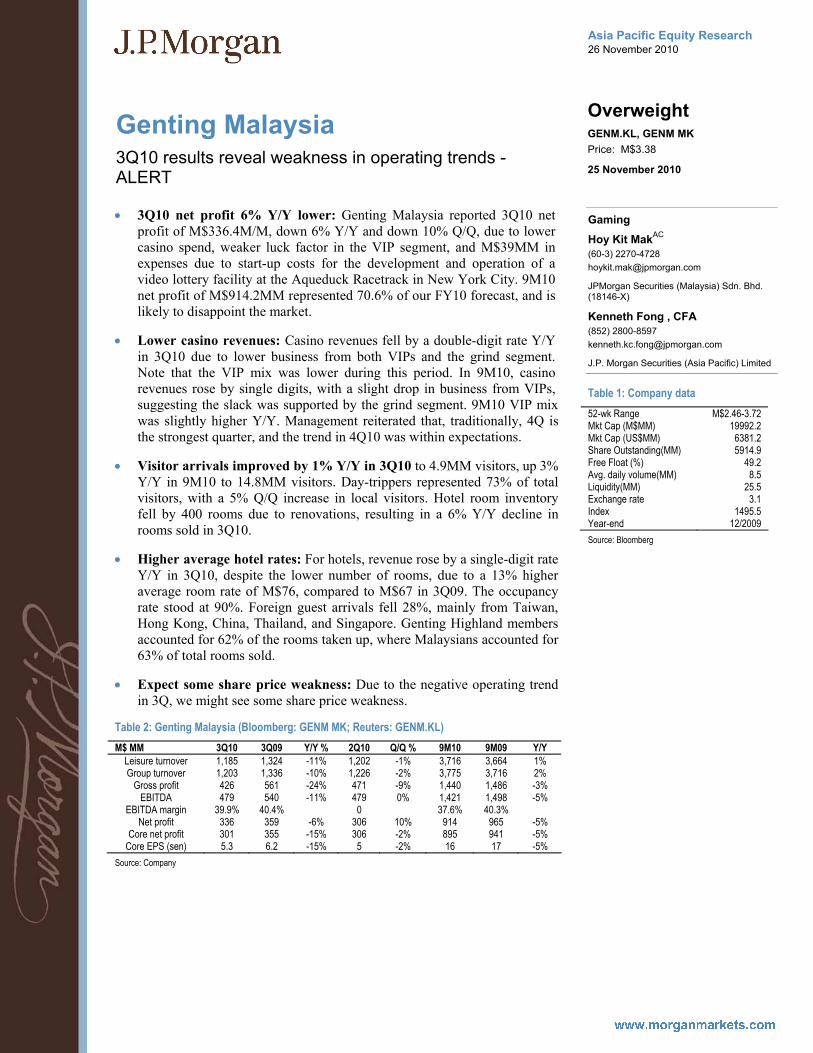
• 3Q10 net profit 6% Y/Y lower: Genting Malaysia reported 3Q10 net profit of M$336.4M/M, down 6% Y/Y and down 10% Q/Q, due to lower casino spend, weaker luck factor in the VIP segment, and M$39MM in expenses due to start-up costs for the development and operation of a video lottery facility at the Aqueduck Racetrack in New York City. 9M10 net profit of M$914.2MM represented 70.6% of our FY10 forecast, and is likely to disappoint the market.
• Lower casino revenues: Casino revenues fell by a double-digit rate Y/Y in 3Q10 due to lower business from both VIPs and the grind segment. Note that the VIP mix was lower during this period. In 9M10, casino revenues rose by single digits, with a slight drop in business from VIPs, suggesting the slack was supported by the grind segment. 9M10 VIP mix was slightly higher Y/Y. Management reiterated that, traditionally, 4Q is the strongest quarter, and the trend in 4Q10 was within expectations.
• Visitor arrivals improved by 1% Y/Y in 3Q10 to 4.9MM visitors, up 3% Y/Y in 9M10 to 14.8MM visitors. Day-trippers represented 73% of total visitors, with a 5% Q/Q increase in local visitors. Hotel room inventory fell by 400 rooms due to renovations, resulting in a 6% Y/Y decline in rooms sold in 3Q10.
• Higher average hotel rates: For hotels, revenue rose by a single-digit rate Y/Y in 3Q10, despite the lower number of rooms, due to a 13% higher average room rate of M$76, compared to M$67 in 3Q09. The occupancy rate stood at 90%. Foreign guest arrivals fell 28%, mainly from Taiwan, Hong Kong, China, Thailand, and Singapore. Genting Highland members accounted for 62% of the rooms taken up, where Malaysians accounted for 63% of total rooms sold.
• Expect some share price weakness: Due to the negative operating trend in 3Q, we might see some share price weakness.
Table 2: Genting Malaysia (Bloomberg: GENM MK; Reuters: GENM.KL) M$ MM 3Q10 3Q09 Y/Y % 2Q10 Q/Q % 9M10 9M09 Y/Y
Leisure turnover 1,185 1,324 -11% 1,202 -1% 3,716 3,664 1% Group turnover 1,203 1,336 -10% 1,226 -2% 3,775 3,716 2%
Gross profit 426 561 -24% 471 -9% 1,440 1,486 -3% EBITDA 479 540 -11% 479 0% 1,421 1,498 -5%
EBITDA margin 39.9% 40.4% 0 37.6% 40.3% Net profit 336 359 -6% 306 10% 914 965 -5%
Core net profit 301 355 -15% 306 -2% 895 941 -5% Core EPS (sen) 5.3 6.2 -15% 5 -2% 16 17 -5%
Source: Company
渐飞研究报告 - http://bg.panlv.net

Asia Pacific Equity Research 25 November 2010
JSW Energy Ltd.
Neutral JSWE.BO, JSW IN
Benefits of African coal mine acquisition will take awhile to play out - ALERT
Price: Rs111.10
23 November 2010
Electric Utilities
Shilpa KrishnanAC
(91-22) 6157-3580 [email protected]
Sumit Kishore (91-22) 6157-3581 [email protected]
Deepika Belani (91-22) 6157-3582 [email protected]
J.P. Morgan India Private Limited
• JSW has agreed to purchase 100% of CIC Energy, a coal mining company with assets in Africa, in an all cash deal of CAD422M (US$414M). We expect the acquisition to be funded out of debt, as the company has outstanding unutilized IPO proceeds of Rs.12B which would be required for the equity commitments of pipeline projects. We calculate a 100% debt funded acquisition would lead to the DER inching up to 2x from 1.64x as of Sep-10.
• Acquisition details from JSWE mgt: 1) Botswana coal mines have estimated reserves of 2.6B tons, of which 935mn tons will be exportable. 2) annual production to commence 3-5 years hence, peak production target of 20mtpa (our view: production would take 5 years) b) production cost estimate of $29/ton, c) India landed cost estimate of ~$70-75/ton FOB (implying est. CIF cost of ~$100/ton) , d) est. GCV of 5,600Kcal/Kg.
• JSWE is short of coal; this deal would improve long term coal security: As against FY11 imports of ~3.9mtpa at market prices (excl. Barmer since it’s on imported coal on a temporary basis), we estimate JSWE would need ~15.2mtpa of imported coal in FY16 (incl. Ratnagiri II). However any shortage in supply of linkage coal and/or coal from captive mines would lead to incremental dependence on imports. Thus long term fuel security is a positive development for the company, but given the time to development of this asset JSW is still exposed to near term fuel price risks. ~50% of its 5GW pipeline in our SOP valuation has no fuel cost pass thru.
• Valuation of this deal: EV of US$0.22/ton of mineable reserves. No earnings based multiples available. Optimum Coal (OPT SJ), covered by JPM, produces 6.5mtpa of saleable coal and trades at $2.94/ton of reserves and at $0.96/ton of reserves and resources. Homeland Energy (HEG CN), recently acquired by GMRI, trades at US$0.2/ton.
• Concerns: We do not have clarity about: a) location and infrastructure availability around the mine to transport and export the coal, b) further capex for mining and infra development, c) challenges to get mining license.
• About CIC Energy: CIC is developing the Mmamabula coal mine in Botswana with est. reserves of 2.6B tons of which 1.9B tons are run of the mine. After beneficiation, the mine is expected to produce 757Mt of thermal coal, 432Mt of 6,500kcal/kg thermal coal for exports and 182Mt for its coal to hydrocarbons project. CIC has 1.5GW of power projects under development in Africa to be fueled from this mine (5mtpa). However these projects are still at a nascent stage with various environmental and regulatory clearances pending.
Please see table overleaf for JSW Energy’s fuel requirements and costing.
渐飞研究报告 - http://bg.panlv.net

Asia Pacific Equity Research 25 November 2010
MISC Berhad
Neutral MISC.KL, MISC MK
1HFY11 results and analyst briefing - ALERT
Price: M$8.62
25 November 2010
Shipping
Simone YeohAC
(60-3) 2270-4710 [email protected]
JPMorgan Securities (Malaysia) Sdn. Bhd. (18146-X)
• MISC's 1HFY11 net profit rose 153% to M$797MM (+350% in 2QFY11). This came in at 54% of our full year forecast (47% of consensus), within expectations. Net DPS of 15sen declared in 1HFY11 (similar to last year), within our full year forecast of 30sen, or an annualised yield of 3.5%. We maintain Neutral. Our SoTP for the stock remains unchanged after accounting for the recent sell-down and listing of MMHE (66.5% equity stake currently).
• Key growth drivers were significantly lower container losses and jump in profits from heavy engineering (HE). Losses from the container unit fell 57% to M$244MM for 1HFY11 following the cessation of the Asia-Europe liner trade early this year. Management guides for continued strong recovery for the container division through FY12E. In our forecast, we are already projecting the container division losses to halve in FY11E and to breakeven by FY12E. HE profits more than doubled to M$197MM in 1HFY11 due to improvement in the margin life cycle of contracts (from the low margin procurement cycle previously) and higher margins from Gumusut-Kakap (fabrication phase).
• The tanker and chemicals divisions however dragged down overall performance due to overcapacity. Losses for the chemical division expanded, while profits from the tanker division fell 88% Y/Y in 1HFY11. Management indicated that the conditions will remain challenging in both segments, though the tanker division is likely to benefit from a seasonal pick-up in late-2010/early 2011 from the winter season.
• VTTI tank terminal acquisition completed. The acquisition of VTTI for US$839MM was completed on 7 Sept-10. Based on 2013-2015E profit guidance of US$100-160MM (100%-stake) from VTTI, we estimate an increase in MISC's profits by M$100-196MM pa, after taking into account its 50% stake and loss of interest income from cash outflow for the acquisition. This accounts for 4-8% of our current net profit forecast of M$2,342MM for MISC for FY12E.
MISC Bhd 1HFY11 results summary Yr to Mar-31 (M$MM) 2QFY11 2QFY10 % yoy 1QFY11 % qoq 1HFY11 1HFY10 % yoy Turnover 3,085 3,527 -13% 3,271 -6% 6,356 7,421 -14% EBIT 500 256 95% 558 -10% 1,015 611 66% EBIT margin 16% 7% 9 pps 17% -1 pps 16% 8% 8 pps PBT 416 161 159% 471 -12% 888 434 104% PBT margin 13% 5% 9 pps 14% -1 pps 14% 6% 8 pps Core Net profit 369 82 350% 428 -14% 797 316 153% Core EPS (M$ sen) 9.9 2.2 350% 11.5 -14% 21.4 8.5 153% Source: Company • See segmental breakdown in the table on the following page.
渐飞研究报告 - http://bg.panlv.net

Asia Pacific Equity Research 25 November 2010
Nestlé India Limited
Neutral NEST.BO, NEST IN
Analyst Meet Takeaways : On a high capex trajectory
Price: Rs3,792.80
Price Target: Rs3,470.00
India Food & Food Manufacture
Latika Chopra, CFAAC
(91-22) 6157-3584 [email protected]
J.P. Morgan India Private Limited
2,000
3,000
4,000
Rs
Nov-09 Feb-10 May-10 Aug-10 Nov-10
Price Performance
NEST.BO share price (Rs)NIFTY (rebased)
YTD 1m 3m 12m Abs 48.9% 11.4% 28.7% 49.3% Rel 36.1% 14.7% 22.1% 34.1%
• Underlying volume growth trends remain healthy in the domestic market registering 18% growth during 9MCY10. Prepared dishes, beverages and chocolate & confectionery saw healthy double digit growth (22-24%). However, volume growth for milk products was affected by phasing out of non-strategic products and channels (defence forces).
• Stepping up capex investments. Nestle India is looking to invest considerably in brownfield and greenfield expansion over the next 2-3 years. Robust demand trends for its product portfolio and current high capacity utilization rates for existing plants are driving this aggressive expansion at their end. Over the last three years the company has made capital investments of Rs6.5bn and will have invested over Rs4.5bn in CY2010, and they see further acceleration in 2011 and beyond. Management noted that they will deploy a mix of internal accruals (which could be a potential risk to dividend payout) and debt to finance these investments. Given that income tax benefits for certain Northern states are valid for greenfield investments till Mar’12, we would expect a significant part of capex to be deployed before this sunset date.
• Raw material inflation remains a significant challenge particularly for milk prices which have remained sticky at higher levels and contrary to initial expectations have not softened much. Coffee and palm oil prices have also seen a sharp uptick recently. YTD2010 Nestle India's commodity cost index has risen 12% over 2009. Nestle has resorted to aggressive price hikes in recent quarters (2.3% in Q110, 5.3% in Q210 and 6.6% in Q310) to mitigate cost pressures and appears confident about maintaining operating margins in the current range of 19-20%.
• Focus on premium portfolio. Nestle is actively looking to augment its premium product portfolio and although management refrained from sharing its plans on new product launches, they did highlight that they could leverage on the wide product offerings of its parent for the same.
• We remain positive on the company's growth outlook and believe it is amongst the best plays on fast-growing high potential processed foods segment in India. However, we think the current valuation of 35x CY11E P/E could constrain stock performance in the near term.
Bloomberg: NEST IN, Reuters: NEST.BO Rs mn, year end Dec FY08 FY09 FY10E FY11E FY12E Net sales 43,242 51,294 61,935 74,916 89,636 52-week range (Rs) 2295-3780 Net profit 5,649 6,976 8,378 10,447 12,865 Market cap (Rs mn) 363,970 EPS (Rs) 58.6 72.4 86.9 108.4 133.4 Market cap (US$ mn) 7,973 DPS (Rs) 42.5 52.5 65.2 81.3 100.1 Shrs outsting (MM) 96.4 Net sales growth 23% 19% 21% 21% 20% Avg daily value (Rs MM) 125 Net profit growth 31% 24% 20% 25% 23% Avg daily value (US$ MM) 2.7 EPS growth (%) 31% 24% 20% 25% 23% Avg dly volume (MM shs) 0.04 ROE 119% 120% 119% 122% 136% Exchange rate (Rs/US$) 46 P/E (x) 64.4 52.2 43.4 34.8 28.3 Sensex 19392 EV/EBITDA (x) 41.9 34.8 29.0 23.3 19.0 Dividend yield 1.1% 1.4% 1.7% 2.2% 2.7%
Source: Bloomberg, Company reports and J.P. Morgan estimates.
渐飞研究报告 - http://bg.panlv.net

Asia Pacific Equity Research 25 November 2010
Siemens India
Neutral SIEM.BO, SIEM IN
Healthy execution and margin improvement in the Sep-q
Price: Rs789.55
Price Target: Rs695.00
India Engineering
Sumit KishoreAC
(91-22) 6157-3581 [email protected]
Shilpa Krishnan (91-22) 6157-3580 [email protected]
Deepika Belani (91-22) 6157-3582 [email protected]
J.P. Morgan India Private Limited
500
650
800
Rs
Nov-09 Feb-10 May-10 Aug-10 Nov-10
Price Performance
SIEM.BO share price (RsBSE30 (rebased)
YTD 1m 3m 12m Abs 35.6% -5.7% 10.5% 40.2% Rel 24.2% -2.2% 4.2% 26.6%
• Sep-q results in-line. Siemens reported PAT of Rs.2.5B (up 66% yoy) a tad ahead of our Rs2.4B est. and the street's Rs2.1B. The results came on the back of a ~340bps yoy improvement in margins particularly in the industry and healthcare segments led by cost rationalization. As anticipated top line growth was healthy at 21% yoy in the Sep-q led by the power segment. FY10 top line growth aggregated to 11%.
• Industry recovery interrupted: Following a 9M recovery in industrial short cycle products, top line declined by 8.7%yoy in the Sep-q spread across almost all sub-segments; however FY10 growth of 10% yoy meets company guidance set at the beginning of the year. The mobility segment continued the down trend (15% yoy) despite management expecting a recovery this year.
• Sharp recovery in the power segment: As expected, the power segment recovered sharply in the 2H, with Sep-q with revenues up 40% yoy (up 23% in Jun-q post de-growth in 1H; up 8.4% in FY10). Margins improved significantly to 13.6%, up 740bps yoy. The distribution segment continues to see pricing pressure as evidenced by low margins.
• Subsidiaries continue to report a loss: Siemens reported standalone PAT of Rs8.3B vs. consolidated profit of Rs.7.6B. The Rs.706M gap (Rs725M in FY09) is explained by losses in its two of its key subsidiaries Siemens Building Technologies (86%) and Siemens Rolling Stock (100%).
• Order flows: OB of Rs135.8B (up 32% YoY) provides visibility for slightly more than 1 year; to which two large cycle orders contribute 27%. In the Sep-q Siemens won Rs.30.2B (up 15% yoy) of new orders.
• Siemens has underperformed CG, our preferred play in the Indian T&D space, by 7% over the last 1 year. Our Mar-11 DCF based PT of Rs695 implies 22.7x FY12E (fiscalized) EPS, vs. 18x for CG, factoring in upside for higher intermediate growth driven by higher domestic exposure. Upside risk stems from stronger than expected order inflows, downside from weak top line growth/margin performance. We would await a lower price point to buy into CG and Siemens.
Table 1: Siemens India: Sep-q results summary Rs. in million, year end September
4QFY10 JPMe 4QFY09 % YoY 3QFY10 %QoQ Net Sales 30,253 31,138 25,180 20.1 22,464 34.7 Total Expenditure 26,281 27,392 22,726 15.6 20,044 31.1 EBITDA 3,972 3,746 2,454 61.9 2,420 64.2 EBITDA Margin 13.1 12.0 9.7 338.6 10.8 235.9 PBT 3,886 3,634 2,327 67.0 2,351 65.3 Tax 1,371 1,249 810 69.3 790 73.4 Adjusted PAT 2,515 2,385 1,517 65.8 1,561 61.2 Net Margin 8.3 7.7 6.0 228.8 6.9 136.7
Source: Company reports and J.P. Morgan estimates.
渐飞研究报告 - http://bg.panlv.net

Asia Pacific Equity Research 25 November 2010
China oil and gas demand
Expected drop in Chinese diesel exports not yet materialized
Integrated Oils, Exploration & Production
Brynjar Eirik BustnesAC
(852) 2800-8578 [email protected]
J.P. Morgan Securities (Asia Pacific) Limited
Oct 10 apparent demand at Jun 10 peak level (mn BOPD)
6.5
7.0
7.5
8.0
8.5
9.0
Jan-
07M
ay-0
7Se
p-07
Jan-
08M
ay-0
8Se
p-08
Jan-
09M
ay-0
9Se
p-09
Jan-
10M
ay-1
0Se
p-10
Source: Bloomberg
• Apparent demand at high levels – up 11% YTD but still stays on 6.5% growth path: October 2010 apparent demand was 37.6 mn tones for the month. This is equivalent to 9.0 mn BOPD, up 0.9 mn BOPD on October last year and up 0.2 mn BOPD on September 2010. YTD demand is up 11.1% on 2009 and it is up around 6.5-7% CAGR relative to 2006, 2007 and 2008 (0.65x GDP). We expect November to show similar numbers, as refinery capacity is back on stream to satisfy diesel demand. Diesel demand is indicative of product inventory draws, while less (3.1 mn tones) available crude vs refinery throughput also indicates crude draw in October. For November we expect crude imports to increase on October’s very low base with again more refineries online.
• IP dislocating from diesel and power demand as China tries to "ramp up" power efficiency: Most recent IP number showed stability above 13%, while lower power and apparent diesel demand did not support this. In the last three months, diesel demand growth has been only 3-8% y/y, while power demand growth has dropped from 13% to 7% y/y (for the months). We believe there has been 0.6-0.7 mn tons/month of inventory draws on diesel in this period, which going into power gensets makes up for some of the discrepancy but not all. Gasoline has actually picked up to above 10% y/y growth in Aug-Oct vs much lower in earlier part of the year. China LNG imports came down to 1.1 BCM in Oct, with average price at US$6.8/mmBTU. Qatar, Yemen and Russia contributed 26% to LNG imports priced at US$13.0/mmBTU. Import of piped natural gas from Turkmenistan was stable at 0.36 BCM in Oct priced at US$8.30/mmBTU. China imported 13% of available natgas.
• Chinese crude import cost and related theoretical china GRM: China appears to be paying more now relative to Brent, as the discount of US$$4.5/bbl we had in 2007/08 has come down to only US$1.5/bbl recently, although improved a bit on last two months at US$2/bbl discount. Sinopec is the major importer of this crude. GRMs have picked up in recent months on price hike matching oil price increases. Our industry sources indicate that diesel wholesale is now done closer to retail prices.
• Product imports staying below 200 kBOPD level (vs 0.5 mn BOPD historically), with October at around 150 kBOPD: Chinese refineries brought back on stream refineries from maintenance. This alleviates diesel tightness but we still expect China to be net diesel importer in November as imports increase significantly, although it may be short lived.
Chinese total apparent demand looks strong y/y, but compared to previous YTD levels we are on 6.5% growth trajectory (CAGR) 2010 Oct YTD – CAGR on YTD: Product import Ref t’put Apparent demand Gasoline demand Diesel demand Kerosene demand
2006 -29% 8.5% 6.5% 7.9% 7.2% 7.4% 2007 -30% 8.6% 6.9% 8.5% 7.5% 10% 2008 -44% 10% 7.3% 5.6% 3.7% 11% 2009 -52% 14% 11% 5.1% 12% 8.8%
Source: J.P. Morgan estimates, Bloomberg.
渐飞研究报告 - http://bg.panlv.net
Asia Pacific Equity Research 25 November 2010
India Iron ore
Oct exports decline 30% y/y; Export ban in Karnataka- While appeal likely in SC, Feb-11 next important date
India India Mining
Pinakin Parekh, CFAAC
(91-22) 6157-3588 [email protected]
Neha Manpuria (91-22) 6157-3589 [email protected]
J.P. Morgan India Private Limited
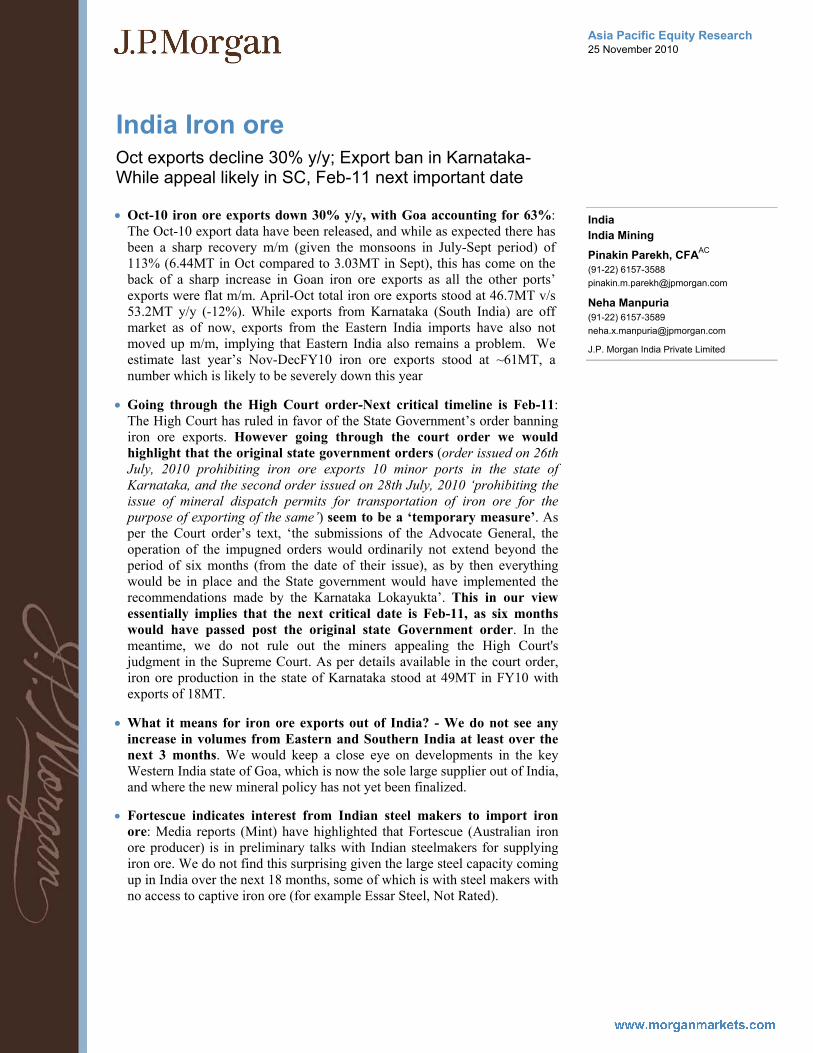
• Oct-10 iron ore exports down 30% y/y, with Goa accounting for 63%: The Oct-10 export data have been released, and while as expected there has been a sharp recovery m/m (given the monsoons in July-Sept period) of 113% (6.44MT in Oct compared to 3.03MT in Sept), this has come on the back of a sharp increase in Goan iron ore exports as all the other ports’ exports were flat m/m. April-Oct total iron ore exports stood at 46.7MT v/s 53.2MT y/y (-12%). While exports from Karnataka (South India) are off market as of now, exports from the Eastern India imports have also not moved up m/m, implying that Eastern India also remains a problem. We estimate last year’s Nov-DecFY10 iron ore exports stood at ~61MT, a number which is likely to be severely down this year
• Going through the High Court order-Next critical timeline is Feb-11: The High Court has ruled in favor of the State Government’s order banning iron ore exports. However going through the court order we would highlight that the original state government orders (order issued on 26th July, 2010 prohibiting iron ore exports 10 minor ports in the state of Karnataka, and the second order issued on 28th July, 2010 ‘prohibiting the issue of mineral dispatch permits for transportation of iron ore for the purpose of exporting of the same’) seem to be a ‘temporary measure’. As per the Court order’s text, ‘the submissions of the Advocate General, the operation of the impugned orders would ordinarily not extend beyond the period of six months (from the date of their issue), as by then everything would be in place and the State government would have implemented the recommendations made by the Karnataka Lokayukta’. This in our view essentially implies that the next critical date is Feb-11, as six months would have passed post the original state Government order. In the meantime, we do not rule out the miners appealing the High Court's judgment in the Supreme Court. As per details available in the court order, iron ore production in the state of Karnataka stood at 49MT in FY10 with exports of 18MT.
• What it means for iron ore exports out of India? - We do not see any increase in volumes from Eastern and Southern India at least over the next 3 months. We would keep a close eye on developments in the key Western India state of Goa, which is now the sole large supplier out of India, and where the new mineral policy has not yet been finalized.
• Fortescue indicates interest from Indian steel makers to import iron ore: Media reports (Mint) have highlighted that Fortescue (Australian iron ore producer) is in preliminary talks with Indian steelmakers for supplying iron ore. We do not find this surprising given the large steel capacity coming up in India over the next 18 months, some of which is with steel makers with no access to captive iron ore (for example Essar Steel, Not Rated).
渐飞研究报告 - http://bg.panlv.net

23
Asia Pacific Equity Research 26 November 2010
Sunil Garg (852) 2800-8518 [email protected]
Companies Recommended in This Report (all prices in this report as of market close on 25 November 2010, unless otherwise indicated) Indika Energy (INDY.JK/Rp3,825/Not Covered)
Analyst Certification: The research analyst who is primarily responsible for this research and whose name is listed first on the front cover certifies (or in a case where multiple research analysts are primarily responsible for this research, the research analyst named first in each group on the front cover or named within the document individually certifies, with respect to each security or issuer that the research analyst covered in this research) that: (1) all of the views expressed in this research accurately reflect his or her personal views about any and all of the subject securities or issuers; and (2) no part of any of the research analyst’s compensation was, is, or will be directly or indirectly related to the specific recommendations or views expressed by the research analyst in this research.
Important Disclosures
• Lead or Co-manager: J.P. Morgan acted as lead or co-manager in a public offering of equity and/or debt securities for Genting, Hitachi (6501), Honda Motor (7267), Hyundai Heavy Industries, Inpex Corporation, JSW Energy Ltd., Nestlé India Limited, TSMC within the past 12 months.
• Client of the Firm: Crompton Greaves Limited is or was in the past 12 months a client of JPM; during the past 12 months, JPM provided to the company non-investment banking securities-related service. Daewoo Shipbuilding & Marine Engineering is or was in the past 12 months a client of JPM; during the past 12 months, JPM provided to the company non-investment banking securities-related service and non-securities-related services. FUJIFILM Holdings (4901) is or was in the past 12 months a client of JPM; during the past 12 months, JPM provided to the company non-investment banking securities-related service and non-securities-related services. Gamuda is or was in the past 12 months a client of JPM. Genting is or was in the past 12 months a client of JPM; during the past 12 months, JPM provided to the company investment banking services, non-investment banking securities-related service and non-securities-related services. Genting Malaysia is or was in the past 12 months a client of JPM. Genting Plantations is or was in the past 12 months a client of JPM. Hitachi (6501) is or was in the past 12 months a client of JPM; during the past 12 months, JPM provided to the company investment banking services, non-investment banking securities-related service and non-securities-related services. Hon Hai Precision is or was in the past 12 months a client of JPM; during the past 12 months, JPM provided to the company non-investment banking securities-related service. Honda Motor (7267) is or was in the past 12 months a client of JPM; during the past 12 months, JPM provided to the company investment banking services, non-investment banking securities-related service and non-securities-related services. Hyundai Heavy Industries is or was in the past 12 months a client of JPM; during the past 12 months, JPM provided to the company investment banking services, non-investment banking securities-related service and non-securities-related services. IJM Corporation is or was in the past 12 months a client of JPM. Indika Energy is or was in the past 12 months a client of JPM. Inpex Corporation is or was in the past 12 months a client of JPM; during the past 12 months, JPM provided to the company investment banking services and non-investment banking securities-related service. JSW Energy Ltd. is or was in the past 12 months a client of JPM; during the past 12 months, JPM provided to the company investment banking services. Kuala Lumpur Kepong is or was in the past 12 months a client of JPM. Lee & Man Paper Manufacturing is or was in the past 12 months a client of JPM. LG Chem Ltd is or was in the past 12 months a client of JPM. LG Display is or was in the past 12 months a client of JPM; during the past 12 months, JPM provided to the company investment banking services and non-investment banking securities-related service. MISC Berhad is or was in the past 12 months a client of JPM; during the past 12 months, JPM provided to the company investment banking services and non-investment banking securities-related service. Nestlé India Limited is or was in the past 12 months a client of JPM; during the past 12 months, JPM provided to the company investment banking services. Samsung Heavy Industries is or was in the past 12 months a client of JPM; during the past 12 months, JPM provided to the company non-investment banking securities-related service and non-securities-related services. Samsung SDI is or was in the past 12 months a client of JPM; during the past 12 months, JPM provided to the company non-investment banking securities-related service. Siemens India is or was in the past 12 months a client of JPM. Sime Darby Berhad is or was in the past 12 months a client of JPM. Sinopac Financial Holdings is or was in the past 12 months a client of JPM; during the past 12 months, JPM provided to the company non-investment banking securities-related service and non-securities-related services. SK Energy Co Ltd is or was in the past 12 months a client of JPM; during the past 12 months, JPM provided to the company non-investment banking securities-related service and non-securities-related services. TSMC is or was in the past 12 months a client of JPM; during the past 12 months, JPM provided to the company investment banking services, non-investment banking securities-related service and non-securities-related services. Vanguard International Semiconductor Corporation is or was in the past 12 months a client of JPM.
• Investment Banking (past 12 months): J.P. Morgan received, in the past 12 months, compensation for investment banking services from Genting, Hitachi (6501), Honda Motor (7267), Hyundai Heavy Industries, Inpex Corporation, JSW Energy Ltd., LG Display, MISC Berhad, Nestlé India Limited, TSMC.
• Investment Banking (next 3 months): J.P. Morgan expects to receive, or intends to seek, compensation for investment banking services in the next three months from Genting, Hitachi (6501), Honda Motor (7267), Hyundai Heavy Industries, Inpex Corporation, JSW Energy Ltd., LG Display, MISC Berhad, Nestlé India Limited, Siemens India, Sime Darby Berhad, TSMC.
渐飞研究报告 - http://bg.panlv.net

24
Asia Pacific Equity Research 26 November 2010
Sunil Garg (852) 2800-8518 [email protected]
• Non-Investment Banking Compensation: JPMS has received compensation in the past 12 months for products or services other than investment banking from Crompton Greaves Limited, Daewoo Shipbuilding & Marine Engineering, FUJIFILM Holdings (4901), Genting, Hitachi (6501), Hon Hai Precision, Honda Motor (7267), Hyundai Heavy Industries, Inpex Corporation, LG Display, MISC Berhad, Samsung Heavy Industries, Samsung SDI, Sinopac Financial Holdings, SK Energy Co Ltd, TSMC. An affiliate of JPMS has received compensation in the past 12 months for products or services other than investment banking from FUJIFILM Holdings (4901), Hitachi (6501), Hon Hai Precision, Honda Motor (7267), Hyundai Heavy Industries, Indika Energy, Inpex Corporation, LG Chem Ltd, LG Display, Samsung Heavy Industries, Siemens India, Sinopac Financial Holdings, SK Energy Co Ltd, TSMC.
• JPMorgan Securities (Malaysia) Sdn. Bhd. ("J.P. Morgan") has been engaged to provide a valuation, to the non-interested members of the board of directors of Genting Malaysia Berhad, on certain of the UK gaming operations owned by Genting Singapore PLC and which will be sold to a wholly-owned subsidiary of Genting Malaysia Berhad, as announced on 1 July, 2010. J.P. Morgan will receive a fee for its services. This research report has been prepared by analysts of J.P. Morgan who are not engaged in the abovementioned transaction, based on publicly available information, and the information herein is not intended to provide voting advice, serve as an endorsement of the above-mentioned proposed transaction or result in the procurement, withholding or revocation of a proxy or any other action by a shareholder.
• J.P. Morgan Securities (Far East) Ltd, Seoul branch is acting as a Market Maker (Liquidity Provider) for the Equity Linked Warrants of Hyundai Heavy Industries and owns 6,966,970 as of 25-Nov-10.
• J.P. Morgan Securities (Far East) Ltd, Seoul branch is acting as a Market Maker (Liquidity Provider) for the Equity Linked Warrants of LG Chem Ltd and owns 10,645,690 as of 25-Nov-10.
• J.P. Morgan Securities (Far East) Ltd, Seoul branch is acting as a Market Maker (Liquidity Provider) for the Equity Linked Warrants of LG Display and owns 17,556,860 as of 25-Nov-10.
• J.P. Morgan Securities (Far East) Ltd, Seoul branch is acting as a Market Maker (Liquidity Provider) for the Equity Linked Warrants of Samsung Heavy Industries and owns 6,634,300 as of 25-Nov-10.
• J.P. Morgan Securities (Far East) Ltd, Seoul branch is acting as a Market Maker (Liquidity Provider) for the Equity Linked Warrants of Samsung SDI and owns 15,740,200 as of 25-Nov-10.
• J.P. Morgan Securities (Far East) Ltd, Seoul branch is acting as a Market Maker (Liquidity Provider) for the Equity Linked Warrants of SK Energy Co Ltd and owns 10,417,540 as of 25-Nov-10.
• MSCI: The MSCI sourced information is the exclusive property of Morgan Stanley Capital International Inc. (MSCI). Without prior written permission of MSCI, this information and any other MSCI intellectual property may not be reproduced, redisseminated or used to create any financial products, including any indices. This information is provided on an 'as is' basis. The user assumes the entire risk of any use made of this information. MSCI, its affiliates and any third party involved in, or related to, computing or compiling the information hereby expressly disclaim all warranties of originality, accuracy, completeness, merchantability or fitness for a particular purpose with respect to any of this information. Without limiting any of the foregoing, in no event shall MSCI, any of its affiliates or any third party involved in, or related to, computing or compiling the information have any liability for any damages of any kind. MSCI, Morgan Stanley Capital International and the MSCI indexes are services marks of MSCI and its affiliates.
Important Disclosures for Equity Research Compendium Reports: Important disclosures, including price charts for all companies under coverage for at least one year, are available through the search function on J.P. Morgan’s website https://mm.jpmorgan.com/disclosures/company or by calling this U.S. toll-free number (1-800-477-0406)
Explanation of Equity Research Ratings and Analyst(s) Coverage Universe: J.P. Morgan uses the following rating system: Overweight [Over the next six to twelve months, we expect this stock will outperform the average total return of the stocks in the analyst’s (or the analyst’s team’s) coverage universe.] Neutral [Over the next six to twelve months, we expect this stock will perform in line with the average total return of the stocks in the analyst’s (or the analyst’s team’s) coverage universe.] Underweight [Over the next six to twelve months, we expect this stock will underperform the average total return of the stocks in the analyst’s (or the analyst’s team’s) coverage universe.] J.P. Morgan Cazenove’s UK Small/Mid-Cap dedicated research analysts use the same rating categories; however, each stock’s expected total return is compared to the expected total return of the FTSE All Share Index, not to those analysts’ coverage universe. A list of these analysts is available on request. The analyst or analyst’s team’s coverage universe is the sector and/or country shown on the cover of each publication. See below for the specific stocks in the certifying analyst(s) coverage universe.
渐飞研究报告 - http://bg.panlv.net
25
Asia Pacific Equity Research 26 November 2010
Sunil Garg (852) 2800-8518 [email protected]
J.P. Morgan Equity Research Ratings Distribution, as of September 30, 2010
Overweight (buy)
Neutral (hold)
Underweight (sell)
J.P. Morgan Global Equity Research Coverage
46% 43% 12%
IB clients* 49% 45% 33% JPMS Equity Research Coverage 43% 48% 8% IB clients* 69% 60% 50%
*Percentage of investment banking clients in each rating category. For purposes only of FINRA/NYSE ratings distribution rules, our Overweight rating falls into a buy rating category; our Neutral rating falls into a hold rating category; and our Underweight rating falls into a sell rating category.
Valuation and Risks: Please see the most recent company-specific research report for an analysis of valuation methodology and risks on any securities recommended herein. Research is available at http://www.morganmarkets.com , or you can contact the analyst named on the front of this note or your J.P. Morgan representative.
Analysts’ Compensation: The equity research analysts responsible for the preparation of this report receive compensation based upon various factors, including the quality and accuracy of research, client feedback, competitive factors, and overall firm revenues, which include revenues from, among other business units, Institutional Equities and Investment Banking.
Registration of non-US Analysts: Unless otherwise noted, the non-US analysts listed on the front of this report are employees of non-US affiliates of JPMS, are not registered/qualified as research analysts under FINRA/NYSE rules, may not be associated persons of JPMS, and may not be subject to FINRA Rule 2711 and NYSE Rule 472 restrictions on communications with covered companies, public appearances, and trading securities held by a research analyst account.
Other Disclosures
J.P. Morgan ("JPM") is the global brand name for J.P. Morgan Securities LLC ("JPMS") and its affiliates worldwide. J.P. Morgan Cazenove is a marketing name for the U.K. investment banking businesses and EMEA cash equities and equity research businesses of JPMorgan Chase & Co. and its subsidiaries.
Options related research: If the information contained herein regards options related research, such information is available only to persons who have received the proper option risk disclosure documents. For a copy of the Option Clearing Corporation’s Characteristics and Risks of Standardized Options, please contact your J.P. Morgan Representative or visit the OCC’s website at http://www.optionsclearing.com/publications/risks/riskstoc.pdf.
Legal Entities Disclosures U.S.: JPMS is a member of NYSE, FINRA and SIPC. J.P. Morgan Futures Inc. is a member of the NFA. JPMorgan Chase Bank, N.A. is a member of FDIC and is authorized and regulated in the UK by the Financial Services Authority. U.K.: J.P. Morgan Securities Ltd. (JPMSL) is a member of the London Stock Exchange and is authorized and regulated by the Financial Services Authority. Registered in England & Wales No. 2711006. Registered Office 125 London Wall, London EC2Y 5AJ. South Africa: J.P. Morgan Equities Limited is a member of the Johannesburg Securities Exchange and is regulated by the FSB. Hong Kong: J.P. Morgan Securities (Asia Pacific) Limited (CE number AAJ321) is regulated by the Hong Kong Monetary Authority and the Securities and Futures Commission in Hong Kong. Korea: J.P. Morgan Securities (Far East) Ltd, Seoul Branch, is regulated by the Korea Financial Supervisory Service. Australia: J.P. Morgan Australia Limited (ABN 52 002 888 011/AFS Licence No: 238188) is regulated by ASIC and J.P. Morgan Securities Australia Limited (ABN 61 003 245 234/AFS Licence No: 238066) is a Market Participant with the ASX and regulated by ASIC. Taiwan: J.P.Morgan Securities (Taiwan) Limited is a participant of the Taiwan Stock Exchange (company-type) and regulated by the Taiwan Securities and Futures Bureau. India: J.P. Morgan India Private Limited is a member of the National Stock Exchange of India Limited and Bombay Stock Exchange Limited and is regulated by the Securities and Exchange Board of India. Thailand: JPMorgan Securities (Thailand) Limited is a member of the Stock Exchange of Thailand and is regulated by the Ministry of Finance and the Securities and Exchange Commission. Indonesia: PT J.P. Morgan Securities Indonesia is a member of the Indonesia Stock Exchange and is regulated by the BAPEPAM LK. Philippines: J.P. Morgan Securities Philippines Inc. is a member of the Philippine Stock Exchange and is regulated by the Securities and Exchange Commission. Brazil: Banco J.P. Morgan S.A. is regulated by the Comissao de Valores Mobiliarios (CVM) and by the Central Bank of Brazil. Mexico: J.P. Morgan Casa de Bolsa, S.A. de C.V., J.P. Morgan Grupo Financiero is a member of the Mexican Stock Exchange and authorized to act as a broker dealer by the National Banking and Securities Exchange Commission. Singapore: This material is issued and distributed in Singapore by J.P. Morgan Securities Singapore Private Limited (JPMSS) [MICA (P) 020/01/2010 and Co. Reg. No.: 199405335R] which is a member of the Singapore Exchange Securities Trading Limited and is regulated by the Monetary Authority of Singapore (MAS) and/or JPMorgan Chase Bank, N.A., Singapore branch (JPMCB Singapore) which is regulated by the MAS. Malaysia: This material is issued and distributed in Malaysia by JPMorgan Securities (Malaysia) Sdn Bhd (18146-X) which is a Participating Organization of Bursa Malaysia Berhad and a holder of Capital Markets Services License issued by the Securities Commission in Malaysia. Pakistan: J. P. Morgan Pakistan Broking (Pvt.) Ltd is a member of the Karachi Stock Exchange and regulated by the Securities and Exchange Commission of Pakistan. Saudi Arabia: J.P. Morgan Saudi Arabia Ltd. is authorized by the Capital Market Authority of the Kingdom of Saudi Arabia (CMA) to carry out dealing as an agent, arranging, advising and custody, with respect to securities business under licence number 35-07079 and its registered address is at 8th Floor, Al-Faisaliyah Tower, King Fahad Road, P.O. Box 51907, Riyadh 11553, Kingdom of Saudi Arabia. Dubai: JPMorgan Chase Bank, N.A., Dubai Branch is regulated by the Dubai Financial Services Authority (DFSA) and its registered address is Dubai International Financial Centre - Building 3, Level 7, PO Box 506551, Dubai, UAE.
渐飞研究报告 - http://bg.panlv.net

26
Asia Pacific Equity Research 26 November 2010
Sunil Garg (852) 2800-8518 [email protected]
Country and Region Specific Disclosures U.K. and European Economic Area (EEA): Unless specified to the contrary, issued and approved for distribution in the U.K. and the EEA by JPMSL. Investment research issued by JPMSL has been prepared in accordance with JPMSL's policies for managing conflicts of interest arising as a result of publication and distribution of investment research. Many European regulators require a firm to establish, implement and maintain such a policy. This report has been issued in the U.K. only to persons of a kind described in Article 19 (5), 38, 47 and 49 of the Financial Services and Markets Act 2000 (Financial Promotion) Order 2005 (all such persons being referred to as "relevant persons"). This document must not be acted on or relied on by persons who are not relevant persons. Any investment or investment activity to which this document relates is only available to relevant persons and will be engaged in only with relevant persons. In other EEA countries, the report has been issued to persons regarded as professional investors (or equivalent) in their home jurisdiction. Australia: This material is issued and distributed by JPMSAL in Australia to “wholesale clients” only. JPMSAL does not issue or distribute this material to “retail clients.” The recipient of this material must not distribute it to any third party or outside Australia without the prior written consent of JPMSAL. For the purposes of this paragraph the terms “wholesale client” and “retail client” have the meanings given to them in section 761G of the Corporations Act 2001. Germany: This material is distributed in Germany by J.P. Morgan Securities Ltd., Frankfurt Branch and J.P.Morgan Chase Bank, N.A., Frankfurt Branch which are regulated by the Bundesanstalt für Finanzdienstleistungsaufsicht. Hong Kong: The 1% ownership disclosure as of the previous month end satisfies the requirements under Paragraph 16.5(a) of the Hong Kong Code of Conduct for Persons Licensed by or Registered with the Securities and Futures Commission. (For research published within the first ten days of the month, the disclosure may be based on the month end data from two months’ prior.) J.P. Morgan Broking (Hong Kong) Limited is the liquidity provider for derivative warrants issued by J.P. Morgan Structured Products B.V. and listed on the Stock Exchange of Hong Kong Limited. An updated list can be found on HKEx website: http://www.hkex.com.hk/prod/dw/Lp.htm. Japan: There is a risk that a loss may occur due to a change in the price of the shares in the case of share trading, and that a loss may occur due to the exchange rate in the case of foreign share trading. In the case of share trading, JPMorgan Securities Japan Co., Ltd., will be receiving a brokerage fee and consumption tax (shouhizei) calculated by multiplying the executed price by the commission rate which was individually agreed between JPMorgan Securities Japan Co., Ltd., and the customer in advance. Financial Instruments Firms: JPMorgan Securities Japan Co., Ltd., Kanto Local Finance Bureau (kinsho) No. 82 Participating Association / Japan Securities Dealers Association, The Financial Futures Association of Japan. Korea: This report may have been edited or contributed to from time to time by affiliates of J.P. Morgan Securities (Far East) Ltd, Seoul Branch. Singapore: JPMSS and/or its affiliates may have a holding in any of the securities discussed in this report; for securities where the holding is 1% or greater, the specific holding is disclosed in the Important Disclosures section above. India: For private circulation only, not for sale. Pakistan: For private circulation only, not for sale. New Zealand: This material is issued and distributed by JPMSAL in New Zealand only to persons whose principal business is the investment of money or who, in the course of and for the purposes of their business, habitually invest money. JPMSAL does not issue or distribute this material to members of "the public" as determined in accordance with section 3 of the Securities Act 1978. The recipient of this material must not distribute it to any third party or outside New Zealand without the prior written consent of JPMSAL. Canada: The information contained herein is not, and under no circumstances is to be construed as, a prospectus, an advertisement, a public offering, an offer to sell securities described herein, or solicitation of an offer to buy securities described herein, in Canada or any province or territory thereof. Any offer or sale of the securities described herein in Canada will be made only under an exemption from the requirements to file a prospectus with the relevant Canadian securities regulators and only by a dealer properly registered under applicable securities laws or, alternatively, pursuant to an exemption from the dealer registration requirement in the relevant province or territory of Canada in which such offer or sale is made. The information contained herein is under no circumstances to be construed as investment advice in any province or territory of Canada and is not tailored to the needs of the recipient. To the extent that the information contained herein references securities of an issuer incorporated, formed or created under the laws of Canada or a province or territory of Canada, any trades in such securities must be conducted through a dealer registered in Canada. No securities commission or similar regulatory authority in Canada has reviewed or in any way passed judgment upon these materials, the information contained herein or the merits of the securities described herein, and any representation to the contrary is an offence. Dubai: This report has been issued to persons regarded as professional clients as defined under the DFSA rules.
General: Additional information is available upon request. Information has been obtained from sources believed to be reliable but JPMorgan Chase & Co. or its affiliates and/or subsidiaries (collectively J.P. Morgan) do not warrant its completeness or accuracy except with respect to any disclosures relative to JPMS and/or its affiliates and the analyst’s involvement with the issuer that is the subject of the research. All pricing is as of the close of market for the securities discussed, unless otherwise stated. Opinions and estimates constitute our judgment as of the date of this material and are subject to change without notice. Past performance is not indicative of future results. This material is not intended as an offer or solicitation for the purchase or sale of any financial instrument. The opinions and recommendations herein do not take into account individual client circumstances, objectives, or needs and are not intended as recommendations of particular securities, financial instruments or strategies to particular clients. The recipient of this report must make its own independent decisions regarding any securities or financial instruments mentioned herein. JPMS distributes in the U.S. research published by non-U.S. affiliates and accepts responsibility for its contents. Periodic updates may be provided on companies/industries based on company specific developments or announcements, market conditions or any other publicly available information. Clients should contact analysts and execute transactions through a J.P. Morgan subsidiary or affiliate in their home jurisdiction unless governing law permits otherwise.
“Other Disclosures” last revised September 1, 2010.
Copyright 2010 JPMorgan Chase & Co. All rights reserved. This report or any portion hereof may not be reprinted, sold or redistributed without the written consent of J.P. Morgan.#$J&098$#*P
渐飞研究报告 - http://bg.panlv.net