Embed Size (px)
Citation preview
Asia Pacific Equity Research
02 July 2010
Top Stories Sunil Garg(852) [email protected] World (OW), Thailand Send me your feedback!
Growth returns; raising earnings estimates & price target (Maria Lapiz) AM perspective
Adrian Mowat, Chief Equity Strategist We think additional ad minutes, ad rate adjustment, and rising utilization rate will underpin BEC earnings in FY10-11. We thus raise our FY10/FY11 earnings estimates by 13%/25% and our PT to Bt35 from Bt28 based on 20x P/E rolled over to Jun 11. We remain Overweight.
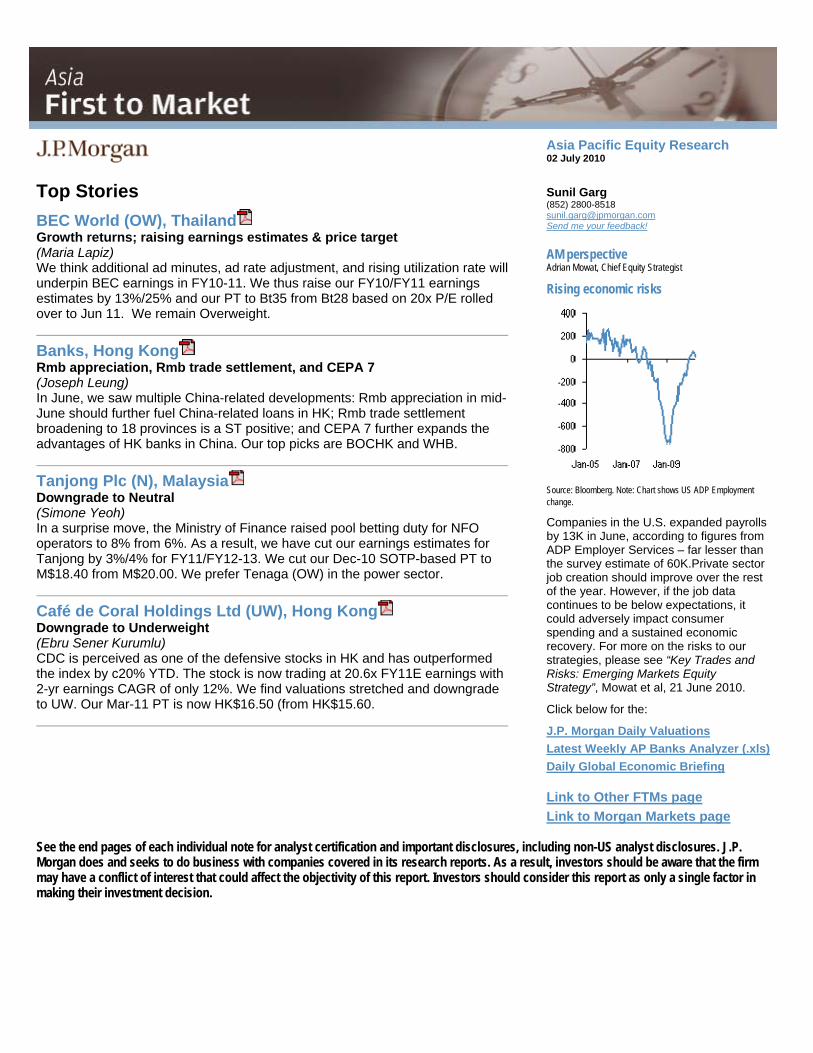
Rising economic risks
Banks, Hong Kong Rmb appreciation, Rmb trade settlement, and CEPA 7(Joseph Leung)In June, we saw multiple China-related developments: Rmb appreciation in mid-June should further fuel China-related loans in HK; Rmb trade settlement broadening to 18 provinces is a ST positive; and CEPA 7 further expands the advantages of HK banks in China. Our top picks are BOCHK and WHB.
Tanjong Plc (N), Malaysia Source: Bloomberg. Note: Chart shows US ADP Employment change. Downgrade to Neutral
(Simone Yeoh)In a surprise move, the Ministry of Finance raised pool betting duty for NFO operators to 8% from 6%. As a result, we have cut our earnings estimates for Tanjong by 3%/4% for FY11/FY12-13. We cut our Dec-10 SOTP-based PT to M$18.40 from M$20.00. We prefer Tenaga (OW) in the power sector.
Café de Coral Holdings Ltd (UW), Hong Kong Downgrade to Underweight(Ebru Sener Kurumlu)CDC is perceived as one of the defensive stocks in HK and has outperformed the index by c20% YTD. The stock is now trading at 20.6x FY11E earnings with 2-yr earnings CAGR of only 12%. We find valuations stretched and downgrade to UW. Our Mar-11 PT is now HK$16.50 (from HK$15.60.
Companies in the U.S. expanded payrolls by 13K in June, according to figures from ADP Employer Services – far lesser than the survey estimate of 60K.Private sector job creation should improve over the rest of the year. However, if the job data continues to be below expectations, it could adversely impact consumer spending and a sustained economic recovery. For more on the risks to our strategies, please see “Key Trades and Risks: Emerging Markets Equity Strategy”, Mowat et al, 21 June 2010. Click below for the: J.P. Morgan Daily ValuationsLatest Weekly AP Banks Analyzer (.xls)Daily Global Economic Briefing
Link to Other FTMs pageLink to Morgan Markets page
See the end pages of each individual note for analyst certification and important disclosures, including non-US analyst disclosures. J.P. Morgan does and seeks to do business with companies covered in its research reports. As a result, investors should be aware that the firm may have a conflict of interest that could affect the objectivity of this report. Investors should consider this report as only a single factor in making their investment decision.
Recommendation and Forecast Changes • Economy, TIP Markets (Sin Beng Ong) Thailand: June CPI softens on fuel - BoT normalization on track
• BEC World (Overweight), TIP Markets (Maria Lapiz) Growth returns; raising earnings and price target
• Economy, TIPV Markets (Matt Hildebrandt) • Cafe de Coral Holdings Ltd (Underweight), Hong Kong (Ebru Sener Kurumlu) Vietnam: GDP growth bounces back strongly from 1Q soft
spot Downgrade to Underweight
• Tanjong Plc (Neutral), Malaysia (Simone Yeoh) Results and Company Views Pool betting duty increased; priced in but limits share price upside; downgrade to Neutral
• Cathay Financial Holdings (Neutral), Taiwan (Dexter Hsu) Post Card from New York - ALERT Strategy
• HTC Corp (Underweight), Taiwan (Alvin Kwock) • Market Strategy, Global (Adrian Mowat) Postcard from J.P. Morgan NY Conference - ALERT Emerging Markets Strategy Dashboards
• KT&G Corp (Neutral), South Korea (Jinah Lee) • Market Strategy, India (Bharat Iyer) Workforce restructuring not meaningful - ALERT India Monthly Wrap: June 2010: A month of policy actions...
• LG Telecom: (Not Covered), South Korea (Sungmin Chang)
• Market Strategy, Malaysia (Chris Oh, CFA) Malaysia Monthly Wrap: June 2010: KLCI outperforms the region slightly Company Visit Note: CEO takes first step
• Mahindra & Mahindra (Overweight), India (Aditya Makharia)
• Market Strategy, Taiwan (Nick Lai) Taiwan Monthly Wrap: June 2010: ECFA signed
Jun' 10 - Sales growth (+7% yoy) moderates on base effect and production constraints - ALERT • Market Strategy, TIP Markets (Aditya Srinath, CFA)
Indonesia Monthly Wrap: June 2010: Consumption plays in focus
• Maruti Suzuki India Ltd (Neutral), India (Aditya Makharia)
Jun'10 - Sales grow +17% y/y but decline -14% m/m due to maintenance shutdown at plant - ALERT
Economics • Economy, China (Qian Wang)
• SK Holdings (Overweight), South Korea (Youna Kim) June manufacturing PMIs suggest moderation in industrial growth momentum; input cost component fell further One step further to holding company transformation
• Tanjong Plc (Overweight), Malaysia (Simone Yeoh) • Economy, India (Jahangir Aziz)
1QFY11 results in line; dividends raised Activity takes a breather but inflation still set to rise • Taishin Financial Holdings (Underweight), Taiwan
(Dexter Hsu) • Economy, South Korea (Jiwon Lim) Customs trade surplus up significantly in June, but details not encouraging Post Card from New York – ALERT
• Tata Power (Neutral), India (Shilpa Krishnan) • Economy, South Korea (James DH Lee)
Inflation edged up in June, with non-core prices down
• Economy, TIP Markets (Sin Beng Ong) Indonesia: June CPI rises on food - BI to stay pat on July 5
• Economy, TIP Markets (Sin Beng Ong) Indonesia: May trade surplus surges - trend narrowing remains
TPWR strikes a deal to dilute 14-15% stake in Indonesian coal mine SPVs, implied valuations in-line - ALERT
Sector Research • Construction, South Korea(Jinmook Kim)
Potential order cancellation in Iran - ALERT

Asia Analyst Focus List
Company Name Ticker Analyst RatingMkt. Cap
(MM) Mkt. Cap (US$ MM)
Focus List Add Date
Focus List Add Price
Close 07/01/10
Target Price
Date Target Price Set
Australia Aristocrat Leisure Limited (A$) ALL AU Stuart Jackson, CFA OW 1925 1609 30-Oct-09 4.52 3.61 5. 5
* 23-Feb-10
Campbell Brothers Limited (A$) CPB AU Alexander Mees, AC AStuart Jackson, CFA
* 1889 1578 9-Sep-09 24.33 30.00 23-Feb-10GrainCorp Ltd (A ) $Intoll Group (A$)
GNC A UITO AU
OW 1061 887 26-Nov-09 6.29 5.35 7.25 27-May-10Kirsty Mackay-Fisher, CFA OW 2386 1994 17-Apr-09 1.35 1.06 1.80 3-Feb-10
Myer Holdings Limited (A$) MYR AU Shaun Cousins OW 1838 1536 5-Feb-10 3.25 3.16 4.05 14-May-10Wesfarmers Limited (A$) WES AU Shaun Cousins OW 32154 26872 6-May-10 27.99 27.77 33.39 28-May-10Westfi ld Group (A$) e WDC AU Rob Stanton O W 28132 23511 27-Jan-10 12. 1 9 12. 9 1 13. 2 9 3-Jun-10 China AAC Acoustic (HK$) 2018 H K
753 HK Charles Guo OW 13754 1765 8-Sep-09 6.91 11.20 17.50
7.8 11-May-10
Air China (HK$) Corrine Pn gSunil Garg
OW 123527 15853 27-Aug-084-Mar-09
3.93 7.78 23-May-10Bank of China 'H' (HK$) 3988 HK OW 994467 127629 2.16 3.97 6.1 24-Mar-10Bank of Communications Co (HK ) $China Citic Bank - H Share (HK$)
3328 H K998 HK
Samuel Chen OW 421478 54092 31-Mar-10 8.73 8.29 11.7 7-Jun-10 Samuel Chen OW 22774 5
20618 2922 92646
23-Nov-09 6.73 4.99 7.70 30-Apr-10China High Speed Transmission (HK$) 658 HK Boris Kan OW 6-May-10 18.42 16.56 24.30 6-May-10China Merchants Bank Co., Ltd - A (HK$) 600036 CH Samuel Chen OW 29062 3
2034 4285 82034
29-Apr-10 13.82 12.81 20.60 14-Apr-10Focus Media (US$) FMCN Dick Wei OW 3-Jun-10 15.44 15.53 22.00
6.5 3-Jun-10
Industrial and Commercial Bank of China - A (Rmb) 601398 CH Samuel Chen OW 1427338 210491 30-Oct-09 4.95 4.04 26-Mar-10Shandong Chenming Paper (HK$) 1812.H K
5 6 HK Leon Chik, CF AK ren Li, CFA
OW 13457 1727 30-Mar-10 5.31 5.86 12 5-May-10Zhejiang Expressway (HK$) 7 a O W 31357 4024 20-Apr-10 6.83 7.2 2 8. 1 20-Apr-10Hong Kong Cosco Pacific (HK$) 1199 HK Karen Li OW 25244 3240 26-Aug-08 10.64 9.31 15.60 31-Mar-10HSBC Holdings plc (HK$) 5 HK Sunil Garg OW 1272089 163259 24-May-10 71.65 72.65 115.00 22-Apr-10Ju Teng International Holdings Limit d (HK$) eK Wah nternational Holdings (HK$)
3336 H K1 3 HK
Alvin Kwock OW 5388 692 29-Nov-09 5.62 4.82 10 29-Nov-09 I 7 Sunny Tam, CFA O W 6025 77 3 13-Apr-10 2.98 2.4 3 4. 7 14-Apr-10
Japan Citizen Holdings (¥) 7762 JT Hisashi Moriyama OW 187439 2142 29-Jan-10 586 535.00 750.00 28-May-10Dainippon Screen Mfg. ¥) (FUJIFILM Holdings (¥)
7735 JT Hisashi Moriyama OW 100066 1143 22-Jun-10 478 394.00 700.00 22-Jun-104901 JT Hisashi Moriyama OW 1309723 14965 26-Jan-10 2,942 2545.00 4,500.00 28-May-10
Hitachi (¥) 6501 JT Yoshiharu Izumi OW 1423218 16262 29-Jul-09 293 315.00 590.00 23-Apr-10Honda Moto (7267) (¥) r Nintendo (¥)
7267 JT Kohei Takahashi OW 4609089 52664 19-Jan-10 3,370 2512.00 3,600.00 37,000
29-May-107974 JO Eiji Maeda OW 3707478 4236 6
9711 23-Mar-10 27,970 26170.00
9,100 7-May-10
Tokyo Elect n (¥) ro 8 35 JP 0 Hisashi Moriyama O W 849774 6-Apr-06 8,050 4705 00. 10-May-10Philippines Philippine S ock Exchange Inc (Php) t PSE PM Harsh Wardhan Modi O W 7894 17 0 9-Oc 07 t- 82 0 257 .50 700. 0 0 27-Jun-09Singapore CapitaLand (S$) CAPL S P
DBS SP Christopher Gee OW 15299 10948 29-Sep-08
8-Aug-08 3.26 3.59 5.30 18-Jan-10
DBS Group (S$) Harsh Wardhan Modi OW 31415 22482 14.36 13.76 19.00 1.35
9-May-10Genting Singapore (S$) GENS SP Nicole Goh OW 14361 1027 7
7205 10-May-10 0.96 1.18
3.50 14-May-10
Noble Group Ltd (S$) NOBL SP Ajay Mirchandani OW 10068 12-Nov-09 2.83 1.68 12-Nov-09Olam International (S$) OLAM SP Ajay Mirchandani OW 5072 3630 2-Oct-08 1.80 2.51 3.70 10-Aug-09Singapore Airlines (S$) SIA SP Corrine Png OW 17245 1234 1
5618 23-May-10 14.60 14.46 17.0 0
1 2-Feb-10
Singapore Exchange (S$) SGX SP Harsh Wardhan Modi OW 7851 22-Jul-09 7.62 7.33 09
22-Jul-09 Wilmar International Limited (S$) WIL SP Y ng-Jian Chan i O W 36377 26033 25-Jan-10 6.69 5.6 9 25-Jan-10South Korea LG Display (W) 034220 KS JJ Park OW 13972700 11387 15-Mar-10 35900.00 39050.00 60,000.00 23-Apr-10LG Innotek (W) 011070 KS Marcus Shin OW 3351722 2732 23-Mar-10 115000.0 0
96100.00 167500.00 210,000.00 27-Apr-10
Samsung SDI (W) 006400 KS Marcus Shin OW 7653802 6238 23-Jun-09 168000.00 240,000.00 20-Jun-10SK Energy Co Ltd (W) 096770 KS Brynjar Eirik Bustnes OW 9893815 8063 5-Oct-07 147,500 107000.00 150,000.00 19-Oct-09Hyundai Department Stores (W) 069960 KS Jinah Lee OW 2623204 2138 3-Mar-10 100,500 115500.00 120,000.00 23-Apr-10Woori Financial Group (W) 053000 KS Scott YH Seo OW 11566320 9426 26-Mar-10 15,400 14350.00 22,000.00 26-Mar-10Taiwan Chinatrust Financial Holdings (NT$) 2891 TT Dexter Hsu OW 162820 5057 24-Aug-09 18.75 17.35 26.00 24-Oct-09Chimei Innolux Corporation (NT$) 3481 TT JJ Park OW 26227 5
43267 8146 10-Jan-10 54.1 32.65 63.00 10-Jan-10
Prime View International Co. (NT$) 8069 TT Winnie Hong OW 1344 4-Mar-10 63.6 40.30 85.00 28-Nov-09Tripod Technology Corp (NT$) 3044 TT Christopher Ma OW 56112 1743 18-Apr-10 106.0 118.5 0
46.05 160.00 60.00
18-Apr-10Unimicron Technology Corp. (NT$) 3037 TT Christopher Ma OW 71258 2213 18-Apr-10 40.75 18-Apr-10Thailand PTT Public Company (Bt) PTT TB Sukit Chawalitakul OW 698219 21537 23-Mar-10 256.00 246.00 378.00 24-Jun-10
Source: Bloomberg, J.P. Morgan estimates. *Under applicable law and/or JPMorgan Chase & Co policy, all J.P. Morgan ratings and estimates for this company have been removed.
For details on the AFL methodology, please see the Asia Cash Equities page on mm.jpmorgan.com or contact your J.P. Morgan salesperson/the covering analyst.
Your feedback can help us to make the FTM better. Please take a moment to tell us what you think. Click here to send comments Click here for the Blackberry version Click here to unsubscribe

Asia Pacific Equity Research 01 July 2010
BEC World
Overweight BEC.BK, BEC TB
Growth returns; raising earnings and price target ▲
Price: Bt27.50
Price Target: Bt35.00 Previous: Bt28.00
Thailand Broadcasting & Radio
Maria LapizAC
(66-2) 684-2683 [email protected]
JPMorgan Securities (Thailand) Limited
18
24
30
Bt
Jun-09 Sep-09 Dec-09 Mar-10 Jun-10
Price Performance
BEC.BK share price (Bt)SET (rebased)
YTD 1m 3m 12mAbs 10.0% 15.1% 13.2% 31.6%Rel 1.5% 7.0% 12.1% -1.8%
BEC World (Reuters: BEC.BK, Bloomberg: BEC TB) Bt in mn, year-end Dec FY08A FY09A FY10E FY11E FY12ERevenue 8,798 8,949 10,968 12,667 13,816Net Profit 2,875.0 2,635.1 3,249.0 3,749.5 3,939.7EPS (Bt) 1.44 1.32 1.62 1.87 1.97DPS (Bt) 1.35 1.30 1.54 1.78 1.87Revenue growth (%) 13.0% 1.7% 22.6% 15.5% 9.1%EPS growth (%) 27.7% -8.3% 23.3% 15.4% 5.1%ROCE 61.7% 54.5% 65.6% 72.9% 73.2%ROE 42.4% 37.0% 44.8% 49.8% 50.0%P/E (x) 19.1 20.9 16.9 14.7 14.0P/BV (x) 7.8 7.7 7.5 7.1 6.8EV/EBITDA (x) 8.9 9.0 7.5 6.4 6.0Dividend Yield 4.9% 4.7% 5.6% 6.5% 6.8%
Shares O/S (mn) 2,000Market cap (Bt mn) 55,000Market cap ($ mn) 1,695Price (Bt) 27.50Date Of Price 30 Jun 10Free float (%) 38.4%3mth Avg daily volume 3M - Average daily Value (Bt mn) Average 3m Daily Turnover (mn) SET 797Exchange Rate 32.45Fiscal Year End Dec
Source: Company data, Bloomberg, J.P. Morgan estimates.
• Raising earnings, price target: Additional ad minutes, ad rate adjustment and rising utilization rate will underpin BEC earnings in FY10-11, in our view. We thus raise our FY10 and FY11 earnings estimates by 13% and 25%, respectively. The higher earnings stream results in our price target being raised to Bt35 from Bt28 based on 20x PE rolled over to Jun 11. We remain OW.
• Potential earnings drivers. The 35%Y/Y growth in BEC’s 1Q10 net profit was underpinned by the 41.5%Y/Y rise in TV ad revenues driven in turn by increased available ad minutes, higher primetime minutes and higher non prime time income reflecting improved utilization rates. We think these drivers are sustainable well into FY11. We expect earnings growth to resume with 23%Y/Y in FY10 and 15% in FY11, higher than our previous estimates of 9% and 5%, respectively.
• Strong TV advertising outlook. Despite the political turmoil in Apr/May, TV adspend posted positive Y/Y growth even adjusting for the steep contraction in 1H09. A positive surprise that, in our view, reflects manufacturers’ stance that consumer spending is recovering. With demand for TV ad remaining strong there is further potential upside to BEC’s earnings.
• Changing valuation methodology. Previously we valued BEC using DDM with 3% perpetuity growth, with the implied value being Bt33. However, the DDM methodology is no longer well-suited, in our view, due to impending change in regulatory framework that makes perpetuity assumption difficult to defend in the light of no concrete guidance on future business model from management. Thus, we change our valuation methodology to PE -based.
• Risks to PT. Depressed consumer sentiment resulting in manufacturers cutting ad spends and rise in programming costs.
Asia Pacific Equity Research 01 July 2010
Hong Kong Banks
Rmb appreciation, Rmb trade settlement, and CEPA 7
Hong Kong Banks
Joseph LeungAC
(852) 2800-8517 [email protected]
Sunil Garg (852) 2800-8518 [email protected]
J.P. Morgan Securities (Asia Pacific) Limited
Theme of the month Threefold impact from China
Recent research notes Asia Financials (Sunil Garg) - Upgrade HK to OW (24 Jun)
Hong Kong macro (Lu Jiang) - Retail sales +15.6% y/y (1 Jun) - Unemployment +20bp (17 Jun) - CPI +1.4% (23 Jun) - Trade +24.4% (24 Jun)
HK property (Ryan Li) - Weekly primary sales (28 Jun)
HK banks (Joseph Leung) - BOCHK: Capital and franchise
advantage in times of recovery (25 Jun)
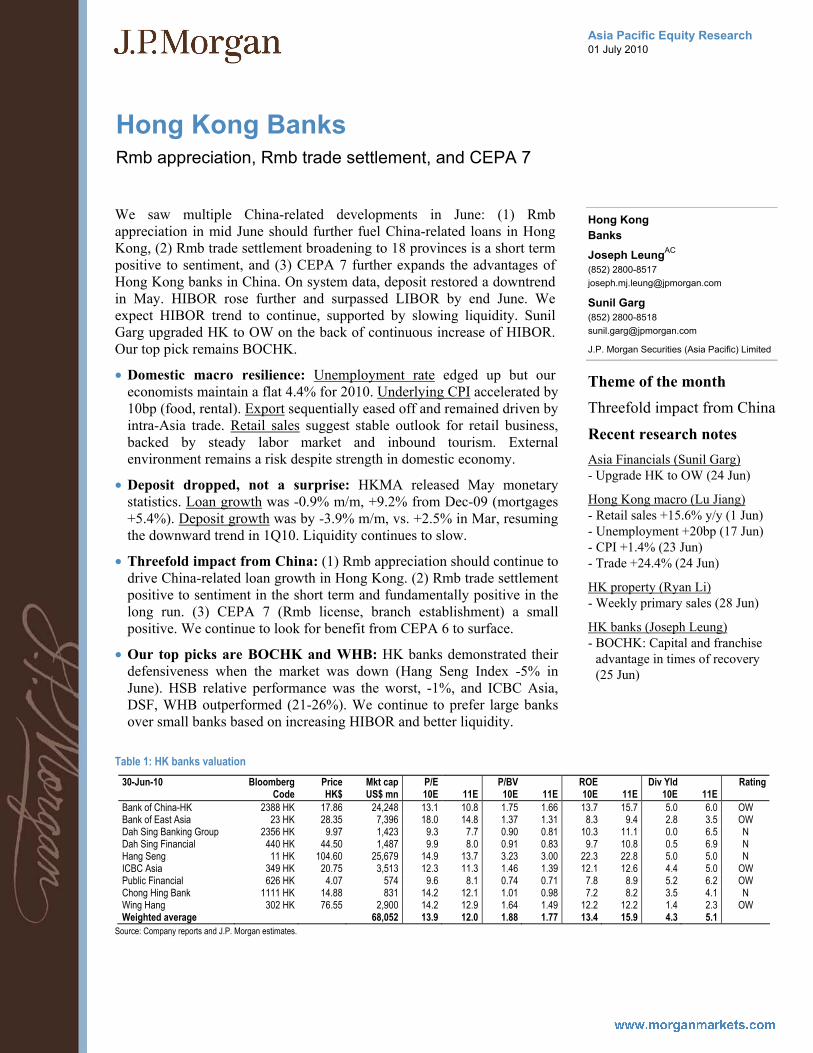
We saw multiple China-related developments in June: (1) Rmb appreciation in mid June should further fuel China-related loans in Hong Kong, (2) Rmb trade settlement broadening to 18 provinces is a short term positive to sentiment, and (3) CEPA 7 further expands the advantages of Hong Kong banks in China. On system data, deposit restored a downtrend in May. HIBOR rose further and surpassed LIBOR by end June. We expect HIBOR trend to continue, supported by slowing liquidity. Sunil Garg upgraded HK to OW on the back of continuous increase of HIBOR. Our top pick remains BOCHK.
• Domestic macro resilience: Unemployment rate edged up but our economists maintain a flat 4.4% for 2010. Underlying CPI accelerated by 10bp (food, rental). Export sequentially eased off and remained driven by intra-Asia trade. Retail sales suggest stable outlook for retail business, backed by steady labor market and inbound tourism. External environment remains a risk despite strength in domestic economy.
• Deposit dropped, not a surprise: HKMA released May monetary statistics. Loan growth was -0.9% m/m, +9.2% from Dec-09 (mortgages +5.4%). Deposit growth was by -3.9% m/m, vs. +2.5% in Mar, resuming the downward trend in 1Q10. Liquidity continues to slow.
• Threefold impact from China: (1) Rmb appreciation should continue to drive China-related loan growth in Hong Kong. (2) Rmb trade settlement positive to sentiment in the short term and fundamentally positive in the long run. (3) CEPA 7 (Rmb license, branch establishment) a small positive. We continue to look for benefit from CEPA 6 to surface.
• Our top picks are BOCHK and WHB: HK banks demonstrated their defensiveness when the market was down (Hang Seng Index -5% in June). HSB relative performance was the worst, -1%, and ICBC Asia, DSF, WHB outperformed (21-26%). We continue to prefer large banks over small banks based on increasing HIBOR and better liquidity.
Table 1: HK banks valuation
30-Jun-10 Bloomberg Price Mkt cap P/E P/BV ROE Div Yld Rating Code HK$ US$ mn 10E 11E 10E 11E 10E 11E 10E 11E Bank of China-HK 2388 HK 17.86 24,248 13.1 10.8 1.75 1.66 13.7 15.7 5.0 6.0 OW Bank of East Asia 23 HK 28.35 7,396 18.0 14.8 1.37 1.31 8.3 9.4 2.8 3.5 OW Dah Sing Banking Group 2356 HK 9.97 1,423 9.3 7.7 0.90 0.81 10.3 11.1 0.0 6.5 N Dah Sing Financial 440 HK 44.50 1,487 9.9 8.0 0.91 0.83 9.7 10.8 0.5 6.9 N Hang Seng 11 HK 104.60 25,679 14.9 13.7 3.23 3.00 22.3 22.8 5.0 5.0 N ICBC Asia 349 HK 20.75 3,513 12.3 11.3 1.46 1.39 12.1 12.6 4.4 5.0 OW Public Financial 626 HK 4.07 574 9.6 8.1 0.74 0.71 7.8 8.9 5.2 6.2 OW Chong Hing Bank 1111 HK 14.88 831 14.2 12.1 1.01 0.98 7.2 8.2 3.5 4.1 N Wing Hang 302 HK 76.55 2,900 14.2 12.9 1.64 1.49 12.2 12.2 1.4 2.3 OW Weighted average TOTAL-HK 68,052 13.9 12.0 1.88 1.77 13.4 15.9 4.3 5.1
Source: Company reports and J.P. Morgan estimates.

Asia Pacific Equity Research 02 July 2010
Tanjong Plc ▼ Neutral
Previous: Overweight
TJPL.KL, TJN MK
Pool betting duty increased; priced in but limits share price upside; downgrade to Neutral ▼
Price: M$17.30
Price Target: M$18.40 Previous: M$20.00
Malaysia Independent Power Producers
Simone YeohAC
(60-3) 2270-4710 [email protected]
JPMorgan Securities (Malaysia) Sdn. Bhd. (18146-X)
Boris Kan (852) 2800-8573 [email protected]
J.P. Morgan Securities (Asia Pacific) Limited
13
16
19
M$
Jul-09 Oct-09 Jan-10 Apr-10 Jul-10
Price Performance
TJPL.KL share price (M$)FBMKLCI (rebased)
YTD 1m 3m 12mAbs -0.2% -0.6% -6.3% 24.9%Rel -2.8% -2.6% -4.7% 3.7%
Company data52-wk range (M$) M$13.4-19.12 Mkt. cap (M$MM) 6976.33 Mkt. cap (US$MM) 2157.72 Shares O/S (MM) 403.26 Free float (%) 57.28 Avg. daily volume 0.36 Liquidity (S$MM) 6.09 Exchange rate 3.23 Index 1308.76 Year-end Jan Source: Bloomberg.
• Pool betting duty increased: In a surprise move, the Ministry of Finance raised pool betting duty for NFO operators to 8% from 6% previously (betting duties are based on gross sale proceeds after deducting gaming tax of 8%). The new rates take effect on Jun-10 for an eight-month impact on Tanjong’s FY11 earnings with full impact in FY12.
• Impact on earnings: Tanjong's NFO operations account for an estimated 19% of its earnings, with power generation accounting for the bulk of the remaining 81%. We have cut our earnings estimates for Tanjong by 3% for FY11 and 4% for FY12-13 to factor in the new betting duties.
• The bigger picture implications and other concerns: The government’s recent less liberal stance toward the gaming industry greatly reduces the prospect of Tanjong securing a new NFO game (similar to that secured by its rivals in 2009), which has been one of the much awaited catalysts for the stock. Note that the government recently revoked the sports betting license initially given to Berjaya Corp. Separately, plans to spin off or list the power division potentially in the UK to unlock value may also be delayed due to the European debt issues.
• Downgrade to Neutral: We cut our Dec-10 SOTP-based PT from M$20.00 to M$18.40 to factor in the new betting duty and we have now stripped out the incremental value (estimated at M$1.00/share) from the prospect of a new NFO game. We believe acquisition prospects for the power division still remain a key mid- to long-term catalyst and are a key risk to our downgrade should it materialize sooner than expected, given the group's good track record here. Net dividend yield of 4-5% should also provide good downside support. We would look to buy Tanjong below M$17.00. We prefer Tenaga in the power sector.
Tanjong Plc (TJN MK; TJPL.KL) historical summary Yr to Jan-31 FY09 FY10 FY11E FY12E FY13E Sales (M$MM) 4,979.5 5,219.9 5,262.0 5,239.8 5,273.7 Reported Net profit (M$MM) 463.7 676.8 659.8 680.0 706.7 Core Net profit (M$MM) 558.4 676.8 659.8 680.0 706.7 Core FD EPS (M$) 1.38 1.68 1.64 1.69 1.75 DPS (M$) 0.68 0.75 0.76 0.79 0.82 Sales growth (%) 23.2% 4.8% 0.8% -0.4% 0.6% Net profit growth (%) 0.7% 21.2% -2.5% 3.1% 3.9% EPS growth (%) 0.7% 21.2% -2.5% 3.1% 3.9% ROE (%) 17.0% 17.7% 15.8% 15.0% 14.4% ROCE (%) 8.4% 10.0% 9.3% 9.7% 10.0% FD P/E (x) 12.5 10.3 10.6 10.3 9.9 P/BV (x) 2.1 1.8 1.7 1.5 1.4 EV/EBITDA (x) 8.7 7.4 7.4 6.9 6.4 Net div yield (%) 3.9% 4.3% 4.4% 4.6% 4.8% Source: Company reports and J.P. Morgan estimates.
.

Asia Pacific Equity Research 01 July 2010
Cafe de Coral Holdings Ltd ▼ Underweight
Previous: Neutral
0341.HK, 341 HK
Downgrade to Underweight ▲
Price: HK$20.00
Price Target: HK$16.50 Previous: HK$15.60
Hong Kong Food Retailing
Ebru Sener KurumluAC
(852) 2800-8521 [email protected]
J.P. Morgan Securities (Asia Pacific) Limited
14
17
20
HK$
Jun-09 Sep-09 Dec-09 Mar-10 Jun-10
Price Performance
0341.HK share price (HK$HSI (rebased)
YTD 1m 3m 12mAbs 13.1% 11.5% 6.4% 29.4%Rel 20.9% 9.7% 12.2% 19.9%
• Results slightly below estimates: CDC announced HK$513mn net profit, up 16% y/y and 3% better than our and Bloomberg consensus for headline net profit. However after excluding non-recurring items such as fair value gains on investments and gain(loss) on disposal of financial assets from both years, recurring earnings were HK$476m, up 7% y/y and 4% below our estimate. 4% miss was mainly due to lower than expected sales from HK and lower than expected dividend income.
• Hong Kong operations: CDC posted 2% SSSG in HK in FY10. Management noted that 1QFY11 has been difficult in HK due to World Cup impact and SSSG was almost flat. However management expects this to improve in coming quarters and we are modeling 9% sales growth in HK, half driven by SSSG and half by store expansion. We expect the company to pass on the food cost pressure which is small so far and maintain margins. However if minimum wages are set at a substantially high level in HK this would pose a threat to margins.
• China operations: China SSSG growth was almost flat in FY10. Margins posted healthy improvement, partly driven by low pork prices impacting CDC's Scan Foods margins. For FY11 we forecast 33% growth in sales and 46% growth in operating profit mainly driven by store additions. In FY11 the company targets to add 35 stores to its China network of 95 stores.
• North America operations: Following the consolidation period this operation was break-even at EBIT level in FY10. We expect small improvement in profit in FY11.
• Downgrade to UW: CDC is perceived as one of the defensive stocks in HK and outperformed the index by c20% YTD. The stock is now trading at 20.6x FY11 earnings with 2yr earnings CAGR of only 12%. Furthermore our estimates could have downside risk if wages increase notably in HK and if China operations cannot maintain strong margins which were partly due to low pork prices that benefited Scan Foods. We find the valuations stretched and downgrade to UW. Our Mar-11 PT of HK$16.5 is based on LT average P/E of c17x. Main risk to our call is stronger than expected SSSG in HK and China.
Reuters: 0341.HK; Bloomberg: 341 HK HK$ in millions, year-end March
FY10 FY11E FY12E FY13E Sales 4,883 5,481 6,058 6,511 52-week range (HK$) 15.24 - 21.35 Net profit 513 540 595 669 Market cap (HK$ MM) 11,218 EPS (HK$) 0.92 0.97 1.07 1.20 Market cap (US$ MM) 1,439 DPS (HK$) 0.62 0.82 0.75 0.84 Shares outstanding 561 Sales growth (%) 4% 12% 11% 7% Avg daily value (HK$ MM) 8.1 Net profit growth (%) 16% 5% 10% 12% Avg daily value (US$ MM) 1.0 Recurring profit growth* (%) 7% 13% 10% 12% Avq daily volume (MM shrs) 0.4 ROE (%) 18% 18% 19% 20% Index (HSI) 20,129 P/E (x) 21.7 20.6 18.7 16.7 Exchange rate (HK$/US$) 7.75 P/BV (x) 3.9 3.8 3.6 3.4 Price Date 30 June, 2010 EV/EBITDA (x) 13.7 12.2 10.9 9.6 Dividend yield (%) 3.1% 4.1% 3.7% 4.2%
Source: Company, Bloomberg and JPMorgan estimates; * Excluding property revaluation, impairment charges and gains (losses) via financial instruments.
Emerging Markets Equity Research 01 July 2010
Emerging Markets Strategy Dashboards
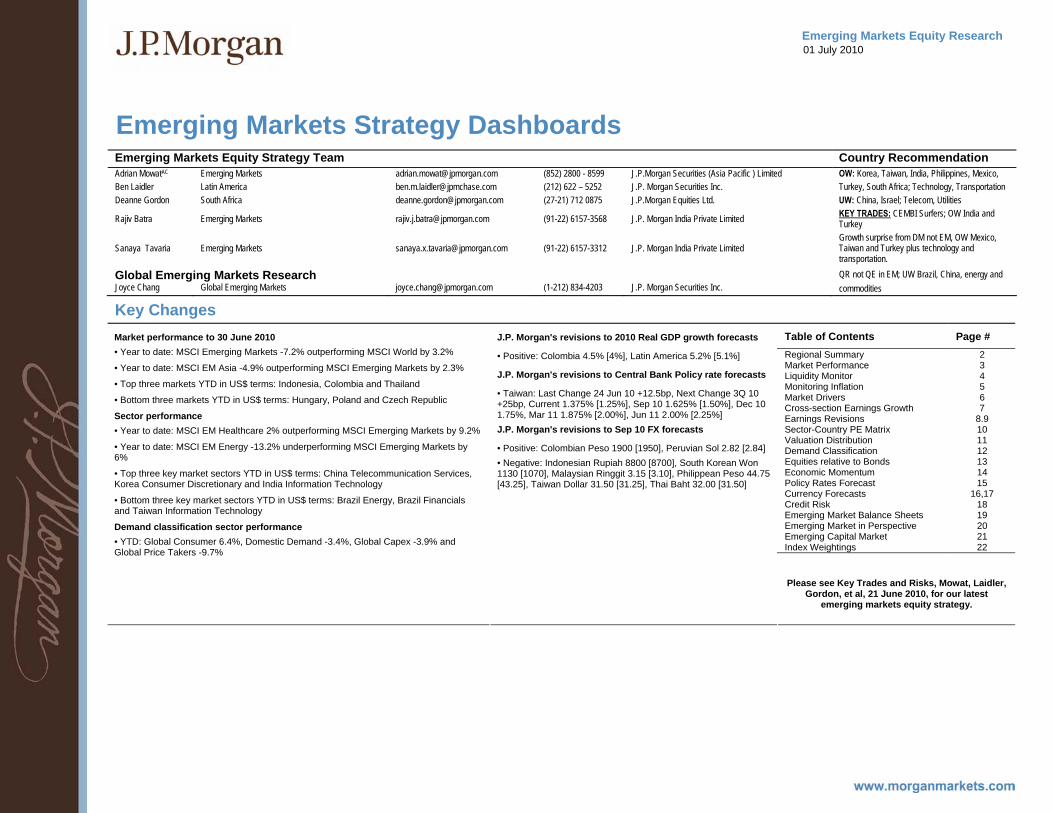
Emerging Markets Equity Strategy Team Country Recommendation Adrian MowatAC Emerging Markets [email protected] (852) 2800 - 8599 J.P.Morgan Securities (Asia Pacific ) Limited OW: Korea, Taiwan, India, Philippines, Mexico, Ben Laidler Latin America [email protected] (212) 622 – 5252 J.P. Morgan Securities Inc. Turkey, South Africa; Technology, Transportation Deanne Gordon South Africa [email protected] (27-21) 712 0875 J.P.Morgan Equities Ltd. UW: China, Israel; Telecom, Utilities
Rajiv Batra Emerging Markets [email protected] (91-22) 6157-3568 J.P. Morgan India Private Limited KEY TRADES: CEMBI Surfers; OW India and Turkey
Sanaya Tavaria Emerging Markets [email protected] (91-22) 6157-3312 J.P. Morgan India Private Limited Growth surprise from DM not EM, OW Mexico, Taiwan and Turkey plus technology and transportation.
Global Emerging Markets Research QR not QE in EM; UW Brazil, China, energy and Joyce Chang Global Emerging Markets [email protected] (1-212) 834-4203 J.P. Morgan Securities Inc. commodities
Key Changes Table of Contents Page # Regional Summary 2 Market Performance 3 Liquidity Monitor 4 Monitoring Inflation 5 Market Drivers 6 Cross-section Earnings Growth 7 Earnings Revisions 8.9 Sector-Country PE Matrix 10 Valuation Distribution 11 Demand Classification 12 Equities relative to Bonds 13 Economic Momentum 14 Policy Rates Forecast 15 Currency Forecasts 16,17 Credit Risk 18 Emerging Market Balance Sheets 19 Emerging Market in Perspective 20 Emerging Capital Market 21 Index Weightings 22
Market performance to 30 June 2010 • Year to date: MSCI Emerging Markets -7.2% outperforming MSCI World by 3.2%
• Year to date: MSCI EM Asia -4.9% outperforming MSCI Emerging Markets by 2.3%
• Top three markets YTD in US$ terms: Indonesia, Colombia and Thailand
• Bottom three markets YTD in US$ terms: Hungary, Poland and Czech Republic
Sector performance • Year to date: MSCI EM Healthcare 2% outperforming MSCI Emerging Markets by 9.2%
• Year to date: MSCI EM Energy -13.2% underperforming MSCI Emerging Markets by 6%
• Top three key market sectors YTD in US$ terms: China Telecommunication Services, Korea Consumer Discretionary and India Information Technology
• Bottom three key market sectors YTD in US$ terms: Brazil Energy, Brazil Financials and Taiwan Information Technology
Demand classification sector performance • YTD: Global Consumer 6.4%, Domestic Demand -3.4%, Global Capex -3.9% and Global Price Takers -9.7%
J.P. Morgan's revisions to 2010 Real GDP growth forecasts
• Positive: Colombia 4.5% [4%], Latin America 5.2% [5.1%]
J.P. Morgan's revisions to Central Bank Policy rate forecasts
• Taiwan: Last Change 24 Jun 10 +12.5bp, Next Change 3Q 10 +25bp, Current 1.375% [1.25%], Sep 10 1.625% [1.50%], Dec 10 1.75%, Mar 11 1.875% [2.00%], Jun 11 2.00% [2.25%] J.P. Morgan's revisions to Sep 10 FX forecasts
• Positive: Colombian Peso 1900 [1950], Peruvian Sol 2.82 [2.84] • Negative: Indonesian Rupiah 8800 [8700], South Korean Won 1130 [1070], Malaysian Ringgit 3.15 [3.10], Philippean Peso 44.75 [43.25], Taiwan Dollar 31.50 [31.25], Thai Baht 32.00 [31.50]
Please see Key Trades and Risks, Mowat, Laidler,
Gordon, et al, 21 June 2010, for our latest emerging markets equity strategy.
Asia Pacific Equity Research 01 July 2010
India Monthly Wrap
June 2010: A month of policy actions...
Indian Equity Strategy
Bharat IyerAC
(91-22) 6157-3600 [email protected]
Bijay Kumar, CFA (91-22) 6157-3586 [email protected]
Gunjan Prithyani (91-22) 6157-3593 [email protected]
J.P. Morgan India Private Limited
BSE Sensex
90
100
110
120
130
Jun 09 Sep 09 Dec 09 M ar 10 Jun 10
Source: Bloomberg (rebased performance).
MSCI India relative
9095
100105110115
Jun 09 Oct 09 Feb 10 Jun 10
rel to EM
rel to APx J
Source: MSCI, Bloomberg.
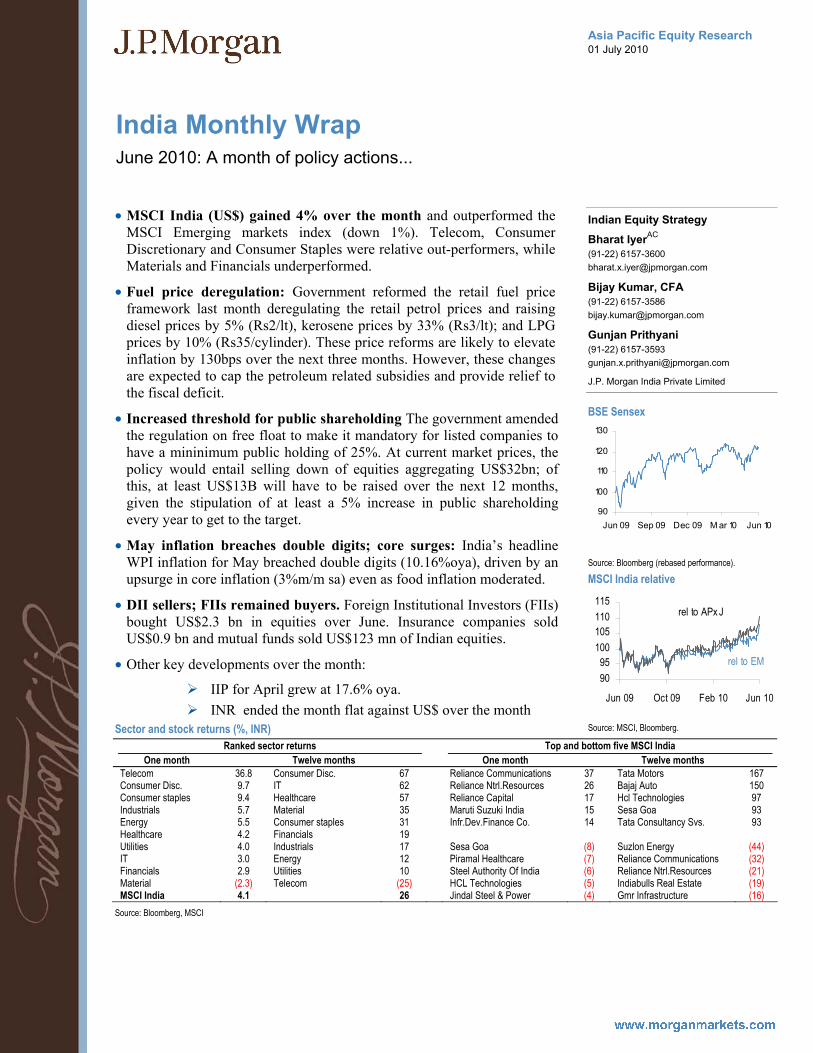
• MSCI India (US$) gained 4% over the month and outperformed the MSCI Emerging markets index (down 1%). Telecom, Consumer Discretionary and Consumer Staples were relative out-performers, while Materials and Financials underperformed.
• Fuel price deregulation: Government reformed the retail fuel price framework last month deregulating the retail petrol prices and raising diesel prices by 5% (Rs2/lt), kerosene prices by 33% (Rs3/lt); and LPG prices by 10% (Rs35/cylinder). These price reforms are likely to elevate inflation by 130bps over the next three months. However, these changes are expected to cap the petroleum related subsidies and provide relief to the fiscal deficit.
• Increased threshold for public shareholding The government amended the regulation on free float to make it mandatory for listed companies to have a mininimum public holding of 25%. At current market prices, the policy would entail selling down of equities aggregating US$32bn; of this, at least US$13B will have to be raised over the next 12 months, given the stipulation of at least a 5% increase in public shareholding every year to get to the target.
• May inflation breaches double digits; core surges: India’s headline WPI inflation for May breached double digits (10.16%oya), driven by an upsurge in core inflation (3%m/m sa) even as food inflation moderated.
• DII sellers; FIIs remained buyers. Foreign Institutional Investors (FIIs) bought US$2.3 bn in equities over June. Insurance companies sold US$0.9 bn and mutual funds sold US$123 mn of Indian equities.
• Other key developments over the month:
IIP for April grew at 17.6% oya. INR ended the month flat against US$ over the month
Sector and stock returns (%, INR) Ranked sector returns Top and bottom five MSCI India
One month Twelve months One month Twelve months Telecom 36.8 Consumer Disc. 67 Reliance Communications 37 Tata Motors 167 Consumer Disc. 9.7 IT 62 Reliance Ntrl.Resources 26 Bajaj Auto 150 Consumer staples 9.4 Healthcare 57 Reliance Capital 17 Hcl Technologies 97 Industrials 5.7 Material 35 Maruti Suzuki India 15 Sesa Goa 93 Energy 5.5 Consumer staples 31 Infr.Dev.Finance Co. 14 Tata Consultancy Svs. 93 Healthcare 4.2 Financials 19 Utilities 4.0 Industrials 17 Sesa Goa (8) Suzlon Energy (44) IT 3.0 Energy 12 Piramal Healthcare (7) Reliance Communications (32) Financials 2.9 Utilities 10 Steel Authority Of India (6) Reliance Ntrl.Resources (21) Material (2.3) Telecom (25) HCL Technologies (5) Indiabulls Real Estate (19) MSCI India 4.1 26 Jindal Steel & Power (4) Gmr Infrastructure (16)
Source: Bloomberg, MSCI
Asia Pacific Equity Research 01 July 2010
Malaysia Monthly Wrap
June 2010: KLCI outperforms the region slightly
Malaysia Malaysia Equity Strategy
Chris Oh, CFAAC
(60-3) 2270-4728 [email protected]
JPMorgan Securities (Malaysia) Sdn. Bhd. (18146-X)
KLCI chart
10001100120013001400
Jun 09 Oct 09 Feb 10 Jun 10
Source: Bloomberg
MSCI M’sia relative to MSCI Asia Pacificex-Japan and MSCI Emerging Markets Indexed
90
95
100
105
110
Jun 09 Sep 09 Dec 09 M ar 10 Jun 10
rel to APxJ
Source: Bloomberg
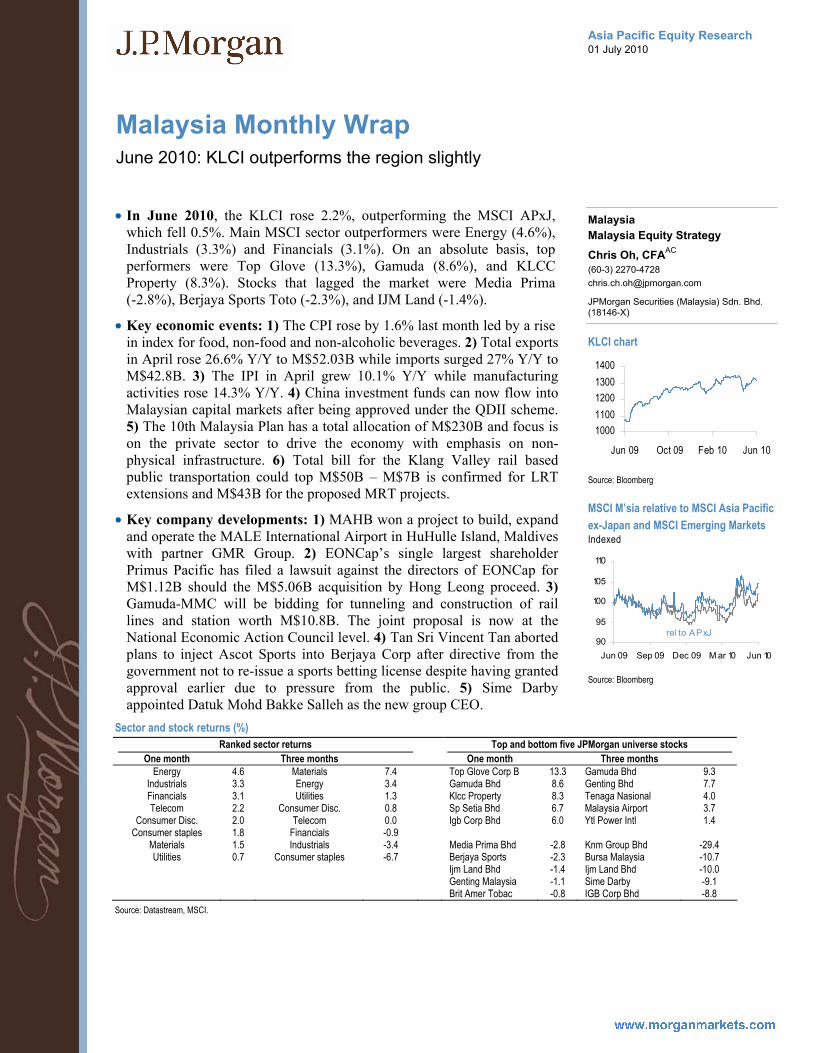
• In June 2010, the KLCI rose 2.2%, outperforming the MSCI APxJ, which fell 0.5%. Main MSCI sector outperformers were Energy (4.6%), Industrials (3.3%) and Financials (3.1%). On an absolute basis, top performers were Top Glove (13.3%), Gamuda (8.6%), and KLCC Property (8.3%). Stocks that lagged the market were Media Prima (-2.8%), Berjaya Sports Toto (-2.3%), and IJM Land (-1.4%).
• Key economic events: 1) The CPI rose by 1.6% last month led by a rise in index for food, non-food and non-alcoholic beverages. 2) Total exports in April rose 26.6% Y/Y to M$52.03B while imports surged 27% Y/Y to M$42.8B. 3) The IPI in April grew 10.1% Y/Y while manufacturing activities rose 14.3% Y/Y. 4) China investment funds can now flow into Malaysian capital markets after being approved under the QDII scheme. 5) The 10th Malaysia Plan has a total allocation of M$230B and focus is on the private sector to drive the economy with emphasis on non-physical infrastructure. 6) Total bill for the Klang Valley rail based public transportation could top M$50B – M$7B is confirmed for LRT extensions and M$43B for the proposed MRT projects.
• Key company developments: 1) MAHB won a project to build, expand and operate the MALE International Airport in HuHulle Island, Maldives with partner GMR Group. 2) EONCap’s single largest shareholder Primus Pacific has filed a lawsuit against the directors of EONCap for M$1.12B should the M$5.06B acquisition by Hong Leong proceed. 3) Gamuda-MMC will be bidding for tunneling and construction of rail lines and station worth M$10.8B. The joint proposal is now at the National Economic Action Council level. 4) Tan Sri Vincent Tan aborted plans to inject Ascot Sports into Berjaya Corp after directive from the government not to re-issue a sports betting license despite having granted approval earlier due to pressure from the public. 5) Sime Darby appointed Datuk Mohd Bakke Salleh as the new group CEO.
Sector and stock returns (%) Ranked sector returns Top and bottom five JPMorgan universe stocks
One month Three months One month Three months Energy 4.6 Materials 7.4 Top Glove Corp B 13.3 Gamuda Bhd 9.3
Industrials 3.3 Energy 3.4 Gamuda Bhd 8.6 Genting Bhd 7.7 Financials 3.1 Utilities 1.3 Klcc Property 8.3 Tenaga Nasional 4.0 Telecom 2.2 Consumer Disc. 0.8 Sp Setia Bhd 6.7 Malaysia Airport 3.7
Consumer Disc. 2.0 Telecom 0.0 Igb Corp Bhd 6.0 Ytl Power Intl 1.4 Consumer staples 1.8 Financials -0.9
Materials 1.5 Industrials -3.4 Media Prima Bhd -2.8 Knm Group Bhd -29.4 Utilities 0.7 Consumer staples -6.7 Berjaya Sports -2.3 Bursa Malaysia -10.7
Ijm Land Bhd -1.4 Ijm Land Bhd -10.0 Genting Malaysia -1.1 Sime Darby -9.1 Brit Amer Tobac -0.8 IGB Corp Bhd -8.8
Source: Datastream, MSCI.

Asia Pacific Equity Research 01 July 2010
Taiwan Monthly Wrap
June 2010: ECFA signed
Taiwan Macro Strategy
Nick LaiAC
(886-2) 2725-9864 [email protected]
Caren Huang (886-2) 2725-9872 [email protected]
J.P. Morgan Securities (Taiwan) Limited.
TWSE performance (indexed)
90
100
110
120
130
Jul 09 Nov 09 M ar 10 Jul 10
Source: Bloomberg.
MSCI Taiwan relative to MSCI Asia Pacific ex-Japan and MSCI Emerging Markets
90
95
100
105
110
Jul 09 Oct 09 Jan 10 Apr 10 Jul 10
rel to APxJ
rel to EM
Source: Bloomberg.
• Key market focus: The signing of the Economic Cooperation Framework Agreement (ECFA) between mainland China and Taiwan on June 30 marked a historical milestone with regard to closer cross-strait economic integration as well as intensified trade flow in the broader Asia region. While the full impact of ECFA on the medium-term cross-strait trade and investment flow, and on Taiwan economy will take time to roll out, recent data flow has started to show some of the early fruits of closer cross-strait economic activity.
• Equity review: MSCI TW underperformed MSCI APxJ (in US$ terms), while MSCI TW was down 2.0% in June, outperforming MSCI APxJ (0.5%) over the same period. Tourism sector (up 9.7%) was the best performer of the month (June 1-June 30), while the worst performing sector was tech (down 2.7%).
• Fund flow: Foreign investors net sold US$386 million in June 2010 with outflows concentrated in tech. Meanwhile, foreigners continued to buy telecom and financials. ITC net sold US$164 million in the month with net outflows concentrated in tech.
• Economic review: (1) Taiwan’s seasonally-adjusted unemployment rate edged down to 5.22% in May. (2) Taiwan’s May export orders point to a moderating growth trend in external trade and industrial activity going into 2H10. (3) Taiwan’s May CPI inflation rate eased more than expected, with core inflation staying tame.
• Key company news: (1) The Investment Commission of the MoEA approved TSMC’s acquisition of about an 8% stake in SMIC. (2) Asustek plans to outsource some of its motherboards and graphics cards production to Elitegroup.
Sector and stock returns, % Ranked sector returns Top and bottom five J.P. Morgan universe stocks
One month Three months One month Three months Industrials 7.9 Telecom 4.8 Yang Ming Marine 30.7 Yang Ming Marine 40.7 Consumer staples 7.6 Consumer staples 1.7 Chang Hwa Bank 19.4 China Airlines 35.8 Financials 5.6 Industrials 0.1 Wan Hai Lines 14.8 Eva Airways Corp 26.2 Telecom 4.8 Consumer Disc. -3.9 China Airlines 11.5 President Chain 17.0 Energy 2.9 Financials -7.4 E-Ton Solar 10.5 Htc Corp 13.8 Consumer disc. 2.9 Energy -8.6 Materials 2.3 Materials -10.8 E Ink Holdings -17.3 Chimei Innolux C -33.1 IT -3.3 IT -11.6 Mediatek Inc -14.4 E Ink Holdings -32.7 Catcher Tech -12.4 Silitech -31.4 Silitech -12.1 Inotera Memories -30.4 Wistron Corp -10.8 E-Ton Solar -30.3
Source: Bloomberg. Figures are as of July 1, 2010.
Asia Pacific Equity Research 01 July 2010
Indonesia Monthly Wrap
June 2010: Consumption plays in focus
Indonesia Indonesia Macro Strategy
Aditya Srinath, CFAAC
(62-21) 5291-8573 [email protected]
PT J.P. Morgan Securities Indonesia
The Jakarta Composite Index (rebased)
80
100
120
140
160
Jun 09 Sep 09 Dec 09 M ar 10 Jun 10
Source: Bloomberg
MSCI Country relative to MSCI Asia Pacific ex Japan and MSCI Emerging Markets
90
100
110
120
Jun 09 Sep 09 Dec 09 M ar 10 Jun 10
rel to APxJ
rel to EM
Source: Bloomberg
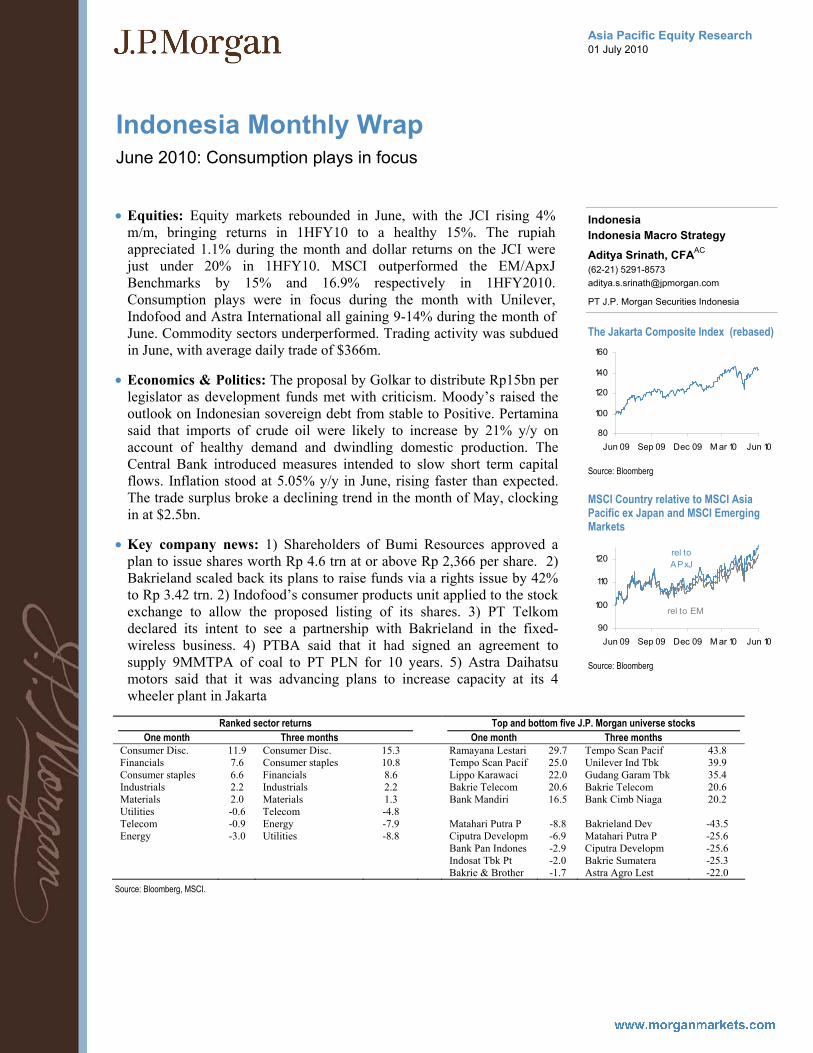
• Equities: Equity markets rebounded in June, with the JCI rising 4% m/m, bringing returns in 1HFY10 to a healthy 15%. The rupiah appreciated 1.1% during the month and dollar returns on the JCI were just under 20% in 1HFY10. MSCI outperformed the EM/ApxJ Benchmarks by 15% and 16.9% respectively in 1HFY2010. Consumption plays were in focus during the month with Unilever, Indofood and Astra International all gaining 9-14% during the month of June. Commodity sectors underperformed. Trading activity was subdued in June, with average daily trade of $366m.
• Economics & Politics: The proposal by Golkar to distribute Rp15bn per legislator as development funds met with criticism. Moody’s raised the outlook on Indonesian sovereign debt from stable to Positive. Pertamina said that imports of crude oil were likely to increase by 21% y/y on account of healthy demand and dwindling domestic production. The Central Bank introduced measures intended to slow short term capital flows. Inflation stood at 5.05% y/y in June, rising faster than expected. The trade surplus broke a declining trend in the month of May, clocking in at $2.5bn.
• Key company news: 1) Shareholders of Bumi Resources approved a plan to issue shares worth Rp 4.6 trn at or above Rp 2,366 per share. 2) Bakrieland scaled back its plans to raise funds via a rights issue by 42% to Rp 3.42 trn. 2) Indofood’s consumer products unit applied to the stock exchange to allow the proposed listing of its shares. 3) PT Telkom declared its intent to see a partnership with Bakrieland in the fixed-wireless business. 4) PTBA said that it had signed an agreement to supply 9MMTPA of coal to PT PLN for 10 years. 5) Astra Daihatsu motors said that it was advancing plans to increase capacity at its 4 wheeler plant in Jakarta
Ranked sector returns Top and bottom five J.P. Morgan universe stocks One month Three months One month Three months
Consumer Disc. 11.9 Consumer Disc. 15.3 Ramayana Lestari 29.7 Tempo Scan Pacif 43.8 Financials 7.6 Consumer staples 10.8 Tempo Scan Pacif 25.0 Unilever Ind Tbk 39.9 Consumer staples 6.6 Financials 8.6 Lippo Karawaci 22.0 Gudang Garam Tbk 35.4 Industrials 2.2 Industrials 2.2 Bakrie Telecom 20.6 Bakrie Telecom 20.6 Materials 2.0 Materials 1.3 Bank Mandiri 16.5 Bank Cimb Niaga 20.2 Utilities -0.6 Telecom -4.8 Telecom -0.9 Energy -7.9 Matahari Putra P -8.8 Bakrieland Dev -43.5 Energy -3.0 Utilities -8.8 Ciputra Developm -6.9 Matahari Putra P -25.6 Bank Pan Indones -2.9 Ciputra Developm -25.6 Indosat Tbk Pt -2.0 Bakrie Sumatera -25.3 Bakrie & Brother -1.7 Astra Agro Lest -22.0
Source: Bloomberg, MSCI.

Asia Pacific Equity Research 01 July 2010
Bumi Resources
Overweight BUMI.JK, BUMI IJ
Olympus deal could have a short-term negative impact on BUMI share price
Price: Rp1,860
Price Target: Rp3,400
Indonesia Mining
Stevanus JuandaAC
(62-21) 5291 8574 [email protected]
PT J.P. Morgan Securities Indonesia
1,500
2,500
3,500
Rp
Jul-09 Oct-09 Jan-10 Apr-10 Jul-10
Price Performance
BUMI.JK share price (Rp)JCI (rebased)
YTD 1m 3m 12mAbs -23.3% -2.6% -19.1% -1.1%Rel -36.7% -8.1% -20.7% -40.6%
Bumi Resources (Reuters: BUMI.JK, Bloomberg: BUMI IJ)$ in bn, year-end Dec FY08A FY09A FY10E FY11E FY12E FY13ERevenue ($ mn) 3,378 3,219 4,666 6,045 6,989 8,137Net Profit ($ mn) 372 190 377 621 628 720EPS ($) 0.02 0.01 0.02 0.03 0.03 0.03DPS ($) 0.01 0.01 0.00 0.01 0.01 0.01Revenue growth (%) 49.1% -4.7% 45.0% 29.5% 15.6% 16.4%EPS growth (%) -52.8% -48.8% 88.7% 57.1% 1.2% 14.6%ROCE 55.2% 18.5% 29.0% 36.0% 32.2% 32.2%ROE 32.5% 14.4% 18.9% 22.4% 19.3% 19.3%P/E (x) 10.7 20.9 11.1 7.0 7.0 6.1P/BV (x) 3.4 2.7 1.7 1.4 1.3 1.1EV/EBITDA (x) 4.0 9.2 3.7 2.8 2.8 2.5Dividend Yield 2.7% 2.8% 1.4% 2.6% 4.3% 4.3%
Shares O/S (mn) 19,404Market cap ($ bn) 4Market cap ($ mn) 3,977Price (Rp) 1,860Date Of Price 01 Jul 10Free float (%) 78.5%3mth Avg daily volume 3M - Average daily Value (Rp mn) Average 3m Daily Turnover (mn) JCI 2,874Exchange Rate 9,074.00Fiscal Year End Dec
Source: Company data, Bloomberg, J.P. Morgan estimates.
• Tata Power sold 4.35% take in KPC and Arutmin: Tata Power announced that it has struck a deal with Olympus Capital to sell 14.5% of its SPV (Bhivpuri Investments Ltd) which owns 30% of KPC and Arutmin for US$300MM. The deal will be conducted via new issuance of class B shares in the SPV which will not be eligible for dividend for five years. At the end of five years, the class B shares are convertible to class A shares one to one.
• The implied purchase price of US$10B is lower than our fair value estimate of US$15B: The implied purchase price, in our calculation, indicates a fair value of US$10B for a 100% stake in KPC and Arutmin; which is lower than our FV estimate of US$15B. (Note: The difference between our valuation and that of our India team is mainly on the 25% conglomerate discount applied). Our US$15B value of KPC and Arutmin translates into our BUMI PT of Rp3,400. We believe at Rp3,400 per share, BUMI’s valuation is relatively comparable to its Indonesia peers on P/E, EV/EBITDA and EV/producing reserve.
• “Check and balance” factor could weaken: We view this deal could weaken the “check and balance” factor at KPC and Arutmin in the form of: (1) potential risk of further sell-down by Tata Power; (2) transparency: Tata Power is publicly traded, while Olympus is a private company; and (3) Tata Power has operating interest (coal offtake agreement) in KPC and Arutmin.
• Short-term negative; we maintain OW and Dec-10 PT of Rp3,400: Considering qualitative and quantitative factors, we view that BUMI’s share price could weaken in the short-term. However, we maintain OW and Dec-10 PT of Rp3,400, mainly due to valuation and the potential spin-off of BUMI Resource Mineral (Bisnis Indonesia). Risks to our PT are volatility and unfavorable corporate actions.
Asia Pacific Equity Research 01 July 2010
Cathay Financial Holdings
Neutral 2882.TW, 2882 TT
Post Card from New York - ALERT
Price: NT$48.05
30 June 2010
Insurance - Life
Dexter HsuAC
(886-2) 2725-9868 [email protected]
J.P. Morgan Securities (Taiwan) Limited.
Penny Lin (886-2) 2725-9870 [email protected]
J.P. Morgan Securities (Taiwan) Limited.
Sunil Garg (852) 2800-8518 [email protected]
J.P. Morgan Securities (Asia Pacific) Limited
Cathay’s management including Abel Lin, the Chief Actuarial, David Sun, the Executive VP, attended our NY conference. Management addressed key issues including the change in RBC rule and impact on their investment strategy, new business growth, and the potential impact from the implementation of IFRS. • Change in RBC rules gives more flexibility in investment strategy.
Cathay has NT$108B of unrealized gains on properties and they are allowed to book NT$32B in the RBC which should effectively bring up their RBC ratio by 70% (vs. 250%-300% as of the end of last year). Cathay will be able to invest up to NT$180B of cash in the equity market though management only target to allocate 2% of their investment funds (i.e. NT$40-50B) in stocks with high dividend yields.
• Increase in overseas investment should enhance earnings. Cathay will increase overseas investments to 39% (vs. current level of 34.6% or legal ceiling of 40%). The target investment return for overseas investments should be 4.5% (i.e. 5.5% bond yield minus 1% hedging cost). For the new investment, the hedging cost through CCS is very low at 1%-2% (vs. 400 bps for NDF) and they will do 100% hedging. Cathay saw 1.7% of hedging costs in 1Q10 – its current adopted hedging strategy comprises of 52% by on-shore hedging (i.e. CCS), 34% by off-shore hedging (i.e. NDF), and 14% on proxy hedging. Cathay holds less than US$100M of credit exposure to Spain through bonds issued by Spain Credit Bureau and Spain Telecom. Also, Cathay will have NT$5B of dividend income over 2Q/3Q this year, according to mgmnt.
• Solid new business growth. Cathay continued to see strong growth in the FYP (74%Y/Y) with market share of 30%. Though single premium policies accounted for 85% of total FYP (note- the profit margin is lower for single premium product), Cathay targeted 10% of annual growth in APE (Annual Premium Equivalent) (vs. 17% in 1Q10) or 17% growth in VNB (value of new business).
• Improvement in the breakeven point = less impact from IFRS. Management indicated that with liability cost of 4.5% and loading gains/mortality gains of 1%, their breakeven point should be 3.5%. With strong sales in new business, management targets to bring down the liability cost to 3% over the next three years (when the IFRS is targeted to be implemented). Management also estimates, with each rate hike of 1%, the investment return should improve by 30-35 bps.
• Limited impact from ECFA as they are in China already. Cathay Life has set up a joint-venture business with China Eastern Airline Group and it operates 33 offices in 27 cities, 8 provinces. Cathay Life (China) has 2000 tied agents and management target to increase the base to 17,000.

Asia Pacific Equity Research 02 July 2010
HTC Corp
Underweight 2498.TW, 2498 TT
Postcard from J.P. Morgan NY Conference - ALERT
Price: NT$438.00
01 July 2010
Computer Hardware
Alvin KwockAC
(852) 2800-8533 [email protected]
J.P. Morgan Securities (Asia Pacific) Limited
Christopher Ma (886-2) 2725-9875 [email protected]
J.P. Morgan Securities (Taiwan) Limited.
Charles Guo (852) 2800-8532 [email protected]
J.P. Morgan Securities (Asia Pacific) Limited
The tone of HTC management at our J.P. Morgan NY Conference was fairly upbeat. From a product company point of view, 2H should have been more challenging, given lots of new competing device launches. However, there does not seem to be signs of weakness yet. If this continues to hold in coming months, there could be a risk to our thesis that the stock could start to trade as a brand company and not as a product company, which means less volatility and potentially higher multiples. • 3Q10 early indications look strong for revenue: Without quantifying,
HTC management expects 3Q revenue to stay strong thanks to strong demand for high-end smart phones and very lean inventory as some orders in 2Q were not able to be fulfilled due to component shortages. Based on our channel checks, indeed order rates have strengthened, not weakened, recently, with 3Q tracking for modest unit growth so far. It is unclear whether there is double booking yet, given HTC has a very severe AM-OLED shortage at Samsung Mobile Display currently, which forces it to dual-source Sony’s IPS LCD display starting in July – this dual-sourcing is unprecedented. Still, HTC seems to get away from a quarterly price cut for 3Q10 due to the strong demand/supply situation.
• Margin still a looming issue due to euro: HTC stresses that margin net of currency impact is strong, big Q/Q revenue growth in 2Q may lead to strong operating leverage, and longer product life cycle helps with its return on R&D investment – we agree and think margin would have been in an upward trend on stable currency. However, euro sensitivity is very high for HTC – ~16% euro depreciation YTD will cost HTC 420bps margin based on our calculations. Unlike PCs, we have not heard of any handset vendor who is able to pass through the currency impact through de-specification or price hike due to Nokia’s presence.
• New Android products in Sep, WinPhone 7 by year-end: We predict the most interesting part of new product launch in Sep is probably going to be the debut of HTC proprietary cloud services, like back-up service potentially. We expect most of the services will be offered for free, aimed at improving customer loyalty rather than immediate revenue generation, and potentially gaining better insights into consumer behavior.
• HTC brand awareness rising in US and China: According to company data, in the one year since HTC has begun its new "You" advertising campaign in the US, awareness of the HTC brand among US consumers has risen from 10% to 40%. We also believe HTC brand is gaining popularity among China high-end consumers via gray market, and its sales volume is even 50% higher than Dopod-branded devices – part of this might have to do with availability of WiFi function in international editions though. We suspect HTC may invest its brand in China for the future by starting to offer HTC-branded phones in China, and also come out with five TD-based devices for China Mobile in 2H10.

Asia Pacific Equity Research 01 July 2010
KT&G Corp
Neutral 033780.KS, 033780 KS
Workforce restructuring not meaningful - ALERT
Price: W60,200
30 June 2010
Tobacco
Jinah LeeAC
(82-2) 758-5723 [email protected]
J.P. Morgan Securities (Far East) Ltd, Seoul Branch
• KT&G announced another round of restructuring today, reducing its workforce by 10% or 470 employees out of 4,700 employees; it had reduced the number of sales branches from 168 to 137. Earlier this year, the company reduced 50 divisional head positions after combining the 250 divisions into 200.
• The impact is quite small and we expect the company to save around W20bn in annual wage costs contributing around 2.5% increase in operating profit, raising margins by 70 bp to 36%.
• On a separate note, the company announced that it has acquired KGC Sales at W5bn. The move is intended to reinforce the door-to-door distribution net work for KT&G group as it intends to launch their ginseng based cosmetic line toward the beginning of 2011. Currently KGC Sales employs around 500 door-to-door salesmen in Korea (Amorepacific 20,000; LG H&H 12,000).

Asia Pacific Equity Research 01 July 2010
Company Visit Note
LG Telecom: CEO takes first step
South Korea Wireless Services
Sungmin ChangAC
(82-2) 758-5719 [email protected]
David Chung (82-2) 758 5710 [email protected]
J.P. Morgan Securities (Far East) Ltd, Seoul Branch
032640. KS, Not Covered KRW 7,740, July 1, 2010 YTD share price chart
6,0007,0008,0009,000
10,000
Jan-10 Mar-10 May -10
W
Source: Bloomberg.
One-year price performance
1M 3M 12M Absolute (%) 0.5 0.7 (12.0) Relative (%) 3.4 (1.9) 19.5
Source: Bloomberg.
Company data 52-week range W9,510-7,110Market cap W3,985BMarket cap US$3,243MMShares issued 514.8MMFree float 61.9%Avg daily value W14.BAvg daily value US$11.4MMAvg daily volume 1.8MM sharesKOSPI 1,686.2Exchange Rate W1,228.7/US$ Source: Bloomberg.
• Target: LGT targets minimum service sales of W10t and OP of W1t by 2014 from W6.4t and W0.6t in 2009. According to management, they will pass 9mm mobile subscribers this year and 10mm+ in a few years. All are moving targets but the company is seeking a material share gain in all segments over the next few years, according to management.
• Strategy: Its fixed-line speed is 100Mbps+ for 90%+ of the coverage and this is sector best. They will replicate the speed on mobile via LTE upgrade and Wi-Fi deployment. The company owns the most access points globally and will be the first to have all IP converged network by 2012. As such, management believes superior coverage, speed, and pricing will eventually tip the balance materially in favor of LGT.
• LTE: Management estimates W2.4t for LTE capex between 2010 and 2016. The pure mobile portion, however, is expected to be roughly W1.8t. Management added that this should translate to W1.2t in 2010E, W1.3t in 11E, and W1.4 to W1.5t in the peak year of 2012E. At present, the company buys 30% of equipment from Samsung and the rest from LG Ericsson.
• Opex and margin: The increase in opex from running dual network will be capped at 20%. The CEO stated that corporate biz generates high margins compared to the home biz on the fixed-line side, while mobile generates about 10%. According to management, home biz generates single digit margins, while corporate biz should be more than double that.
• Smartphone and competition: Current mobile market customers fall into three categories: high-end customers willing to pay up for attractive devices (35%); middle market customers (45%), and those seeking low-cost feature phones (20%). The company is planning to deliver a total of six smartphone models this year for high-end customers. The CEO believes the competition will ease in 2H and likened the heated competition in June as the last struggle before peace.
• Shareholder returns and treasury shares: Management expects DPS could increase by roughly 10% in 2010, from W350 in 2009 to W400. Management has not definitively decided how to handle its treasury shares, noting that some could be sold to strategic investors and some could be cancelled. Its 16% treasury shares are worth W639b or 29% of W2.2t net debt.
• Valuation: Based on Bloomberg 2011 consensus estimates, the stock is trading at a P/E of 6.3x and EV/EBITDA of 3.5x. Yield would be 5.2% with DPS of W400.
• NOTE: THIS DOCUMENT IS INTENDED AS INFORMATION ONLY AND NOT AS A RECOMMENDATION FOR ANY STOCK. IT CONTAINS FACTUAL INFORMATION, OBTAINED BY THE ANALYST DURING MEETINGS WITH MANAGEMENT. J.P. MORGAN DOES NOT COVER THIS COMPANY AND HAS NO RATING ON THE STOCK.
LG Telecom (Bloomberg: 032640 KS, Reuters: 032640.KS) Won in bn, year-end December
FY07 FY08 FY09 Sales 4,586 4,798 6,117 EBITDA 329 368 1,531 % Y/Y -16.4% 14.9% 7.3% Net profit 275 284 308 EPS (Won) 993 1,023 1,112 % Y/Y 15.7% 3.0% 8.9% DPS (Won) 300 200 350 P/E (x) 9.9 9.7 7.6 ROE (%) 16.9% 15.2% 15.4% Source: Company data. Note: Price as of July 1, 2010.

Asia Pacific Equity Research 01 July 2010
Mahindra & Mahindra
Overweight MAHM.BO, MM IN
Jun' 10 - Sales growth (+7% yoy) moderates on base effect and production constraints - ALERT
Price: Rs615.15
01 July 2010
Automobile Manufacture
Aditya MakhariaAC
(91-22) 6157-3596 [email protected]
Bharat Iyer (91-22) 6157-3600 [email protected]
J.P. Morgan India Private Limited
• M&M’s unit sales grew +7% yoy over the month, with unit sales being driven by the three-wheeler and light truck portfolio. The UV and FES segment sales were impacted by production constraints.
• Automotive segment sales growth driven by compact portfolio: While M&M’s automotive sales were up +19% yoy, growth was driven by the three wheeler and light truck portfolio (+125% yoy). UV sales though were flat yoy (off a high base) given production constraints. The management highlighted that shortage fuel injection equipment as well as a plant shutdown (for maintenance) led to the lower sales.
• Tractor sales decline -9% yoy on component shortage: The management highlighted that tractor sales were impacted by shortage of castings and tyres at the vendor’s end. The company though continues to guide for FY11E tractor segment growth of 10-14%, given healthy demand.
• The M&M Renault Logan recorded domestic unit sales of 563 units over June (a growth of +12% yoy).
• M&M commences production of its heavy truck portfolio: Mahindra Navistar Automotives Ltd. commenced production of its 25 ton truck – MN25, from its new manufacturing plant at Chakan. The vehicle is priced at c.Rs.1.5m (ex-showroom Pune). The company will roll out its HCV product portfolio over the course of the year from this facility.
• M&M has commenced due diligence for the bankrupt Korean SUV maker – Ssangyong. The company is amongst one of the six companies that have been short listed for the same. The date for submitting bids has been set as July 20 by the bankruptcy court in Korea.
• Over the month, the stock price (+9% yoy) outperformed the broader BSE Sensex (+6% yoy). We re-iterate our OW stance on M&M – given that the company will benefit from a) expansion into newer product segments b) sustained growth in its traditional segments. Besides, the companies’ subsidiaries (c.30% of stock price) should benefit from a healthy economy, given their presence in high growth segments of the market.
Table 2: M&M monthly unit sales nos Jun-10 Jun-09 %YoY May-10 %MoM FY11YTD FY10YTD % YTD
UV's 18,211 18,126 0 20,008 -9 57,073 49,865 14 LCV 1,111 1,014 10 1,007 10 2,978 2,493 19 Three Wheelers 7,559 3,357 125 6,641 14 20,076 9,032 122 Total Automotive 26,881 22,497 19 27,656 -3 80,127 61,390 31 Tractors 16,590 18,243 -9 17,256 -4 50,150 43,383 16 Total Sales 43,471 40,740 7 44,912 -3 130,277 104,773 24 Export - UV's 1,201 473 154 1,068 12 3,125 1,145 173 Export - Tractors 1,179 432 173 648 82 2,432 1,420 71 Total Exports (of above) 2,380 905 163 1,716 39 5,557 2,565 117
Source: Company

Asia Pacific Equity Research 01 July 2010
Maruti Suzuki India Ltd
Neutral MRTI.BO, MSIL IN
Jun'10 - Sales grow +17% y/y but decline -14% m/m due to maintenance shutdown at plant - ALERT
Price: Rs1,423.75
30 June 2010
Automobile Manufacture
Aditya MakhariaAC
(91-22) 6157-3596 [email protected]
Bharat Iyer (91-22) 6157-3600 [email protected]
J.P. Morgan India Private Limited
Figure 1: Maruti Monthly sales (in Unit nos)
70,000
80,000
90,000
100,000
110,000
APR MAY JUN JUL AUG SEP OCT NOV DEC JAN FEB MARFY10 FY11
Source: Company
• Jun’10 sales at 88,091 units were up +17% y/y but were lower (-14% qoq). The management attributes the lower sales m/m to the maintenance shutdown of the facilities.
• Domestic segment sales at 72,812 units (+18% yoy but lower -19% m/m) were driven by the Eeco (+44% y/y) and Dzire (+32% y/y). However, sales growth in the mass market A2 segment moderated (+11% y/y). The companies’ retail dispatches were at 82,000 units (vs. wholesale dispatches of 73,000 units).
• Export sales sustain: Maruti’s export sales at 15,279 units (+15% yoy) are sustaining at current levels despite weakening demand in Europe. Management, though, is guiding for flat export sales growth in FY11 given weakening sales in Western Europe (post the expiry of the scrap page schemes).
• Auto fuel prices are de-regulated over the month: The government has decided to move auto fuels to market determined rates – at current crude levels, this results in a Rs3.5/lt (~7%) hike in petrol prices. Diesel is to move to market rates in a staggered fashion, with an initial Rs2/lt (5%) hike. The current prices are benchmarked to crude levels of c.$75/bbl (vs. J.P. Morgan Oil price deck of $80/bbl for 2010E). From here onwards, fuel prices would be benchmarked to crude price movements.
• Over the month, the stock (+11% yoy) outperformed the broad BSE Sensex (+6% yoy), given easing commodity prices. Going forward, we believe that as fuel prices have been hiked (for the third time in the calendar year), monthly running costs for automobiles have risen by c7-8% since the budget (in February). We expect auto sector growth rates to moderate into FY11E given: a) a high base effect, and b) rising operating costs, which would likely impact consumer sentiment.
Table 3: Maruti Monthly Unit Sales Jun-10 Jun-09 %YoY May-10 %MoM FY11YTD FY10YTD % YTD A1 2,090 2,438 -14 2,558 -18 6,906 7,119 -3 C 9,914 6,890 44 12,953 -23 33,521 22,233 51 A2 51,418 46,156 11 62,679 -18 170,513 146,733 16 A3 8,081 6,099 32 10,883 -26 28,958 19,947 45 MUV 1,309 190 589 968 35 2,989 1,383 116 Domestic 72,812 61,773 18 90,041 -19 242,887 197,415 23 Export 15,279 13,336 15 12,134 26 40,437 29,314 38 Total Sales 88,091 75,109 17 102,175 -14 283,324 226,729 25
Source: Company

Asia Pacific Equity Research 01 July 2010
SK Holdings
Overweight 003600.KS, 003600 KS
One step further to holding company transformation
Price: W85,800
Price Target: W110,000
South Korea Conglomerates & Multi-industry
Youna KimAC
(82-2) 758-5715 [email protected]
Scott YH Seo (82-2) 758 5759 [email protected]
J.P. Morgan Securities (Far East) Ltd, Seoul Branch
70,000
100,000
130,000
W
Jul-09 Oct-09 Jan-10 Apr-10 Jul-10
Price Performance
003600.KS share price (WKOSPI (rebased)
YTD 1m 3m 12mAbs -3.4% 0.8% -13.8% -20.2%Rel -2.8% -2.6% -11.9% -39.7%
• One step further to holding company transformation - After the market close on June 30th, 2010, SK Holdings disclosed that it will acquire 17.7% (10.9 million shares) of SK Shipping from SK Networks. The purchase price is W4,170 per share and W45.4 billion in total. This is to fulfill the requirement for holding company transformation, given that one subsidiary is not allowed to own stakes in other subsidiaries. After this share purchase, SK Holdings' stake in SK Shipping will rise to 89.8% from 72.1%, while SKC will still hold 10.2%.
• Revision of FTC–Holding Company Act likely to get delayed further - According to Korea Economic Daily, Fair Trade Committee–Holding Company Act revision is likely to be delayed further to September or in worst case to December 2010 National Assembly regular session due to many other urgent and controversial agenda items and a continuing lack of agreement between ruling and opposition parties within the Legislation & Judiciary Committee. Its impact on the share price of SK Holdings should be neutral in our view, considering the time until the deadline for the holding company transformation. However, if this is delayed to 2011, SK Holdings would have to come up with a plan to sell SK Securities stakes by early July 2011.
• We maintain our OW rating with PT of W110,000 – Our target price is based on the median price-to-NAV (0.5x) since May 2009, when SK C&C announced their plan for IPO and the discount to NAV started to widen. We still believe that the 60% discount to NAV solely due to group structural issues and M&A possibilities is not justified. Risks to our PT: if SK Group's decides to merge official and de-facto holding companies in the imminent future; delay of holding company-related law revision to 2011; and weaker than expected equity income.
Bloomberg: 003600 KS; Reuters: 003600.KS Won in billions, year-end December
FY09 FY10E FY11E FY12E Operating Profit 372 931 958 920 52-week range W116,000-76,500 OP growth (%) (14.0) 150.6 2.8 (4.0) Market cap W4,029B Net profit 284 728 780 777 Market cap US$3,279MM NP growth (%) (6.4) 156.0 7.2 (0.4) Shares issued 47.MM EPS (W) 7,023 17,976 19,272 19,201 Free float 49.5% P/E (x) 12.2 4.8 4.5 4.5 Fiscal Year End Dec BVPS (W) 176,285 192,286 209,582 226,808 Price (W) 85,800 P/B (x) 0.5 0.4 0.4 0.4 Date of Price 01-Jul-10 DPS (W) 1,950 1,950 1,950 1,950 Avg daily value W22.6B Dividend yield (%) 2.3 2.3 2.3 2.3 Avg daily value US$18.4MM NAV per share (W) 200,188 224,993 224,689 224,293 Avg daily volume 0.3MM shares P/NAV (x) 0.4 0.4 0.4 0.4 KOSPI 1,686 ROE (%) 4.1 9.8 9.6 8.8 Exchange Rate W1,228.7/US$ Source: Company reports, Bloomberg, J.P. Morgan estimates
Asia Pacific Equity Research 01 July 2010
Tanjong Plc
Overweight TJPL.KL, TJN MK
1QFY11 results in line; dividends raised
Price: M$17.44
Price Target: M$20.00
Malaysia Independent Power Producers
Simone YeohAC
(60-3) 2270-4710 [email protected]
JPMorgan Securities (Malaysia) Sdn. Bhd. (18146-X)
13
16
19
M$
Jun-09 Sep-09 Dec-09 Mar-10 Jun-10
Price Performance
TJPL.KL share price (M$)FBMKLCI (rebased)
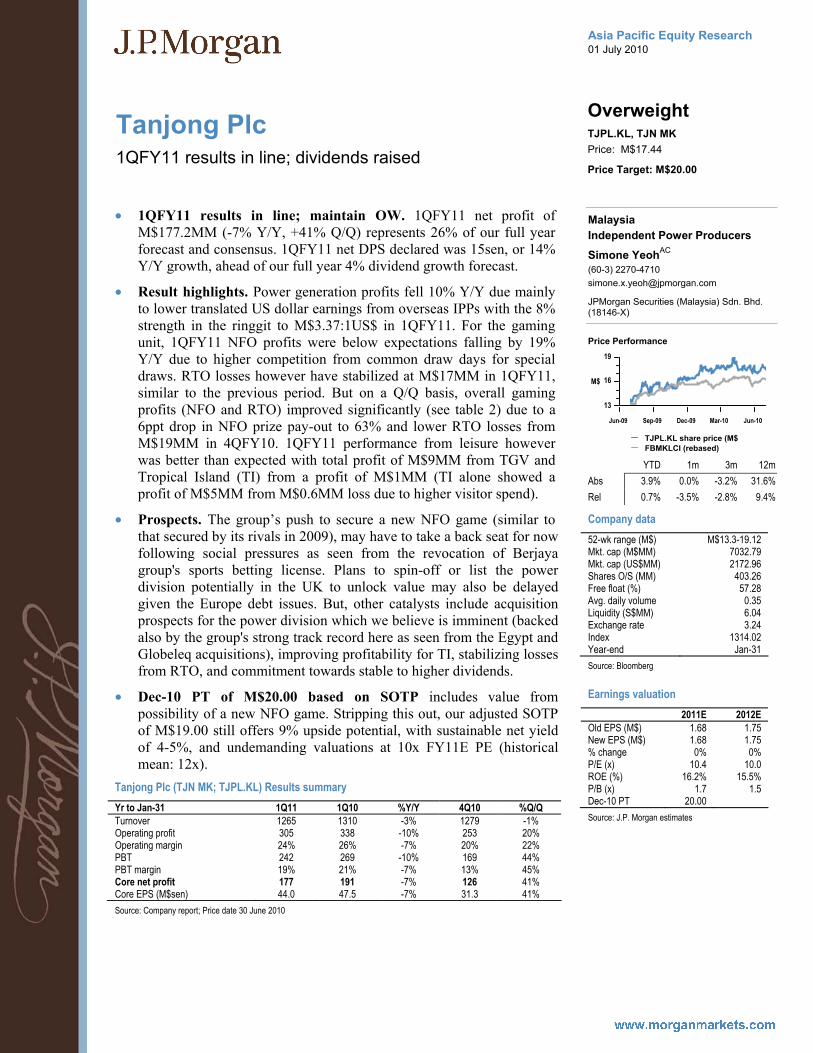
YTD 1m 3m 12mAbs 3.9% 0.0% -3.2% 31.6%Rel 0.7% -3.5% -2.8% 9.4%
Company data52-wk range (M$) M$13.3-19.12 Mkt. cap (M$MM) 7032.79 Mkt. cap (US$MM) 2172.96 Shares O/S (MM) 403.26 Free float (%) 57.28 Avg. daily volume 0.35 Liquidity (S$MM) 6.04 Exchange rate 3.24 Index 1314.02 Year-end Jan-31 Source: Bloomberg
Earnings valuation 2011E 2012E Old EPS (M$) 1.68 1.75 New EPS (M$) 1.68 1.75 % change 0% 0% P/E (x) 10.4 10.0 ROE (%) 16.2% 15.5% P/B (x) 1.7 1.5 Dec-10 PT 20.00 Source: J.P. Morgan estimates
• 1QFY11 results in line; maintain OW. 1QFY11 net profit of M$177.2MM (-7% Y/Y, +41% Q/Q) represents 26% of our full year forecast and consensus. 1QFY11 net DPS declared was 15sen, or 14% Y/Y growth, ahead of our full year 4% dividend growth forecast.
• Result highlights. Power generation profits fell 10% Y/Y due mainly to lower translated US dollar earnings from overseas IPPs with the 8% strength in the ringgit to M$3.37:1US$ in 1QFY11. For the gaming unit, 1QFY11 NFO profits were below expectations falling by 19% Y/Y due to higher competition from common draw days for special draws. RTO losses however have stabilized at M$17MM in 1QFY11, similar to the previous period. But on a Q/Q basis, overall gaming profits (NFO and RTO) improved significantly (see table 2) due to a 6ppt drop in NFO prize pay-out to 63% and lower RTO losses from M$19MM in 4QFY10. 1QFY11 performance from leisure however was better than expected with total profit of M$9MM from TGV and Tropical Island (TI) from a profit of M$1MM (TI alone showed a profit of M$5MM from M$0.6MM loss due to higher visitor spend).
• Prospects. The group’s push to secure a new NFO game (similar to that secured by its rivals in 2009), may have to take a back seat for now following social pressures as seen from the revocation of Berjaya group's sports betting license. Plans to spin-off or list the power division potentially in the UK to unlock value may also be delayed given the Europe debt issues. But, other catalysts include acquisition prospects for the power division which we believe is imminent (backed also by the group's strong track record here as seen from the Egypt and Globeleq acquisitions), improving profitability for TI, stabilizing losses from RTO, and commitment towards stable to higher dividends.
• Dec-10 PT of M$20.00 based on SOTP includes value from possibility of a new NFO game. Stripping this out, our adjusted SOTP of M$19.00 still offers 9% upside potential, with sustainable net yield of 4-5%, and undemanding valuations at 10x FY11E PE (historical mean: 12x).
Tanjong Plc (TJN MK; TJPL.KL) Results summary Yr to Jan-31 1Q11 1Q10 %Y/Y 4Q10 %Q/Q Turnover 1265 1310 -3% 1279 -1% Operating profit 305 338 -10% 253 20% Operating margin 24% 26% -7% 20% 22% PBT 242 269 -10% 169 44% PBT margin 19% 21% -7% 13% 45% Core net profit 177 191 -7% 126 41% Core EPS (M$sen) 44.0 47.5 -7% 31.3 41% Source: Company report; Price date 30 June 2010
Asia Pacific Equity Research 01 July 2010
Taishin Financial Holdings
Underweight 2887.TW, 2887 TT
Post Card from New York - ALERT
Price: NT$12.50
30 June 2010
Banks
Dexter HsuAC
(886-2) 2725-9868 [email protected]
J.P. Morgan Securities (Taiwan) Limited.
Penny Lin (886-2) 2725-9870 [email protected]
J.P. Morgan Securities (Taiwan) Limited.
Sunil Garg (852) 2800-8518 [email protected]
J.P. Morgan Securities (Asia Pacific) Limited
Taishin's CFO, Welch Lin, addressed four key issues during our NY conference including credit, cost, capital and Changhwa Bank. Mgmt believes the earnings in 2009 should be the trough due to one-off items. • Management guidance. Improvement in credit costs could offset the
absence of disposal gains. Loan growth should be 5%-6% this year – corporate loan growth of 5%-10%, unsecured personal loans of 0%-5% (The growth in revolving was due to acquisition of the revolving portfolio from Chinfon Bank), and 0% for mortgage. Mgmt expects slow growth in revolving credit due to high unemployment rate. NIM has recovered from low level after the expiration of high cost deposits and should be stable at 1.5%-1.6% with limited impact from rate hike. Taishin will maintain low loan-to-deposit ratio to prevent any risk when the government abolishes the 100% deposit guarantee. Wealth management fees could be slower due to volatile overseas equity market. Taishin has been weak on bancassurance where they will focus now. They will see NT$1.4B loss from DTA write-down due to the tax rate cut.
• Changhwa Bank issue unresolved. Mgmt indicated the acquisition of 22% stake in Changhwa was not related to the donation to the ex-president. Before the prosecutor reaches any conclusion (which could cost six months), Taishin will not take any action. However, management indicated integration with Changhwa remains prioritized and disposal of the stake will be the last thing Mgmt wants to see.
• Improvement in credit quality. After the consumer credit crisis, Taishin Bank has upgraded its credit system and implemented single-customer-view strategy. Its asset quality is now the best in Taiwan with NPL ratio of 0.46% and coverage ratio of above 288%. To comply with Article 34, management believes its reserve to total loan of 1.33% should be sufficient. Taishin Bank could see NT$250M of recoveries every month. With guidance of low credit cost (i.e. 40-50 bps), Taishin could see a net recovery of NT$70M each month. Management believes, though they have recovered 10% of the NPL write-offs, they expect another 10% recoveries (i.e. NT$10BN) based on experiences from Japan and Korea where banks saw 20% of recoveries.
• Well-capitalized. Taishin sold Taiwan Securities at a price of NT$29B– Taishin saw the amortization of its hyper tier 1 instruments (in Taiwan, hyper tier 1 capital should be amortized five years before the expiration). Taishin has injected NT$10B to its bank subsidiary and replaced NT$10B of sub-debts with lower cost funding. Taishin Financial has CAR of 130% while Taishin Bank's tier 1 is high at 9.1% and CAR ratio reached 13.8% - the highest in Taiwan.
• On the cost side, Taishin laid off 20% of its headcount over the last two years. The cost-income ratio rose to 68% in 1Q10 from 53% last year due to shrinkage in revenues rather than increase in costs.
Asia Pacific Equity Research 01 July 2010
Tata Power
Neutral TTPW.BO, TPWR IN
TPWR strikes a deal to dilute 14-15% stake in Indonesian coal mine SPVs, implied valuations in-line - ALERT
Price: Rs1,308.35
30 June 2010
Electric Utilities
Shilpa KrishnanAC
(91-22) 6157-3580 [email protected]
Sumit Kishore (91-22) 6157-3581 [email protected]
Deepika Belani (91-22) 6157-3582 [email protected]
J.P. Morgan India Private Limited
• Valuation benchmark for Indonesian coal mine investments, a positive. Tata Power announced that it has signed an agreement with Olympus Capital Holdings, a PE firm, to effectively dilute 14-15% stake in SPVs which hold 30% stake in KPC and Arutmin coal mines. The deal involves issue of shares with differential rights to Olympus in return for an investment of US$300MM. These differential rights shares will (a) not have dividend rights for 5 years from date of closing transaction, (b) be subject to ‘capital protection’ arrangement at the end of 5 years, to be serviced by Tata Power, (c) be fully convertible into ordinary shares at the end of this period.
• Proposed end use. According to the company, the US$300MM raised would be used (a) to secure further long term coal supplies by investing in coal mines. Our valuation of KPC and Arutmin coal mines implies an EV of US$1.3/MT of reserves and resources; and (b) repay outstanding debt of US$675MM in SPVs. US$70MM is maturing in Jun-10. Bulk of the remaining debt is maturing in CY14.
• Implied deal valuation in-line with our valuation of Indonesian coal mine investments. The implied post-money valuation ex-dividend rights is US$2.06B (=US$300MM*New shares issued/Post money shares). The TPWR coal mine SPV (Bhivpuri Investment) received US$196MM in cash dividends in CY09 (Source: CY09 Bumi annual report). We roughly estimate the NPV of dividends over 5 year period at US$1B. Thus the total post-money equity value for TPWR’s coal mine SPV is US$3.06B (US$2.06B+US$1.0B). We value the coal mine investments at US$3.11B in our SOP and this accounts for 42.3% of our target equity value for Tata Power. The move to set a benchmark for TPWR’s coal mine investments (acquired at US$1.225B in Jun-07) at implied valuation is a positive, in our view.
• The caveat. We do not have details of the 'capital protection' arrangement at the end of 5 years and the cash flow risk it exposes Tata Power to. We maintain N rating on Tata Power as CMP implies a 8% upside to our target equity value.
Please see analysis on implied valuation from the Olympus deal overleaf.

Asia Pacific Equity Research 02 July 2010
Korea Construction
Potential order cancellation in Iran - ALERT
Construction
Jinmook KimAC
(82-2) 758-5729 [email protected]
J.P. Morgan Securities (Far East) Ltd, Seoul Branch
• What’s new?: After the market close, GS E&C disclosed that it cancelled a US$1.2B (W1.42T) gas project in Iran, following sanctions on Iran by the United Nations (including the US). The project is the contract to sweeten gas from the South Pars field in Iran (phase #6~8) by the Pars Oil and Gas Company (POGC) since last October.
• Orderbook impact limited: Downside risk looks limited to us on GS E&C orderbook as the cancelled project has been excluded due to political risk. However, if this cancellation risk spreads into other South Pars (in Iran) projects, we expect further downside risk to Daelim Industrial’s backlog. The company received W763B worth of South Pars #12 projects in 3Q09, which will be 22% of its overseas backlog (W3.5T) and 4% of its total backlog (W17.5T) as of 1Q10.
• Country-specific issue: We see contagion of cancellation in the Middle East as unlikely to happen as this is a country-specific issue. However, enhanced level of sanctions on Iranian projects may provide an opportunity for new players like Chinese engineering companies. According to our latest visits to China construction companies, they were very eager to expand overseas, given their declining CAPEX on petrochemical.
• Saudi to award Yanbu soon: According to Reuters (June 30), Saudi Arabia is likely to award Yanbu refiner (US$12B) although it did not secure new partners yet. Of note, it announced pre-qualified bidders for five packages already and three Korean bidders were included: SK E&C (not listed) for crude unit, GS E&C for hydro cracker, and Daelim Industrial for gasoline unit. However, Reuters indicated that Daelim was one of the most aggressive bidders for several packages, and may also win the hydro cracker contract, replacing GS E&C.
• Recommendation: Fundamental downside from this cancellation looks to be limited for Korea E&C. However, we expect share prices of GS E&C and Daelim Industrial may experience near-term weakness given their exposure to such political risk. We maintain our positive view on overseas construction of Korea E&C and Samsung Engineering remains our top pick.
25
Asia Pacific Equity Research 02 July 2010
Sunil Garg (852) 2800-8518 [email protected]
Analyst Certification: The research analyst who is primarily responsible for this research and whose name is listed first on the front cover certifies (or in a case where multiple research analysts are primarily responsible for this research, the research analyst named first in each group on the front cover or named within the document individually certifies, with respect to each security or issuer that the research analyst covered in this research) that: (1) all of the views expressed in this research accurately reflect his or her personal views about any and all of the subject securities or issuers; and (2) no part of any of the research analyst’s compensation was, is, or will be directly or indirectly related to the specific recommendations or views expressed by the research analyst in this research.
Important Disclosures
• Lead or Co-manager: JPMSI or its affiliates acted as lead or co-manager in a public offering of equity and/or debt securities for Bank of China (BOCHK), Hitachi (6501), Honda Motor (7267), Tata Power within the past 12 months.
• Analyst Position: The following analysts (and/or their associates or household members) own a long position in the shares of Bank of China (BOCHK): Adrian Mowat. The following analysts (and/or their associates or household members) own a long position in the shares of Mahindra & Mahindra: Bijay Kumar. The following analysts (and/or their associates or household members) own a long position in the shares of Tata Power: Bijay Kumar.
• Beneficial Ownership (1% or more): JPMSI or its affiliates beneficially own 1% or more of a class of common equity securities of Bank of China (BOCHK), Tokyo Electron (8035).
• Client of the Firm: Bank of China (BOCHK) is or was in the past 12 months a client of JPMSI; during the past 12 months, JPMSI provided to the company investment banking services, non-investment banking securities-related services and non-securities-related services. Bumi Resources is or was in the past 12 months a client of JPMSI; during the past 12 months, JPMSI provided to the company non-securities-related services. Cathay Financial Holdings is or was in the past 12 months a client of JPMSI; during the past 12 months, JPMSI provided to the company investment banking services, non-investment banking securities-related services and non-securities-related services. Citizen Holdings (7762) is or was in the past 12 months a client of JPMSI. FUJIFILM Holdings (4901) is or was in the past 12 months a client of JPMSI; during the past 12 months, JPMSI provided to the company non-investment banking securities-related services and non-securities-related services. Hitachi (6501) is or was in the past 12 months a client of JPMSI; during the past 12 months, JPMSI provided to the company investment banking services, non-investment banking securities-related services and non-securities-related services. Honda Motor (7267) is or was in the past 12 months a client of JPMSI; during the past 12 months, JPMSI provided to the company investment banking services, non-investment banking securities-related services and non-securities-related services. HTC Corp is or was in the past 12 months a client of JPMSI. Mahindra & Mahindra is or was in the past 12 months a client of JPMSI. Maruti Suzuki India Ltd is or was in the past 12 months a client of JPMSI. Nintendo (7974) is or was in the past 12 months a client of JPMSI; during the past 12 months, JPMSI provided to the company non-investment banking securities-related services and non-securities-related services. Samsung Engineering is or was in the past 12 months a client of JPMSI. SK Holdings is or was in the past 12 months a client of JPMSI; during the past 12 months, JPMSI provided to the company non-investment banking securities-related services and non-securities-related services. Taishin Financial Holdings is or was in the past 12 months a client of JPMSI; during the past 12 months, JPMSI provided to the company non-investment banking securities-related services and non-securities-related services. Tanjong Plc is or was in the past 12 months a client of JPMSI. Tata Power is or was in the past 12 months a client of JPMSI; during the past 12 months, JPMSI provided to the company investment banking services and non-investment banking securities-related services. Tenaga is or was in the past 12 months a client of JPMSI; during the past 12 months, JPMSI provided to the company non-investment banking securities-related services. Tokyo Electron (8035) is or was in the past 12 months a client of JPMSI; during the past 12 months, JPMSI provided to the company non-investment banking securities-related services. Wing Hang Bank is or was in the past 12 months a client of JPMSI; during the past 12 months, JPMSI provided to the company non-investment banking securities-related services and non-securities-related services.
• Investment Banking (past 12 months): JPMSI or its affiliates received in the past 12 months compensation for investment banking services from Bank of China (BOCHK), Cathay Financial Holdings, Hitachi (6501), Honda Motor (7267), Tata Power.
• Investment Banking (next 3 months): JPMSI or its affiliates expect to receive, or intend to seek, compensation for investment banking services in the next three months from Bank of China (BOCHK), Cathay Financial Holdings, FUJIFILM Holdings (4901), Hitachi (6501), Honda Motor (7267), Tata Power.
• Non-Investment Banking Compensation: JPMSI has received compensation in the past 12 months for products or services other than investment banking from Bank of China (BOCHK), Cathay Financial Holdings, FUJIFILM Holdings (4901), Hitachi (6501), Honda Motor (7267), Nintendo (7974), SK Holdings, Taishin Financial Holdings, Tata Power, Tenaga, Tokyo Electron (8035), Wing Hang Bank. An affiliate of JPMSI has received compensation in the past 12 months for products or services other than investment banking from Bank of China (BOCHK), Bumi Resources, Cathay Financial Holdings, FUJIFILM Holdings (4901), Hitachi (6501), Honda Motor (7267), Nintendo (7974), SK Holdings, Taishin Financial Holdings, Tata Power, Tokyo Electron (8035), Wing Hang Bank.
• MSCI: The MSCI sourced information is the exclusive property of Morgan Stanley Capital International Inc. (MSCI). Without prior written permission of MSCI, this information and any other MSCI intellectual property may not be reproduced, redisseminated or used to create any financial products, including any indices. This information is provided on an 'as is' basis. The user assumes the entire risk of any use made of this information. MSCI, its affiliates and any third party involved in, or related to, computing or compiling the information hereby expressly disclaim all warranties of originality, accuracy, completeness, merchantability or fitness

26
Asia Pacific Equity Research 02 July 2010
Sunil Garg (852) 2800-8518 [email protected]
for a particular purpose with respect to any of this information. Without limiting any of the foregoing, in no event shall MSCI, any of its affiliates or any third party involved in, or related to, computing or compiling the information have any liability for any damages of any kind. MSCI, Morgan Stanley Capital International and the MSCI indexes are services marks of MSCI and its affiliates.
Important Disclosures for Equity Research Compendium Reports: Important disclosures, including price charts for all companies under coverage for at least one year, are available through the search function on J.P. Morgan’s website https://mm.jpmorgan.com/disclosures/company or by calling this U.S. toll-free number (1-800-477-0406)
Explanation of Equity Research Ratings and Analyst(s) Coverage Universe: J.P. Morgan uses the following rating system: Overweight [Over the next six to twelve months, we expect this stock will outperform the average total return of the stocks in the analyst’s (or the analyst’s team’s) coverage universe.] Neutral [Over the next six to twelve months, we expect this stock will perform in line with the average total return of the stocks in the analyst’s (or the analyst’s team’s) coverage universe.] Underweight [Over the next six to twelve months, we expect this stock will underperform the average total return of the stocks in the analyst’s (or the analyst’s team’s) coverage universe.] J.P. Morgan Cazenove’s UK Small/Mid-Cap dedicated research analysts use the same rating categories; however, each stock’s expected total return is compared to the expected total return of the FTSE All Share Index, not to those analysts’ coverage universe. A list of these analysts is available on request. The analyst or analyst’s team’s coverage universe is the sector and/or country shown on the cover of each publication. See below for the specific stocks in the certifying analyst(s) coverage universe.
J.P. Morgan Equity Research Ratings Distribution, as of June 30, 2010
Overweight (buy)
Neutral (hold)
Underweight (sell)
JPM Global Equity Research Coverage 46% 42% 12% IB clients* 49% 46% 31% JPMSI Equity Research Coverage 44% 48% 9% IB clients* 68% 61% 53%
*Percentage of investment banking clients in each rating category. For purposes only of NASD/NYSE ratings distribution rules, our Overweight rating falls into a buy rating category; our Neutral rating falls into a hold rating category; and our Underweight rating falls into a sell rating category.
Valuation and Risks: Please see the most recent company-specific research report for an analysis of valuation methodology and risks on any securities recommended herein. Research is available at http://www.morganmarkets.com , or you can contact the analyst named on the front of this note or your J.P. Morgan representative.
Analysts’ Compensation: The equity research analysts responsible for the preparation of this report receive compensation based upon various factors, including the quality and accuracy of research, client feedback, competitive factors, and overall firm revenues, which include revenues from, among other business units, Institutional Equities and Investment Banking.
Registration of non-US Analysts: Unless otherwise noted, the non-US analysts listed on the front of this report are employees of non-US affiliates of JPMSI, are not registered/qualified as research analysts under NASD/NYSE rules, may not be associated persons of JPMSI, and may not be subject to NASD Rule 2711 and NYSE Rule 472 restrictions on communications with covered companies, public appearances, and trading securities held by a research analyst account.
Other Disclosures
J.P. Morgan is the global brand name for J.P. Morgan Securities Inc. (JPMSI) and its non-US affiliates worldwide. J.P. Morgan Cazenove is a brand name for equity research produced by J.P. Morgan Securities Ltd.; J.P. Morgan Equities Limited; JPMorgan Chase Bank, N.A., Dubai Branch; and J.P. Morgan Bank International LLC.
Options related research: If the information contained herein regards options related research, such information is available only to persons who have received the proper option risk disclosure documents. For a copy of the Option Clearing Corporation’s Characteristics and Risks of Standardized Options, please contact your J.P. Morgan Representative or visit the OCC’s website at http://www.optionsclearing.com/publications/risks/riskstoc.pdf.
Legal Entities Disclosures U.S.: JPMSI is a member of NYSE, FINRA and SIPC. J.P. Morgan Futures Inc. is a member of the NFA. JPMorgan Chase Bank, N.A. is a member of FDIC and is authorized and regulated in the UK by the Financial Services Authority. U.K.: J.P. Morgan Securities Ltd. (JPMSL) is a member of the London Stock Exchange and is authorised and regulated by the Financial Services Authority. Registered in England & Wales No. 2711006. Registered Office 125 London Wall, London EC2Y 5AJ. South Africa: J.P. Morgan Equities Limited is a member of the Johannesburg
27
Asia Pacific Equity Research 02 July 2010
Sunil Garg (852) 2800-8518 [email protected]
Securities Exchange and is regulated by the FSB. Hong Kong: J.P. Morgan Securities (Asia Pacific) Limited (CE number AAJ321) is regulated by the Hong Kong Monetary Authority and the Securities and Futures Commission in Hong Kong. Korea: J.P. Morgan Securities (Far East) Ltd, Seoul Branch, is regulated by the Korea Financial Supervisory Service. Australia: J.P. Morgan Australia Limited (ABN 52 002 888 011/AFS Licence No: 238188) is regulated by ASIC and J.P. Morgan Securities Australia Limited (ABN 61 003 245 234/AFS Licence No: 238066) is a Market Participant with the ASX and regulated by ASIC. Taiwan: J.P.Morgan Securities (Taiwan) Limited is a participant of the Taiwan Stock Exchange (company-type) and regulated by the Taiwan Securities and Futures Bureau. India: J.P. Morgan India Private Limited is a member of the National Stock Exchange of India Limited and Bombay Stock Exchange Limited and is regulated by the Securities and Exchange Board of India. Thailand: JPMorgan Securities (Thailand) Limited is a member of the Stock Exchange of Thailand and is regulated by the Ministry of Finance and the Securities and Exchange Commission. Indonesia: PT J.P. Morgan Securities Indonesia is a member of the Indonesia Stock Exchange and is regulated by the BAPEPAM LK. Philippines: J.P. Morgan Securities Philippines Inc. is a member of the Philippine Stock Exchange and is regulated by the Securities and Exchange Commission. Brazil: Banco J.P. Morgan S.A. is regulated by the Comissao de Valores Mobiliarios (CVM) and by the Central Bank of Brazil. Mexico: J.P. Morgan Casa de Bolsa, S.A. de C.V., J.P. Morgan Grupo Financiero is a member of the Mexican Stock Exchange and authorized to act as a broker dealer by the National Banking and Securities Exchange Commission. Singapore: This material is issued and distributed in Singapore by J.P. Morgan Securities Singapore Private Limited (JPMSS) [MICA (P) 020/01/2010 and Co. Reg. No.: 199405335R] which is a member of the Singapore Exchange Securities Trading Limited and is regulated by the Monetary Authority of Singapore (MAS) and/or JPMorgan Chase Bank, N.A., Singapore branch (JPMCB Singapore) which is regulated by the MAS. Malaysia: This material is issued and distributed in Malaysia by JPMorgan Securities (Malaysia) Sdn Bhd (18146-X) which is a Participating Organization of Bursa Malaysia Berhad and a holder of Capital Markets Services License issued by the Securities Commission in Malaysia. Pakistan: J. P. Morgan Pakistan Broking (Pvt.) Ltd is a member of the Karachi Stock Exchange and regulated by the Securities and Exchange Commission of Pakistan. Saudi Arabia: J.P. Morgan Saudi Arabia Ltd. is authorised by the Capital Market Authority of the Kingdom of Saudi Arabia (CMA) to carry out dealing as an agent, arranging, advising and custody, with respect to securities business under licence number 35-07079 and its registered address is at 8th Floor, Al-Faisaliyah Tower, King Fahad Road, P.O. Box 51907, Riyadh 11553, Kingdom of Saudi Arabia. Dubai: JPMorgan Chase Bank, N.A., Dubai Branch is regulated by the Dubai Financial Services Authority (DFSA) and its registered address is Dubai International Financial Centre - Building 3, Level 7, PO Box 506551, Dubai, UAE.
Country and Region Specific Disclosures U.K. and European Economic Area (EEA): Unless specified to the contrary, issued and approved for distribution in the U.K. and the EEA by JPMSL. Investment research issued by JPMSL has been prepared in accordance with JPMSL's policies for managing conflicts of interest arising as a result of publication and distribution of investment research. Many European regulators require that a firm to establish, implement and maintain such a policy. This report has been issued in the U.K. only to persons of a kind described in Article 19 (5), 38, 47 and 49 of the Financial Services and Markets Act 2000 (Financial Promotion) Order 2005 (all such persons being referred to as "relevant persons"). This document must not be acted on or relied on by persons who are not relevant persons. Any investment or investment activity to which this document relates is only available to relevant persons and will be engaged in only with relevant persons. In other EEA countries, the report has been issued to persons regarded as professional investors (or equivalent) in their home jurisdiction. Australia: This material is issued and distributed by JPMSAL in Australia to “wholesale clients” only. JPMSAL does not issue or distribute this material to “retail clients.” The recipient of this material must not distribute it to any third party or outside Australia without the prior written consent of JPMSAL. For the purposes of this paragraph the terms “wholesale client” and “retail client” have the meanings given to them in section 761G of the Corporations Act 2001. Germany: This material is distributed in Germany by J.P. Morgan Securities Ltd., Frankfurt Branch and J.P.Morgan Chase Bank, N.A., Frankfurt Branch which are regulated by the Bundesanstalt für Finanzdienstleistungsaufsicht. Hong Kong: The 1% ownership disclosure as of the previous month end satisfies the requirements under Paragraph 16.5(a) of the Hong Kong Code of Conduct for Persons Licensed by or Registered with the Securities and Futures Commission. (For research published within the first ten days of the month, the disclosure may be based on the month end data from two months’ prior.) J.P. Morgan Broking (Hong Kong) Limited is the liquidity provider for derivative warrants issued by J.P. Morgan Structured Products B.V. and listed on the Stock Exchange of Hong Kong Limited. An updated list can be found on HKEx website: http://www.hkex.com.hk/prod/dw/Lp.htm. Japan: There is a risk that a loss may occur due to a change in the price of the shares in the case of share trading, and that a loss may occur due to the exchange rate in the case of foreign share trading. In the case of share trading, JPMorgan Securities Japan Co., Ltd., will be receiving a brokerage fee and consumption tax (shouhizei) calculated by multiplying the executed price by the commission rate which was individually agreed between JPMorgan Securities Japan Co., Ltd., and the customer in advance. Financial Instruments Firms: JPMorgan Securities Japan Co., Ltd., Kanto Local Finance Bureau (kinsho) No. 82 Participating Association / Japan Securities Dealers Association, The Financial Futures Association of Japan. Korea: This report may have been edited or contributed to from time to time by affiliates of J.P. Morgan Securities (Far East) Ltd, Seoul Branch. Singapore: JPMSS and/or its affiliates may have a holding in any of the securities discussed in this report; for securities where the holding is 1% or greater, the specific holding is disclosed in the Important Disclosures section above. India: For private circulation only, not for sale. Pakistan: For private circulation only, not for sale. New Zealand: This material is issued and distributed by JPMSAL in New Zealand only to persons whose principal business is the investment of money or who, in the course of and for the purposes of their business, habitually invest money. JPMSAL does not issue or distribute this material to members of "the public" as determined in accordance with section 3 of the Securities Act 1978. The recipient of this material must not distribute it to any third party or outside New Zealand without the prior written consent of JPMSAL. Canada: The information contained herein is not, and under no circumstances is to be construed as, a prospectus, an advertisement, a public offering, an offer to sell securities described herein, or solicitation of an offer to buy securities described herein, in Canada or any province or territory thereof. Any offer or sale of the securities described herein in Canada will be made only under an exemption from the requirements to file a prospectus with the relevant Canadian securities regulators and only by a dealer properly registered under applicable securities laws or, alternatively, pursuant to an exemption from the dealer registration requirement in the relevant province or territory of Canada in which such offer or sale is made. The information contained herein is under no circumstances to be construed as investment advice in any province or territory of Canada and is not tailored to the needs of the recipient. To the extent that the information contained herein references securities of an issuer incorporated, formed or created under the laws of Canada or a province or territory of Canada, any trades in such securities must be conducted through a dealer registered in Canada. No securities commission or similar regulatory

28
Asia Pacific Equity Research 02 July 2010
Sunil Garg (852) 2800-8518 [email protected]
authority in Canada has reviewed or in any way passed judgment upon these materials, the information contained herein or the merits of the securities described herein, and any representation to the contrary is an offence. Dubai: This report has been issued to persons regarded as professional clients as defined under the DFSA rules.
General: Additional information is available upon request. Information has been obtained from sources believed to be reliable but JPMorgan Chase & Co. or its affiliates and/or subsidiaries (collectively J.P. Morgan) do not warrant its completeness or accuracy except with respect to any disclosures relative to JPMSI and/or its affiliates and the analyst’s involvement with the issuer that is the subject of the research. All pricing is as of the close of market for the securities discussed, unless otherwise stated. Opinions and estimates constitute our judgment as of the date of this material and are subject to change without notice. Past performance is not indicative of future results. This material is not intended as an offer or solicitation for the purchase or sale of any financial instrument. The opinions and recommendations herein do not take into account individual client circumstances, objectives, or needs and are not intended as recommendations of particular securities, financial instruments or strategies to particular clients. The recipient of this report must make its own independent decisions regarding any securities or financial instruments mentioned herein. JPMSI distributes in the U.S. research published by non-U.S. affiliates and accepts responsibility for its contents. Periodic updates may be provided on companies/industries based on company specific developments or announcements, market conditions or any other publicly available information. Clients should contact analysts and execute transactions through a J.P. Morgan subsidiary or affiliate in their home jurisdiction unless governing law permits otherwise.
“Other Disclosures” last revised March 1, 2010.
Copyright 2010 JPMorgan Chase & Co. All rights reserved. This report or any portion hereof may not be reprinted, sold or redistributed without the written consent of J.P. Morgan.


![Home [] · rashmi sharma indu hina agrawal ashish sharma abhimanyu sharma tarun garg jasvir singh prince singh arun jain sunil sharma vikas sudhanshu singh monu ne-eraj kumar ashu](https://img.dokumen.tips/doc/110x75/5f51cfbadbbe91146e2dcdce/home-rashmi-sharma-indu-hina-agrawal-ashish-sharma-abhimanyu-sharma-tarun-garg.jpg)


![[ORDERS (INCOMPLETE MATTERS / IAs / CRLMPs)] · garg, suresh chandra tripathy, sunil kumar jain, sudhir naagar[r-1], shiv prakash pandey, shekhar kumar, senthil jagadeesan, a satyendra](https://img.dokumen.tips/doc/110x75/6104ce2219b89f69c677f85f/orders-incomplete-matters-ias-crlmps-garg-suresh-chandra-tripathy-sunil.jpg)


