Embed Size (px)
Citation preview

J P M O R G A N H V A C C O N F E R E N C E
M A Y 31, 2 0 0 7
2007 outlook & long-term objectives
Business strategy
Company review
Appendix
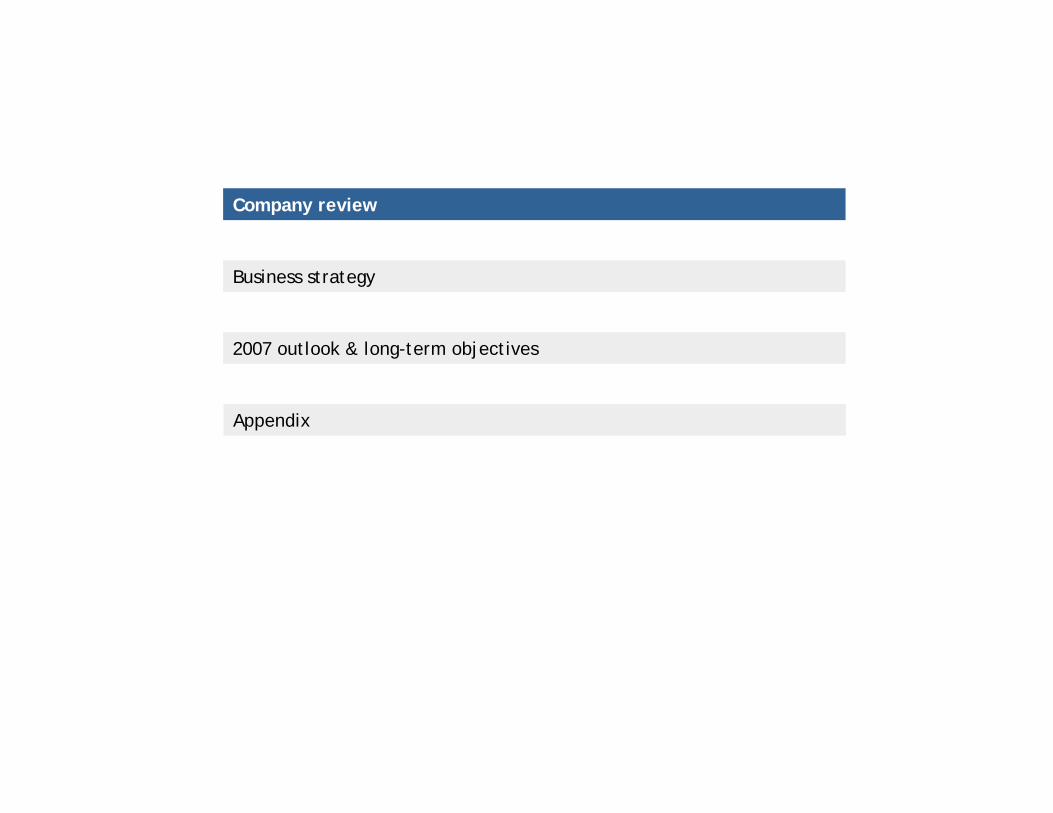
Goodman is a leading manufacturer of
residential and light commercial HVAC products
C O
M P
A N
Y R
E V
I E
W
Residential HVAC market share
Goodman
Source: Goodman estimates
Goodman market share history
2%
1983 1993 2003 2006
Source: Goodman estimates
Consistently growing faster than overall market
Goodman is 2nd largest manufacturer of
residential and light commercial products
Top 6 manufacturers account for
approximately 90% of industry shipments
Goodman has achieved substantial share
growth since its founding in 1982
Key competitive advantages:
Value offering
Extensive distribution network
Dealer focus
8.5 SEER to 10 SEERupgrade
10 SEER to 13 SEERupgrade
Source: Goodman estimates
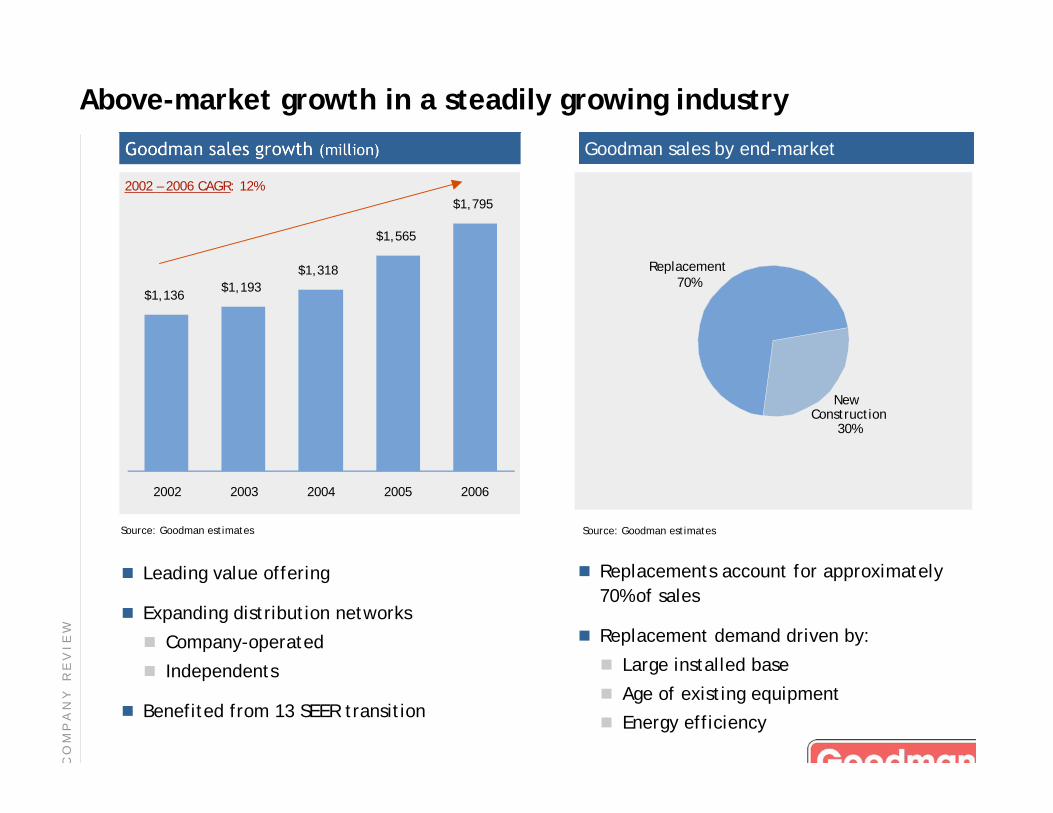
Goodman sales growth (million) Goodman sales by end-market
$1,136$1,193
$1,565
$1,795
$1,318
2002 2003 2004 2005 2006
Replacement70%
New Construction
30%
Source: Goodman estimates
2002 – 2006 CAGR: 12%
Above-market growth in a steadily growing industry
C O
M P
A N
Y R
E V
I E
W
Replacements account for approximately
70% of sales
Replacement demand driven by:
Large installed base
Age of existing equipment
Energy efficiency
Leading value offering
Expanding distribution networks
Company-operated
Independents
Benefited from 13 SEER transition
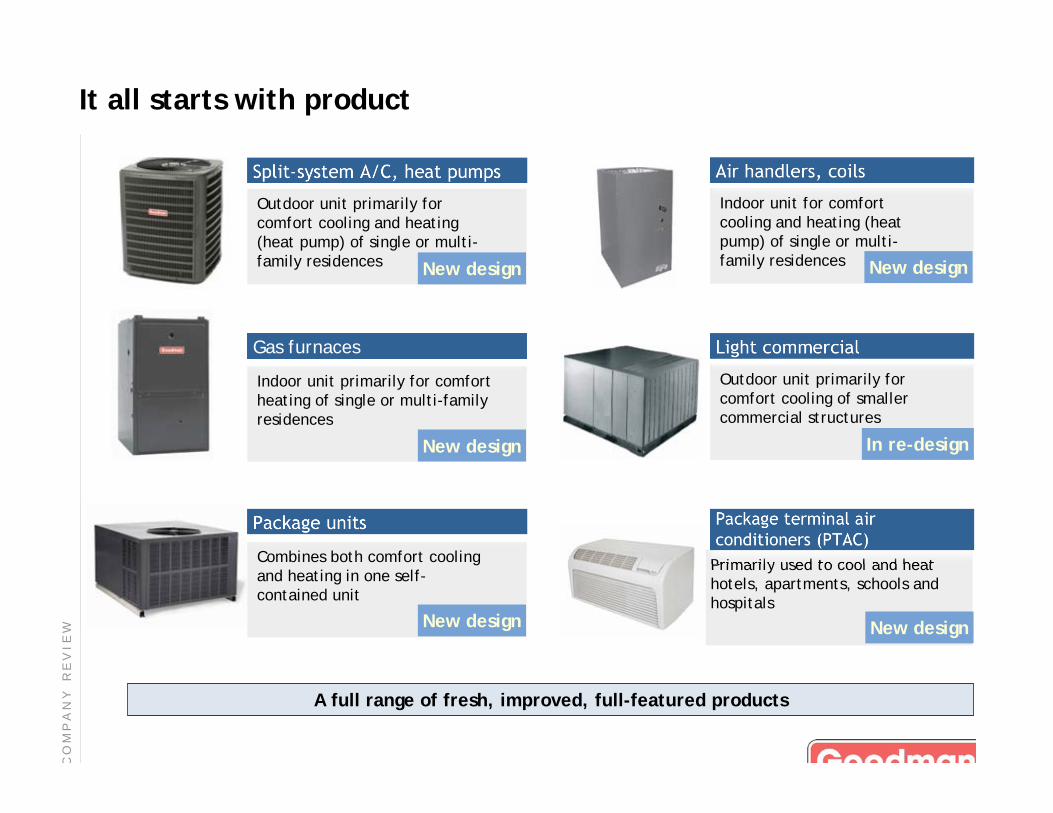
Primarily used to cool and heathotels, apartments, schools andhospitals
Indoor unit for comfortcooling and heating (heatpump) of single or multi-family residences
It all starts with product
Package Units
A full range of fresh, improved, full-featured products
Outdoor unit primarily forcomfort cooling of smallercommercial structures
Combines both comfort coolingand heating in one self-contained unit
Indoor unit primarily for comfortheating of single or multi-familyresidences
Split-system A/C, heat pumps
Outdoor unit primarily forcomfort cooling and heating(heat pump) of single or multi-family residences
Package terminal airconditioners (PTAC)
Light commercial
Air handlers, coils
Package units
Gas furnaces
New design
New design
New design New design
In re-design
New design
C O
M P
A N
Y R
E V
I E
W

Goodman value: reliable performance and a better price
1992: First in industry to offer 5-year parts warranty on all products
2004: First in industry to offer lifetime compressor warranty on highefficiency products
2007: First in industry to offer 10-year parts warranty on all products
2004 2005 2006 2007F
Supplier defects (per million)
0.2%
2004 2005 2006 2007F
Service incident rate
1.0%
2004 – 2006: 25% improvement2007: Equivalent to 6 results
C O
M P
A N
Y R
E V
I E
W
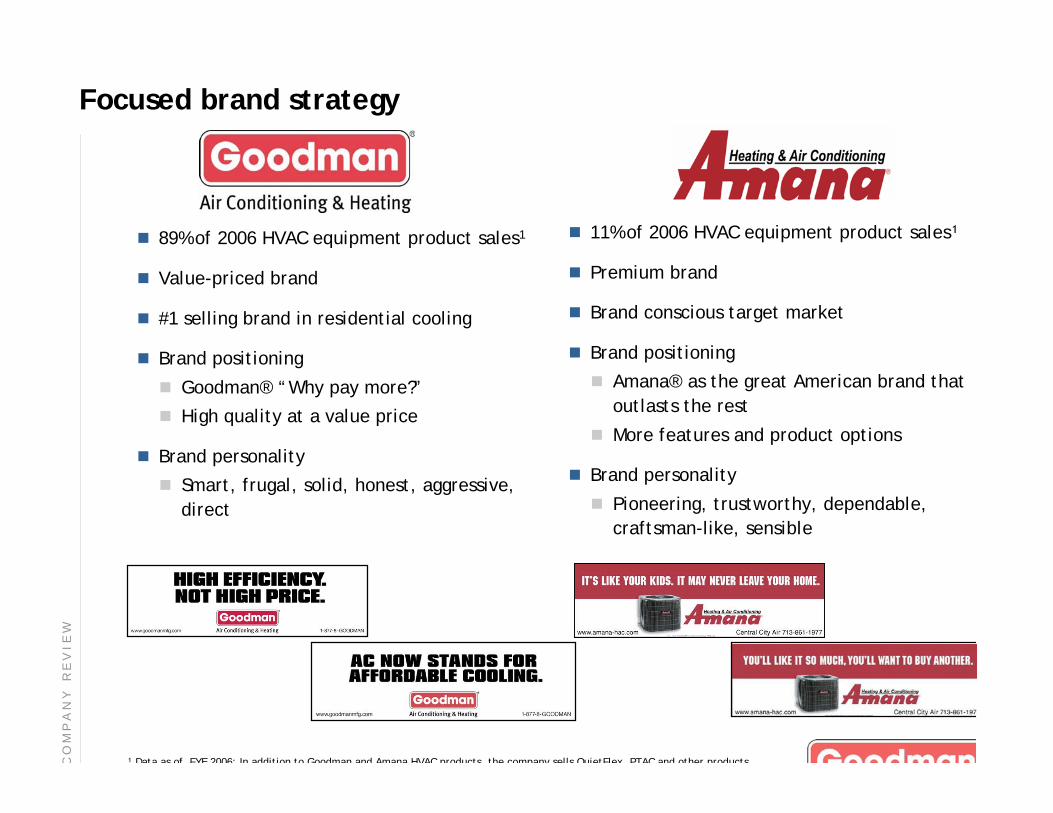
Focused brand strategy
89% of 2006 HVAC equipment product sales1
Value-priced brand
#1 selling brand in residential cooling
Brand positioning
Goodman® “Why pay more?”
High quality at a value price
Brand personality
Smart, frugal, solid, honest, aggressive,
direct
11% of 2006 HVAC equipment product sales
Premium brand
Brand conscious target market
Brand positioning
Amana® as the great American brand that
outlasts the rest
More features and product options
Brand personality
Pioneering, trustworthy, dependable,
craftsman-like, sensible
Data as of FYE 2006; In addition to Goodman and Amana HVAC products the company sells QuietFlex PTAC and other productsC O
M P
A N
Y R
E V
I E
W
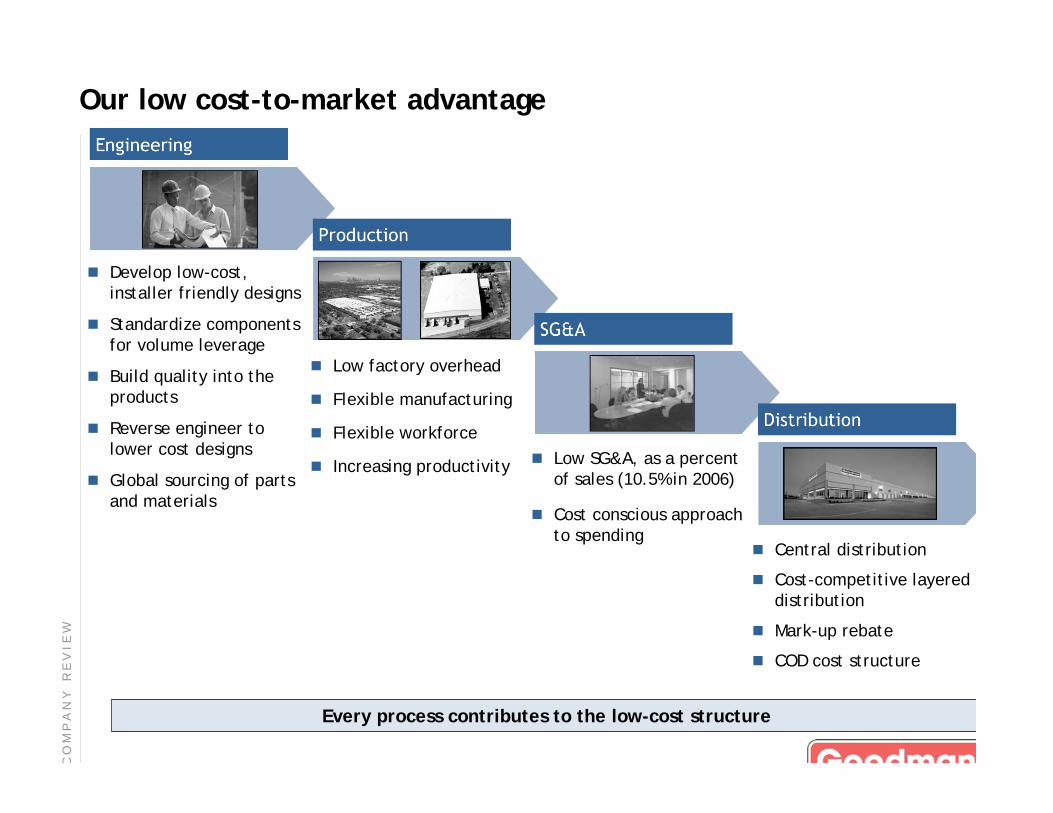
Production
Distribution
SG&A
Engineering
Our low cost-to-market advantage
Develop low-cost,installer friendly designs
Standardize componentsfor volume leverage
Build quality into theproducts
Reverse engineer tolower cost designs
Global sourcing of partsand materials
Low factory overhead
Flexible manufacturing
Flexible workforce
Increasing productivity Low SG&A, as a percentof sales (10.5% in 2006)
Cost conscious approachto spending
Central distribution
Cost-competitive layereddistribution
Mark-up rebate
COD cost structure
Every process contributes to the low-cost structure
C O
M P
A N
Y R
E V
I E
W
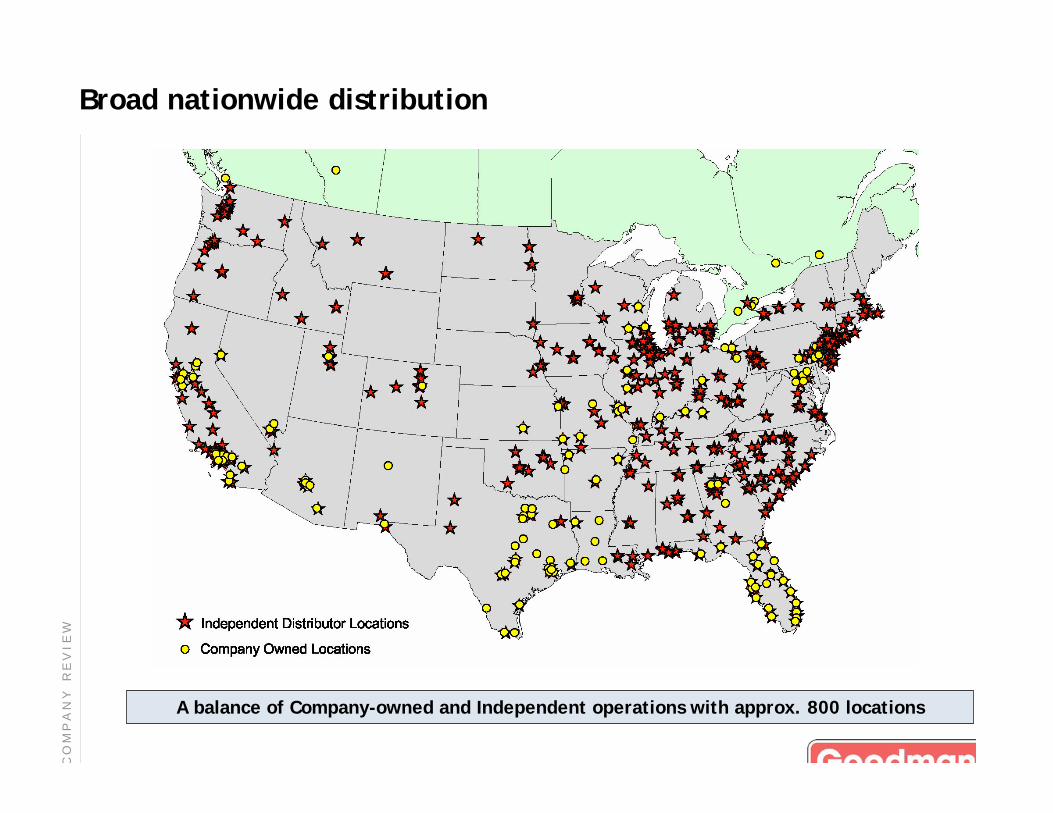
Broad nationwide distribution
A balance of Company-owned and Independent operations with approx. 800 locations
C O
M P
A N
Y R
E V
I E
W
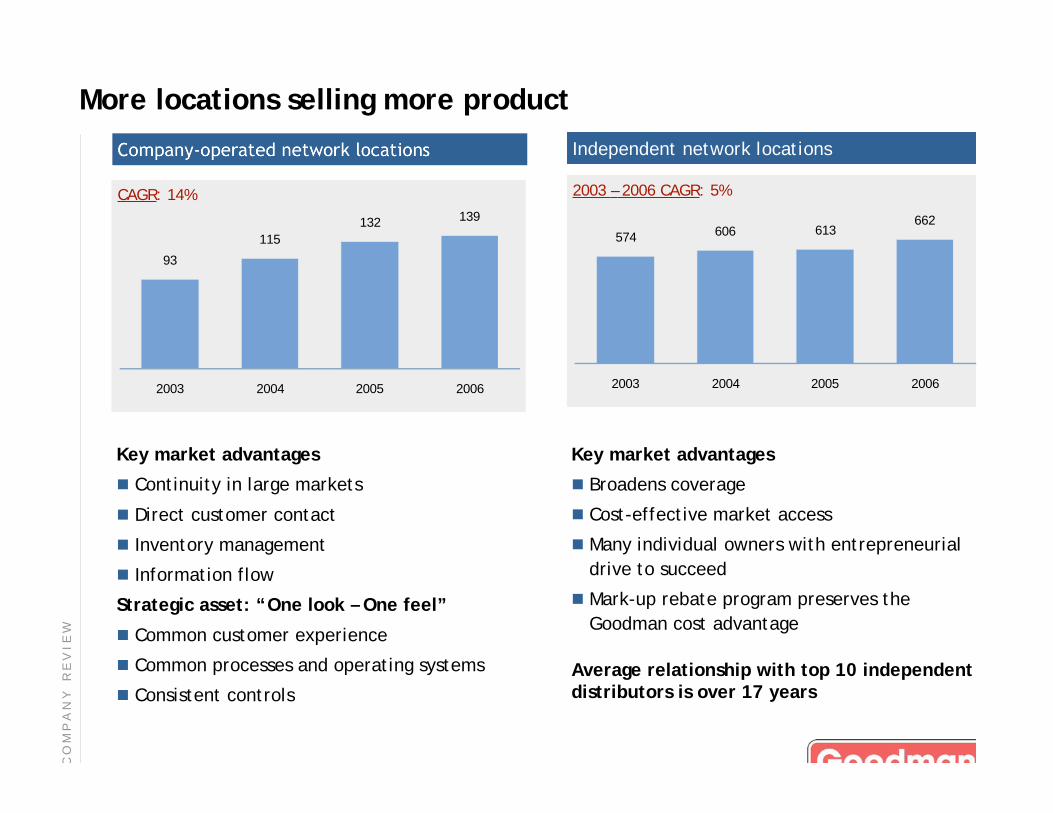
More locations selling more product
93
115
139132
2003 2004 2005 2006
Company-operated network locations
CAGR: 14%
Independent network locations
574606
662613
2003 2004 2005 2006
2003 – 2006 CAGR: 5%
Key market advantages
Continuity in large markets
Direct customer contact
Inventory management
Information flow
Strategic asset: “One look – One feel”
Common customer experience
Common processes and operating systems
Consistent controls
Key market advantages
Broadens coverage
Cost-effective market access
Many individual owners with entrepreneurial
drive to succeed
Mark-up rebate program preserves the
Goodman cost advantage
Average relationship with top 10 independentdistributors is over 17 years
C O
M P
A N
Y R
E V
I E
W
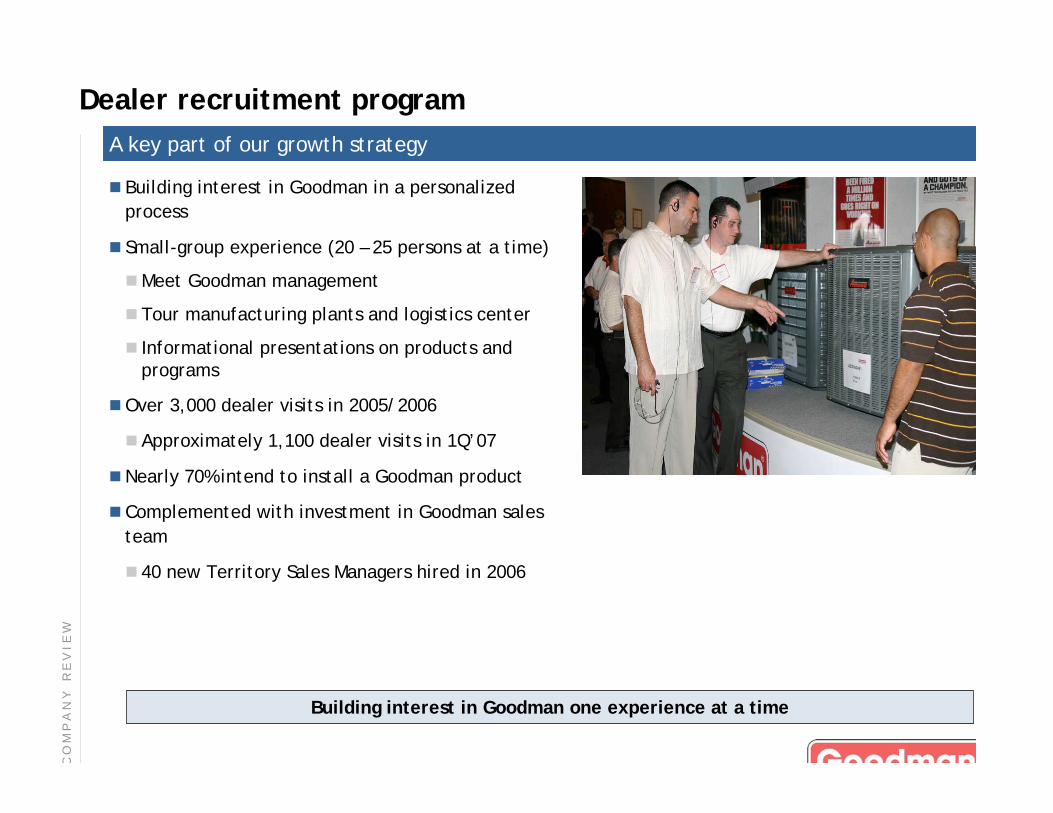
Dealer recruitment program
A key part of our growth strategy
Building interest in Goodman in a personalized
process
Small-group experience (20 – 25 persons at a time)
Meet Goodman management
Tour manufacturing plants and logistics center
Informational presentations on products andprograms
Over 3,000 dealer visits in 2005/2006
Approximately 1,100 dealer visits in 1Q’07
Nearly 70% intend to install a Goodman product
Complemented with investment in Goodman sales
team
40 new Territory Sales Managers hired in 2006
Building interest in Goodman one experience at a time
C O
M P
A N
Y R
E V
I E
W
Product
Comprehensive product portfolio
Sales & Marketing support
Distributor relationship
Business support
Order processing, credit
Warranty
Manufacturer’s warranty
Product reliability and installability
Availability
Distribution network
Delivery logistics
Price
Priced to close
Priced for profitability
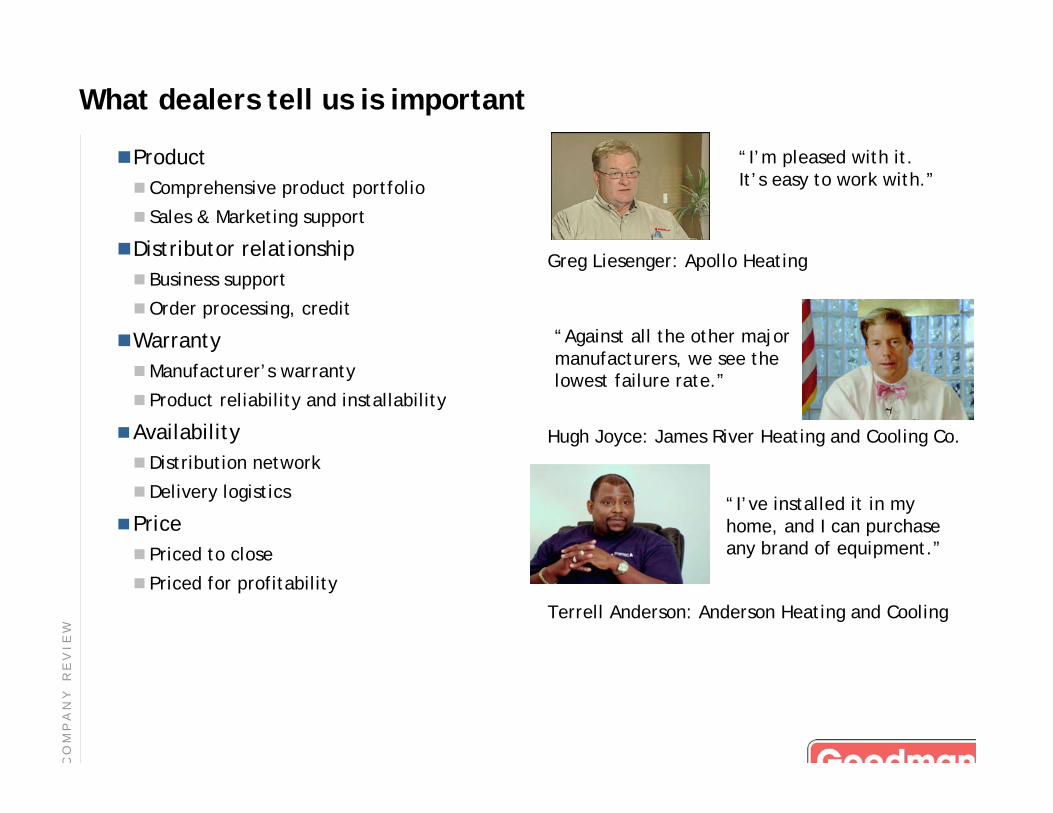
What dealers tell us is important
Greg Liesenger: Apollo Heating
“I’m pleased with it.It’s easy to work with.”
Hugh Joyce: James River Heating and Cooling Co.
“Against all the other majormanufacturers, we see thelowest failure rate.”
“I’ve installed it in myhome, and I can purchaseany brand of equipment.”
Terrell Anderson: Anderson Heating and Cooling
C O
M P
A N
Y R
E V
I E
W
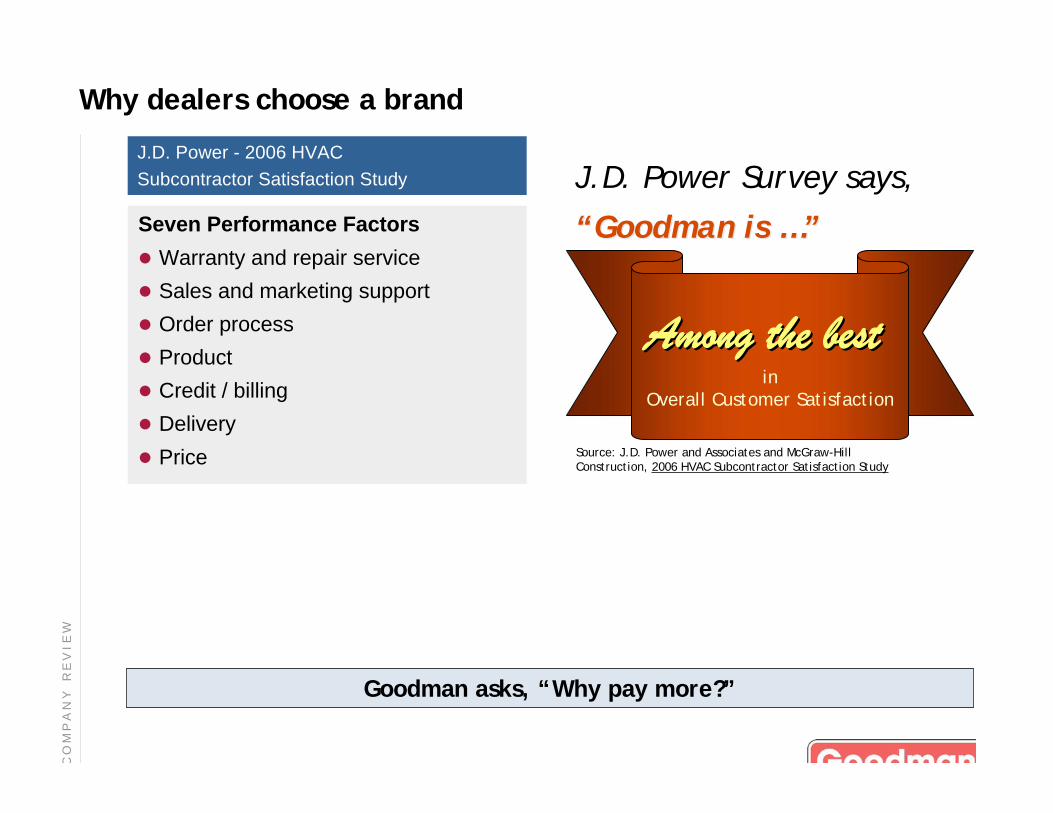
Why dealers choose a brand
Source: J.D. Power and Associates and McGraw-HillConstruction, 2006 HVAC Subcontractor Satisfaction Study
Among the bestAmong the best in
Overall Customer Satisfaction
J.D. Power - 2006 HVAC
Subcontractor Satisfaction Study
Seven Performance Factors
Warranty and repair service
Sales and marketing support
Order process
Product
Credit / billing
Delivery
Price
J.D. Power Survey says,
““Goodman is Goodman is …”…”
Goodman asks, “Why pay more?”
C O
M P
A N
Y R
E V
I E
W
2007 outlook & long-term objectives
Business strategy
Company review
Appendix
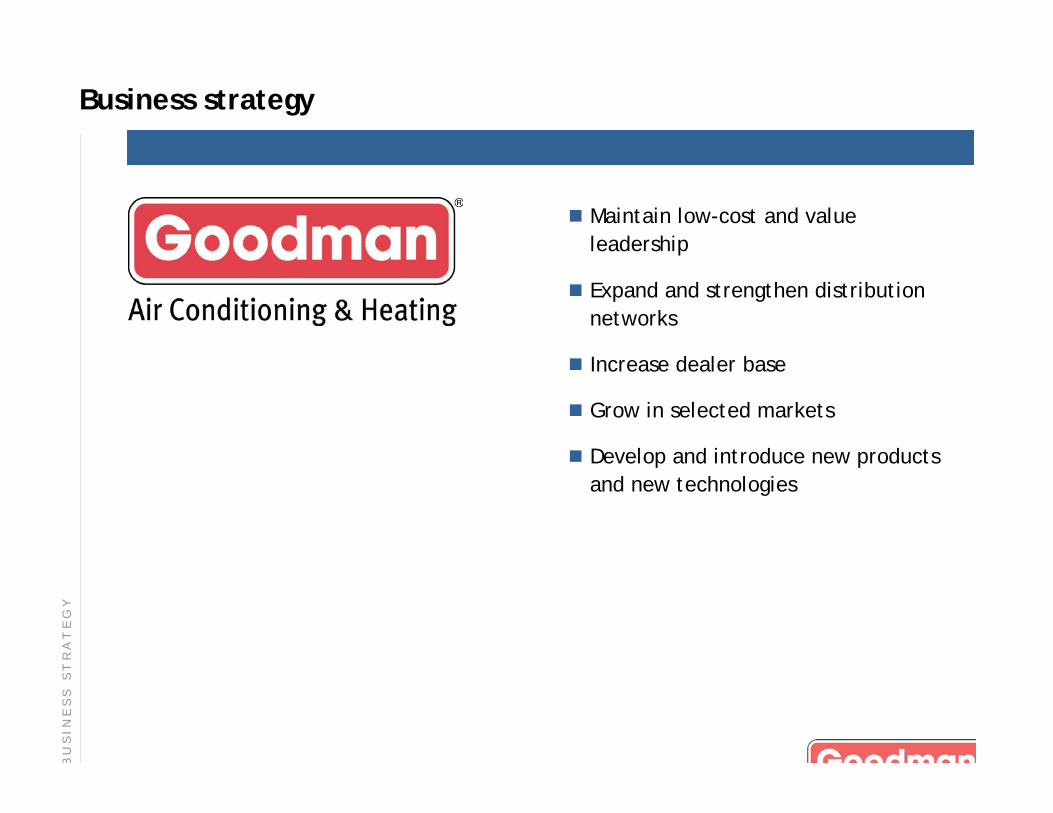
Business strategy
B U
S I N
E S
S S
T R
A T
E G
Y
Maintain low-cost and value
leadership
Expand and strengthen distribution
networks
Increase dealer base
Grow in selected markets
Develop and introduce new products
and new technologies
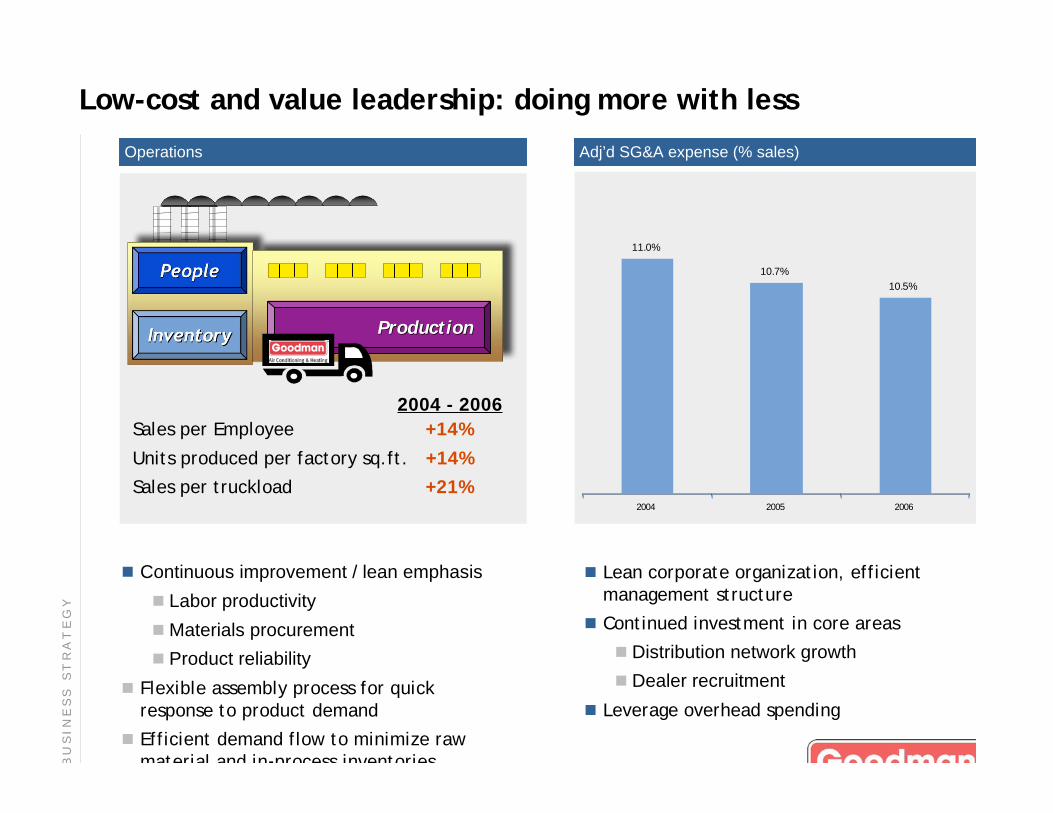
Low-cost and value leadership: doing more with less
B U
S I N
E S
S S
T R
A T
E G
Y
11.0%
10.7%
10.5%
2004 2005 2006
Adj’d SG&A expense (% sales)
Lean corporate organization, efficientmanagement structure
Continued investment in core areas
Distribution network growth
Dealer recruitment
Leverage overhead spending
PeoplePeople
InventoryInventory ProductionProduction
2004 - 2006
Operations
Sales per Employee +14%
Units produced per factory sq.ft. +14%
Sales per truckload +21%
Continuous improvement / lean emphasis
Labor productivity
Materials procurement
Product reliability
Flexible assembly process for quickresponse to product demand
Efficient demand flow to minimize rawmaterial and in process inventories
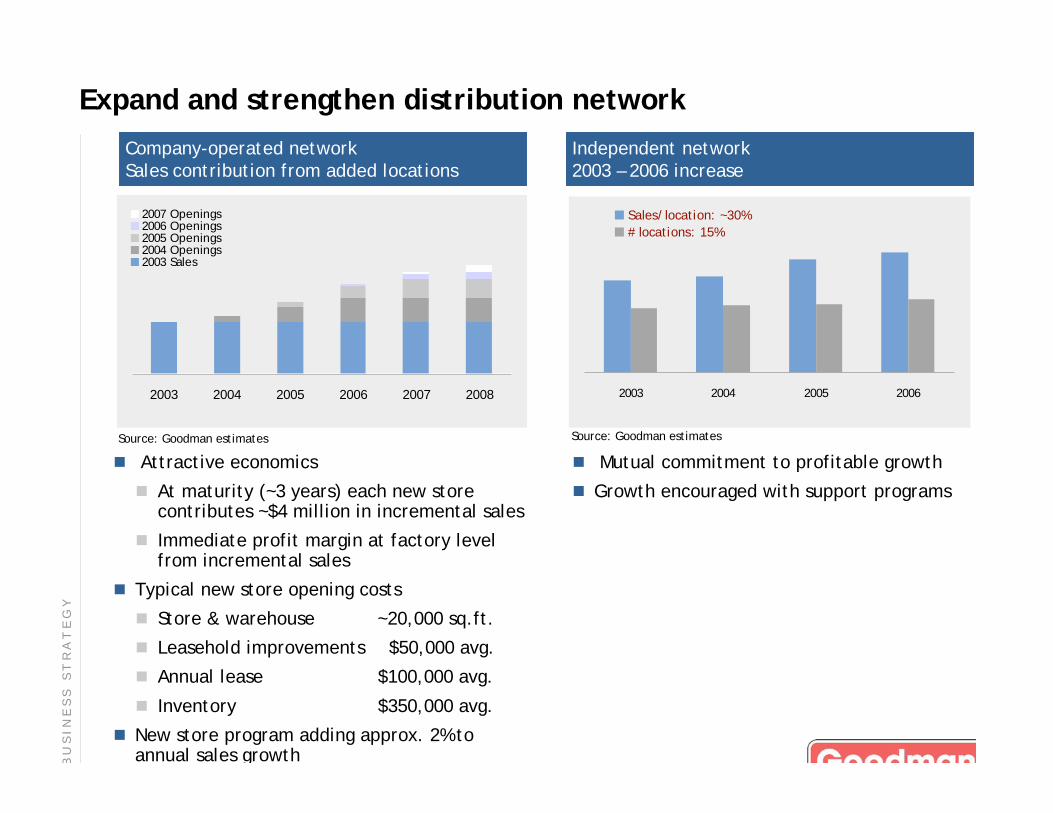
Expand and strengthen distribution network
2003 2004 2005 2006
Sales/location: ~30%
# locations: 15%
Attractive economics
At maturity (~3 years) each new storecontributes ~$4 million in incremental sales
Immediate profit margin at factory levelfrom incremental sales
Typical new store opening costs
Store & warehouse ~20,000 sq.ft.
Leasehold improvements $50,000 avg.
Annual lease $100,000 avg.
Inventory $350,000 avg.
New store program adding approx. 2% toannual sales growth
2003 2004 2005 2006 2007 2008
2007 Openings2006 Openings2005 Openings2004 Openings2003 Sales
Company-operated networkSales contribution from added locations
Independent network2003 – 2006 increase
Source: Goodman estimatesSource: Goodman estimates
Mutual commitment to profitable growth
Growth encouraged with support programs
B U
S I N
E S
S S
T R
A T
E G
Y
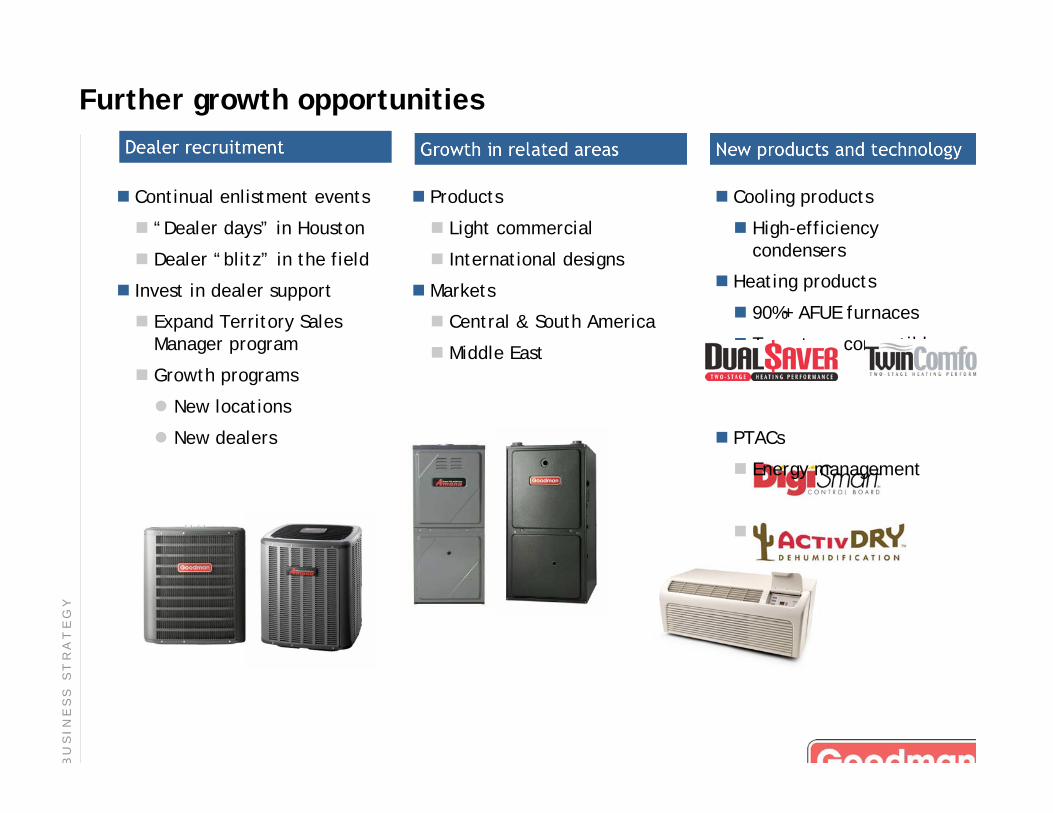
Cooling products
High-efficiencycondensers
Heating products
90%+ AFUE furnaces
Two-stage convertibles
PTACs
Energy management
Comfort control
Further growth opportunities
Growth in related areas New products and technologyDealer recruitment
Continual enlistment events
“Dealer days” in Houston
Dealer “blitz” in the field
Invest in dealer support
Expand Territory SalesManager program
Growth programs
New locations
New dealers
Products
Light commercial
International designs
Markets
Central & South America
Middle East
B U
S I N
E S
S S
T R
A T
E G
Y
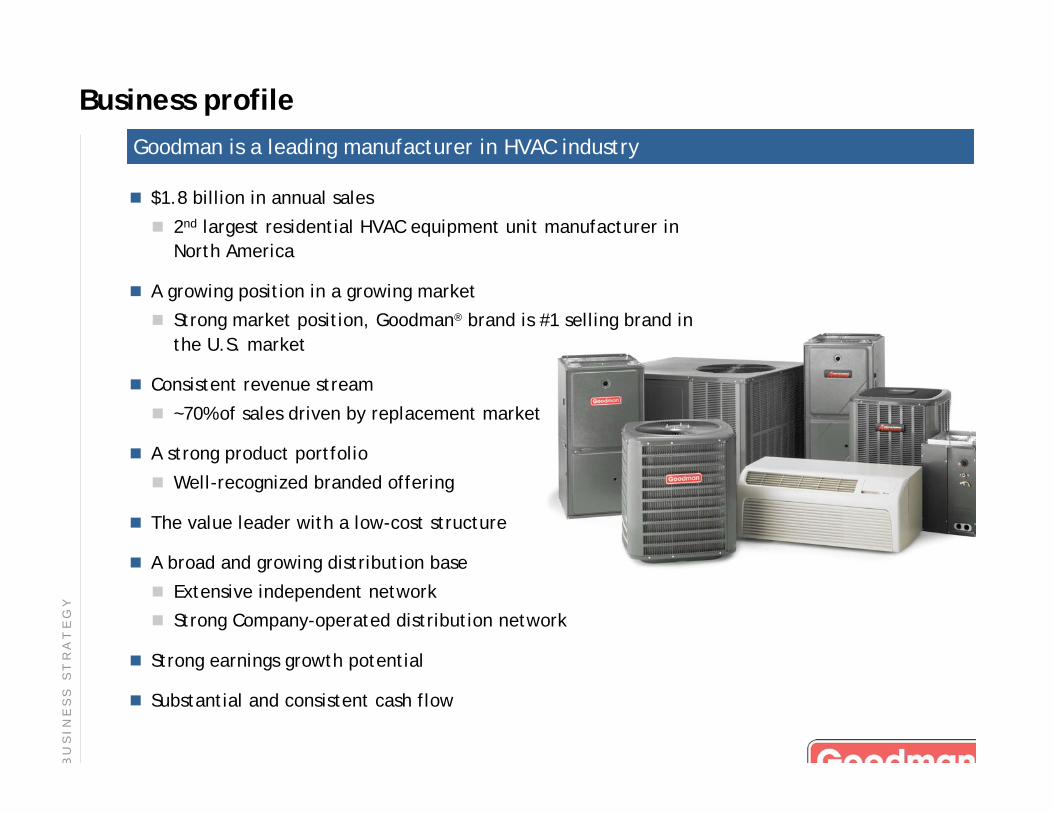
Business profile
$1.8 billion in annual sales
2nd largest residential HVAC equipment unit manufacturer in
North America
A growing position in a growing market
Strong market position, Goodman® brand is #1 selling brand in
the U.S. market
Consistent revenue stream
~70% of sales driven by replacement market
A strong product portfolio
Well-recognized branded offering
The value leader with a low-cost structure
A broad and growing distribution base
Extensive independent network
Strong Company-operated distribution network
Strong earnings growth potential
Substantial and consistent cash flow
Goodman is a leading manufacturer in HVAC industry
B U
S I N
E S
S S
T R
A T
E G
Y
2007 outlook & long-term objectives
Business strategy
Company review
Appendix

2006 results & 2007 outlook
$1,318
$1,565
$1,795
2004 2005 2006 2007F
$226
$194
$164
2004 2005 2006 2007F
22.7%
23.1% 23.1%
2004 2005 2006 2007F
Net sales ($ millions) Adjusted gross margin (% sales) Adjusted EBITDA ($ millions)
$255 - $265
Outsold the industry
Revenues increased 15%
Adjusted gross margins held at23.1%
13-SEER transition benefits
Operating efficiencies
Commodity cost increases
Adjusted SG&A expense ratioimproved 20 bp
Sales per employee increased 10%
Complete transition to 13+ SEER
Decline in residential newconstruction
2006 price increases
Copper and aluminum costincreases
Productivity gains
Investment in growing distributionnetwork and dealer recruitment
EBITDA
$255 million to $265 million
Earnings per share
$1.30 to $1.40
Excluding gain on property sale
Debt reduction
Approx. $120 million
2 0
0 7
O
U T
L O
O K
&
L
O N
G -
T E
R M
O
B J
E C
T I V
E S
2006 results 2007 outlook 2007 forecast

1Q’07 results: A good start
$268
$296
$381 $380
1Q'04 1Q'05 1Q'06 1Q'07
$26
$29
$41
$32
1Q'04 1Q'05 1Q'06 1Q'07
22.5% 22.3% 22.6%
20.3%
1Q'04 1Q'05 1Q'06 1Q'07
Net sales ($ millions) Adjusted gross margin (% sales) Adjusted EBITDA ($ millions)
Net sales:
HVAC industry’s best reportedsales performance
Significant decline in residentialnew construction market
Carryover of 2006 price increases
Further 13 SEER transition
Benefit from dealer recruitmentand promotional activities
3 Yr CAGR: 12%
Gross margin:
13 SEER transition benefits
Copper and aluminum costincreases above price increases
Factory productivity
Continued investments indistribution network and dealerrecruitment
1Q’07, adjusted for $10mm, net,commodities impact
Adj’d gross margin = 22.9%
Adj’d EBITDA = $42 million
C diti h d i l
Cash flow:
Improved inventory levels
Capital spending in line
Debt well below prior year level
2 0
0 7
O
U T
L O
O K
&
L
O N
G -
T E
R M
O
B J
E C
T I V
E S
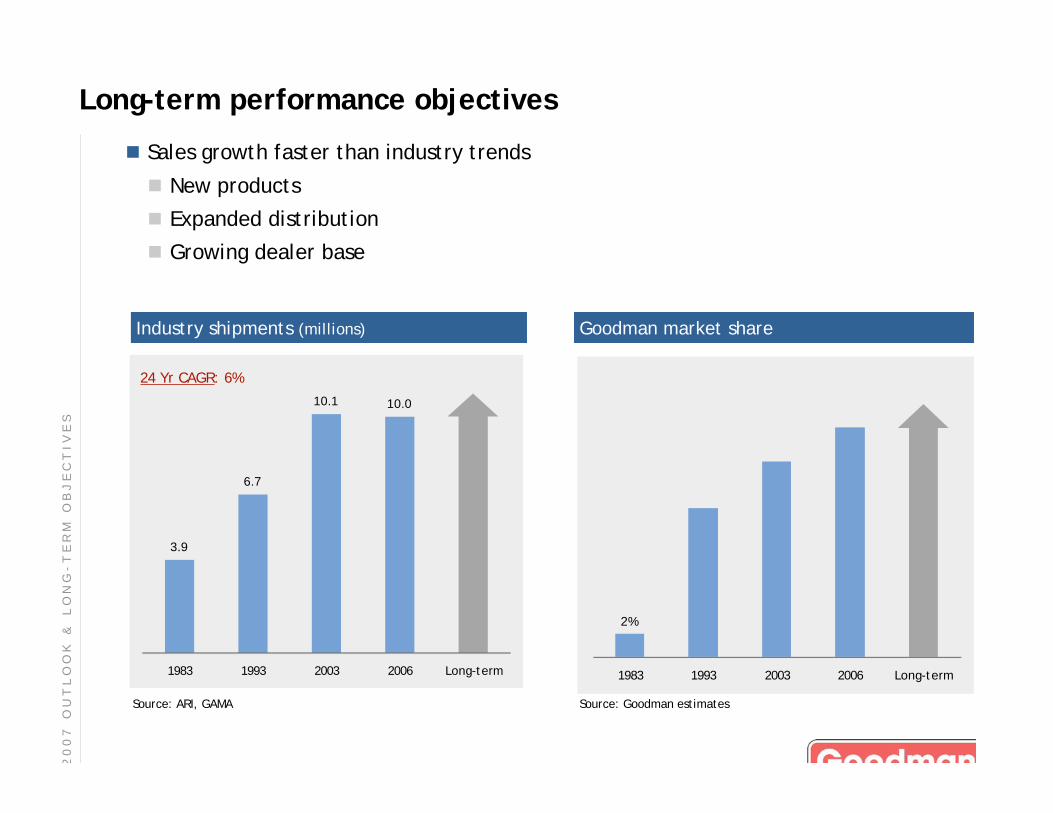
Long-term performance objectives
Sales growth faster than industry trends
New products
Expanded distribution
Growing dealer base
2%
1983 1993 2003 2006 Long-term
Goodman market share
3.9
6.7
10.1 10.0
1983 1993 2003 2006 Long-term
Industry shipments (millions)
24 Yr CAGR: 6%
2 0
0 7
O
U T
L O
O K
&
L
O N
G -
T E
R M
O
B J
E C
T I V
E S
Source: Goodman estimatesSource: ARI, GAMA
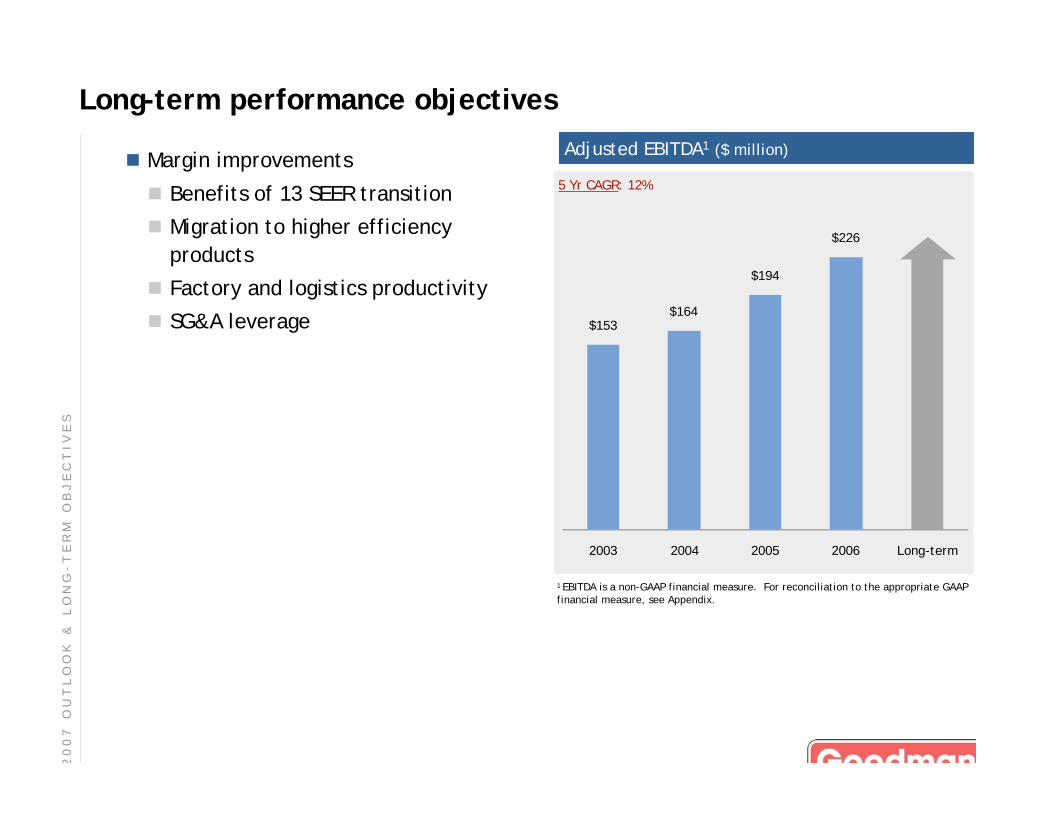
Long-term performance objectives
Margin improvements
Benefits of 13 SEER transition
Migration to higher efficiency
products
Factory and logistics productivity
SG&A leverage
Adjusted EBITDA1 ($ million)
$153$164
$194
$226
2003 2004 2005 2006 Long-term
1 EBITDA is a non-GAAP financial measure. For reconciliation to the appropriate GAAPfinancial measure, see Appendix.
5 Yr CAGR: 12%
2 0
0 7
O
U T
L O
O K
&
L
O N
G -
T E
R M
O
B J
E C
T I V
E S
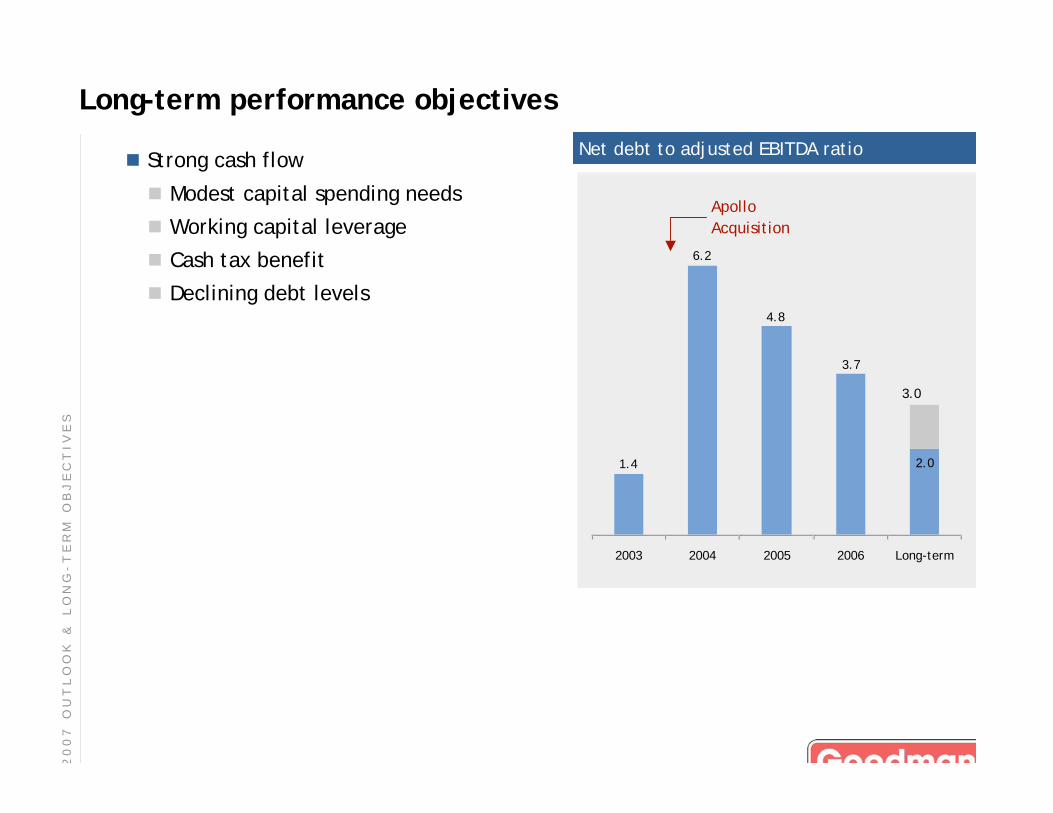
Long-term performance objectives
Strong cash flow
Modest capital spending needs
Working capital leverage
Cash tax benefit
Declining debt levels
2.0
3.7
4.8
6.2
1.4
2003 2004 2005 2006 Long-term
Net debt to adjusted EBITDA ratio
Apollo
Acquisition
3.0
2 0
0 7
O
U T
L O
O K
&
L
O N
G -
T E
R M
O
B J
E C
T I V
E S
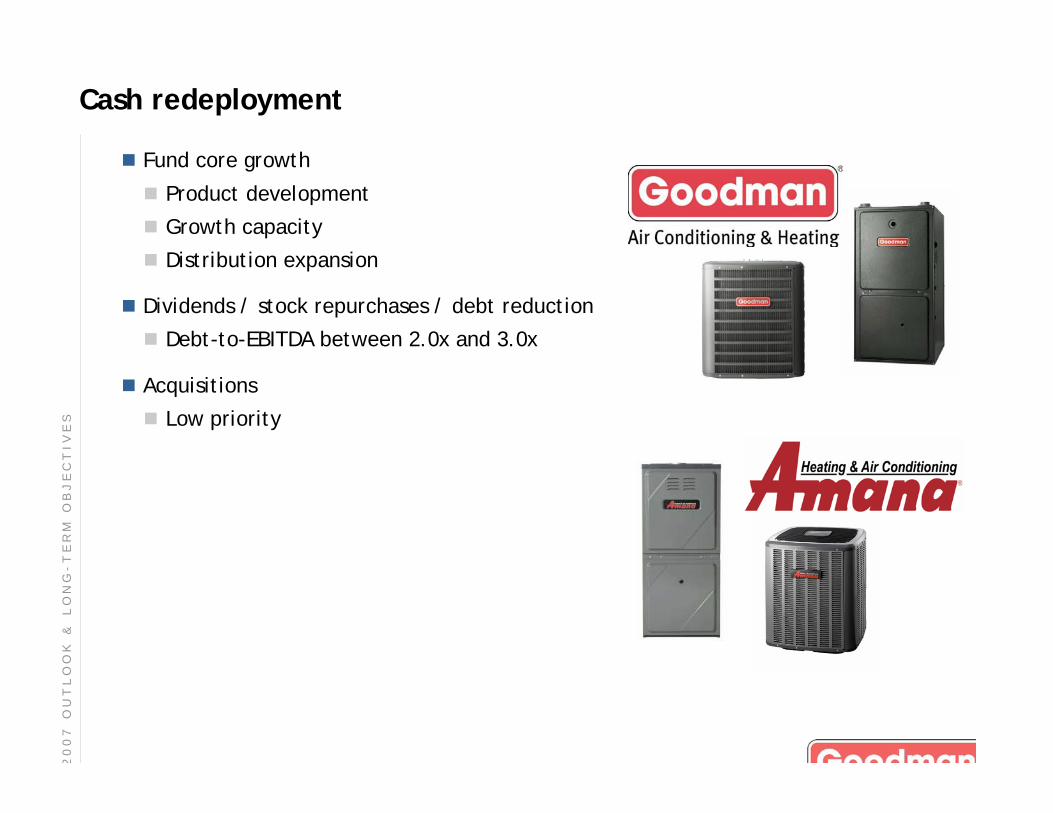
Cash redeployment
Fund core growth
Product development
Growth capacity
Distribution expansion
Dividends / stock repurchases / debt reduction
Debt-to-EBITDA between 2.0x and 3.0x
Acquisitions
Low priority
2 0
0 7
O
U T
L O
O K
&
L
O N
G -
T E
R M
O
B J
E C
T I V
E S
Summary
Attractive industry structure
Strong and improving market position
Consistent revenue stream driven by non-cyclical replacement demand
Extensive and growing distribution network
Expanding dealer base
The low-cost, value leader with industry leading EBIT margins
Significant opportunities for continued sales and earnings growth
Substantial and consistent cash flow
2 0
0 7
O
U T
L O
O K
&
L
O N
G -
T E
R M
O
B J
E C
T I V
E S
2007 outlook & long-term objectives
Business strategy
Company review
Appendix

Reconciliation of non-GAAP financial measures
A P
P E
N D
I X
EBITDA & Adjusted EBITDA 2003 2004 2005 2006 1Q'04 1Q'05 1Q'06 1Q'07
Net Income 87.4$ 47.7$ 24.9$ 64.2$ 17.2$ (21.0)$ 8.4$ 4.6$
Add:
Provision for income taxes 1.7 (5.1) 15.8 34.2 (0.3) (12.8) 4.9 2.4
Interest expense, net 26.1 12.5 74.2 77.8 3.2 18.2 19.7 16.9
Depreciation and amortization expense 14.8 18.9 37.7 32.6 4.0 6.6 7.5 8.3
EBITDA 130.0$ 74.0$ 152.6$ 208.8$ 24.1$ (9.0)$ 40.5$ 32.2$
Add:
Strategic repositioning 4.2 3.3 - - 0.4$ -$ -$ -$
Inventory valuation step-up - 4.4 39.6 - - 39.6 - -
Transaction-related charges and expenses - 68.8 - 16.1 - - - -
Monitoring fees - - 2.0 0.6 - 0.5 0.6 -
Gain on commodities derivative - - - - - (2.0) - -
Gain on sale of property - - - - - - - (0.6)
Other non-recurring items 18.7 13.8 - - 1.4 - - -
Adjusted EBITDA 152.9$ 164.3$ 194.2$ 225.5$ 25.9$ 29.1$ 41.1$ 31.6$
Reconciliation of non-GAAP financial measures
A P
P E
N D
I X
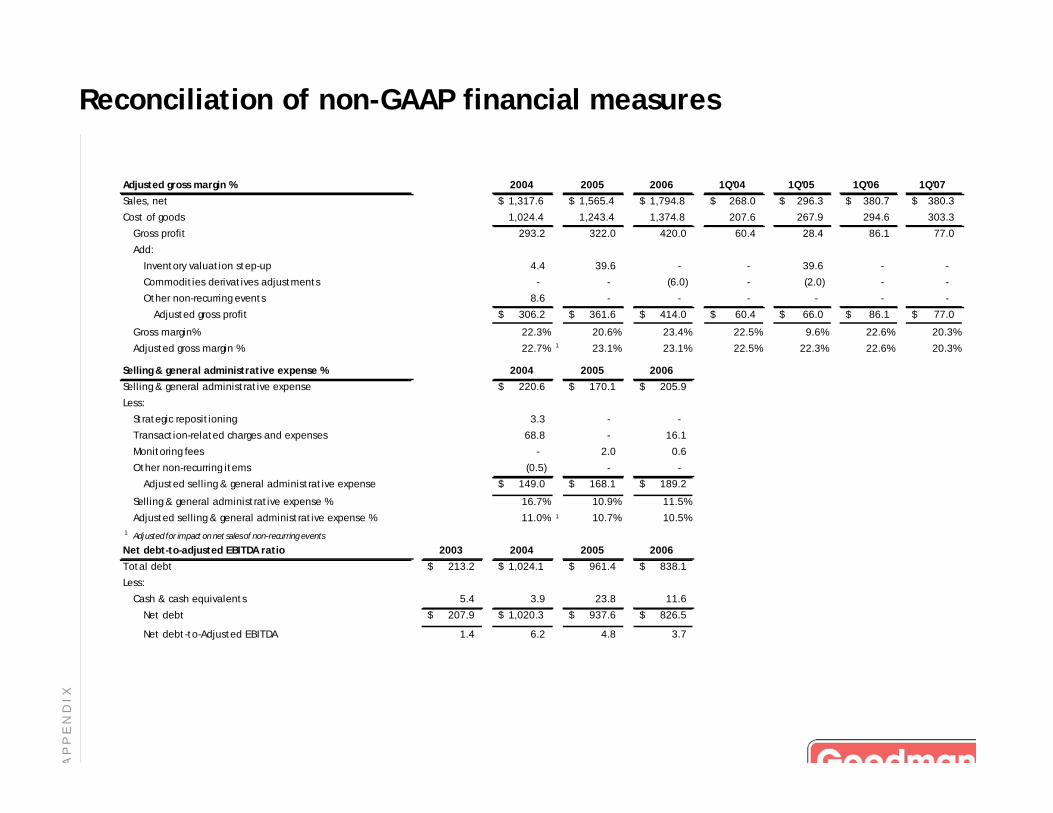
Adjusted gross margin % 2004 2005 2006 1Q'04 1Q'05 1Q'06 1Q'07
Sales, net 1,317.6$ 1,565.4$ 1,794.8$ 268.0$ 296.3$ 380.7$ 380.3$
Cost of goods 1,024.4 1,243.4 1,374.8 207.6 267.9 294.6 303.3
Gross profit 293.2 322.0 420.0 60.4 28.4 86.1 77.0
Add:
Inventory valuation step-up 4.4 39.6 - - 39.6 - -
Commodities derivatives adjustments - - (6.0) - (2.0) - -
Other non-recurring events 8.6 - - - - - -
Adjusted gross profit 306.2$ 361.6$ 414.0$ 60.4$ 66.0$ 86.1$ 77.0$
Gross margin% 22.3% 20.6% 23.4% 22.5% 9.6% 22.6% 20.3%
Adjusted gross margin % 22.7% 1 23.1% 23.1% 22.5% 22.3% 22.6% 20.3%
Selling & general administrative expense % 2004 2005 2006
Selling & general administrative expense 220.6$ 170.1$ 205.9$
Less:
Strategic repositioning 3.3 - -
Transaction-related charges and expenses 68.8 - 16.1
Monitoring fees - 2.0 0.6
Other non-recurring items (0.5) - -
Adjusted selling & general administrative expense 149.0$ 168.1$ 189.2$
Selling & general administrative expense % 16.7% 10.9% 11.5%
Adjusted selling & general administrative expense % 11.0% 1 10.7% 10.5%
1Adjusted for impact on net sales of non-recurring events
Net debt-to-adjusted EBITDA ratio 2003 2004 2005 2006
Total debt 213.2$ 1,024.1$ 961.4$ 838.1$
Less:
Cash & cash equivalents 5.4 3.9 23.8 11.6
Net debt 207.9$ 1,020.3$ 937.6$ 826.5$
Net debt-to-Adjusted EBITDA 1.4 6.2 4.8 3.7

Forward looking statements
This presentation contains forward-looking statements. The words “believe,” “expect,” “anticipate,” “intend,”“estimate” and other expressions that are predictions of or indicate future events and trends and that do not relate tohistorical matters identify forward-looking statements. Forward-looking statements also include statements about thefollowing subjects:
• changes in weather patterns and seasonal fluctuations;
• changes in customer demand related to the 13 SEER federally mandated minimum efficiency standard;
• the maturation of our new company-operated distribution centers;
• increased competition and technological changes and advances;
• increases in the cost of raw materials and components;
• our relations with our independent distributors; and
• damage or injury caused by our products.
Although forward-looking statements reflect management’s good faith beliefs, they involve known and unknown risks,uncertainties and other factors, which may cause the actual results, performance or achievements to differ materiallyfrom anticipated future results, performance or achievements expressed or implied by such forward-looking statements.We undertake no obligation to publicly update or revise any forward-looking statement, whether as a result of newinformation, future events, changed circumstances or otherwise. These forward-looking statements are subject tonumerous risks and uncertainties, including, but not limited to, the impact of general economic conditions in the regionsin which we do business; general industry conditions, including competition and product, raw material and energy prices;the realization of expected tax benefits; changes in exchange rates and currency values; capital expenditurerequirements; access to capital markets and the risks and uncertainties described under “Risk Factors” in our recent SECfilings.
A P
P E
N D
I X
J P M O R G A N H V A C C O N F E R E N C E