Embed Size (px)
Citation preview

Journal of the South African Institution of Civil Engineering • Volume 54 Number 1 April 201222
TECHNICAL PAPERJournal of the South african inStitution of civil engineeringVol 54 No 1, April 2012, Pages 22–31, Paper 778
DrLubinDaWaLubitaholdsaPhD,anMSc(Eng),andabEngdegreeinCivilEngineeringfromthetexasa&Muniversity,theuniversityofStellenboschandtheuniversityofZambiarespectively.HecurrentlyworksasaresearchScientistforthetexastransportationinstitute(tti)ofthetexasa&MuniversitySystem,uSa.Hisareaofspecialisationisroads,materialsandpavement
engineering.Hisotherresearchinterestsincludenanotechnology,wherehecurrentlyservesastheVice-PresidentfortheGlobalnetworkofnanotechnologyanditsapplicationstoroadMaterialsandPavements(Gnn-rMP).Heisanauthorofover100publications,includingeditinganaSCE-GSPbook.HealsohassubstantialindustrialexperienceasaroadengineerinSouthafricaandZambia.
Contact details:tti–thetexasa&MuniversitySystemCE-ttibldg,room303C,3135taMuCollegeStation,tX77843,uSat:+19798623356F:+19798451710E:[email protected]
branDonJaMiSonholdsMSandbSdegreesinCivilEngineeringfromtexasa&Muniversity.WhileearninghisMS,hespecialisedinfatiguecrackingmechanismsofasphaltconcrete.HecurrentlyworksasaPropulsionDesignEngineerfortheboeingCompany.
Contact details:theboeingCompany3003WestCasinoroadEverett,Wa98204MC:03-rat:+14253422059E:[email protected]
ProFaLLEXaLVarEZholdsaPhD,anMSc(Eng)andabEngdegreeinCivilEngineeringfromthetexasa&Muniversity,theuniversityofLosandes,andthenationaluniversityofColombiarespectively.HecurrentlyworksasassociateProfessorfortheuniversityofMagdalenainSantaMarta,Colombia,whereheleadstheGiiCresearchgroup.Hisareaofspecialisationis
pavementengineering,pavingmaterialsandroads.
Contact details:universityofMagdalenaCarrera32no22-08SantaMarta,Colombiat:+57-54301292F:+57-54301292E:[email protected]
ProFXiaoDiHuholdsaPhD,anMSc(Eng)andabEngdegreeinCivilEngineeringfromthetongjiuniversity,andtheHuazhonguniversityofScienceandtechnology.Heworkedalmostfiveyearsasaresearchassociateforthetexastransportationinstitute(tti)ofthetexasa&MuniversitySystem,uSa,andnowworksasanassociateProfessorforthetransportation
Air void characterisation of HMA gyratory laboratory‑moulded samples and field cores using X‑ray computed tomography (X‑ray CT) LFWalubita,bJamison,aEalvarez,XHu,CMushota
The research work presented in this paper deals with the characterisation of the internal structure of hot-mix asphalt (HMA), incorporating both gyratory compacted samples produced in the laboratory and field cores. The primary objective was to determine the optimum trim depth on either end of laboratory-moulded HMA cylindrical samples that would optimise the air void (AV) uniformity in the test specimens. The analysis was based on the X-ray Computed Tomography (X-ray CT) scanning tests and subsequent image analyses. Two Texas HMA mixes, namely a coarse-graded (Type B) and a fine-graded (Type D) mix, with gyratory samples compacted in the laboratory to two different heights (110 and 164 mm) were evaluated for their internal structure in terms of the distribution of both the AV content and AV size. Analysis of the results indicated that the coarse-graded HMA mix (Type B) and the taller (164 mm in height) gyratory-moulded samples would be more likely associated with a more heterogeneous distribution of the AV content and AV size, respectively. Supplemented with field cores, the X-ray CT results indicated significantly poor AV content distribution (i.e. higher AV content and weakest area) at the ends, particularly in the top and bottom 20 mm zone of the samples. Thus, for 150 mm diameter samples of height equal to or greater than 110 mm, trimming a minimum of 20 mm on either side of the gyratory compacted samples should be given due consideration without compromising the specimen aspect ratio and NMAS coverage requirements (NMAS – nominal maximum aggregate size). In general, test specimens should always be cut from the middle zone of the SGC moulded samples where the AV is less heterogeneously distributed.
researchCenteroftheWuhaninstituteoftechnology,China.Hisareaofspecialisationisroads,materialsandpavementengineering.Hisresearchworkisinternationallyacknowledgedandhehasauthoredover30publications.HealsohassubstantialindustrialexperienceasaroadengineerinChina.
Contact details:transportationresearchCenterWuhaninstituteoftechnology693XiongchuavenueWuhan,HubeiProvince430073Chinat:+861582 7199471E:[email protected]
CHarLESMuSHotaholdsanMSc(Eng)andabEngdegreeinCivilEngineeringfromtheStuttgartuniversityandtheuniversityofZambiarespectively.HecurrentlyworksforEstalPrideLimited,whichisaroadconsulting,contractingandresearchcompanythathefoundedin2010inZambia.Hisareaof
specialisationisroadsandpavementengineering.Hisotherresearchinterestsincludenanotechnology,wherehecurrentlyservesasatechnicalMemberoftheGlobalnetworkofnanotechnologyanditsapplicationstoroadMaterialsandPavements(Gnn-rMP).HehassubstantialindustrialexperienceasaroadengineerinZambia.
Contact details:EstalPrideLimitedPobox50402LusakaZambiat:+260977769761E:[email protected]
Keywords:hot-mixasphalt(HMa),superpavegyratorycompactor(SGC),air voids(aV),mixinternalstructure,X-raycomputedtomography(X-rayCt)

Journal of the South African Institution of Civil Engineering • Volume 54 Number 1 April 2012 23
INTRODUCTIONThe internal structure of a hot-mix asphalt (HMA) can be analysed in terms of the air voids (AV) characteristics (e.g. distribution, size, and connectivity), and the aggregate ori-entation, contact, and distribution (Alvarez et al 2010a). This HMA characteristic (inter-nal structure) is one of the key factors that greatly influences the performance of HMA, including variability in the test results of not only the gyratory laboratory-moulded sam-ples, but also of field cores. This is particu-larly critical for HMA tensile loading tests such as the direct-tension (DT) test. Thus, it is important to characterise the mix internal structure, for example via the distribution of the total AV content (or AV content) as a function of the HMA sample height, to ensure uniform mix internal structure (e.g. AV uniformity) and reduce variability in the laboratory test results (Walubita et al 2010a).
In this study, the X-ray Computed Tomography (X-ray CT) scanner and subsequent image analysis techniques were
used to characterise the AV distribution (i.e. AV content and AV size) as a function of HMA sample height (or depth). The primary objective was to determine the optimum trim depth on either end of laboratory-moulded HMA cylindrical samples that would optimise the AV uniformity in the test specimens. X-ray CT scanning tests were conducted on cylindrical HMA sam-ples (150 mm diameter) that were gyratory laboratory-moulded to two different heights of 110 and 164 mm. Two Texas HMA mixes, namely a coarse-graded (Type B) and a fine-graded (Type D) mix, were used for the study. To relate to in situ field conditions, the results of these two laboratory mixes were supplemented with X-ray CT results of field cores from in-service perpetual pavement (PP) sections.
In the paper, the X-ray CT scanner and the concepts of image analysis are described first, followed by the experimental design plan and the laboratory test results including the effects of the AV distribution on the DT
test failure mode. A summary of key findings and recommendations is then presented to wrap up the paper.
X-RAY COMPUTED TOMOGRAPHY (X-RAY CT)The X-ray CT is a non-destructive test used to capture the internal structure of materi-als. Various applications of this method have been discussed by Masad (2004) and others (Braz et al 1999; Shashidhar 1999). In HMA mixes, X-ray CT has been used successfully for characterising the influence of compac-tion on HMA internal structure (Masad et al 2009), assessing internal structure of open-graded mixes (Alvarez et al 2010a; Muraya 2007), analysing water transport character-istics (Kassem et al 2008; Masad et al 2007), and stone-on-stone contact assessment (Alvarez et al 2010b; Watson et al 2004). The X-ray CT setup at Texas A&M University, used to perform the HMA scanning for this study, is shown pictorially in Figure 1.
The setup shown in Figure 1 includes two separate systems placed in the same shielding cabinet. The mini-focus system has a 350 kV X-ray source and a linear detector, whereas the micro-focus system has a 225 kV X-ray source and an area detector. The mini-focus source can penetrate thicker and denser samples than the micro-focus source. The micro-focus system, however, provides better resolution than the mini-focus system. All the experimental measurements in this study were conducted using the mini-focus 350 kV X-ray source system. This system has the necessary power and resolution to penetrate the HMA samples and provide good quality grey scale images for subsequent analysis of AV characteristics (Kassem et al 2008).
In the X-ray CT, a test specimen is placed between an X-ray source (Figure 1) and a detector. The intensity of X-rays change from I0 before entering the specimen to I after penetrating the specimen due to the absorp-tion and scattering of radiation. The relation-ship between I0 and I is related to the linear attenuation coefficients of the materials that constitute the specimen, which are related to the densities of these materials. As such, determining the attenuation coefficients allows calculating the density distribution within a specimen section. These different densities are represented in a grey scale image of the section that consists of 256 grey intensity levels with a lower density material represented by a darker colour (e.g. AV are shown as black pixels) – see Figure 2.
In this study, images were captured every 1 mm in the vertical direction of the speci-men and with a horizontal resolution equal to approximately 0.17 mm/pixel. Images were
Figure 1 Pictorial setup of the X-ray CT scanner
250 kV X-ray source HMA specimen
225 kV X-ray source
Figure 2 Example of a grey scale X-ray CT image (Kassem et al 2008)
AggregateAir void
Asphalt-binder + Fines

Journal of the South African Institution of Civil Engineering • Volume 54 Number 1 April 201224
analysed using macros that were developed (Masad et al 2007) in Image-Pro® Plus soft-ware (Media Cybernetics 1999). Using a suit-able grey intensity threshold value, AV can be separated from other HMA mix constituents (aggregate and asphalt-binder). The threshold level represents a boundary value below which pixels in the analysed image are considered as part of the AV, whereas pixels that have intensity values above the threshold value are considered to belong to the remaining phases. The analysis is capable of quantifying the vertical and horizontal distributions of AV, size distribution of AV, and connectivity of the AV. Additional details on the image analysis and computation of these parameters are documented elsewhere (Alvarez et al 2009). Readers are referred to Masad (2004) and Masad et al (2009) for more details on the different X-ray CT configurations, operational features and other capabilities.
However, it must be stated herein that the accuracy of the image analysis is also consid-ered to be a function of the maximum scan-ning resolution of a specific X-ray CT device that is used. To attain more accurate results, some researchers proposed to apply a correc-tion scheme such as a Weibull distribution (Luo & Lytton 2011). In this study, the mini-focus 350 kV X-ray source that was used was considered to have sufficient resolution and to be accurate enough not to warrant the need for data correction adjustments.
EXPERIMENTAL DESIGNTwo Texas HMA mixes were evaluated in the laboratory; a coarse-graded Type B and a fine-graded Type D mix. The HMA mix-design characteristics are summarised in Table 1 and the aggregate gradations are shown in Figure 3. As shown in Table 1, two moulded cylindrical sample heights of 110 and 164 mm respectively were investigated, all with a diameter of 150 mm. These two heights were evaluated, because they repre-sent the mould height that is typically used for fabricating test specimens for various laboratory tests such as the Overlay Tester (OT), dynamic modulus, repeated load permanent deformation, and DT (Walubita et al 2010c). A minimum of two cylindrical replicate specimens were scanned with the X-ray CT per sample height per mix type.
Table 2 Typical as-built in situ HMA mix-design characteristics for the PP field cores
HMA mix designation Typical as-built in situ mix-design characteristics Aggregate
gradation
PFC 6.0% PG 76-22S + 1.0% lime + 0.3% cellulose fibres + igneous/limestone aggregates
Open-graded (19 mm NMAS)
SMA 6.0% PG 76-22S + 8.0% mineral filler + 1.5% lime + 0.3% cellulose fibres + 4.5% fly ash + igneous/limestone aggregates
Gap-graded (12.5 mm NMAS)
¾" SFHMA 4.4% PG 76-22 + 1.5% lime + 1.0% anti-strip + limestone aggregates Moderately coarse-graded (19 mm NMAS)
1" SFHMA 4.2% PG 70-22 + 1.5% lime + 0.5% anti-strip + limestone Coarse-graded (25 mm NMAS)
RBL 5.4% PG 64-22 + 1.5% lime + 0.5% anti-strip + limestone aggregates Dense- to fine-graded (12.5 mm NMAS)
Legend: PFC = permeable friction course; SMA = stone mastic (matrix) asphalt;SFHMA = stone-filled hot mix asphalt; RBL = rich-bottom layer; PG = performance-graded asphalt-binder; S = styrene-butadiene-styrene polymer (added as 5% by weight of asphalt-binder)
Table 1 HMA Mix-Design Characteristics
HMA Mix Aggregate Gradation Mix-Design Sample Diameter Sample Height
Replicates Scanned
Type B Coarse (22 mm NMAS) 4.3% PG 64-22 + Limestone 150 mm 110 and 164 mm ≥ 2
Type D Fine (9.5 mm NMAS) 5.0% PG 70-22 + Limestone 150 mm 110 and 164 mm ≥ 2
Legend: NMAS = nominal maximum aggregate size; PG = performance-graded asphalt-binder
Figure 3 Aggregate gradations of the Type B and D mixes
% P
assi
ng
100
80
60
40
20
0
Sieve size (mm)0.01 0.1 1 10 100
Type D (Fine-graded) Type B (Coarse-graded)
Figure 4 The Servopac SGC and some moulded samples
150 mm φ by 164 mm height
150 mm φ by 110 mm height

Journal of the South African Institution of Civil Engineering • Volume 54 Number 1 April 2012 25
Sample moulding was accomplished using a Servopac Superpave gyratory compactor (SGC) to a final target total AV content of 7±1%. This is the AV content that is typically specified for laboratory performance test-ing in Texas (TxDOT 2004; TxDOT 2011; Walubita et al 2010c). The SGC and some examples of the moulded samples are shown in Figure 4. Standard SGC moulding para-meters were used, namely 600 kPa vertical pressure and 1.25° compaction angle at a rate of 30 gyrations per minute (Walubita 2006). Moulding and compaction temperatures were consistent with the asphalt-binder PG grade (Table 1) (TxDOT 2004; TxDOT 2011). Note that the SGC mould shown in Figure 4 can handle sample heights of up 172.5 mm
As stated in the introductory section, field cores were used to supplement and relate the total AV distribution of the laboratory-moulded samples to in situ field conditions. To achieve this, cores from PP sections that represent thick multi-layered HMA pavement structures with numerous layer-lift thicknesses and constructed with both fine- and coarse-graded HMA mixes were used (Walubita et al 2010a). The typical as-built in situ HMA mix-design character-istics of these PP cores are summarised in Table 2.
Table 2 shows that the PP core consists of a wide spectrum of aggregate gradations ranging from open- (PFC) to coarse- through to fine-graded (RBL) HMA mixes. Therefore, these PP cores were deemed satisfactory to provide a field correlation to the total AV distribution structure of the laboratory-moulded samples for the mixes listed in Table 1. Accordingly, the laboratory X-ray CT results of these PP field cores are also presented and discussed in the subsequent sections of this paper. More details about PP structures are published elsewhere (Walubita et al 2010a).
RESULTS, ANALYSES AND DISCUSSIONThis section presents the results of the AV characteristics analysis for both laboratory-moulded samples and field cores. The results are presented in terms of the following: distribution of AV content and AV size for laboratory-moulded samples, distribution of AV content for field cores, and effects of AV distribution on the tensile failure mode of laboratory-moulded samples.
Distribution of air voids (AV) content: laboratory‑moulded samplesThe vertical distribution of the total AV con-tent as a function of the SGC sample height (or depth) is shown in Figures 5 and 6 for the
164 and 110 mm high samples respectively. These vertical distributions of AV content are hardly uniform and exhibit considerably high values (i.e. low density) at the top and bottom ends of the SGC samples, particular-ly in the top and bottom 20 mm zone, where
the range of the AV content is from 8% to as high as 25%. For a final target AV content of 7±1% for the laboratory samples, both Figures 5 and 6 suggest staying away from these end zones. Based on this data, trim-ming a minimum of 20 mm off the top and
Figure 5 Vertical distribution of AV content for 164 mm high samples
Sam
ple
heig
ht (m
m)
180
160
140
100
120
80
60
40
0
20
% Air Void0 5 6 8 10 15 20 25
150
mm
dia
met
er b
y 16
4 m
m h
eigh
t
Top 20 mm
Bottom 20 mm Type BType D
Figure 7 Vertical distribution of AV content versus samples height
Figure 6 Vertical distribution of AV content for 110 mm high samples
Sam
ple
heig
ht (m
m)
120
100
80
60
40
0
20
% Air Void0 5 6 8 10 15 20 30
150
mm
dia
met
er b
y 11
0 m
m h
eigh
t Top 20 mm
Bottom 20 mmType B
Type D
25
Sam
ple
heig
ht (m
m)
200
160
140
100
120
80
60
40
0
20
% Air Void0 5 6 8 10 15 20 30
Type D, 164 mm180
25
Type B, 164 mm
Type D, 110 mm
Type B, 110 mm
Journal of the South African Institution of Civil Engineering • Volume 54 Number 1 April 201226
bottom ends of the SGC laboratory-moulded samples may thus be warranted.
Additionally, the taller 164 mm SGC sample (Figure 5) also exhibited much higher AV content values in the middle zone, and their AV content distribution is generally more heterogeneous than that of the shorter 110 mm high samples. Although lower than the 7±1% target in the central portion of the specimen, the AV content distribution for the 110 mm high samples (Figure 6) appears to be less heterogeneous, particularly in the middle zone and does not exhibit any signifi-cant difference between the coarse-graded Type B and the fine-graded Type D mix (Walubita et al 2010a).
Overall, these results (particularly Figure 6) indicate that test specimens should generally be cut from the middle zone of the SGC-moulded samples where the AV content is less heterogeneously distributed, i.e. avoid the edges. For example, a single test specimen of 38 mm thickness for the overlay tester would easily be cut from the middle zone of the SGC-moulded sample shown in Figure 6 with reasonable uniformity in terms of AV content distribution.
As indicated in Figure 7, taller moulding heights would be more prone to heterogene-ous AV content distribution and variability than shorter moulding heights (having better AV content uniformity in the middle zone of the SGC samples). Thus, wherever possible and under the current compaction SGC parameters, shorter compaction moulding heights should always be given preference to promote the AV content uniformity in the test specimens.
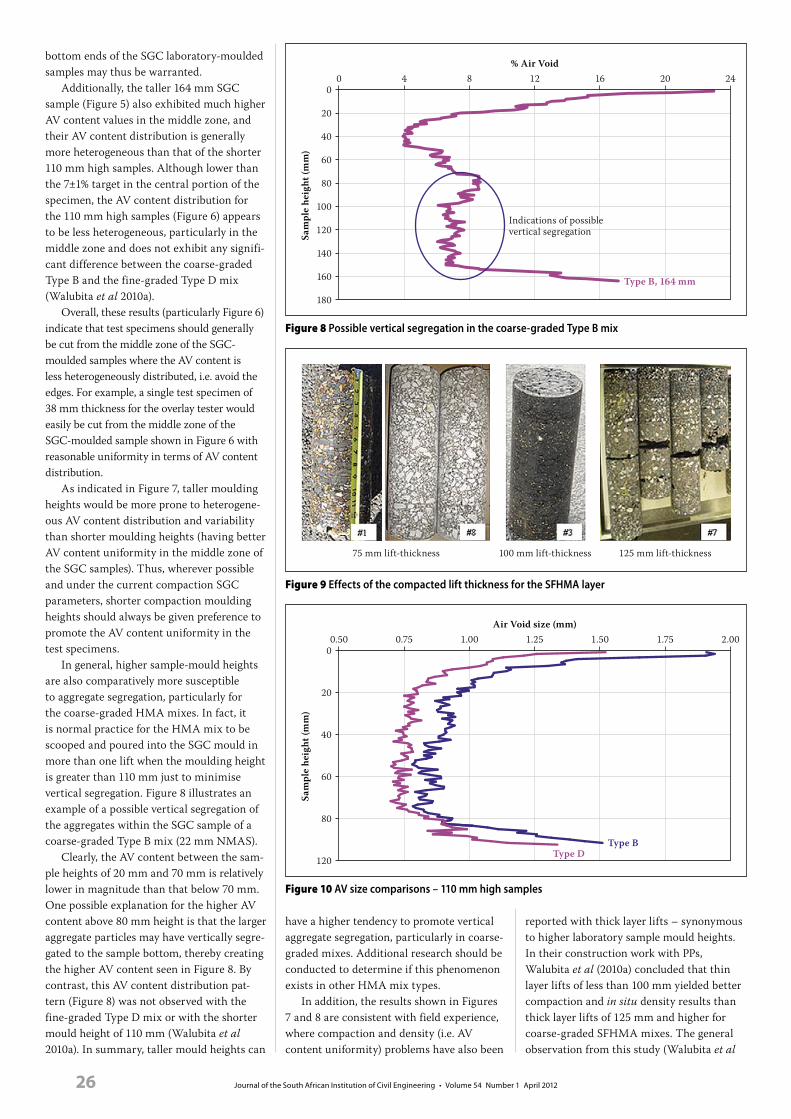
In general, higher sample-mould heights are also comparatively more susceptible to aggregate segregation, particularly for the coarse-graded HMA mixes. In fact, it is normal practice for the HMA mix to be scooped and poured into the SGC mould in more than one lift when the moulding height is greater than 110 mm just to minimise vertical segregation. Figure 8 illustrates an example of a possible vertical segregation of the aggregates within the SGC sample of a coarse-graded Type B mix (22 mm NMAS).
Clearly, the AV content between the sam-ple heights of 20 mm and 70 mm is relatively lower in magnitude than that below 70 mm. One possible explanation for the higher AV content above 80 mm height is that the larger aggregate particles may have vertically segre-gated to the sample bottom, thereby creating the higher AV content seen in Figure 8. By contrast, this AV content distribution pat-tern (Figure 8) was not observed with the fine-graded Type D mix or with the shorter mould height of 110 mm (Walubita et al 2010a). In summary, taller mould heights can
have a higher tendency to promote vertical aggregate segregation, particularly in coarse-graded mixes. Additional research should be conducted to determine if this phenomenon exists in other HMA mix types.
In addition, the results shown in Figures 7 and 8 are consistent with field experience, where compaction and density (i.e. AV content uniformity) problems have also been
reported with thick layer lifts – synonymous to higher laboratory sample mould heights. In their construction work with PPs, Walubita et al (2010a) concluded that thin layer lifts of less than 100 mm yielded better compaction and in situ density results than thick layer lifts of 125 mm and higher for coarse-graded SFHMA mixes. The general observation from this study (Walubita et al
Figure 9 Effects of the compacted lift thickness for the SFHMA layer
100 mm lift-thickness 125 mm lift-thickness75 mm lift-thickness
Figure 8 Possible vertical segregation in the coarse-graded Type B mix
Sam
ple
heig
ht (m
m)
180
160
140
100
120
80
60
40
0
20
% Air Void0 4 8 16 20 24
Type B, 164 mm
12
Indications of possible vertical segregation
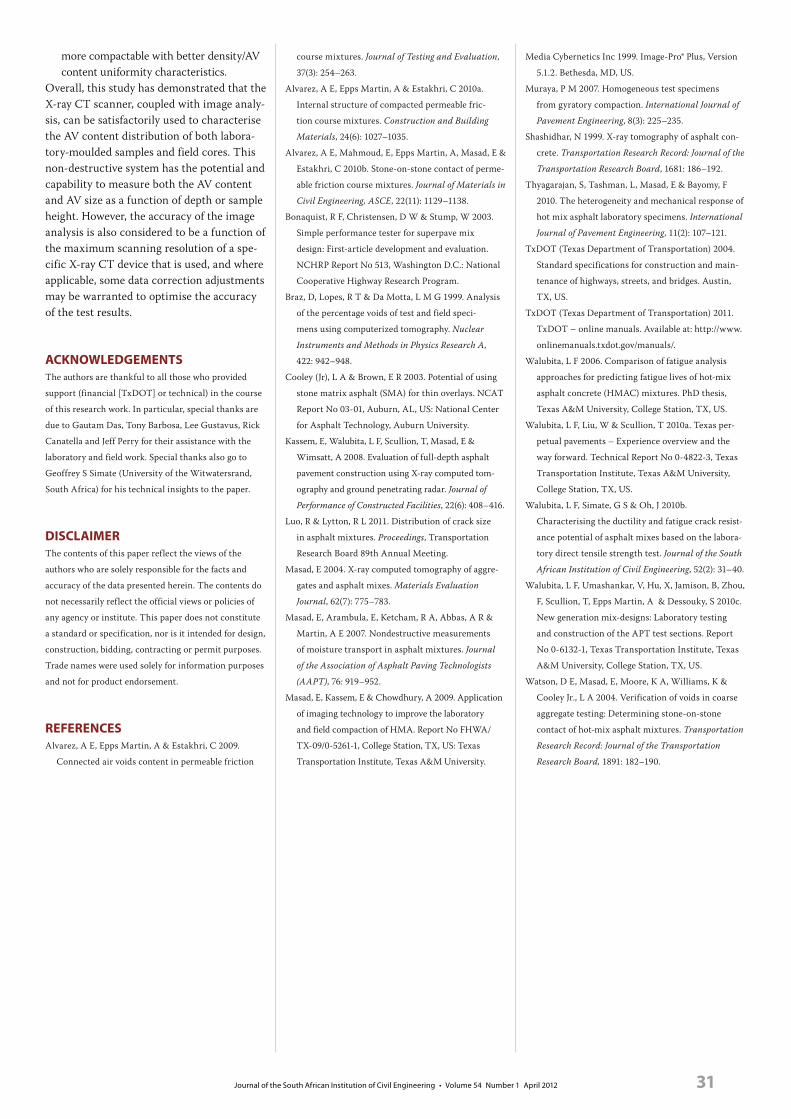
Figure 10 AV size comparisons – 110 mm high samples
Sam
ple
heig
ht (m
m)
120
80
60
40
0
20
Air Void size (mm)0.50 1.25 1.75 2.00
Type D
0.75 1.00 1.50
Type B

Journal of the South African Institution of Civil Engineering • Volume 54 Number 1 April 2012 27
2010a) was that compacting at the lower lift thickness such as 75 mm yielded a more constructable mix than using thicker lifts greater than 100 mm, as gauged by attain-ing the target in-place density and layer interface bonding. Furthermore, compacting
at the lower lift thickness also required less compactive effort in terms of the rolling pattern and number of passes. Compacting at a greater lift thickness tended to cause the mixes to segregate vertically, creating highly voided areas capable of detrimentally
trapping moisture. Figure 9 shows a com-parative illustration of the compacted lift thickness for a 25 mm NMAS coarse-graded SFHMA layer whose in situ target density was 96% (Walubita et al 2010a).
Figure 9 shows better construction quality for the 75 mm and 100 mm layer lift-thicknesses (cores #1, #8 and #3) with no visual evidence of vertical segregation or debonding. Also, the measured average AV content using the traditional water-displacement method at 7.3% was fairly reasonable as opposed to about 12.6% for the 125 mm layer lift-thickness (cores #7). Synonymous to the conclusions made for the results in Figures 7 and 8, Walubita et al (2010a) also recommended that a thin-ner layer-lift thickness (i.e. ≤ 100 mm) was appropriate for the coarse-graded SFHMA mixes in terms of yielding acceptable field compaction and in situ density results during construction (Walubita et al 2010a). In either case, however, the aspect ratio and NMAS coverage requirements must still be met as specified below for laboratory-moulded sam-ples and field compaction layer-lift thickness respectively (Bonaquist et al 2003; Cooley (Jr) & Brown 2003):
■ Aspect ratio (ar) (longest side divided by the shortest side): 1.5 ≤ ar ≤ 2.0
■ NMAS coverage (NMAS_C):1.5 × NMAS ≤ NMAS_C ≤ 3.0 × NMAS
Distribution of air voids (AV) size: laboratory‑moulded samplesInterestingly for SGC samples of similar height, there was no significant difference in the trends of the vertical AV content distri-bution (Figures 5 through 7) or total AV con-tent values (at an average of 8.3%) between the Type B and D mixes. By contrast, and as shown in Figures 10 through 13, there was a considerable difference in the AV sizes. The more coarse-graded Type B mix exhibited relatively larger AV sizes in magnitude com-pared to the more fine-graded Type D mix, as theoretically expected.
Based on the vertical distribution of the AV size shown in Figures 10 and 11, the Type B mix exhibited larger AV size values across the entire SGC sample height than that of the Type D mix. In fact, the average AV size was 0.95 and 0.82 mm for the Type B and Type D samples respectively. Also the variability of the AV size, measured in terms of the coefficient of variation (COV), for the Type B mix (i.e. COV = 28%) was higher than that for the Type D mix (COV = 18%). Based on these COV values, it would be expected that the Type B mix would be associated with more AV size variability during SGC sample fabrication as when compared to the Type D mix.
160
140
100
120
80
60
40
20
Figure 11 AV size comparisons – 164 mm high samples
Sam
ple
heig
ht (m
m)
180
0
Air Void size (mm)0.50 1.25 1.75
Type D
0.75 1.00 1.50
Type B
160
140
100
120
80
60
40
20
Sam
ple
heig
ht (m
m)
180
0
Air Void size (mm)0.50 1.25 1.75
Type D, 164 mm
0.75 1.00 1.50
Type D, 110 mm
Figure 12 Vertical distribution of AV size for the Type D mix
160
140
100
120
80
60
40
20
Sam
ple
heig
ht (m
m)
180
0
Air Void size (mm)0.50 1.25 1.75 2.250.75 1.00 1.50
Figure 13 Vertical distribution of AV size for the Type B mix
2.00
Type B, 164 mm
Type B, 110 mm

Journal of the South African Institution of Civil Engineering • Volume 54 Number 1 April 201228
Compared to the fine-graded mixes, coarse-graded mixes with larger AV sizes would thus be more susceptible to oxidative ageing and/or moisture damage due to the possibilities of easy air or water infiltration. However, future research based on image analysis should focus on the computation of AV connectivity (i.e. content and vertical distribution) to validate this hypothesis. The connected AV serves as paths for water movement (defining the mix permeability) and air circulation through the mix, which undesirably creates favourable conditions
for oxidative ageing and/or moisture dam-age. In addition, it can intuitively be stated that coarse-graded mixes require more meticulous work and caution during labora-tory sample fabrication. As subsequently discussed, similar results were also observed with field cores.
As discussed for the vertical distribution of the AV content, Figures 12 and 13 suggest that taller moulding heights would be more prone to heterogeneous distributions of the AV size and variability than shorter mould-ing heights. These findings further support
the convenience of preferring (based on the current compaction SGC parameters) shorter compaction mould heights to promote uni-formity in the internal structure of the SGC samples. One of the possible causes of having higher AV content and AV size at the ends, in addition to aggregate segregation, is the restriction of the top and bottom metallic surfaces of the SGC device that limits the movement of the aggregate particles and decreases the compaction efficiency at these zones of the sample (Thyagarajan et al 2010).
Distribution of air voids (AV) content: field coresFigure 14 shows the AV content distribution of a core extracted from a newly constructed PP section prior to opening to conventional traffic (Walubita et al 2010c).
The SFHMA layers represent coarse-graded mixes of 25 mm NMAS, whose target in situ density was 96%, and was compacted in 75 mm layer lift-thickness. The RBL layer represents a dense- to fine-graded mix of 12.5 mm NMAS, whose target in situ density was 97% at a layer lift-thickness of 50 mm (Walubita et al 2010a). The aggregate grada-tions for these HMA mixes are shown in Figure 15.
As echoed by the laboratory AV content determined using traditional methods, Figure 14 shows that the AV content for the RBL (fine-graded) is lower than that for the SFHMA layers in magnitude. This is consistent with theoretical expectations and supports preceding results. Similarly, the AV content seems to be relatively higher in magnitude at the ends – in this case at the bottom zones of the layer and lift interfaces, among other reasons possibly due to vertical segregation of the aggregates, which is illus-trated by the example shown subsequently in Figure 16 (Walubita et al 2010c).
The AV content distribution pattern depicted in Figure 8 for the SGC sample of the coarse-graded Type B mix (22 mm NMAS) suggested the possible occurrence of vertical segregation in the aggregates, i.e. larger aggregate particles gravitationally moving to the bottom. Figure 16 provides this visual evidence with a core from a PP section. This core consists of a coarse-graded SFHMA mix that was compacted in 125 mm layer-lift thicknesses, with a target in situ density of 96%. The aggregate gradation was shown in Figure 15. Clearly, this figure high-lights the potential construction problems of thicker layer-lift thicknesses, particularly for coarse-graded mixes such as the SFHMA mixes. If water infiltrates through and gets trapped within this high AV content mix, it could undesirably damage the HMA pave-ment (Walubita et al 2010a).
Figure 14 Vertical distribution of AV content for field cores – coarse vs fine-graded
Dep
th (m
m)
200
140
160
180
120
100
40
60
80
20
0
% Air Void25.00 2.5 5.0 7.5 10.0 12.5 15.0 17.5 20.0 22.5
1" SFHMAAverage lab AV = 6.7%75 mm thick
Top
RBL-½" SuperpaveAverage lab AV = 4.5%50 mm thick
1" SFHMAAverage lab AV = 6.9%75 mm thick
Figure 15 Aggregate gradations of the 1" SFHMA and RBL mixes
% P
assi
ng
100
80
60
40
20
0
Sieve size (mm)0.01 0.1 1 10 100
RBL (dense-graded) 1" SFHMA (coarse-graded)

Journal of the South African Institution of Civil Engineering • Volume 54 Number 1 April 2012 29
Figure 17 shows another comparison of the vertical distribution of AV content for different layers of an approximately 525 mm thick multi-layered PP core, with the fine-graded RBL exhibiting the most AV uniform-ity (i.e. the lowest AV content distribution variability).
Because of its functionalities within the PP structure, such as preventing bottom-up fatigue cracking and upward water intru-sion from the base/subgrade, the RBL is typically compacted to a relatively higher in situ target density than other layers (i.e. 97% versus 96% specified for SMA and SFHMA, or 80% specified for PFC mixes). Combined with its fine aggregate gradation and rich asphalt-binder content (average 5.4%), this partly accounts for its superior AV content uniformity compared to the other layers (Walubita et al 2010a). The comparative aggregate gradations for these PP cores are illustrated in Figure 18, with the RBL having the finest aggregate gradation.
Just like the RBL in Figure 18, Table 1 indicated a finer aggregation gradation (Figure 3) and more asphalt-binder content for the Type D mix compared to the Type B mix. Conversely, and just like in Figure 17, the fine-graded and rich Type D mix exhib-ited better AV uniformity than the coarse-graded Type B mix (refer to the preceding results in Figures 5 through 13).
The PFC, as theoretically expected, shows the highest AV content values, rang-ing from about 10% to 25%. Again, the AV content peak at the layer- and lift-interfaces is clearly visible, particularly for the coarse-graded SFHMA mixes. Actually, if the SFHMA layers are analysed separately, their AV distribution patterns do not differ significantly from Figures 5 through 8 for the laboratory-moulded samples. These high AV content peaks suggest potential for debond-ing problems, which is undesirable. In fact, debonding problems were experienced with some SFHMA cores – see Figure 9 (Walubita et al 2010c).
In addition to possible vertical aggregate segregation, the heterogeneous AV content distribution exhibited in Figures 14 through 17 may have been contributed by many other factors, including but not limited to the following:
■ Temperature segregation within the HMA mix during construction. At the bottom of the HMA mix, the existing layer (which is at a relatively lower tem-perature) may be promoting rapid cooling and therefore low density at the interface. At the surface, the compactor wheels, as well as the effects of the environment, may have a rapid cooling effect on the top portion of the HMA mix.
Figure 16 Effects of vertical segregation of aggregates on the AV content distribution
Dep
th (m
m)
120
% Air void0
20
40
60
80
100
02.5 17.512.510.07.55.0 15.0
140
1"SFHMAC
Figure 17 Vertical distribution of AV content in field cores-various layer comparison
Dep
th (m
m)
500
% Air void0
250
300
350
400
450
02515105 20
550
50
100
150
200
PFC
SMA
¾" SFHMA
1" SFHMA
1" SFHMA
1" SFHMA
RBL
Top
Figure 18 Aggregate gradations of the PFC, SMA, SFHMA and RBL mixes
Sieve size (mm)
100
% P
assi
ng
80
60
40
20
00.01 0.1 1 10 100
PFC (Open-graded)SMA (Gap-graded)RBL (Dense-graded)1" SFHMA (Coarse-graded)
¾" SFHMA (Moderately coarse-graded)

Journal of the South African Institution of Civil Engineering • Volume 54 Number 1 April 201230
■ Heterogeneous distribution of the compac-tion energy, which is applied at the surface and dissipates decreasingly with depth.
■ In the case of the coarse-graded SFHMA mixes, conjecture is that the large angular aggregate particles do not receive suf-ficient compactive energy at the bottom of thicker lifts to promote adequate reori-entation, and thus contribute to the poor AV distribution structure. This problem is exacerbated by the low asphalt-binder content (Table 2) that limits the effective lubrication to allow reorientation of the aggregate particles (Walubita et al 2010a).
Effects of air voids (AV) distribution on the tensile failure modeFigure 19 shows a typical vertical distribu-tion of AV content in a 164 mm high SGC compacted cylindrical sample (Type D mix) and a side by side comparison including the tensile failure zones for a specimen tested under DT loading.
In Figure 19, the red horizontal bounda-ries represent the AV content distribution for cutting the sample to 150 mm high, while the green boundaries represent the AV content distribution for cutting the sample to 100 mm high HMA test specimens. With respect to the target AV content tolerance, the dashed blue and red lines represent the lower and upper allowable limits respec-tively; i.e. 7±0.5% for this particular case for DT testing (Walubita et al 2010a).
Clearly, Figure 19 shows that the AV content distribution is not homogeneous, leading to weaker zones at the ends of the
sample. For DT testing, the tensile failure zone should be in the middle, as exhibited by the 100 mm high test specimen in Figure 19 (Walubita et al 2010b). End-failures, such as the one exhibited by the 150 mm high test specimen (on the right side of Figure 19), are undesirable. For the 150 mm high specimen, Figure 19 in fact shows a maximum trim depth of about 10 mm, which yielded unde-sired results with the DT tensile testing. A minimum trim depth of 20 mm would likely yield the desired failure mode as evidenced by the 100 mm high test specimen. Similarly, the irregular distribution of the AV content in the HMA mix specimens can lead to problems for testing and evaluation of other HMA characteristic properties, such as permanent deformation resistance, stiffness, and/or moisture damage susceptibility.
CONCLUSIONS AND RECOMMENDATIONSBased on the research work that was con-ducted and the data presented in this paper, the following conclusions and recommenda-tions were drawn:
■ In general, there is potential for aggregate vertical segregation and AV content vari-ability in SGC samples moulded to taller heights in the laboratory. Where possible, shorter mould heights that would allow sufficient trim depth should be used so as to optimise the AV content uniformity of HMA test specimens. For the SGC compactor and sample types considered in this study, a sample height of less than
164 mm – that does not compromise both the aspect ratio and NMAS coverage requirements – would be preferred.
■ For the type of SGC samples discussed in this paper (i.e. 110 mm and 164 mm high with 150 mm diameter), trimming a minimum of 20 mm on either side is recommended. This is envisaged to optimise the total AV content uniform-ity. In general, test specimens should always be cut from the middle zone of the SG-moulded samples where the total AV content is less heterogeneously distributed. With shorter mould heights, however, caution should be exercised to satisfy the test specimen aspect ratio and NMAS coverage requirements.
■ As evidenced by the field core data presented in this paper, there is also a high potential for compaction problems, including aggregate vertical segregation and in situ density variations, when opt-ing for thicker layer-lift thicknesses in the field during construction. Where pos-sible, thin layer-lift thicknesses should be used that will optimise the construction quality without compromising the NMAS coverage requirements.
■ For the materials and HMA mixes evalu-ated in this study, the coarse-graded mixes exhibited more susceptibility to aggregate vertical segregation and AV content variability with larger AV sizes than fine-graded mixes. Thus, care should be exercised both in the laboratory and field to optimise density/AV content uniformity. Fine-graded mixes on the other hand are
Figure 19 DT failure zones and vertical distribution of AV content (Type D mix) (Walubita et al 2010c)
180
Dep
th (m
m)
% Air void2520151050
0
20
40
60
80
100
120
140
160
6.5%
7.5%
6"
4"
100 mm high 150 mm high
Journal of the South African Institution of Civil Engineering • Volume 54 Number 1 April 2012 31
more compactable with better density/AV content uniformity characteristics.
Overall, this study has demonstrated that the X-ray CT scanner, coupled with image analy-sis, can be satisfactorily used to characterise the AV content distribution of both labora-tory-moulded samples and field cores. This non-destructive system has the potential and capability to measure both the AV content and AV size as a function of depth or sample height. However, the accuracy of the image analysis is also considered to be a function of the maximum scanning resolution of a spe-cific X-ray CT device that is used, and where applicable, some data correction adjustments may be warranted to optimise the accuracy of the test results.
ACKNOWLEDGEMENTSThe authors are thankful to all those who provided
support (financial [TxDOT] or technical) in the course
of this research work. In particular, special thanks are
due to Gautam Das, Tony Barbosa, Lee Gustavus, Rick
Canatella and Jeff Perry for their assistance with the
laboratory and field work. Special thanks also go to
Geoffrey S Simate (University of the Witwatersrand,
South Africa) for his technical insights to the paper.
DISCLAIMERThe contents of this paper reflect the views of the
authors who are solely responsible for the facts and
accuracy of the data presented herein. The contents do
not necessarily reflect the official views or policies of
any agency or institute. This paper does not constitute
a standard or specification, nor is it intended for design,
construction, bidding, contracting or permit purposes.
Trade names were used solely for information purposes
and not for product endorsement.
REFERENCESAlvarez, A E, Epps Martin, A & Estakhri, C 2009.
Connected air voids content in permeable friction
course mixtures. Journal of Testing and Evaluation,
37(3): 254–263.
Alvarez, A E, Epps Martin, A & Estakhri, C 2010a.
Internal structure of compacted permeable fric-
tion course mixtures. Construction and Building
Materials, 24(6): 1027–1035.
Alvarez, A E, Mahmoud, E, Epps Martin, A, Masad, E &
Estakhri, C 2010b. Stone-on-stone contact of perme-
able friction course mixtures. Journal of Materials in
Civil Engineering, ASCE, 22(11): 1129–1138.
Bonaquist, R F, Christensen, D W & Stump, W 2003.
Simple performance tester for superpave mix
design: First-article development and evaluation.
NCHRP Report No 513, Washington D.C.: National
Cooperative Highway Research Program.
Braz, D, Lopes, R T & Da Motta, L M G 1999. Analysis
of the percentage voids of test and field speci-
mens using computerized tomography. Nuclear
Instruments and Methods in Physics Research A,
422: 942–948.
Cooley (Jr), L A & Brown, E R 2003. Potential of using
stone matrix asphalt (SMA) for thin overlays. NCAT
Report No 03-01, Auburn, AL, US: National Center
for Asphalt Technology, Auburn University.
Kassem, E, Walubita, L F, Scullion, T, Masad, E &
Wimsatt, A 2008. Evaluation of full-depth asphalt
pavement construction using X-ray computed tom-
ography and ground penetrating radar. Journal of
Performance of Constructed Facilities, 22(6): 408–416.
Luo, R & Lytton, R L 2011. Distribution of crack size
in asphalt mixtures. Proceedings, Transportation
Research Board 89th Annual Meeting.
Masad, E 2004. X-ray computed tomography of aggre-
gates and asphalt mixes. Materials Evaluation
Journal, 62(7): 775–783.
Masad, E, Arambula, E, Ketcham, R A, Abbas, A R &
Martin, A E 2007. Nondestructive measurements
of moisture transport in asphalt mixtures. Journal
of the Association of Asphalt Paving Technologists
(AAPT), 76: 919–952.
Masad, E, Kassem, E & Chowdhury, A 2009. Application
of imaging technology to improve the laboratory
and field compaction of HMA. Report No FHWA/
TX-09/0-5261-1, College Station, TX, US: Texas
Transportation Institute, Texas A&M University.
Media Cybernetics Inc 1999. Image-Pro® Plus, Version
5.1.2. Bethesda, MD, US.
Muraya, P M 2007. Homogeneous test specimens
from gyratory compaction. International Journal of
Pavement Engineering, 8(3): 225–235.
Shashidhar, N 1999. X-ray tomography of asphalt con-
crete. Transportation Research Record: Journal of the
Transportation Research Board, 1681: 186–192.
Thyagarajan, S, Tashman, L, Masad, E & Bayomy, F
2010. The heterogeneity and mechanical response of
hot mix asphalt laboratory specimens. International
Journal of Pavement Engineering, 11(2): 107–121.
TxDOT (Texas Department of Transportation) 2004.
Standard specifications for construction and main-
tenance of highways, streets, and bridges. Austin,
TX, US.
TxDOT (Texas Department of Transportation) 2011.
TxDOT – online manuals. Available at: http://www.
onlinemanuals.txdot.gov/manuals/.
Walubita, L F 2006. Comparison of fatigue analysis
approaches for predicting fatigue lives of hot-mix
asphalt concrete (HMAC) mixtures. PhD thesis,
Texas A&M University, College Station, TX, US.
Walubita, L F, Liu, W & Scullion, T 2010a. Texas per-
petual pavements – Experience overview and the
way forward. Technical Report No 0-4822-3, Texas
Transportation Institute, Texas A&M University,
College Station, TX, US.
Walubita, L F, Simate, G S & Oh, J 2010b.
Characterising the ductility and fatigue crack resist-
ance potential of asphalt mixes based on the labora-
tory direct tensile strength test. Journal of the South
African Institution of Civil Engineering, 52(2): 31–40.
Walubita, L F, Umashankar, V, Hu, X, Jamison, B, Zhou,
F, Scullion, T, Epps Martin, A & Dessouky, S 2010c.
New generation mix-designs: Laboratory testing
and construction of the APT test sections. Report
No 0-6132-1, Texas Transportation Institute, Texas
A&M University, College Station, TX, US.
Watson, D E, Masad, E, Moore, K A, Williams, K &
Cooley Jr., L A 2004. Verification of voids in coarse
aggregate testing: Determining stone-on-stone
contact of hot-mix asphalt mixtures. Transportation
Research Record: Journal of the Transportation
Research Board, 1891: 182–190.