Embed Size (px)
Citation preview
Journal of Physical Science, Vol. 25(2), 97–112, 2014
© Penerbit Universiti Sains Malaysia, 2014
Slow Pyrolysis of Oil Palm Empty Fruit Bunches for Biochar Production and Characterisation
Adilah Shariff,* Nur Syairah Mohamad Aziz and Nurhayati Abdullah
School of Physics, Universiti Sains Malaysia,
11800 USM Pulau Pinang, Malaysia
*Corresponding author: [email protected]
ABSTRACT: The objective of this study was to investigate the influence of the ash content of oil palm empty fruit bunch (EFB) feedstock on the biochar yield percentage produced by slow pyrolysis experiments. The characteristics of the biochar produced were also investigated. Proximate analysis, elemental analysis and lignocellulosic analysis of EFB feedstock were performed. High heating values (HHVs) were determined using a bomb calorimeter. The ash content of the EFB feedstock was varied by washing. The properties of the washed and unwashed EFBs were analysed via thermogravimetric analysis (TGA) for thermal degradation behaviour. EFB feedstocks in the range of 1.60 to 5.29 mf wt% ash content were pyrolysed at 550°C with 1 h residence time. The heating rate was set at 5°C min–1. The biochars produced by slow pyrolysis experiments were analysed by proximate, elemental, scanning electron microscopy (SEM) and Brunauer-Emmett-Teller (BET) surface area analyses. The EFB feedstock with the lowest ash content (1.60 mf wt%) produced the lowest biochar yield percentage (23.05 wt %) with the highest fixed carbon percentage (88.34 mf wt%). Reduction of the EFB feedstock ash content from 5.29 to 1.60 mf wt% produced significant changes in the morphological structure of the resulting biochar. The maximum BET surface area of the EFB biochar, obtained from the EFB feedstock with 2.21 mf wt% ash content, was found to be 11.1200 m2 g–1. Keywords: Biochar, empty fruit bunches, slow pyrolysis, washing method, ash content 1. INTRODUCTION
Biomass is one of the renewable energy resources. Generally, biomass
refers to non-fossilised and biodegradable organic material originating from plants, animals or microorganisms.1 Biomass resources include various natural and derived materials, such as woody and herbaceous species, wood wastes, bagasse, agricultural and industrial residues, waste paper, municipal solid waste, sawdust, biosolids, grass, waste from food processing, animal wastes, aquatic plants and algae.2 The utilisation of biomass as an energy source offers a way to reduce carbon dioxide (CO2) from the atmosphere and help to mitigate climate change by reducing greenhouse gases.

Slow Pyrolysis of Oil Palm EFB 98
Oil palm wastes are high-potential biomass energy resources available in Malaysia because the country is the second largest producer and exporter of oil palm products in the world. In 2011, the oil palm planted area reached approximately 5 million hectares, and production mills generate a large amount of solid wastes such as extracted oil palm fibres, palm shells, palm stones and empty fruit bunches (EFB).3,4 Most of these wastes, including EFBs, are dumped in the mill area due to their high production rate, together with their currently limited utilisation and application.5 Therefore, the utilisation of oil palm EFBs as biomass feedstock is a good way to reduce waste management problems and decrease the emission of methane (CH4) and nitrous oxide (N2O) from the degradation of dumped EFBs.
Biochar is a product of thermal decomposition processes such as the slow
pyrolysis process for organic materials, e.g., biomass, in the total absence or limited supply of oxygen (O2) and at a relatively low temperature (< 700°C).6,7 Biochar has been produced with the intent of being applied to soil. The application of biochar to soil improves soil productivity, reduces the emission of N2O from soil, increases water holding capacity and has the potential to become a long-term carbon sink due to its high chemical stability, high carbon content and potential to reside in the soil for a long time.7–9 The types and properties of biochar and soil determine the effectiveness of the use of biochar for soil treatment. The properties, composition and yield percentage of biochar depends on many factors. The initial state and type of biomass feedstock used (chemical composition, ash composition and size), pre-treatment process (drying, washing or crushing) and pyrolysis parameters (temperature, heating rate and residence hour) are among the major factors that influence the characteristics of the biochar produced.10,11 Thus, the investigation and study of the characteristics of biochar is important so that it may be coordinated with the requirements of its application.
In this study, the influence of the ash content of EFB feedstock on
biochar production from slow pyrolysis experiments was investigated. The characteristics of the raw EFBs used and the biochar produced were identified.
2. EXPERIMENTAL 2.1 Feedstock Preparation
EFB samples used in this study were collected from Malpom Industry
Sdn. Bhd., Nibong Tebal, Pulau Pinang, Malaysia. The EFBs were received in the wet condition and weighed 2.2 kg. Normally, the EFBs took more than 24 h of drying to reduce their moisture content until it was less than 10 mf wt%.12 To avoid the growth of orange fungus and grey mould, the bunches were dried in a

Journal of Physical Science, Vol. 25(2), 97–112, 2014 99
conventional oven at 105°C for 48 h. The abbreviation "mf wt%" refers to the moisture free weight percentage, which is similar to the dry basis concept. Random portions of the dried bunch were selected and grounded for moisture determination according to ASTM 871 to ensure that their moisture was less than 10 mf wt%. The moisture content was calculated using the following equation:
initial weight of sample - final weight of sampleMoisture content (mf wt%) 100final weight of sample
= × (1)
where (initial weight of sample–final weight of sample) is equal to weight of water in the sample.
Then, the bunch was manually chopped into smaller sizes of
approximately 5–10 cm and stored in an air-tight container prior to the pyrolysis process.
2.2 Feedstock Analysis
Preliminary analysis was conducted to investigate the characteristics of
EFB samples. Proximate analysis, elemental analysis, calorific value determination, lignocellulosic percentage determination and thermogravimetric analysis (TGA) were performed. Proximate analysis was performed via ASTM E871 for moisture content,13 ASTM E872 for volatile matter14 and ASTM E1755-01 for ash content determination.15 Fixed carbon was calculated by subtracting the sum of the ash content and volatile matter from 100%. This result was expressed in moisture-free weight percentage (mf wt%). Elemental analysis was performed using a Perkin Elmer 2400 analyser. The high heating value (HHV) was determined using a Nenken-type adiabatic bomb calorimeter. In addition, low heating values (LHVs) were determined using the following equation:
LHV = HHV (1 M) 2.447M− − (2) where M is the wet basis moisture content of feedstock expressed as a decimal mass fraction.16
The lignocellulosic components of EFB feedstock (lignin, cellulose and
hemicelluloses) were analysed according to the method of the Technical Association of the Pulp and Paper Industry (TAPPI). The determination of holocellulose, cellulose and lignin was performed following standard methods for TAPPI T6m-59 for extraction,17 TAPPI T9m-54 for holocellulose and cellulose (Cross-Beran cellulose analysis)18 and TAPPI T13m-54 for lignin (Klason lignin

Slow Pyrolysis of Oil Palm EFB 100
analysis).19 For hemicelluloses, different percentages of holocellulose and cellulose were determined.
TGA was performed using a Perkin Elmer Thermogravimetric Analyzer
TGA7 with unwashed and washed EFB feedstock samples.
2.3 Washing Procedure A washing treatment was performed to produce feedstock with different
ash contents. Four different washing methods were applied to the EFB samples. Each method was distinguished by the amount of water used per 100 g sample, residence time of the washing treatment (in hours), washing method and water temperature. The EFB size was fixed at approximately 5–8 cm, and distilled water was used for all washing procedures. The washing procedure is summarised in Table 1. The washed EFB samples were dried in a conventional oven until the moisture content percentage was less than 10 mf wt%.
Table 1: Summary of washing procedure of EFB feedstock.
EFB sample Washing method
1 The feedstock was not subjected to any washing treatment 2 Stir by manual 100 g of EFB feedstock in 5 l distilled water for 1 min at ambient
temperature 3 Soak 100 g of EFB feedstock in 5 l distilled water for 10 min at ambient temperature 4 Soak 100 g of EFB feedstock in 5 l distilled water for 20 min at ambient temperature 5 Soak 100 g of EFB feedstock in 7 l distilled water for 120 min at 90°C
2.4 Experimental Setup
The slow pyrolysis experiment was performed using a lab-scale pyrolysis
system (Figure 1). This system consists of a Thermolyne F600 Ashing Furnace, a cylindrical sample holder made of steel (pyrolyser), an L-shape iron pipe and a condensing system. The condensing system consists of two ice-cooled spherical flasks and condenser tubes.

Journal of Physical Science, Vol. 25(2), 97–112, 2014 101
Figure 1: Lab-scale pyrolysis system.
2.5 Pyrolysis Experiment
For every slow pyrolysis experiment run, approximately 100 g of EFB
samples were tightly packed by compression into the pyrolyser. Then, the pyrolyser was placed in a furnace and connected to a condensing system with an L-tube iron pipe. The terminal temperature, heating rate and residence time were set at 550°C, 5°C min–1 and 1 h, respectively.20 The experiment was started with unwashed EFB feedstock (EFB Sample 1) followed by EFB Sample 2, EFB Sample 3, EFB Sample 4 and EFB Sample 5, which were obtained from various washing treatments as listed in Table 1. The experiment was repeated three times for each sample. During the pyrolysis experiment, white volatiles were emitted from the pyrolyser and passed through the L-tube iron pipe to the condensing system. The condensate was accumulated in spherical flasks. In addition non-condensable gases escaped into the fume cupboard.
When the slow pyrolysis experiment reached the fixed residence time,
the pyrolyser was removed from the furnace and allowed to cool for approximately 2 h. The pyrolyser was weighed to determine the percentage of biochar yield using the following equation: Biochar Yield,wt % = [Mass of char produced (g) / Mass of dry feedstock (g)] 100× (3)
The biochar obtained from the slow pyrolysis experiment was stored in
desiccators to avoid moisture absorption.

Slow Pyrolysis of Oil Palm EFB 102
2.6 Biochar Analysis In addition to calculating the yield percentage of biochar products,
analysis procedures were conducted on the EFB biochar itself. The EFB biochar was ground and stored in airtight bottles prior to these analyses. Proximate analysis was performed to determine the moisture content, volatile matter, ash content and fixed carbon content of EFB biochar. This analysis was conducted according to ASTM D1762 (Procedure for chemical analysis for wood charcoal)21 with some modifications, as suggested by Hugh McLaughlin.22 The temperature ranges and heating period for this study were modified with the intention to apply the biochar into soil rather than use it in the thermal energy furnace. Proximate analysis of EFB biochar first involved determining the moisture content. Biochar samples were dried in an oven until they reached 200°C. Then, the biochar samples were halved. Each half was used for the determination of ash content and volatile matter. One-half of the samples was subjected to 525°C for 6 h for the ashing process. The other half was subjected to 450°C for 30 min for volatile matter determination. In addition, elemental analysis of the EFB biochar was performed using a Perkin Elmer 2400 analyser. The percentages of carbon, hydrogen, nitrogen, sulphur and oxygen in biochar were determined by this analysis.
A surface morphology study was performed on the EFB biochar to
observe the effects of various EFB feedstock ash contents on the physical characteristics of EFB biochar. Scanning electron microscopy (SEM) analysis was performed to observe structural changes in EFB biochar. High-resolution images of EFB biochar were obtained using a JEOL JSM 6400 LV model scanning electron microscope, which was operated at 15 kV. A Quantachrome Autosorb-1 Surface Analyzer was used to determine the BET surface area of the EFB biochar.
3. RESULTS AND DISCUSSIONS 3.1 Characterisation of Raw Material
Table 2 shows the properties of the raw EFBs. From proximate analysis,
it can be observed that EFB feedstock contains a large percentage of volatile matter, 77.46 mf wt%, a moderate percentage of ash content, 5.29 mf wt%, and a small percentage of fixed carbon content, 17.25 mf wt%. Thus, EFB is suitable feedstock for slow pyrolysis due to its high volatile content. The low percentage of nitrogen and sulphur in EFB obtained from elemental analysis results, which is less than 1%, indicate the environmentally friendly behaviour of this feedstock.

Journal of Physical Science, Vol. 25(2), 97–112, 2014 103
Table 2: Properties of EFB feedstock.
Proximate analysis (mf wt%)
Ultimate analysis (%)
Heating value (MJ kg–1)
Moisture content 1.33 Carbon 47.14 HHV 20.61 Volatile matter 77.46 Hydrogen 6.03 LHV 20.34 Ash content 5.29 Nitrogen <0.1 Fixed carbona 17.25 Sulfur 0.84 Oxygena 45.99
a: calculated by difference It was found that cellulose is a main component of EFB. Table 3 shows
the percentages of lignin (22.8%), cellulose (57.8%) and hemicellulose (21.2%) in EFB feedstock. The percentages obtained by Hamzah et al.23 and Kelly Yong et al.24 are also presented in Table 3 for comparison.
Table 3: Lignocellulosic component of EFB.
Component Measured values (%) Literature values (%) References
Cellulose 57.8 44.2, 38.3 23, 24 Hemicellulose 21.2 33.5, 35.3 23, 24 Lignin 22.8 20.4, 22.1 23, 24
The thermal degradation characteristics of washed and unwashed EFB
are presented in the TG and derivative (DTG) curves shown in Figures 2 and 3, respectively. The TG curves in Figure 2 indicate the fractional weight loss of the various ash content samples as a function of temperature. In addition, the DTG curves in Figure 3 are plotted to show the rate of mass change, dM/dt, versus temperature.
In Figure 2, it can be observed that the thermal degradation for all
feedstock samples began at approximately 200°C. Below this temperature, the weight loss for washed and unwashed EFB exhibited no significant change; this behaviour is due to moisture reduction in the samples during the analysis. When the temperature was greater than 200°C, the percent weight suddenly decreased. The weight loss for all feedstock samples was most prominent between 220°C–400°C, possibly due to the thermal degradation of polymer blocks within the biomass (such as hemicellulose, cellulose and lignin).25 After the temperature reached 400°C, no obvious weight loss was observed. It is also apparent that when the temperature was greater than 370°C, the degradation rate for EFB with a higher ash content (5.29 mf wt%) was slower than that of washed EFB with a lower ash content (1.60 mf wt%).

Slow Pyrolysis of Oil Palm EFB 104
Figure 2: TG curves of EFB feedstock.
Figure 3: DTG curves of EFB feedstock.
Journal of Physical Science, Vol. 25(2), 97–112, 2014 105
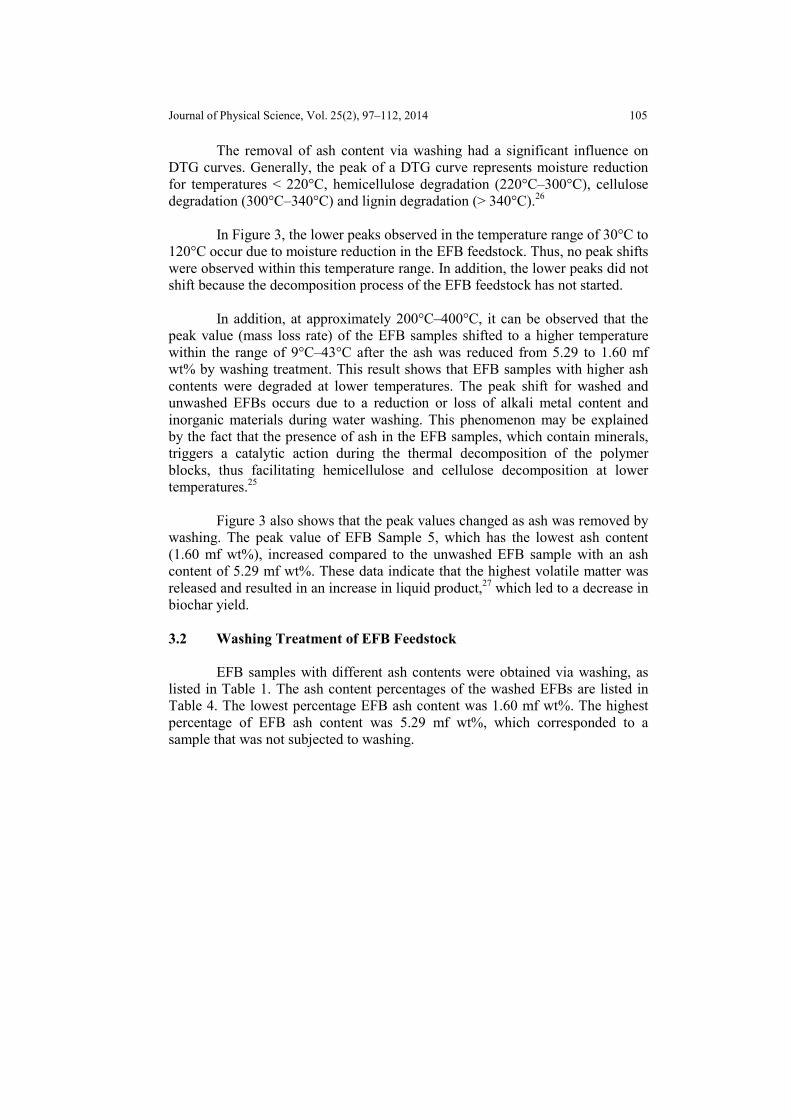
The removal of ash content via washing had a significant influence on DTG curves. Generally, the peak of a DTG curve represents moisture reduction for temperatures < 220°C, hemicellulose degradation (220°C–300°C), cellulose degradation (300°C–340°C) and lignin degradation (> 340°C).26
In Figure 3, the lower peaks observed in the temperature range of 30°C to
120°C occur due to moisture reduction in the EFB feedstock. Thus, no peak shifts were observed within this temperature range. In addition, the lower peaks did not shift because the decomposition process of the EFB feedstock has not started.
In addition, at approximately 200°C–400°C, it can be observed that the
peak value (mass loss rate) of the EFB samples shifted to a higher temperature within the range of 9°C–43°C after the ash was reduced from 5.29 to 1.60 mf wt% by washing treatment. This result shows that EFB samples with higher ash contents were degraded at lower temperatures. The peak shift for washed and unwashed EFBs occurs due to a reduction or loss of alkali metal content and inorganic materials during water washing. This phenomenon may be explained by the fact that the presence of ash in the EFB samples, which contain minerals, triggers a catalytic action during the thermal decomposition of the polymer blocks, thus facilitating hemicellulose and cellulose decomposition at lower temperatures.25
Figure 3 also shows that the peak values changed as ash was removed by
washing. The peak value of EFB Sample 5, which has the lowest ash content (1.60 mf wt%), increased compared to the unwashed EFB sample with an ash content of 5.29 mf wt%. These data indicate that the highest volatile matter was released and resulted in an increase in liquid product,27 which led to a decrease in biochar yield.
3.2 Washing Treatment of EFB Feedstock
EFB samples with different ash contents were obtained via washing, as
listed in Table 1. The ash content percentages of the washed EFBs are listed in Table 4. The lowest percentage EFB ash content was 1.60 mf wt%. The highest percentage of EFB ash content was 5.29 mf wt%, which corresponded to a sample that was not subjected to washing.

Slow Pyrolysis of Oil Palm EFB 106
Table 4: Ash content of EFB feedstock.
EFB sample Washing method Ash content
(mf wt%)
1 The feedstock was not subjected to any washing treatment 5.29
2 Stir by manual 100 g of EFB feedstock in 5 l distilled water for 1 min at ambient temperature 4.65
3 Soak 100 g of EFB feedstock in 5 l distilled water for 10 min at ambient temperature 3.28
4 Soak 100 g of EFB feedstock in 5 l distilled water for 20 min at ambient temperature 2.21
5 Soak 100 g of EFB feedstock in 7 l distilled water for 120 min at 90°C 1.60
For the washing method applied, it can be observed that the EFB
feedstock ash content decreased as the residence time was prolonged. The increase in temperature and water volume used for washing also contributed to the reduction in EFB feedstock ash content. 3.3 Product (Biochar Yield)
Biochar is the main product of the slow pyrolysis process. Using
Equation 3, the biochar percentage yield was calculated and presented in Figure 4.
Figure 4: Effect of ash content on biochar yield.
Figure 4 shows that the biochar yield obtained from unwashed feedstock
with an ash content of 5.29 mf wt% was 25.47 wt%. It also can be observed that

Journal of Physical Science, Vol. 25(2), 97–112, 2014 107
for the washed EFB feedstock, the biochar yield decreased as the feedstock ash content decreased. The highest biochar yield, 27.02 wt%, was obtained from the slow pyrolysis of EFB with an ash content of 4.65 mf wt%. In addition, the slow pyrolysis of EFB with the lowest ash content, 1.60 mf wt%, produced the lowest biochar percentage yield, 23.05 wt%. As expected, ash removal by washing caused a reduction in the biochar yield percentage. This result may attribute to secondary reactions among the primary pyrolysis products, which generate tars, char and gases and are slowed by the removal of the ash that generally promotes the reaction.25
3.4 Characterisation of Biochar
The proximate and elemental analysis results for biochar are provided in
Table 5 and Table 6. The results of the proximate analysis of biochar are also presented in moisture-free weight percentage, mf wt%. According to the proximate analysis results for biochar shown in Table 5, it can be observed that as the ash content of EFB feedstock decreased from 5.29 to 1.60 mf wt%, the biochar moisture content decreased from 5.15 to 1.07 mf wt%. The volatile matter of biochar also decreased from 7.20 to 4.11 mf wt%. The ash content of the biochar produced also experienced a decrease from 19.86 to 7.55 mf wt%. In addition, the fixed carbons in the biochar increased from 72.94 to 88.34 mf wt%. The percentage of biochar carbons determined by elemental analysis also increased as the ash content of the EFB feedstock decreased. The fixed carbon obtained by proximate analysis differed from that obtained by elemental analysis. The fixed carbons in proximate analysis do not include the carbons in the volatile matter.28 In addition, a fixed carbon is one of the important elements that determine the quality of biochar as a soil amendment. Good biochar should have a high fixed carbon content.
Table 5: Proximate analysis results of biochar.
Biochar Ash content of EFB
feedstock (mf wt%)
Proximate analysis (mf wt%)
Moisture content
Volatile matter
Ash content
Fixed carbona
1 5.29 5.15 7.20 19.86 72.94 2 4.65 2.42 6.68 16.53 76.79 3 3.28 2.05 5.46 13.75 80.79 4 2.21 1.15 4.81 10.16 85.03 5 1.60 1.07 4.11 7.55 88.34
a: Calculated by difference

Slow Pyrolysis of Oil Palm EFB 108
Table 6: Elemental analysis results of biochar.
Biochar Ash content of EFB
feedstock (mf wt%)
Elemental analysis (%)
C H N S Oa
1 5.29 67.09 2.02 6.83 0.16 23.90 2 4.65 67.26 1.59 1.12 0.29 29.74 3 3.28 72.23 1.50 6.53 <0.01 19.74 4 2.21 77.39 1.52 6.12 <0.01 14.97 5 1.60 79.04 1.82 1.34 0.26 17.54
a: Calculated by difference
EFB biochars obtained from slow pyrolysis experiments have a lower percentage of volatile matter compared to EFB feedstock because volatile matter is released during the slow pyrolysis process. In addition, the percentages of fixed carbons and EFB biochar ash content are higher than that of the EFB feedstock. The increase in the ash content percentage may be due to the mineral matter that forms ash and remains in biochar after the slow pyrolysis process.29
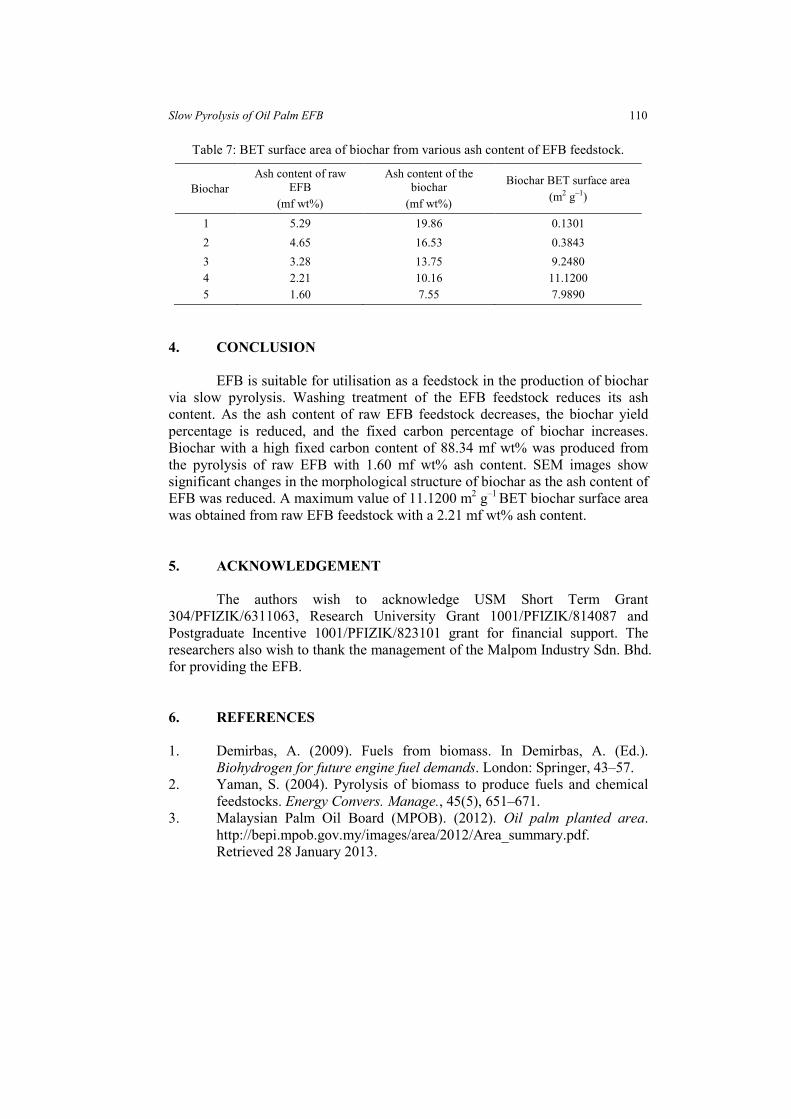
SEM images of biochars produced by EFB feedstock with various ash contents are shown in Figure 5. All of the images were magnified 2,500 times. In Figure 5(a) it can be observed that the morphological structure of biochar produced from unwashed feedstock is more dense and lumpy compared with biochar produced from washed feedstock [Figure 5(b)]. In Figure 5(e), cell wall breakdown can be clearly observed for biochar produced from the lowest ash content (1.6 mf wt%). The BET surface area of biochar was determined and shown in Table 7. The surface area of biochar is dependent on the ash content of the EFB feedstock. The results in Table 7 show that as the ash content of the EFB feedstock decreased from 5.29 to 2.21 mf wt%, the surface area increased from 0.1301 to 11.1200 m2 g–1. In general, the BET surface area of biochar increased as the ash content of raw EFB decreased. Table 7 also shows that the ash content of biochar produced from pyrolysis experiments decreases as the ash content of the EFB feedstock decreases. Thus, the low surface area of biochar produced from the EFB feedstock with higher ash content may be due to the plugging of pores by inorganic compounds in the ash present in biochar.30,31 However, the BET surface area of biochar produced from the lowest ash content (1.6 mf wt%) was found to be reduced to 7.9890 m2 g–1, which may be due to the breakdown of cell walls, as can be observed in Figure 5(e).

Journal of Physical Science, Vol. 25(2), 97–112, 2014 109
(a) Biochar 1 from EFB (unwashed feedstock)
of 5.29 mf wt% ash content. (b) Biochar 2 from EFB (washed feedstock) of
4.65 mf wt% ash content.
(c) Biochar 3 from EFB (washed feedstock) of
3.28 mf wt% ash content. (d) Biochar 4 from EFB (washed feedstock) of
2.21 mf wt% ash content.
(e) Biochar 5 from EFB (washed feedstock) of 1.60 mf wt% ash content.
Figure 5: Biochars from different ash content of EFB feedstock.
Slow Pyrolysis of Oil Palm EFB 110
Table 7: BET surface area of biochar from various ash content of EFB feedstock.
Biochar Ash content of raw
EFB (mf wt%)
Ash content of the biochar
(mf wt%)
Biochar BET surface area (m2 g–1)
1 5.29 19.86 0.1301 2 4.65 16.53 0.3843 3 4 5
3.28 2.21 1.60
13.75 10.16 7.55
9.2480 11.1200 7.9890
4. CONCLUSION
EFB is suitable for utilisation as a feedstock in the production of biochar
via slow pyrolysis. Washing treatment of the EFB feedstock reduces its ash content. As the ash content of raw EFB feedstock decreases, the biochar yield percentage is reduced, and the fixed carbon percentage of biochar increases. Biochar with a high fixed carbon content of 88.34 mf wt% was produced from the pyrolysis of raw EFB with 1.60 mf wt% ash content. SEM images show significant changes in the morphological structure of biochar as the ash content of EFB was reduced. A maximum value of 11.1200 m2 g–1 BET biochar surface area was obtained from raw EFB feedstock with a 2.21 mf wt% ash content.
5. ACKNOWLEDGEMENT The authors wish to acknowledge USM Short Term Grant
304/PFIZIK/6311063, Research University Grant 1001/PFIZIK/814087 and Postgraduate Incentive 1001/PFIZIK/823101 grant for financial support. The researchers also wish to thank the management of the Malpom Industry Sdn. Bhd. for providing the EFB. 6. REFERENCES
1. Demirbas, A. (2009). Fuels from biomass. In Demirbas, A. (Ed.).
Biohydrogen for future engine fuel demands. London: Springer, 43–57. 2. Yaman, S. (2004). Pyrolysis of biomass to produce fuels and chemical
feedstocks. Energy Convers. Manage., 45(5), 651–671. 3. Malaysian Palm Oil Board (MPOB). (2012). Oil palm planted area.
http://bepi.mpob.gov.my/images/area/2012/Area_summary.pdf. Retrieved 28 January 2013.

Journal of Physical Science, Vol. 25(2), 97–112, 2014 111
4. Lua, A. C. & Guo, J. (1998). Preparation and characterisation of chars from oil palm waste. Carbon, 36(11), 1663–1670.
5. Paepatung, N., Nopharatana, A. & Songkasiri, W. (2009). Bio-methane potential of biological solid materials and agricultural waste. Asian J. Energy Environ., 10, 19–27.
6. Sohi, S. P. et al. (2010). A review of biochar and its use and function in soil. In Donald, L. S. (Ed.). Advances in agronomy. Burlington: Academic Press, 47–82.
7. Lehmann, J. & Joseph, S. (2009). Biochar for environmental management: An introduction. In Lehmann, J. & Joseph, S. (Eds.). Biochar for environmental management-science and technology. London: Earthscan, 1–9.
8. Commonwealth Scientific and Industrial Research Organisation (CSIRO). (2010). Biochar. www.csiro.au/files/files/pnzp.pdf. Retrieved 2 June 2011.
9. Koide, R. T., Petprakob, K. & Peoples, M. (2011). Quantitative analysis of biochar in field soil. Soil Biol. Biochem., 43(7), 1563–1568.
10. Pilon, G. & Lavoie, J. M. (2011). Characterization of switchgrass char produced in torrefaction and pyrolysis conditions. BioRes., 6(4), 4824–4839.
11. Yang, H. et al. (2006). Mechanism of palm oil waste pyrolysis in a packed bed. Energy Fuels, 20(3), 1321–1328.
12. Che Khalib, N., Abdullah, N. & Sulaiman, F. (2010). Drying pre-treatment on empty fruit whole bunches of oil palm wastes. Progress of Physics Research in Malaysia: PERFIK Conference Proceedings, Malacca, 7–9 December 2009.
13. American Society of Testing and Materials (ASTM). (2006). ASTM E871-82 standard test method for moisture analysis of particulate wood fuels. Annual book of ASTM standard. New York: ASTM International.
14. ASTM. (2006). ASTM E872-82 standard test method for volatile matter in the analysis of particulate wood fuels. Annual book of ASTM standard. New York: ASTM International.
15. ASTM. (2007). ASTM E1755-01 standard test method for ash in biomass. Annual book of ASTM standard. New York: ASTM International.
16. Boundy, B. et al. (2011). The effect of moisture on heating value. http://cta.ornl.gov/bedb/appendix_a/The_Effect_of_Moisture_on_Heating_Values.pdf. Retrieved 3 September 2012.
17. Technical Association of Pulp and Paper Industry (TAPPI). (1950). Alcohol benzene solubility of wood. Official standard T6M-59. New York: TAPPI.
18. TAPPI. (1954). Holocellulose in wood. Official standard T9M-54. New York: TAPPI.
Slow Pyrolysis of Oil Palm EFB 112
19. TAPPI. (1991). Lignin in wood. Official standard T13M-54. New York: TAPPI.
20. Khor, K. H. & Lim K. O. (2008). Slow pyrolysis of oil palm empty fruit bunches. Int. Energy J., 9(3), 181–188.
21. ASTM. (2007). ASTM D1762-84 standard test method for chemical analysis of wood charcoal. Annual book of ASTM standard. New York: ASTM International.
22. McLaughlin, H. (2011). Characterizing biochars prior to addition to soils: Version I. http://terrapreta.bioenergylists.org/Characterizing_ Biochars. Retrieved 4 July 2011.
23. Hamzah, F., Idris, A. & Shuan, T. K. (2011). Preliminary study on enzymatic hydrolysis of treated oil palm (Elaeis) empty fruit bunches fibre (EFB) by using combination of cellulase and β 1-4 glucosidase. Biomass Bioenergy, 35(3), 1055–1059.
24. Kelly-Yong, T. L. et al. (2007). Potential of hydrogen from oil palm biomass as a source of renewable energy worldwide. Energy Policy, 35(11), 5692–5701.
25. Abdullah, N., Gerhauser, H. & Bridgewater, A. V. (2007). Bio-oil from fast pyrolysis of oil palm empty fruit bunches. J. Phys. Sci., 18(1), 57–74.
26. Yang, H. et al. (2004). Thermogravimetric analysis-fourier transform infrared analysis of palm oil waste pyrolysis. Energy Fuel, 18(6), 1814–1821.
27. Chaiwong, K. et al. (2012). Biochar production from freshwater algae by slow pyrolysis. Maejo Int. J. Sci. Technol., 6(2), 186–195.
28. Basu, P. (2010). Biomass gasification and pyrolysis. Oxford: Elsevier. 29. Ozçimen, D. & Ersoy-Meriçboyu, A. (2010). Characterization of biochar
and bio-oil samples obtained from carbonization of various biomass materials. Renew. Energy, 35(6), 1319–1324.
30. Novak, J. M. et al. (2009). Characterization of designer biochar produced at different temperatures and their effects on a loamy sand. Annals Environ. Sci., 3, 195–206.
31. Ronsse, F. et al. (2013). Production and characterization of slow pyrolysis biochar: Influence of feedstock type and pyrolysis conditions. GCB Bioenergy, 5(2), 104–115.