Embed Size (px)
Citation preview

lable at ScienceDirect
Journal of Natural Gas Science and Engineering 2 (2010) 163e177
Contents lists avai
Journal of Natural Gas Science and Engineering
journal homepage: www.elsevier .com/locate/ jngse
A new approach to investigate hydrate deposition in gas-dominated flowlines
Esam Jassim a, M. Abedinzadegan Abdi a,*, Y. Muzychka b
a Propel Inc., Canadab Faculty of Engineering and Applied Science, Memorial University of Newfoundland, Canada
a r t i c l e i n f o
Article history:Received 8 September 2009Received in revised form17 February 2010Accepted 9 May 2010Available online 16 June 2010
Keywords:Natural gasDeposition, CFDHydrate formation
* Corresponding author. East Coast DevelopmentCoast Operations, Suite 901, Scotia Center, 235 WaterA1C 1B6. Tel.: þ1 709 724 4033
E-mail address: [email protected] (M.A. Abdi).
1875-5100/$ e see front matter � 2010 Elsevier B.V.doi:10.1016/j.jngse.2010.05.005
a b s t r a c t
A new model describing the mechanism of the hydrate deposition based on the most recent particledynamics theories is developed. The model splits the motion of the particle into two main regions: theturbulent and the sublayer regions.
A novel approach is used to define the particle migration and attachment in the sublayer region.Depending on the ratio of the particle diameter relative to the thickness of the sublayer, the particle willeither travel as a result of the force balance acting on the particle (lift, adhesion, gravity, and drag) or as itmay experience bouncing process.
The proposed model employs the following three main components to simulate the hydrate deposi-tion: (a) computational fluid dynamics (CFD) technique is used to configure the flow field; (b) nucleationand growth models are incorporated in the simulation to predict the incipient hydrate particles size andgrowth rate; and finally (c) a novel approach of particle migration and deposition is used to determinehow particles deposit and adhere to the walls of flow conduit.
The results predicted by the model show that the distance of the deposition decreases as the particlesize increases. However, after certain size of particle, there is no impact on the deposition distance. Thiscritical particle size is called “deposition critical size”. The experimental tests are shown to be in goodagreement with the model predictions in terms of the following criteria: 1) Formation of hydrateparticles are observed to be poly-dispersed since different sizes of particles are formed; 2) Studying theinfluence of the Reynolds number and pipe diameter, the deposition distance is found to be linearlycorresponded to both.
� 2010 Elsevier B.V. All rights reserved.
1. Introduction
Particles deposition is a process that plays a key role in manyfields ranging from atmospheric applications to material sciences.In oil and gas pipelines field, accumulation of hydrate is one of themost challenging aspects in the flow assurance modeling.
Hydrate can pose a major risk in all high pressure natural gastransport lines including the connecting lines and manifoldsystems in all offshore production facilities. Marine transportationof compressed natural gas is one example where prediction ofhydrate formation is a requirement for the safe transport of gas toand from ocean going ships. Production facility components such aschokes, velocity-controlled subsurface safety valves, and conven-tional valves and fittings can all act as restrictions to the flowingfluids resulting changes in flow conditions which could lead to the
Group, Husky Energy - EastStreet, St. John’s, NL, Canada,
All rights reserved.
formation of hydrate particles accumulated eventually in thepipeline.
Hydrate plugs have disturbed the normal flow of natural gas andother reservoir fluids in the production and transportation linesand have claimed lives of personnel and resulted loss of property inoil and gas industries (Sloan, 1998). Hydrate propagation tends togradually form a plug that separates the pipe into two pressuresections: a high pressure section between the well or high pressuregas source and the plug and a second section at low pressurebetween the plug and the gas recovery division. In the upstreamsection, a pipe blast can occur due to pressure rise. The plug canalso behave as a projectile that destroys the pipewhen the pressuredifference between the upstream and downstream sectionsincreases. Both events can endanger personnel safety and damageproduction equipment (Sloan, 2000).
Considering such significant economic risks in the gas and oilindustry, a great deal of research has been conducted by petroleumindustry to hinder this undesirable phenomenon. Annually anoperating expense greater than $500 million is allocated to hydrateprevention (Lederhos et al., 1996), almost half of which spent for
Nomenclature
A Hamaker constantAf Orifice Area (m2)C0 Initial Particle ConcentrationC0ut Outlet Particle ConcentrationCav Average Particle Concentrationdp Particle diameter (m)Dpipe Pipe diameter (m)D Diffusion Coefficient (m2/s)e Coefficient of restitutionE Surface Potential Energy (J)f Friction CoefficientF Force (N)Fo Particle Fourier Numberg Gravity (m/s2)G Particle mass fluxk Surface roughnesskB Boltzmann ConstantL Pipe length (m)m Mass (kg)P Pressuremp Mass of Particle (kg)n* number of particle formednv Molar density (kg-mole/m3)P Pressure (kPa)Q Flow rate (m3/s)rp Radius of particle (m)r Experimental result parameterr* dimensionless particle radiusrc Critical radius of particle (m)R Pipe radius (m)Re Reynolds numberS Density ratio
SL Stop Distance (m)St Stoke NumberSc Schmidt NumberSd Particle deposition distance (m)Sh Sherwood Numbert time (s)teq Equilibrium temperature (K)T Temperature (K)u Velocity in the (x) direction (m/s)u* Friction Velocity (m/s)up Particle Velocity (m/s)us Settling Velocity (m/s)Ug Mean gas velocity (m/s)Vd Deposition Velocity (m/s)V0 Initial Velocity (m/s)X Deposition distance (m)y Actual molar fractionyeq Equilibrium molar fraction
Greek Symbolsr Density (kg/m3)mg Gas dynamic viscosity (N s/m2)lg Mean Free Path (m)ng Gas Kinematics Viscosity (m2/s)d Boundary layer thickness (m)sV Relaxation time (s)h Collection efficiencys Surface Tension (N/m)
Subscriptsf Fluidg Gasp Particlest Standard condition
E. Jassim et al. / Journal of Natural Gas Science and Engineering 2 (2010) 163e177164
hydrate inhibition (Sloan, 2003). In addition, offshore operationsexpend approximately $1,000,000 per mile for insulation of subseapipelines to prevent hydrates. Further, Lysne (1995) listed threeincidents in which hydrate projectiles erupted from pipelines atelbows and caused loss of three lives and over $7 million (US) incapital costs. Consequently, concerns have been expressed aboutthe effect of hydrates on foundations of platforms and pipelines, aswell as offshore drilling.
The basic behaviours of any flowing particles such as deposition,transport, lifetime, and optical influence, depend strongly on theirsize, their chemical composition, and on the nature of the carriergas. Thus the interaction of these parameters is the dominatingprocess that controls the nucleation, the size distribution and thedeposition of the flowing particles.
Because of simultaneous influences from fluid flow convection,particle-boundary hydrodynamic interaction, colloidal interaction,molecular diffusion, and external applied body forces, particledeposition onto surface is an extremely complicated process.
Chein and Liao (2005) found that the particle could be sus-pended above or deposited on the wall, depending on the Hamakerconstant, the surface potentials of the particle and wall, and thethickness of the electrical double layer (EDL).
Yang et al. (1998) divided the process of particle deposition intofour steps according to the distance between the particle and thesurface:
� The particle transport is controlled by the fluid convection andexternal body force when the distance is large.
� As the distance becomes comparable to the particle size,additional force acting on the particle is produced due to thepresence of the wall. This force, known as particle-wallhydrodynamic interaction, reduces the particle mobility.
� When the distance becomes within the range of 1e100 nm, thevan der Waals (VDW) forces and the electrical double-layer(EDL) force due to the interaction between the surface poten-tials of particle and wall start to affect the particle motion.These two interactions form the basis of the well-knownDerjaguine LandaueVerweyeOverbeek (DLVO) theory ofcolloidal stability (Derjaguin and Landau, 1941; Verwey andOverbeek, 1948).
As the distance becomes smaller, within 1 nm, traditionalcontinuum mechanisms may not be applied to tackle the particlebehaviour for such molecular dimension. Hence the particle isusually considered to adhere to the wall when the VDW force isattractive.
The adhesive distance cannot be calculated from theoreticalconsiderations and is usually approximated as a constant (Cheinand Liao, 2005). Krupp (1967) suggested a value of 0.4 nm whileIsraelachvili (1992) proposed the adhesional distance as 0.2 nm.
As the above mentioned sub-models requires first to solvenumerically the fluid flow governing equations, commercial soft-ware based on Computational Fluid Dynamics (CFD) technique isused for this purpose.
The fundamental concepts related to the nucleationphenomena, growth theory, and forces applied to the particle are

d h
Lift
Drag
Gravity
Adhesion
Fig. 1. Forces acting on a particle within sublayer region.
E. Jassim et al. / Journal of Natural Gas Science and Engineering 2 (2010) 163e177 165
well established and ready to be integrated. The comprehensivemodels which are able to predict hydrate formation and accumu-lation have also been successfully implemented. However, based onour extensive literature survey and best knowledge, modelsspecifically developed to predict the most probable location forhydrate deposition under conditions where natural gas with littleor no free water flows through restrictions in pipeline systems arestill unavailable and need to be addressed.
A comprehensive model has been built to predict the depositionspots of hydrate. The model could be used to modulate thecollection phenomena, analyze the forces applied to a particle, anddescribe the process of deposition in a new approach. The latter isthe main issue concerned in the present work.
In this paper the theory of the particle migration in gas flow andthe mechanism of the particle deposition are briefly addressed. Theapparatus used for the experimental tests that performed to vali-date the proposed model is presented. Finally, the results of theparticle deposition location and the influence of bouncing processfor two case studies where saturated air and saturated propane areemployed as carrier fluid are discussed. Tests are also presented tovalidate the accuracy of the proposed model.
2. Forces acting on particle
The Lagrangian equations governing the position Xi and velocityupi along the trajectory of each spherical particle, of diameter dp andmass mp in the carrier flow field can be written as follows:
dXi
dt¼ upi (1)
mpdupidt
¼ �Fi (2)
Where, Fi denotes the summation of all forces acting on the particle,including drag, adhesion, lift and gravity forces.
As the diameter of the hydrate particles in our situation is muchsmaller than thecarrierpiperadiusand itsdensity ismuchgreater thanthat of the carrier fluid, the particle equation ofmotion can be reducedto an equation consisting only of the drag and gravitational forces(Crowe, 2006). For a particle with a Reynolds number higher than theStokes limit, a lift forcemayexist due to the asymmetric patternofflowaround the particle (Saffman, 1968). Another transport phenomenonassociatedwith the interactionof smallparticleswithfluidmolecules isthe Brownianmotion, resultswhenhigh-momentummolecules in thefluid collide with small particles in suspension.
3. Deposition mechanism
A basic quantity characterizing convective transport of a hydrateparticle is the collection efficiency, defined as the fraction of theinflowing particles that is lost by deposition (Crowe, 2006). It canbe written as:
h ¼ 1� CoutC0
(3)
Where, Cout and C0 are the particle concentrations (either mass ornumber) at the outlet and inlet, respectively.
Another quantity commonly employed to characterize deposi-tion in convective particle flows is deposition velocity, defined as:
Vd ¼ Gp
Cav(4)
Where, Gp is the particle mass flux to the wall and Cav the particleaverage particle concentration above the surface. The latter isusually taken equal to the average concentration over the cross-section of the conduit.
For fully developed turbulent flow in a circular pipe of length L,the deposition velocity Vd may be considered as constant along thetube, and the collection fraction can be express as (Crowe, 2006):
h ¼ 1� exp�� 4VdL
UgD
�(5)
Vdr ¼
8>>>><>>>>:0:084Sc�2=3þ 1
2
��0:64kþþ0:5dþ
p
�23:42
�1=ð1þsþ2Lþ1 Þ
�h1þ8e�ðs�10Þ2=32
i0:037
1�sþ2 Lþ1þ sþgþ
0:14
if Vdr < 0:14
(6)
Where, Vdr ¼ Vdu*; Lþ1 ¼ 3:08
Sdþp; S ¼ rp
rf; dþp ¼ dpu*
n ; Ug is the carrier gasmean velocity; D is the pipe diameter. and kþ is the surfaceroughness (which is zero for smooth surface).
4. The proposed model
The model consists of the following parts:
i) Computational fluid dynamic (CFD) technique to configurethe flow field;
ii) The new correlation of hydrate growth and distribution basedon the satisfaction of the Law of Mass action, developed byJassim (2008), is considered to predict the incipient hydrateparticles size and growth rate.
iii) The principle of particle deposition velocity is used to trackthe particle motion in the turbulent regime;
iv) A novel approach to describe the particle behaviour near wallregion is implemented.
4.1. Sublayer region
The behaviour of the particle in the boundary layer region is influ-encedbythefluid turbulenceandproperties,particle-wall interactions,particle inertia, gravity in the case of horizontal flows, and local wallsurface geometry in the case of cross-flows (Wang and Levy, 2003).
The particle path could be explained from the resultant forceacting on the particles based on the force balance method. Asmentioned earlier, lift force is the main force affecting the particleentrainment in the sublayer region. Adhesion force of the particlewith the wall resists the lifting force and jointly influences themovement of the particle. Further drag and gravitational forces areconsidered in the model and it is shown how the balance of theseforces would determine the trajectory of the particle. Fig. 1 showsthe force balance applied to a particlemoving in the sublayer region.
4.2. Bouncing model
When a solid particle contacts a surface at low velocity, theparticle loses its kinetic energy by deforming itself and the surface.

E. Jassim et al. / Journal of Natural Gas Science and Engineering 2 (2010) 163e177166
At high velocities, part of kinetic energy is dissipated in thedeformation process (plastic deformation), and part is convertedelastically to kinetic energy of rebound (Hinds, 1999). If therebound energy exceeds the adhesion energy, the particle willbounce away from the surface.
There are two approaches used in defining the conditions atwhich the particle could bounce. The first approach is based on thelimiting adhesion or kinetic energy whereas the second approachdefines a critical velocity Vc for which bounce will occur if thatvelocity is exceeded.
Friedlander (1977) described the process of bouncing asa balance of energy before and after impact and proposed a relationbetween the velocities of the particle before and after impact. Theexpression is given as:
y2y1
¼24e2 � E
�1� e2
�mpy212
351=2 (7)
Where,mp is themass of theparticle and e is the restitution coefficient.The critical approach velocity corresponding to y2 ¼ 0 is given by:
y1c ¼�2Emp
�1� e2
e2
��1=2(8)
Where, E is the surface potential energy given by (Dahneke, 1971):
E ¼ dpA12y0
(9)
A is the Hamaker constant; y0 is the equilibrium separation distanceof the particle from the surface, which depends on the scale ofsurface roughness. For smooth surfaces, the distance is usuallyassumed to be 0.4 nm (Hinds, 1999).
The restitution coefficient, “e” proposed by Legendre et al. (2005),was used in the analysis:
e ¼ emaxexp��b
St
�(10)
b is a parameter taking the value 35.emax is 0.91, the maximum coefficient of restitution that can be
reached by the particle for collisions in air for both solid particlesand drop.
St is defined as the Stokes number of the particle away from thewall by an order of boundary layer thickness.
St ¼�rp þ 0:5rf
Ugdp
9mg(11)
4.3. Calculating the distance of the deposition
According to the proposed model, the procedure for calculatingthe distance traveled by a single particle before depositing on thewall could be summarized as follows:
� The deposition velocity is first determined using Eq. (6).� The time required for the particle to reach the sublayer regioncan be found from:
t ¼ yiV
(12)
dWhere, yi is measured from the tube wall.
� Within this time, the hydrate particle grows from the originalsize rp0 to a new size rp. The correlation of particle radius asa function of time becomes (Jassim et al., 2008):
rnp ¼ffiffiffiffiffiffiffiffiffiffiffiffiffiffiffiffiffiffiffiffiffiffiffiffiffiffiffiffiffiffiffiffiffiffiffiffiffiffiffiffiffiffiffiffiffiffiffiffiffiffie2b2tr2p0 þ
b1b
�e2b2t � 1
�s(13)
2
� Now, launching from rest, the particle velocity can be deter-mined using the following formula, which analytically derivedfrom the Equation of Motion (Jassim et al., 2008):
up ¼ �ug � gsV
�� ð1� expð�t=sV ÞÞ; (14a)
where,
UN�uðyiÞu*
¼ 2:5lnRyi
(14b)
and the residence time,
sV ¼ rpd2pCc18mg
(14c)
� The traveling distance in the turbulent region becomes:
X1 ¼ upðyiÞ:t (15)
� In the sublayer region, the particles smaller than the thicknessof the boundary layer could migrate further as a result ofexternal forces. Hence, the total distance from the initialposition would be:
Xt ¼ X1 þ Xd (16)
� When particles larger than the sublayer thickness, thebouncing distance (XB), the distance taken by the particle tosettle as a result of rebound, is added to the distance traveled inthe turbulent region.
Xt ¼ X1 þ XB (17)
4.4. Summary of the deposition model
The flowchart presented in Fig. 2 summarizes the procedure ofthe particle migration and process of deposition in turbulent flow.As particles travel in the fully turbulent region, deposition velocityis evaluated (depending on their sizes) and used to determinecollection factor, the elapsed time required to reach the boundarylayer, and the new size of such particle before merging in thesublayer regime.
In the sublayer region, again the size of the particle is used todirect the phenomena of the deposition to the proper model ofdeposition process, which is either the balance of the forcesexperienced by the particle or the probability of bouncing. Hence,the extended distance acquired by the particle before settlingoccurs would be evaluated.
5. Experimental apparatus and procedure
5.1. Preliminary experiment setup
Before constructing the actual apparatus for natural gas/hydrocarbon tests, we decided to perform preliminary tests usingsaturated air as the working fluid. The purpose of these tests was toobtain a better understanding of the test system by monitoring iceparticles formed and deposited in the transparent tubes. Thefollowing section outlines the system setup.

Start
CFDDensity, P,T,ug(y)
ParticleSize?
Particle Deposition Velocity
Particle Deposition Velocity
Collection Efficiency
Elapsed Time (reaching the wall) ti= yi (from wall) / Vd (Deposition Velocity)
Go to Sublayer region
Diffusion Inertia
Fig. 2. Flowchart describing process of particle migration and deposition in turbulentflow.
Fig. 2. (continued).
1 Compressor 6 Separator 2 Valve 7 Orifice 3 Water Container 8 Tube 4 By-Pass Line 9 Flowmeter 5 Cooling Coil
2
Air Charge
1
9
3
Pressure sensor
Temperature sensor
4
5
6
7 8
Drain
Exit
Fig. 3. Schematic of deposition apparatus using saturated air.
E. Jassim et al. / Journal of Natural Gas Science and Engineering 2 (2010) 163e177 167
5.1.1. Apparatus and proceduresAs illustrated in Fig. 3, the compressed air is saturated by bubbling
it through the water container, cooled down through cooling coil todrop the temperature to just above 0 �C, and then passed throughseparator to separate the air stream from any liquid droplets thatmight be formed during the cooling process. After that, the air flowsthrough the orifice, which is connected to the tube where the accu-mulation is monitored, and finally the stream passes through a flow-meter before exiting to the ambient. The tests were performed at theFaculty of Engineering and Applied Science ofMemorial University ofNewfoundland using the Environmental Chamber located in theFluids Lab. The entire system but the air source and the saturatedvessel were placed inside the environmental chamber.
The compressed air pressure was measured downstream of thecompressor. The orifice inlet pressure and temperature weredirectly measured using the attached pressure gauges andtemperature sensors. Information about pressure loss throughwater container, cooling coil, separator, and all connections wererecorded. No temperature measurement sensor was placed at the
0 0.02 0.04 0.06
Distance (m)
240
250
260
270
280
e p m
e T
r u t a r
) K (
e
Fig. 4. Numerical prediction of temperature variation through an orifice.
1. Compressor
2. Valve
3. Gas saturator
4. Gas charging valve
5. Cooling coil
6. Separator
7. Valve
8. Flow meter
9. Liquid trap/filter
P4 , T4
Suction
Propane Charge
Discharge
P3 , T3
P2 , T2
3
6
5
Condensed water Exit
8
9
2
1
4
7
Fig. 5. Schematic of improved experimental system using propane as carrier gas.
E. Jassim et al. / Journal of Natural Gas Science and Engineering 2 (2010) 163e177168
orifice outlet as anymeasuring sensor in this position could perturbthe air flow and affect the process of condensation and/or crystal-lization. The pressure and temperature after the orifice werecalculated using the procedure detailed in Appendix A1.
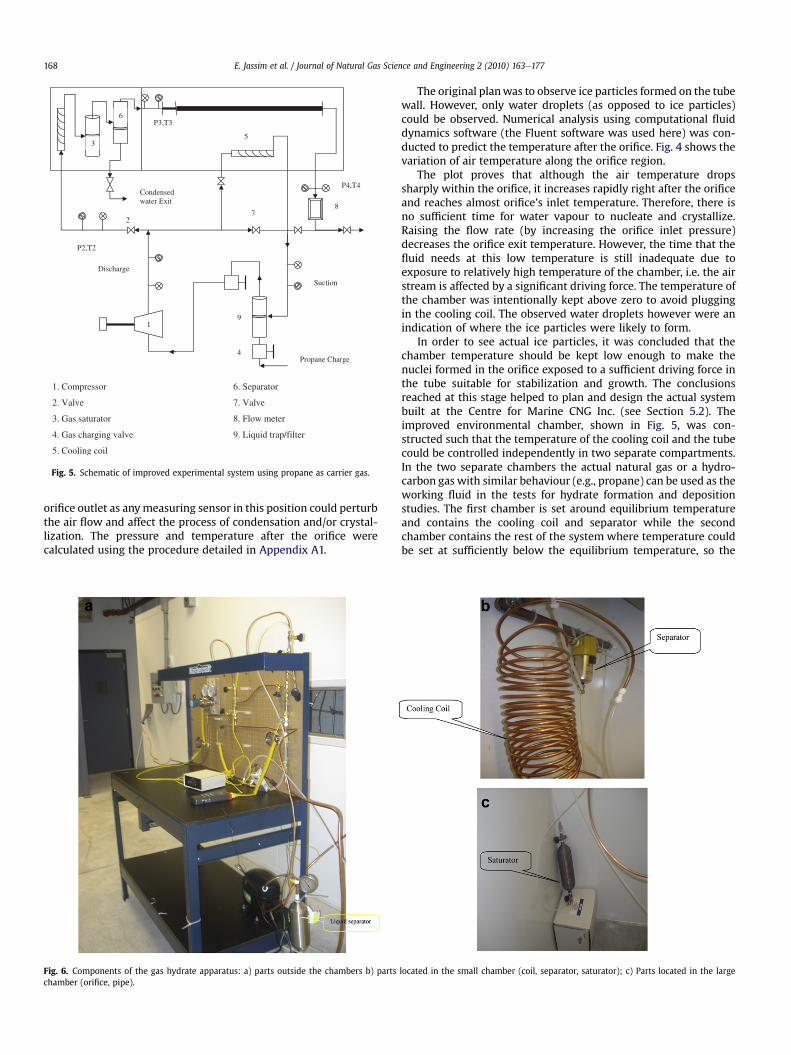
Fig. 6. Components of the gas hydrate apparatus: a) parts outside the chambers b) partschamber (orifice, pipe).
The original planwas to observe ice particles formed on the tubewall. However, only water droplets (as opposed to ice particles)could be observed. Numerical analysis using computational fluiddynamics software (the Fluent software was used here) was con-ducted to predict the temperature after the orifice. Fig. 4 shows thevariation of air temperature along the orifice region.
The plot proves that although the air temperature dropssharply within the orifice, it increases rapidly right after the orificeand reaches almost orifice’s inlet temperature. Therefore, there isno sufficient time for water vapour to nucleate and crystallize.Raising the flow rate (by increasing the orifice inlet pressure)decreases the orifice exit temperature. However, the time that thefluid needs at this low temperature is still inadequate due toexposure to relatively high temperature of the chamber, i.e. the airstream is affected by a significant driving force. The temperature ofthe chamber was intentionally kept above zero to avoid pluggingin the cooling coil. The observed water droplets however were anindication of where the ice particles were likely to form.
In order to see actual ice particles, it was concluded that thechamber temperature should be kept low enough to make thenuclei formed in the orifice exposed to a sufficient driving force inthe tube suitable for stabilization and growth. The conclusionsreached at this stage helped to plan and design the actual systembuilt at the Centre for Marine CNG Inc. (see Section 5.2). Theimproved environmental chamber, shown in Fig. 5, was con-structed such that the temperature of the cooling coil and the tubecould be controlled independently in two separate compartments.In the two separate chambers the actual natural gas or a hydro-carbon gas with similar behaviour (e.g., propane) can be used as theworking fluid in the tests for hydrate formation and depositionstudies. The first chamber is set around equilibrium temperatureand contains the cooling coil and separator while the secondchamber contains the rest of the system where temperature couldbe set at sufficiently below the equilibrium temperature, so the
located in the small chamber (coil, separator, saturator); c) Parts located in the large

Y i = R
u(y)
y
x
D pipe =3/4”
orifice=3/10”
L = 6ft
Fig. 7. Schematic of the saturated air case study (identical dimensions of theexperiment).
E. Jassim et al. / Journal of Natural Gas Science and Engineering 2 (2010) 163e177 169
formed hydrate could be under driving force as it moves throughthe tube. Thus, the nucleation process could be enhanced.5.2. Improved experimental apparatus
The main objective of the experimental work was to establish,by physical evidence, the role played by the various forces dis-cussed in previous chapters on particles deposition. The methodadopted to examine this effect was to form hydrate particles as theresult of a contraction to flow passage and record the distancerequired by the particle to deposit on the wall.
5.2.1. Flow circuitThe experimental apparatus is composed of transparent tubes
approximately 2 m in length and diameters ranging from 6.35 to19.05 mm (1/4” to 3/4”). The orifice had a diameter of 2.54 mm(0.1”) and other equipment pieces are listed in Fig. 5. Two main testzones were suggested, namely: the starting or gas saturation loop,which is designated for cooling the gas and saturating it with waterat the desired temperature, and the main hydrate formation loop,where the gas passes through the orifice and the tube, and the placewhere hydrate particles are deposited.
In the starting loop, the charged gas is mixedwith the cool gas ina separator container (9) before being routed to the compressor. Inorder to bring the gas temperature down, it is then passed throughthe cooling coil (5) located in the large environmental chamber.This process continues until the compressor’s exit temperaturereaches a stable value. The gas, at this time, will be directed to themain loop by opening Valve (2).
The gas then moves through the Container (3) filled half withwater to saturate the gas, the cooling coil to bring the gastemperature to the equilibrium level, and the Separator (6) to trapany droplet that could form during the cooling process in the coil.At this point, the gas is at equilibrium temperature and ready toflow through the system. It is worth to note here that thetemperature of the small environmental chamber is adjustedaround the gas hydrate formation temperature.
The pressure and temperature of the gas are monitored onceagain upstream of the orifice and the tube to confirm that itsconditions are suitable for hydrate formation. The orifice and thetube are located in a separate chamber with an independenttemperature control system. As the gas flows through the orifice itstemperature falls rapidly. Although the gas temperature couldincrease after leaving the orifice, as concluded from the numerical
Table 1Boundary conditions for saturated air simulation.
Parameter Value Unit Description
Inlet Pressure 8.96 � 104 Pa GaugeTotal temperature 273 K
Exit Pressure 2.35 � 10�3 Pa GaugeTotal temperature 300 K
Lateral wall Temperature 271 K Isothermal
simulation mentioned earlier, the low temperature of the secondchamber will keep the gas below the equilibrium hydrate forma-tion temperature. Fig. 6 shows some photos of the actual system.
1. Compressor2. Valve3. Gas saturator4. Gas charging valve5. Cooling coil6. Separator7. Valve8. Flow meter9. Liquid trap/filter
6. Water-air system
The geometry used in this study (Fig. 7) is a simplified version ofthe actual orifice-pipe system, with the axisymmetric assumption.The dimensions of the orifice and the pipe are shown in Fig. 7.
The boundary conditions for the saturated air case are listed inTable 1, which represents the data measured under the experi-ments’ conditions.
Fig. 8 shows the temperature contours inside of the orifice. Dueto the variable temperature within the orifice, ice particles withdiverse critical sizes may form as a result of different driving forces.This can also be interpreted as the flow leaving the orifice maycontain a wide range of particle sizes. This conclusion will befurther analyzed in the subsequent discussions.
6.1. Nucleation and growth of ice particles
The data obtained from the FLUENT software was used todescribe and estimate the process of nucleation and growth of theice particles. Using mass transfer as the predominant process ofnucleation and growth, parameters used for describing theprocesses are listed in Table 2.
The variation of the particle size and its growth rate with timefor the conditions listed in Table 2 are now presented. Fig. 9 showsthe growth rate of ice particles in micrometer scale as a function oftime. The growth starts with a very fast rate after the ice particlebecomes nucleated and slows down as the time elapses. Thatmeans the ice particle growth rate decreases with particles size.Hence, the time required for ice particles to grow to severalmicronsis relatively long; see Fig. 10.
Fig. 8. Temperature contours inside the orifice.

Table 2Parameters used in calculating b1 (Eq.(19a)).
Parameter Valuea
nv 0.067Sh 2.009D 1.636 � 10�1 (cm2/s)y 2.68 � 10�3
yeq 2.49 � 10�3
S 0.033 (N/m)
a See Appendix A2 for typical calculations.
0 0.4 0.8 1.2 1.6 2
time (hr)
0
2
4
6
8
10
( r e t e m
a i d
e l c i t r a P μ
) m
Fig. 10. Diameter for ice particles as a function of time.
E. Jassim et al. / Journal of Natural Gas Science and Engineering 2 (2010) 163e177170
Particles formed in the orifice have different values of criticalsizes. This could also be due to the fact that the temperaturedistribution inside the orifice is not uniform. The temperature ofthe flow inside the orifice ranges from 235 to 272 K. Accordingly,the critical sizes would be 11e13 nm.
Since the measurement of the actual nucleus (critical particle)size was not possible in this research, the analytical correlation ofthe Particle Distribution Function listed below was used (Jassim,2008).
n*ðt; rÞ ¼ 1:65r*exp
Fo� r*
2
!(18)
where,
Particle Fourier number : Fo ¼ b1tr2c
(19a)
Reduced radius : r* ¼ rrc; (19b)
Fig. 11 illustrates the number of particles in dimensionless form(using Eq. (18)) as a function of dimensionless particle radius attime equal zero (nucleation time). The graph proves that thedistribution of the particles contains different sizes; in particularparticles with radii larger than the critical radius. It means that,analytically, the size of the particles just after the orifice are neitheridentical nor all at critical size, rather large sizes (several microns)could also exist. Besides, due to large number of particles formed,the probability of particleeparticle attachment is possible and evenlarger sizes (up to hundreds of microns) could form.
0 0.4 0.8 1.2 1.6 2
time (hr)
0.0001
0.001
0.01
0.1
( h t
w
o r G
e l c i t r a P
μ ) s /
m
Fig. 9. Growing rate for ice particle as a function of time.
Hence the assumption made here is based on the conclusionthat the particles leaving the orifice have different sizes and theapproach used to describe the deposition model in this study isbased on this fundamental hypothesis.
6.2. Calculating deposition distance
Based on the procedure elaborated in Section 4.3, the travelingdistance in the turbulent region becomes:
X1 ¼ upðyiÞ:t (20)
The total distance includes, as discussed in Section 4.3, thedistance traveled by the particle, either due to sublayer forces or asa result of bouncing.
0.01 0.1 1 10r *
0
0.2
0.4
0.6
0.8
n *
Fig. 11. Particle distribution as a function of its size.

0.001 0.01 0.1 1 10
x(m)
0.0001
0.001
0.01
0.1
1
10
) m
m
( Y
Particle dia= 10 µ mδ
Fig. 12. Deposition distance of a 10-mm particle calculated based on influence of flowmotion and force balance.
0.1 1 10 100 1000
Particle diameter (µm)
0.1
1
10
100
1000
10000
)m(
ecnatsidnoitisoped
Fig. 14. Deposition distance as a function of particle size initially located at the pipecenterline.
E. Jassim et al. / Journal of Natural Gas Science and Engineering 2 (2010) 163e177 171
6.2.1. Trajectory of a single particle (dp < d)The following data, obtained from the actual saturated air test, is
used as the initial conditions in the simulations to track andcalculate the distance from the initial position of a single iceparticle (x0, yi) to the point of resting on the wall (Xt, 0):
Smooth pipe : Dpipe ¼ 20 mm; f
¼ 0:023;Rew32800 and dw 56:7 mm
Fig. 12 illustrates the deposition of a 10-mm particle initiallylocated at the centre of the pipe where u(yi)¼UN. Using theconditions mentioned earlier, the results show that the particletravels w7m before entering the boundary layer (BL) region. In theBL, the particle movese1 mm then deposits on the wall. Although
100 200 300 50 150 250 350
d p ( μ m)
0
20
40
60
80
10
30
50
70
) m
c (
e c n a t s i d n o i t i s o p e d
Traveling distance rebound In turbulent region Total
Fig. 13. Deposition distance of particles (dp>d) calculated based on influence of flowmotion and bouncing.
the particle migration in the BL region is minor for this particularsize, very small particles tend to travel a significant distance in thisregion. For instance, particles with 0.1-mm diameter travele5995 min the turbulent flow ande1.5 m in the BL region.
6.2.2. Trajectory of single particle (dp > d)Particles having sizes greater than the sublayer thickness
experience bouncing process as a result of collisions in the wallregion. The total distance that the particle travels is now equivalentto the migration distance in the turbulent regime plus the distancetraveled due to bouncing effect. Fig. 13 shows the depositiondistance as a function of the particle size for particle diametersgreater than the sublayer thickness. The three curves in this figureindicate in the order: the distance caused by bouncing, the distance
4 8 12 16 20
Pipe diameter (mm)
0
20
40
60
)mc(
ecnatsidnoitisoped
ModelExperiment
Fig. 15. Deposition distance predicted by simulation and measured during tests asa function of pipe size.

Table 3Percent error of deposition distance observed in experimental tests and predicted bysimulation for Re ¼ 32 800 (Fig. 15).
Pipe Diameter (cm) Model prediction (cm) Test result (cm) % discrepancy
6.36 19.1 15 21.59.53 28.7 24 16.412.70 38.2 40 4.719.05 57.3 55 4.0
Table 4comparison of the deposition distance for ice and water particles observed in thetests and predicted by the simulation for Re ¼ 32 800.
Dpipe
(mm)Test result(cm)
Liquid droplet(cm)
Ice particle(cm)
% error ofdroplet
% error of iceparticle
6.35 25 19.12 27.66 23.5 10.649.525 30 28.7 33.95 4.33 13.1712.7 40 38.2 41.93 4.5 4.819.05 55 57.3 59.6 4.2 8.4
E. Jassim et al. / Journal of Natural Gas Science and Engineering 2 (2010) 163e177172
traveled in the turbulent region, and the total distance traveled bythe particle. The figure also shows that as the particle becomeslarger, the inertia of the particle increases and hence the bouncingdistance will shrink.
A very important conclusion is shown in Fig. 14, which repre-sents a combination of results shown in Figs. 12 and 13. Thereduction in the total deposition distance will asymptoticallyapproach a certain value. Hence the conclusion reached fromFig. 12, which stated that the deposition distance decreaseddramatically following an increase in the particle size, should becorrected as follows: For particles larger than a certain diameter,called hereafter deposition critical size, there is no significantinfluence of the particle size on the deposition distance. Conse-quently, particles having sizes greater than the deposition criticalsize will deposit at the same position. In this example, (ice forma-tion studies), particles larger than 200 mmwill deposit almost at thesame location (e0.6 m). Therefore the deposition critical size for thisexample is about 200 mm. Therefore deposition will start at about0.6 m and all smaller particles will travel further until they becomelarge enough to start settling on the wall.
6.3. Experimental results and preliminary model validation
Several tests were conducted using four tubes and at differentReynolds numbers. The transparent tubes used for the tests weree1.83m (6ft) in length and their diameters were varied from ¼ to 3/4inches. The tests for each tubewere conducted using three differentflow rates controlled by changing orifice inlet pressure throughcontrolling the air pressure at the compressor discharge. Position of
0 4 8 12 16 20
Dpipe (mm)
0
20
40
60
)mc(
ecnatsidnoitisoped
Liquid dropletIce particleExperiment
Fig. 16. Comparison of deposition distance predicted by simulation for different typesof particles (assumption of particles remaining in ice or liquid forms when reachingwall) with experimental data as a function of the pipe size.
the first droplets deposit on the wall was observed and the distancefrom the orifice to that position was measured.
Based on the procedure of the experiments described in Section5, the temperature of the air at the exit of the orifice drops slightlybelow water freezing point. The temperature right after the orificestarts to increase rapidly and reaches almost the orifice inlet valuewithin a short distance (e 2 cm). Theory and numerical analysismatched the observations. Both confirmed that the ice particles, ifformed in the orifice, thawed out due to either the rapid increase inthe pressure and temperature after the orifice or as a result of theheat transfer with the surrounding. The latter means that the iceparticles maintained in the solid form during migration in the flowthen melted after deposited on the tube wall. In the present anal-ysis both situations are studied by including the bouncing effect forsolid particles and ignoring such effect for water droplets.
During the tests the following parameters were recorded: exitair standard volume flow rate Qst; inlet P1 and T1; and system exitconditions Pex and Tex. The given data were reported in standardcondition (101 325 Pa; 15 �C).
The measured data were compared with the model predictionsto confirm the level of agreement and to validate the accuracy ofthe simulations. Themodel presumed that various sizes of particles,ranging from the critical size (rc ¼ 11.5 nm) to several hundredmicrons (e200 mm), are leaving the orifice. It is concluded fromFig. 14 that particles larger than this range have no influence on thedeposition distance. Based on the assumption, the model isdesigned to predict the deposition distance of these sizes using theapproach discussed in Section 4.3.
Fig. 15 illustrates the distance from the orifice to the location ofdeposition as a function of pipe size when Reynolds number is32.8 � 103. The diagram shows a fair agreement between theexperiment and the model prediction. As shown in Table 3 thedistance of the deposition increases with the pipe size.
Finally, comparison of the ice particles with water droplets ispresented by studying the influence of the bouncing process. Fig. 16illustrates the deposition distance as a function of the pipe size withandwithout bouncingeffect, i.e. assumption of particles remaining inthe solid or liquid states, respectively. It could be concluded from thediagram that the discrepancy of the deposition distance predicted bythe simulation for the liquid droplets and solid particles with thatobserved in the tests for all pipes is within a reasonable range. Thepercent errors in model prediction of deposition distance for theliquiddroplets and ice solidparticleswith respect to theexperimentalresults are listed in Table 4. The results show good agreementbetween the simulations prediction and the tests observation.
Table 5Percent of uncertainty error for saturated air tests.
Re % error
Size (3/4”) Size (1/2”) Size (3/8”) Size (1/4”)
32 800 3.3 3.1 3.8 4.135 300 3.4 3 3.5 3.137 300 3.1 3 2.5 2.6

Table 6Data recorded from a typical propane test.
Suction Discharge Point 2 Point 3 Point 4
Temperature (�C) 3 63 60 8.0 5.5Pressure (KPa) 82.74 455 413.7 193 193Standard flowrate
(m3/s)13 � 10�3
Corrected flowrate(m3/s)
4.28 � 10�3
Table 7Boundary conditions for typical saturated propane simulations.
Parameters Values Units Description
Inlet Pressure 1.95 � 105 Pa gaugeTotal temperature 279 K
Exit Pressure 1.93 � 10�5 Pa gaugeTotal temperature 278 K
Lateral Wall Temperature 272 K Isothermal
E. Jassim et al. / Journal of Natural Gas Science and Engineering 2 (2010) 163e177 173
6.4. Analysis of uncertainty for saturated air experiments
There is a fact that uncertainties exist in virtually all computa-tional, analytical, or experimental engineering analyses. Thepurpose of this section is to manifest the uncertainty analyses,whichwas used in the planning of experimental facilities. Details onthe approach used in the study can be found in References (21,22).
During the tests, the independent variables or the measuredparameters were: flow temperature and pressure (T, P), standardflowrate (Q0), pipe diameter (Dpipe), and the standard temperatureand pressure (T0, P).
Therefore, the uncertainty equations of the deposition distance(Sd) become:
Sd ¼ Sd�Q0;Dpipe; T; T0; P; P0
�(21)
USd ¼24�vSd
vQ0dQ0
2þ� vSdvDpipe
dDpipe
2þ�vSdvT dT2þ�vSdvT0
dT02þ�
vSdvP dP
2þ�vSdvP0dP02
351=2
(22)
The simulation model was run for data obtained from a typicaltest by keeping all the parameters but one constant and the resultsof the deposition distances were compared with the base case(exact values of all parameters) to find out the discrepancy in thedeposition distances responding to the error in a certain parameter.Following the procedure that is elaborated in Appendix A3 forpredicting the uncertainty of deposition distance for typical case,Table 5 shows the percent error in the deposition distance fordifferent pipe size and various Reynolds numbers.
10
7. Propane-hydrate testsPropane was used as the working fluid since the propanehydrate can form above water freezing temperature under rela-tively low pressures.
Fig. 17. Hydrate particles deposit on the pipe wall (magnification factore2.73).
7.1. Test procedure
A compressor was used to circulate the gas within the system.The gas loops were charged with propane and the compressor wasstarted. The maximum pressure recorded in the transparent pipewas around 293 kPa ab (w42.5 psi). The hydrate equilibriumtemperature (teq) relative to this pressure ise3 �C (Carroll, 2003). Thesmall chamber was adjusted to a temperature slightly above teq(6 �C) to prevent any hydrate formation in saturation zone. Thetemperature in the large chamber (hydrate formation zone) was setto a temperature below teq (�2 �C) to induce a driving force largeenough to stabilize the nucleation and particle growth stable.
It should be noted here that the saturator was originally locatedbefore the cooling coil outside of the small chamber. However, thetemperature of the gas heading to the saturator was observed to beexcessively high making the gas oversaturated leading to excessivecondensation in the saturation zone. The condensed water over-loaded the filter separator and ended up as free liquid in thetransparent tube in the hydrate formation zone. Since the purposeof this study was to investigate the hydrate formation in theabsence of free water, it was decided to saturate the gas, under lowtemperature of saturation zone, by moving the saturator todownstream of the coil inside the small chamber.
The data shown in Table 6 were recorded during the tests andthe flow rates were corrected using Eq. (A1.1) in Appendix A1. Table6 shows the recording data and the corrected flow rate for a typicaltest using the 3/4 ” pipe. From the table, the following parameterswere calculated:
0.1 1 10 100 1000 10000
radius (µm)
0.001
0.01
0.1
1
(etar
htworg
elcitraPμ
)s/m
Fig. 18. Propane hydrate growth rate as a function of particle size.

1 10 100 1000
time (hr)
0.01
0.1
1
10
100
1000
10000
(retemaid
elcitraPμ
)m
Fig. 19. Propane hydrate diameter as a function of time.
4000 8000 12000 16000 Re
72
76
80
84
88
92
) m
c (
e c n a t s i d n o i t i s o p e d
Model Experiment
Fig. 20. Comparison of hydrate deposition distance predicted by proposed model andexperimental results as a function of Reynolds number.
E. Jassim et al. / Journal of Natural Gas Science and Engineering 2 (2010) 163e177174
Gas superficial velocity : Ug ¼ 15:02m=s;
Gas density : r ¼ 5:6 kg=m3; and
Reynolds number : Re ¼ 14 560
These parameters, along with the environmental temperatureinside the large chamber, were used as the boundary conditions inthe simulation model to predict the deposition of the hydrateparticles.
7.2. Observations
As shown in Fig. 17, propane hydrate with different particle sizeswas formed. It is presumed that due to the particleeparticleattachment (coalescence within the gas and on the tube wall),formation of various critical sizes, and different growth times,a range of particle sizes were formed.
After the completion of the test, the distance from the orifice tothe location of the first observable particle was measured. Then thepipe was dismantled and abandoned for a while to assure therewere nowater droplets remaining in the pipe before doing the nexttest. This procedure was repeated three times for different flow-rates to investigate the influence of the Reynolds number on thedeposition distance.
Table 9Uncertainty in parameters and total uncertainty for test no. (1).
Parameter Change in the /DRe/ /DSd/(mm)
7.3. CFD and simulation results
The model of nucleation needs the distribution of fluid prop-erties, e.g., temperature, velocity, pressure, along the pipe, thegoverning transport equations of air-vapour mixture. These
Table 8Measured deposition distance and model predictions for various Re.
Test # Re Sd theory (cm) Sd measured (cm) Deviation %
1 14 500 89.1 90.5 1.62 8400 82.3 83.7 1.73 4300 74.6 73.5 1.5
properties were numerically determined using commercial soft-ware (the FLUENT software was used in this research).
The boundary conditions are listed in Table 7, which representsthe data measured for typical test conditions.
7.4. Nucleation and growth of hydrate particles
The data obtained from FLUENT were used to describe theprocess of nucleation and growth of the hydrate particles. Masstransfer and hydrate formation reaction kinetics are the dominantprocesses in the nucleation and growth of the hydrate particles.
Fig. 18 shows the growth rate of hydrate particles in themicrometer scale as a function of size (diameter). Since masstransfer is the dominating factor of growth after the hydrate wasjust nucleated, the rate of growth will decrease as the size ofhydrate grows. However, the reaction kinetics will start to be thecontrolling factor in the growth process as the particle size growsfurther. Therefore there is a dip (valley) in the growth rate diagram.That means that the elapsed time required for hydrate particles togrow to several hundreds of microns is relatively long but the trenddramatically change as the particle size increase beyond 100microns and a sharp change of particle diameter is observed; seeFig. 19.
7.5. Deposition distance
The data of the measured deposition distance from the orificeexit to the first deposition spot were recorded with a measurement
parameter
Flowrate (Q0) �2% 306 3Diameter (Dpipe) �1% 151 2System Temperature (T) �1K 55 1.3System Pressure (P) �13.8 kPa 53 1.3Ambient Temperature (T0) �1K 720 6.6Ambient Pressure (P0) �13.8 kPa 2109 19USd 20.5

Table 10Uncertainty in parameters and total uncertainty for test no. (2).
Parameter Change in theparameter
/DRe/ /DSd/(mm)
Flowrate (Q0) �2% 170 2Diameter (Dpipe) �1% 84 1System Temperature (T) �1K 30 0.5System Pressure (P) �13.8 kPa 30 0.5Ambient Temperature (T0) �1K 400 5.7Ambient Pressure (P0) �13.8 kPa 1170 17.3USd 18.36
Table 11Uncertainty in parameters and total uncertainty for test no. (3).
Parameter Change in theparameter
/DRe/ /DSd/(mm)
Flowrate (Q0) �2% 82 1.9Diameter (Dpipe) �1% 41 1.4System Temperature (T) �1K 15 0.2System Pressure (P) �13.8 kPa 14 0.2Ambient Temperature (T0) �1K 194 5.1Ambient Pressure (P0) �13.8 kPa 570 16USd 16.96
E. Jassim et al. / Journal of Natural Gas Science and Engineering 2 (2010) 163e177 175
tape with millimetre precisions. The deposition measurement datawere compared with the results obtained from the simulation.Table 8 illustrates such comparison of deposition distances withthose predicted from the model for three tests performed for a 3/4 ”pipe under the conditions where Reynolds numbers were 14500,8400, and 4300, respectively. Fig. 20 shows the discrepancybetween the deposition distance predicted by the theory and theexperiments. Themodel predictions were in a very good agreementwith the experiment data.
7.6. Uncertainty analysis
Following the procedure elaborated and using Eq. (22), theuncertainty in the deposition distance and the precision of eachparameter are calculated. Tables 9e11 demonstrate the discrepancyin the deposition distance for each measuring parameter and thetotal uncertainty error for each test.
8. Grid independency
Since the boundary layer (d) in the orifice is of interest in thepresent study, for all CFD analyses, a non-uniformmeshwas used inthe y direction, and the smallest elements were placed close to theorifice wall. The parameters used were: first row a ¼ 0.1d; aspectratio, the ratio of the two consecutive mesh thicknesses, (tiþ1/ti ¼ 1.2) and the depth of the boundary layer meshing region gt; d.Starting from thewall, the height of the first grid row should be lessthan the boundary layer thickness to describe the flow in thatregion more precisely.
A structured grid with 575 340 cells was used for the calcula-tions. Resolutionwas found to be independent of cell dimensions asseen in Table 12. The table shows the number of grids that led to
Table 12Mesh generation and grid dependency.
No. of cells % Errors inmass flow
263 980 2.5 � 10�2
575 340 3.7 � 10�4
672 250 4.3 � 10�4
convergence for each case with total mass error in inlet/outlet massflow. It is clearly shown that meshing with more than 575 340 gridsdid not significantly affect the mass residual for convergence, henceit can be concluded that the solutions were grid independent.
9. Conclusion
The particle deposition theory was proposed to predict thedeposition of the hydrate particles formed in a gas/vapour domi-nated flow. Computational fluid dynamics was used to configurethe carrier fluid through solving the NaveireStokes equation forturbulent flow. A new approach was developed to estimate thedistance of particle migration from the spot of formation to thepoint of deposition.
The concept of the particle deposition velocity is introduced tohelp to predict the trajectory of the particle motion in the turbulentregion. The model presented in this research proposes a newapproach to track the particlemotionmerged in the sublayer regionusing the forces acting on the particle. For particles with sizes largerthan the sublayer thickness, the model introduces the influence ofthe bouncing concept to explain the near wall effects. This studyalso presented the apparatus employed to validate model resultsusing water saturated air and propane.
The approach and observations of the tests concluded thatparticles within the boundary layer travel further in the flowdirection as a result of external forces (lift, drag, gravity, andadhesion). The bouncing action is the dominant process causinglarge particles to further travel before being attached to the pipewall.
The main conclusions of the research can be summarized asfollows:
1. In the turbulent region, small particles are influenced by themain fluid velocity but the effect diminishes for relatively largeparticles as a result of the high particle inertia.
2. The distance of deposition decreases as the particle sizeincreases. However, the analysis has introduced a certain size ofparticle in which further particle growth has no effect on thedistance of deposition. Such size was called “deposition criticalsize”.
3. The experimental tests were in good agreement with themodel predictions and that within the test conditions, thedeposition distance is linearly proportional to the Reynoldsnumber and pipe size.
4. Formation of hydrate particles are observed to be poly-dispersed since different sizes of particles are formed. Thisobservation is consistent with the analytical correlationderived based on the law of Mass Action (Jassim, 2008).
Acknowledgments
The authors wish to express their gratitude to the: Propel Inc.,Canada, Atlantic Innovation Fund (AIF) through Atlantic CanadaOpportunities Agency (ACOA), Natural Racecourses Canada(NRCan) for financing this project.
Appendix A1
The target of the following analysis is the temperature at orificeexit (T2), Fig. A1.
� Determining actual mass flow:
Using the ideal gas relation:

Fig. A1. Flow through an orifice Plate.
E. Jassim et al. / Journal of Natural Gas Science and Engineering 2 (2010) 163e177176
Qa ¼ Qst :PstPex
:TexTst
(A1.1)
� � � �rex ¼�
PexRTex
�(A1.2)
_ma ¼ rexQa (A1.3)
Where, _ma:actual mass flow (kg/s); Qa: use normal text whereverpossible for instance here you could simply use Qa actual volumeflow rate; rex or here rex: density at system exit; R gas constant
� Stagnation properties:
From mass flow rate, the velocity at orifice inlet (V1), Point 1 inFig. A1, can be determined as follows:
r1 ¼�
P1RT1
�(A1.4)
V1 ¼�
_ma
r1A1
�(A1.5)
Then stagnation pressure and temperature at Point 1 can becalculated using:
T01 ¼ T1 þV21
2Cp(A1.6)
P01 ¼ P1 þr1V
21
2(A1.7)
� Assuming adiabatic reversible process through the orifice, themass flow rate formula listed below used to find out thepressure at Point 2 (John and Keith, 2006).
ffiffiffiffiffiffiffiffiffiffiffiffiffiffiffiffiffiffiffiffiffiffiffiffiffiffiffiffiffiffiffiffiffiffiffiffiffiffiffiffiffiffiffiffiffiffiffiffiffiffiffiffiffiffiffiffiffiffiffiffiffiffiffiffiffiffi2g
RT0ðg�1Þ�P2P0
2=gh�P0P2
ðg�1Þ=g�1ir
_ma ¼1þ 2
p
�P2P0
1=g P0Af (A1.8)
where, P0]P01]P02; T0 ¼ T01 ¼ T02; g: specific heat ratio; and Af:orifice area.
The NewtoneRaphson method can be used in calculating thepressure at the orifice exit.
� The orifice exit temperature now can be found using theisotropic formula:
T2 ¼ T1
�P2P
�ðg�1Þ=g(A1.9)
Fig. A2. Water content of saturated air.
1Appendix A2. Calculation of parameters in Table 2
nv ¼ P
RT¼ 150
8:314� 272¼ 0:067 kg�mole=m3
Diffusion coefficient (Bird et al., 2002)
Critical temperature and pressure for:Air: 133K; 39 atm.Water: 647.1K; 217.75 atm.
DAB ¼ 3:64� 10�4
1:5��
272ffiffiffiffiffiffiffiffiffiffiffiffiffiffiffiffiffiffiffiffiffiffiffiffiffiffiffi133� 647:1
p�2:334
�ð39� 217:75Þ1=3
� ð133� 647:1Þ5=12��
129
þ 118
�1=2
DAB ¼ 0:16366 cm2=s
Sherwood number: assumed to be Sh ¼ 2.0.
Equilibrium water content (yeq):
Using the diagram (A2), the water content at 0 �C and 1.5 bar is:w0.002 kg/m3 air. The water content in molar unit can be calcu-lated as follows:
1 gr�mole of a gas ¼ 22:4 L at atmospheric pressure and
0�C temperature
yeq ¼ 0:002� 103 � 22:4� 10�3
18¼ 2:49� 10�3 gr�mole of water=gr� air
Saturation ratio (S) and actual molar fraction (y):
From Eqs. (4.8) and (4.9), (Jassim, 2008):
S ¼ 1þ DHs�Teq � T
�RT2
(A2.1)
S ¼ yvkyeqvk
(A2.2)

Table A3.2Uncertainty values for saturated air tests
Re USd (mm)
Size (3/4”) Size (1/2”) Size (3/8”) Size (1/4”)
32 800 18.41 12.32 9.22 6.1435 300 18.7 12.44 9.33 6.2537 300 18.61 12.52 9.42 6.36
E. Jassim et al. / Journal of Natural Gas Science and Engineering 2 (2010) 163e177 177
S ¼ 1þ 46:7� 10�3 � 18:314� 2722
¼ 1:076
and
y ¼ 2:68� 10�3 gr�mole of water=gr� air
Critical radius (rc):
The range of flow temperature inside the orifice is 235e272K.Based on that the range of the critical radius would be:
rc ¼ 2� 0:0331000� 8314
29 � T � lnð1:076Þ ¼ ð11:5� 13:37Þ nm
Appendix A3. Uncertainty analysis of measuring data
The sensitivity of the flowmeter device used in the experimentis �2%, the tolerance error in the size of the pipe is �1%, theaccuracy of temperature measurement is within �1 K, and that ofthe pressure measurement is �13.79 KPa (�2 PSI).
The measurement’s errors influence the flow Reynolds numberaccording to the following formula:
Re ¼ UgDpipe
ng¼ 4Q
pDpipeng(A3.1)
where,
Q ¼ Q0 �P0P
� TT0
(A3.2)
The actual flowrate is sensitive to the error of measurementsin the standard flowrate, the system temperature and pressure,and the standard temperature and pressure. Besides, theviscosity of the fluid changes strongly with the temperature(White, 2003). All these parameters will disturb the magnitudeof Reynolds number followed by the value of the depositiondistance (Sd). The following equation, which represents thevariation of kinematics viscosity with temperature for air, wasused in the analysis:
ng ¼ �1:1555� 10�14T3 þ 9:5728� 10�11T2 þ 3:7604
� 10�8T � 3:4484� 10�6
(A3.3)
Where, T is temperature in K, and ng kinematics viscosity in m2/s.Table A3.1 shows such response in the values of Reynolds numberand deposition distance.
Using Eq. (22), the total uncertainty in the depositiondistance would be:
Table A3.1Sensitivity analysis of parameters measured in experimental tests
Parameter Change in the parameter /DRe/ /DSd/(mm)
Flowrate (Q0) �2% 370.7 1.7Diameter (Dpipe) �1% 244.68 1.2System Temperature (T) �1K 66.83 0.3System Pressure (P) �2PSI 2081.09 10.3Ambient Temperature (T0) �1K 85.51 0.5Ambient Pressure (P0) �2PSI 3408.68 15.1
USd ¼ 18:41 mm ¼ 1:841 cm
The measured deposition distance of this typical sample testwas found to be 55 cm. Therefore, the percent error due to uncer-tainty is approximately �3.3%.
Similar procedure is established for all saturated air tests andthe results of the total uncertainty in deposition distance for eachtests is calculated using Eq. (22). Table A3.2 summarizes theuncertainty value for different pipe size and at various Reynoldsnumber while.
References
Bird, R.B., Stewart, W.E., Lightfoot, E.N., 2002. Transport Phenomena, second ed.John Wiley and Sons Inc..
Carroll, J.J., 2003. Natural Gas Hydrate: a Guide for Engineers. Gulf ProfessionalPublication, Amsterdam, The Netherlands.
Chein, R., Liao, W., 2005. Analysis of particle-wall interaction during particle freefall. Journal of Colloid and Interface Science 288, 104e113.
Crowe, C.T., 2006. Multiphase Flow Handbook. Taylor & Francis Group.Dahneke, B., 1971. The capture of aerosol particles by surfaces. Journal of Colloid
Interface Science 37, 342e353.Derjaguin, B.V., Landau, L., 1941. Theory of the stability of strongly charged
lyophobic sols and of the adhesion of strongly charged particles in solutions ofelectrolytes. Acta Physicochim 14, 633e662.
Friedlander, S.K., 1977. Smoke Dust and Haze. Wiley, New York.Hinds, W.C., 1999. Aerosol Technology: Properties, Behaviour, and Measurement of
Airborne Particles, second ed.. Wiley, New York.Israelachvili, J., 1992. Intermolecular and Surface Forces. Academic Press, London,
UK.E. Jassim, Locating Hydrate Deposition in Multiphase Compressed Natural Gas Flow
Lines Using Computational Fluid Dynamics Techniques, PhD Thesis, MemorialUniversity of Newfoundland, St. Johns, 2008.
Jassim, E., Abedinzadegan Abdi, M., Muzychka, Y., 2008. A cfd-based model to locateflow restriction induced hydrate deposition in pipelines. In: Proceedings in the2008 Offshore Technology Conference. OTC 08, Houston, USA.
John, J.E., Keith, T.G., 2006. Gas Dynamics, third ed.. Pearson Prentice Hall.Krupp, H., 1967. Particle adhesion theory and experiment. Adv. Colloid Interface Sci.
2, 111.Lederhos, J.P., Long, J.P., Sum, A., Christiansen, R.L., Sloan, E.D., 1996. Effective kinetic
inhibitors for natural gas hydrates. Chemical Engineering Science 51 (8),1221e1229.
Legendre, D., Daniel, C., Guiraud, P., 2005. Experimental study of a drop bouncing ona wall in a liquid. Physics of Fluids 17 (1), 1e13.
D. Lysne, An Experimental Study of Hydrate Plug Dissociation by Pressure Reduc-tion, PhD Thesis, Norwegian Institute of Technology, University of Trondhiem,Trondhiem, 1995.
Saffman, P.G., 1968. The lift on a small sphere in a slow shear flow. J. Fluid Mech 31,264.
Sloan, E.D., 1998. Clathrate Hydrate of Natural Gases, second ed.. Marcel Dekker,New York. Cap. 2455e464.
Sloan, E.D., 2000. Clathrate hydrates: the other common solid water phase. Ind. Eng.Chem Res 39, 3123e3129.
Sloan, E.D., 2003. Fundamental principles and applications of natural gas hydrates.Nature Publication Group 426, 353e359.
Verwey, E.J., Overbeek, J.T.G., 1948. Theory of the Stability of Lyophobic Colloids.Elsevier, Amsterdam.
Wang, J., Levy, E.K., 2003. Particle motions and distributions in turbulent boundarylayer of air-particle flow past a vertical flat plate. Experimental Thermal andFluid Science 27, 845e853.
White, F.M., 2003. Fluid Mechanics, fifth ed.. McGraw-Hill Inc., New York.Yang, C., Dabros, T., Li, D., Czarnecki, J., Masliyah, J.H.J., 1998. Kinetics of
particle transport to a solid surface from an impinging jet under surfaceand external force fields. Journal Colloid and Interface Science 208,226e240.