Embed Size (px)
Citation preview

Corresponding author: [email protected] (S. Mulenga).
Shahrood University of Technology
Iranian Society of Mining
Engineering (IRSME)
Journal of Mining and Environment (JME)
journal homepage: www.jme.shahroodut.ac.ir
Vol. 11, No. 3, 2020, 643-659. DOI: 10.22044/jme.2020.9506.1861
Blast Design for Improved Productivity using a Modified Available
Energy Method
S. Mulenga1* and R.B. Kaunda2
1-Department of Mining Engineering, School of Mines, University of Zambia, Lusaka, Zambia 2-Department of Mining Engineering, Colorado School of Mines, Colorado, USA
Received 28 March 2020; received in revised form 17 May 2020; accepted 17 May 2020
Keywords
Blasting optimization
Modified available energy
Specific drilling
Average fragment size
Abstract In this work, a new drilling and blasting design methodology is introduced and applied at a case study mine to improve productivity. For the case study copper mine, a blast diameter of 203 mm is proposed to be used in the ore zone to meet the new required production rate of 90mtpa from 75mtpa. Currently, the Konya and Walter’s model is used to generate drilling and blasting design at a blasthole diameter of 172 mm. The new drilling and blast design approach is advantageous in the sense that it generates a lower specific drilling value and predicts an average fragment size compared with the current method being used. In this regard, a modified available energy blast design method that incorporates the blastability index of ore zone in the calculation of the input powder factor is introduced. The results of the blast design simulations at a 203 mm blasthole diameter shows that the modified available energy model generates a drilling and blasting design with a specific drilling value that is 15.3% less than that generated by the Ash’s and Konya and Walter’s models. Further, the modified available energy model generates a blast design with a predicted average fragment size that is 3.4% smaller than that generated by the Ash’s model, and 6.7% smaller than that generated by the Konya and Walter’s model.
1. Introduction Drilling and blasting has remained the most economical method for rock mass fragmentation in the mining and civil engineering operations. This is achieved by drilling a hole in the rock mass, which is then charged with commercial explosives. The explosives are confined by a stemming material and then detonated. The energy released by the explosives during detonation breaks the rock mass into smaller fragments that are easy to handle and process. An efficient rock fragmentation leads to an improved productivity and reduced production costs [1-2]. Unfortunately, the blasting engineers in open-pit mines have commonly developed drilling and blasting designs using the rules of thumb methods and engineering experience alone, which are highly inefficient. Ideally, the layout of these drilling and blast designs should include parameters such as the burden, spacing, blasthole diameter, and blasthole depth based on the sound
engineering practice. Among these parameters, the blasthole diameter significantly affects the production rate at the mine. This is because the blasthole diameter influences the penetration rate, explosive consumption, burden, and spacing. The penetration rate, which in some context is referred to as drillability, is one of the most important parameters for mine planning, development, and economics. Beside the blasthole diameter, the penetration rate is also affected by the controllable equipment parameters and the uncontrollable rock characteristics and geological conditions [3-7]. For a given blasthole diameter and bench height, the empirical blast design methods can generate different specific drilling values based on the burden, spacing, and sub-drill that they calculate. The specific drilling value is defined as the number of meters drilled per meter cubed of the rock mass, and gives an indication of the total number of

Mulenga and Kaunda./ Journal of Mining & Environment, Vol. 11, No. 3, 2020
644
meters drilled per working bench based on the drilling layout. A drilling layout with a lower specific drilling value has fewer meters drilled per working bench compared to a layout with a higher specific drilling value. Lower specific drilling values lead to higher production rates. Therefore, a drilling and blast design with an efficient productivity is required to have a low specific drilling value and produce rock fragmentation of high quality. The objective of this work was to develop and apply a new drilling and blast design approach with the potential to improve mine productivity. When the proposed drilling and blast design method was applied to a mine site case study, it generated a lower specific drilling value and predicted an average fragment size compared with the current method being used. An additional advantage of the proposed blast design method is that the burden, spacing, sub-drill, and stemming for the model can be assessed based on the specific drilling value and predicted average fragment size. A critical literature review of the empirical blast design methods including Anderson [8], Fraenkel [9], Pearse [10], Hino [11], Allsman [12], Ash [13], Langefors and Kihlstrom [14], Hansen [15], Konya [16], Foldesi [17], Praillet [18], Jemino [19], Konya and Walter [20], Carr [21], Olofsson [22], Rustan [23], Energy Transition (ET) theory [24], blastability index [24], and available energy [25] was conducted. The review shows that only the methods by Ash [13], Konya and Walter [20], and the available energy method [25] give clear guidelines regarding the use of the burden, spacing, stemming, and sub-drill. The Langefors and Kihlstrom [14] method prescribes how the burden, spacing, and sub-drill should be calculated but makes no mention of how the stemming length should be determined. The rest of the reviewed blast design method only focuses on the calculation of the burden. As a result, only the methods proposed by Ash [13], Konya and Walters [20], and the available energy method [25] were evaluated at the proposed blast diameter of 203 mm in terms of the specific drilling value and predicted average fragment size. The models or methods proposed by Ash [13] and Konya and Walters [20] calculate the burden, which is one of the most critical parameters that influence rock fragmentation by blasting [26] from the blasthole diameter, rock mass density, and explosive density. The Available Energy (AE) model [25] calculates its burden from the powder factor, cut width, explosive density, and rock density. The input powder factor in the AE model
is calculated using the parameters determined by either the Ash’s model [13] or the Konya and Walter’s model [20]. As a result, the AE model has been found to have the same productivity rate as that of the Ash’s model and the Konya and Walter’s model in terms of the powder factors, specific drilling values, and predicted average fragmentation size. This was deduced from the Blair’s work [25]. To that effect, a Modified Available Energy (MAE) method is proposed in this paper. It proposes that the input powder factor should be calculated from the blastability index proposed by Lilly [27]. This method incorporates the rock mass response to blasting in the estimation of burden, and eradicates the double computation of the burden that exists in the AE model. The proposed MAE method will be assessed against the Ash’s model [13] and the Konya and Walter’s model [13] to establish if the inclusion of more rock mass properties in the calculation of the burden will lead to an improved productivity in the case study.
2. Details of Empirical Blast Design Methods In this section, the details of the empirical blast design methods or models that have been shortlisted via literature review for application and comparison using the case study are presented. The details of the AE blast design model have also been provided to give a background to the proposed model.
2.1. Ash’s Model Ash [13] has developed an equation that weighs the explosive density against the rock density to come up with a burden factor, expressed as follows:
퐾 = 30 ×푆퐺1.4
×160푊푇
(1)
where 푆퐺 is the specific gravity of the explosive and 푊푇 is the unit weight of rock in lb/cubic foot. Then the burden is calculated as follows:
퐵 = 퐾 × (2) (2)
where 퐷 is the diameter of explosives in inches. The Ash’s model ensures that the burden calculated is a good match between the explosive density and the density of the rock mass being blasted. Ash [13] has recommended that other blast design parameters such as the spacing, stemming and sub-drill should be a derivate of the burden. The stemming length should be between 0.7 and 1.0 times the burden, while the sub-drill should be 0.3 times the burden. In addition, the spacing should be between 1.2 and 1.5 times the burden. The Ash’s
Mulenga and Kaunda./ Journal of Mining & Environment, Vol. 11, No. 3, 2020
645
method [13] is intended to be used for the initial blast design purposes.
2.2 Konya and Walter’s Model Konya and Walter [20] have proposed that the burden should result from the weights of the explosive density and rock density. They proposed the following model for the calculation of the burden:
퐵 =2푆퐺푆퐺
+ 1.5 × 퐷 (3)
where 푆퐺 is the specific gravity of the explosive is, 푆퐺 is the specific gravity of rock, and 퐷 is the blasthole diameter in inches Konya and Walter [20] have recommended that the stemming length should be 0.7 times the burden if the crushed rock is used, and 1 times the burden if drill cuttings are used. They further recommended that the sub-drill should be 0.3 times the burden. Konya and Walter [20] have included the stiffness ratio in their calculation of spacing. They defined the stiffness ratio as the ratio of bench height to burden. The spacing can be calculated using Equation (4) when the stiffness ratio is greater than 4.
푆푝푎푐푖푛푔 = 1.4 × 퐵푢푟푑푒푛 (4)
However, when the stiffness ratio is less than 4, the spacing is calculated as follows:
푆푝푎푐푖푛푔 = 12 + (7퐵) /8 (5)
2.3 AE Blast Design Method The AE design method is a method that is based on the concept of AE [25]. AE is defined as the ratio of explosive loading density to powder factor, and it describes the amount of the material that can be moved by a linear foot (0.3 m) of borehole charged with explosives [25]. The AE concept was first developed for large-scale coal surface mines (LSCSMs) and quarries to help bridge the gap between the design powder factor and the budgeting powder factor. Blair [25] has observed that many mines use the average powder to project their explosives budget forecast and financial planning, and yet the powder factor is not used as an input parameter to blast design. Consequently, Blair [25] has proposed a blast design model that includes powder factor and cut width in the calculation of the burden. Blair [25] has suggested several formulas or steps required to complete a blast design using the AE method. This method assumes that the input burden, spacing, stemming length, and sub-drill have already been calculated
from either the Ash’s method or the Konya and Walter’s method. The suggested formulas in his original work were in imperial units. However, Blair [25] suggested formulas that have been converted to SI units for easy understanding. The following are the suggested steps:
1. Calculate the loading density The loading density (LD) is calculated using the following equation:
퐿퐷 = 3.142 × 휌 × 퐷 /4000 (6)
where 휌 is the explosive density (g/cc), D is the blasthole diameter (mm), 퐿퐷 is the loading density (kg/m).
2. Calculate the power column The power column (PC) is calculated as follows:
푃퐶 = 퐻 − 푆푡푙 (7)
where 푃퐶 is the power column (m), 퐻 is the bench height (m), and 푆푡푙 is the stemming length (m) calculated from either the Ash’s model or the Konya and Walter’s model.
3. Calculate the powder factor The powder factor (PF) for the single blasthole is calculated as:
푃퐹 =푃퐶 × 퐿퐷
(퐵 × 푆 × 퐻) (8)
where: 푃퐹 is the powder factor ( ),
푃퐶 is the power column (m), LD is the loading density (kg/m), 퐵 is the burden (m), 푆 is the spacing (m), 퐻 is the bench height (m). This is for bulk explosives, where the diameter of the explosive is equal to the diameter of the blast hole.
4. Calculate the available energy The available energy (AE) is calculated as follows:
퐴퐸 =퐿퐷푃퐹
(9)
where 퐴퐸 is the available energy.
5. Calculate the stemming length In this method, the stemming length (Stl) is calculated relative to AE as follows:
푆푡푙 = √퐴퐸 × 푆푡 (10)

Mulenga and Kaunda./ Journal of Mining & Environment, Vol. 11, No. 3, 2020
646
where 푆푡푙 is the available energy method stemming length and 푆푡 is the stemming factor.
6. Calculate the sub-drill length The sub-drill (Sb) is calculated relative to the stemming length as follows:
푆푏 = 푆푡푙 × 푆푏 (11)
where 푆푏 is the sub-drill length for the available energy model and 푆푏 is the sub-drill factor.
7. Calculate the surface area The surface area (SA) is calculated as follows:
푆퐴 = 퐴퐸 × 1 −(푆푡푙 − 푆푏 )
퐻 (12)
where 푆퐴 is the surface area.
8. Calculate the number of rows The number of rows (NR) required to cross the cut width is calculated as follows:
푁 =퐶푊√푆퐴
(13)
where 푁 is the number of rows and 퐶푊 is the cut width.
9. Calculate the required spacing The spacing for the AE model can be calculated as follows:
푆 =퐶푊푁
(14)
where 푆 is the spacing for the AE model.
10. Calculate the burden Finally, the AE burden is calculated as follows:
퐵 =푆퐴푆
(15)
All the ten steps can be combined into a single burden equation and expressed as shown in Equation 16.
퐵 =
⎣⎢⎢⎢⎢⎢⎢⎢⎢⎢⎢⎢⎢⎢⎢⎢⎢⎢⎡
. × ×× ×
⎝
⎜⎜⎜⎜⎛ . × ×
× × . × ×× × ×
⎠
⎟⎟⎟⎟⎞
⎣⎢⎢⎢⎢⎢⎢⎢⎢⎢⎢⎢⎡
⎷⃓⃓⃓⃓⃓⃓⃓⃓⃓⃓⃓⃓⃓⃓⃓
. × ×× ×
⎝
⎜⎜⎜⎜⎛
. × ×× × . × ×
× × ×
⎠
⎟⎟⎟⎟⎞
⎦⎥⎥⎥⎥⎥⎥⎥⎥⎥⎥⎥⎤
⎦⎥⎥⎥⎥⎥⎥⎥⎥⎥⎥⎥⎥⎥⎥⎥⎥⎥⎤
(16)
As stated earlier, the AE design uses the input powder factor calculated either from the Ash model or the Konya and Walter model [25]. This implies that the method also only matches the explosive
density with the density of the rock mass being blasted. The design flow chart for the AE model [25] is shown in Figure 1.

Mulenga and Kaunda./ Journal of Mining & Environment, Vol. 11, No. 3, 2020
647
Figure 1. AE method design flow chart [25].
3. Proposed Modified Available Energy (MAE) Blast Design Method The proposed MAE blast design method proposes a different approach to calculate the input powder factor from the approach used in the standard available energy (AE) method. The new approach proposes the calculation of powder factor from the blastability index (BI) proposed by Lilly [27], unlike the Ash’s model [13] or the Konya and Walter’s model [20]. This approach eliminates the double burden calculation, which is in the original AE blast design method. It further incorporates the rock mass response to blasting in terms of fragmentation in the computation of the burden. Calculation of the rest of the parameters of design remain unchanged. In brief, the following steps are proposed for the MAE blast design method;
1. Calculate the blastability index (BI) 퐵퐼 = 0.5(푅푀퐷 + 퐽푃푆 + 퐽푃푂 + 푅퐷퐼 + 퐻) (17)
where: 푅푀퐷 is the rock mass description, which is calculated using Equation (18) [29] 푅푀퐷 = 10 + 10푥 , (18)
where 푥 is the in-situ block size
퐽푃푆 is the joint plane spacing,
퐽푃푆 =50 푖푓 푗표푖푛푡 푠푝푎푐푖푛푔 > 1 푚
20 푖푓 푗표푖푛푡 푠푝푎푐푖푛푔 0.1− 1 푚10 푖푓 푗표푖푛푡 푠푝푎푐푖푛푔 < 0.1 푚
(19)
퐽푃푂 is the joint plane orientation = 10 for horizontal, 20 for dipping out of the face, 30 when the strike is normal to face, and 40 for dipping into the face, 푅퐷퐼 is the rock density influence, which is calculated using Equation (20) [27]
푅퐷퐼 = 25 × 휌 − 50, (20)
where 휌 is the rock mass density in tonnes/m3 퐻 is the hardness factor, which is calculated using the following Equation [30]:
퐻 =푈퐶푆 + 23.7
47.6 (21)
2. Calculate the powder factor (modified) The powder factor from the blastability index is calculated as follows:
푃퐹 푘푔푚
= 0.004 × 퐵퐼 × 휌 (22)

Mulenga and Kaunda./ Journal of Mining & Environment, Vol. 11, No. 3, 2020
648
where 푃퐹 is the powder factor calculated from the blastability index.
3. Calculate the loading density (LD) using Equation (6).
4. Calculate MAE MAE is calculated as follows:
퐴퐸 = (23)
where 퐴퐸 is MAE
5. Calculate the stemming length Equally, the stemming length is calculated relative to MAE as follows:
푆푡푙 = 퐴퐸 × 푆푡 (24)
where 푆푡푙 is the stemming length for the MAE model and 푆푡 is the stemming factor.
6. Calculate the sub-drill length The sub-drill is calculated relative to the stemming length as follows:
푆푏 = 푆푡푙 × 푆푏 (25)
where 푆푏 is the sub-drill for MAE and 푆푏 is the sub-drill factor.
7. Calculate the surface area The surface area is calculated as follows:
푆퐴 = 퐴퐸 × 1 −(푆푡푙 − 푆푏 )
퐻 (26)
where 푆퐴 is the surface area for the MAE model.
8. Calculate the number of rows The number of rows required to cross the cut width is calculated as follows;
푁 =퐶푊푆퐴
(27)
where 푁 is the number of rows for the MAE model and 퐶푊 is the cut width.
9. Calculate the spacing The spacing for the MAE model is calculated as follows:
푆 =퐶푊푁
(28)
where 푆 is the spacing for the MAE model. 10. Calculate the burden
Finally, the burden for the MAE model is calculated as follows:
퐵 =푆퐴푆
(29)
Similar to Equation 16, the 10 steps were combined resulting in Equation (30).
The design flow chart for MAE is shown in Figure 2.
퐵 =
⎣⎢⎢⎢⎢⎢⎢⎢⎢⎢⎢⎢⎢⎢⎢⎢⎢⎢⎢⎢⎢⎢⎢⎡
. × ×× ×
⎝
⎜⎜⎜⎜⎜⎜⎛
⎝
⎜⎛ . × ×
× × . × ×× × ×
⎠
⎟⎞
⎠
⎟⎟⎟⎟⎟⎟⎞
푪푾
⎣⎢⎢⎢⎢⎢⎢⎢⎢⎢⎢⎢⎢⎢⎢⎢⎡
⎷⃓⃓⃓⃓⃓⃓⃓⃓⃓⃓⃓⃓⃓⃓⃓⃓⃓⃓⃓⃓
. × ×× ×
⎝
⎜⎜⎜⎜⎜⎜⎛
⎝
⎜⎛ . × ×
× × . × ×× × ×
⎠
⎟⎞
⎠
⎟⎟⎟⎟⎟⎟⎞
⎦⎥⎥⎥⎥⎥⎥⎥⎥⎥⎥⎥⎥⎥⎥⎥⎤
⎦⎥⎥⎥⎥⎥⎥⎥⎥⎥⎥⎥⎥⎥⎥⎥⎥⎥⎥⎥⎥⎥⎥⎤
(30)

Mulenga and Kaunda./ Journal of Mining & Environment, Vol. 11, No. 3, 2020
649
Figure 2. MAE method design flow chart.
4. Specific Drilling and a Review of Empirical Blast Fragmentation Prediction Models As stated earlier, the specific drilling for a drilling and blast design is defined as the number of meters drilled per cubic meter of the rock mass. It can be calculated using Equation 31.
푆푝푒푐푖푓푖푐 푑푟푖푙푙푖푛푔 =퐻 + 푆퐻 × 푆 × 퐵
(31)
where 퐻 is the bench height, 푆 is the spacing, 퐵 is the burden, and 푆 is the sub-drill. The units of specific drilling are m/m3.
Given that the present work uses prediction of the average fragment size as a measure of productivity, it is necessary to highlight a brief survey of the common blast fragmentation models. The earliest and most used fragmentation model to predict the rock fragment by blasting is the Kuznetsov’s fragmentation model [31]. The Kuznetsov’s model is a blasting formula relating the mean fragment size to the specific charge used in the blast. Based on the Kuznetsov’s model and the Rosin Rammler model, Cunningham [32] has developed a model to predict a fragmentation distribution from a blast. Hjenlmberg [33] has developed a model called the SveDeFo model to predict the average fragment
size based on the rock mass properties and the blast design parameters. Otterness et al. [34] have developed a fragmentation prediction model by the correlated blast design parameters for the fragmentation generated. Kou and Rustan [35] have equally proposed an empirical model to predict the mean fragment size. Lownds [36] has predicted fragmentation by rock blasting using the explosive energy. Aler et al. [37] have predicted the blast fragmentation through the multivariate analysis procedures. Morin and Ficarazzo [38] have applied the Monte Carlo simulation to predict rock fragmentation. Ouchterlony [39] has proposed a new fragment size distribution function from the blast design parameters and rock properties. Also Gheibie et al. [40, 41] tried to improve the fragmentation prediction accuracy by modifying the Kuznetsov and Kuz–Ram models. Monjezi et al. [42] have used a fuzzy logic model for the prediction of rock fragmentation by blasting. Kulatilake et al. [43] have used artificial neural networks to predict the mean particle size in rock blast fragmentation. The other researchers such as Chakraborty et al. and Hudaverdi et al. [44, 45], and Faramarmzi et al. [46] have predicted rock fragmentation using the

Mulenga and Kaunda./ Journal of Mining & Environment, Vol. 11, No. 3, 2020
650
multivariate analytical process and rock engineering systems, respectively. Akbari et al. [47] have generated the blast fragmentation prediction models based on the rock properties, blast design parameters, and explosive properties. Kim and Kemeny [48] have developed a model using the in situ block size, post-blast fragmentation, and tensile strength of the rock mass as inputs to predict the specific blast energy. Based on the Kim and Kemeny’s model, Shad et al. [49] have developed a fragmentation model to predict the mean fragment size. The inputs to this model are the specific energy of the explosive, in situ block size, burden, spacing, explosive density, and rock density. The model by Shad et al. [49] had an improved mean fragment size prediction accuracy of 11.37% when compared with the Kuznetsov’s model. To that effect, the result of the average fragment mean size from the shad et al.’s model can be estimated from the Kuznetsov’s model by multiplying by a factor of 88.67%. The Kuznetsov’s model development is given below:
푋 = 퐴푉푄
.
푄 (32)
where 푋 is the average fragment size, 퐴 is the rock factor, 푉 is the rock volume in cubic meters, and 푄 is the mass (kg) of TNT containing the energy equivalent of the explosive charge in each blasthole. The relative weight strength on TNT compared with ANFO (ANFO = 100) is 115. Hence, Equation (32) based on ANFO instead of TNT can be re-written as:
푋 = 퐴푉푄
.
푄푆115
(33)
where 푄 is the mass of the explosives used (kg) 푎푛푑 푆 is the relative weight strength of the explosive to ANFO since: 푉푄
=1퐾
(34)
where K is the powder factor (specific charge) with units of kg/m3 . Now, Equation (33) can be written as:
푋 = 퐴(퐾) . 푄푆115
(35)
Therefore, the predicted mean fragment size using the Shad et al. [49] model can be estimated using Equation 36.
푋 = 0.8863퐴(퐾) . 푄푆115
(36)
Equation (36) can be used to predict the average fragment size for the blast designs generated by the Ash’s model and the Konya and Walter’s and MAE’s models. Note that the powder factor in the prediction of the average fragment size only considers the explosive column above grade. It does not include explosive in the sub-drill portion. In an attempt to better quantify the selection of the rock factor A, the blastability index initially proposed by Lilly [27] has been adapted for this application by Cunningham [32]. The rock factor can be calculated from the blastability index using the following equation: 퐴 = 0.06 × (푅푀퐷+ 퐽푃푆 + 퐽푃푂 + 푅퐷퐼 +퐻) (37)
5. Case Study In order to test the new design approach, it was applied at a surface mine X in Zambia, Africa. The mine uses the conventional drilling and blasting to fragment the rock mass and utilizes the conventional shovels and trucks for loading and hauling of ore and waste. The drilling and blasting designs are developed using the Konya and Walter’s [20] method. The drilling and blasting parameters currently used are shown in Table 1. From 2016, the mine has been mining about 75 Mtpa of ore. Currently, the mine seeks to increase the production of ore from 75 Mtpa to 90 Mtpa from 2020 going forward. In order to achieve this, a blasthole diameter of 203 mm has been proposed to be used in the ore zone. The mine requires a new blast design to be used for the proposed blasthole diameter with improved productivity in terms of the specific drilling value and average fragment size.
Table 1. Current drilling and blasting design parameters.
Description Blast parameter Powder factor 0.72 kg/m3
Bench height 12 m Burden 4.6 m Spacing 5.5 m
Hole diameter 172 mm Sub-drill 1.5 m
Stemming length 3.2 m Stemming material Crushed stone
Explosive type AEL SD130 Explosive density 1.0 g/cc Specific drilling 0.044

Mulenga and Kaunda./ Journal of Mining & Environment, Vol. 11, No. 3, 2020
651
6. Materials and Methods Geological mapping for structural features in the orebody zone, schist, was done using window mapping. The company standard operating procedure was followed during the mapping process. Therefore, only safe and accessible faces were mapped. More than 40 faces were mapped during the exercise. The joint plane spacing (JPS) and joint plane orientation (JPO) were determined using the measuring tape and the Clar campus, respectively. The persistence of each joint set was also noted. The in situ block size was estimated from the average joint spacing. The rock mass description (RMD) was then calculated using Equation (18). The rock samples from the ore zone were collected for laboratory testing to determine the rock density and the uniaxial compressive strength. The rock density index (RDI) and the hardness factor were calculated using Equations (20) and (21), respectively. The Lilly’s [27] methodology (Equation 17) was then used to determine the blastability index, and the input powder factor for the MAE method was calculated using Equation (22). The blast design calculations for the Ash’s model [13], Konya and Walter’s model [20], and MAE model were implemented using Microsoft Excel. The calculations were carried out for the proposed 203 mm blast hole. These calculations were carried out at a constant bench height of 12 m, the explosive density of 1.0 g/cc, and the stemming factor of 0.7. The corresponding sub-drill factor was 0.3 for the Ash’s and Konya and Walter’s models, while 0.375 was used for MAE. For MAE, the calculation was made at the constant powder factor of 0.7 kg/m3 and the constant cut width of 13.5 m. The powder factor for the Ash’s model [13] and the Konya and Walter’s model [20] were calculated using Equation (8). The powder column did, however, exclude the explosives in the sub-drill. This was because the same powder factors were used in the prediction of the average fragment size. The specific drilling values for the blast designs generated by the Ash’s [13], Konya and Walter’s [13], and MAE models were calculated using
Equation (31), and the predicted average fragment size was calculated using Equation (36). The results of the specific drilling and average fragment size from the Ash's model [13] and the Konya and Walter's model [20] were compared with the results obtained from the MAE model using the percentage match. The percentage match between values A and B is calculated as the ratio of A and B multiplied by 100. If the percentage match is less than 100, it means that the value of A is less than B. Likewise, if the value of the percentage match is greater than 100, it means that the value of A is greater than the value of B [25].
7. Results 7.1. Calculating blastability Index The joint spacing distribution for the ore zone hoisted in schist is shown in Figure 3. The joint distribution in schist appears to be lognormal and skewed to the right. The overall skewed of the distribution shows a predominance of the lower measurement of joint spacing with spacing between 0.1 m and 1.0 m followed by the spacing between 1.1 m and 2 m. The data was treated for outliers, and the average joint spacing of 1.24 m was obtained, which was approximately the in situ block in schist. Using Equations (18) and (19), the values for the RMD and JPS ratings became 22.4 and 50, respectively. The box plot for the distribution of joint in schist is shown in Figure 4. The collective effect of joint plane orientation was used to arrive at the JPO rating for the rock mass. The overall orientation of the joints was dipping out of the face, and therefore, the JPO rating of 30 was assigned. The Stereoplot of the major joints in schist is shown in Figure 5. The results of the rock density ranged from 2.75 t/m3 to 3.1 t/m3 with an average value of 2.79 t/m3. The average value of the rock density was used as an input in the calculation of RDI giving the value of approximately 20. The average value of 100 MPa was obtained for the uniaxial compressive strength. This was used to obtain the hardness factor value of 3. The blastability index value of 62.7 was obtained using Equation (17).

Mulenga and Kaunda./ Journal of Mining & Environment, Vol. 11, No. 3, 2020
652
Figure 3. Joint space distribution in schist. Figure 4. Box plot of joint spacing distribution in
schist.
Figure 5. Stereoplot of the major joint sets in schist.
7.2. Blast design simulation The blast design simulation using the blasthole diameter range of 63-273 mm was carried out for the Konya and Walter’s [20], Ash’s, [13], and MAE model. The burden spacing ratio of 1.2 was used for the Ash’s model. The blastability index of 62.7 was for the MAE model simulations. A constant rock mass density of 2.79 t/m3 and an explosive density of 1.0 g/cc were used during the simulations.
The resultant specific drilling values and mean fragment size from the Konya and Walters’s [20] and Ash’s [13] models were compared with those generated by MAE using the percentage match. The percentage match chart tracks the difference between the individual entities within the two datasets. The results obtained are presented in Figures 6 and 7.

Mulenga and Kaunda./ Journal of Mining & Environment, Vol. 11, No. 3, 2020
653
Figure 6. Percentage match for specific drilling and average fragment size for Konya and
Walter vs. MAE.
Figure 7. Percentage match for specific drilling and average fragment size for Ash vs. MAE.
The sample of the simulation results at the proposed blasthole diameter of 203 mm for the
Ash’s model [13], Konya and Walter’s model [20], and MAE model are presented in Table 2.
Table 2. Blast design parameters generated by Ash [13], Konya and Walter [20], and MAE. Ash’s model
Diameter (mm)
Exp. density (g/cm3)
Rock density
t/m3
Bench height
(m)
Burden (m)
Spacing (m)
Stemming (m)
Sub-drill (m)
Powder factor Kg/m3
Specific drilling m/m3
Average fragment size
(cm) 203 1 2.79 12 5.3 6.4 3.7 1.6 0.67 0.034 25.7
Konya and Walter’s model
Diameter (mm)
Exp. density (g/cm3
Rock density
t/m3
Bench height
(m)
Burden (m)
Spacing (m)
Stemming (m)
Sub-drill (m)
Powder factor Kg/m3
Specific drilling m/m3
Average fragment size
(cm) 203 1 2.79 12 5.4 6.2 3.8 1.6 0.66 0.034 26.6
MAE
Diameter (mm)
Exp. density (g/cm3
Rock density
t/m3
Bench height
(m)
Burden (m)
Spacing (m)
Stemming (m)
Sub-drill (m)
Powder factor Kg/m3
Specific drilling m/m3
Average fragment size
(cm) 203 1 2.79 12 5.9 5.9 4.7 1.7 0.7 0.029 24.8
The blastability index input was varied from 40 to 103 at a constant blasthole diameter of 203 mm to observe the effects of varying blastability index on specific drilling and mean fragment size. The effects of varying the blastability index on specific
drilling for the Konya and Walter’s, Ash’s, and MAE models are present in Figure 8. Likewise, the effects of varying the blastability index on the average fragment size for the Konya and Walter’s, Ash’s, and MAE models are presented in Figure 8.

Mulenga and Kaunda./ Journal of Mining & Environment, Vol. 11, No. 3, 2020
654
Figure 8. Effect of the blastability index on specific
drilling. Figure 9. Effect of blastability index on the average
fragment size.
8. Discussion The blastability index of 62.7 was calculated from the schist or the ore zone rock mass characterization. The blastability obtained was used to calculate the powder factor, which was used as an input into the MAE model. The specific drilling value and the average fragment size generated by the MAE model were compared with those generated by the Ash’s [13] and Konya and Walter’s model [20], as shown in Figures 6 and 7. The specific drill percentage match for Konya and Walter vs. MAE was less than 100% up to the blasthole diameter of 83 mm, as shown in Figure 6. These results mean that for a blasthole of less than 83 mm, the Konya and Walter’s model [20] generated lower specific drilling values compared to the MAE model, and had a more productivity in terms of the specific drilling. The average fragment size percentage match of Konya and Walter vs. MAE was greater than 100% for the blasthole diameter range of 63-273 mm. The percentage match graph showed increasing trends on both sides of range with the minimum percentage match occurring at a blasthole diameter of 143 mm. This result means that for all the possible blasthole diameter ranges, the MAE model generates a lower mean fragment size compared to the Konya and Walter model [20]. Therefore, the MAE model has a better productivity compared with the Konya and
Walter’s model [20] in terms of both the specific drilling and the average fragment size at blasthole diameters larger 83 mm. The specific drilling percentage match for Ash vs, MAE models was greater than 100% for the blasthole diameter range under consideration, as shown in Figure 7. These results obtained equally mean that the MEA model generates lower specific drilling values compared with the Ash’s model [13]. However, the specific drilling percentage match curve has a negative gradient, indicating that at larger diameters (beyond 364 mm), the Ash’s model [13] will generate lower specific values compared to the MAE model. The average fragment size percentage match for Ash vs. MAE was less than 100% up to the blasthole diameter of 172 mm, as shown in Figure 7. This means that for blasthole diameters less than 172 mm, the Ash’s model [13] generates average smaller fragment size values compared to the MAE model. Therefore, the MAE model has a better productivity compared to the Ash’s model [13] in terms of the specific drilling and average fragment size for blasthole diameters between 172 mm and 364 mm. At the proposed blasthole diameter of 203 mm, the percentage match results of MEA vs. Ash and MAE vs. Konya and Walter for powder factor, specific drilling, and average fragment size are presented in Table 3.
Table 2. Comparison of results from MEA method against Ash method [13] and Konya and Walter method [13] for Powder factor, Specific drilling and Average fragment size.
Powder factor Specific drilling Average fragment size MAE Ash % Match MAE Ash % Match MAE Ash % Match 0.7 0.67 104.5 0.029 0.034 84.7 24.8 25.7 96.5
Powder factor Specific drilling Average fragment size MAE Konya % Match MAE Konya % Match 0.7 0.66 106 0.029 0.034 84.7 24.8 26.6 93.2
The results obtained show that the specific drilling generated by the MAE model is 15.3% less than
that generated by the Ash’ model and the Konya and Walter’s model. Furthermore, MAE generates
Mulenga and Kaunda./ Journal of Mining & Environment, Vol. 11, No. 3, 2020
655
an average fragment size that is 3.4% smaller than the average fragment size generated by the Ash’s model and 6.7% smaller than that generated by the Konya and Walter’s model. The blastability index was varied at a constant proposed blasthole diameter of 203 mm. The results obtained showed that MAE had lower specific drilling values compared with the Konya and Walter’s model [20] and Ash’s model [13] up to the blastability index of approximately 76, as shown in Figure 8. Equally, MAE generated a lower mean fragment size compared to both the Konya and Walter’s [20] and Ash’s models [13] up to the blastability index of approximately 85, shown in Figure 9. This means that MAE has a higher productivity in terms of the specific drilling and average fragment size compared with both the Ash’s [13] and Konya and Walter’s [20] models at
the proposed blast diameters in the region of the pit were the blastability index of the rock mass is less than 76.
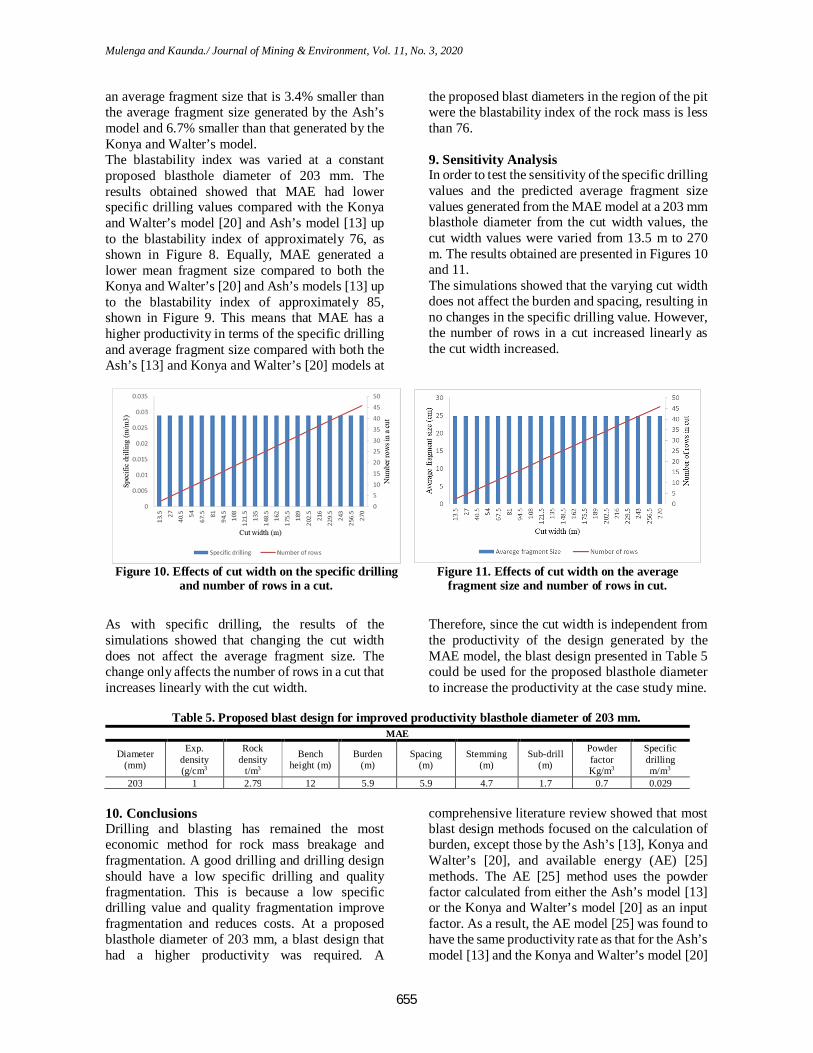
9. Sensitivity Analysis In order to test the sensitivity of the specific drilling values and the predicted average fragment size values generated from the MAE model at a 203 mm blasthole diameter from the cut width values, the cut width values were varied from 13.5 m to 270 m. The results obtained are presented in Figures 10 and 11. The simulations showed that the varying cut width does not affect the burden and spacing, resulting in no changes in the specific drilling value. However, the number of rows in a cut increased linearly as the cut width increased.
Figure 10. Effects of cut width on the specific drilling
and number of rows in a cut. Figure 11. Effects of cut width on the average
fragment size and number of rows in cut.
As with specific drilling, the results of the simulations showed that changing the cut width does not affect the average fragment size. The change only affects the number of rows in a cut that increases linearly with the cut width.
Therefore, since the cut width is independent from the productivity of the design generated by the MAE model, the blast design presented in Table 5 could be used for the proposed blasthole diameter to increase the productivity at the case study mine.
Table 5. Proposed blast design for improved productivity blasthole diameter of 203 mm. MAE
Diameter (mm)
Exp. density (g/cm3
Rock density
t/m3
Bench height (m)
Burden (m)
Spacing (m)
Stemming (m)
Sub-drill (m)
Powder factor Kg/m3
Specific drilling m/m3
203 1 2.79 12 5.9 5.9 4.7 1.7 0.7 0.029
10. Conclusions Drilling and blasting has remained the most economic method for rock mass breakage and fragmentation. A good drilling and drilling design should have a low specific drilling and quality fragmentation. This is because a low specific drilling value and quality fragmentation improve fragmentation and reduces costs. At a proposed blasthole diameter of 203 mm, a blast design that had a higher productivity was required. A
comprehensive literature review showed that most blast design methods focused on the calculation of burden, except those by the Ash’s [13], Konya and Walter’s [20], and available energy (AE) [25] methods. The AE [25] method uses the powder factor calculated from either the Ash’s model [13] or the Konya and Walter’s model [20] as an input factor. As a result, the AE model [25] was found to have the same productivity rate as that for the Ash’s model [13] and the Konya and Walter’s model [20]

Mulenga and Kaunda./ Journal of Mining & Environment, Vol. 11, No. 3, 2020
656
in terms of the powder factors, specific drilling values, and predicted average fragmentation size. Therefore, the blast design method proposed by Ash [13] and Konya and Walter [20] were evaluated at the proposed blasthole diameter in terms of the specific value and average fragment size. Further, none of the blast designs methods incorporates the rock mass response to blasting in the design of the blast. Therefore, the modified available energy (MAE) model incorporating the rock mass response to blast was proposed. The proposed MAE model was compared with the Konya and Walter’s model [20] and the Ash’s model [13] in terms of the specific drilling value and the average fragment size. The following conclusions were drawn from the results of the comparisons:
The MAE model has a better productivity in terms of the specific drilling and the average fragment size than both the Konya and Walter’s [20] and Ash’s models [13] between the blasthole diameters of 172 mm and 364 mm in a rock mass with a blastability index of 62.7.
The MAE model at the proposed blasthole diameter of 203 mm and in a rock mass with a blastability index of 62.7 generates a drilling and blast design with lower specific drilling values that are 15.3% less compared with those generated by the Ash’s [13] and Konya and Walter’s [20] models. Further, the MAE model generates an average fragment size that is 3.4% less than that generated by the Ash’s model [13] and 6.7% less than that generated by the Konya and Walter’s model [20].
The MAE model has a higher productivity in terms of the specific drilling and the average fragment size compared to the Ash’s model [13] and the Konya and Walter’s model [20] at the proposed blasthole diameter of 203 mm in rock masses with a blastability index of the rock mass less than the 76.
Therefore, the MAE method can be successfully used to develop a blast design for a mine site. In the case study example discussed, for a proposed blasthole diameter of 203 mm, MAE indicates a higher productivity compared to the Ash’s [13] and Konya and Walter’s [20] methods. MAE is different from the available AE method in the sense that MAE calculates the input powder factor from the blastability index of the rock mass rather than from the Ash’s model [13] or the Konya and Walter’s model [20].
References [1]. Faramarzi, F., Mansouri, H. and Ebrahimi Farsangi, M.A. (2013). A rock engineering systems based model to predict rock fragmentation by blasting. International Journal of Rock Mechanics and Mining Sciences 60, 82-94.
[2]. Karamia A. and Afiuni-Zadehb, S. (2012). Sizing of rock fragmentation modeling due to bench blasting using adaptive neuro-fuzzy inference system and radial basis function. International Journal of Mining Science and Technology 22, 459-463.
[3]. Thuro, K. and Spaun, G. (1996). Introducing the destruction work as a new rock property of toughness referring to drillability in conventional drill and blast tunneling. Rock Mech Rock Eng; 2:707–20.
[4]. Altindag, R. (2004). Evaluation of drill cuttings in prediction of penetration rate by using coarseness index and mean particle size in percussive drilling. GeotechGeol Eng; 22:417–25.
[5]. Köhler, M., Maidl, U. and Martak, L. (2011). Abrasiveness and tool wear in shield tunnelling insoil/Abrasivität und Werkzeugverschleiß beim Schildvortrieb imLockergestein. Geomech Tunn; 4:36–54
[6]. Yarali, O. and Soyer, E. (2013). Assessment of relationships between drilling rate index and mechanical properties of rocks. Tunn Undergr Sp Technol; 33:46–53.
[7]. Inanloo Arabi Shad H., Sereshki F., Ataei M. and Karammozian, M. (2018). Prediction of rotary drilling penetration rate in iron oxide using rock engineering system, International Journal of mining Science and Technology, Volume 28, Issue 3, May 2018, pp. 407-413.
[8]. Anderson, O. (1952). Blasthole burden design-introducing a new formula. Australian Institute of Mining and Metallurgy, Nos. 166–167, pp. 115–130.
[9]. Fraenkel, K.H. (1954). Handbook in Rock Blasting Technique, Part-1, Esselte AB, Stockholm, p. 378.
[10]. Pearse, G.E. (1955). Rock blasting: some aspects on theory and practice. Mine & Quary Engineering, Vol. 21, No. 1, pp. 25–30.
[11]. Hino, K. (1959). Theory and Practice of Blasting. Nippon Kayaku Co., Ltd., pp. 86–89.
[12]. Allsman, P.L. (1960). Analysis of explosive action in breaking rock. Transactions, Australian Institute of Mining and Metallurgy, Vol. 217, pp. 475, 476.
[13]. Ash, R.L. (1963). The mechanics of rock breakage (Part 2)–Standards for blasting design. Pit and Quarry, Vol. 56, No. 3, pp. 126–131.
[14]. Langefors, U. and Kihlström, B. (1963). The Modern Technique of Rock Blasting. Almquist and Wiksell, Stockholm, p. 438.

Mulenga and Kaunda./ Journal of Mining & Environment, Vol. 11, No. 3, 2020
657
[15]. Hansen, D.W. (1967). Drilling and blasting techniques for morrow point power plant. Proceedings Ninth Symposium of Rock Mechanics, Golden, Colorado, pp. 347–360.
[16]. Konya, C.J. (1972). The Use of Shaped Explosive Charges to Investigate Permeability, Penetration, and Fracture Formation in Coal, Dolomite, and Plexiglas, PhD Dissertation, Department of Mining and Petroleum Engineering, University of Missouri at Rolla.
[17]. Foldesi, J. (1980) in Sereshki et al. [24].
[18] Praillet, R. (1980). A New Approach to Drilling and Blasting. Technical publications, Drilltech Inc., Alachua, USA, p. 73.
[29]. Jimeno, E.L. (1980). Parametros Criticos en la Fragmentacion de Rocas con Explosivos. 6th Journadas Minerometalurgicas, Huelva, pp. 178–185.
[20]. Konya, C.J. and Walter, E.J. (1983). Chap. 6 – blast monitoring. in Sendlein, L.V.A. et al. (Eds.): Surface Mining, Environmental Monitoring and Reclamation Handbook, New York, Elsevier Scientific Publishing Co., Montville, Ohio.
[21]. Carr, B. (1985) in Sereshki et al. [24].
[22]. Olofsson, S.O. (1990). Applied Explosive Technology for Construction and Mining. Applex, Arla, Sweden, p. 303.
[23]. Rustan, P.A. (1990). Burden, spacing and borehole diameter at rock blasting. The 3rd International Symposium on Rock Fragmentation by Blasting, 26–31 August, Brisbane, Australia, pp. 303–309.
[24]. Sereshki, F., Ataei, M. and Hoseinie, S.H. (2010). Comparison and analysis of burden design methods in blasting: a case study on Sungun copper mine in Iran. Int. J. Mining and Mineral Engineering, Vol. 2, No. 2, pp. 123–136.
[25]. Blair, A. C. (2015). A novel powder factor based bench blast design method for large surface coal mines. Missouri University of Science and Technology.
[26]. Mulenga, S. (2020). Evaluation of factors affecting rock fragmentation by blasting using interrelations diagram method. Journal of Physical Sciences, Vol 2. No.
[27]. Lilly P.A. (1986). An empirical method of assessing rock mass blastability. Proceedings of the Large Open Pit Conference, IMM, Australia, 89–92.
[28]. Cailteux, J.L.H., Kampunzu, A.B., Lerouge, C., Kaputo, A.K. and Milesi, J.P. (2005). Genesis of Sediment-Hosted Stratiform Copper-Cobalt Deposits, Central African Copperbelt. Journal of African Earth Sciences.
[29]. Nabiullah, J., Pingua, B. and Misra, D. (2003). Design of drilling and blasting pattern for optimum fragmentation – A case study. Proceedings of
Geomechanics and Ground Control. Allied Publishers, India, p. 98.
[30]. Rorke, A. (2003). BME training module: Pre-splitting. Bulk Mining Explosives, Johannesburg. South Africa. pp. 1–24.
[31]. Kuznetsov, V.M. (1973). The mean diameter of the fragments formed by blasting rock. Soviet Mining Science, 9(2), 144–48.
[32]. Cunningham, C.V.B. (1983). The Kuz-Ram model for prediction of fragmentation from blasting. Proceedings of the 1st International Symposium on Rock Fragmentation by Blasting, Lulea, Sweden, 439–453.
[33]. Hjelmberg, H. (1983). Some ideas on how to improve calculations of the fragment size distribution in bench blasting. Proceedings of the 1st International Symposium on Rock Fragmentation by Blasting, Lulea, Sweden, 469–494.
[34]. Otterness, RE., Stagg, M.S., Rholl, S.A. and Smith. N.S. (1991). Correlation of shot design parameters to fragmentation. Proceedings of the 7th Annual Conference of Explosives and Blasting Research, Las Vegas, 179–191.
[35]. Kou, S. and Rustan, P. (1993). Computerized design and result prediction of bench blasting. Proceedings of 4th International Symposium on Rock Fragmentation by Blasting, 263-271.
[36]. Lownds, C.M. (1995). Prediction of fragmentation based on distribution of explosives energy. Proceedings of the 11th Annual Conference of Explosives and Blasting Research, Orlando, Florida, USA, 286–296.
[37]. Aler, J., Du Mouza, J. and Arnould. M. (1996). Evaluation of blast fragmentation efficiency and its prediction by multivariate analysis procedures. International Journal of Rock Mechanics and Mining Sciences & Geomechanics Abstracts 33: 189–96.
[38]. Morin, M.A. and Ficarazzo, F. (2006). Monte carlo simulation as a tool to predict blasting fragmentation based on the Kuz-Ram model, Computers and Geotechnics, 32, 352–369.
[39]. Ouchterlony, F. (2005). The Swebrec© function: linking fragmentation by blasting and crushing, Mininig Technology, 114, 29–44.
[40]. Gheibie S., Aghababaei, H., Hoseinie, S.H. and Pourrahimian, Y. (2009). Modified Kuz-Ram fragmentation model and its use at the Sungun Copper Mine, International Journal of Rock Mechanics and Mining Sciences, 46, 967–973.
[41]. Gheibie S. and Aghababaei, H. (2010). Kuznetsov model’s efficiency in estimation of mean fragment size at the Sungun copper mine. Proceeding of 9th International Symposium on Rock Fragmentation by Blasting, 265–270.

Mulenga and Kaunda./ Journal of Mining & Environment, Vol. 11, No. 3, 2020
658
[42]. Monjezi, M., Rezaei, M. and Yazdian Varjani, A. (2009). Prediction of Rock Fragmentation due to Blasting in Gol-E-Gohar Iron Mine Using Fuzzy Logic.” International Journal of Rock Mechanics and Mining Sciences 46(8): 1273–1280 1273–1280. doi:10.1016/j.ijrmms.2009.05.005.
[43]. Kulatilake, P.H.S.W., Qiong, W., Hudaverdi, T. and Kuzu, C. (2010). Mean particle size prediction in rock blast fragmentation using neural networks. Engineering Geology 114(3–4): 298–311.
[44]. Chakraborty, A.K., Raina, A.K., Ramulu, M., Choudhury, P.B., Haldar, A., Sahu, P. and Bandopadhyay, C. (2004). Parametric study to develop guidelines for blast fragmentation improvement in jointed and massive formations. Engineering Geology 73(1–2): 105–16.
[45]. Hudaverdi, T., Kulatilake, P. and Kuzu, C. (2011). Prediction of blast fragmentation using multivariate analysis procedures. International Journal for Numerical and Analytical Methods in Geomechanics 35: 1318–1333.
[46]. Faramarzi, F., Mansouri, H. and Ebrahimi Farsangi, M.A. (2013). A rock engineering systems based model to predict rock fragmentation by blasting. International Journal of Rock Mechanics and Mining Sciences 60: 82–94.
[47]. Akbari, M., Lashkaripour, G., Yarahamdi Bafghi, A. and Ghafoori, M. (2015). Blastability evaluation for rock mass fragmentation in Iran central iron ore mines. International Journal of Mining Science and Technology, 1–8.
[48]. Kim, V.J. and Kemeny, J. (2011). Site specific blasting model for mine-to-mill optimization. Proceedings of SME Annual Meeting and Exhibit and CMA 113th National Western Mining Conference, 619-623.
[49]. Shad, H.I.A., Sereshki, F., Ataei, M., Karamoozian, M. (2018). Investigation of rock blast fragmentation based on specific explosive Energy and In-Situ Block Size. International Journal of Mining and Geo-Engineering 52-1: 1-6.

1399وم، سال س، شماره زیست، پژوهشی معدن و محیط -مولنگا و کائوندا/ نشریه علمی
در دسترس اصلاح شده يروش انرژ کیبا استفاده از يوربهبود بهره يانفجار برا یطراح
2و رنه کائوندا *1ساندي مولنگا
دانشگاه زامبیا، لوساکا، زامبیاگروه مهندسی معدن، مدرسه معدن، -1 ي آمریکا، مدرسه معدن کلورادو، کلورادو، ایالات متحدهمعدن یگروه مهندس. 2
17/05/2020، پذیرش 28/03/2020ارسال
[email protected]* نویسنده مسئول مکاتبات:
چکیده:
203نفجار معدن مس مورد مطالعه، قطر ا ياجرا شد. برا دیبهبود تول يمعدن برا کیو انفجار ارائه شده است و در یچالزن يالگو یروش طراح کی قیتحق نیدر اmm دیجد ازیمورد ن دیاســتفاده شــد تا نرخ تول یمعدن يماده هیدر ناحmtpa 90 ازmtpa 75 را برآورده کند. در حال حاضــر مدلKonya وWalter يبرا برخوردار اســت که مقدار تیمز نیانفجار از ا یو طراح يحفار دی. روش جدشــودیاســتفاده م mm 172به قطر يو انفجار در چال انفجار یچالزن يالگو یطراحسط خردا نیدارد و همچن يکمتر يژهیو يحفار ستفاده پ یرا برخلاف روش فعل شیاندازه متو شده انرژ کیمنظور نی. به اکندیم ینیب شیمورد ا صلاح يمدل ا
شاخ شان داد که، مدل mm 203در چال انفجار به قطر يشنهادیانفجار پ يالگو جیشد. نتا یمعرف يو فاکتور پودر یمعدن يتوده ماده يریانفجار پذ یشامل ن Ash ،Konya يهامدل شده توسط دینسبت به مدل تول يکمتر 3/15 % ژهیو يمقدار حفار يکه دارا کندیم دیتول يو انفجار ياصلاح شده طرح حفار يانرژو % Ashکوچکتر از روش 4/3است که در حدود % ینیب شیسنگ قابل پ شیابعاد متوسط خردا يانرژ يمدل اصلاح شده نیدر ا نیاست. علاوه بر ا Walterو .است Walterو Konyaکوچکتر از مدل ارائه شده توسط 7/6
.اصلاح شده، حفاري ویژه، متوسط ابعاد خردایشانرژي در دسترس بهینه سازي انفجار، کلمات کلیدي: