Embed Size (px)
Citation preview

Journal ofThe Institution of
Electrical & ElectronicsEngineers Pakistan
Disseminate Technical
Knowledge
Conserve Electricity
Editorial
PageNo
VOL # 76 April-June 2012
“New Horizons”
1
2
3
CONTENTS
4
5
PresidentEngr. Tahir Basharat Cheema
Vice PresidentEngr. Muhammad Azeem
Vice President (South)Engr. S. S. A. Jafri
Hony. Secretary GeneralEngr. Prof. Dr. Suhail Aftab Qureshi
Hony: TreasurerEngr. Salis Usman
Hony. Joint SecretaryEngr. Syed Saleem Akhtar
6
1
7
8
2
1
Renewables & Electric Power DeficitA new strategy is required to overcome the crisisEngr. Irfan Ahmad (Fellow IEEEP)
N.E.C (U.S.A) and Protective Devices Considerations For Electrical MotorsBy: Engr. Mohammad Irfan AkhtarActing Chief Electrical Engineer, (N.J. Project) A.C.E (Pvt) Ltd
Solar Energy Applications in Industrial and Commercial Sectors in Pakistan and Barrriers in its GrowthBy: Engr. Faiz Mohammad BhuttaChapter Chairman Renewable and Alternate Energy Society of Pakistan and General Manager Izhar Energy Services, Izhar Group of Companies
Center of Mass of Earth through Mass Balancing and Torque Balancing Latitude: An Analysis Anam Qureshi, Murk Marvi, Fahim Aziz Umrani, B. S. Chowdhry, and A. Q. K. RajputInstitute of Information & Communication Technologies,Mehran University of Engineering and Technology, Pakistan.
Optimal Pitch Control Design of an Airplane with Analysis and Verification using MATLAB/SimulinkEngr. Muhammad Majid Gulzar*, Engr. Zain-ul-Abdeen*, Engr. Muhammad Yaqoob Javaid*, Engr.Tahir Rizvi**Faculty of Engineering, University of Central PunjabProf. Dr. Suhail A. Qureshi Electrical Engg. Deptt. UET, Lahore-Pakistan.Alham Jameel, Electrical Engg. Deptt., Lahore College University, Lahore.
Improvement of Distribution System by Conversion of 3phase System to Single Phase SystemDr.Engr.Faisal Nafees Yousaf
Performance and Analysis of FSO link availability under different weather conditions in PakistanMuhammad Naveed Shaikh, Abi Waqas, B. S. Chowdhry, and Fahim A. UmraniInstitute of Information & Communication Technologies (IICT),Mehran UET, Jamshoro, Pakistan 76062.
Resurrection of the Pakistani Power Sector !Engr Tahir Basharat CheemaPresidentInstitution of Electrical & Electronics Engineers Pakistan
Selecting Senior Management for the Power Sector!Engr Tahir Basharat CheemaPresidentInstitution of Electrical & Electronics Engineers Pakistan
9
4-Lawrence Road, Lahore. Ph:(042) 36305289Fax: (042) 36360287 Email:[email protected]
Website:www.ieeep.org.pk
3
8
16
21
25
27
31
34
36
Board of Publications-2011-12
ChairmanEngr. Prof. Dr. Noor M. Sheikh(Rtd) Professor UET, LahoreEmail:[email protected]
SecretaryEngr. Prof. Dr. Suhail Aftab QureshiVC University of South AsiaEmail:[email protected]
Engr. Prof. Dr. Rana Abdul JabbarCEO FESCOEmail:[email protected]
Engr. Dr. Khawaja Rifat HassanDy. Director WapdaEmail:[email protected]
Engr. Prof. Dr. Muhammad JahangirLUMS University Y-Block, DHA, Lahore
Engr.Dr. Murtaza HashmiAssociate Professor, UET, LahoreEmail:[email protected]
Euditor
Email:[email protected] of the Computer Engineering Department
Editorial
Assalam-o-Alaikum
Dear Members,
The Journal policy is to publish high quality articles with permission from
the Editorial Board. The principal aim of the journal is to bring together
the latest research and development in various fields of technology such
as Electrical & Electronics engineering, I am sure this time again Articles
are covering all important issues like Selecting Senior Management for the
Power Sector in practical & improvement of Distribution system by
conversion of 3-Phase system to Single Phase system.
Since 1969, researchers from all over the world preferred IEEEP journal
for the submission of their manuscripts and high profile researches. The
Editorial Board is looking forward to further improve the quality of IEEEP
journal and to broaden the impact of IEEEP articles.
We provide on-line free access to all published papers. Permanent links are
available on our website.
We request our members to send us quality papers to be published in our forth coming journal at their earliest to avoid any delay in the publication of our next issue.
We hope that you would like this issue as past practice!
Editor
2
3
Performance and Analysis of FSO link
availability under different weather conditions
in Pakistan Muhammad Naveed Shaikh, Abi Waqas, B. S. Chowdhry,
and Fahim A. Umrani
Institute of Information & Communication Technologies
(IICT),
Mehran UET, Jamshoro, Pakistan – 76062.
Abstract: Free Space Optics (FSO) can deliver an effective
line-of sight, wireless, and high bandwidth communication
between two places. FSO can be good alternative to provide
bandwidth hungry communication. This paper mainly
presents optical turbulence effects resulting from small
temperature variations causing increased power losses from
spreading of the beam or from the scintillation effects due to
diffraction alone and due to temporal and spatial
fluctuations of the laser beam. The FSO link is established
using the cable free FSO equipment. The RSSI level of laser
head versus distance and time are reported and experiments
carried out to measure the link capacity of FSO in outdoor
environment versus different distances. Furthermore, in this
paper the performance of FSO link availability is measured
under different weather condition and results are concluded
to identify which atmospheric effect is more significant and
necessary remedies are suggested.
1. INTRODUCTION
As a communication system, FSO uses air as its core. The
transmission process using FSO is relatively simple since it
only needs a laser transmitter and a receiver. Each FSO
system uses a high-power optical source such as laser plus a
telescope that transmits light through the atmosphere to
another telescope which acts as a receiver. An FSO link
refers to a pair of FSO telescope, each aiming a laser beam
at the other. Hence one telescope has duplex capability to
act as a laser transmitter as well as a receiver [1]. Laser head
are usually installed on the top of the building. Operating
range of FSO communication is 0.7 nm to 1.6 nm which
correspond to frequencies in the order of terahertz, lying in
unlicensed band and they will not face any interference with
RF frequencies band. Moreover, the narrow beam of laser
allows placing two FSO systems nearby as they will not
face any interference. FSO links are more secure and
inherently possess anti-jamming capabilities.
Free Space Optical communication involves the
transmission of data through a wireless medium using
modulated near infrared light beam as carrier wave. The
unique characteristics of laser such as its powerful coherent
light beam, the possibility of modulating it at high
frequency and the low beam divergence has made it the
preferred light source for enhanced FSO applications. FSO
communication is considered to be one of the key
technologies for realizing very high- speed multi-gigabit-
per-second large-capacity communications when fibre optic
cable is impractical or too expensive. FSO communication
can be of crucial advantage particularly because of its
wireless nature and several applications, making it a viable
alternative to the laying of fiber cable underground which is
expensive and has environmental consequences. Unlike
radio and microwave systems, FSO has higher data rate due
to its high carrier frequency, low power requirements, no
frequency license required. [2].
FSO is a line of sight technology that uses devices such as
lasers to establish connectivity for video and voice
communication. Currently, it can allow up to 2.5 Gbps of
data rate but can be increased to 10 Gbps using Wavelength
Division Multiplexing (WDM). FSO is based on
connectivity between two stations consisting of optical
transceiver to achieve full duplex communication. The light
pulses are transmitted through the atmosphere in a small
conical shaped beam by the means of low powered lasers or
LED’s [3].
The maximum range for terrestrial FSO link (FSO can be
used for communication between space crafts and satellites)
is around 2-3 Km [4] however, the quality of service of a
FSO link in the atmosphere is strongly influenced by
weather conditions. Weather condition is like fluctuation of
atmospheric attenuation caused by a number of phenomena
in the atmosphere, such as scattering, absorption, and
turbulence. Scattering in particular, which is a product of
fog, haze, or low clouds, causes large variation in the
received optical power and limits the availability of FSO for
a given transmission range[8][9].
2. ATMOSPHERIC EFFECTS ON FSO LINK
The performance of FSO link is significantly influenced by
following channel impairments:
2.1 Atmospheric Scintillation
Scintillation is known as the optical turbulence resulting
from small temperature variations Scintillation is caused by
solar energy heating up small air pockets in homogenously,
thereby creating varying refractive index along the FSO
link. This results in the scattering of laser beams at various
angles along the propagation path and a resultant fluctuation
in both the intensity and phase of the received light.
Atmospheric scintillation is less significant at distances less
than 500 m but degrades performance of a FSO link at
ranges of the order of 1km or longer [5] [9].
2.2 Physical Obstacles
Physical obstructions such as birds, insects, tree limbs,
buildings or other factors can temporarily or permanently
block the laser line-of-sight. Platform/building motion due
to wind, differential heating and cooling, or ground motion
over time can result in serious misalignment of fixed-
position laser communication systems. Proper planning and
site measurements are ways of avoiding this effect [6].
2.3 Sunshine
A bright sunny day will increase the background light level
detected by the receiver i.e. the RSSI will be higher in the
day than at night. During normal operation this effect is
masked by other variations like temperature changes etc.
4
However, the effect of background light levels can be
demonstrated (in an exaggerated way) by comparing the
RSSI value when a Cable free unit is pointed at the sky or at
the ground (NOTE: do not point Cable free laser products
directly at the sun as this can damage the unit and direct
facing of sunshine is not only cause of damaging the
receiver but also can cause link unavailability because
background noise dominates and RSSI falls down) [7].
2.4 Fog
Fog, low cloud, rain, snow, sand etc. attenuates the beam as
it passes through the atmosphere. If the atmospheric effect
is severe enough causing a greater attenuation than the
available fade margin of the link, errors will be caused and
ultimately even complete loss of communication. As
general rule if the other side is visible to the human eye,
then the link will operate correctly and pass data error free,
in actual practice Cable free links perform far better than
this. As a “rough rule of thumb” the naked eye can see
through approximately 14dB of attenuation. [7]
2.5 Shimmer
Shimmer (heat haze) is atmospheric movement caused by
heating of a surface such as tarmac or a flat rooftop. The hot
surface causes a rapid increase in temperature of the air
immediately adjacent to the surface; this in turn rises and is
replaced with cool air. The boundaries between the hot and
cold air causes the laser beam to be bent just slightly. On a
large scale shimmer can cause two effects [7]:
1. The beam is bent enough to divert the majority of the
power contained in the footprint away from the receiver at
the remote end or
2. Constructive and destructive interference of the beam,
which shows up as random “speckles” in the footprint, can
cause errors in the data stream.
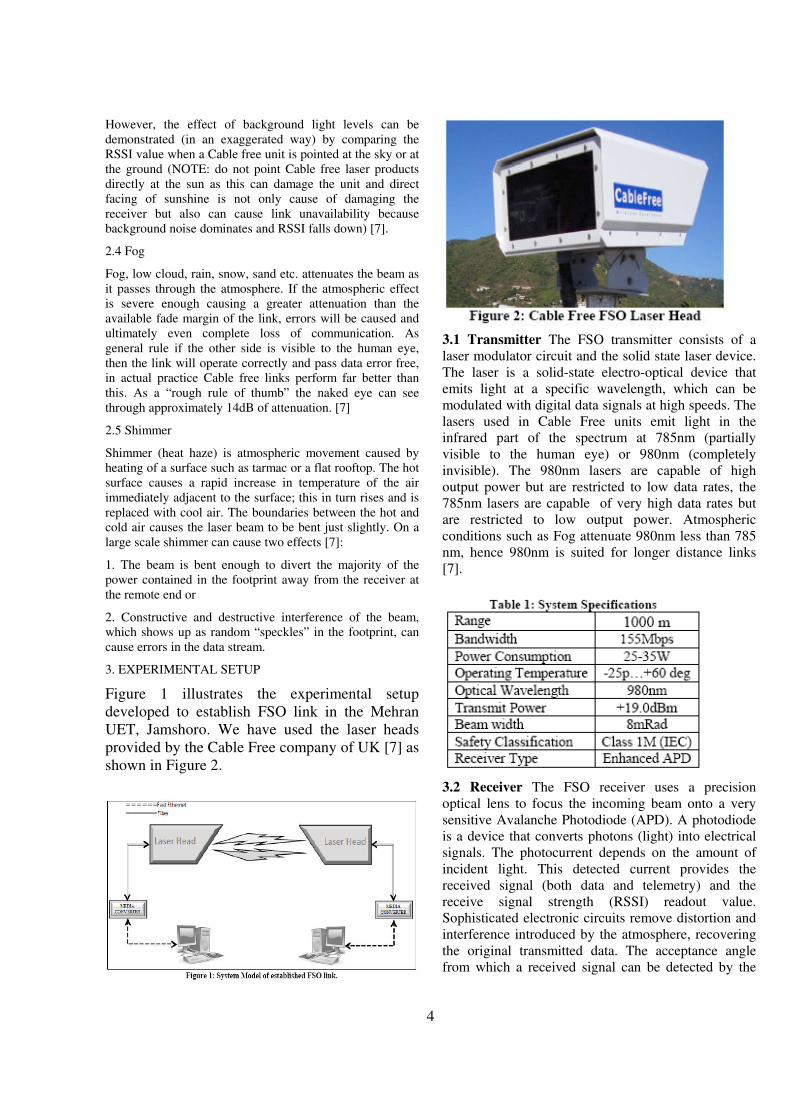
3. EXPERIMENTAL SETUP
Figure 1 illustrates the experimental setup
developed to establish FSO link in the Mehran
UET, Jamshoro. We have used the laser heads
provided by the Cable Free company of UK [7] as
shown in Figure 2.
3.1 Transmitter The FSO transmitter consists of a
laser modulator circuit and the solid state laser device.
The laser is a solid-state electro-optical device that
emits light at a specific wavelength, which can be
modulated with digital data signals at high speeds. The
lasers used in Cable Free units emit light in the
infrared part of the spectrum at 785nm (partially
visible to the human eye) or 980nm (completely
invisible). The 980nm lasers are capable of high
output power but are restricted to low data rates, the
785nm lasers are capable of very high data rates but
are restricted to low output power. Atmospheric
conditions such as Fog attenuate 980nm less than 785
nm, hence 980nm is suited for longer distance links
[7].
3.2 Receiver The FSO receiver uses a precision
optical lens to focus the incoming beam onto a very
sensitive Avalanche Photodiode (APD). A photodiode
is a device that converts photons (light) into electrical
signals. The photocurrent depends on the amount of
incident light. This detected current provides the
received signal (both data and telemetry) and the
receive signal strength (RSSI) readout value.
Sophisticated electronic circuits remove distortion and
interference introduced by the atmosphere, recovering
the original transmitted data. The acceptance angle
from which a received signal can be detected by the

5
photodiode is also nominally 0.5 degrees full angle
(8mRad) [7].
3.3 Calculation of Atmospheric Effects Peak to
peak scintillation is very important for a given
observation interval we can easily calculate the
Scintillation index means that refractive index
which is varying by the energetic pockets of air or
atmosphere. By using approximation in [4] we
can approximate S.I “Scintillation index” as:
SI= (Pmax-Pmin)/ (Pmax+Pmin) (1)
Pmax =highest 3rd peak of received signal strength
during observation interval and Pmin= 3rd lowest peak
of received signal for given observation interval.
We can also calculate standard deviation by the
formula
(2)
Where n can be calculated as
(3)
Where P is the atmospheric pressure in millibars and
Te is the temperature in Kelvin. For all engineering
applications the rate of change in refractive index with
respect to temperature is given by: (4)
There is more significant parameter than SI which is
defined in [4] as
(5) Where σx is standard deviation and mx is mean.
3.4. Methodology
We used the equipment of Cable free company to
perform the experiment. The link between two FSO
heads which were supposed as relay station fitted at
the roof of 40 feet high building separated by the
distance of approximately 50 meter. The all data of
one end side was aggregated and sent to the laser
heads and then laser modulated the input data of fiber
over air means free space. The LOS was maintained
between the two laser heads and FSO link was
successfully established. Data sent from the local
network was successfully received at the remote
network. Number of transmissions of different data
files of various sizes was performed and the time to
successfully transmit the data was recorded as shown
in Table 2 and Table 3.
Note: These values are taken at random interval. In the FSO
head ATPC (automatic power control) system in
integrated which was adjusting the power adaptively.
4. Result During the experiments it was observed that only
sunshine was found to be effective impairment out of
all possible atmospheric effects in Jamshoro
environment. This problem can easily be avoided if
the FSO Link is designed in such a way that link
orientation is from South to North. With this approach
FSO heads will never face sun shine.
Figure 3 shows the performance of FSO Link
established at the roof of IT building, in terms of data
size versus time. The readings are noted in evening
time at the distance of approximately 50 meters.
Result obtained in the graph are according to
expectations as time = size of date / link rate.
According to the formula time taken to transmit the 8
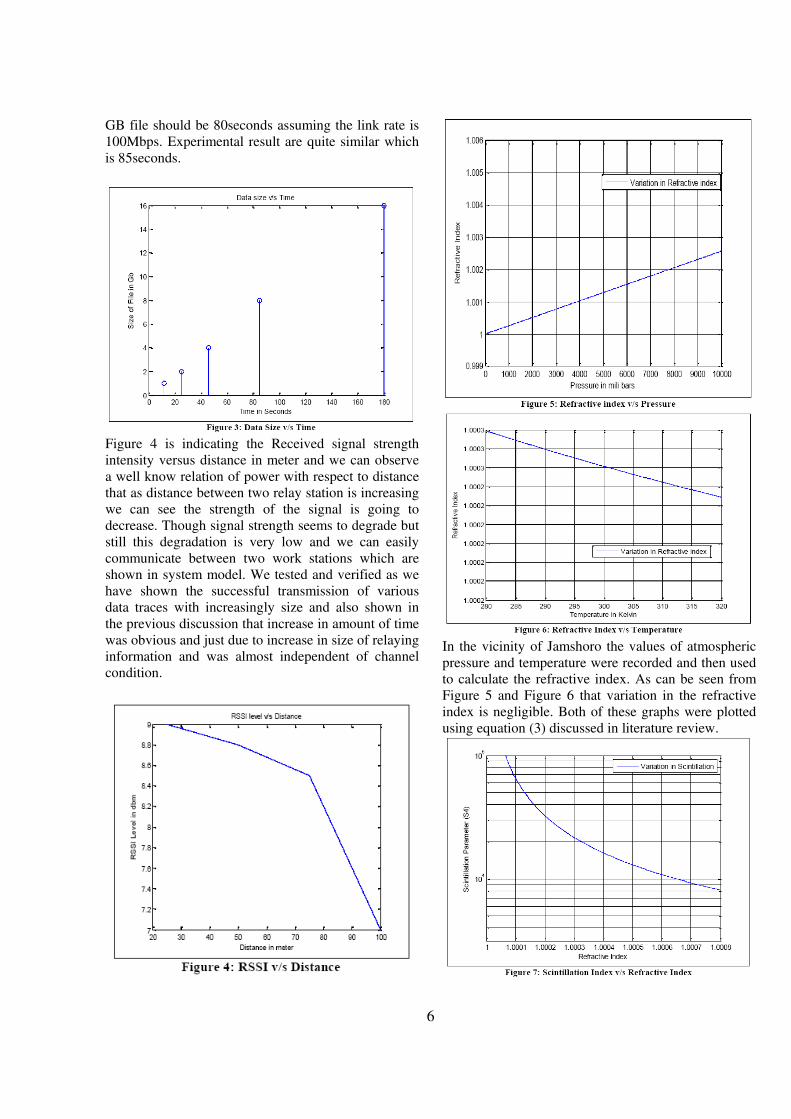
6
GB file should be 80seconds assuming the link rate is
100Mbps. Experimental result are quite similar which
is 85seconds.
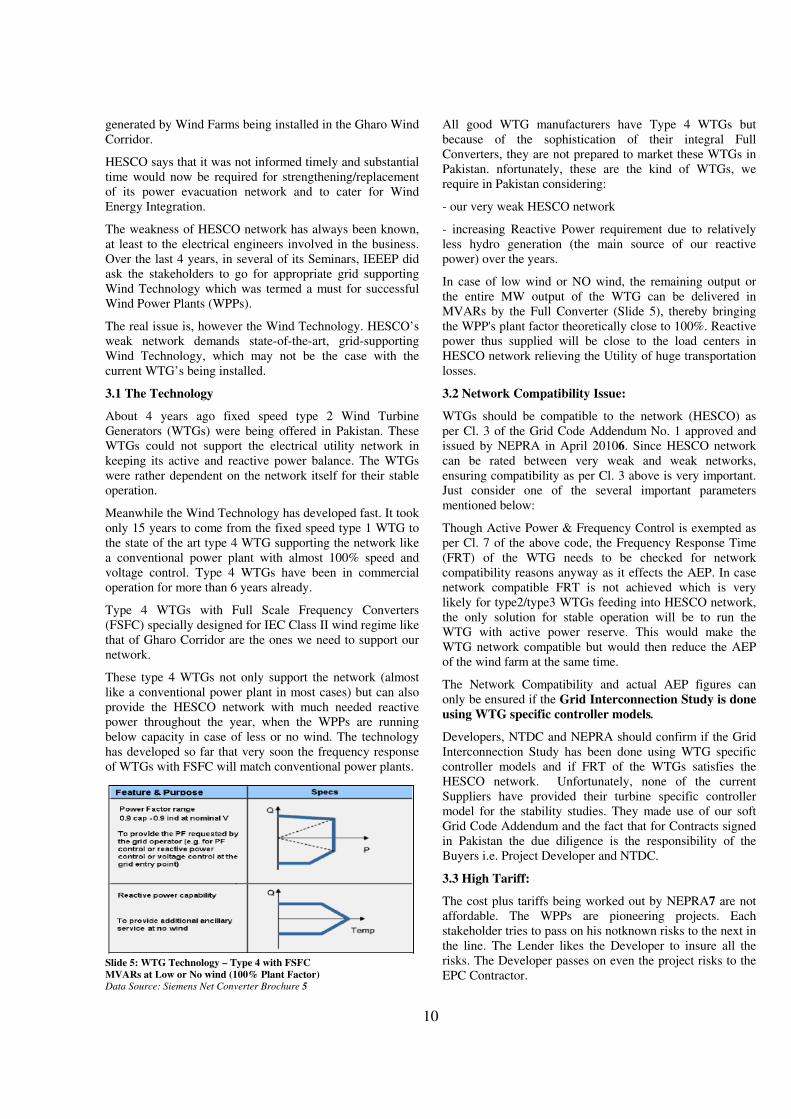
Figure 4 is indicating the Received signal strength
intensity versus distance in meter and we can observe
a well know relation of power with respect to distance
that as distance between two relay station is increasing
we can see the strength of the signal is going to
decrease. Though signal strength seems to degrade but
still this degradation is very low and we can easily
communicate between two work stations which are
shown in system model. We tested and verified as we
have shown the successful transmission of various
data traces with increasingly size and also shown in
the previous discussion that increase in amount of time
was obvious and just due to increase in size of relaying
information and was almost independent of channel
condition.
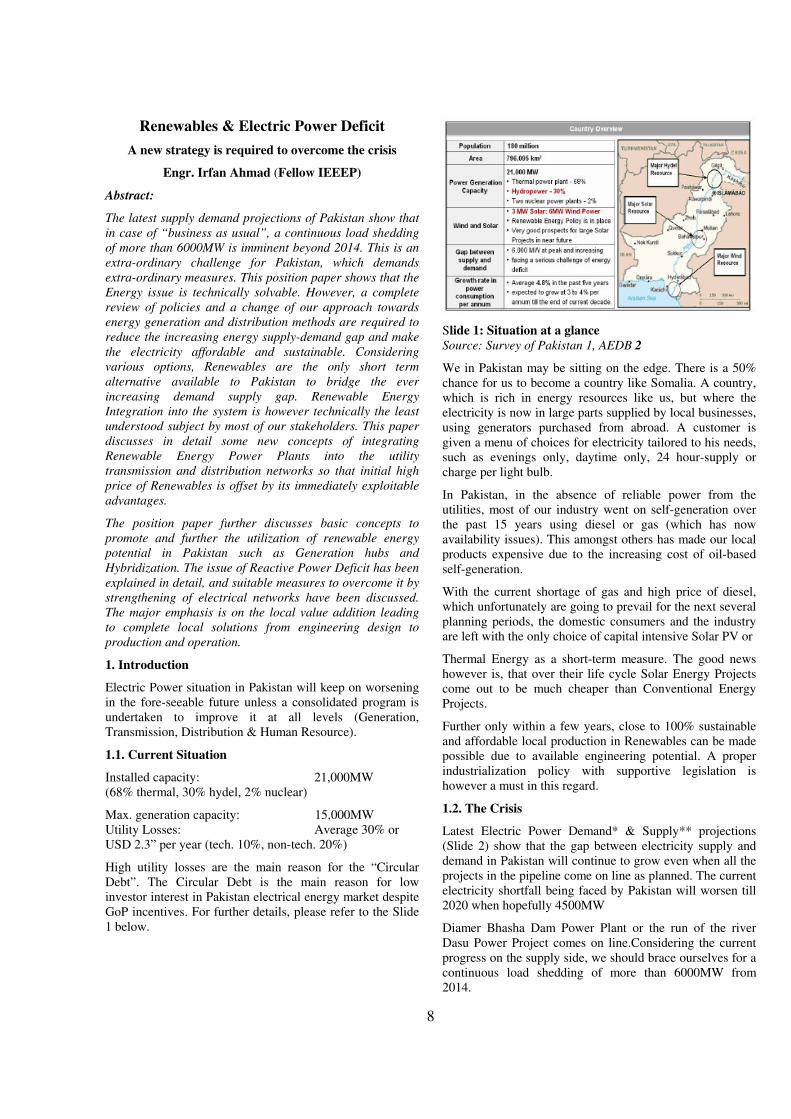
In the vicinity of Jamshoro the values of atmospheric
pressure and temperature were recorded and then used
to calculate the refractive index. As can be seen from
Figure 5 and Figure 6 that variation in the refractive
index is negligible. Both of these graphs were plotted
using equation (3) discussed in literature review.

7
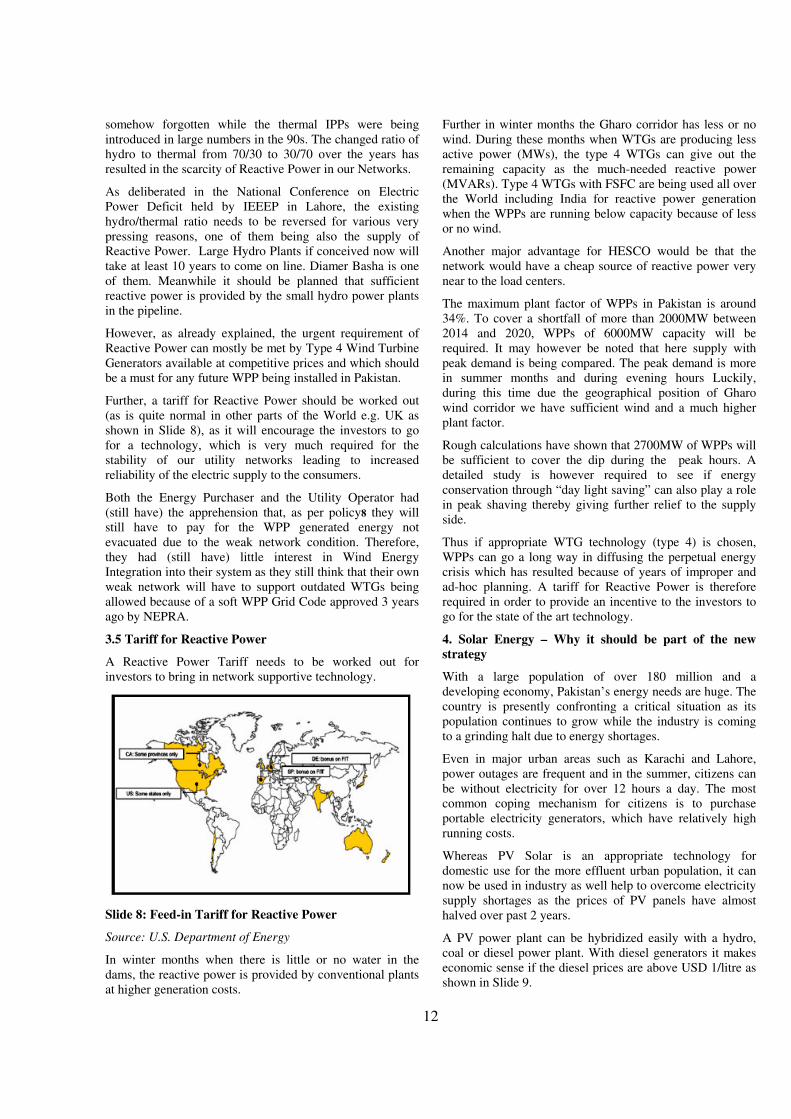
The results shown in Figure 7 plotted using equation
(5) and (2) further reaffirms that the effects of
scintillation are insignificant. And this same behavior
can be expected throughout the south region of
Pakistan due to similar weather conditions. Hence,
FSO becomes the ideal choice for short range (0.5km
to 1.5 km) wireless communication with offered data
rates comparable with traditional optical fiber
networks cost efficiently. 5. CONCLUSIONS
The free space optics link is successfully established. The
established link has very low size, weight and power
requirements, and is very difficult to detect or jam. The link
successfully transmits 8 GB data wirelessly in less than one
minute at the distance of 100 meters which can be further
extended up to 1500 meters. Thus strongly advocating the
usage of FSO links in LAN range or in between of grounds
of normal LAN and MAN boundaries because distance was
sufficient to claim building to building information
transference. The link performance can further be improved
to terabytes per second with slight enhancement of 1Gbits
NIC cards for FSO heads. Furthermore, it is observed that
the south region of Pakistan is particularly suitable as it is
naturally free of most of the channel impairments which
degrades the performance of conventional FSO link. This is
due to the fact that the temperature variations are very small
and resulting refractive index is suitable for transmission of
infrared light at 980 nm window. The only serious problem
is that of shimmer which also can be easily rectified by
setting the orientation of the FSO link as suggested.
Acknowledgments One of the Authors (Prof Dr BS Chowdhry) acknowledges
financial support of HEC for the project “Challenges on
FSO wireless broadband networks for health care
monitoring and disaster recovery”.
References: [1] Kim, Isaac, et. al. Wireless optical transmission of fast
Ethernet, FDDI, ATM, and ESCON protocol data using
the TerraLink laser communication system. SPIE. 1998
[2] A. Majumdar and J. Ricklin, Free-Space Laser
Communications: Principles and Advances, Optical and
Fiber Communications Reports, Vol. 2, Springer, 2008,
pp 1-3.
[3] Free Space Optics: Atmospheric Effects & Back Up,
International Journal of Research in Computer Science
eISSN 2249-8265 Volume 1 Issue 1 (2011) pp. 25-30©
White Globe Publications
[4] W.O.Popoola, Z.Ghassemlooy, C.G.Lee, A.C.
Boucouvalas. “Scintillation effects on intensity
modulated laser communication systems”. Optical
Comm: Research Group, NCRLabs, School of CEIS,
Northumbra University, Newcastle upon tyne, UK,
available online on December 2009
[5] Heatley D., Wisely D.R, Neild I., and Cochrane P.,
“Optical Wireless: The story so far”, IEEE
Communications Magazine, December 1998, pp72-82.
[6] O'Brien D. et al, A presentation on “Free Space optical
links for broadband wireless communication”, available
onhttp://www.acreo.se/upload/Publications/
Proceedings/OE03/FREESPACE-OE003.pdf accessed
on 29th of July, 2009.
[7] Cable Free FSO/Laser Systems, "User Reference and
Installation Manual" (2011, May 1). Document
Number: FSO-MAN-1001, Rev.A1.
http://www.wirelessexcellence.com
[8] Performance of Free Space Optical Communication
System with BPSK and QPSK Modulation Tejbir Singh
Hanzra1, Gurpartap Singh2. IOSR Journal of
Electronics and Communication Engineering
(IOSRJECE) ISSN : 2278-2834 Volume 1, Issue 3
(May-June 2012)
[9] Improvement in Performance of Free Space Optical
Communication. Tejbir Singh Hanzr, Gurpartap Singh
International Journal of Applied Information Systems
(IJAIS) – ISSN : 2249-0868Volume 2– No.4, May
2012 – www.ijais.org
*****
8
Renewables & Electric Power Deficit
A new strategy is required to overcome the crisis
Engr. Irfan Ahmad (Fellow IEEEP)
Abstract:
The latest supply demand projections of Pakistan show that
in case of “business as usual”, a continuous load shedding
of more than 6000MW is imminent beyond 2014. This is an
extra-ordinary challenge for Pakistan, which demands
extra-ordinary measures. This position paper shows that the
Energy issue is technically solvable. However, a complete
review of policies and a change of our approach towards
energy generation and distribution methods are required to
reduce the increasing energy supply-demand gap and make
the electricity affordable and sustainable. Considering
various options, Renewables are the only short term
alternative available to Pakistan to bridge the ever
increasing demand supply gap. Renewable Energy
Integration into the system is however technically the least
understood subject by most of our stakeholders. This paper
discusses in detail some new concepts of integrating
Renewable Energy Power Plants into the utility
transmission and distribution networks so that initial high
price of Renewables is offset by its immediately exploitable
advantages.
The position paper further discusses basic concepts to
promote and further the utilization of renewable energy
potential in Pakistan such as Generation hubs and
Hybridization. The issue of Reactive Power Deficit has been
explained in detail, and suitable measures to overcome it by
strengthening of electrical networks have been discussed.
The major emphasis is on the local value addition leading
to complete local solutions from engineering design to
production and operation.
1. Introduction
Electric Power situation in Pakistan will keep on worsening
in the fore-seeable future unless a consolidated program is
undertaken to improve it at all levels (Generation,
Transmission, Distribution & Human Resource).
1.1. Current Situation
Installed capacity: 21,000MW
(68% thermal, 30% hydel, 2% nuclear)
Max. generation capacity: 15,000MW
Utility Losses: Average 30% or
USD 2.3” per year (tech. 10%, non-tech. 20%)
High utility losses are the main reason for the “Circular
Debt”. The Circular Debt is the main reason for low
investor interest in Pakistan electrical energy market despite
GoP incentives. For further details, please refer to the Slide
1 below.
Slide 1: Situation at a glance
Source: Survey of Pakistan 1, AEDB 2
We in Pakistan may be sitting on the edge. There is a 50%
chance for us to become a country like Somalia. A country,
which is rich in energy resources like us, but where the
electricity is now in large parts supplied by local businesses,
using generators purchased from abroad. A customer is
given a menu of choices for electricity tailored to his needs,
such as evenings only, daytime only, 24 hour-supply or
charge per light bulb.
In Pakistan, in the absence of reliable power from the
utilities, most of our industry went on self-generation over
the past 15 years using diesel or gas (which has now
availability issues). This amongst others has made our local
products expensive due to the increasing cost of oil-based
self-generation.
With the current shortage of gas and high price of diesel,
which unfortunately are going to prevail for the next several
planning periods, the domestic consumers and the industry
are left with the only choice of capital intensive Solar PV or
Thermal Energy as a short-term measure. The good news
however is, that over their life cycle Solar Energy Projects
come out to be much cheaper than Conventional Energy
Projects.
Further only within a few years, close to 100% sustainable
and affordable local production in Renewables can be made
possible due to available engineering potential. A proper
industrialization policy with supportive legislation is
however a must in this regard.
1.2. The Crisis
Latest Electric Power Demand* & Supply** projections
(Slide 2) show that the gap between electricity supply and
demand in Pakistan will continue to grow even when all the
projects in the pipeline come on line as planned. The current
electricity shortfall being faced by Pakistan will worsen till
2020 when hopefully 4500MW
Diamer Bhasha Dam Power Plant or the run of the river
Dasu Power Project comes on line.Considering the current
progress on the supply side, we should brace ourselves for a
continuous load shedding of more than 6000MW from
2014.

9
Slide 2: Pakistan Power Demand-Supply Projections Data Source: PEPCO Projects List, Position Paper – IEP 2010-
2025 3
*) Demand: based on average 3% growth rate. The increase is
similar to world demand increase.
**) Supply: Including also power plants which are likely to
achieve financial close
The demand and supply gap shown in Slide 2 may not be as
accurate over 20 years as depicted because sufficient
verified data is not available to project a number of
important variables (E.g.: GDP and population growth in
Pakistan beyond 5 years). Even ADB’s Integrated Energy
Model 20114 is only as good as the basic assumptions of the
econometric model it is based upon.
Demand projections based on 3% growth rate are close to
overall world increase in electricity demand. However
demand projections from PEPCO depict a beyond the
control situation and may please be considered as
information only.
The Energy Policies of major political parties declared in
early 2012 show a peak demand of 50,000MW by 2030.
Further, though updated recently, the timelines given for
future projects may seem quite optimistic to those who have
closely followed the energy development in Pakistan over
the years.
1.3 The Reasons
Slide 3: Major Reasons – Upside Down Planning and No Money Data Source: Survey of Pakistan, AEDB
Apart from misplanning or upside down planning depicted
in Slide 3 above, the crisis is deepening due to:
� Delayed induction of new power plants in the system is
not sufficient to replace a large number of retiring
power plants. More than 6000MW of continuous load
shedding is therefore expected from 2014.
� Failure of Rental Power Plants.
� High oil prices in the world market. Even conservative
estimates show that current prices at around USD 100
per barrel may double by 2020 and triple by 2030.
� Average Hydro generation is much below the installed
capacity due to increasing shortage of water in our
rivers and indecision of the responsible due to political
reasons as regards large dams.
� Current shortage of gas of about 30% would reach 50%
by next year. Short-term (3-5 years) situation remains
bleak according to the latest newspaper reports.
2. The Strategy
After the failure of Rental Power, the only shortterm
solution left is Wind & Solar Energy implementation. For
the medium and long term, small and large Hydro Power
Plants have become necessary.
Therefore, any future strategy must have Renewable Energy
Solutions as a main stay. These solutions should be
technically implementable, financially affordable and
politically viable. The major emphasis should be on the
local value addition leading to sustainable and reliable
selfsufficiency in Electric Power.
To pin point the correct solutions, we need to understand the
major shifts in the Pakistan Energy Market over the past 20
years as shown in Slide 4. Due to these shifts, certain policy
changes are now required to support the Pakistan Energy
Market to achieve the goal of reliability and affordability of
Renewable Energy.
Slide 4: Why a change in strategy?
3. Wind Energy – What is hindering its integration into
the System
In a recent development HESCO as utility operator has
shown its inability to evacuate the electric power to be
10
generated by Wind Farms being installed in the Gharo Wind
Corridor.
HESCO says that it was not informed timely and substantial
time would now be required for strengthening/replacement
of its power evacuation network and to cater for Wind
Energy Integration.
The weakness of HESCO network has always been known,
at least to the electrical engineers involved in the business.
Over the last 4 years, in several of its Seminars, IEEEP did
ask the stakeholders to go for appropriate grid supporting
Wind Technology which was termed a must for successful
Wind Power Plants (WPPs).
The real issue is, however the Wind Technology. HESCO’s
weak network demands state-of-the-art, grid-supporting
Wind Technology, which may not be the case with the
current WTG’s being installed.
3.1 The Technology
About 4 years ago fixed speed type 2 Wind Turbine
Generators (WTGs) were being offered in Pakistan. These
WTGs could not support the electrical utility network in
keeping its active and reactive power balance. The WTGs
were rather dependent on the network itself for their stable
operation.
Meanwhile the Wind Technology has developed fast. It took
only 15 years to come from the fixed speed type 1 WTG to
the state of the art type 4 WTG supporting the network like
a conventional power plant with almost 100% speed and
voltage control. Type 4 WTGs have been in commercial
operation for more than 6 years already.
Type 4 WTGs with Full Scale Frequency Converters
(FSFC) specially designed for IEC Class II wind regime like
that of Gharo Corridor are the ones we need to support our
network.
These type 4 WTGs not only support the network (almost
like a conventional power plant in most cases) but can also
provide the HESCO network with much needed reactive
power throughout the year, when the WPPs are running
below capacity in case of less or no wind. The technology
has developed so far that very soon the frequency response
of WTGs with FSFC will match conventional power plants.
Slide 5: WTG Technology – Type 4 with FSFC MVARs at Low or No wind (100% Plant Factor) Data Source: Siemens Net Converter Brochure 5
All good WTG manufacturers have Type 4 WTGs but
because of the sophistication of their integral Full
Converters, they are not prepared to market these WTGs in
Pakistan. nfortunately, these are the kind of WTGs, we
require in Pakistan considering:
- our very weak HESCO network
- increasing Reactive Power requirement due to relatively
less hydro generation (the main source of our reactive
power) over the years.
In case of low wind or NO wind, the remaining output or
the entire MW output of the WTG can be delivered in
MVARs by the Full Converter (Slide 5), thereby bringing
the WPP's plant factor theoretically close to 100%. Reactive
power thus supplied will be close to the load centers in
HESCO network relieving the Utility of huge transportation
losses.
3.2 Network Compatibility Issue:
WTGs should be compatible to the network (HESCO) as
per Cl. 3 of the Grid Code Addendum No. 1 approved and
issued by NEPRA in April 20106. Since HESCO network
can be rated between very weak and weak networks,
ensuring compatibility as per Cl. 3 above is very important.
Just consider one of the several important parameters
mentioned below:
Though Active Power & Frequency Control is exempted as
per Cl. 7 of the above code, the Frequency Response Time
(FRT) of the WTG needs to be checked for network
compatibility reasons anyway as it effects the AEP. In case
network compatible FRT is not achieved which is very
likely for type2/type3 WTGs feeding into HESCO network,
the only solution for stable operation will be to run the
WTG with active power reserve. This would make the
WTG network compatible but would then reduce the AEP
of the wind farm at the same time.
The Network Compatibility and actual AEP figures can
only be ensured if the Grid Interconnection Study is done
using WTG specific controller models.
Developers, NTDC and NEPRA should confirm if the Grid
Interconnection Study has been done using WTG specific
controller models and if FRT of the WTGs satisfies the
HESCO network. Unfortunately, none of the current
Suppliers have provided their turbine specific controller
model for the stability studies. They made use of our soft
Grid Code Addendum and the fact that for Contracts signed
in Pakistan the due diligence is the responsibility of the
Buyers i.e. Project Developer and NTDC.
3.3 High Tariff:
The cost plus tariffs being worked out by NEPRA7 are not
affordable. The WPPs are pioneering projects. Each
stakeholder tries to pass on his notknown risks to the next in
the line. The Lender likes the Developer to insure all the
risks. The Developer passes on even the project risks to the
EPC Contractor.

11
Some Developers have gone for the cheapest machines
available, to create a sufficient head room, in their favour,
between the cost and the tariff. Further, almost all the WTG
suppliers are product suppliers. They do not have EPC
experience. EPC condition is a basic requirement of the
Lenders in Pakistan, as they want a Single Point
Responsibility on the Contractor side. The main Contractor,
who is generally the WTG supplier, keeps on stacking all
the risks in his prices. The cost plus tariff thus goes beyond
the affordability limit of a common consumer.
Annual Energy Production (AEP) calculations done by
Lenders are on P90 (90% exceedance probability) basis.
This shows only a 10% risk of the calculated/guaranteed
energy yield not being met thereby helping Lender’s
decision in favour of the investment.
On the other hand, the AEP calculations submitted by the
Developer for tariff determination to NEPRA are on the P50
basis, which show an increased AEP as compared to P90. In
P50 case, the 50% un-calculable risk that the guaranteed
yield will not be met is passed on to the energy purchaser
and eventually to the end consumer. These risks are due to:
� highly probabilistic nature of wind regime including
extrapolated short term actual site wind data. Our base
calculations are done on the site wind speeds. The other
losses including wake losses (Slide 6) and shear effect
which can together result in 20% to 30% less output are
generally considered as a certain smaller percentage of
the total output on an average basis due to
nonavailability of actual measurements.
� weak HESCO network. As a thumb rule, a sufficiently
strong network should have S/Pn ratio of more than 25
at the point of common coupling of the Wind Farm and
the Network. On all the sites, within the Gharo Wind
Corridor, this ratio is much below the desired level.
� in-sufficient references and service experience of the
selected WTGs in similar site conditions, specially
temperatures, dusty and corrosive environment.
In case the above aspects have not been thoroughly looked
into and proven, it will be advisable to go for the lowest
value of AEP calculations. At the most an average of the
exceedance probabilities P50 and P90 may be considered,
otherwise the end consumer will have to bear the brunt of
lack of due diligence by Developers, NTDC & NEPRA.
Slide 6: Wake Losses Source: Siemens Wind Power
Affordability of WPPs can be achieved by:
� Feed in Tariff (FIT) only, as this will give an
incentive to the Developer to go for more efficient
machines.
� Optimizing EBoP design and thereby reducing its
cost. The following major should be considered with
reference to Slide 7:
1) Use of Air Insulated Switchgear (AIS) instead of
Gas Insulated Switchgear for the main station as
specified by the Consultants.
2) Use of one power transformer instead of 100%
redundancy.
3) Use of 20kV operational voltage level for the
collection system as against 33kV recommended
by some consultants.
4) Use of good but unbranded fire protection
equipment.
Slide 7: Overview (Line Feeder Arrangement)
Scope of Electrical BOP (Excluding Wind Turbines)
3.4 Role of Reactive Power
The most common industrial load i.e. electric motors
require reactive power to rotate. Energy savers and
computers also require reactive power to operate properly.
Currently the Hydro Power Plants up North are being used
as a cheap source of reactive power though there is a
considerable transmission loss due to long distances from
the load centers.
Records show that most of the black-outs in the World,
including the tripping of grids in most advanced countries
like USA, were because of scarcity (leading to imbalance of
power) of Reactive Power in the utility networks. In recent
months, grid stations tripping in Pakistan has also been
attributed to the reactive power demand of the Industry, not
being met by the Generation.
Most of the Reactive Power requirement is met by hydro
generation in many countries, as it is a cheaper source of
Reactive Power due to various technical reasons. This was
12
somehow forgotten while the thermal IPPs were being
introduced in large numbers in the 90s. The changed ratio of
hydro to thermal from 70/30 to 30/70 over the years has
resulted in the scarcity of Reactive Power in our Networks.
As deliberated in the National Conference on Electric
Power Deficit held by IEEEP in Lahore, the existing
hydro/thermal ratio needs to be reversed for various very
pressing reasons, one of them being also the supply of
Reactive Power. Large Hydro Plants if conceived now will
take at least 10 years to come on line. Diamer Basha is one
of them. Meanwhile it should be planned that sufficient
reactive power is provided by the small hydro power plants
in the pipeline.
However, as already explained, the urgent requirement of
Reactive Power can mostly be met by Type 4 Wind Turbine
Generators available at competitive prices and which should
be a must for any future WPP being installed in Pakistan.
Further, a tariff for Reactive Power should be worked out
(as is quite normal in other parts of the World e.g. UK as
shown in Slide 8), as it will encourage the investors to go
for a technology, which is very much required for the
stability of our utility networks leading to increased
reliability of the electric supply to the consumers.
Both the Energy Purchaser and the Utility Operator had
(still have) the apprehension that, as per policy8 they will
still have to pay for the WPP generated energy not
evacuated due to the weak network condition. Therefore,
they had (still have) little interest in Wind Energy
Integration into their system as they still think that their own
weak network will have to support outdated WTGs being
allowed because of a soft WPP Grid Code approved 3 years
ago by NEPRA.
3.5 Tariff for Reactive Power
A Reactive Power Tariff needs to be worked out for
investors to bring in network supportive technology.
Slide 8: Feed-in Tariff for Reactive Power
Source: U.S. Department of Energy
In winter months when there is little or no water in the
dams, the reactive power is provided by conventional plants
at higher generation costs.
Further in winter months the Gharo corridor has less or no
wind. During these months when WTGs are producing less
active power (MWs), the type 4 WTGs can give out the
remaining capacity as the much-needed reactive power
(MVARs). Type 4 WTGs with FSFC are being used all over
the World including India for reactive power generation
when the WPPs are running below capacity because of less
or no wind.
Another major advantage for HESCO would be that the
network would have a cheap source of reactive power very
near to the load centers.
The maximum plant factor of WPPs in Pakistan is around
34%. To cover a shortfall of more than 2000MW between
2014 and 2020, WPPs of 6000MW capacity will be
required. It may however be noted that here supply with
peak demand is being compared. The peak demand is more
in summer months and during evening hours Luckily,
during this time due the geographical position of Gharo
wind corridor we have sufficient wind and a much higher
plant factor.
Rough calculations have shown that 2700MW of WPPs will
be sufficient to cover the dip during the peak hours. A
detailed study is however required to see if energy
conservation through “day light saving” can also play a role
in peak shaving thereby giving further relief to the supply
side.
Thus if appropriate WTG technology (type 4) is chosen,
WPPs can go a long way in diffusing the perpetual energy
crisis which has resulted because of years of improper and
ad-hoc planning. A tariff for Reactive Power is therefore
required in order to provide an incentive to the investors to
go for the state of the art technology.
4. Solar Energy – Why it should be part of the new strategy
With a large population of over 180 million and a
developing economy, Pakistan’s energy needs are huge. The
country is presently confronting a critical situation as its
population continues to grow while the industry is coming
to a grinding halt due to energy shortages.
Even in major urban areas such as Karachi and Lahore,
power outages are frequent and in the summer, citizens can
be without electricity for over 12 hours a day. The most
common coping mechanism for citizens is to purchase
portable electricity generators, which have relatively high
running costs.
Whereas PV Solar is an appropriate technology for
domestic use for the more effluent urban population, it can
now be used in industry as well help to overcome electricity
supply shortages as the prices of PV panels have almost
halved over past 2 years.
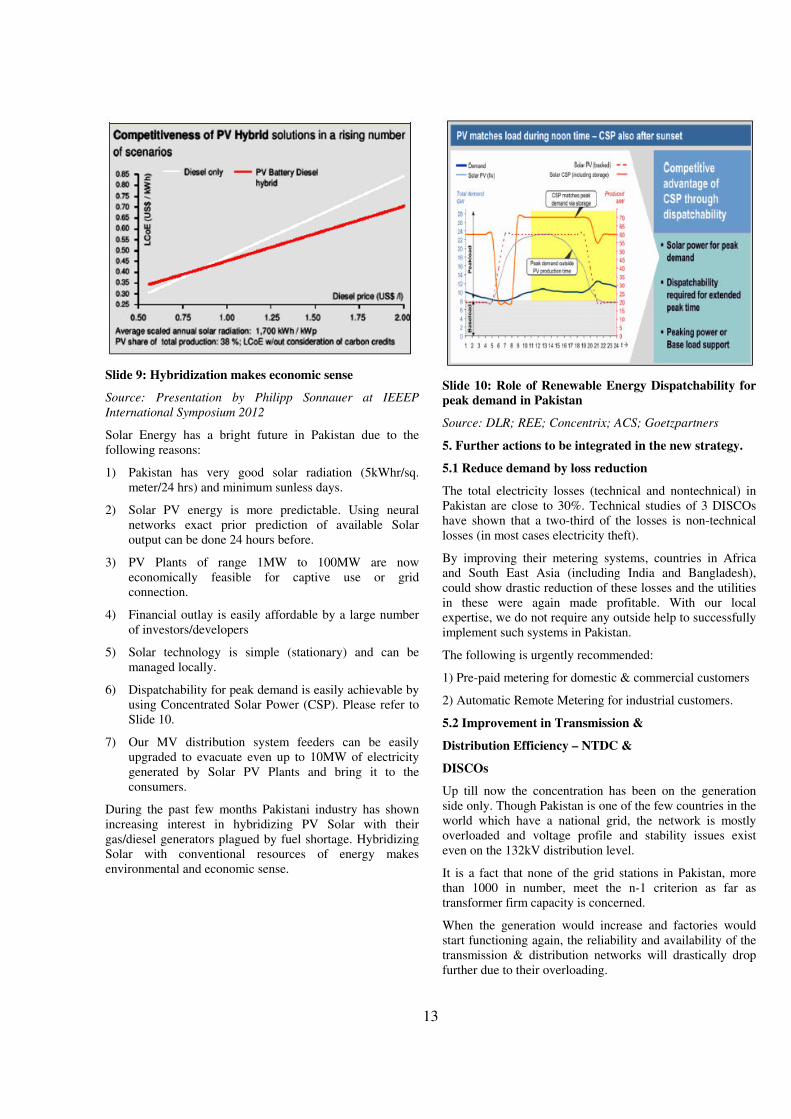
A PV power plant can be hybridized easily with a hydro,
coal or diesel power plant. With diesel generators it makes
economic sense if the diesel prices are above USD 1/litre as
shown in Slide 9.
13
Slide 9: Hybridization makes economic sense
Source: Presentation by Philipp Sonnauer at IEEEP
International Symposium 2012
Solar Energy has a bright future in Pakistan due to the
following reasons:
1) Pakistan has very good solar radiation (5kWhr/sq.
meter/24 hrs) and minimum sunless days.
2) Solar PV energy is more predictable. Using neural
networks exact prior prediction of available Solar
output can be done 24 hours before.
3) PV Plants of range 1MW to 100MW are now
economically feasible for captive use or grid
connection.
4) Financial outlay is easily affordable by a large number
of investors/developers
5) Solar technology is simple (stationary) and can be
managed locally.
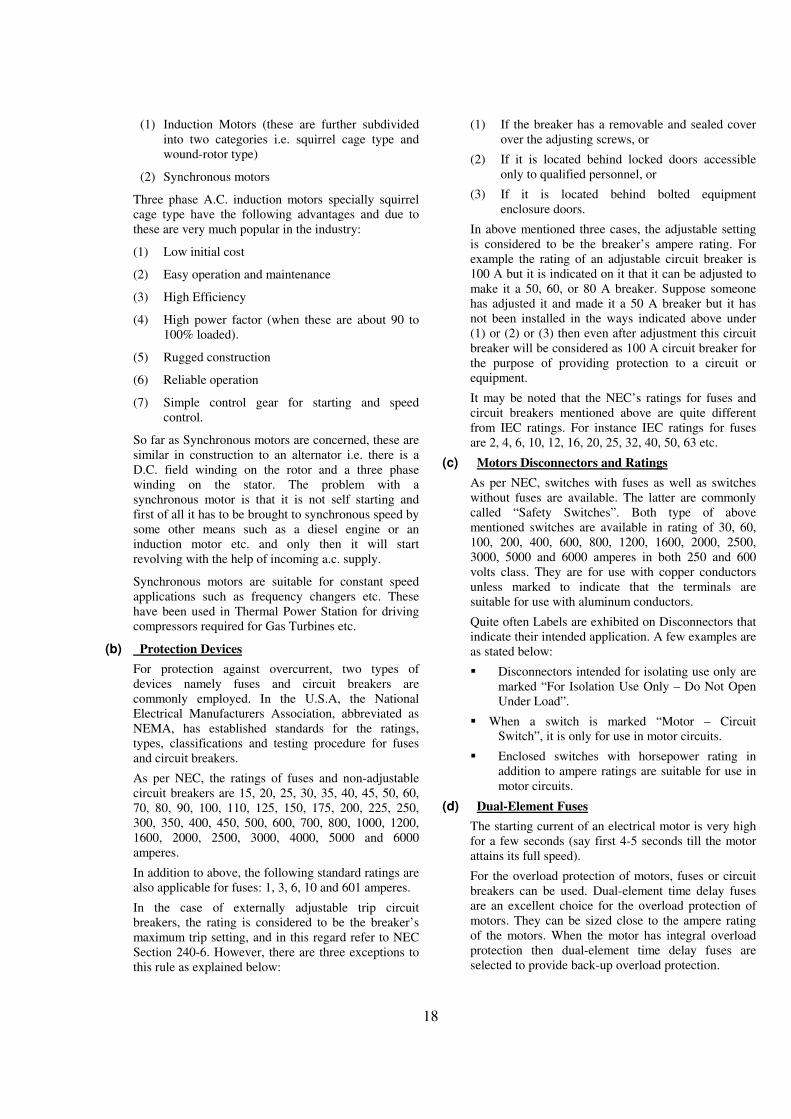
6) Dispatchability for peak demand is easily achievable by
using Concentrated Solar Power (CSP). Please refer to
Slide 10.
7) Our MV distribution system feeders can be easily
upgraded to evacuate even up to 10MW of electricity
generated by Solar PV Plants and bring it to the
consumers.
During the past few months Pakistani industry has shown
increasing interest in hybridizing PV Solar with their
gas/diesel generators plagued by fuel shortage. Hybridizing
Solar with conventional resources of energy makes
environmental and economic sense.
Slide 10: Role of Renewable Energy Dispatchability for peak demand in Pakistan
Source: DLR; REE; Concentrix; ACS; Goetzpartners
5. Further actions to be integrated in the new strategy.
5.1 Reduce demand by loss reduction
The total electricity losses (technical and nontechnical) in
Pakistan are close to 30%. Technical studies of 3 DISCOs
have shown that a two-third of the losses is non-technical
losses (in most cases electricity theft).
By improving their metering systems, countries in Africa
and South East Asia (including India and Bangladesh),
could show drastic reduction of these losses and the utilities
in these were again made profitable. With our local
expertise, we do not require any outside help to successfully
implement such systems in Pakistan.
The following is urgently recommended:
1) Pre-paid metering for domestic & commercial customers
2) Automatic Remote Metering for industrial customers.
5.2 Improvement in Transmission &
Distribution Efficiency – NTDC &
DISCOs
Up till now the concentration has been on the generation
side only. Though Pakistan is one of the few countries in the
world which have a national grid, the network is mostly
overloaded and voltage profile and stability issues exist
even on the 132kV distribution level.
It is a fact that none of the grid stations in Pakistan, more
than 1000 in number, meet the n-1 criterion as far as
transformer firm capacity is concerned.
When the generation would increase and factories would
start functioning again, the reliability and availability of the
transmission & distribution networks will drastically drop
further due to their overloading.

14
Instead of going for very expensive expansion programs,
network optimization by using simulation and management
software can help us to achieve the required reliability by
simultaneously reducing the maintenance costs also.
The following software packages are available in the
market:
1) Transmission network simulations
2) Distribution network simulations
3) Grid Station Maintenance Management
4) Network Asset Management
First step to improve DISCOs performance is to determine
the exact technical losses and non-technical losses by using
network simulation software.
As a second step, proper Asset Management measures can
reduce maintenance costs at the same time increasing the
reliability of the system.
The above measures to improve a DISCOs performance can
be mutually worked out with the utility operator.
5.3 Reduce demand by Energy
Conservation
Energy conservation is another issue that is perhaps not so
tangible but equally important. A dollar worth of energy
conserved is equivalent to 2 dollars saved, considering the
environmental loss in the energy supply chain. We may
need to change our entire approach towards life to come to
terms with our increasing energy supply-demand gap.
Training from the childhood will be required to make the
energy conservation plans work. Energy conservation
should be a subject in schools and universities. Awareness
needs to be generated by using all possible means.
USA has reduced its oil requirement by 30% over the last 5
years by applying energy conservation measures.
We are wasting 3 times more energy than the world
average. Therefore, we need to stop being wasteful
immediately. It only involves switching of the equipment
and gadgets not required. In a small country like Austria,
200MW could be saved by not keeping the household
gadgets and office equipment on standby. We should know
that what we are spending today in Pakistan is being
borrowed from the future of our children.
5.4 Human Resource
Utilities need to work with Engineering Universities to get a
new generation of engineers who understand Renewable
Energies and Energy Economics.
The suppliers for Renewable Energy goods are invariably
product suppliers and do not understand our utility network
requirements and grid interconnection problems. The
foreign consultants have similar limitations. The
engineering and consultancy services therefore can be best
supplied by our local engineers, who should be accordingly
trained in our engineering institutions.
Two subjects should be introduced at the undergraduate
levels. Outline of the courses can be provided as a basis of
discussion.
o Renewables
o Engineering Economics
6.0 Conclusion:
If we want to expedite the use of our huge Renewable
Resources and avert a full-blown crisis in the next few
years, we will have to rethink our entire approach towards
generation, transmission and distribution of electric power.
The main reasons are:
1) We do not have many financially strong investors.
2) Borrowed money is expensive and resulting tariffs are
unaffordable.
3) Law and order situation in the region will remain
volatile; therefore, self-dependence is called for i.e.
maximizing use of local energy and human resources.
4) Opportunity costs of gas and water resources for forced
electricity production are high.
In the light of the above, the following measures are
suggested:
� Cooperatives for Wind Power Plants: Investors may
even own a single WTG. With the modern monitoring and
communication possibilities, they may not be required to
visit the plant even. They can get their returns as cash or in
equivalent amount of electricity delivered to their industry
elsewhere. Such models are operating successfully in many
parts of the world. Only grid supporting, state of the art
wind technology should be allowed.
� Instead of cost plus tariff, only an attractive Feed in
Tariff (FIT) should be made available. This will encourage
investors to go for high efficiency state of the art wind
turbines. A feed in tariff for reactive power needs to be
worked out as well to provide incentive to the investors to
get the grid supporting wind technology.
� Since HESCO has recently shown its inability for
various reasons to evacuate power generated by WPPs in
the Gharo corridor, as an immediate measure, the WPPs
should be allowed to invest in setting up transmission lines
from Wind Farm sites to the National Network. This
investment can be adjusted in the tariff and would be much
better than the huge IDC to be paid by the WPPs ready for
power evacuation. Other 18th amendment related issues,
need to be resolved on priority basis with a win-win
situation for both energy generating province and energy
consuming province.
� Generation hubs for Solar PV Plants (2MW to 20MW),
Solar Thermal Plants (20MW to 200MW) and Wind Power
Plants (30MW to 100MW) should be installed in
government provided secure areas with good solar radiation
& wind speed areas. The power evacuation and

15
strengthening of the network by adding base load plants
should be pre-planned and prearranged.
The time schedules should be adhered to at all costs,
otherwise serious Lenders and Suppliers would go away
never to come back. Investors can get their returns as cash
or equivalent amount of electricity delivered to any industry
with which they may have an agreement. Wheeling
agreements with utilities should be supported as a policy.
� Hybridization of Solar with Wind, small Hydro and
Fossil fired Power Plants need to be promoted. As an
example, a 10MW PV Solar Plant with our standard 50MW
WPP is technically most suited under the circumstances as it
would:
o Provide ancillary services for the WPP
o Help in supporting the weak utility grid
o Improve the overall availability and predictability of the
hybridized plant
� Only Renewable Energies including small Hydro offer
a local value addition of the desired level. As a matter of
principle, we should invest only in those energy projects
that can achieve a 70% local value addition within a decade.
This is easily possible in case of small hydro, wind and
solar.
� Large hydro storage projects are necessary for our
Country. A program for maximizing local content here
should form a corner stone of any future energy policy. A
politics of creating winwin situation can expedite an
amicable resolution of internal non-technical issues.
The engineering community headed by PEC should
seriously look into this issue and resolve it within the real
time. Our engineers amongst the politicians need to accept
their responsibility regarding the nontechnical issues.
According to conservative estimates, the Pakistan Energy
Market requires a financial outlay of 150 billion USD over
the next 20 years to generate, transmit and distribute
50,000MW, provided we have a local value addition level
of close to 70%. This is the minimum electrical energy
required by us to remain to a viable Country. Most of this
money has to come from the private sector, which will also
be the major beneficiary of this expenditure. In case of
“business as usual” i.e. no local value addition, the financial
inputs can be 3 times higher.
These are extra-ordinary times for Pakistan, which demand
extra-ordinary measures. Though the electricity issue is
technically solvable, but each one of us needs to walk an
extra mile to make electricity affordable and sustainable.
References:
1 Survey of Pakistan, Atlas of Pakistan 3rd ed., 2012
2 Alternate Energy Development Board, Resource Potential
(Wind), Web. 20 Feb. 2013.
3 PBC Energy Expert Group, Integrated Energy Planning
and Pakistan’s Energy Future, PBC Position Paper,
2011
4 Asian Development Bank, Pakistan Integrated Energy
Model (Pak-IEM), Aug. 2011
5 Henrik Stiesdal, SWP Engineering White Paper,
NetConverter®, May 2010.
6 National Transmission and Despatch Company, Grid
Code Addendum No. 1: Grid Integration of Wind Power
Plants, Apr. 2010.
7 National Electric Power Regulatory Authority, Tariff
Wind Power Generation, Web, 20 Feb. 2013
8 Government of Pakistan, Policy for Development of
Renewable Energy for Power Generation, Dec. 2006
*****

16
N.E.C (U.S.A) and Protective Devices
Considerations For Electrical Motors
By: ENGR. MOHAMMAD IRFAN AKHTAR
Acting Chief Electrical Engineer, (N.J. Project) A.C.E
(Pvt) Ltd
Abstract
NEC (USA) is being used in the U.S.A for well over hundred
years. It pertains to issues related with distribution of
electrical power in Domestic, Industrial and Commercial
areas.
In power houses, we come across many electrical motor
circuits. There are some protective devices i.e. fuses and
circuit breakers which are involved.
In this paper, a case study is included wherein the ratings of
the various protective devices have been calculated with the
help of NEC tables.
INTRODUCTION
The National Electrical Code, abbreviated as NEC, is a very
important document and a design guide to understand and
construct all electrical installation in the U.S.A.
In the U.S.A, and in some other countries too (for instance
Saudi Arabia, Kuwait etc.) where the above cited code is
employed, all equipment and wiring must conform to the
NEC Standards. The NEC is user’s friendly and even a
person who can read and write English and has some
technical know-how can easily understand it and make full
use of it.
In NEC, there are hundreds of very useful tables. Out of
those a few tables particularly pertaining to “electrical
motors” are discussed in detail.
The NEC sets forth the minimum standards for electrical
wiring in the United States. The standards contained in the
NEC are enforced by being incorporated into the different
city and community ordinances that deal with electrical
wiring in residences, industrial plants (e.g. factories and
chemical plants etc.) and commercial building. Therefore,
these local ordinances conform to the standards set forth in
the NEC.
Just to give an idea to those engineers who are not familiar
with NEC, only a page from Table of Contents is attached
herewith as Annexure – 1. This partial listing provides an
over-view of the organization of the NEC. It is important for
all electrical engineers as well as brilliant students of
Electrical Engineering to learn as to how to fruitfully use
the NEC.
SOME BACKGROUND OF NATIONAL ELECTRICAL CODE (U.S.A)
The National Electrical Code (abbreviated as NEC) is one
of many codes and standards that are published by the
National Fire Protection Association (NFPA), a not-for-
profit corporation. The First Edition was issued during the
year 1896. The code is revised every three years in order to
keep up with new materials, tools, and methods that are
constantly being developed. This work is performed by 21
separate committees, each consisting of approximately 10 to
15 persons, the majority of them engineers. Members of
each committee meet several times, discuss all proposed
changes, accepting some and rejecting others, and rewrite
(as required) the sections of the Code that were assigned to
their committee. Then, they circulate the changes among the
various committees, coordinate the changes, and rewrite
again. So, obviously, the updating of the NEC is a tedious
task. But the real difficulty is that it must remain applicable
to all types of electrical installations, leaving no “gaps”.
Because of this, it becomes rather difficult to interpret in
some instances. For this reason, Handbooks are also
available which are written by prominent and experienced
persons and these Handbooks are very useful.
The engineers who write the Code and the Handbooks are
deeply concerned with technical accuracy and
completeness.
NEC is being used not only in U.S.A but also in some other
countries such as Saudi Arabia and Kuwait etc.
In Saudi Arabia historically the Eastern Region has more
American influence due to the presence of ARAMCO
which has been carrying out the trade of crude oil for the
past 80 years. The author happened to see some contracts
regarding Thermal Power Plants which were awarded by
SCECO East (now it is called S.E.C) and which contained
reference of above said NEC. In Dammam area, sockets,
switches and wiring devices are generally in accordance
with N.E.C (U.S.A).
The above said extremely useful code is available on the
internet for free down-loading at the following website:
ESSENTIALS OF A MOTOR CIRCUIT
If one happens to see the Single Line Diagram pertaining to
a power station, it will be observed that there are many
circuits which feed a.c. motors. The motors employed are
invariably three-phase type; this is particularly true for large
hp motors. Further, those motors which need large starting
torque must be wound rotor a.c. motors. There are some
other motors which do not need large starting torque, for
instance those which are used in exhaust fans etc. Such
motors are squirrel cage type a.c. induction motors.
Let us take an actual study case for a motor. Refer to Figure
– 1 wherein a complete feeding circuit for a 10 H.P. squirrel
cage induction motor is shown. The motor is having a
Service Factor of 1.15 and it is a 40°C temperature rise
motor. Since all American motors, which are made in
accordance with NEC, must have a NEMA Design Code
letter (for example A, B, C, D etc., which indicates as to
how much is the starting current of the motor). While “A”
has the minimum starting current, “B” will have more
starting current than “A”. This feature goes on increasing in
the ascending order.

17
A 10 hp motor is not a large hp motor and it can be directly
connected to a.c. power supply. But large motors say one
having a rated output of 100 hp is started through reduced
voltage starting equipment (for instance, a star-delta starter
is utilized for this purpose). As explained in Reference – 2,
if the kVA rating of the motor, which can be ascertained
from the hp rating of the motor, is less than 15% of the
capacity of the distribution transformer which is feeding it,
only then it can be connected directly to the a.c. supply. For
example, if the distribution transformer is having a rated
capacity of 25kVA then even a 10 hp motor cannot be
directly connected, i.e. without some reduced voltage
starters, since it is more than 15% of the rated capacity of
the transformer.
In the following paragraphs methodology as well as
pertinent aspects of motors and their protective device are
explained.
METHODOLOGY
The following methodology is used for ascertaining the
ratings of Protective Devices etc.
1) Refer to Figure – 1. The motor is a 10 hp direct on line
3-phase a.c. squirrel cage induction motor.
Refer to NEC Table 430-150 (attached herewith). In
this Table against 10 HP, the value which is appearing
below 460V is 14 Amps. A few notes are provided in
the table and according to one of those, if the power
factor is taken as 0.8 then the above found value (i.e.
14 Amps) has to be multiplied by 1.25.
Further the voltage which is prevailing in WAPDA
system is 400 V. So we will make the above said
current for 400 V in this way:
(14 x 1.25) x 460/400 = 20.125 Amps - - - - - - - - - - - - - (i)
2) Now for ascertaining the rating of the Inverse Time
Circuit Breaker which is for short circuit and Ground
Fault Protection, refer to Table 430-152. This circuit
Breaker will be installed in the Main Distribution Panel
appearing in Figure -1. Since the above said motor has
a NEMA Design code “A” (which is so stated on its
name plate, we will read against “squirrel cage other
than Design “E”, and the value is 250%. In other
words, the rating of the circuit breaker will be 20.125 x
2.5 = 50.3125 amps. This is, ordinarily, the maximum
size of the circuit breaker which is allowed for Figure –
1 motor.
As per NEC Section 240-6, the next higher standard
size of circuit breaker which is 60 A can be used. The
same is selected and should be employed for the
intended purpose.
Usually 60 A should be able to allow the above said
motor to start and come to its full speed. However, in
case this 60 A circuit breaker does not allow the motor
to start and the former unnecessarily trips then for such
motors whose full load current is 100 amps or less, the
absolute maximum size of the branch circuit breaker
(i.e. the one which is installed in the Main Distribution
Panel) can be 400% of the full load current. For those
motors, whose full load current is more than 100 amps,
there are different rules and for that purpose NEC
should be consulted.
3) Regarding overload protection which is also called
Running Protection, there are two types of motors. In
the first category are those motors which are 40°C
temperature rise over 40°C ambient temperature and
which have a Service Factor of 1.15. The overload
protection (i.e. fuse or C.B ) should not be more than
125% of the full load current. The second category
motors are all other motors which do not fall in the first
category and for these the overload protection should
not exceed 115% of full load current of the motor.
In our particular case, the full load current as read from
the name plate of the motor is 19.0 amps. So, 19 x 1.25
= 23.75 amps. Since NEC allows to utilize next higher
standard size, therefore, from NEC section 240-6, the
selected size will be 25 amps.
4) It must be borne in mind that while selecting overload
protection of motor, the full load current which is to be
used in the calculation is the one which is indicated on
the name plate of the motor. It may be recalled that
while selecting Short Circuit and Ground Fault
Protection, the value of the full load current of the
motor was taken from NEC Table 430-150 and in this
particular case it will be wrong to use the value of the
full load current of the motor which is appearing on the
name plate of the motor.
5) Regarding overload protection of the motor, refer to
Table 7-3(A) which is attached herewith. Since the
Motor’s ampere rating as found by (i) above is 20.125
Amps therefore, the rating of the Dual-element fuse
will be 25 Amps.
6) The last thing which is yet to be determined is the size
of the Disconnector. As per NEC it should not be less
than 125% of the full load current of the motor. Since
full load current of the motor, as found from Table 430-
150 is 20.125 amps, so the size of the Disconnector will
be 20.125 x 1.25 = 25.16 amps. Again selecting the
next higher size from section 240-6, we choose 30
amps size.
SOME ELABORATION ABOUT VARIOUS COMPONENTS
(a) Electrical Motors
For converting electrical energy into mechanical
energy, A.C. and D.C. motors have been in vogue in
the industry for well over 100 years.
So far as A.C. motors are concerned, the principal
types of three-phase motors are:
18
(1) Induction Motors (these are further subdivided
into two categories i.e. squirrel cage type and
wound-rotor type)
(2) Synchronous motors
Three phase A.C. induction motors specially squirrel
cage type have the following advantages and due to
these are very much popular in the industry:
(1) Low initial cost
(2) Easy operation and maintenance
(3) High Efficiency
(4) High power factor (when these are about 90 to
100% loaded).
(5) Rugged construction
(6) Reliable operation
(7) Simple control gear for starting and speed
control.
So far as Synchronous motors are concerned, these are
similar in construction to an alternator i.e. there is a
D.C. field winding on the rotor and a three phase
winding on the stator. The problem with a
synchronous motor is that it is not self starting and
first of all it has to be brought to synchronous speed by
some other means such as a diesel engine or an
induction motor etc. and only then it will start
revolving with the help of incoming a.c. supply.
Synchronous motors are suitable for constant speed
applications such as frequency changers etc. These
have been used in Thermal Power Station for driving
compressors required for Gas Turbines etc.
(b) Protection Devices
For protection against overcurrent, two types of
devices namely fuses and circuit breakers are
commonly employed. In the U.S.A, the National
Electrical Manufacturers Association, abbreviated as
NEMA, has established standards for the ratings,
types, classifications and testing procedure for fuses
and circuit breakers.
As per NEC, the ratings of fuses and non-adjustable
circuit breakers are 15, 20, 25, 30, 35, 40, 45, 50, 60,
70, 80, 90, 100, 110, 125, 150, 175, 200, 225, 250,
300, 350, 400, 450, 500, 600, 700, 800, 1000, 1200,
1600, 2000, 2500, 3000, 4000, 5000 and 6000
amperes.
In addition to above, the following standard ratings are
also applicable for fuses: 1, 3, 6, 10 and 601 amperes.
In the case of externally adjustable trip circuit
breakers, the rating is considered to be the breaker’s
maximum trip setting, and in this regard refer to NEC
Section 240-6. However, there are three exceptions to
this rule as explained below:
(1) If the breaker has a removable and sealed cover
over the adjusting screws, or
(2) If it is located behind locked doors accessible
only to qualified personnel, or
(3) If it is located behind bolted equipment
enclosure doors.
In above mentioned three cases, the adjustable setting
is considered to be the breaker’s ampere rating. For
example the rating of an adjustable circuit breaker is
100 A but it is indicated on it that it can be adjusted to
make it a 50, 60, or 80 A breaker. Suppose someone
has adjusted it and made it a 50 A breaker but it has
not been installed in the ways indicated above under
(1) or (2) or (3) then even after adjustment this circuit
breaker will be considered as 100 A circuit breaker for
the purpose of providing protection to a circuit or
equipment.
It may be noted that the NEC’s ratings for fuses and
circuit breakers mentioned above are quite different
from IEC ratings. For instance IEC ratings for fuses
are 2, 4, 6, 10, 12, 16, 20, 25, 32, 40, 50, 63 etc.
(c) Motors Disconnectors and Ratings
As per NEC, switches with fuses as well as switches
without fuses are available. The latter are commonly
called “Safety Switches”. Both type of above
mentioned switches are available in rating of 30, 60,
100, 200, 400, 600, 800, 1200, 1600, 2000, 2500,
3000, 5000 and 6000 amperes in both 250 and 600
volts class. They are for use with copper conductors
unless marked to indicate that the terminals are
suitable for use with aluminum conductors.
Quite often Labels are exhibited on Disconnectors that
indicate their intended application. A few examples are
as stated below:
� Disconnectors intended for isolating use only are
marked “For Isolation Use Only – Do Not Open
Under Load”.
� When a switch is marked “Motor – Circuit
Switch”, it is only for use in motor circuits.
� Enclosed switches with horsepower rating in
addition to ampere ratings are suitable for use in
motor circuits.
(d) Dual-Element Fuses
The starting current of an electrical motor is very high
for a few seconds (say first 4-5 seconds till the motor
attains its full speed).
For the overload protection of motors, fuses or circuit
breakers can be used. Dual-element time delay fuses
are an excellent choice for the overload protection of
motors. They can be sized close to the ampere rating
of the motors. When the motor has integral overload
protection then dual-element time delay fuses are
selected to provide back-up overload protection.
19
Dual-element time delay fuses will carry five (5) times
their ampere rating for at least 10 seconds. As a result,
this feature allows the motor to start and then provide
good overload protection while it is running.
For example, a motor whose full load current is 4
amperes could have a starting current as high as 24
amperes. The fuse must not open needlessly when it
encounters the inrush current of 24 amperes. In such a
situation, a 15 – ampere ordinary (i.e. not having time
delay feature) fuse or breaker might be required to
allow the motor to start. Certainly it would not provide
overload protection for the appliance since the
overload protection has to be 125% of the normal full
load current of the motor.
The solution is to install a dual-element time delay
fuse that permits the motor to start yet on a continuous
overload it melts and thus protects the motor. Type
“S” fuses (which are as per U.S.A practice) as well as
Type S adaptors are inserted into the fuse holders and
installed in the motor’s feeding circuit.
Note: The Disconnector must be visible from the location
of motor and should not be more than 50 feet away from it.
Otherwise, it must be lockable.
CONCLUSION:
NEC (USA), which is being used in U.S.A for well over
100 years is an excellent design guide and it can be
profitably used in Pakistan.
In all types of power stations, the auxiliary power supply
system has to provide a.c. power supply to many electrical
motor circuits. In this paper a study case regarding a 10 hp
induction motor has been included to ascertain the sizes of
the various protective devices, in accordance with NEC
(U.S.A). The necessary tables which are required for the
calculations are also included.
REFERENCES:
1) National Electrical Code, published in year 2011,
Published by National Fire Protection Association,
U.S.A
2) Electrical Engineer’s Portable Handbook, 2nd
Edition, Published by Mcgraw-Hill Book Company,
U.S.A.
3) Electrical Wiring Commercial, 10th Edition,
Published by Delmar Publishers, U.S.A.
Note:Multiplier for using 400 V at 0.8 p.f is = (460/400) x
1.25 = 1.4375↔ Factor find value from above table. Then
multiply by the multiplier. (For example for 100 HP motor,
current under 460 V = 124 A.
Then 124 x (460/400) x 1.25 = 178.25A will be motor’s F.L
current at 400 Volts.
(C) Rating or Setting.
(1) In Accordance with Table 430.52. A protective device
that has a rating or setting not exceeding the value
calculated according to the values given in Table 430.52
shall be used.
Table 430.52 Maximum Rating or Setting of Motor Branch-Circuit
Short-Circuit and Ground-Fault Protective Devices
Percentage of Full-Load Current
Type of Motor
Nontime
Delay Fuse1
Dual
Element
(Time-
Delay)
Fuse1
Instant
aneous
Trip
Breake
r
Invers
e Time
Breaker2
Single-phase motor 300 175 800 250
AC polyphase motors others than wound-rotor
300 175 800 250
Squirrel cage –
other than Design E
or Design B energy
efficient
300 175 1100 250 Design E or Design
B energy efficient
Synchronous3 300 175 800 250
Wound rotor 150 150 800 150
150 150 250 150 Direct current
(constant voltage)
Note: For certain exceptions to the values specified, see
430.54.
1The values in the Nontime Delay Fuse column apply to Time-
Delay Class CC fuses.
2The values given in the last column also cover the ratings of
nonadjustable inverse time types of circuit breakers that may
be modified as in 430.52 ©, Exception No. 1 and No. 2.
3Synchronous motors of the low-torque, low-speed type
(usually 450 rpm or lower), such as are used to drive
reciprocating compressors, pumps, and so forth, that start
unloaded, do not require a fuse rating or circuit-breaker setting
in excess of 200 percent of full-load current.
Exception No. 1: Where the values for branch-circuit short-circuit
and ground-fault protective devices determined by Table 430.52
do not correspond to the standard sizes or ratings of fuses,
nonadjustable circuit breakers, thermal protective devices, or
possible settings of adjustable circuit breakers, a higher size,
rating, or possible setting that does not exceed the next higher
standard ampere rating shall be permitted.
Exception No. 2: Where the rating specified in Table 430.52, as
modified by Exception No. 1, is not sufficient for the starting
current of the motor:
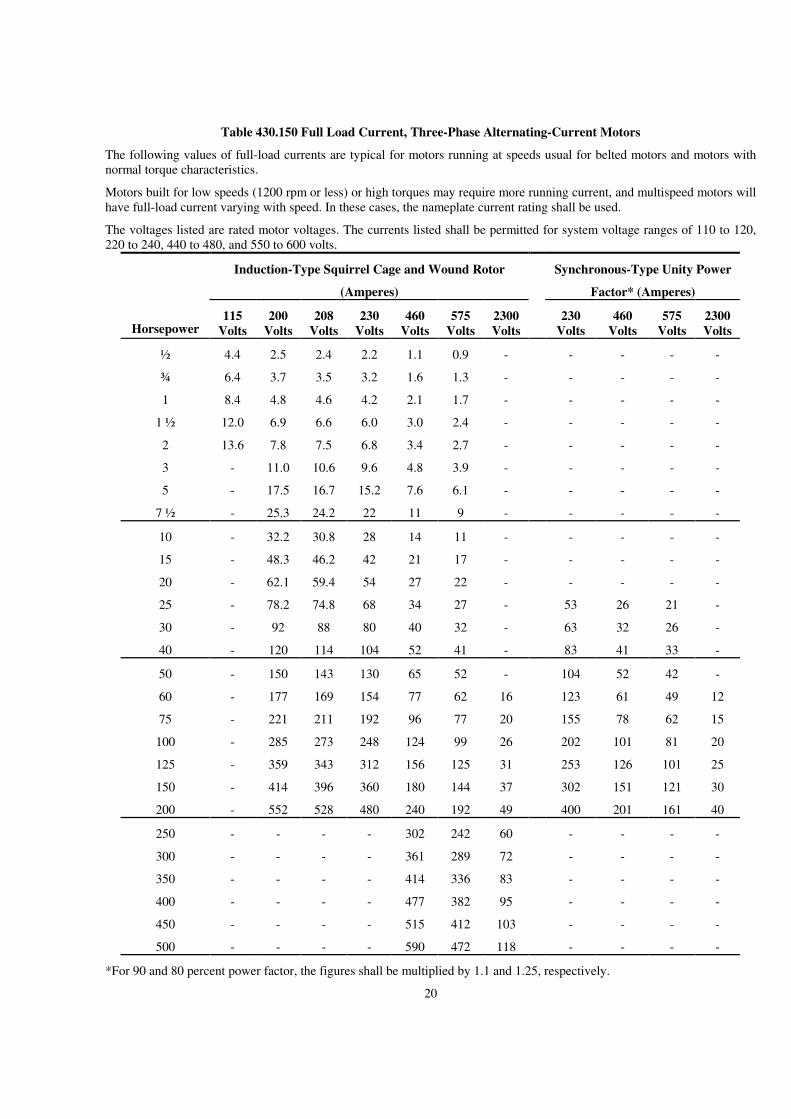
Table 430.150 Full Load Current, Three-Phase Alternating-Current Motors
The following values of full-load currents are typical for motors running at speeds usual for belted motors and motors with
normal torque characteristics.
Motors built for low speeds (1200 rpm or less) or high torques may require more running current, and multispeed motors will
have full-load current varying with speed. In these cases, the nameplate current rating shall be used.
The voltages listed are rated motor voltages. The currents listed shall be permitted for system voltage ranges of 110 to 120,
220 to 240, 440 to 480, and 550 to 600 volts.
Induction-Type Squirrel Cage and Wound Rotor
(Amperes)
Synchronous-Type Unity Power
Factor* (Amperes)
Horsepower 115
Volts
200
Volts
208
Volts
230
Volts
460
Volts
575
Volts
2300
Volts
230
Volts
460
Volts
575
Volts
2300
Volts
½ 4.4 2.5 2.4 2.2 1.1 0.9 - - - - -
¾ 6.4 3.7 3.5 3.2 1.6 1.3 - - - - -
1 8.4 4.8 4.6 4.2 2.1 1.7 - - - - -
1 ½ 12.0 6.9 6.6 6.0 3.0 2.4 - - - - -
2 13.6 7.8 7.5 6.8 3.4 2.7 - - - - -
3 - 11.0 10.6 9.6 4.8 3.9 - - - - -
5 - 17.5 16.7 15.2 7.6 6.1 - - - - -
7 ½ - 25.3 24.2 22 11 9 - - - - -
10 - 32.2 30.8 28 14 11 - - - - -
15 - 48.3 46.2 42 21 17 - - - - -
20 - 62.1 59.4 54 27 22 - - - - -
25 - 78.2 74.8 68 34 27 - 53 26 21 -
30 - 92 88 80 40 32 - 63 32 26 -
40 - 120 114 104 52 41 - 83 41 33 -
50 - 150 143 130 65 52 - 104 52 42 -
60 - 177 169 154 77 62 16 123 61 49 12
75 - 221 211 192 96 77 20 155 78 62 15
100 - 285 273 248 124 99 26 202 101 81 20
125 - 359 343 312 156 125 31 253 126 101 25
150 - 414 396 360 180 144 37 302 151 121 30
200 - 552 528 480 240 192 49 400 201 161 40
250 - - - - 302 242 60 - - - -
300 - - - - 361 289 72 - - - -
350 - - - - 414 336 83 - - - -
400 - - - - 477 382 95 - - - -
450 - - - - 515 412 103 - - - -
500 - - - - 590 472 118 - - - -
*For 90 and 80 percent power factor, the figures shall be multiplied by 1.1 and 1.25, respectively.
20
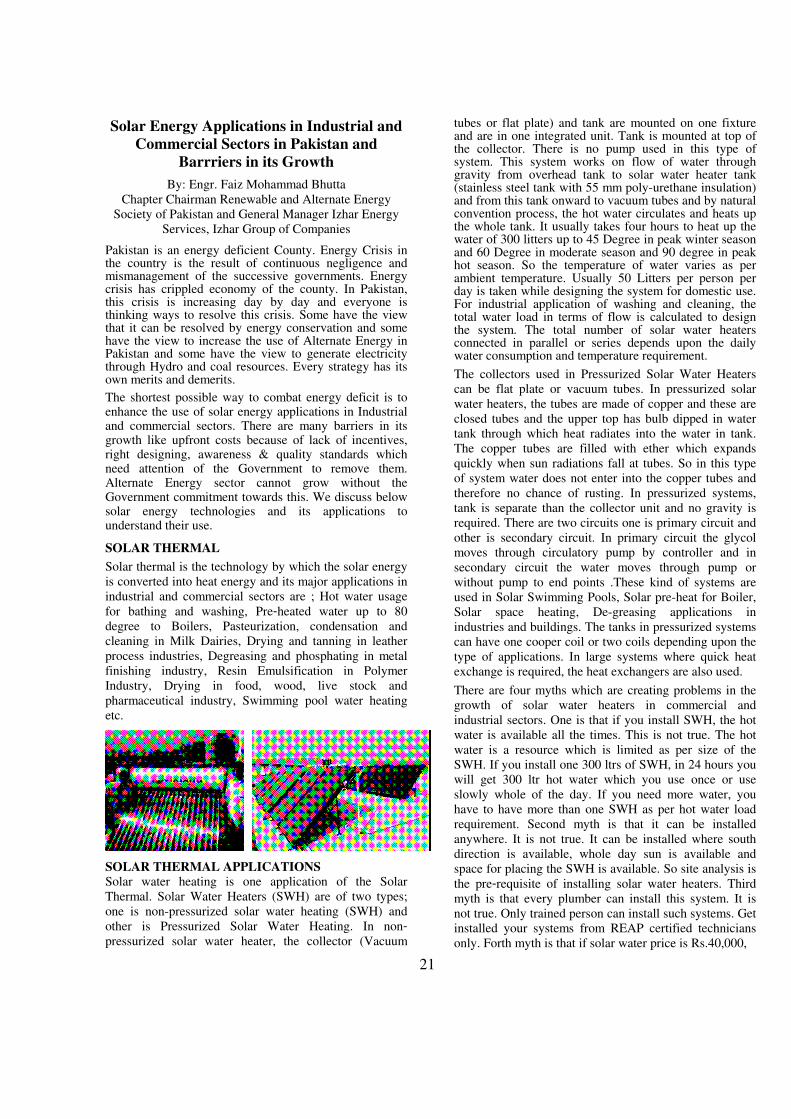
Solar Energy Applications in Industrial and
Commercial Sectors in Pakistan and
Barrriers in its Growth
By: Engr. Faiz Mohammad Bhutta
Chapter Chairman Renewable and Alternate Energy
Society of Pakistan and General Manager Izhar Energy
Services, Izhar Group of Companies
Pakistan is an energy deficient County. Energy Crisis in the country is the result of continuous negligence and mismanagement of the successive governments. Energy crisis has crippled economy of the county. In Pakistan, this crisis is increasing day by day and everyone is thinking ways to resolve this crisis. Some have the view that it can be resolved by energy conservation and some have the view to increase the use of Alternate Energy in Pakistan and some have the view to generate electricity through Hydro and coal resources. Every strategy has its own merits and demerits.
The shortest possible way to combat energy deficit is to enhance the use of solar energy applications in Industrial and commercial sectors. There are many barriers in its growth like upfront costs because of lack of incentives, right designing, awareness & quality standards which need attention of the Government to remove them. Alternate Energy sector cannot grow without the Government commitment towards this. We discuss below solar energy technologies and its applications to understand their use.
SOLAR THERMAL
Solar thermal is the technology by which the solar energy
is converted into heat energy and its major applications in
industrial and commercial sectors are ; Hot water usage
for bathing and washing, Pre-heated water up to 80
degree to Boilers, Pasteurization, condensation and
cleaning in Milk Dairies, Drying and tanning in leather
process industries, Degreasing and phosphating in metal
finishing industry, Resin Emulsification in Polymer
Industry, Drying in food, wood, live stock and
pharmaceutical industry, Swimming pool water heating
etc.
SOLAR THERMAL APPLICATIONS Solar water heating is one application of the Solar
Thermal. Solar Water Heaters (SWH) are of two types;
one is non-pressurized solar water heating (SWH) and
other is Pressurized Solar Water Heating. In non-
pressurized solar water heater, the collector (Vacuum
tubes or flat plate) and tank are mounted on one fixture and are in one integrated unit. Tank is mounted at top of the collector. There is no pump used in this type of system. This system works on flow of water through gravity from overhead tank to solar water heater tank (stainless steel tank with 55 mm poly-urethane insulation) and from this tank onward to vacuum tubes and by natural convention process, the hot water circulates and heats up the whole tank. It usually takes four hours to heat up the water of 300 litters up to 45 Degree in peak winter season and 60 Degree in moderate season and 90 degree in peak hot season. So the temperature of water varies as per ambient temperature. Usually 50 Litters per person per day is taken while designing the system for domestic use. For industrial application of washing and cleaning, the total water load in terms of flow is calculated to design the system. The total number of solar water heaters connected in parallel or series depends upon the daily water consumption and temperature requirement.
The collectors used in Pressurized Solar Water Heaters
can be flat plate or vacuum tubes. In pressurized solar
water heaters, the tubes are made of copper and these are
closed tubes and the upper top has bulb dipped in water
tank through which heat radiates into the water in tank.
The copper tubes are filled with ether which expands
quickly when sun radiations fall at tubes. So in this type
of system water does not enter into the copper tubes and
therefore no chance of rusting. In pressurized systems,
tank is separate than the collector unit and no gravity is
required. There are two circuits one is primary circuit and
other is secondary circuit. In primary circuit the glycol
moves through circulatory pump by controller and in
secondary circuit the water moves through pump or
without pump to end points .These kind of systems are
used in Solar Swimming Pools, Solar pre-heat for Boiler,
Solar space heating, De-greasing applications in
industries and buildings. The tanks in pressurized systems
can have one cooper coil or two coils depending upon the
type of applications. In large systems where quick heat
exchange is required, the heat exchangers are also used.
There are four myths which are creating problems in the
growth of solar water heaters in commercial and
industrial sectors. One is that if you install SWH, the hot
water is available all the times. This is not true. The hot
water is a resource which is limited as per size of the
SWH. If you install one 300 ltrs of SWH, in 24 hours you
will get 300 ltr hot water which you use once or use
slowly whole of the day. If you need more water, you
have to have more than one SWH as per hot water load
requirement. Second myth is that it can be installed
anywhere. It is not true. It can be installed where south
direction is available, whole day sun is available and
space for placing the SWH is available. So site analysis is
the pre-requisite of installing solar water heaters. Third
myth is that every plumber can install this system. It is
not true. Only trained person can install such systems. Get
installed your systems from REAP certified technicians
only. Forth myth is that if solar water price is Rs.40,000,
21

this is total cost. It is not true. The total cost is the cost of
SWH, piping and plumbing accessories which can vary
from Rs.2000 to Rs.10,000 depending upon site
conditions. Scaling is another issue in SWH which has to
be considered during performance monitoring of systems.
Amount of scaling depends on water quality. In industrial
applications, water softeners are required to soften the
water before they enter into solar collectors. Get your
systems de�scaled once in two years as it will improve its
performance. Cleaning it on weekly basis the collectors as
in our country dust is too much.
Solar Thermal Power Plant is another application of solar
thermal. Solar thermal power plant consists of solar
collectors which can be of Dish, parabolic or tower type
formation, steam generation process and steam generators
for converting steam into electric power. These thermal
power plants are very economical way of generating
power as compared to solar electric power generation.
The operational expense is more than that of solar electric
systems. Space requirement is more than Solar electric.
High power upto 200 MW can be generated through this
solar thermal power plants.
SOLAR PHOTOVOLTAICS Solar Photovoltaic is the technology by which solar
energy is converted into electrical energy and its major
applications in industrial and commercial sectors are;
Solar Homes Systems upto 2000 W, Solar Lighting, Solar
Power Plants from 10 KW to 20 MW, Solar Parks upto 20
MW, Solar UPS, Solar Roof Based On Grid Power
Generation, Solar Traffic Signals Lights, Power for
Remote Terminal Units, Power for Telecommunication
Towers and BSC and MSC, Building Integrated
Photovoltaic System, Military signaling applications,
Solar water Pumping, Solar Lighting for Parking lots,
Solar Lighting for Bus Stop Shelters etc.
SOLAR PHOTOVOLTAIC APPLICATIONS SOLAR ELECTRIC POWER GENERATION
Solar Electric Power can be generated varying from 100
Watts small solar home systems to 100 MW Solar Power
Plants or sometimes more than that. The solar power
systems are of two types; one is off-grid and other is on-
grid systems. In off-grid systems, the system has no link
with Utility grid and components used in Systems are
Solar Panels, Charge Controllers, Inverters, Deep Cycle
Batteries, mounting and electric accessories. Solar Panels
convert solar radiations into electric current and this
current passes through charge controllers which charges
the battery by controlling current for the battery. Charge
controllers maintain control on charging the battery for its
long life. So the DC power is stored in Batteries and this
stored energy is converted into AC Power to operate the
AC appliances. The DC appliances can be operated
directly with the battery. So DC and AC load can be
operated through a solar power system.
Un-professional and Un-trained people in the market are
selling under-designed and low quality systems because
of which the customers are losing confidence in solar
technology. On the one hand, solar technology has high
upfront costs and on the other hand people are selling low
quality and under-designed systems to cut down the costs.
The most important thing in solar Power systems is its
right design and putting high quality system components
which should guarantee faultless operation of the whole
systems for 20 years. The other important thing for
customers is that they should not buy system in watts but
systems in watthours. For example 500W system can
work for one hour and can work for 24 hours. If it
22

generates power for one hour, the system capacity will be
500 Watt�Hours and if the system works for 24 hours,
12000 Watt�Hours (12 KWHR per day means 12 units
per day). Now both systems are of 500 W but their
operational hours vary. The cost of the system is
calculated as per watt�hours, not as per watt. So
customers should not buy watts but watt�hours as they
are buying not watts but watt�hours which is real energy
as they pay their electric bills in watt�hours or Kilo Watt
Hours which is called the Units in common language.
On-grid systems are common in the world and world is
moving toward on�grid technology. On�Grid system is
that system which is connected with Utility Grid with
built in two meters one is export meter and one is import
meter and in some case one bi�directional meter which
reverses when electricity is sold to Grid and at the end the
user pays for the net meter reading. In two meters system,
when energy is sold to Grid, the export meter counts and
when energy is bought from grid, import meter counts the
power consumption and user has to pay the net reading of
both meters. User/Power producer will be paid by the
Utility if Utility has bought more and sold less. To make
legal such systems, there is FIT (Feed�In�Tariff) policy
by which the solar power generation is governed.
Through FIT policy, the Government fixes up the rate of
buying from solar power producers as per slabs. In
Pakistan, there is no net�metering policy and there is no
FIT policy. On�Grid power is cheaper and does not have
batteries. One of the barriers in FIT in Pakistan is the
continuous load shedding because such systems stop
working as such systems have no back up when grid is
off.
SOLAR LIGHTING
Solar Lighting is another application of solar
photovoltaic. Solar Lighting has many types. The solar
lighting can be solar street lighting, solar flood lighting,
solar garden lighting or some special applications of
lighting. In solar lighting, very important thing is the
designing of solution so that the lights work automatically
and remain on as per requirement. Most of the solar
lights, we see un�lit in the nights or they lit for some
hours and then go off against the timing requirement. The
reason for this is that the un�professional people have
designed and sold under�designed and low quality
systems. While purchasing the solar lighting systems,
define your specifications and then buy systems
accordingly and monitor their operational hours
continuously.
SOLAR PUMPING
Solar Pumping is another application of solar
photovoltaic. The solar pumping systems are of two
types, one is DC solar Pumping system and other is AC
solar Pumping system. DC solar pumping systems are
small systems which are for domestic purposes, offices
and irrigation of small lands up to two Acres. These DC
solar pumping systems are very reliable and cheaper. In
this system the pump motor is DC motor and one
controller controls its operation which is MPPT controller
responsible for smooth operation of the pump without the
need for batteries. The maximum flow with DC systems
can be upto 10,000 Gallons per day with maximum head
of 200ft. Solar AC Pumping system consists of AC Pump,
Pump Controller and solar panels. These are big systems
of motor power varying from 2KW to 60KW and their
up�front costs vary from Rs.1M to 20M. These AC
pumps are for all kinds of agriculture and big farming
applications. The flow can vary from 10m3 per hour to
300 m3 per hour with head varying from 100 ft to 600 ft.
Solar Pumping is very specialized job and calls for high
technical expertise starting from pump design &
selections to installation and commissioning of systems.
The customers should buy systems from professional
companies and get installed from trained pump
technicians.
23
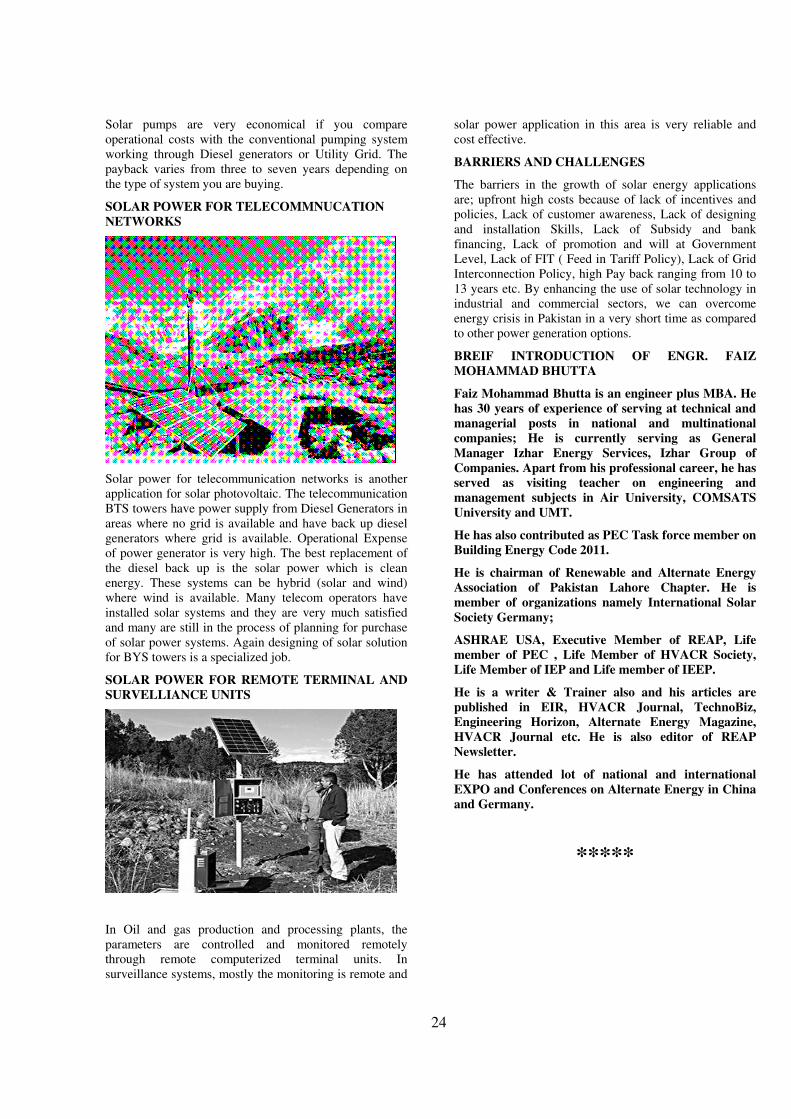
Solar pumps are very economical if you compare
operational costs with the conventional pumping system
working through Diesel generators or Utility Grid. The
payback varies from three to seven years depending on
the type of system you are buying.
SOLAR POWER FOR TELECOMMNUCATION
NETWORKS
Solar power for telecommunication networks is another
application for solar photovoltaic. The telecommunication
BTS towers have power supply from Diesel Generators in
areas where no grid is available and have back up diesel
generators where grid is available. Operational Expense
of power generator is very high. The best replacement of
the diesel back up is the solar power which is clean
energy. These systems can be hybrid (solar and wind)
where wind is available. Many telecom operators have
installed solar systems and they are very much satisfied
and many are still in the process of planning for purchase
of solar power systems. Again designing of solar solution
for BYS towers is a specialized job.
SOLAR POWER FOR REMOTE TERMINAL AND
SURVELLIANCE UNITS
In Oil and gas production and processing plants, the
parameters are controlled and monitored remotely
through remote computerized terminal units. In
surveillance systems, mostly the monitoring is remote and
solar power application in this area is very reliable and
cost effective.
BARRIERS AND CHALLENGES
The barriers in the growth of solar energy applications
are; upfront high costs because of lack of incentives and
policies, Lack of customer awareness, Lack of designing
and installation Skills, Lack of Subsidy and bank
financing, Lack of promotion and will at Government
Level, Lack of FIT ( Feed in Tariff Policy), Lack of Grid
Interconnection Policy, high Pay back ranging from 10 to
13 years etc. By enhancing the use of solar technology in
industrial and commercial sectors, we can overcome
energy crisis in Pakistan in a very short time as compared
to other power generation options.
BREIF INTRODUCTION OF ENGR. FAIZ
MOHAMMAD BHUTTA
Faiz Mohammad Bhutta is an engineer plus MBA. He
has 30 years of experience of serving at technical and managerial posts in national and multinational companies; He is currently serving as General
Manager Izhar Energy Services, Izhar Group of
Companies. Apart from his professional career, he has served as visiting teacher on engineering and
management subjects in Air University, COMSATS
University and UMT.
He has also contributed as PEC Task force member on Building Energy Code 2011.
He is chairman of Renewable and Alternate Energy Association of Pakistan Lahore Chapter. He is
member of organizations namely International Solar
Society Germany;
ASHRAE USA, Executive Member of REAP, Life member of PEC , Life Member of HVACR Society, Life Member of IEP and Life member of IEEP.
He is a writer & Trainer also and his articles are
published in EIR, HVACR Journal, TechnoBiz, Engineering Horizon, Alternate Energy Magazine,
HVACR Journal etc. He is also editor of REAP
Newsletter.
He has attended lot of national and international
EXPO and Conferences on Alternate Energy in China and Germany.
*****
24

Center of Mass of Earth through Mass
Balancing and Torque Balancing Latitude:
An Analysis
Anam Qureshi, Murk Marvi, Fahim Aziz Umrani, B. S.
Chowdhry, and A. Q. K. Rajput
Institute of Information & Communication Technologies,
Mehran University of Engineering and Technology,
Pakistan, 76062
Abstract This research paper presents the proof of
concept of locating the center of mass of earth using basic
physics principles. The underline argument in this paper
is that the geometrical center of the earth i.e., Equator
cannot be the center of mass of the earth.
Keywords: Center of mass of earth, crust mass, Mass
Balancing technique, Torque balancing Latitude
1. INTRODUCTION
The center of mass is the point where all of the mass of
the object is concentrated. This point can be different
from the geometric center of the object. For example, a
car's center of mass is closer to the ground rather than in
the geometric center of the car and due to this, car is
balanced in a better way. The center of mass of objects
plays very important role when there are number of
interrelated objects in a system. For example in case of
satellite communication, the complete system consists of
two objects, the earth and the artificial satellite. Now for
the purpose of having a very stable system it is a required
condition that the satellite must revolve around the center
of mass of the earth therefore the correct estimation of
center of mass of earth can help to achieve more stable
artificial satellite systems.
Another important thing about center of mass of any
object is that it can be used as a frame of reference and
with the help of an accurate frame of reference number of
unknown parameters can be approximated. For example
in case of earth the accurate frame of reference can help
to approximate the rate of change of continental drift in a
better way and hence the earth quakes and some other
natural hazards can be estimated more accurately.
From above discussion it is clear that the estimation of an
accurate center of mass of earth is very important for
number of purposes. The center of mass of the earth has
been discussed by many researchers and scientists but yet
not discovered [1]. Sometimes equator is considered as
center of mass of earth by merely considering geometrical
shape of the earth, which is not justifiable in any ways
because there are few conditions that need to be satisfied
by a point to be the center of mass of the object and it
would be clear in the remaining sections that the equator
is not satisfying any of those conditions.
In this paper, the proof of concept of locating the center
of mass of earth using basic physics principles has been
presented. Following this section, section 2 discusses the
method to locate the center of mass of earth and applies
the relevant tests on the equator. Finally section 3
provides the conclusions to this short paper.
2. METHOD
The conditions that need to be satisfied by any point to be
the center of mass of an object are:
١) The mass of object must get balanced at that
point
٢) The effect of net torque must be zero at that
point
Any point satisfying above two conditions will be in static
equilibrium.
The formula for torque is:
where r is the moment arm and W is the weight. It is
possible to locate the center of mass of a system by
placing a pivot at the theoretical center of mass and using
the formula for torque by setting the torques on either end
of a long, rigid body equal to each other.
Figure 1: Center of mass point illustration
Therefore, the center of mass of earth would be around
the latitude on the earth’s surface where the above two
conditions will be satisfied. So firstly it is required to find
out the latitude on the earth where the mass of earth is
getting balanced Secondly, at that latitude the torque must
also get balanced.
Test 01: Mass balancing latitude
The Earth’s interior is divided into three main layers
namely core, mantle and crust. The outer most layer of
Earth is crust which is divided in to two parts, the oceanic
crust and the continental crust. The mass of mantle and
core layer is not considered in our calculations because
these two layers are not fully discovered yet and it is not
known exactly that from where these layers start and
where they end. As the outermost layer (i.e., crust) is
almost fully accessible and discovered therefore it is
better to consider it only in the calculation and assume
that the others are uniformly distributed inside the earth.
The estimated center of mass of earth using this method
would be at least better than equator which is merely a
consideration based on the geometric shape of the earth.
So here we have considered the mass of continental crust
and the oceanic crust along with hydrosphere. The
oceanic crust is very thin as compared to continental
25
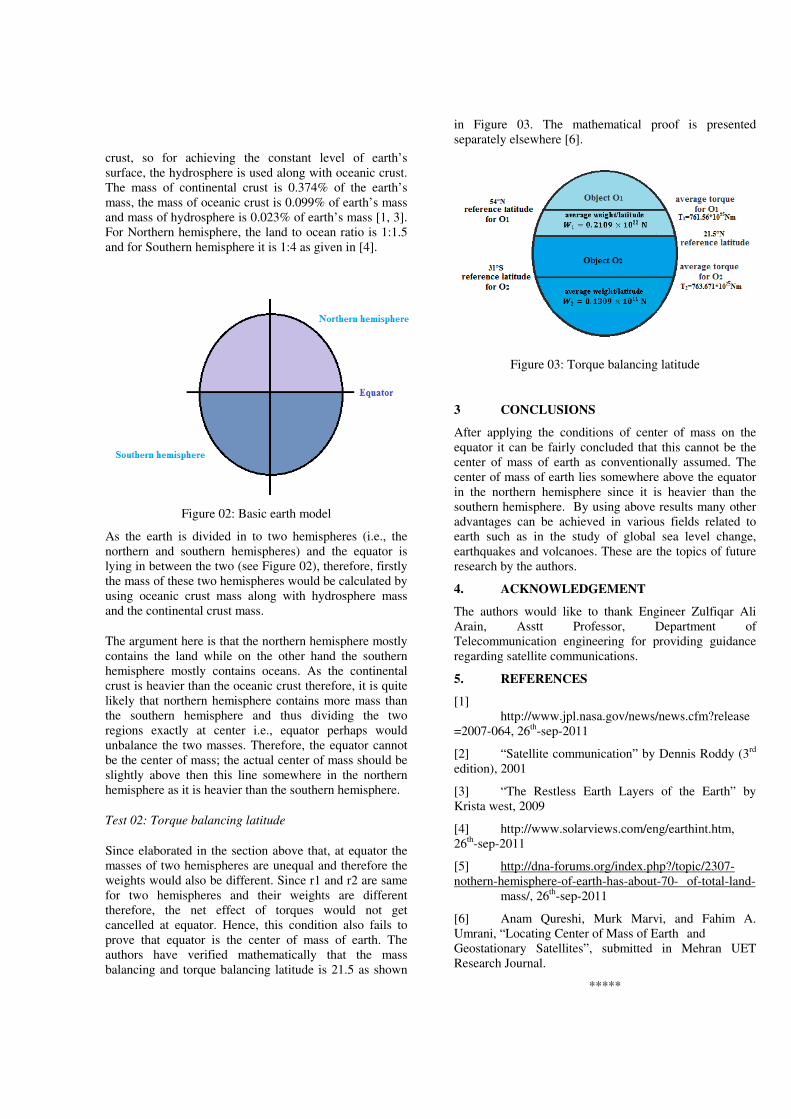
crust, so for achieving the constant level of earth’s
surface, the hydrosphere is used along with oceanic crust.
The mass of continental crust is 0.374% of the earth’s
mass, the mass of oceanic crust is 0.099% of earth’s mass
and mass of hydrosphere is 0.023% of earth’s mass [1, 3].
For Northern hemisphere, the land to ocean ratio is 1:1.5
and for Southern hemisphere it is 1:4 as given in [4].
Figure 02: Basic earth model
As the earth is divided in to two hemispheres (i.e., the
northern and southern hemispheres) and the equator is
lying in between the two (see Figure 02), therefore, firstly
the mass of these two hemispheres would be calculated by
using oceanic crust mass along with hydrosphere mass
and the continental crust mass.
The argument here is that the northern hemisphere mostly
contains the land while on the other hand the southern
hemisphere mostly contains oceans. As the continental
crust is heavier than the oceanic crust therefore, it is quite
likely that northern hemisphere contains more mass than
the southern hemisphere and thus dividing the two
regions exactly at center i.e., equator perhaps would
unbalance the two masses. Therefore, the equator cannot
be the center of mass; the actual center of mass should be
slightly above then this line somewhere in the northern
hemisphere as it is heavier than the southern hemisphere.
Test 02: Torque balancing latitude
Since elaborated in the section above that, at equator the
masses of two hemispheres are unequal and therefore the
weights would also be different. Since r1 and r2 are same
for two hemispheres and their weights are different
therefore, the net effect of torques would not get
cancelled at equator. Hence, this condition also fails to
prove that equator is the center of mass of earth. The
authors have verified mathematically that the mass
balancing and torque balancing latitude is 21.5 as shown
in Figure 03. The mathematical proof is presented
separately elsewhere [6].
Figure 03: Torque balancing latitude
3 CONCLUSIONS
After applying the conditions of center of mass on the
equator it can be fairly concluded that this cannot be the
center of mass of earth as conventionally assumed. The
center of mass of earth lies somewhere above the equator
in the northern hemisphere since it is heavier than the
southern hemisphere. By using above results many other
advantages can be achieved in various fields related to
earth such as in the study of global sea level change,
earthquakes and volcanoes. These are the topics of future
research by the authors.
4. ACKNOWLEDGEMENT
The authors would like to thank Engineer Zulfiqar Ali
Arain, Asstt Professor, Department of
Telecommunication engineering for providing guidance
regarding satellite communications.
5. REFERENCES
[1]
http://www.jpl.nasa.gov/news/news.cfm?release
=2007-064, 26th-sep-2011
[2] “Satellite communication” by Dennis Roddy (3rd
edition), 2001
[3] “The Restless Earth Layers of the Earth” by
Krista west, 2009
[4] http://www.solarviews.com/eng/earthint.htm,
26th-sep-2011
[5] http://dna-forums.org/index.php?/topic/2307-
nothern-hemisphere-of-earth-has-about-70- of-total-land-
mass/, 26th
-sep-2011
[6] Anam Qureshi, Murk Marvi, and Fahim A.
Umrani, “Locating Center of Mass of Earth and
Geostationary Satellites”, submitted in Mehran UET
Research Journal.
*****

Optimal Pitch Control Design of an Airplane with Analysis and Verification using
MATLAB/Simulink
Engr. Muhammad Majid Gulzar*, Engr. Zain-ul-
Abdeen*, Engr. Muhammad Yaqoob Javaid*,
Engr.Tahir Rizvi*
*Faculty of Engineering, University of Central Punjab
Prof. Dr. Suhail A. Qureshi Electrical Engg. Deptt. UET,
Lahore-Pakistan.
Alham Jameel, Electrical Engg. Deptt., Lahore College
University, Lahore.
Abstract
Though airplane has a number of important factors, its
stability and control is a key design parameter that must
be met. In an airplane the stability is defined in three
angles i.e. pitch, yaw, and roll. The control pitch has been
focused in this paper, for which the low cost optimal PD
controller is designed and compares control result with
uncontrolled ones. The percentage overshoot, steady state
error, settling time, and rise time of Boeing Commercial
Airplane are reduced and also analyses the results
through root locus and frequency response.
MATLAB/Simulink plays an important role in monitoring
the results of designed controller.
I. INTRODUCTION
It is fact that, [1] an airplane pitch controller is designed
to change the pitch of an aircraft using the deflection
angle of the elevators. [2] As aircraft is a rigid body,
which moves freely through space, it can be defined by
six coordinates, three in translation rest in rotation.
Keeping in mind the assumption of six degrees of
freedom (6DOF) nonlinear differential equations, [3] the
transfer function for Boeing airplane obtained is:
SSS
SsG
921.0739.0
1774.0151.1)(
23++
+=
(1)
Fig. 1 implementing this transfer function in MATLAB
and observing the step response authenticate it to be
highly unstable. Thus a controller is to be designed which
is less complex, cost effective and highly effective for the
system.
II. CONTROLLER DESIGN
The controller is designed to make the system stable.
There are a number of controllers like P, PD, PI and PID.
[3] PID controller proves to be the best option and highly
suitable for the system but at the same time it is also quite
complex to use. Thus, in order to minimize the
complexity of controller, optimize PD controller is used,
which is not much complex as PID and fulfills all the
requirements. Fig. 2 the PD controller placed in the
system has got unity feedback. [4] The values of PD are
to be changed so that the system becomes quite stable and
can also satisfy the limitations i.e. minimum settling time,
percentage overshoot and steady state error.
First, [5] solving for PD controller
PD Controller= Kp+ S Kd
SSS
SSKdKpsG
921.0739.0
)1774.0151.1)(()(
23++
++=
(2)
Figure 1. Step Response without controller
Proportional
Controller
DerivativeController
Air Plane Pitch System
`
PD-Controller
Input Output
Figure 2. System with PD Controller
After calculating the unity feedback system:
SSS
KpSKpKdKdSsG
921.0739.0
1774.0)151.11774.0(151.1)(
23
2
++
+++=
(3)
[1] Extensive simulation on MATLAB gives the stability
of the system under desired specification, and the
concluded P and D values come out to be:
Kp=208.3 and Kd=163.6
SSS
SSsG
921.0739.0
95.368.2683.188)(
23
2
++
++=
(4)
Fig. 3 its step response. These setting were seemed to be
highly balance for the rapid stability of the system. This
will fulfill the requirements. From the figure it can be
concluded that rise time is 0.0115 sec and settling time is
26
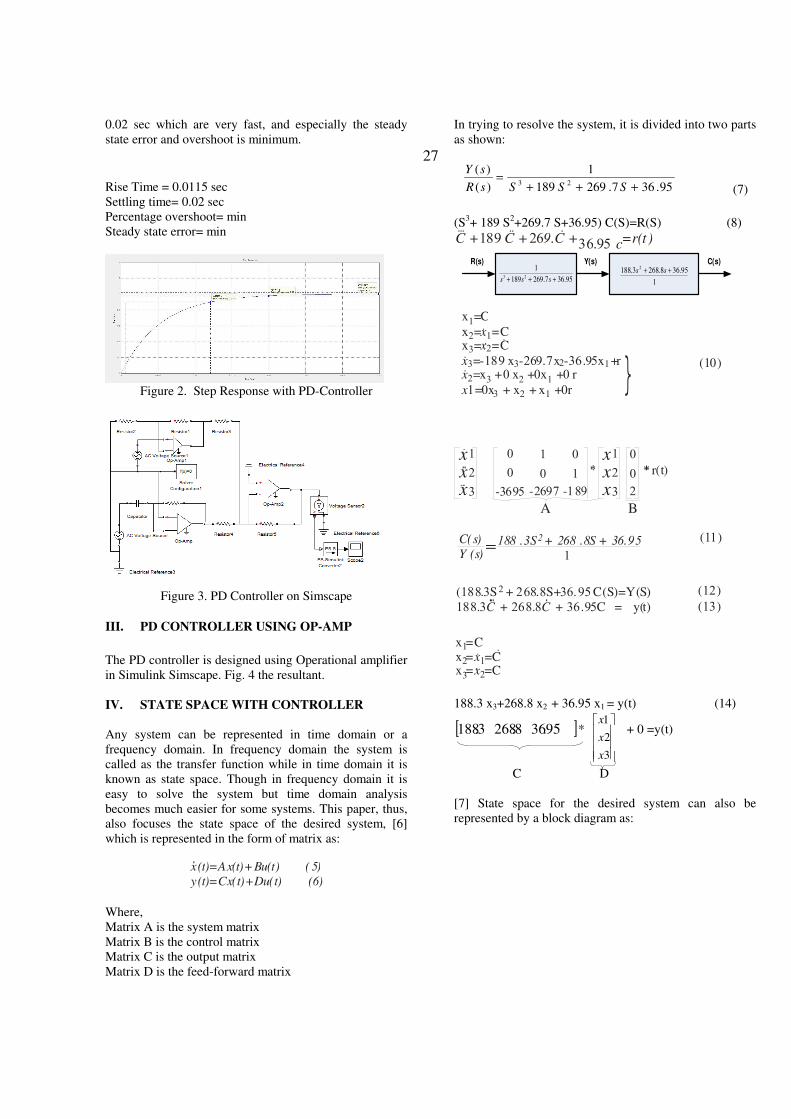
0.02 sec which are very fast, and especially the steady
state error and overshoot is minimum.
Rise Time = 0.0115 sec
Settling time= 0.02 sec
Percentage overshoot= min
Steady state error= min
Figure 2. Step Response with PD-Controller
Figure 3. PD Controller on Simscape
III. PD CONTROLLER USING OP-AMP
The PD controller is designed using Operational amplifier
in Simulink Simscape. Fig. 4 the resultant.
IV. STATE SPACE WITH CONTROLLER Any system can be represented in time domain or a
frequency domain. In frequency domain the system is
called as the transfer function while in time domain it is
known as state space. Though in frequency domain it is
easy to solve the system but time domain analysis
becomes much easier for some systems. This paper, thus,
also focuses the state space of the desired system, [6]
which is represented in the form of matrix as:
x(t)=Ax(t)+Bu(t) (5)
y(t)=Cx(t)+Du(t) (6)
Where,
Matrix A is the system matrix
Matrix B is the control matrix
Matrix C is the output matrix
Matrix D is the feed-forward matrix
In trying to resolve the system, it is divided into two parts
as shown:
95.367.269189
1
)(
)(23
+++=
SSSsR
sY
(7)
(S3+ 189 S2+269.7 S+36.95) C(S)=R(S) (8)
C + C + 9.C + c=r(t )189 2636.95
95.367.269189
123
+++ sss 1
95.368.2683.188 2++ ss
R(s) C(s)Y(s)
x =C1
x = =C2 1xx = =C3 2x
x3 3 2 1=-189 x -269.7x -36.95x +rx2 3 2 1
=x +0 x +0x +0 r
x1=0x + x + x +0r3 2 1
} (10)
A B
0
0
-3695
1
0
-2697
0
1
-189
xxx
1
2
3
xxx
1
2
3
0
0
2
r(t)
C(s)
Y (s)188 .3S + 268 .8S + 36.952
1
(11)
(188.3S + 268.8S+36.95 C(S)=Y(S)
188.3 + 268.8 + 36.95C = y(t)
2
C C
(12)
(13)
x =C1
x = =C2 1xx = =C3 2x
188.3 x3+268.8 x2 + 36.95 x1 = y(t) (14)
[ ]95.368.2683.188 *
3
2
1
x
x
x + 0 =y(t)
C D
[7] State space for the desired system can also be
represented by a block diagram as:
27

36.95
269.7
189
1
36.95
268.8
188.3
x(t)
y(t)
.
)(•
tx.
)(••
tx.
)(•••
tx
Figure 4. State Space in Block Diagram
V. ANALYSIS USING ROOT LOCUS
The root locus technique is one of the design analysis
tools used in this paper for controller synthesis of Boeing
airplane. Root locus is essentially a combination of two
words “Root” and “Locus”. Root is something which
satisfies the equation and locus signifies the path. Thus,
root locus is a path or a locus of all the roots of a close
loop transfer function depending upon the values of k.
When the value of k is zero, the points on root locus plot
are poles, and for k infinity, the points on root locus plot
are zeros. In other words, by changing the value of k from
zero to infinity, root locus moves from poles toward
zeros. The number of branches of root locus depends
upon number of poles. [8] These branches start from
poles and end at zeros. Manual calculations for root locus
of closed loop transfer function are as follows:
Initially, σ (known as centriod) is calculated:
23
)1541.02734.1()088.036.088.036.0(
−
−−−+−−+−=
iiσ
(15)
=σ 0.7075
Θ=Na
)12( +q (16)
Θ= π
Break away point
P(s)=)()(
1
sHsG
P(s) =95.368.2683.188
921.0739.02
23
++
++
SS
SSS
(17)
Taking Derivative
]]95.368.2683.188[
)8.2686.376)(921.0739.0()921.0478.13)(95.368.2683.188([
)(22
2322
++
+++−++++=
SS
SSSSSSSS
ds
sdP
(18)
Putting the derivative equal to zero and simplifying,
53.213175.30206.1366.5373.188 234−+++ SSSS (19)
Solving the above equation, the roots come out to be:
4417.04
9225.02243.03
9225.02243.02
8482.21
=
−=
+=
−=
S
iS
iS
S
The point of arrival is -2.8482.
Simulating root locus, fig. 3 and fig.4 shows the system
before and after the PD controller respectively. On
comparing, it can easily be concluded that the system will
become stable for infinite range after adding the PD
controller in the system.
VI. FREQUECY RESONSE USING MATLAB After introducing the controller with the system, the
frequency response is found on the bode plot. Fig. 8
Noise margin and gain margin are observed to be infinity
in this plot, which shows that the system is stable.
Figure 5. Roots Locus without Controller
Figure 6. Roots Locus with PD-Controller
Figure 7. Frequency Response
VII. SIMULINK
28

[9] The system is verified using simulink which gives a
quick response as well. Fig. 9 and fig. 10 shows simulink
and its output respectively.
`
VIII. CONCLUSION Among various numbers of important factors, an
airplane’s stability and control is major design parameter
that must be met. In an airplane the stability is defined in
three angles i.e. pitch, yaw, and roll. This paper only
focused to control the pitch. Overshoot, rise time (0.0115
sec) and settling time (0.02 sec) of a pitch are minimized
by designing an optimal controller. MATLAB played an
important role in analyzing and comparing the results of
the designed controller. The paper also describes the
flight control mechanism of an air plane using simple
MATLAB algorithm, as more and more airplane
functions can be controlled through this algorithm.
Figure 8. Simulink
Figure 9. Simulink Output
REFERENCES
[1] Adam Niksch, John Valaseky, Thomas W.
Strganacz, and Leland A. Carlson, “Six Degree of
Freedom Dynamical Model of a Morphing
Aircraft”, AIAA Atmospheric Flight Mechanics
Conference 10 - 13 August 2009, Chicago, Illinois.
[2] Ekprasit Promtun, Sridhar Seshagiri, “Sliding
Mode Control of Pitch-Rate of an F-16 Aircraft”
Proceedings of the 17th World Congress, The
International Federation of Automatic Control
Seoul, Korea, July 6-11, 2008.
[3] Dr A S Chaudhuri, P S Khuntia, Dr S Sadhu,
“Design of Optimally Convex Controller for Pitch
Control of an Aircraft”.
[4] Kevin D. Palmer Calvin College, Grand Rapids,
“Flight Control Dynamics and Unmanned Aerial
Vehicles”.
[5] Myo Myint, Htin Kyaw Oo, Zaw Min Naing and
Yin Mon Myint, “PID Controller for Stability of
Piper Cherokee’s Pitch Displacement using
MATLAB”.
[6] Richard Dorf, “Modren Control Systems,” 8th
edition, Addison Wesley.
[7] Norman S. Nise, “Control Systems Engineering,”
John Wiley & Sons, Inc., 5th edition.
[8] Branimir Stojiljkovic1 – Ljubisa Vasov1, Caslav
Mitrovic, Dragan Cvetkovic, ” The Application of
the Root Locus Method for the Design of Pitch
Controller of an F-104A Aircraft”.
[9] Jenie, Yazdi, Indriyanto, “X-Plane-Simulink®
Simulation of a Pitch-Holding Automatic Control
System for Boeing 747”.
******
2930

31
Improvement of Distribution System by
Conversion of 3phase System to Single Phase
System
Dr.Engr.Faisal Nafees Yousaf
1. Introduction:
As investigated through practical experience during field
works in DISCO’S (Distribution Company’s) to analyze the
system and also find out the causes of failure/interruption in
the distribution system. By analyzing 70% of faults/failure
occur due to poor maintenance and also use the
substandard material as along as poor workmanship. The
DISCO’S (Distribution Company’s) un-necessarily
extended the HT and 3phase LT lines to all the domestic
consumers where the load is not required as per line and
not meet with next five years but the company invested the
high cost of the 3phase system is converted in to single
phase systems then the DISCO’s (Distribution Company’s)
sustain less capital cost and minimize the loss. The single
phase system is cheaper than 3phase system which is
approximately 45%. By adopting this method or idea,
distribution system improved and reduces interruption
system which is more reliable than the 3phase system. [1, 4]
٢. Basic structure:-
The distribution system is defined as HT line, LT line and
consumers premises. The power system consists of
generation transmission and distribution system. But being
electrical engineers well known the type of system which
are not discussed
Here. All the connections such as domestic,
commercial and industrials areas are existing in 3phase
system.
In most developed area system must be under
ground which is more reliable in modern area/developed
area the LT system is eliminated and installed all connection
with single phase transformers as per load demand. [1, 3]
٣. Existing Distribution system in DISCO,s
(Distribution Company’s)
Mostly the distribution system in all DISCO’s is over head
and redial. In Pakistan system is design with growth rate of
five years with BC ratio above one percentage. Actually the
growth rate/demand with increasing approximately 35%.
٣�١. In DISCO’s (Distribution Company’s) distribution
system has the lowest priority and to less investment
in the distribution system. Actually all revenue is
collected from the distribution. More interruption
more loss. It means that proper investment is alone in
distribution system.
٣�٢. 99% of the DISCO’s (Distribution Company’s)
distribution system is 3 phase and over head. Due to
the over head system interruption in DISCO’s
(Distribution Company’s) by lighting, accidents, dust
storms, kitting and etc. For reduction of losses ELR
(energy loss reduction) and DOP programmes are
carried out in DISCO’s (Distribution Company’s).
The programmes based on the BC ratio which are not
suitable for improvement of systems. If the system is
converted from 3 phase system to single phase
system with same rating of single phase T/Formers
are installed in maximum capacity instead of
extension of lines by proper planning desired results
are achieved. Mostly T/Formers are damaged due to
improper planning and loose heavy units which
generate the high revenue loss.[3]
٤. Causes of system failure.
The DISCO’s (Distribution Company’s) have no
priorities. It always in hurry up position, no proper planning
management also mismanagement of resources. The
efficiency of system will be it always in hurry up position,
no proper planning management also mismanagement of
resources. Improved with least cost. The operational
management collected the accurate data of interruption from
some operational offices and then the expertise analyses and
find out their solutions. Interruption is main causes of
failure of supply system. Which cause the main loss of
DISCO’s? (Distribution Company’s) Mostly faults are
visible like, lose jumper, deteriorated connections, improper
clearance, poor earthing, and lose bindings, broken/cracked
insulations, improper sag non compliance of standards and
etc. 80% faults are visible as discussed above. These faults
are removed with least cost and in minimum period.
Therefore 10% faults are difficult such as switching,
lightning harmonics, corona and etc. Also the remaining
faults are beyond the control of human being like wind
storm accidents, and etc. These types of faults are
expensive.
٥. COST COMPARISON BETWEEN 3/PHASE
AND SINGLE PHASE SYSTEM.
Suppose if the feeder having 5 KM length in the 3/Phase
system the estimate of the HT line & LT Line is as under
with 1 No 200 KVA transformer & 2 No 100 KVA
Transformers.
5.1 COST ESTIMATION OF 3/PHASE SYSTEM.
Cost estimation of 5 KM HT line (High Tension) and
2 KM LT line with connection is as under.
5.2 HT Line Cost (High Tension)
DESCRIPTIO
N QTY
RATE
PER
UNIT
COST
IN Rs.
PC Poles 10 16842 168420
Conductor
(DOG)
15000
Mtr/15
KM
95 142500
0
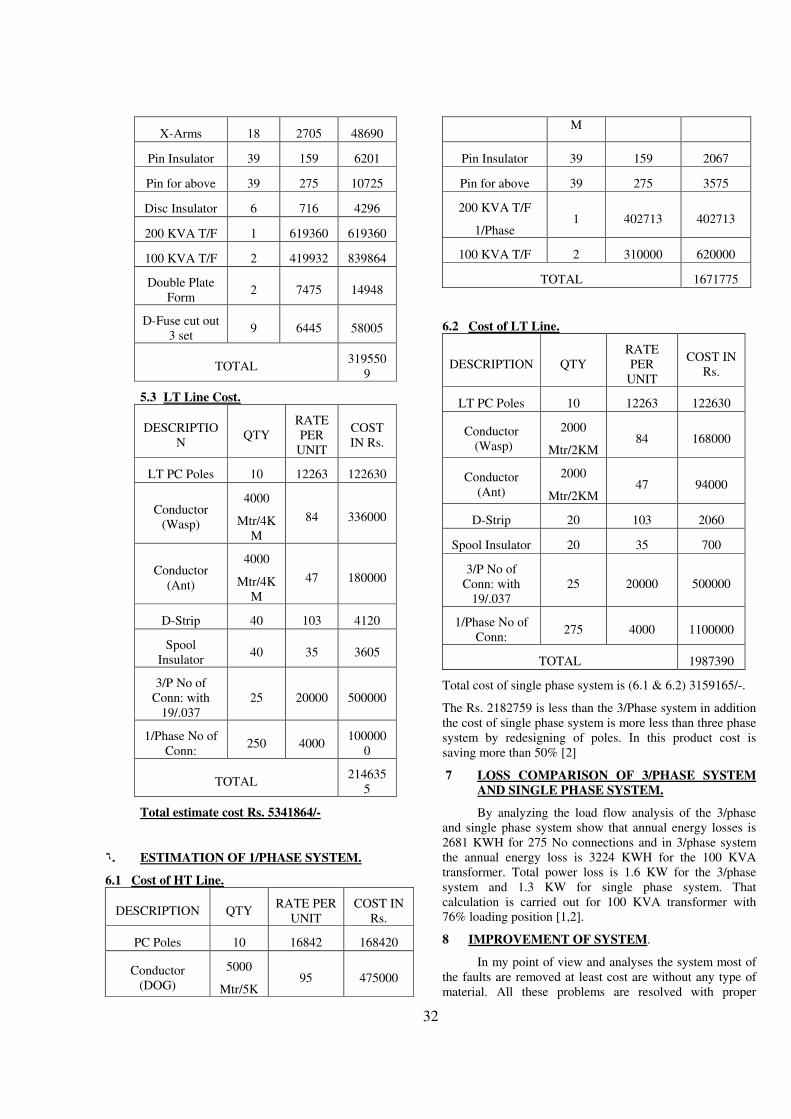
32
X-Arms 18 2705 48690
Pin Insulator 39 159 6201
Pin for above 39 275 10725
Disc Insulator 6 716 4296
200 KVA T/F 1 619360 619360
100 KVA T/F 2 419932 839864
Double Plate
Form 2 7475 14948
D-Fuse cut out
3 set 9 6445 58005
TOTAL 319550
9
5.3 LT Line Cost.
DESCRIPTIO
N QTY
RATE
PER
UNIT
COST
IN Rs.
LT PC Poles 10 12263 122630
Conductor
(Wasp)
4000
Mtr/4K
M
84 336000
Conductor
(Ant)
4000
Mtr/4K
M
47 180000
D-Strip 40 103 4120
Spool
Insulator 40 35 3605
3/P No of
Conn: with
19/.037
25 20000 500000
1/Phase No of
Conn: 250 4000
100000
0
TOTAL 214635
5
Total estimate cost Rs. 5341864/-
٦. ESTIMATION OF 1/PHASE SYSTEM.
6.1 Cost of HT Line.
DESCRIPTION QTY RATE PER
UNIT
COST IN
Rs.
PC Poles 10 16842 168420
Conductor
(DOG)
5000
Mtr/5K95 475000
M
Pin Insulator 39 159 2067
Pin for above 39 275 3575
200 KVA T/F
1/Phase 1 402713 402713
100 KVA T/F 2 310000 620000
TOTAL 1671775
6.2 Cost of LT Line.
DESCRIPTION QTY
RATE
PER
UNIT
COST IN
Rs.
LT PC Poles 10 12263 122630
Conductor
(Wasp)
2000
Mtr/2KM 84 168000
Conductor
(Ant)
2000
Mtr/2KM 47 94000
D-Strip 20 103 2060
Spool Insulator 20 35 700
3/P No of
Conn: with
19/.037
25 20000 500000
1/Phase No of
Conn: 275 4000 1100000
TOTAL 1987390
Total cost of single phase system is (6.1 & 6.2) 3159165/-.
The Rs. 2182759 is less than the 3/Phase system in addition
the cost of single phase system is more less than three phase
system by redesigning of poles. In this product cost is
saving more than 50% [2]
7 LOSS COMPARISON OF 3/PHASE SYSTEM AND SINGLE PHASE SYSTEM.
By analyzing the load flow analysis of the 3/phase
and single phase system show that annual energy losses is
2681 KWH for 275 No connections and in 3/phase system
the annual energy loss is 3224 KWH for the 100 KVA
transformer. Total power loss is 1.6 KW for the 3/phase
system and 1.3 KW for single phase system. That
calculation is carried out for 100 KVA transformer with
76% loading position [1,2].
8 IMPROVEMENT OF SYSTEM.
In my point of view and analyses the system most of
the faults are removed at least cost are without any type of
material. All these problems are resolved with proper

33
operation and planning. These are so many options to
improve the system.
8.1 All the 3 phase system is converted into single
phase system. The interruptions are minimizes.
LT Lines are finished/eliminated from the filed.
8.2 When the LT Line eliminated then connections
are provided to consumers with single phase
T/Formers are per requirement of the load of
said consumers. Single phase is the supply of
consumers depends on the geographical position
of the load.
8.3 By applying this methodology to eliminate the
LT Line from the system, pilferage of energy
will be controlled at level of line losses will also
be reduces. The system will also be
maintainable. But it is very difficult in a
developed country.
8.4 Cost of the single phase system is less than 3
phase system approximately 35%. This
percentage will also be maximizing by designing
as per requirement of single phase system. [1, 3,
4]
9. CONCLUSION.
All DISCO’s introduces the programmes and
electrifying the new modern designed area on these lines
especially commercial area and new colonies. The cost of
line will be minimize up 35% and reduce the line losses and
also help to overcome the energy crises. Reduces the
interruption and prolonging the life of system and
equipments. Developing the cause effect with scope of error
to be analyzed. Most of the effect reveals the problems
deselected for analysis be selected.
REFERENCE
[1] www.WAPDA.Com
[2] www.GEPCO.Com
[3] Paper published in IEEEP Newsletter in oct.2009
[4] Alternating current electrical Engineering by Philips
Kemp.
[5] Transformers by coral H. Dunlop
*****
Quotation
• If wishes were horses, beggars might ride.
John Ray
• There is always some madness in love. But
there is also always some reason in
madness.
Friedrich Wilhelm Nietzche
• Stupidity often saves a man from going
made.
Oliver Wendell Holmes, Jr.
• The only difference between intelligence
and education is this: intelligence will
make you a good living.
Charles F. Kettering
• To the dull mind all nature is leaden. To the
illumined mind the whole world sparkles
with light.
Ralph Waldo Emerson
• The height of cleverness is to conceal one’s
cleverness.
Francois de La Rochefoucauld
• Knowledge itself is power.
Francis Bacon
• In expanding the field of knowledge we but
increase the horizon of ignorance.
Henry Miller
• Integrity without knowledge is weak and
useless, and knowledge without integrity
is dangerous and dreadful.
John F. KIennedy
• The acquisition of knowledge is the mission
of research, the transmission of knowledge
is the mission of teaching, and the
application of knowledge is the mission of
public service.
James A. Perkins
34
Words: 1,102
Resurrection of the Pakistani Power Sector !
By
Engr Tahir Basharat Cheema
President
Institution of Electrical & Electronics Engineers Pakistan
It was only a few days ago that a senior official of the
Finance Ministry proclaimed that the Pakistani Power
Sector sucks up-to 2.5% of the GDP amounting to Rs. 300-
350 billion every year. The same official told that over Rs.
1.0 trillion had been gobbled-up by this sector during the
last three years. One the other hand, the GoP takes the credit
for removing a huge financial burden from the books of
various DISCOs / NTDC/ WAPDA, which amounts had
earlier been secured as loans from various Banks in order to
fill the gap between the revenue based on the then near
frozen power tariff and the actual cost of supply during the
period 2006-08 (and had subsequently resulted in the
creation of the now in famous circular debt). Additionally,
there seems to be a large majority amongst politicians and
business executives who categorically subscribe to the
concept of the governments leaving businesses to the
private sector. They vehemently consider utilities like
power, telecommunications, WASA, health and education
and so on as having nothing to do with the social obligations
of the governments. That, they are only correct in the
developed world’s context, is sadly forgotten. That, private
sector foray into the utility business depends upon a very
strong regulatory regime is also ignored. That all the above
may take quite some time to resolve is another issue which
is never discussed or debated.
Leaving aside the issues of placement of the power sector
and others, it is of prime importance that specially the
Power Sector has necessarily to be resurrected. As the
Sector is highly technical and beset with issues of
technology and introduction / assimilation thereof, the need
is for the sectorial professionals to deliver the solutions.
Once the experts are allowed to present the solutions, the
present non-technical and non-professional edicts would
automatically take the back seat. Incidentally, non-
professional solutions especially of the last one year have
resulted in great loses and the backwards march on the gains
of 2009 and 2010.
In this context, the Institution of Electrical & Electronics
Engineers Pakistan (IEEEP) has taken the lead and held the
National Conference on Power Deficit in late October,
2011. The IEEEP, having a membership of over six
thousand engineers relating to the fields of electrical &
electronics engineering, inclusive of avionics, mechatronics,
medical engineering and computer engineering disciplines,
was able to attract the best of scientists, engineers and
economists to the conference. Additionally, over 400
hundred delegates from all over Pakistan and abroad
participated in the Conference. The fact that the event had
the backing of the Country’s premier technical university
viz the UET Lahore, further provided impetus to the event.
Coming to the caucus, we see that as many as 16 research
papers were presented in the daylong conference. The
papers broached the subjects of Reservoirs in the National
Economy, Hydrocarbon & LNG Route, Coal Power
Generation, Hydro Power Short Term & Medium term
Solutions, Large Hydropower Projects, Genocide on the
Indus & the Hydro Bomb, Hydrocarbon Scenario in the
short term, Solar Thermal and Geo Thermal Solutions, Coal
Gasification, Initiatives of the GOP in the RE Sector, RE as
part of the Energy Mix, Plans for Nuclear Power,
Engineering Management, Power Demand Projection,
Issues & impediments in Thar Coal development, and
Thermal Fuel Mix etc.. All the speakers were clear and
focused on one point viz. that it is only the professional who
can overcome the ongoing power crises.
As a first, the IEEEP had setup an independent panel of
experts / committee to firm-up recommendations of the
Conference. These recommendations have since been
forwarded it to the Federal Government. All the speakers
and the huge number of delegate also concluded that
implementation of these recommendations would take the
country out of the crises it is facing at the moment. The
recommendations were very clear, all encompassing and
based on ground realties and the requirements of the
country.
These are as under :-
• Need to evolve a National Energy Policy with
participation of all stakeholders to generate 100,000
MW by 2030.
• The main pillar of this policy would be to utilize local
fuel sources like, coal, large hydel, small & micro hydel
and using local technology under a planned
indigenization programme.
• Development and utilization of Thar Coal as a National
Policy, with the Federal Govt. and all Provincial
Governments pitching in as necessary stakeholders.
• A new focus on RE like solar, wind has to be developed
to leap frog the technological curve and join the ranks
of the developed countries in generating power with
minimum carbon footprint.
• Create industry-academia-government linkage to
develop local human resource which can perpetuate the
energy autarky plan by designing, development and
production of all phases of power generation projects /
re-designing of existing curricula / syllabi on the need
basis.
• Development of infrastructure necessary to support the
growth of energy sector in general and power sector in
particular must be included in PSDP funding each year

35
and amount of Rs.100 Billion must be allocated for
infrastructure development in the power sector alone.
• Immediate mitigation of circular debt by paying off
Rs.300 Billion and appointment of competent
professionals in the power sector, which is to be
followed by allocation of gas on a priority basis (UFG
gains to be diverted to power sector) and conversion of
Oil Fired GENCOs to coal within 12 to 18 months.
This will bring in the presently stunted foreign
investment into the country.
• Regulatory authorities NEPRA / OGRA must be
restructured and will be staffed by competent
professionals.
• Harnessing of 2000 MW from the sugar power from the
private sector by notifying upfront tariff. Additionally,
State bank of Pakistan to arrange for low interest
finances for this effort as a National Policy.
The above 11 recommendations actually form the
road map for recovery and also a detailed plan for arranging
an appropriate power sector infrastructure in Pakistan. The
recommendations also provide answers to the affordability
issue and the National quest for attaining the needed
semblance of autarky in the power sector. As the conference
pinpointed the present disconnect between the government,
academia and industry and also the relegation of National
needs to the back burner, correction thereof would have a
laudatory effect on our development. This last point alone
would assure the availability of the needed technical
resource in the country as against the need for possible
imports. More so, when the energy requirements are
growing at a stupendous pace and when renewable energy
has to make its mark on the Pakistani horizon in the
immediate further.
*****
Quotation
• The greatest obstacle to discovery is not ignorance-it is
the illusion of knowledge.
Daniel J. Boorstin
• Knowing others is wisdom. Knowing the self is
enlightenment.
Lao-tzu
• Knowledge which is obtained under compulsion
obtains no hold on the mind.
Plato
• The great end of life is not knowledge but action
Thomas Henry Huxley
• Youth longs and manhood strives, but age remembers.
Oliver Wendell Holmes, Sr.
• The true are of memory is the art of attention.
Samuel Johnson
• A retentive may be a good thing, but the ability to
forget is the true token of greatness.
Elbert Hubbard
• The only place where success comes before work is in
a dictionary
Vidal Sassoon
• Behind every successful man thee are a lot of
unsuccessful years.
Bob Brown
• Nothing fails like success because we don’t learn from
it. We lean only from failure.
Kenneth Boulding
• All you need in life isi ignorance and confidence, and
then success is sure..
Mark Twain
• Hard work without talent is a sharne, but talent without
hard work is a tragedy.
Roberty Half.
36
Words: 1224 Selecting Senior Management for the Power
Sector! h
Engr Tahir Basharat Cheema
President
Institution of Electrical & Electronics Engineers Pakistan
Power sector reforms are in the air since the last one decade.
Incidentally, the meaning of reform seems to have different
connotations for different segments of government, society
and the MLDAs. And the sad part being that presently the
reform is being forced in the midst of the ongoing energy
crises. It is like reforming an army while in battle. Another
serious issue is that none of the drivers has ever had any
experience of change management in a power sector like
ours. PEPCO, which was mandated and could have changed
the face of the sector, was subjected to a strange-hold firstly
by WAPDA (which did not let it operate independently) and
then by various arms of the GoP who thought that they
could do the things in a much better manner. Unfortunately,
such control of the last one year has not yielded any results
– rather has spoilt the broth with political interference
calling the shots to the detriment of the sector. Now further
change is being contemplated through executive search for
the position of the CEOs of the nine DISCOs in the country.
In this regards, recently quarter page ads have appeared in
the national print media soliciting applications for the
positions of CEOs and the CFOs of DISCOs. The
solicitations are so perfunctory that one would but think that
these are actually for special assistants of the existing CEOs
and for middling financial officers. As the smallest of the
DISCOs has a revenue base of above Rs. 36-50 billion, with
LESCO/MEPCO both touching Rs. 135 and Rs. 90 billion
respectively, it is strange to see such open ended
solicitations that are bound to attract over a 100,000
applications (imagine so many persons claiming
competence to the nine chairs). These ads very innocently
quote the areas of the responsibility to the effect that the
applicants should be thoroughly familiar with the economic,
social, legislative and political environment in which
today’s electric utility industry operates. It is further said
that the prospective chief executive should be conducive to
the legislative and community relationship which are
essential for the productive communications and support
essential to the utilities growth. Furthermore, having
experience in working with a union (?) is a plus. The
qualification and experience part states that the candidate
should hold a professional degree (any) from a recognized
institution, while preference will be given to candidates
holding a Master’s Degree in business management,
accounting, communication or engineering. Lastly the
candidate should have overall minimum of 15 years of
professional experience, 10 of which (should be) in
public/private sector serving in a senior management
position. In the end, the ad states that the power sector
experience will be considered (?).
Leaving aside the cavalier manner in which these ads have
been formulated and then published – surely due to lack of
good advice, there is need to study the actual job description
of the CEO of any DISCO as formulated by consultants
commissioned by the World Bank in late 1990s – the time
when actual corporatization of WAPDA’s Power Wing
took place. It is seen that the chief executive officer shall be
responsible for the over-all management of company
operations to ensure achievement of company’s service and
revenue targets. He will lead the company management in
setting and achieving higher operational performance
targets and formulate plans for further improving the same
with special emphases on load management, loss reduction,
theft control and significant augmentation/improvement of
distribution network and services to customers in a new
paradigm of customer friendly culture. He will ensure
adherence by the company to NEPRA performance
standards and meet relevant regulatory operational
requirements. In this regard, the original authors of the
Power Sector reforms in Pakistan sought pro-active, results-
oriented professionals with established credibility and
performance record, who could take the above challenging
assignment. The candidates were required to have strong
leadership, inter-personal and communications skills with a
high drive for performance targets. In the qualification and
experience part, the candidate was thought preferably to be
a professional engineer registered with the PEC or a senior
power utility management expert. Additional engineering
and management qualifications, experience specifically in
Power Utility operations was considered to be an added
plus. Minimum 20 years experience in the employment
level, with a minimum of 5 years in senior management
position was then considered essential. And the age was
ideally thought to be in the band of mid to late 50s. In other
words, the candidate had to be an expert instead of any
person likely to learn the trade after taking over as the CEO.
Additionally, a window was also created so that competent
WAPDA/ PEPCO Chief Engineers and above could also
apply for the position. It was decided that WAPDA, PEPCO
and the Corporate Entities’ senior officers who met the
criteria were eligible to apply through proper channels.
Officers recently retired or those retiring within three/four
months time were also considered eligible to apply for the
position (s). The tenure of the selected CEOs was to be for a
period of three years, extendable with mutual agreement on
satisfactory performance.
Looking around and also considering the ground realities,
we see that such professionals are not available in Pakistan
other than in the relevant Ex-WAPDA PSCEs viz the
DISCOs and in the KESC. More so, when we see that the
incumbent CEO of a DISCO has to additionally be privy to
ten specific attributers, reproduced here under as: Deep
insight and under-standing into dynamics of core-
responsibilities, ability to dip into the current and future
trends, come equipped with knowledge of the weaknesses

37
and strengths of the specific sub-sector he is to manage, be
adept at and be privy to the level of expertise at the disposal
of the resource/cadre, have the means to fast up-grade the
same, be able to build upon the existing expertise (and not
start learning about the core requirements),enable the
organization to jump even higher by breaking earlier
constrictions and barriers, effect change management in a
structured manner, arrange conversion to the next
generation of technologies and be able to arrange for a mix
of science and sociology leading to innovations and
improvisations that favor the people - a must, when we see
the havoc played by the current reliance on oil for
generating electricity and the ensuing unbearable cost of
service.
In other words, the DISCOs are bound to flounder in case
the CEO does not possess the above experience, exposure
and the depth/intellect to deal with the requirements. As a
former MD PEPCO, I had the chance to look into the
selection of CEOs (especially when a large number of such
positions in early 2009 were held by persons who had long
ago attained the age of superannuation). And looking
around the National landscape did not yield any result and
resultantly in-house search was conducted to post the CEOs
of the DISCOs. The search based on merit lead to good
results and the sector was able to look strong by the end of
2010. That, thereafter, the situation changed can be
attributed to various reasons about which separate space is
needed for any meaningful discussion. Consequently, the
selection process of CEOs of DISCOs should restrict itself
to the above methodology and not become open ended as is
likely to happen if the current process is accepted as the one
that has to be followed.
*****
Quotation
• The common idea that success spoils people by
making them vain, egotistic, and self-complacent is
erroneous; on the contrary, it makes them, for the most
part, humble, tolerant, and kind. Failure makes people
cruel and bitter.
W. Somerest Maugham
• We must use time creatively… and forever realize
that the time is always ripe to do right..
Martin Luther King, Jr.
• Time heals what reason cannot.
Seneca the Younger
• An honourable defeat is better than a
dishonourable victory.
Millard Fillmore
• The man who is swimming against the stream
knows the strength of it..
Woodrow Wilson
• If we had no winter, the spring would not be so
pleasant; if we had not sometimes taste of adversity,
prosperity would not be so welcome.
Anna Bradstreet
• The greater the difficult, the greater the glory.
Cicero
• When people agree with me, I always feel that I
must be wrong.
Oscar Wilde
• A single lie destroys a whole reputation of
integrity.
Baltasar Gracian
• The greatest incitement to crime is the hope of
escaping punishment.
Cicero
• He who does not prevent a crime when he can,
encourages it.
Seneca the Younger


![FAHIM AKHTAR KE AFSANE … · pôt£]© Fahim Akhter Key Afsane äYZ˘”Zî: [´ FAHIM AKHTER ”Zî : ’ 15 Greenway : Ø London SW20 9BQ (U.K.) Tel.: 020-85434995, Mob.:07947](https://img.dokumen.tips/doc/110x75/5f443705787fdd3bdf545b87/fahim-akhtar-ke-pt-fahim-akhter-key-afsane-yzaz-fahim-akhter.jpg)