Embed Size (px)
Citation preview
Journal of Hydrology 528 (2015) 773–789
Contents lists available at ScienceDirect
Journal of Hydrology
journal homepage: www.elsevier .com/ locate / jhydrol
Expert knowledge based modeling for integrated water resourcesplanning and management in the Zayandehrud River Basin
O
http://dx.doi.org/10.1016/j.jhydrol.2015.07.0140022-1694/� 2015 Elsevier B.V. All rights reserved.
⇑ Corresponding author. Tel.: +98 31 3391 3826; fax: +98 31 3391 2700.E-mail address: [email protected] (H.R. Safavi).
Hamid R. Safavi a,⇑, Mohammad H. Golmohammadi a, Samuel Sandoval-Solis b
a Department of Civil Engineering, Isfahan University of Technology (IUT), Isfahan, Iranb Department of Land, Air and Water Resource, University of California, Davis, CA, USA
a r t i c l e i n f o s u m m a r y
Article history:Received 9 December 2014Received in revised form 28 April 2015Accepted 7 July 2015Available online 9 July 2015
This manuscript was handled by GeoffSyme, Editor-in-Chief, with the assistance ofBellie Sivakumar, Associate Editor
Keywords:Integrated water resources managementComplex hydrologic systemsExpert knowledgeANFISZayandehrud basin
nly fo
r Rea
ding
Do Not
Downlo
adThis study highlights the need for water resource planning and management using expert knowledge tomodel known extreme hydrologic variability in complex hydrologic systems with lack of data. TheZayandehrud River Basin in Iran is used as an example of complex water system; this study provides acomprehensive description of the basin, including its water demands (municipal, agricultural, industrialand environmental) and water supply resources (rivers, inter-basin water transfer and aquifers). Theobjective of this study is to evaluate near future conditions of the basin (from Oct./2015 to Sep./2019)considering the current water management policies and climate change conditions, referred as Baselinescenario. A planning model for the Zayandehrud basin was built to evaluate the Baseline scenario, theperiod of hydrologic analysis is 21 years, (from Oct./1991 to Sep./2011); it was calibrated for 17 yearsand validated for 4 years using a Historic scenario that considered historic water supply, infrastructureand hydrologic conditions. Because the Zayandehrud model is a planning model and not a hydrologicmodel (rainfall–runoff model), an Adaptive Network-based Fuzzy Inference System (ANFIS) is used togenerate synthetic natural flows considering temperature and precipitation as inputs. This model is anexpert knowledge and data based model which has the benefits of Artificial Neural Networks (ANN)and Fuzzy Inference Systems (FIS). Outputs of the ANFIS model were compared to the Historic scenarioresults and are used in the Baseline scenario. Three metrics are used to evaluate the goodness of fit of theANFIS model. Water supply results of the Baseline scenario are analyzed using five performance criteria:time-based and volumetric reliability, resilience, vulnerability and maximum deficit. One index, theWater Resources Sustainability Index is used to summarize the performance criteria results and to facil-itate comparison among trade-offs. Results for the Baseline scenario show that water demands will besupplied at the cost of depletion of surface and groundwater resource, making this scenario undesirable,unsustainable and with the potential of irreversible negative impact in water sources. Hence, the currentwater management policy is not viable; there is a need for additional water management policies thatreduce water demand through improving irrigation efficiency and reduction of groundwater extractionfor sustainable water resources management in the Zayandehrud basin.
� 2015 Elsevier B.V. All rights reserved.
1. Introduction
Rapid population growth, high agricultural use and industrialdevelopment, coupled with climate changes during the past fewdecades have caused increasing pressure on land and waterresources in almost all regions of the world. The challenge is howto improve the management of water resources for present andfuture generations. Water resources planning and managementrequires the deep understanding of the special value of water forhuman life, interaction of human beings and nature, and the social
significance of water resources for national economic development(Rosenberg, 2008). Water resources planning and managementtries to meet the water requirements of all the water users,although, sometimes this is not possible. Frequently, conflictsamong water users arise because water is a scarce and sharedresource. The difficulties increase when the systems become largewith numerous water users, several types of use, with unequal spa-tial distribution and such scarcity that water cannot bere-distributed without affecting other water users. Nowadays, thisseems to be the common pattern of water allocation in large basins(Sandoval-Solis and McKinney, 2014).
Historically, fragmented water resources management hasresulted in degradation of rivers and water bodies in many of the
R
t
774 H.R. Safavi et al. / Journal of Hydrology 528 (2015) 773–789
Only
for
Do No
watersheds in the world, especially in arid and semi-arid regions(e.g. Aral Sea). Today, integrated water resources management(IWRM), especially in areas facing limited water resources, hasbecome an indispensable approach. IWRM was introduced in1980s to optimize water uses between different water demandsectors and water sources (Ludwig et al., 2014). The goal of thisapproach is to balance water availability and demand, humanand environmental water requirements, taking into account allthe available water sources (surface water, groundwater, reclaimedand desalinated water) which provides sustainability of waterresources (Molinos-Senante et al., 2014; Dukhovny, 2004).
Meire et al. (2008) argue that the IWRM concept was originatedat the first United Nations (UN) conference on the human environ-ment in Stockholm in 1972. According to Porto and Porto (2008),the Dublin Principles and the 1992 UN summit at Rio de Janeiroreinforced this concept through the agenda 21’s principles(Coelho Maran, 2010). It is important to note that IWRM is a pro-cess, not a product, and that it serves as a tool for assessmentand program evaluation. IWRM does not provide a specific blue-print for a given water management problem but rather is a broadset of principles, tools, and guidelines, which must be tailored tothe specific context of the country or region or a river basin (Xie,2006). Stakeholder participation is the key point in IWRMapproach. That is the empowered community has the responsibil-ity to address local issues in a coordinated and integrated way(Matondo, 2002).
Many scientists and experts believe that water resources mod-eling is one of the most important preconditions that facilitate theapplication of IWRM in large basins. Models help to organize infor-mation related to water availability and water requirements ofstakeholders. Using a ‘‘bottom-up’’ approach stakeholders canevaluate local alternatives for IWRM, while whole basin regula-tions can be evaluated using a ‘‘top-down’’ approach, taking intoaccount physical limitations of existing infrastructure (Cai, 1999;Cai et al., 2006; Dukhovny and Sokolov, 2005). It is important tonote that during the implementation of IWRM, there is no needto seek universal and stereotyped approaches that are acceptablefor all (IWRM Toolbox, 2003). Due to these justifications, manyresearches have documented many IWRM case studies using dif-ferent decision support systems (DSS). For instant, Letcher et al.(2006a,b), developed a DSS for Mae Chaem catchment inNorthern Thailand. This DSS contains models of crop growth, ero-sion and rainfall–runoff, as well as household decision and socioe-conomic impact models; Weng et al. (2010) developed anintegrated scenario based multi-criteria support system for plan-ning water resources management in the Haihe River basin. Theydefined some policy parameters or policy scenarios such as: watersaving intensity, excessive volumes of groundwater extraction, vol-ume of untreated wastewater and the amount of water suppliedfrom transfer project for IWRM implementation to develop a DSSmodel that used a fuzzy multi-criteria decision analysis as the eval-uation model. During the construction of DSS, special attentionshould be given to the definition of scenarios (Katsiardi, 2005;Liu et al., 2007; Soussa and Vekerdy, 2005; Van beek and Meijer,2006; ZhenGfu et al., 2009; Ni et al., 2012). Gaiser et al. (2008)developed the Model for Sustainable Development of Water(MOSDEW) in the Neckar basin in South-west Germany. Thereare nine sub-models covering large scale hydrology, groundwaterflow, water demand, agricultural production, point and non-pointpollution and chemical as well as biological water quality. One ofsub-models was the agroeconomic sector model, referred asACRE model, developed by Henseler et al. (2005, 2009). This modelis very useful for IWRM but it is very complex due to its hybridmodeling nature; Davies and Simonovic (2011), employed asystem-dynamic integrated assessment model that incorporatessocio-economic and environmental change. Their model includes
eadin
g
Dow
nload
global climate system, carbon cycle, economy, population, landuse and agriculture, and novel versions of the hydrological cycle,global water use and water quality. Also, some of researchersfocused on effects of IWRM implementations at the catchmentscale. For instant, Ako et al. (2010), investigated methods toimprove water resources management in Cameroon and to imple-ment IWRM at the catchment scale. Coelho et al. (2012) employeda multi-criteria DSS for IWRM implementation in theTocantions-Aragauia River Basin in Brazil. Safaei et al. (2013)applied the concept of IWRM to Zayandehrud River Basin in Iran.These studies considered stakeholder participation, scenario anal-ysis, dispute resolution and climate change conditions. AlsoGeorgakakos et al. (2012), Dawadi and Ahmad (2012), andVargas-Amelin and Pindado (2014) surveyed the impacts of cli-mate changes in water management in Northern California,Colorado River and Spain, respectively.
Nowadays, water resources planning and management pro-cesses are moving away from top down approaches to bottom upapproaches. There is a variety of generic software platforms usedto evaluate water planning and management policies and to facil-itate stakeholder involvement during the planning anddecision-making process (Assata et al., 2008). The models such asMODSIM, River Basin Simulation Model (RIBASIM), MIKE Basin,Water balance Model (WBalMo), MULti-sectoral, Integrated andOperational Decision Support System (MULINO-DSS), WaterEvaluation and Planning System (WEAP) can be used for planningpurposes at catchment scale, evaluation of current and alternativewater allocation policies, river flow routing, reservoir routing,water demand analysis, rainfall–runoff modeling, water balance,water quality and sedimentation transport, and in general, water-shed management (Mugatsia, 2010). The comparisons of thesetools are described in Mugatsia (2010) and Jakeman et al. (2008).
WEAP is one of the IWRM platforms that seamlessly integratewater supplies generated through watershed-scale hydrologic pro-cesses with a water management model driven by water demandsand environmental requirements. New versions of WEAP considerdemand priority and supply preferences, which are used in a linearprogramming heuristic to solve the water allocation problem as analternative to multi-criteria weighting or rule-based logicapproaches (Yates et al., 2005a,b). WEAP has been applied inGhana to simulate the impact of small reservoirs in the Volta(Hagan, 2007), in Olifants catchment in South Africa to analyzecurrent and future demands (Arranz and McCartney, 2007), inPerkrra catchment to analyze scenario implementation(Mugatsia, 2010), in Rio Grande/Rio Bravo transboundary basinto implement IWRM in large scale river basin (Sandoval-Solisand McKinney, 2014). These case studies show a good performanceof this platform. It is clear that modeling of large basins impliessets of known and unknown parameters. Hydrologic and climatictime series, geologic data, water demands and historic water sup-ply, and a variety of information of catchments and basins are usedfor modeling. However, in large basins for one period of time thereis data with many gaps for a variety of known parameters. Also inmany case studies there is not data at all for some importantparameters.
This study presents how engineering judgment and expertknowledge could be used for integrated water resources planningand management in Zayandehrud River Basin. Modeling dis-tributed water demands considering all sources such as surfaceand ground water resources and interaction between them regard-ing to the lack of data and information are difficulties which aresurveyed in this study. Simulation of rainfall–runoff at the wholeof basin to calculate natural flows due to climate change in thefuture is another challenges which is studied in this research.The Zayandehrud River Basin is one of the largest and most impor-tant basins in central Iran. Because of existence of different water
H.R. Safavi et al. / Journal of Hydrology 528 (2015) 773–789 775
Only
for R
Do Not
sources, water demands, environmental needs, and water transfersfrom/to other basins, this basin is one of the best case studies forIWRM modeling. There are many studies and reports for waterresources management in this basin (Madani and Mariño, 2009;Nikouei et al., 2012; Gohari et al., 2013b; Safaei et al., 2013) butthere is not a comprehensive model to address IWRM in this basin.The reason is the lack of data for many important parameters formodeling. Based on a 21-year recorded data (1991–2011) andapplying expert knowledge, a water planning model referred asZayandehrud Model is developed for surface and ground waterresources; after estimating the interaction between water sourcesand parameters. The Zayandehrud model was calibrated from 1991to 2006 and validated from 2007 to 2011.
In this study, a scenario analysis technique is employed as anappropriate approach, because it is well known that stochasticoptimization approaches cannot be used when there is insufficientstatistical information on data estimation to support the model,when probabilistic rules are not available, and/or when it is neces-sary to take into account information not derived from historicaldata. In these cases, the scenario analysis technique could be analternative approach to address the ‘‘What if . . .?’’ situations, calledscenarios. Scenario analysis can model many real problems wheredecisions are based on an uncertain future, whose uncertainty isdescribed by means of a set of possible future outcomes, called‘‘Scenarios’’ (Pallottino et al., 2005). Scenarios have been used asan important tool for exploring future uncertainties in a coherent,consistent and plausible way, and such as, they have been widelyused for strategic planning and policy making (Dong et al., 2013).In this study, a baseline scenario is developed (from 2015 to2019) to assess the current water management policies into thenear future and considering climate change conditions. In orderto account for future climate change condition, an AdaptiveNetwork-based Fuzzy Inference System (ANFIS) is developed tomodel rainfall–runoff processes in this basin. Outputs from thismodel are used as inflows into the Zayandehrud model.
2. Case study: the Zayandehrud River Basin
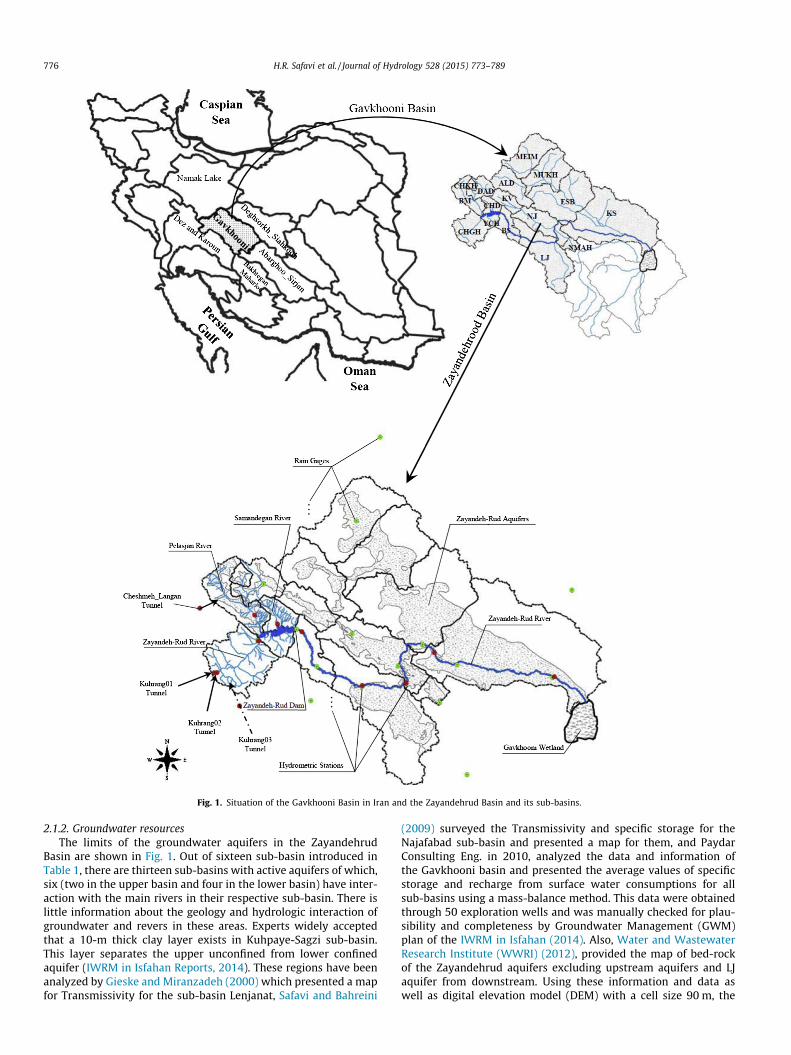
The Zayandehrud River Basin is the most important watershedand a crucial source of water for irrigation, as well as for industries,animal farming, municipal supply and wastewater dilution (Safaviand Alijanian, 2010). This basin is located in center of Iran with thearea of 26,972 km2 of which 16,649 km2 is in mountainous areaand the rest in the foothills and plains (Fig. 1). The basin is a partof Esfahan and Sirjan Catchment in the Iran’s central plateauaccording to the Iran’s hydrology classification.
The Zayandehrud River is a vitally important river for agricul-tural development as well as domestic water supply and economicactivity of the Isfahan province in west-central Iran. It is a com-pletely closed basin having no outlet to the sea. The river is about350 km long and runs in a roughly west–east direction, originatingin the Zagros Mountains, west of the city of Isfahan, and terminat-ing in the Gavkhooni wetland to the east of the city (Murray-Rastet al., 2000). The Zayandehrud contains more water than any otherriver in central Iran. Nevertheless, the management of the waterresource in the catchment area has become a source of conflictbetween different parties; a conflict which has become exacer-bated in recent years. Municipal water utilities, industry such ascement companies, large steel rolling mills, pulp and paper, powerplant companies and irrigation-dependent agriculture, all havehigh priority water demands (IWRM in Isfahan: Industry Report,2014; Paydar Consulting Eng., 2010). On the other hand, as suchunder the Ramsar Convention, because of climate change anddrought, the Gavkhooni wetland does not receive enough water;so this led to deterioration of this wetland status (Matthews,1993). Madani and Mariño (2009) have been introduced the
eadin
g
Downlo
ad
Zayandehrud Basin as a complex water system. They discussedthe lack of complete understanding about all interactingsub-systems. However, it is important to note that there is valuableexperience, expertise and information regarding this basin and theinteractions of sub-basins, water sources and water demands thatcan be used for research and studies in this basin.
According to the recent studies in Esfahan Regional Waterboard Company (ESRW), the Zayandehrud Basin is divided into six-teen sub-basins (Table 1). There are four aquifers very important,in terms of their interaction with the river: Kuhpayeh-Sagzi (KS),Esfahan-Borkhar (ESB), Najafabad (NJ) and Lenjanat (LJ). Thesesub-basins are known as complex sub-systems of theZayandehrud Basin because of the conjunctive use of the surfacewater and groundwater and interaction between river and ground-water resources as well as development of agriculture, industriesand urban population density in these areas.
Therefore, research related to IWRM in this basin is very neces-sary and important given the vulnerability and complexity of thewater system. The innate complexity of the basin is the reason forchoosing it as the case study for this research, for instance: differentwater sources including surface water and groundwater, conjunc-tive use of water and interaction between surface and groundwater,inter-basin water transfers and several types of use such as domes-tic and sanitation, agriculture, industries and environmental waterdemands. This research also shows that in cases with lack of datafor modeling, the valuable expert knowledge can be used to developa reliable model to manage water resources system.
2.1. Water resources in the Zayandehrud Basin
2.1.1. Surface water resourcesThere are three main rivers in the Zayandehrud Basin:
Zayandehrud River, Pelasjan River and Samandegan River (seeFig. 1). Based on 21-year historic data (from water year 1991 to2011), the average annual runoff of these rivers is approximately990 Million Cubic Meters (MCM) above Zayandehrud Dam, 87%from the Zayandehrud River, 12% from Pelasjan River and less than1% from Samandegan River. Runoff from these rivers is strategi-cally stored in the Zayandehrud Dam, constructed in 1971(Fig. 1). Because of its characteristics as shown in Table 1, theChelgerd_Ghal’e Shahrokh sub-basin is the most importantsub-basin and primary source of surface water in this basin.
Downstream of Zayandehrud Dam, there should be lateral con-tributions to the Zayandehrud mainstem from seasonal river tribu-taries; however, because of the fragmentation of water resourcesmanagement, these rivers often do not reach to the ZayandehrudRiver; thus, they have little regional importance (Molle et al.,2009). In contrast, recharge to the aquifers from effective rainfalland the Zayandehrud River in this area is very important(Zayandab Consulting Eng., 2008).
With the opening of the first inter-basin tunnel, named Kuhrangtunnel No.1, the basin resources were augmented in 1953. Thistunnel could divert an annual volume of 340 MCM from KuhrangRiver. In 1970, the storage capacity Zayandehrud Dam was com-pleted (1470 MCM) to regulate the water regime upstream of thisdam (IWRM in Isfahan, 2014). These projects have increased thewater supply and storage in the Zayandehrud basin dramatically.Another tunnel from Kuhrang River was built in 1986 with capac-ity to divert approximately 250 MCM/year, on average. In addition,Cheshmeh-Langan tunnel delivered 164 MCM/year of water fromDez River Basin since 2009 (Gohari et al., 2013a). Based on21-year historic data, the two Kuhrang tunnels and theCheshmeh-Langan tunnel delivered annually about 238, 309 and86 MCM from Karun and Dez River Basins, respectively. Locationsof these tunnels are illustrated in Fig. 1. Table 2 shows the mainsurface water resources in the Zayandehrud Basin.
Only
for R
eadin
g
Do Not
Downlo
ad
Fig. 1. Situation of the Gavkhooni Basin in Iran and the Zayandehrud Basin and its sub-basins.
776 H.R. Safavi et al. / Journal of Hydrology 528 (2015) 773–789
2.1.2. Groundwater resourcesThe limits of the groundwater aquifers in the Zayandehrud
Basin are shown in Fig. 1. Out of sixteen sub-basin introduced inTable 1, there are thirteen sub-basins with active aquifers of which,six (two in the upper basin and four in the lower basin) have inter-action with the main rivers in their respective sub-basin. There islittle information about the geology and hydrologic interaction ofgroundwater and revers in these areas. Experts widely acceptedthat a 10-m thick clay layer exists in Kuhpaye-Sagzi sub-basin.This layer separates the upper unconfined from lower confinedaquifer (IWRM in Isfahan Reports, 2014). These regions have beenanalyzed by Gieske and Miranzadeh (2000) which presented a mapfor Transmissivity for the sub-basin Lenjanat, Safavi and Bahreini
(2009) surveyed the Transmissivity and specific storage for theNajafabad sub-basin and presented a map for them, and PaydarConsulting Eng. in 2010, analyzed the data and information ofthe Gavkhooni basin and presented the average values of specificstorage and recharge from surface water consumptions for allsub-basins using a mass-balance method. This data were obtainedthrough 50 exploration wells and was manually checked for plau-sibility and completeness by Groundwater Management (GWM)plan of the IWRM in Isfahan (2014). Also, Water and WastewaterResearch Institute (WWRI) (2012), provided the map of bed-rockof the Zayandehrud aquifers excluding upstream aquifers and LJaquifer from downstream. Using these information and data aswell as digital elevation model (DEM) with a cell size 90 m, the

Table 1The Zayandehrud sub-basins and their characteristics.
Sub-basin name (abbreviation) Area (km2) Annual average precipitation Position relative to the dam
(mm) (MCM)
Damaneh_Daran (DAD) 710.70 362 257 Upstream (upper basin)Chelkhaneh (CHKH) 161.85 362 59Boein_Miandasht (BM) 981.41 378 371Chadegan (CHD) 425.67 299 127Chelgerd_Ghal’e Shahrokh (CHGH) 1504.17 896 1347Yan Cheshmeh (YCH) 338.24 325 110
Ben_Saman (BS) 834.32 292 244 Downstream (lower basin)Karvan (KV) 727.33 252 184Lenjanat (LJ) 3362.68 164 553Najafabad (NJ) 1753.56 161 282North Mahyar (NMAH) 267.15 140 37Alavijeh_Dehagh (ALD) 1442.73 259 374Meimeh (MEIM) 2063.88 159 328Murchehkhort (MUKH) 2203.25 158 348Esfahan_Borkhar (ESB) 3772.99 134 506Kouhpayeh_Sagzi (KS) 6422.35 103 660
Total 26972.28 4444 5787
H.R. Safavi et al. / Journal of Hydrology 528 (2015) 773–789 777
average groundwater levels and some of unknown characteristicsof the aquifers are estimated in this study. The characteristics ofthe Zayandehrud aquifers are presented in Table 3.
R2.2. Water demand and supply in the Zayandehrud Basin
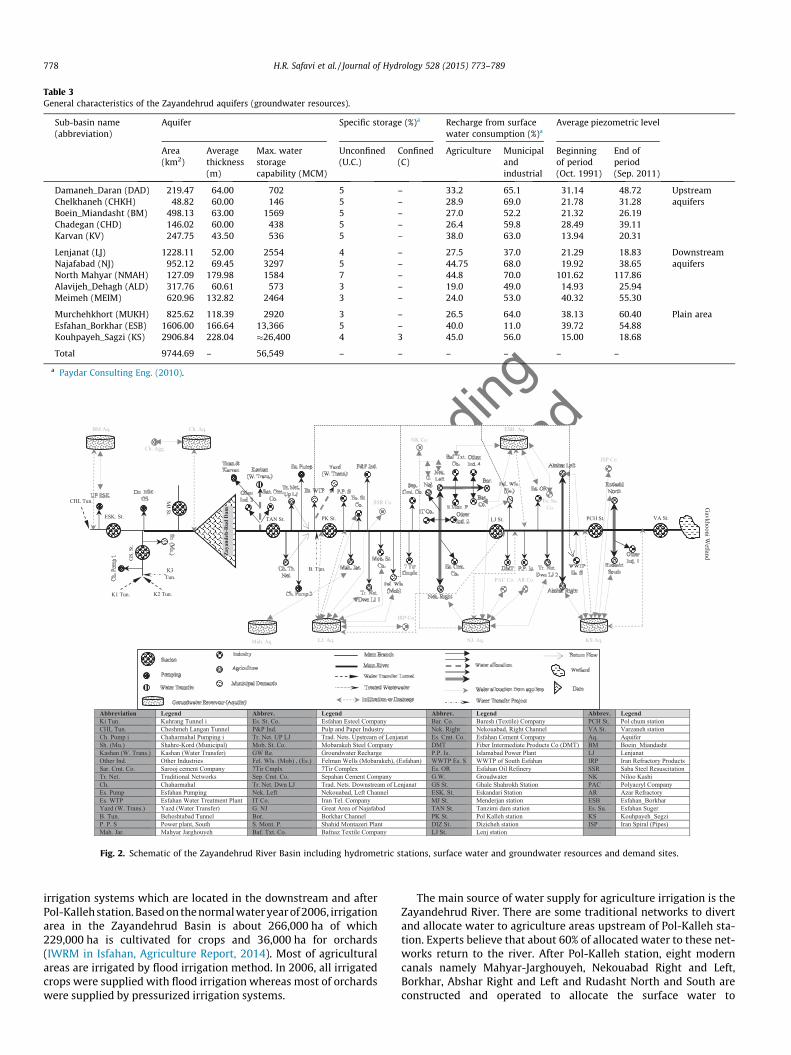
In general, there are four types of water use in the ZayandehrudBasin: municipal, environmental, industrial and agricultural. Fig. 2
Only
for
Do Not
Table 2General characteristics of the Zayandehrud surface water resources.
Attribute Value
PrecipitationTotal (MCM) 5788Upstream of dam (MCM) 2271Downstream of dam (MCM) 3207
Zayandehrud RiverLength upstream of dam (km) 47Length downstream of dam (km) 313Annual stream flow (MCM) in CHGH sub-basin 858Monthly min., max and average temperature
of origin area (�C)a�9, 24.7 and 10.13
Pelasjan RiverLength (km)b 72.5Annual stream flow (MCM) 122Monthly min., max and average temperature
of origin area (�C)a�10, 24.7 and 10.04
Samandegan RiverLength (km)b 26.9Annual stream flow (MCM) 7Monthly min., max and average temperature
of origin area (�C)a�10, 26.5 and 11.51
Zayandehrud Damc
Height of dam from foundation (m) 100Crest level (m.a.s.l) 2063Normal water level (m.a.s.l) 2059Max. reservoir volume (MCM) 1470Effective reservoir volume (MCM) 1260Year of completion 1969Max. discharge (m3/s) 1910Monthly min., max and average temperature
of the area of dam (�C)a�9.7, 28.7, 12.16
Annual evaporation from reservoir (MCM)d 73.87
a Based on 21-year data (from Oct.-1991 to Sep.-2011) (unpublished data).b Yekom Consulting Eng. (2013).c ESRW Company Brochure of the Zayandehrud Dam.d Based on volume–elevation curve of the Zayandehrud Dam (unpublished data).
eadin
g
Downlo
adshows the schematic of the Zayandehrud Basin, including all majorwater demands and their supply sources considered in this study.This figure also shows aquifers that have interaction with the mainriver.
Municipal demand in the basin includes: (a) greater Isfahan cityand it metropolitan area, (b) other municipal demands in theZayandehrud basin and (c) exporting of water to other cities outof the basin such as Shahre-Kord, Yazd and Kashan cities. Abouttwo-thirds of municipal water supplies come from theBaba-Sheikh-Ali water treatment plant (WTP) which directlydiverts water from the Zayandehrud River. The remaining watercomes from the Mobarakeh and Isfahan Felman well fields, whosemain recharge source is the Zayandehrud River (about 70%) andthe water supply comes from LJ, NJ and ESB aquifers (Salemi andMurray-Rust, 2002; ESRW Company, unpublished data). Thereare return flows from urban areas which can be used by down-stream irrigation systems. About 40% of return flows are treatedby South Isfahan wastewater treatment plant and returns to theZayandehrud River.
One of the most important demands in the Zayandehrud basinis the environmental demand for the Gavkhooni wetland, locatedat the end of the Zayandehrud River on the east side of basin.Currently, there is no defined surface water allocation to protectthis wetlands or in-stream requirements. Sarhadi and Soltani(2013) have determined the minimum flow requirement of theGavkhooni wetland for normal water years (141 MCM/year) anddrought periods (60 MCM/year). In recent years, because ofsuccessive droughts and unauthorized extractions from upstreamand downstream water users of the Zayandehrud Dam, theGavkhooni wetland has been destroyed.
There are about 13,000 industrial units in the Zayandehrudbasin of which about 30 large industrial units appropriating morethan 75% of the industrial demands (IWRM in Isfahan, IndustryReport, 2014). These are mainly in the sectors of steel, petrochem-ical, cement and power stations, they have high water demand andare mostly located between Pol-Kalleh and Lenj hydrometric sta-tions. There are fifteen large water demands of industries suppliedexclusively by the Zayandehrud River, ten industries from ground-water sources and the rest by both water sources. In general, about87% of industrial demands is supplied by the Zayandehrud Riverand the rest by groundwater resources.
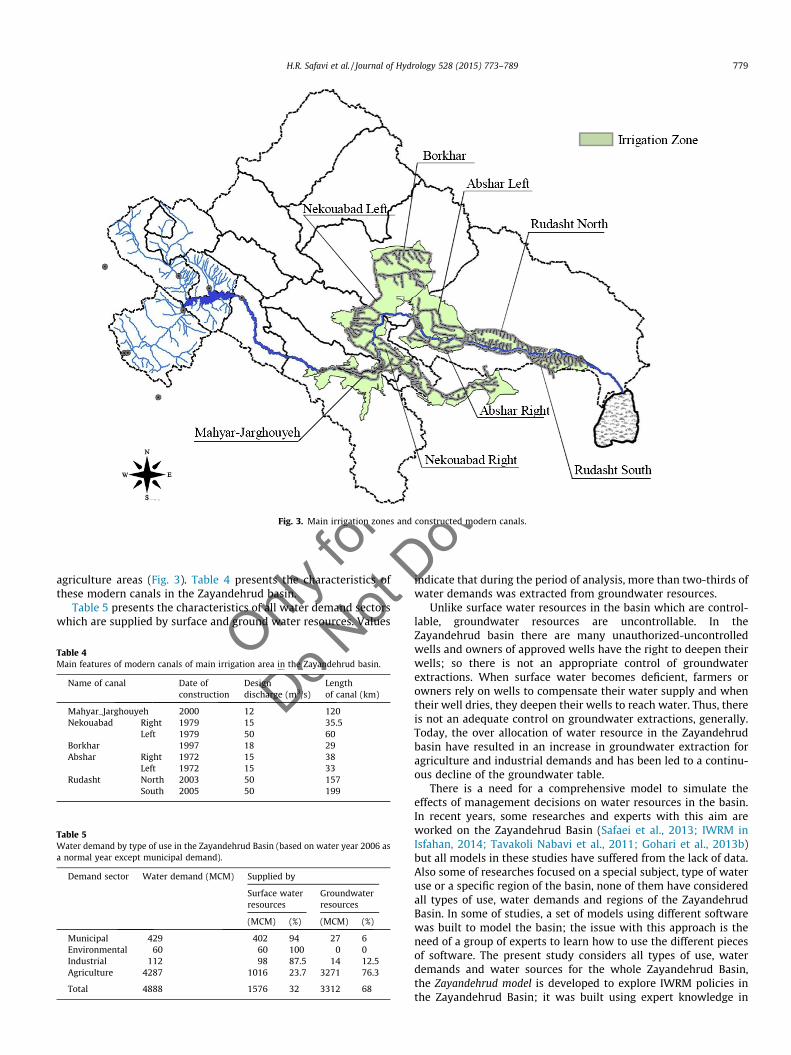
Agricultural demand accounts for 85% of the water demand and itis the main consumer of both surface and groundwater resources inthe Zayandehrud Basin. Fig. 3 shows the overall layout of different
Only
for R
eadin
g
Do Not
Downlo
ad
Table 3General characteristics of the Zayandehrud aquifers (groundwater resources).
Sub-basin name(abbreviation)
Aquifer Specific storage (%)a Recharge from surfacewater consumption (%)a
Average piezometric level
Area(km2)
Averagethickness(m)
Max. waterstoragecapability (MCM)
Unconfined(U.C.)
Confined(C)
Agriculture Municipalandindustrial
Beginningof period(Oct. 1991)
End ofperiod(Sep. 2011)
Damaneh_Daran (DAD) 219.47 64.00 702 5 – 33.2 65.1 31.14 48.72 UpstreamaquifersChelkhaneh (CHKH) 48.82 60.00 146 5 – 28.9 69.0 21.78 31.28
Boein_Miandasht (BM) 498.13 63.00 1569 5 – 27.0 52.2 21.32 26.19Chadegan (CHD) 146.02 60.00 438 5 – 26.4 59.8 28.49 39.11Karvan (KV) 247.75 43.50 536 5 – 38.0 63.0 13.94 20.31
Lenjanat (LJ) 1228.11 52.00 2554 4 – 27.5 37.0 21.29 18.83 DownstreamaquifersNajafabad (NJ) 952.12 69.45 3297 5 – 44.75 68.0 19.92 38.65
North Mahyar (NMAH) 127.09 179.98 1584 7 – 44.8 70.0 101.62 117.86Alavijeh_Dehagh (ALD) 317.76 60.61 573 3 – 19.0 49.0 14.93 25.94Meimeh (MEIM) 620.96 132.82 2464 3 – 24.0 53.0 40.32 55.30
Murchehkhort (MUKH) 825.62 118.39 2920 3 – 26.5 64.0 38.13 60.40 Plain areaEsfahan_Borkhar (ESB) 1606.00 166.64 13,366 5 – 40.0 11.0 39.72 54.88Kouhpayeh_Sagzi (KS) 2906.84 228.04 �26,400 4 3 45.0 56.0 15.00 18.68
Total 9744.69 – 56,549 – – – – – –
a Paydar Consulting Eng. (2010).
Abbreviation Legend Abbrev. Legend Abbrev. Legend Abbrev. Legend Ki Tun. Kuhrang Tunnel i Es. St. Co. Esfahan Esteel Company Bar. Co. Baresh (Textile) Company PCH St. Pol chum station CHL Tun. Cheshmeh Langan Tunnel P&P Ind. Pulp and Paper Industry Nek. Right Nekouabad, Right Channel VA St. Varzaneh station Ch. Pump i Chaharmahal Pumping i Tr. Net. UP LJ Trad. Nets. Upstream of Lenjanat Es. Cmt. Co. Esfahan Cement Company Aq. Aquifer Sh. (Mu.) Shahre-Kord (Municipal) Mob. St. Co. Mobarakeh Steel Company DMT Fiber Intermediate Products Co (DMT) BM Boein_Miandasht Kashan (W. Trans.) Kashan (Water Transfer) GW Re. Groundwater Recharge P.P. Is. Islamabad Power Plant LJ Lenjanat Other Ind. Other Industries Fel. Wls. (Mob) , (Es.) Felman Wells (Mobarakeh), (Esfahan) WWTP Es. S WWTP of South Esfahan IRP Iran Refractory Products Sar. Cmt. Co. Sarooj cement Company 7Tir Cmplx 7Tir Complex Es. OR Esfahan Oil Refinery SSR Saba Steel Resuscitation Tr. Net. Traditional Networks Sep. Cmt. Co. Sepahan Cement Company G.W. Groudwater NK Niloo Kashi Ch. Chaharmahal Tr. Net. Dwn LJ Trad. Nets. Downstream of Lenjanat GS St. Ghale Shahrokh Station PAC Polyacryl Company Es. Pump Esfahan Pumping Nek. Left Nekouabad, Left Channel ESK. St. Eskandari Station AR Azar Refractory Es. WTP Esfahan Water Treatment Plant IT Co. Iran Tel. Company MJ St. Menderjan station ESB Esfahan_Borkhar Yazd (W. Trans.) Yazd (Water Transfer) G. NJ Great Area of Najafabad TAN St. Tanzimi dam station Es. Su. Esfahan Suger B. Tun. Beheshtabad Tunnel Bor. Borkhar Channel PK St. Pol Kalleh station KS Kouhpayeh_Segzi P. P. S Power plant, South S. Mont. P. Shahid Montazeri Plant DIZ St. Dizicheh station ISP Iran Spiral (Pipes) Mah. Jar. Mahyar Jarghouyeh Baf. Txt. Co. Bafnaz Textile Company LJ St. Lenj station
TAN St. PK St. LJ St. VA St.
Gavkhooni W
etland
PCH St.
B. Tun.
MJ St. ESK. St.
CHL Tun.
Zay
ande
h-R
ud D
am
GS.
St.
K2 Tun.
K3 Tun.
K1 Tun.
ISP Co.
KS Aq.
Es. Su. Co.
ESB. Aq.
NJ. Aq.
PAC Co.
NK Co.
AR Co.
LJ. Aq.
SSR Co.
IRP Co.
Ch. Aq.
Ch. Agg.
BM Aq.
Mah. Aq.
Fig. 2. Schematic of the Zayandehrud River Basin including hydrometric stations, surface water and groundwater resources and demand sites.
778 H.R. Safavi et al. / Journal of Hydrology 528 (2015) 773–789
irrigation systems which are located in the downstream and afterPol-Kalleh station. Based on the normal water year of 2006, irrigationarea in the Zayandehrud Basin is about 266,000 ha of which229,000 ha is cultivated for crops and 36,000 ha for orchards(IWRM in Isfahan, Agriculture Report, 2014). Most of agriculturalareas are irrigated by flood irrigation method. In 2006, all irrigatedcrops were supplied with flood irrigation whereas most of orchardswere supplied by pressurized irrigation systems.
The main source of water supply for agriculture irrigation is theZayandehrud River. There are some traditional networks to divertand allocate water to agriculture areas upstream of Pol-Kalleh sta-tion. Experts believe that about 60% of allocated water to these net-works return to the river. After Pol-Kalleh station, eight moderncanals namely Mahyar-Jarghouyeh, Nekouabad Right and Left,Borkhar, Abshar Right and Left and Rudasht North and South areconstructed and operated to allocate the surface water to
for R
eadin
g
ow
nload
Fig. 3. Main irrigation zones and constructed modern canals.
H.R. Safavi et al. / Journal of Hydrology 528 (2015) 773–789 779
nly
otagriculture areas (Fig. 3). Table 4 presents the characteristics ofthese modern canals in the Zayandehrud basin.
Table 5 presents the characteristics of all water demand sectorswhich are supplied by surface and ground water resources. Values
ODo NTable 4
Main features of modern canals of main irrigation area in the Zayandehrud basin.
Name of canal Date ofconstruction
Designdischarge (m3/s)
Lengthof canal (km)
Mahyar_Jarghouyeh 2000 12 120Nekouabad Right 1979 15 35.5
Left 1979 50 60Borkhar 1997 18 29Abshar Right 1972 15 38
Left 1972 15 33Rudasht North 2003 50 157
South 2005 50 199
Table 5Water demand by type of use in the Zayandehrud Basin (based on water year 2006 asa normal year except municipal demand).
Demand sector Water demand (MCM) Supplied by
Surface waterresources
Groundwaterresources
(MCM) (%) (MCM) (%)
Municipal 429 402 94 27 6Environmental 60 60 100 0 0Industrial 112 98 87.5 14 12.5Agriculture 4287 1016 23.7 3271 76.3
Total 4888 1576 32 3312 68
Dindicate that during the period of analysis, more than two-thirds ofwater demands was extracted from groundwater resources.
Unlike surface water resources in the basin which are control-lable, groundwater resources are uncontrollable. In theZayandehrud basin there are many unauthorized-uncontrolledwells and owners of approved wells have the right to deepen theirwells; so there is not an appropriate control of groundwaterextractions. When surface water becomes deficient, farmers orowners rely on wells to compensate their water supply and whentheir well dries, they deepen their wells to reach water. Thus, thereis not an adequate control on groundwater extractions, generally.Today, the over allocation of water resource in the Zayandehrudbasin have resulted in an increase in groundwater extraction foragriculture and industrial demands and has been led to a continu-ous decline of the groundwater table.
There is a need for a comprehensive model to simulate theeffects of management decisions on water resources in the basin.In recent years, some researches and experts with this aim areworked on the Zayandehrud Basin (Safaei et al., 2013; IWRM inIsfahan, 2014; Tavakoli Nabavi et al., 2011; Gohari et al., 2013b)but all models in these studies have suffered from the lack of data.Also some of researches focused on a special subject, type of wateruse or a specific region of the basin, none of them have consideredall types of use, water demands and regions of the ZayandehrudBasin. In some of studies, a set of models using different softwarewas built to model the basin; the issue with this approach is theneed of a group of experts to learn how to use the different piecesof software. The present study considers all types of use, waterdemands and water sources for the whole Zayandehrud Basin,the Zayandehrud model is developed to explore IWRM policies inthe Zayandehrud Basin; it was built using expert knowledge in

780 H.R. Safavi et al. / Journal of Hydrology 528 (2015) 773–789
the case of imperfect or lack of data and can evaluate strategies forimproving the integrated management in the basin.
R
3. Methodology
The Zayandehrud model is a water resources model developed toevaluate current and proposed water management policies. Thismodel consists of a rainfall–runoff model (ANFIS Model) with apriority-based water allocation system to represent regionalhydrology, infrastructure, and water management on a monthlystep (Planning Model). The Water Evaluation and PlanningSystem (WEAP) platform is used for the planning model, it calcu-lates a monthly water balance of inflows, changes in reservoirand groundwater storages, water supply allocated to waterdemands and outflows based on a 21-year hydrologic period ofanalysis (Oct./1991–Sep./2011). This period of analysis containsthe historical record of the water abundant period of 1992–1995,the drought period of 2001–2003 and part of the most recentdrought of the years 2008–2011. Visual Basic scripts converteddata between WEAP and Excel. In this study a model is developedfor the Zayandehrud Basin using a multi-step methodology asillustrated in Fig. 4.
This methodology includes: (i) an ANFIS model to simulate rain-fall–runoff in the basin, this data is used as inputs in the planningmodel; (ii) a reach-scale water planning model that considerswater supply from the ANFIS model, projected water demandsand allocation system, and surface water and groundwater interac-tion; and (iii) an automated evaluation system using 5 perfor-mance criteria and one summary index to evaluate present watermanagement policies under different climate change conditions.
Only
for
Do Not
SW and GW Resources
Natural Streamflow
Streamflow Gauges
Municipality
Agriculture
Industry
Environmental
Demands
Data
Surface Water
Groundwater (
Losses
Gains
Comparison
Pl
ANFIS M
Climate Change
Precipitation
Temperature
Historic
Resources
Calibration and Validation Criteria Reservoirs, stream flows and supplied
demands
Calibration
Fig. 4. Study method framewo
eadin
g
nload
3.1. ANFIS model
ANFIS is a multi-layer adaptive network-based fuzzy inferencesystem initially developed by Jang (1993), and later on widelyapplied in engineering (Jang and Sun, 1995). The general structureof the ANFIS is presented in Fig. 5. The corresponding equivalentANFIS architecture which is used Takagi–Sugeno FIS is presentedin Fig. 5b, where nodes of the same layer have similar functions.
A Sugeno system by two inputs and one output can beexpressed by two rules as:
Rule 1: if x is A1 and y is B1, Then f = p1x + q1y+r1
Rule 2: if x is A2 and y is B2, Then f = p2x + q2y+r2
The functioning of the ANFIS is as follows (Jang et al., 1997):Layer 1: Each node in this layer generates membership grades
of an input variable. The node output OP1i s defined by:
OP1i ¼lAi
ðxÞ for i¼1;2 or OP1i ¼lBi�2
ðyÞ for i¼3;4 ð1Þ
where x (or y) is the input to the node; Ai (or Bi�2) is a fuzzy set asso-ciated with this node, characterized by the shape of the member-ship functions (MFs) in this node and can be any appropriatefunctions that are continuous and piecewise differentiable such asGaussian, generalized bell-shaped, trapezoidal shaped, ortriangular-shaped functions. Because of their smooth and nonzeroat all points, Gaussian and bell MFs are more popular methods forspecifying fuzzy sets although the bell-MF has one more parameterthan the Gaussian MF (Sumathi and Paneerselvam, 2010). Assuminga generalized bell function as the MF, the output OPi
1 can becomputed as:
Dow
(SW) Model
GW) Model
Gains
Losses
Comparison Interaction between
SW and GW
anning Model
odel
Validation Set
Future Set
SUPP
LY
Performance criteria and
Sustainability Index
Set
AN
FIS
Mod
el
rk and conceptual model.

r Rea
ding
wnlo
ad
(a)
2
1
2
2
1
w1
w2
f1=p1x+q1y+r1
f2=p2x+q2y+r2
1 1 2 2
1 2
1
1 2
1
2
1 2
2
1 1 2 2
1
2
1
x
x
y
y
A1
A2
B1
B2
(b)
Fig. 5. (a) Fuzzy inference system. (b) Equivalent ANFIS architecture (Jang et al., 1997; Nayak et al., 2004).
H.R. Safavi et al. / Journal of Hydrology 528 (2015) 773–789 781
Only
fo
Do Not
OP1i ¼ lAi
ðxÞ ¼ 1
1þ x�ciai
� �2bið2Þ
where {ai, bi, ci} is the parameter set that changes the shape of theMF with a maximum equal to 1 and a minimum equal to 0.
Layer 2: Every node in this layer multiplies the incomingsignals, denoted by p, and the output OPi
2 that represents the firingstrength of a rule computed as:
OP2i ¼ wi ¼ lAi
ðxÞ � lBiðyÞ; i ¼ 1;2 ð3Þ
where wi is the activation weight.Layer 3: The ith node of this layer, labeled as N, computes the
normalized firing strengths as:
OP3i ¼ �wi ¼
wi
w1 þw2; i ¼ 1;2 ð4Þ
Layer 4: Node i in this layer compute the contribution of the ithrule toward the model output, with the following node function:
OP4i ¼ �wif i ¼ �wiðpixþ qiyþ riÞ ð5Þ
where �w is the output of layer 3 and {pi, qi, ri} is the parameter set.Layer 5: The single node in this layer computes the overall
output of the ANFIS as:
OP5i ¼ Overall output ¼
Xi
�wif i ¼P
iwif iPiwi
ð6Þ
Training of these systems means that by using training data,nonlinear parameter of layer 1 and linear parameter of layer 4are set, so that for each input desired output is achieved.Hybrid-learning algorithm is one of the most important methodsof training ANFIS. In this method, for training parameters in the
Dolayer 1 and layer 4, back propagation (BP) and least square error(LSE) methods are used, respectively. Details of algorithm andmathematical background can be found in Jang and Sun (1995).
Since the information of soil texture and structure, watershedmanagement projects and many diversion dams are insufficientin the Zayandehrud basin, there is not the possibility of developinga reliable hydrologic model. Intelligent systems such as ANN andANFIS are very useful and practical technique in these cases(Chau, 2007; Chen and Chau, 2006; Muttil and Chau, 2006;Cheng et al., 2005). So, in this study, ANFIS model is developed tosimulate rainfall–runoff with two inputs as temperature and pre-cipitation and one output as runoff for each considered river ornode. ANFIS has been widely used for deriving rainfall–runoff mod-els because it has the advantages of both Artificial Neural Networks(ANN) and the Fuzzy Inference System (FIS) methods (Safavi et al.,2013; Nourani and Komasi, 2013; Akrami et al., 2013; Wang et al.,2009; Nayak et al., 2004; Özgar, 2009). In ANFIS, ANN is used fordeveloping the fuzzy rules which are constructed regarding his-toric data or expert knowledge. The aim of developing ANFIS modelin this study is to simulate natural flows in the basin especially forstreamflows of the main rivers and relating this estimation to tem-perature and precipitation. So this model can be used in case of cli-mate change conditions to simulate natural flows in the basin.Outputs of the ANFIS model, which are natural flows in the future,are used as inputs of the Zayandehrud model (Fig. 4).
3.2. Planning model
To develop the planning model, first the naturalized flows wereestimated. Naturalized flows are calculated to represent historicalstreamflow in a river basin in the absence of human developmentand water use (Wurbs, 2006). It is used in the Zayandehrud Basin
R
t
782 H.R. Safavi et al. / Journal of Hydrology 528 (2015) 773–789
Only
for
Do No
model as input for both headflows and Incremental Flows (IFs). Inthe Zayandehrud Basin model, headflows are specified for threemain rivers and IFs are calculated for ten sites (station by stationillustrated in Fig. 2) to represent gains and losses along streamreaches (Danner et al., 2006). In summary, IFs discretize: (a) localwatershed contributions to runoff, (b) surface water–groundwaterinteractions, and (c) unaccounted-extractions from river or aquifer.Same as surface water resources, this process is used to calculateIFs for 13 aquifers of the Zayandehrud Basin. So the Zayandehrudmodel is governed by the continuity equation for an ith subreachin month t as follows (Lane, 2014):
DStorageit ¼ Inflowsi
t � Outflowsit þ IFi
t ð7Þ
where DStorageit is the change of reservoir storage, inflowsi
t includestreamflow inputs, water imports, and returns for surface waterresource or recharges, and leakage ponds for groundwater resource,Outflowsi
t include streamflow outputs, water exports, evaporationand diversions out of the reach for surface water resource orextracted or pumped water from aquifer, and drainage water tothe rivers for groundwater resource, and IFi
t refer to water gains ifits value is positive and losses if it is negative.
The Zayandehrud model considers two main water sources, sur-face and groundwater. Because of this, it is important to specify theinteraction between them. In order to consider the conjunctive useof these two sources of water and to estimate amount of waterexchanged between them, gains and losses of river in the siteswhich have interaction with aquifers have been compared withlosses and gains of those aquifers, respectively (Fig. 2). Historicalstreamflows, inter-basin water imports and exports, precipitation,water allocations from rivers and aquifers, diversions,Zayandehrud Dam specifications, operation, volume and evapora-tion, aquifer specifications provided by ESRW and recharge to theaquifers regarded average precipitation data of rain gauges(showed in Fig. 1) and percentage of overall precipitation reachedto the aquifers (presented in Table 3) are used to estimate IFs. Alsomonthly evaporation of one climatology gauge located close to theZayandehrud Dam and volume–area–elevation curve of the dam isused to estimate historic evaporation volume exported from theZayandehrud reservoir.
After calculating streamflows and natural flows in the main riv-ers IFs were estimated for surface water model. Similarly, IFs forgroundwater storage (aquifers) were estimated using the sameprocedures as for surface water sources. The interaction of riverwith aquifer can be estimated with comparing the losses from sur-face water with groundwater water gains of each sub-basin whichriver is flowed on it. Experts believe that because of their geologicalcharacteristics, interaction of four aquifers of LJ, NJ, ESB and KS isquite evident and obvious. So these process were applied to theriver and these aquifers which are located from PK station to VAstation (refer to Figs. 1 and 2) (IWRM in Isfahan, GroundwaterReport, 2014) and other sub-basins have not any considerableinteraction with river in downstream of dam. Thus, the integrationof expert’s knowledge, reports and calculation of IFs (IWRM inIsfahan-Groundwater Report, 2014; Zayandab Consulting Eng.,2008; Paydar Consulting Eng., 2010) lead to the estimation ofexchanged water between surface and ground water resources.
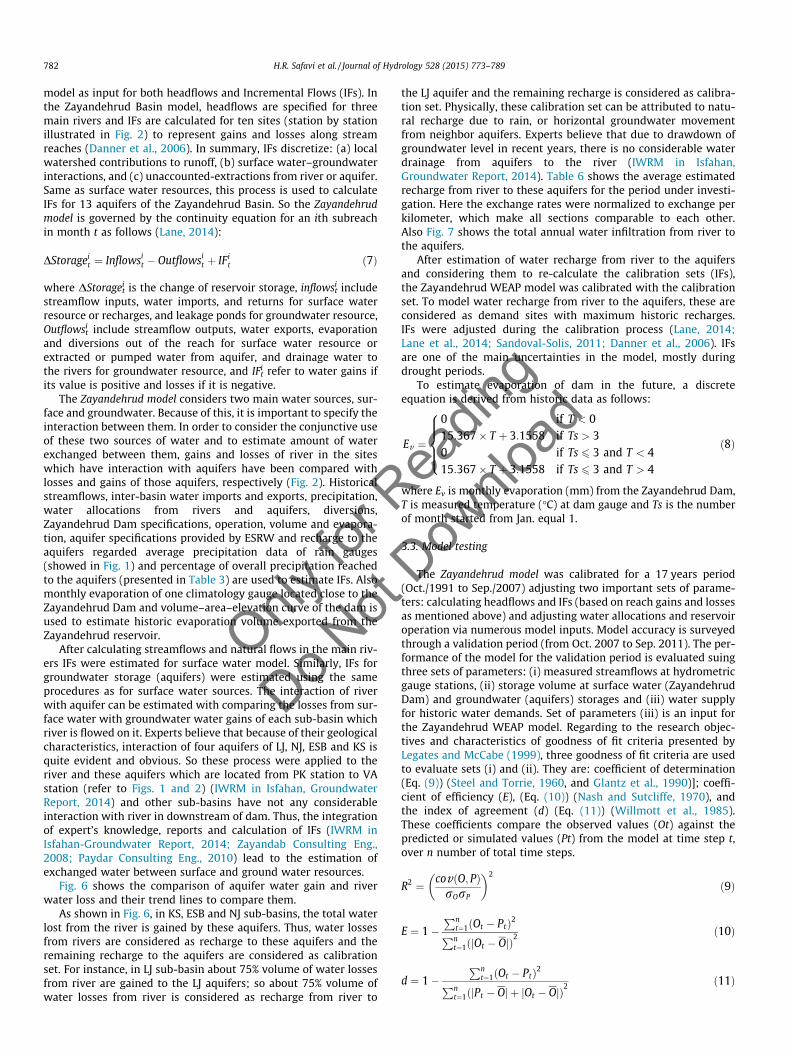
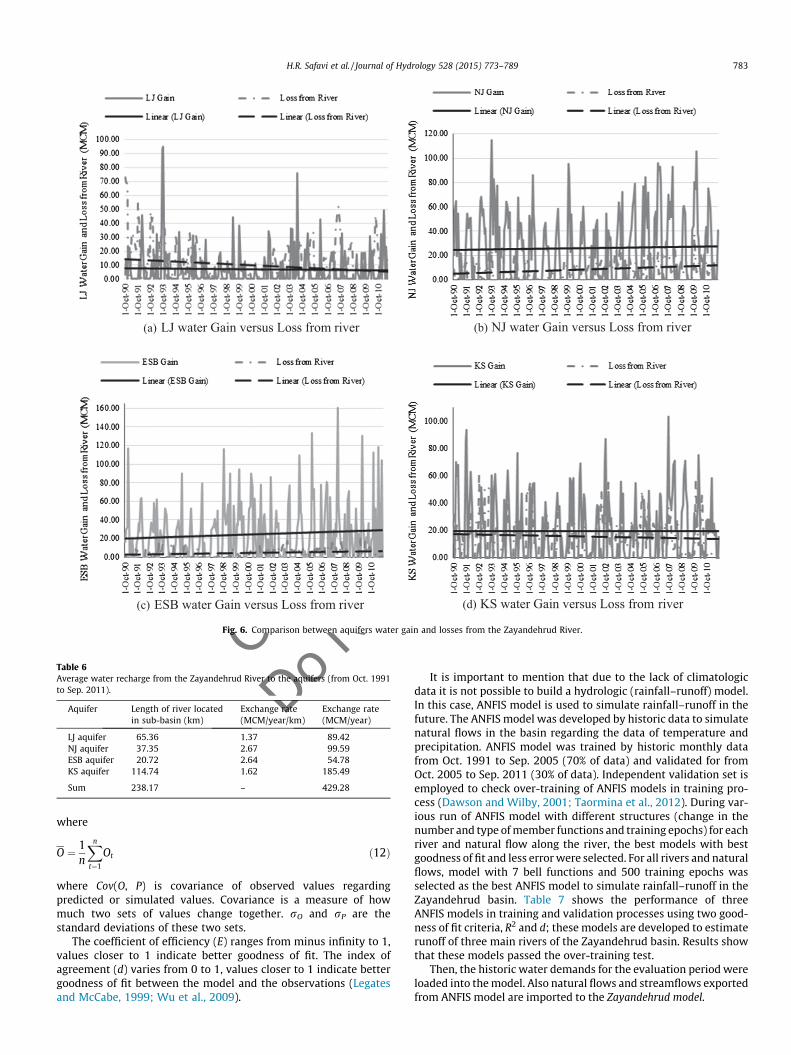
Fig. 6 shows the comparison of aquifer water gain and riverwater loss and their trend lines to compare them.
As shown in Fig. 6, in KS, ESB and NJ sub-basins, the total waterlost from the river is gained by these aquifers. Thus, water lossesfrom rivers are considered as recharge to these aquifers and theremaining recharge to the aquifers are considered as calibrationset. For instance, in LJ sub-basin about 75% volume of water lossesfrom river are gained to the LJ aquifers; so about 75% volume ofwater losses from river is considered as recharge from river to
eadin
g
Dow
nload
the LJ aquifer and the remaining recharge is considered as calibra-tion set. Physically, these calibration set can be attributed to natu-ral recharge due to rain, or horizontal groundwater movementfrom neighbor aquifers. Experts believe that due to drawdown ofgroundwater level in recent years, there is no considerable waterdrainage from aquifers to the river (IWRM in Isfahan,Groundwater Report, 2014). Table 6 shows the average estimatedrecharge from river to these aquifers for the period under investi-gation. Here the exchange rates were normalized to exchange perkilometer, which make all sections comparable to each other.Also Fig. 7 shows the total annual water infiltration from river tothe aquifers.
After estimation of water recharge from river to the aquifersand considering them to re-calculate the calibration sets (IFs),the Zayandehrud WEAP model was calibrated with the calibrationset. To model water recharge from river to the aquifers, these areconsidered as demand sites with maximum historic recharges.IFs were adjusted during the calibration process (Lane, 2014;Lane et al., 2014; Sandoval-Solis, 2011; Danner et al., 2006). IFsare one of the main uncertainties in the model, mostly duringdrought periods.
To estimate evaporation of dam in the future, a discreteequation is derived from historic data as follows:
Ev ¼
0 if T < 015:367� T þ 3:1558 if Ts > 30 if Ts 6 3 and T < 415:367� T þ 3:1558 if Ts 6 3 and T > 4
8>>><>>>:
ð8Þ
where Ev is monthly evaporation (mm) from the Zayandehrud Dam,T is measured temperature (�C) at dam gauge and Ts is the numberof month started from Jan. equal 1.
3.3. Model testing
The Zayandehrud model was calibrated for a 17 years period(Oct./1991 to Sep./2007) adjusting two important sets of parame-ters: calculating headflows and IFs (based on reach gains and lossesas mentioned above) and adjusting water allocations and reservoiroperation via numerous model inputs. Model accuracy is surveyedthrough a validation period (from Oct. 2007 to Sep. 2011). The per-formance of the model for the validation period is evaluated suingthree sets of parameters: (i) measured streamflows at hydrometricgauge stations, (ii) storage volume at surface water (ZayandehrudDam) and groundwater (aquifers) storages and (iii) water supplyfor historic water demands. Set of parameters (iii) is an input forthe Zayandehrud WEAP model. Regarding to the research objec-tives and characteristics of goodness of fit criteria presented byLegates and McCabe (1999), three goodness of fit criteria are usedto evaluate sets (i) and (ii). They are: coefficient of determination(Eq. (9)) (Steel and Torrie, 1960, and Glantz et al., 1990)]; coeffi-cient of efficiency (E), (Eq. (10)) (Nash and Sutcliffe, 1970), andthe index of agreement (d) (Eq. (11)) (Willmott et al., 1985).These coefficients compare the observed values (Ot) against thepredicted or simulated values (Pt) from the model at time step t,over n number of total time steps.
R2 ¼ covðO; PÞrOrP
� �2
ð9Þ
E ¼ 1�Pn
t¼1ðOt � PtÞ2Pnt¼1ðjOt � OjÞ2
ð10Þ
d ¼ 1�Pn
t¼1ðOt � PtÞ2Pnt¼1ðjPt � Oj þ jOt � OjÞ2
ð11Þ
Only
for R
eadin
g
Do Not
Downlo
ad
(a) LJ water Gain versus Loss from river (b) NJ water Gain versus Loss from river
(c) ESB water Gain versus Loss from river (d) KS water Gain versus Loss from river
Fig. 6. Comparison between aquifers water gain and losses from the Zayandehrud River.
Table 6Average water recharge from the Zayandehrud River to the aquifers (from Oct. 1991to Sep. 2011).
Aquifer Length of river locatedin sub-basin (km)
Exchange rate(MCM/year/km)
Exchange rate(MCM/year)
LJ aquifer 65.36 1.37 89.42NJ aquifer 37.35 2.67 99.59ESB aquifer 20.72 2.64 54.78KS aquifer 114.74 1.62 185.49
Sum 238.17 – 429.28
H.R. Safavi et al. / Journal of Hydrology 528 (2015) 773–789 783
where
O ¼ 1n
Xn
t¼1
Ot ð12Þ
where Cov(O, P) is covariance of observed values regardingpredicted or simulated values. Covariance is a measure of howmuch two sets of values change together. rO and rP are thestandard deviations of these two sets.
The coefficient of efficiency (E) ranges from minus infinity to 1,values closer to 1 indicate better goodness of fit. The index ofagreement (d) varies from 0 to 1, values closer to 1 indicate bettergoodness of fit between the model and the observations (Legatesand McCabe, 1999; Wu et al., 2009).
It is important to mention that due to the lack of climatologicdata it is not possible to build a hydrologic (rainfall–runoff) model.In this case, ANFIS model is used to simulate rainfall–runoff in thefuture. The ANFIS model was developed by historic data to simulatenatural flows in the basin regarding the data of temperature andprecipitation. ANFIS model was trained by historic monthly datafrom Oct. 1991 to Sep. 2005 (70% of data) and validated for fromOct. 2005 to Sep. 2011 (30% of data). Independent validation set isemployed to check over-training of ANFIS models in training pro-cess (Dawson and Wilby, 2001; Taormina et al., 2012). During var-ious run of ANFIS model with different structures (change in thenumber and type of member functions and training epochs) for eachriver and natural flow along the river, the best models with bestgoodness of fit and less error were selected. For all rivers and naturalflows, model with 7 bell functions and 500 training epochs wasselected as the best ANFIS model to simulate rainfall–runoff in theZayandehrud basin. Table 7 shows the performance of threeANFIS models in training and validation processes using two good-ness of fit criteria, R2 and d; these models are developed to estimaterunoff of three main rivers of the Zayandehrud basin. Results showthat these models passed the over-training test.
Then, the historic water demands for the evaluation period wereloaded into the model. Also natural flows and streamflows exportedfrom ANFIS model are imported to the Zayandehrud model.

R
Fig. 7. Annual water recharge from the Zayandehrud River to the aquifers.
784 H.R. Safavi et al. / Journal of Hydrology 528 (2015) 773–789
The Zayandehrud model accuracy was evaluated through a vali-dation test from Oct. 2007 to Sep. 2011. Using historic data ofdemand sites and streamflows and natural flows which are outputsof ANFIS regarding historic data of temperature and precipitation,water reliability and surface and ground water resources statusare compared with historic data.
During the calibration and validation processes, historicdemands were declared as inputs values to the model and thegoodness of fit for sets (i) streamflows in gauges and (ii) reservoirand aquifer storages were very close to 1 (R2 > 0.862, E > 0.821 andd > 0.947). The goodness of fit of Zayandehrud WEAP model is verygood accordingly to Moriasi et al. (2007); and it has been calibratedand validated (Figs. 8–10).
rt
Only fo
Do No
3.4. Baseline scenario development
The purpose of the planning model is to evaluate the water sup-ply performance of the Zayandehrud basin under current watermanagement policies, referred as Baseline scenario, which is thewater management before any new policy is implemented. Thisscenario is developed for the near future (Oct. 2015–Sep. 2019).In this period the climate changes will have an impact on temper-ature and precipitation. Data of temperature and precipitationunder climate change conditions for those stations used in thisstudy have been getting from the climate change studies in theZayandehrud Basin researched by WWRI (2012). Therefore, naturalflows, evaporation and groundwater recharges will change in thefuture. Natural flows are simulated by ANFIS model and
Table 7Results of the training and validating process of ANFIS models for three main rivers ofthe basin.
ANFIS model structure Process Coefficient ofdetermination (R2)
Index ofagreement (d)
Number of MFs(MF type)
Epochs
Zayandehrud River7 (Bell) 500 Training 0.88 0.96
Validation 0.76 0.92
Pelasjan River7 (Bell) 500 Training 0.89 0.97
Validation 0.76 0.90
Samandegan River7 (Bell) 500 Training 0.84 0.95
Validation 0.67 0.79
eadin
g
Dow
nload
groundwater recharge to the aquifers are estimated like before.These are the key assumptions considered for the baselinescenario:
(1) Scenario period is from Oct. 2015 to Sep. 2019.(2) Climatic data are based on A2 scenario (the high scenario) of
climate change (IPCC, 2007) and climate change report of theZayandehrud Basin (WWRI, 2012).
(3) Demands of industries and agriculture areas are consideredas supplied demands in the water year 2006 which is knownas a normal year (IWRM in Isfahan, Agriculture Report,2014).
(4) Demand of the Gavkhooni wetland is considered as the min-imum required water for survival birds which is about60 MCM (Sarhadi and Soltani, 2013).
(5) Municipality demand is considered as demands in wateryear 2009 which have the maximum supplied municipalwater demand during the modeling period.
(6) The first allocation priority is for municipal demand andother demands have the same preference with second prior-ity (like present water management policy in the basin).
(7) Percentage of demand extracted from groundwaterresources versus surface water resources are as in the past.
(8) Yearly inter-basin water transferred from/to other basin areas in the past with the same monthly variation.
(9) The third Kuhrang tunnel will delivered about 60 MCMwater annually from Karun basin (Figs. 1 and 2).
(10) If reservoir volume of the Zayandehrud Dam be less than250 MCM the release will be only equal the municipaldemand.
(11) Reservoir volume and aquifers volume at the beginning ofwater year 2015 is assumed that will be equal their valueat the end of water year 2011.
The previous assumptions are declared into the Zayandehrudmodel to evaluate the status of the basin in the near future. Thestatus of water allocations to the demand sites and status of theaquifers and the Zayandehrud Dam can be analyzed after runningmodel under current water management policies. Performance cri-teria are used to evaluate the Baseline scenario. Specifically, fivewater supply performance criteria and one summary index are cal-culated (Sandoval-Solis, 2011; Lane, 2014): time-based and volu-metric reliability, resilience, vulnerability, maximum deficit andsustainability index. Reliability is the probability that the systemwill remain in a non-failure state; resilience is the ability of thesystem to return to non-failure state after a failure has occurred;vulnerability is the likely damage of a failure event (Kjeldsen and
Only
for R
eadin
g
Do Not
Downlo
ad
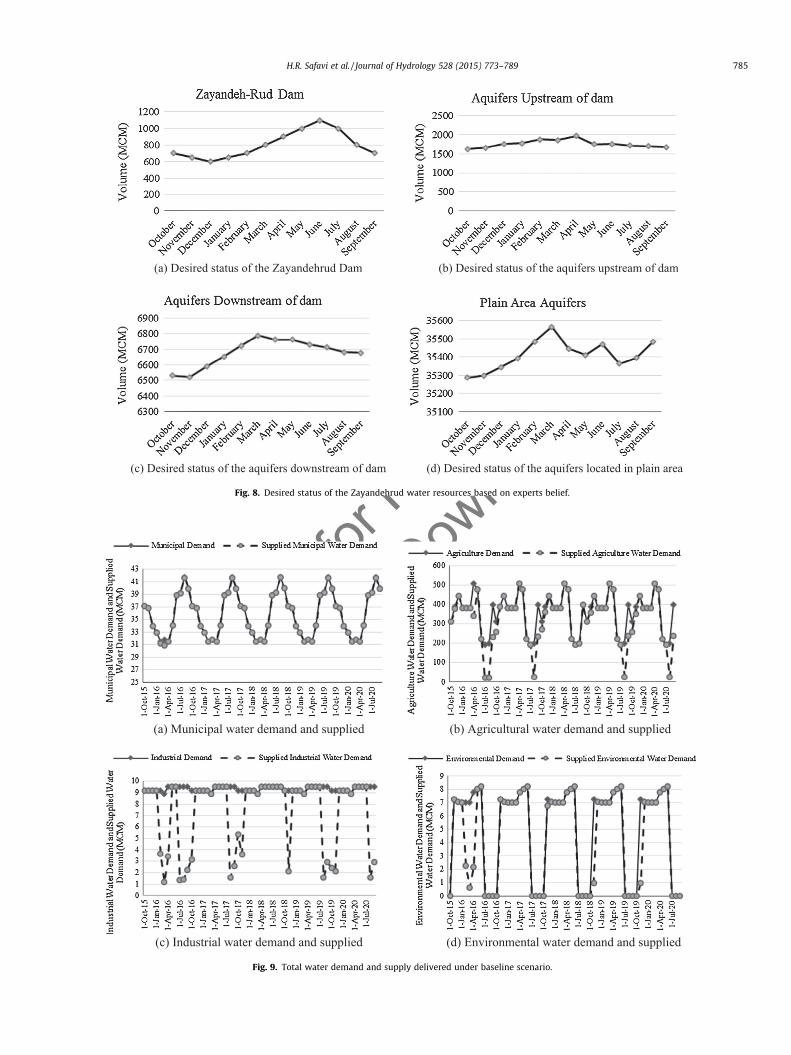
(a) Desired status of the Zayandehrud Dam (b) Desired status of the aquifers upstream of dam
(c) Desired status of the aquifers downstream of dam (d) Desired status of the aquifers located in plain area
Fig. 8. Desired status of the Zayandehrud water resources based on experts belief.
(a) Municipal water demand and supplied (b) Agricultural water demand and supplied
(c) Industrial water demand and supplied (d) Environmental water demand and supplied
Fig. 9. Total water demand and supply delivered under baseline scenario.
H.R. Safavi et al. / Journal of Hydrology 528 (2015) 773–789 785

Rea
ding
twnlo
ad
(a) Zayandehrud Dam reservoir (b) Aquifers located upstream of dam
(c) Aquifers located downstream of dam (d) Aquifers located the plain area
Fig. 10. The Zayandehrud water resources status under Baseline scenario.
786 H.R. Safavi et al. / Journal of Hydrology 528 (2015) 773–789
Only
for
Do No
Rosbjerg, 2004; Asefa et al., 2014); and maximum deficit is theworst-case annual deficit which is occurred (Moy et al., 1986;Sandoval-Solis, 2011). These criteria relate water demand(Demandi
t) and water supply (Supplyit) for a determined jth water
user (Eq. (13)) defined as an agricultural, municipal, environmentalor industrial demand objective; or relate reservoir status (Reservi
t)and desired status (Desirei
t) for a determined jth water resourcedefined as an aquifer or a dam. Equations for the performance cri-teria are same for water user and water resources (Vigerstol, 2002).Only with replace the Demandi
t with Reservit and Supplyi
t with Desireit
the criteria can be calculated for another objective. If deficit (Djt) is
defined as follows (Loucks, 1997):
D jt ¼
Demand jt � Supply j
t if Demand jt > Supply j
t
0 if Demandjt ¼ Supply j
t
(ð13Þ
The following equations show the mathematical procedure toestimate the five performance criteria: time-based reliability[Reljtime, Eq. (14), (McMahon et al., 2006)], volumetric reliability[Reljvol, Eq. (15), (Hashimoto et al., 1982)], resilience [Resj, Eq.(16), (Hashimoto et al., 1982; Moy et al., 1986)], vulnerability[Vulj, Eq. (17) (Sandoval-Solis, 2011)] and maximum deficit [Max.Defj, Eq. (18), (Moy et al., 1986; Lane, 2014; Sandoval-Solis, 2011)]:
Re l jtime ¼
Ns
N� 100%; 0 < Re l j
time < 100% ð14Þ
Re l jvol ¼
Pt¼Nt¼1 Supply j
tPt¼Nt¼1 Demandj
t
� 100%; 0 < Re l jvol < 100% ð15Þ
Re s j ¼ # of times D jt ¼ 0 follows D j
t > 0
# of times D jt > 0 occured
� 100%;
0 < Re s j < 100% ð16Þ
Do
Vul j ¼
PD j
t>0D jt
# of times D jt > 0 occuredPt¼N
t¼1 Demandjt
� 100%; 0 < Re l jvol < 100%
ð17Þ
Max: Def j ¼ maxðD jAnnualÞPt¼12
t¼1 Demandjt
ð18Þ
where Ns is the number of time steps that the water demand wasfully supplied and N is the total number of steps.
Desired status to estimate performance criteria of surface andground water resources is given by experts in the ZayandehrudBasin. They believed that normal and desired status of theZayandehrud Dam and aquifers can be considered as monthly sta-tus of the water year 2007. Fig. 8 shows monthly desired status ofthe Zayandehrud Dam and all aquifers.
The Water Resources Sustainability Index (SIj), the geometricmean of the above mentioned performance criteria (Loucks,1997; Sandoval-Solis et al., 2011), it summarizes the performanceof results to facilitate comparison among complex trade-offs whichis defined as (Sandoval-Solis and McKinney, 2014; Lane, 2014):
SI j ¼ Re l jtime � Re l j
vol � Re s j � ð1� Vul jÞ � ð1�Max: Def jÞn o1=5
ð19Þ
4. Results and discussion
To run the Zayandehrud WEAP model for the baseline scenario,natural flows and streamflows were simulated by ANFIS modelregarding climate change data for precipitation and temperaturefrom Oct. 2015 to Sep. 2019. All hypotheses noted at methodologysection were applied to the model. Fig. 9 shows water demand and
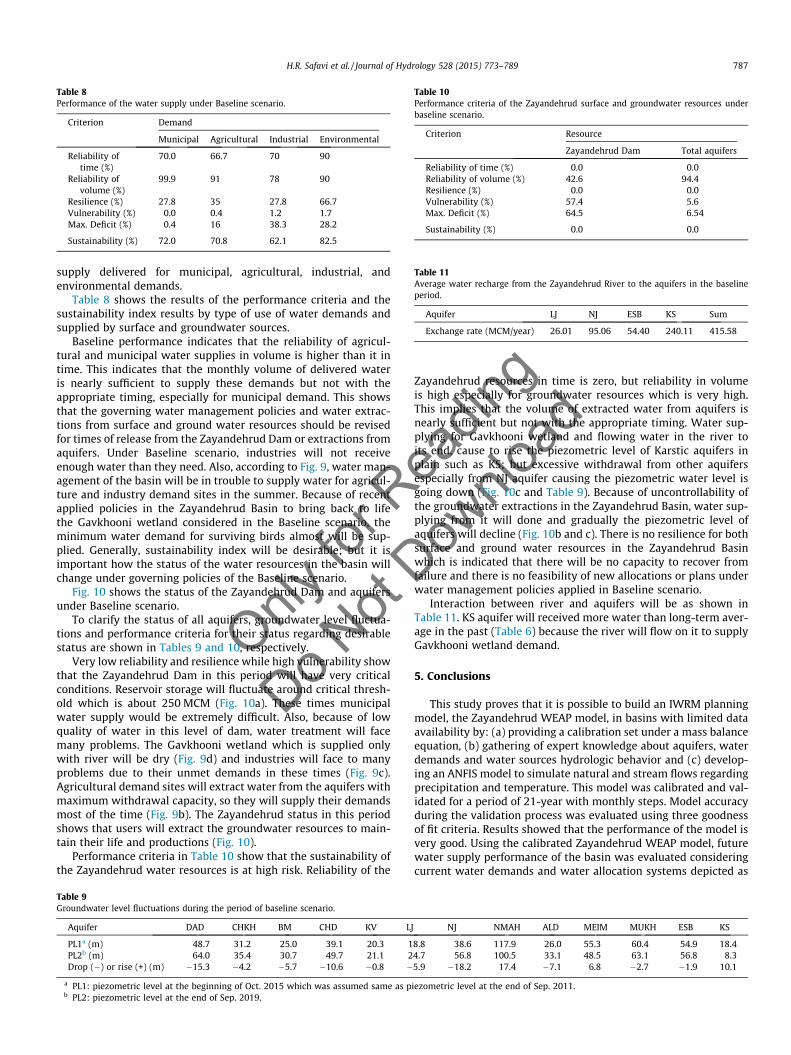
Table 8Performance of the water supply under Baseline scenario.
Criterion Demand
Municipal Agricultural Industrial Environmental
Reliability oftime (%)
70.0 66.7 70 90
Reliability ofvolume (%)
99.9 91 78 90
Resilience (%) 27.8 35 27.8 66.7Vulnerability (%) 0.0 0.4 1.2 1.7Max. Deficit (%) 0.4 16 38.3 28.2
Sustainability (%) 72.0 70.8 62.1 82.5
Table 10Performance criteria of the Zayandehrud surface and groundwater resources underbaseline scenario.
Criterion Resource
Zayandehrud Dam Total aquifers
Reliability of time (%) 0.0 0.0Reliability of volume (%) 42.6 94.4Resilience (%) 0.0 0.0Vulnerability (%) 57.4 5.6Max. Deficit (%) 64.5 6.54
Sustainability (%) 0.0 0.0
Table 11Average water recharge from the Zayandehrud River to the aquifers in the baselineperiod.
Aquifer LJ NJ ESB KS Sum
Exchange rate (MCM/year) 26.01 95.06 54.40 240.11 415.58
H.R. Safavi et al. / Journal of Hydrology 528 (2015) 773–789 787
Only
for R
Do Not
supply delivered for municipal, agricultural, industrial, andenvironmental demands.
Table 8 shows the results of the performance criteria and thesustainability index results by type of use of water demands andsupplied by surface and groundwater sources.
Baseline performance indicates that the reliability of agricul-tural and municipal water supplies in volume is higher than it intime. This indicates that the monthly volume of delivered wateris nearly sufficient to supply these demands but not with theappropriate timing, especially for municipal demand. This showsthat the governing water management policies and water extrac-tions from surface and ground water resources should be revisedfor times of release from the Zayandehrud Dam or extractions fromaquifers. Under Baseline scenario, industries will not receiveenough water than they need. Also, according to Fig. 9, water man-agement of the basin will be in trouble to supply water for agricul-ture and industry demand sites in the summer. Because of recentapplied policies in the Zayandehrud Basin to bring back to lifethe Gavkhooni wetland considered in the Baseline scenario, theminimum water demand for surviving birds almost will be sup-plied. Generally, sustainability index will be desirable; but it isimportant how the status of the water resources in the basin willchange under governing policies of the Baseline scenario.
Fig. 10 shows the status of the Zayandehrud Dam and aquifersunder Baseline scenario.
To clarify the status of all aquifers, groundwater level fluctua-tions and performance criteria for their status regarding desirablestatus are shown in Tables 9 and 10, respectively.
Very low reliability and resilience while high vulnerability showthat the Zayandehrud Dam in this period will have very criticalconditions. Reservoir storage will fluctuate around critical thresh-old which is about 250 MCM (Fig. 10a). These times municipalwater supply would be extremely difficult. Also, because of lowquality of water in this level of dam, water treatment will facemany problems. The Gavkhooni wetland which is supplied onlywith river will be dry (Fig. 9d) and industries will face to manyproblems due to their unmet demands in these times (Fig. 9c).Agricultural demand sites will extract water from the aquifers withmaximum withdrawal capacity, so they will supply their demandsmost of the time (Fig. 9b). The Zayandehrud status in this periodshows that users will extract the groundwater resources to main-tain their life and productions (Fig. 10).
Performance criteria in Table 10 show that the sustainability ofthe Zayandehrud water resources is at high risk. Reliability of the
Table 9Groundwater level fluctuations during the period of baseline scenario.
Aquifer DAD CHKH BM CHD KV LJ
PL1a (m) 48.7 31.2 25.0 39.1 20.3 1PL2b (m) 64.0 35.4 30.7 49.7 21.1 2Drop (�) or rise (+) (m) �15.3 �4.2 �5.7 �10.6 �0.8 �
a PL1: piezometric level at the beginning of Oct. 2015 which was assumed same as pb PL2: piezometric level at the end of Sep. 2019.
eadin
g
Downlo
adZayandehrud resources in time is zero, but reliability in volumeis high especially for groundwater resources which is very high.This implies that the volume of extracted water from aquifers isnearly sufficient but not with the appropriate timing. Water sup-plying for Gavkhooni wetland and flowing water in the river toits end, cause to rise the piezometric level of Karstic aquifers inplain such as KS; but excessive withdrawal from other aquifersespecially from NJ aquifer causing the piezometric water level isgoing down (Fig. 10c and Table 9). Because of uncontrollability ofthe groundwater extractions in the Zayandehrud Basin, water sup-plying from it will done and gradually the piezometric level ofaquifers will decline (Fig. 10b and c). There is no resilience for bothsurface and ground water resources in the Zayandehrud Basinwhich is indicated that there will be no capacity to recover fromfailure and there is no feasibility of new allocations or plans underwater management policies applied in Baseline scenario.
Interaction between river and aquifers will be as shown inTable 11. KS aquifer will received more water than long-term aver-age in the past (Table 6) because the river will flow on it to supplyGavkhooni wetland demand.
5. Conclusions
This study proves that it is possible to build an IWRM planningmodel, the Zayandehrud WEAP model, in basins with limited dataavailability by: (a) providing a calibration set under a mass balanceequation, (b) gathering of expert knowledge about aquifers, waterdemands and water sources hydrologic behavior and (c) develop-ing an ANFIS model to simulate natural and stream flows regardingprecipitation and temperature. This model was calibrated and val-idated for a period of 21-year with monthly steps. Model accuracyduring the validation process was evaluated using three goodnessof fit criteria. Results showed that the performance of the model isvery good. Using the calibrated Zayandehrud WEAP model, futurewater supply performance of the basin was evaluated consideringcurrent water demands and water allocation systems depicted as
NJ NMAH ALD MEIM MUKH ESB KS
8.8 38.6 117.9 26.0 55.3 60.4 54.9 18.44.7 56.8 100.5 33.1 48.5 63.1 56.8 8.35.9 �18.2 17.4 �7.1 6.8 �2.7 �1.9 10.1
iezometric level at the end of Sep. 2011.
R
788 H.R. Safavi et al. / Journal of Hydrology 528 (2015) 773–789
r
Baseline scenario. The baseline scenario considers continuing cur-rent water management under climate change conditions in thebasin before implementing any new policy. Results from the base-line scenario were evaluated using five performance criteria: relia-bility (time and volumetric), resilience, vulnerability, maximumdeficit. One index was used to summarize the results, the waterresources sustainability index. The aforementioned metrics wereestimated for water demands and water sources. Results showedthat all demands almost will be supplied under this scenario whilesurface and ground water resources would be in critical conditions.In other words, water management in the Zayandehrud Basin isbased on supplying water demands at the expense of loss of waterresources. Under baseline scenario, although the sustainability ofwater demands will be desirable but water resources will be thor-oughly unsustainable. Analyzing the future status under baselinescenario implies that future studies to apply IWRM in theZayandehrud Basin should be emphasized on scenarios which bedeveloped based on: (i) demand management especially fordomestic and agricultural demands, (ii) controlling water extrac-tions from aquifers, (iii) reducing pressure on groundwaterresources, (iv) setting appropriate times to water supply especiallyfor groundwater resources and agricultural and municipaldemands, (v) studying water transfer from other basins, (vi) chang-ing the method of irrigation from flooding to pressurized systems,(vii) optimizing standard operational policy (SOP) and rule curve ofthe Zayandehrud Dam to improve its performance. Developing thehydrologic model, linking a distributed groundwater model to theZayandehrud WEAP model and assessing socio-economic parame-ters are suggested for future studies in the basin. In future research,the authors will introduce three scenarios for IWRM for this basinusing the Zayandehrud WEAP model explained in this documentand evaluate the sustainability of each scenario and compared withbaseline scenario that presented at this paper.
ot
Only f
Do No
Acknowledgments
This paper was written behind of PhD thesis of second authorwho worked on the Zayandehrud WEAP model during his stay atthe University of California, Davis (UCD) as a visiting scholar. Thesecond author would like to thank the Iran’s Ministry of Science,Research and Technology (MSRT) and Isfahan University ofTechnology (IUT), for their financial support throughout his stayat UCD. We would like to express our endless gratitude to Prof.Abbas Afshar for his wisdom and guidance. Special thanks to theexperts of Isfahan Regional Water Company especially Mr. Aslani,Mr. Asadi, Mr. Kazemi, and Mr. Dorri who shared their knowledge,data and information regarding the Zayandehrud Basin.
References
Akrami, S.A., El-Shafie, A., Jaafar, O., 2013. Improving rainfall forecasting efficiencyusing Modified Adaptive Neuro-Fuzzy Inference System (MANFIS). WaterResour. Manage. 27 (9), 3803–3823.
Ako, A.A., Eyong, G.E.T., Nkeng, G.E., 2010. Water resources management andintegrated water resources management (IWRM) in Cameroon. Water Resour.Manage. 24 (5), 871–888.
Asefa, T., Clayton, J., Adams, A., Anderson, D., 2014. Performance evaluation of awater resources system under varying climatic conditions: reliability,resilience, vulnerability and beyond. J. Hydrol. 508, 53–65.
Assata, H., Van Beek, E., Borden, C., Gijsbers, P., Jolma, A., Kaden, S., Wood, D.M.,2008. Generic Simulation Models for Facilitating Stakeholder Involvement inWater Resources Planning and Management: A Comparison, Evaluation, andIdentification of Future Needs. University of Nebraska, Lincoln, US Departmentof Energy Publications.
Arranz, R., McCartney, M.P., 2007. Application of the Water Evaluation and Planning(WEAP) Model to Assess Future Water Demands and Resources in the OlifantsCatchment, South Africa, vol. 116. IWMI.
Cai, X., 1999. A Modeling Framework for Sustainable Water Resources Management.Ph.D. Dissertation, University of Texas at Austin, Austin, TX.
eadin
g
Dow
nload
Cai, X., Ringler, C., Rosegrant, M.W., 2006. Modeling Water Resources Managementat the Basin Level: Methodology and Application to the Maipo River Basin, vol.149. Intl Food Policy Res Inst..
Chau, K.W., 2007. An ontology-based knowledge management system for flow andwater quality modeling. Adv. Eng. Softw. 38 (3), 172–181.
Chen, W., Chau, K.W., 2006. Intelligent manipulation and calibration of parametersfor hydrological models. Int. J. Environ. Pollut. 28 (3), 432–447.
Cheng, C., Chau, K.W., Sun, Y., Lin, J., 2005. Long-term prediction of discharges inManwan Reservoir using artificial neural network models. Lect. Notes Comput.Sci. 3498, 1040–1045.
Coelho, A.C., Labadie, J.W., Fontane, D.G., 2012. Multicriteria decision supportsystem for regionalization of integrated water resources management. WaterResour. Manage. 26 (5), 1325–1346.
Coelho Maran, A.C., 2010. Multicriteria Decision Support System to Delineate WaterResources Planning and Management Regions. Colorado State University.
Danner, C.L., McKinney, D.C., Teasley, R.L., Sandoval-Solis, S., 2006. Documentationand Testing of the WEAP Model for the Rio Grande/Bravo Basin, Center forResearch in Water Resources. Online Report 2006. Revised May 2008.
Davies, E.G., Simonovic, S.P., 2011. Global water resources modeling with anintegrated model of the social–economic–environmental system. Adv. WaterResour. 34 (6), 684–700.
Dawadi, S., Ahmad, S., 2012. Changing climatic conditions in the Colorado RiverBasin: implications for water resources management. J. Hydrol. 430, 127–141.
Dawson, C.W., Wilby, R.L., 2001. Hydrological modelling using artificial neuralnetworks. Prog. Phys. Geogr. 25 (1), 80–108.
Dong, C., Schoups, G., van de Giesen, N., 2013. Scenario development for waterresource planning and management: a review. Technol. Forecast. Soc. Chang. 80(4), 749–761.
Dukhovny, V.A., 2004. Governance and IWRM. In: Proceedings of the AWRAConference, Dundee, UK.
Dukhovny, V., Sokolov, V., 2005. Integrated Water Resources Management,Experience, and Lessons Learned from Central Asia-towards the Fourth WorldWater Forum. Inter-State Commission for Water Coordination in the Aral SeaBasin, Tashkent.
Gaiser, T., Printz, A., von Raumer, H.G., Götzinger, J., Dukhovny, V.A., Barthel, R.,Stahr, K., 2008. Development of a regional model for integrated management ofwater resources at the basin scale. Phys. Chem. Earth A/B/C 33 (1), 175–182.
Georgakakos, A.P., Yao, H., Kistenmacher, M., Georgakakos, K.P., Graham, N.E.,Cheng, F.Y., Shamir, E., 2012. Value of adaptive water resources management inNorthern California under climatic variability and change: reservoirmanagement. J. Hydrol. 412, 34–46.
Gieske, A., Miranzadeh, M., 2000. Groundwater Resource Modeling of the LenjanatAquifer System. IAERI-IWMI Research Reports No. 15.
Glantz, Stanton, A., Slinker, B.K., 1990. Primer of Applied Regression and Analysis ofVariance. McGraw-Hill.
Gohari, A., Eslamian, S., Abedi-Koupaei, J., Massah Bavani, A., Wang, D., Madani, K.,2013a. Climate change impacts on crop production in Iran’s Zayandehrood RiverBasin. Sci. Total Environ. 442, 405–419.
Gohari, A., Eslamian, S., Mirchi, A., Abedi-Koupaei, J., Massah Bavani, A., Madani, K.,2013b. Water transfer as a solution to water shortage: a fix that can backfire. J.Hydrol. 491, 23–39.
Hagan, I.S.A.A.C., 2007. Modeling the impact of small reservoirs in the upper eastregion of Ghana. Examensarete TVVR 7, 5008.
Hashimoto, T., Stedinger, J.R., Loucks, D.P., 1982. Reliability, resiliency andvulnerability criteria for water resources system performance evaluation.Water Resour. Res. 10 (1), 14–20.
Henseler, M., Wirsig, A., Herrmann, S., Krimly, T., Dabbert, S., 2009. Modeling theimpact of global change on regional agricultural land use through an activity-based non-linear programming approach. Agric. Syst. 100 (1), 31–42.
Henseler, M., Wirsig, A., Krimly, T., 2005. Introduction of ACRE: an agro-economicproduction model on regional level. In: International Conference on PolicyModeling (EcoMod2005), Istanbul, Turkey.
IPCC, 2007. General Guidelines on the Use of Scenario Data for Climate Impact andAdaptation Assessment. Cambridge University Press, Cambridge and New York.
IWRM in Isfahan, 2014. Integrated Water Resource Management in Isfahan, Iran.Zayandehrud River Catchment Reports. <http://www.iwrm-isfahan.com>(retrieved 05.12.14).
IWRM in Isfahan, 2014. Agriculture Report. Isfahan Regional Water Board Company,Isfahan, Iran.
IWRM in Isfahan, 2014. Groundwater Report. Isfahan Regional Water BoardCompany, Isfahan, Iran.
IWRM in Isfahan, 2014. Industry Report. Isfahan Regional Water Board Company,Isfahan, Iran.
IWRM Toolbox, 2003. Sharing Knowledge for Equitable, Efficient and SustainableWater Resources Management. Version 2. GWP, 157p.
Jakeman, A.J., Chen, S.H., Rizzoli, A.E., Voinov, A.A., 2008. Chapter one modelling andsoftware as instruments for advancing sustainability. Develop. Integr. Environ.Assess. 3, 1–13.
Jang, J.S.R., 1993. ANFIS: adaptive network based fuzzy inference system. IEEETrans. Syst. Man Cybernet. 23 (3), 665–683.
Jang, J.S.R., Sun, C.T., 1995. Neuro-fuzzy modeling and control. Proc. IEEE 83 (3),378–406.
Jang, J.S.R., Sun, C.T., Mizutani, E., 1997. Neuro-fuzzy and Soft Computing. PrenticeHall, Englewood Cliffs.
Katsiardi, P., 2005. Scenario-based strategy development for integrated waterresource management. Glob. NEST 7 (3), 360–368.
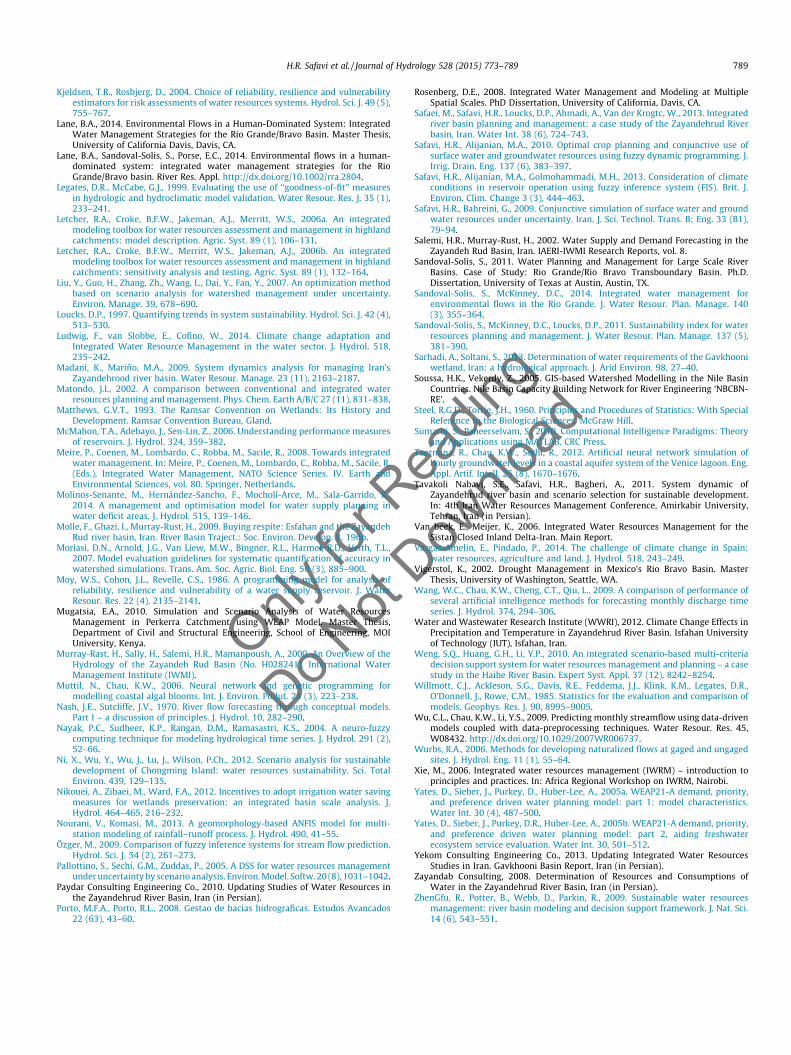
H.R. Safavi et al. / Journal of Hydrology 528 (2015) 773–789 789
Only
for R
Do Not
Kjeldsen, T.R., Rosbjerg, D., 2004. Choice of reliability, resilience and vulnerabilityestimators for risk assessments of water resources systems. Hydrol. Sci. J. 49 (5),755–767.
Lane, B.A., 2014. Environmental Flows in a Human-Dominated System: IntegratedWater Management Strategies for the Rio Grande/Bravo Basin. Master Thesis,University of California Davis, Davis, CA.
Lane, B.A., Sandoval-Solis, S., Porse, E.C., 2014. Environmental flows in a human-dominated system: integrated water management strategies for the RioGrande/Bravo basin. River Res. Appl. http://dx.doi.org/10.1002/rra.2804.
Legates, D.R., McCabe, G.J., 1999. Evaluating the use of ‘‘goodness-of-fit’’ measuresin hydrologic and hydroclimatic model validation. Water Resour. Res. J. 35 (1),233–241.
Letcher, R.A., Croke, B.F.W., Jakeman, A.J., Merritt, W.S., 2006a. An integratedmodeling toolbox for water resources assessment and management in highlandcatchments: model description. Agric. Syst. 89 (1), 106–131.
Letcher, R.A., Croke, B.F.W., Merritt, W.S., Jakeman, A.J., 2006b. An integratedmodeling toolbox for water resources assessment and management in highlandcatchments: sensitivity analysis and testing. Agric. Syst. 89 (1), 132–164.
Liu, Y., Guo, H., Zhang, Zh., Wang, L., Dai, Y., Fan, Y., 2007. An optimization methodbased on scenario analysis for watershed management under uncertainty.Environ. Manage. 39, 678–690.
Loucks, D.P., 1997. Quantifying trends in system sustainability. Hydrol. Sci. J. 42 (4),513–530.
Ludwig, F., van Slobbe, E., Cofino, W., 2014. Climate change adaptation andIntegrated Water Resource Management in the water sector. J. Hydrol. 518,235–242.
Madani, K., Mariño, M.A., 2009. System dynamics analysis for managing Iran’sZayandehrood river basin. Water Resour. Manage. 23 (11), 2163–2187.
Matondo, J.I., 2002. A comparison between conventional and integrated waterresources planning and management. Phys. Chem. Earth A/B/C 27 (11), 831–838.
Matthews, G.V.T., 1993. The Ramsar Convention on Wetlands: Its History andDevelopment. Ramsar Convention Bureau, Gland.
McMahon, T.A., Adebayo, J., Sen-Lin, Z., 2006. Understanding performance measuresof reservoirs. J. Hydrol. 324, 359–382.
Meire, P., Coenen, M., Lombardo, C., Robba, M., Sacile, R., 2008. Towards integratedwater management. In: Meire, P., Coenen, M., Lombardo, C., Robba, M., Sacile, R.(Eds.), Integrated Water Management, NATO Science Series. IV. Earth andEnvironmental Sciences, vol. 80. Springer, Netherlands.
Molinos-Senante, M., Hernández-Sancho, F., Mocholí-Arce, M., Sala-Garrido, R.,2014. A management and optimisation model for water supply planning inwater deficit areas. J. Hydrol. 515, 139–146.
Molle, F., Ghazi, I., Murray-Rust, H., 2009. Buying respite: Esfahan and the ZayandehRud river basin, Iran. River Basin Traject.: Soc. Environ. Develop. 8, 196p.
Moriasi, D.N., Arnold, J.G., Van Liew, M.W., Bingner, R.L., Harmel, R.D., Veith, T.L.,2007. Model evaluation guidelines for systematic quantification of accuracy inwatershed simulations. Trans. Am. Soc. Agric. Biol. Eng. 50 (3), 885–900.
Moy, W.S., Cohon, J.L., Revelle, C.S., 1986. A programming model for analysis ofreliability, resilience and vulnerability of a water supply reservoir. J. WaterResour. Res. 22 (4), 2135–2141.
Mugatsia, E.A., 2010. Simulation and Scenario Analysis of Water ResourcesManagement in Perkerra Catchment using WEAP Model. Master Thesis,Department of Civil and Structural Engineering, School of Engineering, MOIUniversity, Kenya.
Murray-Rast, H., Sally, H., Salemi, H.R., Mamanpoush, A., 2000. An Overview of theHydrology of the Zayandeh Rud Basin (No. H028241). International WaterManagement Institute (IWMI).
Muttil, N., Chau, K.W., 2006. Neural network and genetic programming formodelling coastal algal blooms. Int. J. Environ. Pollut. 28 (3), 223–238.
Nash, J.E., Sutcliffe, J.V., 1970. River flow forecasting through conceptual models.Part I – a discussion of principles. J. Hydrol. 10, 282–290.
Nayak, P.C., Sudheer, K.P., Rangan, D.M., Ramasastri, K.S., 2004. A neuro-fuzzycomputing technique for modeling hydrological time series. J. Hydrol. 291 (2),52–66.
Ni, X., Wu, Y., Wu, J., Lu, J., Wilson, P.Ch., 2012. Scenario analysis for sustainabledevelopment of Chongming Island: water resources sustainability. Sci. TotalEnviron. 439, 129–135.
Nikouei, A., Zibaei, M., Ward, F.A., 2012. Incentives to adopt irrigation water savingmeasures for wetlands preservation: an integrated basin scale analysis. J.Hydrol. 464–465, 216–232.
Nourani, V., Komasi, M., 2013. A geomorphology-based ANFIS model for multi-station modeling of rainfall–runoff process. J. Hydrol. 490, 41–55.
Özger, M., 2009. Comparison of fuzzy inference systems for stream flow prediction.Hydrol. Sci. J. 54 (2), 261–273.
Pallottino, S., Sechi, G.M., Zuddas, P., 2005. A DSS for water resources managementunder uncertainty by scenario analysis. Environ. Model. Softw. 20 (8), 1031–1042.
Paydar Consulting Engineering Co., 2010. Updating Studies of Water Resources inthe Zayandehrud River Basin, Iran (in Persian).
Porto, M.F.A., Porto, R.L., 2008. Gestao de bacias hidrograficas. Estudos Avancados22 (63), 43–60.
eadin
g
Downlo
ad
Rosenberg, D.E., 2008. Integrated Water Management and Modeling at MultipleSpatial Scales. PhD Dissertation, University of California, Davis, CA.
Safaei, M., Safavi, H.R., Loucks, D.P., Ahmadi, A., Van der Krogtc, W., 2013. Integratedriver basin planning and management: a case study of the Zayandehrud Riverbasin, Iran. Water Int. 38 (6), 724–743.
Safavi, H.R., Alijanian, M.A., 2010. Optimal crop planning and conjunctive use ofsurface water and groundwater resources using fuzzy dynamic programming. J.Irrig. Drain. Eng. 137 (6), 383–397.
Safavi, H.R., Alijanian, M.A., Golmohammadi, M.H., 2013. Consideration of climateconditions in reservoir operation using fuzzy inference system (FIS). Brit. J.Environ. Clim. Change 3 (3), 444–463.
Safavi, H.R., Bahreini, G., 2009. Conjunctive simulation of surface water and groundwater resources under uncertainty. Iran. J. Sci. Technol. Trans. B; Eng. 33 (B1),79–94.
Salemi, H.R., Murray-Rust, H., 2002. Water Supply and Demand Forecasting in theZayandeh Rud Basin, Iran. IAERI-IWMI Research Reports, vol. 8.
Sandoval-Solis, S., 2011. Water Planning and Management for Large Scale RiverBasins. Case of Study: Rio Grande/Rio Bravo Transboundary Basin. Ph.D.Dissertation, University of Texas at Austin, Austin, TX.
Sandoval-Solis, S., McKinney, D.C., 2014. Integrated water management forenvironmental flows in the Rio Grande. J. Water Resour. Plan. Manage. 140(3), 355–364.
Sandoval-Solis, S., McKinney, D.C., Loucks, D.P., 2011. Sustainability index for waterresources planning and management. J. Water Resour. Plan. Manage. 137 (5),381–390.
Sarhadi, A., Soltani, S., 2013. Determination of water requirements of the Gavkhooniwetland, Iran: a hydrological approach. J. Arid Environ. 98, 27–40.
Soussa, H.K., Vekerdy, Z., 2005. GIS-based Watershed Modelling in the Nile BasinCountries. Nile Basin Capacity Building Network for River Engineering ‘NBCBN-RE’.
Steel, R.G.D., Torrie, J.H., 1960. Principles and Procedures of Statistics: With SpecialReference to the Biological Sciences. McGraw Hill.
Sumathi, S., Paneerselvam, S., 2010. Computational Intelligence Paradigms: Theoryand Applications using MATLAB. CRC Press.
Taormina, R., Chau, K.W., Sethi, R., 2012. Artificial neural network simulation ofhourly groundwater levels in a coastal aquifer system of the Venice lagoon. Eng.Appl. Artif. Intell. 25 (8), 1670–1676.
Tavakoli Nabavi, S.E., Safavi, H.R., Bagheri, A., 2011. System dynamic ofZayandehrud river basin and scenario selection for sustainable development.In: 4th Iran Water Resources Management Conference, Amirkabir University,Tehran, Iran (in Persian).
Van beek, E., Meijer, K., 2006. Integrated Water Resources Management for theSistan Closed Inland Delta-Iran. Main Report.
Vargas-Amelin, E., Pindado, P., 2014. The challenge of climate change in Spain:water resources, agriculture and land. J. Hydrol. 518, 243–249.
Vigerstol, K., 2002. Drought Management in Mexico’s Rio Bravo Basin. MasterThesis, University of Washington, Seattle, WA.
Wang, W.C., Chau, K.W., Cheng, C.T., Qiu, L., 2009. A comparison of performance ofseveral artificial intelligence methods for forecasting monthly discharge timeseries. J. Hydrol. 374, 294–306.
Water and Wastewater Research Institute (WWRI), 2012. Climate Change Effects inPrecipitation and Temperature in Zayandehrud River Basin. Isfahan Universityof Technology (IUT), Isfahan, Iran.
Weng, S.Q., Huang, G.H., Li, Y.P., 2010. An integrated scenario-based multi-criteriadecision support system for water resources management and planning – a casestudy in the Haihe River Basin. Expert Syst. Appl. 37 (12), 8242–8254.
Willmott, C.J., Ackleson, S.G., Davis, R.E., Feddema, J.J., Klink, K.M., Legates, D.R.,O’Donnell, J., Rowe, C.M., 1985. Statistics for the evaluation and comparison ofmodels. Geophys. Res. J. 90, 8995–9005.
Wu, C.L., Chau, K.W., Li, Y.S., 2009. Predicting monthly streamflow using data-drivenmodels coupled with data-preprocessing techniques. Water Resour. Res. 45,W08432. http://dx.doi.org/10.1029/2007WR006737.
Wurbs, R.A., 2006. Methods for developing naturalized flows at gaged and ungagedsites. J. Hydrol. Eng. 11 (1), 55–64.
Xie, M., 2006. Integrated water resources management (IWRM) – introduction toprinciples and practices. In: Africa Regional Workshop on IWRM, Nairobi.
Yates, D., Sieber, J., Purkey, D., Huber-Lee, A., 2005a. WEAP21-A demand, priority,and preference driven water planning model: part 1: model characteristics.Water Int. 30 (4), 487–500.
Yates, D., Sieber, J., Purkey, D.R., Huber-Lee, A., 2005b. WEAP21-A demand, priority,and preference driven water planning model: part 2, aiding freshwaterecosystem service evaluation. Water Int. 30, 501–512.
Yekom Consulting Engineering Co., 2013. Updating Integrated Water ResourcesStudies in Iran. Gavkhooni Basin Report, Iran (in Persian).
Zayandab Consulting, 2008. Determination of Resources and Consumptions ofWater in the Zayandehrud River Basin, Iran (in Persian).
ZhenGfu, R., Potter, B., Webb, D., Parkin, R., 2009. Sustainable water resourcesmanagement: river basin modeling and decision support framework. J. Nat. Sci.14 (6), 543–551.


![Assata: An autobiography by Assata Shakur [BOOK] - …libcom.org/files/assataauto.pdf · Assata (Shakur), An Autobiography Digitalized by RevSocialist for SocialistStories. Author:](https://img.dokumen.tips/doc/110x75/5a7011ea7f8b9a9d538b9bb2/assata-an-autobiography-by-assata-shakur-book-libcomorgfilesassataautopdfpdf.jpg)