Embed Size (px)
Citation preview


Journal of Economic and Social Development (JESD), Vol. 4, No. 1, March2017
Selected Papers from: 19th International Scientific Conference on Economic and Social Development- Melbourne, Australia
February 9-10, 2017
18th International Scientific Conference on Economic and Social Development - "Building Resilient Society" – Zagreb, Croatia
December 9-10, 2016
17th International Scientific Conference on Economic and Social Development - "Managerial Issues in Modern Business" -Warsaw, Poland
October 20-12, 2016
Editor Marijan Cingula, University of Zagreb, Faculty of Economics and Business, Zagreb, Croatia
Co-editors
Fran Galetic, University of Zagreb, Faculty of Economics and Business, Zagreb, Croatia Goran Kozina, University North, Koprivnica, Croatia
Marina Klacmer Calopa, University of Zagreb, Faculty of Organization and Informatics, Varazdin, Croatia
Members of the International Editorial Boad Ayuba A. Aminu, University of Maiduguri, Department of Management, Faculty of Management Sciences, Maiduguri, Nigeria; Lidija Bagaric, University of Rijeka, Faculty of Tourism and Hospitality Management, Opatija, Croatia; Leonid K. Bobrov, Novosibirsk State University of Economics and Management, Novosibirsk, Russia; Marina Dabic, University of Zagreb, Faculty of Economics and Business, Zagreb, Croatia;Ivica Filipovic, University of Split, University Center for the Vocational Studies, Split, Croatia; Marli Gonan Bozac, Juraj Dobrila University of Pula, Faculty of Economics and Tourism, Pula; Miryam de la Concepción González-Rabanal, National Distance Education University (UNED), Faculty of Economics and Business Administration, Madrid, Spain; Anica Hunjet, University North, Croatia; Irena Jankovic, Belgrade University, Faculty of Economics, Belgrade, Serbia; Hacer Simay Karaalp, Pamukkale University, Faculty of Economics and Administraive Sciences, Denizli, Turkey; Dafna Kariv, School of Business Administration, Department of Strategy and Entrepreneurship - Center of Entrepreneurship, Rishon Lezion, Israel; Kaarel Kilvits, Tallinn University of Technology, School of Economics and Business, Tallinn, Estonia; Marina Klacmer Calopa, University of Zagreb, Faculty of Organization and Informatics, Varazdin, Croatia; Robert A. Lewis, Les Roches Gruyère University of Applied Sciences, Switzerland; Francesca Mandanici, University of L'Aquila, Coppito, L’Aquila, Italia; Marjana Merkac Skok, Faculty of Commercial and Business Sciences, Celje, Slovenia; Marin Milkovic, University North, Croatia; Claudia Ogrean, Lucian Blaga University of Sibiu, Sibiu, Romania; Mislav Ante Omazić, University of Zagreb, Faculty of Economics and Business, Zagreb, Croatia, Nikolai Ostapenko, University of the District of Columbia, Washington, D.C.,USA; Ivan Pavic,University of Split, Faculty of Economics, Split, Croatia; Vojko Potocan, University of Maribor, Faculty of Economics and Business, Maribor, Slovenia; Kerry J. Redican, Virginia Tech University, Department of Population Health Sciences, Blacksburg, Virginia, USA; Souhaila Abdullah Saieed, Al Zaytoonah University, Amman, Jordan; Armando Javier Sánchez Díaz, University of Sinaloa, Sinaloa, Mexico; Olga Sirotina, Novosibirsk State University of Economics and Management, Novosibirsk, Russia; Aziz Sunje, School of Economics and Business, University of Sarajevo, Sarajevo, Bosnia and Herzegovina; Darko Tipuric,University of Zagreb, Faculty of Economics and Business, Zagreb, Croatia
Journal of Economic and Social Development (JESD) publishes scientific papers in the field of Economics and Social Development. The Journal is published two times a year.Online journalis open access and peer-reviewed. Authors are responible for the linguistic and technical accuracy of their contributions. Indexing/abstracting: Journal is regularly indexed and abstracted by ProQuest, DOAJ, ERIH PLUS, ECONBIZ, DRJI, SIS, Citefactor, J-Gate, Hrcak, ResearchBib, OCLC WorldCat, EZB, WCOSJ, ROAD, DAIJ, WZB and Kubon & Sagner databases. It is available in a PDF format from the Journal of Economic and Social Developmentwebsite: http://www.jesd-online.com Publisher: Varazdin Development and Entrepreneurship Agency, Mihanoviceva 4, Varazdin, Croatia Co-publisher: University North, Koprivnica, Croatia © Varazdin Development and Entrepreneurship Agency, Varazdin, Croatia. All rights reserved. ISSN 1849-3327 (online version), 1849-6628 (print version) UDC 33:316


EDITORIAL
Entering the fourth year of regular existence, our Journal of Economic and
Social Development, brings to the audience selected papers from three
different conferences: the 17th International Scientific Conference on
Economic and Social Development - "Managerial Issues in Modern
Business", Warsaw 20-21 October 2016, the 18th International Scientific
Conference on Economic and Social Development - "Building Resilient
Society", Zagreb 9-10 December 2016 and the 19th International Scientific
Conference on Economic and Social Development – Melbourne 9-10
February 2017. From total of 172 papers, the best 8 papers are selected
for this edition. We are happy that our authors keep tradition of cultural
and social varieties with emphasis on ethical behavior in business
activities. And finally, we are proud that our conferences were supported
by distinguish co-organizers: University North (Croatia), Victoria
University, Melbourne (Australia) and Faculty of ManagementUniversity of
Warsaw (Poland).
Marijan Cingula
Editor

1 Journal of Economic and Social Development – Vol 4. No 1., March 2017
TABLE OF CONTENTS
Benjamin L. Britton, David G. AtkinsonAN INVESTIGATION INTO THE
SIGNIFICANT IMPACTS OF AUTOMATION IN ASSET MANAGEMENT ....................... 2
Samar K. Mukhopadhyay, Guangliang YeEFFECT OF CSR ON PRODUCT
DIFFERENTIATION IN THE PRESENCE OF COST ADVANTAGE ................................. 15
Filip Kokotovic, Petar KurecicTHE CASE OF BREXIT: AN ANALYSIS OF THE
POLITICAL AND ECONOMIC FACTORS ............................................................................. 28
Zdravko Sergo, Grzinic JasminaEXPLORING INTERNATIONAL TOURISM TRENDS
IN THE MEDITERRANEAN: CONVERGENCE OR BIG DIVERGENCE.......................... 40
Marina Malkina ASSESSMENT OF INTER-REGIONAL CONVERGENCE IN THE
SOCIAL WELFARE BASED ON THE A. SEN FUNCTION: RUSSIAN CASE STUDY... 52
Katarina Rentkova DEVELOPMENT OF REGIONS AND MUNICIPALITIES OF THE
SLOVAK REPUBLIC BY APPLICATION OF EUROPEAN COHESION POLICY ........... 63
Anona F. Armstrong, Ronald D. Francis, Heath S. GrowETHICAL ISSUES IN THE
EMPLOYMENT OF EXPATRIATE LEADERS IN CORPORATIONS ................................ 73
Meghna Thapar, Arjun SharmaCORPORATE GOVERNANCE IN INDIA: AN
ANALYSIS ................................................................................................................................... 84

2
AN INVESTIGATION INTO THE SIGNIFICANT IMPACTS
OF AUTOMATION IN ASSET MANAGEMENT
AN INVESTIGATION INTO THE SIGNIFICANT IMPACTS OF AUTOMATION IN ASSET MANAGEMENT
Benjamin L. Britton
Pearson Business School, 80 Strand, London, Great Britain, WC2R 0RL, UK [email protected]
David G. Atkinson
Pearson Business School, 80 Strand, London, Great Britain, WC2R 0RL, UK
ABSTRACT This paper explores the implications of applying automation, a technological force in which computer systems can fulfill human tasks, into the asset management industry. The investigation explores a number of significant topics in which managers should begin contemplating, including workforce origination post automation, the primary skills necessary to facilitate augmentation, and how robo advisors could challenge an organization’s value proposition. The investigation was centered on Jupiter Asset Management (JAM) to support their preparations for automation, as well as to provide insight from the ‘grass roots’. Research centered on interviews with experienced individuals within automative and asset management. The findings identify that current entry level occupations with systematic, repetitive tasks in a fixed domain, will be automated. Placing a greater demand for analytical abilities in junior recruits as the cognitive understanding of what data represents is a weakness of artificial intelligence (AI) thus strengthening augmentation between employees and technology. Automated investment profilers known as robo advisors will challenge the value proposition of organizations, such as JAM, which in time will need to be onboard with the technology to remain competitive within a growing millennial market. The paper concludes that there is an evident need for asset management firms to design training processes that blend enhanced senior level shadowing, with programmes focused on broadening juniors’ abilities to interpret and apply AI generated data through a series of newly identified skills. Keywords: Asset Management, JAM
1. INTRODUCTION AND RESEARCH OBJECTIVES The asset management industry presides over the strategic investment of wealth, by attempting to increase deposit values whilst additionally mitigating investment risks through the comprehensive identification of market trends, rigorous analysis of multifaceted data,

3 Journal of Economic and Social Development – Vol 4. No 1., March 2017
and logical process of informed decision making. Facilitated through a firm’s dedicated ‘portfolio managers’ these services are typically offered to high net-worth individuals, or institutions such as pension funds, sovereign wealth funds or other corporations (WallStreetOasis.com, 2015). The industry’s presence within international financial affairs is exceedingly pronounced, consequently elevating its economic importance. In 2013 the worldwide value of assets under management were estimated at $87 trillion (approximately one year’s global GDP), with PwC forecasting this to escalate to $100 trillion by 2020 (Bank of England, 2013). As a result of this predicted monetary value growth, it’s fiscally important to the intercontinental economy to prevent instability and nurture growth of the industry. It has become ever more apparent in the 21st century that technological innovations will be a pressing managerial issue, in contending with this paradigm across many industries. A critical manifestation, and yet challenging innovative technology, that effective managers should take note of is the notion of automation. Automation is part of a wider Artificial Intelligence (AI) umbrella, which can be defined as “the theory and development of computer systems able to perform tasks that normally require human intelligence” (Deloitte, 2016). It takes numerous forms such as Robotic Process Automation (RPA), which formulates reasoning through pattern recognition of large quantities of data. Furthermore there is ‘autonomics’, where systems are able to complete routine tasks by interfacing with existing applications to process transactions and responses faster than a human (Deloitte, 2016). When discussing the ramifications of automation, it is typical to find individuals focusing on the impact upon manufacturing and other blue collar workflows. However, automative technologies vary and can be implemented into a wide scope of organisational processes. It is thus beginning to transpire that automation can be systematically deployed into professional white collar streams as well. For example, RPA has been brought into service by global wealth advisors, UBS, in what is called the SQREEM (Sequential Quantum Reduction and Extraction Model). This delivers customised guidance for their wealthiest clients, by aligning an individual’s specific investment preferences to the most suitable financial product, thus substantiating a methodology of how automation could replace some white collar operatives in the bank (Vögeli, 2014). Although the economic and technological importance of automation has been well documented within blue collar processes, little research has yet emerged which considers the organisational opportunities, including refined decision making, reduced costs and improved innovation (Deloitte, 2016), and problems such as employee displacement (Bessen, 2016), which potentially may exist when applying the technology to the white collar sector. As a result, this paper contributes to the literature by investigating automation within the asset management sector, centered on one of the most respectable wealth management firms known as Jupiter Asset Management (JAM). More specifically this paper contributes by serving as an industry based case study that academics and managers alike can reflect upon, in order to prepare themselves for the impacts of automation within the white collar sector.
2. SUMMARY OF LITERATURE THEMES According to Heathfield (2016) an entry level occupation facilitates an individual’s ability to penetrate an organisation’s workforce with relatively minor experience. White collar organisations, such as JAM, will typically require these persons to have undertaken an undergraduate degree related to their respective industry before employment considerations are made. Entry level tasks are often centered around those which senior figures don’t wish or have time to complete. This crucially exposes a new entrant to a wide

4
AN INVESTIGATION INTO THE SIGNIFICANT IMPACTS
OF AUTOMATION IN ASSET MANAGEMENT
host of organisational processes, thereby facilitating a broad and multi-disciplined spectrum of talent development that benefits the employee and the host firm. However, according to Frey and Osborne (2013), a significant number of these entry level positions will be automated in the coming years. This is further supported by the World Economic Forum (2016) which forecasts a substantial decline in office and administrative job roles by 2020. Consequently, it is plausible to suggest that traditional entry level occupations may be in decline as a result of automation type innovations and technologies. This consequently provokes an emerging managerial issue surrounding the forward looking structure of the firms talent acquisition methods, and the integrity of its talent development process. In respect of the financial services industry, sizeable occupational growth will dramatically shift towards roles within computing and mathematics (World Economic Forum, 2016). I.T. roles in general are poised to dominate the top tier of entry level occupations moving forward across multiple industries (Dill, 2015). As a result of these circumstances, and the International Data Corporation’s prediction that organisational access to data will grow 50-fold over the next decade (Frey, 2014), it’s subsequently plausible that data analysis and interpretation roles will become the contemporary foundation of entry level occupation schemes within the wealth management sector, as opposed to data processing. This notion is supported by UKCES (2014) who, in respect of the business and finance profession, state analytical occupations in the future will be of upmost importance. With regards to the predicted displacement of entry level roles, as a result of automation, the academic literature generally fails to consider what entry level credentials should be regarded as essential in a post automation professional services world. In response to this, this paper proposes the B-PAP model (Britton’s Post-Automation Profiler). The B-PAP model helps outline the potential requirements (qualifications, experience or characteristics) for entry level employees when a high degree of roles, at lower levels in an organisation, are automated. The B-PAP model (Table 1) has been applied to JAM, the case study setting for this paper, in order to demonstrate its applicability.
Table following on the next page

5 Journal of Economic and Social Development – Vol 4. No 1., March 2017
Table 1: B-PAP Model for the Asset Management Industry
Industry Key Forward Looking Industry Needs for 2020
Asset Management • Enhanced interpretive capabilities to formulate deep market insights, thus building
a superior investment proposition for clients.
• Ability to formulate synergies between large amounts of data acquired by
advanced technological processes to find correlations and generate investment
opportunities.
• Improved operational efficiency driven by automative processes.
Job Level Typical Occupations of the Level & Industry for 2020
Entry • Business & Market Performance Analyst / Junior Data Analyst / Junior Programmer
/ Database & Networking Junior
- ENTRY LEVEL EMPLOYEES WILL THEREFORE REQUIRE -
Qualifications (one option) • BA in Finance & investment, as provided by Coventry University (2016).
• BSc in Data Science, as provided by The University of Warwick (2016).
• BSc in Software Engineering, as provided by De Montfort University Leicester
(2016).
Experience (multiple options) • Demonstrated financial prowess, by potentially making small investments in
publicly traded companies.
• Data analysis and arranging information into insightful arrays, by potentially using
data visualisation software.
• Programming, by potentially developing their own smartphone apps.
• System and process development, by potentially collaborating in the building and
or maintenance of servers.
Characteristics (all) • Inquisitive / Diligent / Analytical / Logical / Agile / Technologically astute.
For managers it is evident that convergence between their human employees and modern automated counterparts will be essential in creating synchronous and valuable workflows. To facilitate this contemporary method of operation, it is arguable that augmentation is the primary optimisation route as supported by Davenport (2015). Broadly speaking, augmentation encourages a collaboration between humans and machines in order to complement each other’s strengths, whilst compensating for each other’s weaknesses (Davenport and Kirby, 2015). The MIT Economist, Autor (2014), denounces commentators who repeatedly overemphasize the use of automation as a mechanism for success, stating the challenge of instituting a machine that possesses flexibility, judgement and common sense similar to a human is “immense”.With it apparent that machines do have some comparative disadvantages to humans, it is plausible that asset management organisations, like JAM, will need to re-configure its employees’ current key skills in order to remedy

6
AN INVESTIGATION INTO THE SIGNIFICANT IMPACTS
OF AUTOMATION IN ASSET MANAGEMENT
overarching computer weaknesses, thus designing a modern workforce that can facilitate vigorous augmentation. According to Gray (2016), the top skills needed by employees by 2020, in an era known as the AI driven Fourth Industrial Revolution, will largely focus on ‘creativity’ while ‘quality control’ could be potentially removed. Therefore, it is evident that in order to establish affluent automation, management will need to prioritise the enhancement of humanistic soft skills and social abilities in its employees, across a wide range of industries, rather than just hard technical skills such as programming. This notion is supported by the work of Davies et al. (2011), who also placed a significant emphasis on human interactive skills in their top ten future abilities needed of employees’ talents by 2020. Gray’s (2016) prediction on the top skills required of employee’s by 2020 is a good start yet it is non-industry specific. As a result, this paper builds on the work of Gray (2016) by considering the skills and abilities required of employees, for the asset management industry, within the AI driven Fourth Industrial Revolution. The Ten-ES Model (Table 2) is a conceptual application of the top skills thought to be required, in the emerging Fourth Industrial Revolution, for the asset management industry. The framework conceptually prioritizes the skills that may need to be obtained in order to allow organisations to fully capitalise on the introduction of automated entry level roles. In this paper’s theoretical prediction, the more humanistic soft skills have been placed within the higher rankings to compensate for AI’s lack of emotive understanding.
Table 2: Ten-ES Model for the Asset Management Industry
INDUSTRY: Asset Management
TARGET YEAR: 2020
Rank of
Importance
Skill Justification
1 (Most
Important)
Emotional Intelligence • Ability to understand the emotive needs of clients will be a key
differentiator to empower sales, and AI’s most prominent weakness.
2 Negotiation • Important in enabling portfolio managers to broker mutually favourable
terms for the firm and its client in an AI competitive market.
3 Co-ordinating with
Others
• Important to ensure each operation within the firm plays its part in
delivering the promised results.
4 Creativity • Empower humans to develop contemporary offerings and innovative uses
of AI as a competitive force.
5 People Management • Important to nurturing augmentation between humans and machines.
6 Service Orientation • Important to finding correlations in research data, which could lead to
profitable investments and value proposition growth.
7 Complex Problem Solving • Necessary to accomplish challenging objectives. AI will assist staff in
forming best practice solutions.
8 Cognitive Flexibility • Creates adaptability in planning and thinking, when AI’s identify more
efficient ways of operating.
9 Programming • Important to building and maintaining modern AI’s, however machine
learning will become ever more able to improve itself.

7 Journal of Economic and Social Development – Vol 4. No 1., March 2017
INDUSTRY: Asset Management
TARGET YEAR: 2020
Rank of
Importance
Skill Justification
10
(Important)
Logical Reasoning • Important to understanding the consequences of AI’s proposed actions.
Whilst automative technologies emerge as an electrifying opportunity for managers to empower the value proposition of their firm, so too does it arise as a challenging force. In respect of the asset management industry, this is evident in the fruition of ‘robo advisors’ (RAs). As a defining trend of 2014 onwards, RAs allow firms that use complex algorithms to leverage a client’s information and then formulate tailored investment recommendations by executing highly diversified automative investment portfolios at lower costs when compared to traditional asset management firms (Hougan, 2015). RAs have shown unprecedented growth, with the leading eleven wealth management organisations increasing the total assets under management by RAs to 65% - this was equivalent to an all time high value of $19 billion by the end of 2014 (Miller, 2014). Whilst this monetary valuation is notable it is also negligible against the total assets under management of Vanguard for example, one of the world’s largest investment firms, who alone controlled $3 trillion at the end of 2015 (The Vanguard Group. 2016). Nevertheless, according to Vincent et al. (2015), RAs will cause significant disruption in the wealth management industry for a variety of reasons. Firstly their substantially lower fees will open the market to mass consumers (with assets under $200k), who seek affordable financial assistance with a healthy return. Secondly, RAs will cater towards the digital preferences of millenials (individuals born post 1980), who seek greater control of their funds at anytime, anywhere. Finally, the technology will also reduce barriers to entry, as ‘Robo SMEs’ will surface more often to challenge established organisations incumbent value propositions.Whilst UK high street banks, such as Lloyds, Santander and Barclays, are planning to launch RAs into the mass market (Dunkley and Arnold, 2016), Allianz (2015) indicates that specialised asset management firms will in the short term choose to ignore this phenomenon. This is because the majority of Baby Boomers (individuals born between 1946 and 1964) and GenXers (individuals born between 1965 and 1980) will still desire a humanistic relationship within their financial affairs. These two generational groups are important as they contain the largest proportion of high net-worth individual investors, at present. However, in the medium term future millenials will start emerging as a larger clientele segment, who will be more likely to be accustomed to the cost efficient and anytime nature of RAs. Consequently, in order to evolve a relevant value proposition whilst maintaining its premium service advantage (i.e. personalised human relationships), it is plausible JAM, and other asset management organisations, will need to establish a hybrid digital platform (part human, part automation) that aligns with the expectations of millennials (Greenhalgh, 2016). Whilst the literature concludes that firms such as JAM will need to establish a hybrid digital platform, what is lacking at present is how managers will practically achieve this version of part human, part automation working facilities. In order to assist in this issue, this paper attempts to bridge the gap by applying the Johnson et al. (2013) ‘Buy, Ally or DIY’ matrix (see application below in Table 3). The general principle proposed by Johnson et al. (2013) entails how to achieve a new capability through acquisition, alliances and organic development. By applying the knowledge derived from

8
AN INVESTIGATION INTO THE SIGNIFICANT IMPACTS
OF AUTOMATION IN ASSET MANAGEMENT
previously synthesized literature to the overarching guidance of Johnson et al’s (2013) model, we are able to formulate a premise as to which strategy is most suitable for JAM.
Table following on the next page
Table 3: Adapted ‘Buy, Ally, DIY Matrix’ for JAM and other asset management firms
- Buy
(acquisition)
Ally (alliance or
partnership)
DIY (organic
development)
Advised strategy Justification
High urgency Fast Fast Slow DIY • Medium term scope of interest
would enable JAM to take more
time building a RA platform.
High
uncertainty
Failures
potentially
salable
Share losses and
retain buy
options
Failures likely
unsalable
Ally • Unfamiliar territory to JAM.
• Alliance with an experienced
specialist will cut risks and
bolster knowledge. Option to
acquire could also be potentially
brokered.
Soft capabilities
important
Culture and
valuation
problems
Culture and
control problems
Cultural
consistency
DIY • Enables JAM to build a RA fully
around its own mantras, culture
and client expectations.
High modular
capabilities
Avoid buying
whole
company
Ally just with
relevant partner
unit
Develop in new
venture unit
Ally • Highly targeted alliances will
ensure the use of solely RA
technologies with no other
commitments.
i) Advised strategies: Buy 0 / Ally 2 / DIY 2. ii) Ally has more ‘green advocations’ from (Johnson et al. 2013). iii)
Final recommended strategy: ALLY
3. RESEARCH METHODS As a result of the literature review, three conceptual frameworks were devised along with a host of associated premises, which required expansive research and ultimately ratification. The first was the B-PAP model (Table 1), which aimed to determine plausible traits of entry level employees at lower levels of an organisation, in an era when automaton, within the white collar sector, will be prevalent. The second was the Ten-ES model (Table 2), which details a feasible list of prioritised skills needed by entry level employees in order to allow organisations, within the asset management industry, to fully capitalise on automation in the lower levels of an organisation. In general, the Ten-ES model largely promoted the precedence to humanistic soft skills, thereby synthesising the work of Gray (2016) and Davies et al. (2011). The last premise provided by the literature review considers how managers will establish the automated capability predicted. Here an application of the Johnson et al’s (2013) ‘Buy, Ally or DIY’ matrix was considered. In order to investigate these

9 Journal of Economic and Social Development – Vol 4. No 1., March 2017
assertions the study interviewed richly experienced and knowledgeable individuals within the fields of automation and asset management, as a method to clarify and investigate the three conceptual frameworks with empirical evidence.The first interviewee was Simon Crawford, a Fixed Income, Multi-Asset Performance & Risk Manager. Crawford has worked at JAM for 15 years, amassing a deep working knowledge of JAM’s financial products. Crawford also has a profound awareness of macro industry trends that could affect the asset management industry and was therefore an ideal candidate for commenting on the asset management industry’s perception of automation particularly in JAM.
The second interviewee was Daniel Hulme, CEO of Satalia and Advisor to the UK Home Office. Hulme holds an Engineering Doctorate in Computational Complexity and thus has evidenced academic superiority in this field, presenting an experienced candidate who rendered profound insights on the forward looking ramifications of automation in the asset management industry. Both were interviewed using structured interviews, in order to streamline the discussions into key areas of interest, based around the three conceptual frameworks devised through the literature review. The duplicate use of predetermined questions for each interviewee prevented wastage of resources as well as facilitated truthful comparability between interviewee’s responses, as guided by Saunders et al. (2012). To accommodate the investigatory process and establish an academic reference, both interviews were recorded, transcribed and have been stored electronically.Of crucial importance to the success of this investigation’s data analysis before and after the commencement of interviews, was the use of an analytical pattern matching produce, which examined qualitative information. In accordance with this methodology (i) existing or personally developed models (B-BAP, Ten-ES as per the literature discussion) were utilised based upon the available literature, (ii) interviews were conducted which examined these assertions within the models devised, (iii) and finally both interview transcripts were interpreted in order to devise conclusions in comparison to the original conceptual models/frameworks. Where interconnected evidence existed between Hulme and Crawford, a valid explanation to support the findings had been identified. Where an unforeseen variable challenged the established thought of the investigations considered in the three conceptual frameworks, further inquiry was initiated so as to establish the reasoning behind its origin and thus developed a deeper level of contributory knowledge (Yin, 2009). The application of pattern matching has proven to be a useful methodology in this investigation. It allowed for the evolution of a robust set of research themes and frameworks through a clear framework of academic investigation, which supported the identification of appropriate interviewees (Miles and Huberman, 1994).
4. RESULTS, DISCUSSIONS, AND CONCLUSIONS
i) The reorganisation of JAM’s talent development programmes This investigation has found confirmation for the works of Frey and Osborne (2013) that indeed many typical entry level occupations will be automated, by way of Hulme and Crawford both concurring with this widely accepted notion. Hulme stated that roles which require “systematic, repetitive work in a fixed domain” will be primary operational targets for automation. However, the means to how this will impact management and their forward looking talent development protocols is nuanced and highly intriguing.

10
AN INVESTIGATION INTO THE SIGNIFICANT IMPACTS
OF AUTOMATION IN ASSET MANAGEMENT
According to Crawford, if entry level roles are automated, then new recruits will begin a ‘step up’ within the organisation therein altering the firm’s structure of career progression and operational formation. With the absence of menial tasks to educate new recruits, Crawford believed entrants would be placed into more extensive in-house training programmes, coupled with a greater degree of senior shadowing thus enabling for a more pragmatic application of education. Some of the contemporaneous academic elements of these training programmes have already been identified. For example, Crawford cites a significant issue with AI is that it can create a lack of understanding e.g. operatives are presented with a number but have no comprehension of how it was derived. As a means to answer this challenge, Hulme advocated that all personnel across from entry level to more senior operatives should have a working comprehension of machine learning and AI, therein enabling an awareness of data analysis processes to which they can further interpret from a humanistic perspective.
In relation to the devised B-PAP model, the evidence largely supports and expands this investigation’s theoretical 2020 asset management industry notions. For example, in terms of qualifications, Hulme cites psychological degrees as a credible option, given that management will need to comprehend the human decision making process in order to design services that resonate with the target audience, and ultimately design a compelling motivation to purchase. Crawford amazingly states that despite asset management firms being white collar, experience may not be required if a candidate is entering via a programme similar to the current industry wide 2020 scheme, which absorbs gap year and A-level students into the workforce. However, he did additionally cite the importance of maturity and intelligence as characteristics, particularly for any younger 2020 programme
recruits.
In conclusion it is recommended that JAM, and other asset management organisations, should recognise and prepare for the loss of current entry level positions, by designing new training protocols that blend extensive in-house training programmes, with a greater degree of senior shadowing thus supporting juniors' abilities to interpret AI generated data. Prospective applicants to the firm should be considered against the ratified forward looking B-PAP model.
ii) The definitive top skills needed in asset management industry in the era of automation In relation to the works of Gray (2016) and the World Economic Forum (2016), a thought provoking contradistinction was identified between the responses of Hulme and Crawford. Hulme advocates the theory of a soft skill prioritisation approach in the design of a proactive augmented workforce, stating that empathy is a crucial skill that computers lack, a notion that is echoed by World Economic Forum (2016) and Davies et al. (2011). On the other hand, Crawford reverses this perspective, believing computers are only as competent as their programmers and thus the harder technical skills such as coding should be prioritised. The literature of Gray (2016), the World Economic Forum (2016) and Davies et al. (2011) conflicts with Crawford’s opinion, and thus it should be respectably considered as perhaps an inconsistent or outlying notion. Each perspective during the research process was reflected in the respective Ten-ES model answers. Thus confirming the assertions posed.
In conclusion, by considering the perspectives of Hulme and Crawford with those considered in the literature there are a number of direct matches and near matches (to within two

11 Journal of Economic and Social Development – Vol 4. No 1., March 2017
allocations of each other) for the Ten-ES model conceptualized as part of the literature review (see table 2 below). As a result, the model is empirically informed and thus should be systematically incorporated into the evolution of JAM’s future talent development programmes. Broadly speaking the softer skills are categorised higher in the rank order of importance, with those becoming narrower and harder being ranked lower, see table 4 below.
Table following on the next page
Table 4: Empirically Derived: Top skills needed in the asset management industry for the era of automation
Rank Order Skills of Importance Rank Order Skills of Importance
1 (most important) • Emotional Intelligence 6 • Judgement and Decision Making
2 • Creativity 7 • Complex Problem Solving
3 • Negotiation 8 • Service Orientation
4 • People Management 9 • Cognitive Flexibility
5 • Coordinating with Others 10 (important) • Logical Reasoning
iii) The current existence of augmentation and how to enhance it Presenting itself as a fascinating acknowledgement, Hulme declared that we as a society are already augmented, exampling that we cannot immediately access all of human knowledge without a machine (computer and the internet). Consequently this raises a compelling notion that civilisation should not perceive augmentation as a forward looking technology to prepare for. But rather that businesses are already engaged within the methodology. Thus to optimise its advantageous properties, management must evolve augmentation as opposed to create it, by way of creating faster and more natural ways to engage with the digital world thus propagating better decision making with agility. Hulme declared there are indeed tasks that computers cannot effectively perform such as interpreting the results of analytical processes with empathy based perspectives. For example, Hulme cited that some individuals will not approve of using RAs as their decisions may be perceived as unfair or unsympathetic, which as a result will likely always stimulate a demand for human ratification. Within this conjecture, Hulme believes there is a compelling augmentation opportunity to ensure a seamless transition process from machine to a human, thus quelling the individual’s concerns and maintaining customer satisfaction. As a result, there is firm evidence for the notion of augmentation as a primary optimisation route as argued by Davenport (2015), and that an overemphasis of automative technologies is counterproductive given their empathic weakness as argued by Autor (2014). One meaningful concern that was not previously

12
AN INVESTIGATION INTO THE SIGNIFICANT IMPACTS
OF AUTOMATION IN ASSET MANAGEMENT
identified, during the investigation, was the issue of responsibility. Hulme indicated that if a machine was to independently make an inadequate decision, then the implementing firm would be liable for its error. However, by augmenting a human employee with the machine who ratifies all proposed automative decisions, the liability rests with that employee alone. Consequently, this presents an ethically challenging but credible strategy for firms, particularly those that are small and not cash rich, to reduce their overarching automative liability and exposure to monetary damages. In conclusion, we can surmise that augmentation is already largely present in the daily activities of our personal and professional lives. Management should recognise that organisations must now invoke a process of evolving this synergy, rather than supposedly creating one, in order to orchestrate an ever more seamless customer experience and increase operational efficiencies. The use of humans as mitigating individuals of automative liability is an ethical question that management should consider, against the cultural values of their organisation and potentially their legal responsibilities imposed by law.
iv) Alliance with the option to acquire as the most effective strategy to onboard RA’s The research conducted here affirms the notion that an alliance is the most appropriate choice to facilitate a RA centric hybrid digital platform. According to both Hulme and Crawford, a strategic alliance or partnership would be the most favourable approach, with Crawford going further to state that the second most appropriate option would be an acquisition and the third would be a DIY option. Crawford believes that if a firm has developed in their maturity and proved the value of their services, alliances are effective in preventing wasting monetary and other resources in discovering whether a technology will be of organisational use. Whilst supportive of the strategy Hulme did urge caution with arguably its most prominent risk, that being competitive advantage issues, which could arise from numerous firms using the same partner thus fabricating a lack of differentiation. Consequently, this adds favour to the notion of an alliance with the option to acquire later, which both Hulme and Crawford enthusiastically supported.
In conclusion, to acquire an RA capability it is recommended that JAM, and other asset management organisations, should strategically align or partner with a specialist firm in this field. Furthermore, the partner should demonstrate operational proficiency and ideally an option to acquire the partnering RA organisation, in order to develop a competitive advantage. Furthermore, organisations like JAM should implement a seamless transition process for customers who choose to abandon RAs in favour of an empathic human manager.
5. FUTURE RESEARCH The potential to extend the results of this investigation through further research are pronounced in two key areas. There firstly is a providential opportunity to explore how precisely augmentation, between RAs and employees, can be nurtured in order to create faster and more natural expressions of engagement between employees, facilitating enhanced decision making. For example, analysis could be conducted into the properties of incorporating augmented reality technologies within an organisation’s working environment, both in terms of facilitating a progressive method of completing occupational tasks and improving a firms value proposition. The second area presented for future research is an investigation into prospective strategic alliances with the option to acquire, between a large asset management firm, such as JAM, and a flourishing RA organisation in the approach to

13 Journal of Economic and Social Development – Vol 4. No 1., March 2017
2020. This builds upon the papers recommendations, and would compile an additional layer of academic knowledge that firms could utilise in their technological diversification.
LITERATURE: 1. Allianz. (2015). How boomers and Generation Xers are facing their financial futures.
Generations Apart Study, pg 8. 2. Autor. D. (2014). Polanyi’s Paradox and the Shape of Employment Growth. Journal of
Research in Employment, pg 130 & 136. 3. Bank of England. (2014). The age of asset management? Speech by the Governor of the
Bank of England, Mark Carney, pg 2 & 3. 4. Bessen. J. (2016). Computers Don’t Kill Jobs but Do Increase Inequality. Harvard Business
Review Article. 24th March 2016. Retrieved July 2016 from https://hbr.org/2016/03/computers-dont-kill-jobs-but-do-increase-inequality. 5. Coventry University. (2016). Finance and Investment BA (Hons). Internet Research.
Retrieved July 2016 from: http://www.coventry.ac.uk/course-structure/business-and-law/undergraduate-degree/2016-17/finance-and-investment-ba-hons/.
6. Davenport. T. (2015). Augmentation or Automation? Wall Street Journal Article. 24th February 2015. Retrieved July 2016 from: http://blogs.wsj.com/cio/2015/02/25/augmentation-or-automation/.
7. Davenport. T, & Kirby. J. (2015). Beyond Automation. Harvard Business Review Article. June 2016. Retrieved July 2016 from: https://hbr.org/2015/06/beyond-automation.
8. Davies. A, Fidler. D, & Gorbis. M. (2011). Future Work Skills 2020. Journal of Research in Employability Skills, pg 8, 9.
9. De Montfort University Leicester. (2016). Software Engineering BSc (Hons). Internet Research. Retrieved July 2016 from: http://www.dmu.ac.uk/study/courses/undergraduate-courses/software-engineering-bsc-degree/software-engineering-bsc-degree.aspx.
10. Deloitte. (2016). Intelligent automation entering the business world, pg 2, 3. 11. Denscombe. M. (2007). The Good Research Guide. 3rd ed. Buckingham: Open University
Press. 12. Dey. I. (1993). Qualitative Data Analysis. 1st ed. London: Routledge. 13. Dill. K. (2015). The Best And Worst Entry-Level Jobs. Forbes Article. 24th April 2015.
Retrieved July 2016 from: http://www.forbes.com/sites/kathryndill/2015/04/28/the-best-and-worst-entry-level-jobs/#2b308bc1ceaa.
14. Dunkley. E, & Arnold. M. (2016). UK banks set to launch ‘robo-advisers’. Financial Times Article. 22nd January 2016. Retrieved July 2016 from: https://next.ft.com/content/afb03182-c107-11e5-9fdb-87b8d15baec2.
15. Frey. C, & Osborne. M. (2013). The Future of Employment: How Susceptible Are Jobs to Computerisation?. Journal of Research in Employment, pg 71, 72.
16. Frey. T. (2014). Fifty-Five Jobs of the Future: Part One. Journal of Research in Employability, pg 38.
17. Gray. A. (2016). The 10 skills you need to thrive in the Fourth Industrial Revolution. Summative article of the World Economic Forum’s Future Jobs Report. 19th January 2016. Retrieved July 2016 from: https://www.weforum.org/agenda/2016/01/the-10-skills-you-need-to-thrive-in-the-fourth-industrial-revolution/.

14
AN INVESTIGATION INTO THE SIGNIFICANT IMPACTS
OF AUTOMATION IN ASSET MANAGEMENT
18. Greenhalgh. H. (2016). Mr Robot, your new financial adviser. Financial Times Article. 19th February 2016. Retrieved July 2016 from: https://next.ft.com/content/48e5f1a0-d631-11e5-829b-8564e7528e54.
19. Heathfield. S. (2016). What Is an Entry-Level Job? The Foundations of Long Careers are Built on Experience. 27th June 2016. Retrieved July 2016 from: http://humanresources.about.com/od/glossarye/qt/what-is-an-entry-level-job.htm.
20. Hougan. M. (2015). Robo-Advisers: What It Means to You. Journal of Research in Robo Advisor Technology.
21. Johnson. G, Whittington. R, Scholes. K, Angwin. D, & Regnér. P. (2013). Exploring Strategy. 10th ed. Harlow: Pearson Education Limited, Pg 330, 350 & 351.
22. Miles, M.B, & Huberman, A.M. (1994). Qualitative Data Analysis. 2nd ed. Thousand Oaks, CA: Sage.
23. Miller. M. (2014). Total AUM Increases for 11 Leading Robo-Advisors. Notes on Retirement. 22nd December 2014. Retrieved July 2016 from: http://wealthmanagement.com/retirement-planning/total-aum-increases-11-leading-robo-advisors.
24. Reichman, C.S. (1962). Use and Abuse of Statistics. 1st ed. New York: Oxford University Press.
25. Saunders. M, Lewis. P, & Thornhill. A. (2012). Research Methods for Business Students. 6th ed. Harlow: Pearson Education, pg 56, 317 - 320, 374 - 379, 383, 579 - 580 & 598.
26. Smith. E. (2006). Using Secondary Data in Educational and Social Research. 1st ed. Maidenhead: Open University Press.
27. Stewart, D.W, & Kamins. M.A. (1993). Secondary Research: Information Sources and Methods. 2nd ed. Newbury Park, CA: Sage.
28. The University of Warwick. (2016). Undergraduate Degrees >> Data Science. Internet Research. Retrieved July 2016 from: http://www2.warwick.ac.uk/fac/sci/statistics/courses/datsci/.
29. The Vanguard Group. (2016). Fast facts about Vanguard. Retrieved July 2016 from: https://about.vanguard.com/who-we-are/fast-facts/.
30. UKCES. (2014). Careers of the future. Journal of Research on Future Careers, pg 4. 31. Vincent. G, Laknidhi. V, Klien. P & Gera. R. (2015). Robo-Advisors, Capitalizing on a
growing opportunity. Journal of Research on Robo Advisor Technology, pg 2. 32. Vögeli. J. (2014). UBS Turns to Artificial Intelligence to Advise Clients. Bloomberg Article.
7th December 2014. Retrieved July 2016 from: http://www.bloomberg.com/news/articles/2014-12-07/ubs-turns-to-artificial-intelligence-to-advise-wealthy-clients.
33. WallStreetOasis.com. (2015). What Is Asset Management? Financial Career Guidance Portal. Retrieved July 2016 from: http://www.wallstreetoasis.com/finance-dictionary/what-is-asset-management-am.
34. World Economic Forum. (2016). The Future of Jobs. Employment, Skills and Workforce Strategy for the Fourth Industrial Revolution, pg 15, 52, 53 & 79.
35. Yin, R.K. (2009). Case Study Research: Design and Methods. 4th ed. Thousand Oaks, CA: Sage.

15 Journal of Economic and Social Development – Vol 4. No 1., March 2017
EFFECT OF CSR ON PRODUCT DIFFERENTIATION IN THE PRESENCE OF COST ADVANTAGE
Samar K. Mukhopadhyay Professor, Decision Sciences SungKyunKwan University – GSB 53 Myungryun dong, Jongno gu, Seoul, Korea 110-745; +822 740 1522 [email protected]
Guangliang Ye Hanqing Advanced Institute of Economics and Finance, Renmin University of China 59 Zhongguancun Street, Beijing 100872 P.R. China; +86-10-62514797 [email protected]
ABSTRACT
Corporate social responsibility (CSR), once thought of only a philanthropic activity of a firm, is now treated as a serious business strategy that can contribute to a firm’s profitability. The seemingly altruistic activity helps build the firm’s image with all the stakeholders including its customers so that it has the potential to increase the firm’s profit. This fact is now well established in research literature. Product differentiation is another corporate strategy that is pursued by some companies in order to offer a distinctive product in the market to avoid competition, charge premium price, and increase profit. What is not known is that when two firms compete in a Hotelling type product differentiation line, how much this product differentiation is affected by the extent of the CSR activity of a firm. Our study is conducted in a game-theoretic setting where the CSR firm is competing with a non-CSR firm. The CSR firm maximizes a convex combination of its own profit and a form of social utility function, while the non-CSR firm maximizes its own profit only. The CSR firm is also assumed to have a technological advantage that reduces its production cost. The interaction of the effects of both the extent of CSR and the extent of this production cost advantage is also considered. We also study a scenario of asymmetric information. Our main results include that the degree of product differentiation is reduced when CSR is practiced. On the other hand, product differentiation increases with the production cost advantage. The interaction between the two factors – CSR activity and cost advantage – is also studied. Keywords: Asymmetric information; Corporate social responsibility; Game theory; Product differentiation; Spatial price discrimination

16
EFFECT OF CSR ON PRODUCT DIFFERENTIATION
IN THE PRESENCE OF COST ADVANTAGE
1. INTRODUCTION In recent times, Corporate Social Responsibility (CSR) has become an important part of corporate strategy. Many companies are establishing CSR as a separate functional area with its own objectives and policies. A majority of companies actually issue a CSR report annually. In 2011, 83% of top 100 US companies by revenue issued such report compared to 74% in 2008 and only 37% in 2005. Globally, this figure is 95% of the top 250 largest companies (KPMG 2011). Recently, the UN started a Global Compact Initiative for companies to pledge support for human rights, labor standards, and environmental protection. As a measure of success of this initiative, 8000 businesses around the world have signed this pledge (Knowledge@Wharton, 2012). Bateman and Snell (2002) defined CSR as a set of corporate actions that positively affects an identifiable social stakeholder’s interests and does not violate the legitimate claims of another identifiable social stakeholder. CSR activities should do some social good and should be beyond that is required by law (McWilliams and Siegel, 2001). They also say that CSR activities would increase the social utilities of the companies’ activities. Common examples include recycling, pollution reduction and product design that have social attributes and characteristics. Product differentiation is another corporate strategy that is pursued by some companies in order to offer a distinctive product in the market to avoid competition, charge premium price, and increase profit. Usually, when the products are less differentiated in a particular industry, the firms therein will encounter more intense competition. A common tool for depicting product differentiation in a duopoly is to use the Hotelling’s Principle. Hotelling considers a stretch of physical street of finite length along which customers are uniformly distributed. Two shops are deciding about the physical location along the street. Assuming that customers will choose the nearest shop, Hotelling’s law predicts that both shops will find themselves next to each other at the halfway point. This law has been applied to product differentiation in some characteristic of the product, for example color, sweetness or size. Applying Hotelling’s law will mean that, given price and all other product attribu tes remaining the same, the characteristic in question will eventually be the same for both products making them identical to each other. In our paper, we use an “augmented version”, called the SPD (Spatial Price Discrimination) model. In this model, a firm charges consumers different prices according to different locations. For markets with differentiated products or large transportation costs, spatial price discrimination is an important and useful strategy for firms. Greenhut (1981) conducted a survey which showed that, in areas like the US, Europe and Japan where the transportation cost can be as high as five percent of the total cost such price discrimination is definitely resorted to. For example, in the ready-mixed concrete market, a producer could observe each customer’s location and then charge different prices. In addition to the transportation of this kind of bulky product, spatial model could also be applied to horizontal differentiation. As long as producers can identify the location, (for example, taste), price discrimination would exist. Breakfast cereals vary in sweetness; airlines choose different flight time in a day. As a result, many studies in literature used this model to analyze various questions concerning both firm’ best strategy and social policy. While product differentiation strategy makes a firm’s product different from others’, the firms are also increasingly adopting CSR for improving their image. The research question studied in this paper is: Is there any link between a firm’s CSR strategy and its product differentiation strategy? There are some anecdotal connections shown in popular media

17 Journal of Economic and Social Development – Vol 4. No 1., March 2017
which shows that high CSR-intensive industries are often associated with low product differentiation. For example, among top US companies, automobile industry is highly CSR-intensive. This industry, however, engages in low product differentiation across firms, that is each major auto-maker produces similar types of products and covers full range of cars, including coupe, sedan, SUV, minivan, and so on. An article published in Forbes (Fernandez-Kranz, 2010) shows some stylized facts regarding the relationship between firm’s CSR strategy and the product differentiation; specifically, how low product differentiation indicates intense market competition. According to their study, more intensive CSR strategy is associated with fiercer marketplace competition. Their further empirical evidence shows that firms can use CSR strategy as a substitute for the product differentiation strategy. For example, firms tend to rely less on CSR strategy in industries which already show a high degree of product differentiation (achieved by innovation that measured by expenses on R&D). This anecdotal reference motivates us to study this link and develop a theoretical model to analyze this issue. In this paper, we investigate how the CSR activities of a firm would influence product differentiation in the market, and if it does, whether the analytical results support the anecdotal conjectures. We consider two firms each producing and marketing a single product. One of the firms is a traditional profit-maximizing firm. The other is a CSR firm in the sense that they maximize not only their own profit but also some identifiable stakeholder’s (the firm’s customers) interests. In our model setting, the CSR firm has a cost advantage with a lower marginal production cost since a CSR firm in the real world is usually associated with competitive advantage in the industry. CSR would entail additional costs to the firm, but it would also bring in some kind of CSR premium. In our model the products are differentiated along a spatial competition type line. We explore the effect of a firm’s CSR objective on the extent of product differentiation in the industry. We also explore the effect of cost advantage on the extent of product differentiation. Finally, we study the interaction of the two effects (CSR and cost advantage) together on the extent of product differentiation. 2. BRIEF LITERATURE SURVEY Our paper is at the crossing of the CSR and the product differentiation literature. There is increasingly more awareness in the corporate sector that CSR activities do probably increase profit. The mechanism is an enhanced respect for the company that will, in turn, increase sales and make employees loyal (Robins, 2011). McWilliams and Siegel (2001) found that there exists an optimum level of CSR that will maximize profit, and at the same time, fulfill the CSR demand from various stakeholders. Siegel and Vitaliano (2007) studied the strategic engagement of firms in profit-maximizing CSR. The fact that firms can use CSR to increase private profits is also highlighted in Hernandez-Murrillo and Montinek (2009). Fisman, Heal and Nair (2014) found some evidence that CSR is motivated by profits and is especially profitable in consumer-oriented industries, and in competitive industries. Hsueh and Chang (2008) consider a three-tier supply chain and contrast its performance without and with CSR activities. The positive relationship between CSR activities and firms’ profits is empirically found by Crifo et al. (2016) using data from French industry. Similar correlation between CSR and profitability was also found by Zhu, Liu and Lai (2016) among Chinese enterprises. An article by van Wassenhove (2006) on the co-operation between private and humanitarian sectors through CSR activities outlines the best strategies for such a co-operation. From a supply chain co-ordination point of view, a model developed by Hsueh (2014) showed that
18
EFFECT OF CSR ON PRODUCT DIFFERENTIATION
IN THE PRESENCE OF COST ADVANTAGE
by suitably designing a revenue sharing contract can improve total supply chain profit. While the link between CSR activity and increased profit seems to be currently intuitively well-known, there does not exist any model to analytically demonstrate this. At the same time, there is no research done about the link between other variables like product differentiation and a firm’s cost efficiencies, and CSR. This paper seeks to bridge this gap in literature. The product differentiation literature is quite mature. Product differentiation can be horizontal or vertical. A horizontal product differentiation is when the quality of the product is not easily distinguished and customers resort to different rankings for different products even when the price is same. Examples can be breakfast cereals and cola brands. In vertical product differentiation, the products have different levels of quality that is objectively measurable by the customer, with prices being same or different. Vertical product differentiation has been widely studied in several papers, for example, Gabszewicz and Thisse (1980), and Shaked and Sutton (1982). Lacourbe, Loch and Kavadias (2009) study a market where there is a mix of vertical differentiation (in case of product performance) and horizontal differentiation (for product features). The role of variable costs and volume-dependent manufacturing costs is studied. As for horizontal product differentiation, researchers usually use spatial competition model to study it, which was first brought up by Hotelling (1929), focusing on location on a bounded linear market by two firms. In contrast to Hotelling model that did not consider spatial price discrimination, Hoover (1937) studied the market where price discrimination is through freight absorption, which is common when goods have a relatively high transportation cost compared with its value. By assuming that each firm has a single fixed location, he concludes that in the neighborhood of the market area, the seller at the nearest location is able to fix the delivered price at an amount that equals the sum of marginal cost at the next nearest selling point and the transportation cost from that point. The spatial model can be interpreted as a model of product location in the characteristics space, where individual firm’s location choice can be interpreted as its product specification. This is studied by Macleod, Norman and Thisse (1985), Lederer and Hurter (1986) as well as Greenhut, Norman and Hung (1987). Anderson and de Palma (1988) extend the spatial discrimination model to heterogeneous products and show many of the strong properties in the standard homogeneous goods case no longer hold, and particularly, unless products are very different, social optimum is not sustainable any more. A paper that is similar to ours is by Kopel, Lamantia and Szidarovszky (2014) where they find that a CSR firm can have higher profit compared to a profit maximizing rival. Our paper analyzes CSR within the spatial price discrimination model. 3. THE MODEL
In this section, we will first introduce the classical spatial competition model and then its application for the case of product differentiation as used in our paper. In classic Hotelling’s model, where price is exogenous and thus no price discrimination exists, at the equilibrium, the shops will locate next to each other. Each shop will capture half the market. Recall that the customers want to minimize the distance travelled and therefore would buy from the nearest shop. Let t be the unit cost of transportation for each customer. Then, it is easy to see that the total cost of transportation for all the customers in the system is (t/4). But, if one is concerned about the socially beneficial solution, the above solution is not the optimum. For example, suppose the shops are located one quarter of the way along the

19 Journal of Economic and Social Development – Vol 4. No 1., March 2017
street from each end. The shops will still get the same number of customers (half of total each), but the total distance covered by all the customers will be reduced to (t/8).Thus, we can see that it is possible to obtain a socially responsible solution that could also be optimum for the firms. In our model, we will use such a CSR model for one of the firms, to study the role played, if any, by a CSR objective. The spatial competition street can be a metaphor for product differentiation. The relative positions of the products along the street give the extent of differentiation between the two products and this can be for any product characteristic. We consider two firms each producing a product. Customers’ preferences are uniformly distributed along a unit line segment. To the customers, the products are horizontally differentiated. The position of Firm 1’s product on the line is denoted by L1 and that of Firm 2 by L2 (see Figure 1). Let us assume,
without loss of generality,1 2L L . We also assume that Firm 1 as a CSR company possesses
superior production technology and therefore enjoys an advantage in marginal cost of production. Without loss of generality, we normalize this cost to zero. Let k be the production cost of Firm 2 (over and above that of Firm 1). So, we have k1 = 0 and k2 = k. Note that the value of k can be negative, which means the production cost of Firm 1 is more than that of Firm 2. In other words, it is the case where CSR firm is associated with cost disadvantage but our main analysis remains same.
Figure 1 here Each consumer has inelastic demand for one unit of the good, with a reservation price r,
where 20 k r . Transport cost is t per unit of distance, which can also measure firms’ cost
of customizing the standard product to align with each customers taste. The total cost for
company i to supply all consumers in the line segment 0x to 1x is 1
0
x
i ixC (c )dx
where
i i ic t | x L | k . The firm can use its rival’s cost of customizing the product to charge discriminative prices and therefore the equilibrium delivered price schedule for any consumer located at x is as follows:
p*(x,L
i) = max{| L
i- x | t + k
i, | L
~i- x | t + k
~i},i = 1,2 (1)
| |iL x is the deviation of the product i from the preference of a customer given by x.
Consider again a customer located at x buying product i. The first argument in Equation (1) is the cost to Firm i. The second argument is the cost to the same customer buying the other product. The rationale of Equation (1) is as follows. Say Firm 1 sees that the cost c2to a customer to buy from the rival is higher than its own cost, c1. Then Firm 1 can set its price at (or an infinitesimal amount less than) c2. If its own cost c1 is higher, then that would be the price to avoid loss.
Let x be the customer who faces the same delivered cost from each of the firms. Then
1 1| | L x t k = 2 2| |L x t k . We get ( noting that k1 = 0 and k2 = k):
1 2( )
2
t L L kx
t
Figure 1 shows the price schedule derived in Equation (1) for all customers in the line segment [0,1] given by the bold line (being the maximum of the two arguments). We assume that the indifferent customer will buy from the closest firm. Therefore, Firm 1 will get all
outcomes in the segment [0, x ] and Firm 2 will get all customers in the segment ( x , 1). Also

20
EFFECT OF CSR ON PRODUCT DIFFERENTIATION
IN THE PRESENCE OF COST ADVANTAGE
recall that the price charged by Firm 1 will be c2 (Firm 2’s cost, this being the higher) and price of Firm 2 is c1. The gives the profit functions of the two firms as:
1 1 2 2 10
1
2 1 2 1 2
( , ) ( )
( , ) ( )
x
x
π L L c c dx
π L L c c dx
(2)
Firm 2, which is not a CSR firm will maximize 2 1 2( , )π L L given in Equation (2). Firm 1on the
other hand, is a CSR company and will maximize a convex combination of 1 1 2( , )π L L and its
own consumer surplus (CS) in the market. This is because a CSR firm cares about its stakeholders’ (including consumers) interest. Therefore, the CSR firm takes its own consumers’ surplus into account. By definition, CS of buying a product is the difference between the consumer’s willingness-to-pay and the product price, and thus total CS of firm 1 becomes the difference between the market reservation price and the sum of its profit and cost. This gives:
1 2 1 10
( ) ( )x
r c dx x CCS r
Thus the utility function U that Firm 1 will maximize is:
1 1(1 )U CS (3)
Where is a measure of the degree of the CSR consideration, [0,1] . A higher indicates
that the company cares more about its customers’ surplus, indicating higher CSR. When0 , the company cares only about profit;when 1 , the company behaves like an NGO.
The product differentiation decisions of the two firms are played as a game. The game is played in two stages. In stage one, firms make locations (i.e., differentiation) decision. In stage two, firms announce prices. Our objective in this paper is to explore the role of CSR strategy (adopted by Firm 1 in rivalry with Firm 2 which is a traditional firm) on the optimum level of product differentiation.
Note that the benchmark without CSR is the case when 0 and both firms maximize profit. Simultaneous profit maximization of two firms generates equilibrium locations as
1
2
4
B k tL
t
and 2
2 3
4
B k tL
t
. Thus, the market product variation becomes2 1
1| |
2
B B BL L .
Our main results are given in the next section and we will compare the equilibrium with that of the benchmark.
4. MAIN RESULTS In this section, we state the main results. For brevity, we omit the derivation and the proof. Equation (3) shown in the earlier section gives the objective function of firm 1 (the CSR firm).
Firm 2 maximizes 2 1 2( , )π L L given in Equation (2). In the first stage of the game the two firms
develops the best response functions as follows:
21 1
12 2
(2 3 ) 2 (2 3 ):
(6 7 )
2:
3
r k k tLBr L
t
k t tLBr L
t
(4)
21 Journal of Economic and Social Development – Vol 4. No 1., March 2017
Solving two best response functions simultaneously generates equilibrium locations
*
1
*
2
2 (2 3 ) 3 ( ) 2
(8 9 )
(4 5 ) ( 7 ) 6
(8 9 )
k r t tL
t
k r t tL
t
(5)
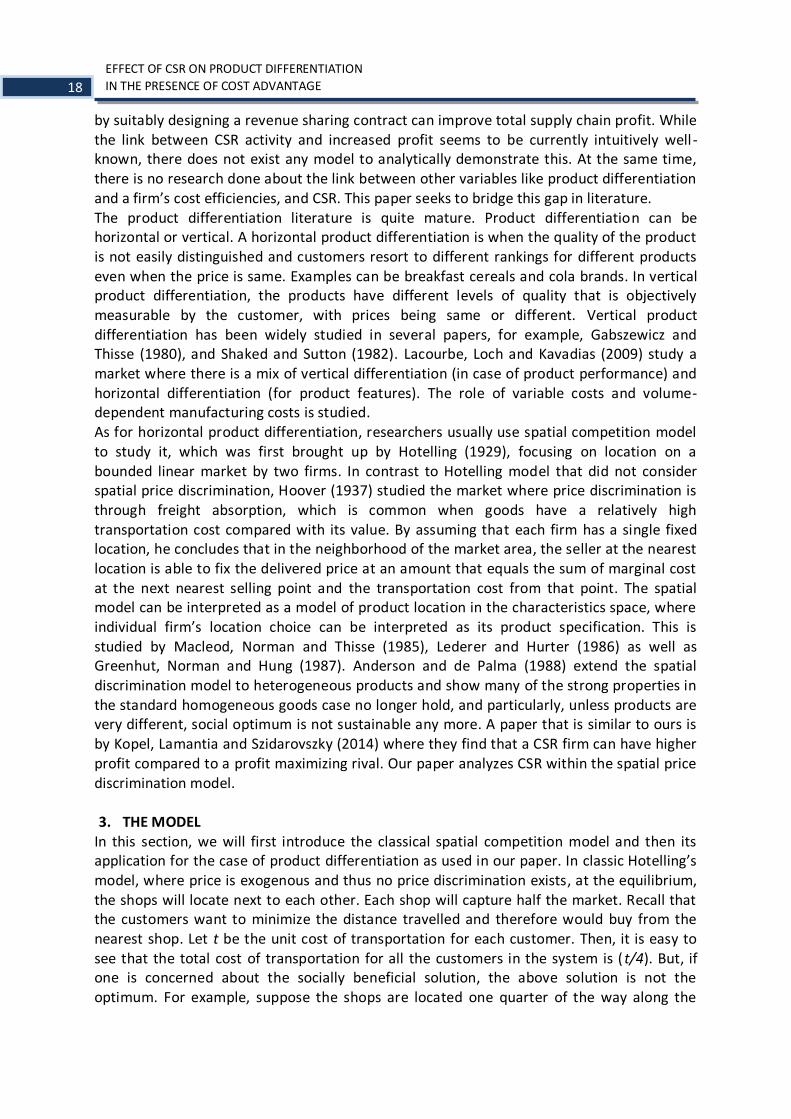
Equation (5) gives the equilibrium product designs of the two firms. L1 and L2 give the absolute locations while their difference is a measure of the product differentiation in the market. If L1 and L2are sufficiently close to each other, then the products are essentially similar with no distinguishing features. On the other hand, if the difference is large then the two products are significantly different. Thus, the degree of product differentiation measured by the market product variation becomes:
* *
2 1
4 (2 4 )| |
(8 9 )
t r t kL L
t
(6) One of the main objectives of this paper is to find the role CSR plays in product differentiation. The next proposition establishes the relationship. PROPOSITION 1: At the Sub-game Perfect Nash Equilibrium, there exists a negative relationship between the degree of the company’s CSR and degree of product differentiation in the market. Intuitively, product differentiation is a measure used by firms to attract consumers with certain tastes in order to get a higher profit. But a CSR-friendly company also cares about the surplus of its own consumers, so it will act more aggressively and move toward its rival’s position in order to get more consumers, resulting in a decreased product differentiation. PROPOSITION 2: At the Sub-game Perfect Nash Equilibrium, the competitive advantage (in production cost) by the CSR-friendly company increases the equilibrium degree of product differentiation. Since k is the product cost difference, the larger the k , the greater is the disadvantage of firm 2 in production cost and also in price. In this case, the CSR firm intends to move towards the middle to obtain more market share, but firm 2 will be more willing to increase the product differentiation by moving farther to the right to avoid head-on competition where it is associated with cost disadvantage. PROPOSITION 3: At the Sub-game Perfect Nash Equilibrium, the competitive advantage (in production cost) by the CSR-friendly company softens the negative relationship between the degree of the company’s CSR and the degree of product differentiation in the market. An analysis of Propositions 1 and 2 shows that the effects of and k on product differentiation are opposite.Intuitively, as k increases, the product disadvantage will become a more and more important concern of firm 2 when choosing location. Thus in order to make up for this, firm 2 has more incentive to move to the right to preserve the product differentiation in order to attract consumers, which leaves the impact of on product differentiation trivial. Thus, the increase of competitive advantage (in production cost) by the CSR-friendly company will soften the negative relationship between the degree of the company’s CSR and the degree of product differentiation in the market.
22
EFFECT OF CSR ON PRODUCT DIFFERENTIATION
IN THE PRESENCE OF COST ADVANTAGE
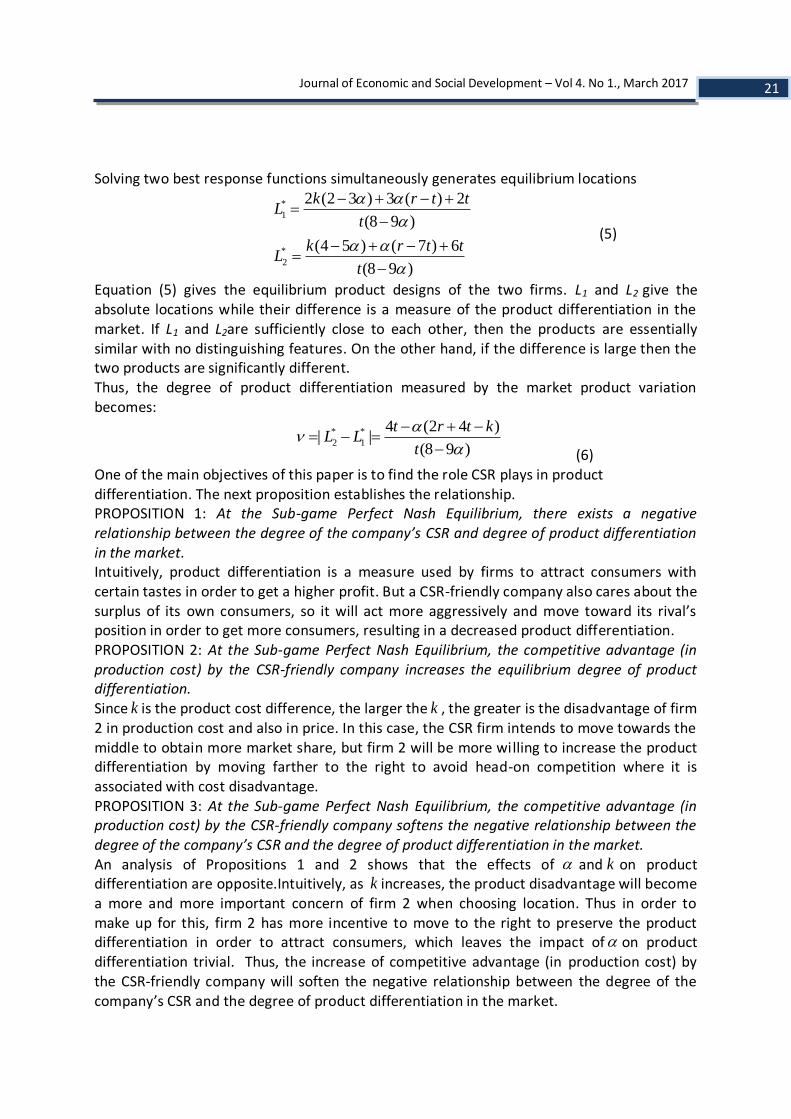
COROLLARY 1: The CSR activity increases the profit of CSR-friendly company until it reaches the optimal degree of the company’s CSR. This optimal level of the company’s CSR is increasing with both its cost advantage and the unit transportation cost. 5. EXTENSION WITH ASYMMETRIC INFORMATION In this section, we keep all conditions the same as earlier, except the information structure
of firms’ production cost. Firm 2 still produces with a constant marginal cost of production 2k ,
20 k k r . However, we now assume that there may be different types of firm 1 with
different production costs 1k , which is the private information only to itself. Specifically,
there is a probability that firm 1 may be low type (“L”) with a production technology
advantage (giving a lower production cost), and in this case, without loss of generality, 1k can
be normalized to zero ( 1 0k ). Firm 1 is of high type (“H”) with a probability1 with no
cost advantage 1 2k k k . This distribution is common knowledge. We now turn to derive the Sub game Perfect Nash Equilibrium and solve it by backward induction. In this asymmetric information case, we have two utility functions for the CSR-friendly Company’s given by
1 1
1 1
(1 )
(1 )
L L L
H H H
U CS
U CS
(7)
Firm 2’s expected profit function is given by 1 1
2 1 1 2 1 2 1 2
1 2 1 2
1( , , ) ( ) (1 ) ( )
2
( ) ,
2 2
L HL H L H
x x
L HL H
E L L L c c dx c c dx
t L L k L Lwhere x x
t
(8)
In the first stage, the two kinds of CSR-friendly company maximize U according to their own utility function (7) and its rival maximizes its own expected profit function (8). Firms develop their best response functions of location, as follows:
21 1
21 1
1 12 2
(2 3 ) 2 (2 3 ):
(6 7 )
(2 2 ) (2 3 ):
(6 7 )
( ) 2 (1 ):
3
L L
H H
L H
r k k tLBr L
t
r k tLBr L
t
k tl t tlBr L
t
(9)
Solving three best response functions simultaneously generates equilibrium locations: 2
*
1
2*
1
*
2
8 12 16 (18 20 44 32 ) (12 21 21 30 )
(6 7 )(8 9 )
8 12 (12 21 21 21 ) ( 20 18 32 18 )
(6 7 )(8 9 )
( 7 ) 4(1 ) 6
(8 9 )
L
H
k t k r k k t k t r kL
t
k t k k t r k k t rL
t
r t k k tL
t
(10)

23 Journal of Economic and Social Development – Vol 4. No 1., March 2017
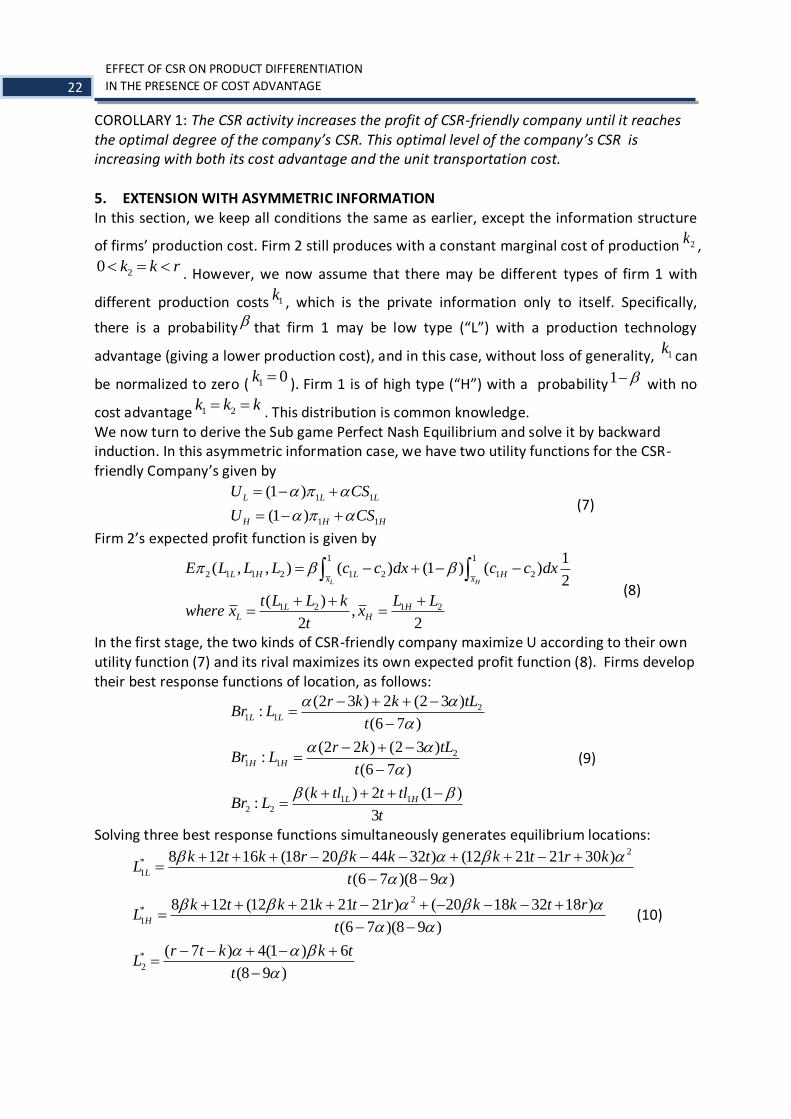
Equation (10) gives the equilibrium product design of the CSR-firm and firm 2. *
1LL ,*
1HL , and*
2L are the absolute locations of low type firm 1, high type firm 1 and firm 2 respectively. Thus the degree of product differentiation under both types “H” and “L” measured by the location distance becomes:
2
*
2*
(14 16 23 28 ) ( 12 32 38 52 ) 24 16 16
(6 7 )(8 9 )
2[(8 14 7 7 ) ( 6 16 6 26 ) 12 8 ]
(6 7 )(8 9 )
L
H
r k k t r k k t t k kv
t
k t r k r k k t t kv
t
(11)
Next, we establish propositions to show how the role of asymmetric information impacts the relationship between CSR and the product differentiation. PROPOSITION 4: At the Sub-game Perfect Nash Equilibrium with asymmetric information, there exists a positive relationship between the probabilities of the CSR-friendly company
being a low type and the degree of the product differentiation. PROPOSITION 5: At the Sub-game Perfect Nash Equilibrium with asymmetric information, the relationship between the degree of the company’s CSR and degree of product differentiation remains negative, and this relationship would be strengthened if the CSR-firm is of low type. PROPOSITION 6: At the Sub-game Perfect Nash Equilibrium with asymmetric information, the competitive advantage k (in production cost) by the CSR-friendly company diminishes the equilibrium degree of product differentiation under the low type case when the likelihood of CSR-friendly company being a low type ( ) is relatively low, and vice versa.Results remain
same as the symmetric information when the CSR-friendly company is of high type. PROPOSITION 7: At the Sub-game Perfect Nash Equilibrium with asymmetric information, the competitive advantage of the low type CSR-friendly company moderates the negative relationship between the degree of the company’ CSR and the degree of product differentiation when the CSR-friendly company is a high type. However, when the CSR-friendly company is low type, the relationship may become ambiguous, which depends on
probability . COROLLARY 2: At the Sub-game Perfect Nash Equilibrium with asymmetric information, CSR-friendly company’s profit increases when it first initiates the CSR strategy. This holds under both the low type and high type case.
Proof:
Underlying intuition of this result is same as corollary 1. The initiation of a CSR-strategy will lead the firm to act more aggressively and move towards the middle to obtain more market share, resulting in higher profit.
1
0
(2 4 3 )(4 2 4 )0
192
L k k t r k k t
t
1
0
(2 3 )(4 2 4 )0
192
H k t r k k t
t

24
EFFECT OF CSR ON PRODUCT DIFFERENTIATION
IN THE PRESENCE OF COST ADVANTAGE
6. DISCUSSION AND FURTHER RESEARCH In recent times, companies are considering corporate social responsibility (CSR) as a serious business strategy. CSR is not only good for building a positive image of the company for its stakeholders, but it could also make a positive contribution to its bottom line. Because of this, and also because of motivation from various external bodies like governments and UN bodies, more and more companies are incorporating CSR in their operations. One relevant research question that arises from this is explicitly what benefits a firm gets following a CSR strategy compared to another firm that does not adopt CSR. We have considered a game theoretic model that include two firms – one CSR and the other non-CSR – both competing in the same market with substitutable products. We operationalize the CSR firm by making its objective as maximizing a linear combination of its own profit and a form of social utility. We also assume that the CSR firm has a technological advantage so that its marginal cost of production is lower than the non-CSR firm. Our goal is to find to what extent the two firms differentiate their products from each other’s (measured along a Hotelling type line), and how this degree of differentiation is influenced by the extent of cost advantage and the degree of CSR activities. First, a benchmark case where both firms are profit-maximizing (without the CSR objective) was solved to generate a benchmark product differentiation. When the game is played out between the two firms, we find that the degree of product differentiation is reduced when CSR is practiced. On the other hand, product differentiation increases with the production cost advantage. The interaction between the two factors – CSR activity and cost advantage – is also studied. Further, we study an asymmetric information scenario where the extent of production cost advantage of the CSR firm is private information and is not known to the other firm. The cost could be at two levels, a high level with no advantage and a low level as previously considered, with a probability that is common knowledge. The effect of the production cost advantage and the extent of CSR activity are studied in this scenario. We find to what extent the product differentiation is affected by the high and low type firms as well as their effect on each other. Our work can be extended in various ways. The effect of the CSR activity can be studied in interaction with variables other than the production cost advantage as used in our paper. Another example variable could be an elastic demand for each customer that is dependent on the discriminative price. We can also incorporate a variable search cost on part of the customers in the model. The optimal level of CSR for the firm and for the whole value system might be of interest to study as well. Our one-dimensional Hotelling model used for the product differentiation can be extended to a two-dimensional spatial model. Figure following on the next page

25 Journal of Economic and Social Development – Vol 4. No 1., March 2017
Figure 1: Spatial Price Discrimination with Demand Constraints
r
1CS
1 2
LITERATURE: 1. Anderson, S. P. and de Palma, A., 1988. Spatial Price Discrimination with Heterogeneous
Products. The Review of Economic Studies, 55 (4): 573-592. 2. Bateman, T. S. and Snell S. A., 2002. Management: Competing in the New Era (5th ed.).
McGraw-Hill/Irwin: New York. 3. Crifo, P., Diaye, M-A. and Pekovic, S., 2016. CSR related management practices and firm
performance: An empirical analysis of the quantity-quality trade-off on French data. International Journal of Production Economics, 171(3): 405-416.
4. Fernandez-Kranz, D., 2010. How competitors use CSR when market conditions change. Forbes India, Jan 29.
5. http://forbesindia.com/article/ie/how-competitors-use-csr-when-market-conditions-change/7712/1, last accessed March 25, 2016.
26
EFFECT OF CSR ON PRODUCT DIFFERENTIATION
IN THE PRESENCE OF COST ADVANTAGE
6. Fisman, R., Heal, G. and Nair, V., 2014. Corporate Social Responsibility: Doing Well by Doing Good? Available at: http://apps.olin.wustl.edu/jfi/pdf/corporate.social.responsibility.pdf, last accessed March 25, 2016.
7. Gabszewicz, J. and Thisse J-F., 1980. Entry (And Exit) in a Differentiated Industry. Journal of Economic Theory, 22: 327-338.
8. Greenhut, M. L., 1981. Spatial pricing in the United States, West Germany and Japan. Economica, 48(189): 79-86.
9. Greenhut, M. L., Norman, G. and Hung C-S., 1987. The Economics of Imperfect Competition-A Spatial Approach (Cambridge: Cambridge University Press).
10. Hernández-Murillo, R. and Martinek C. J., 2009. Corporate Social Responsibility Can Be Profitable. The Regional Economist, Available at http://www.stlouisfed.org/publications/re/articles/?id=1258, last accessed March 25, 2016.
11. Hsueh, C-F., 2014. Improving corporate social responsibility in a supply chain through a new revenue sharing contract. International Journal of Production Economics ,151: 214-222.
12. Hotelling, H., (1929). Stability in Competition, Economic Journal, 39: 4-57. 13. Hsueh, C-F and Chang, M-S., 2008. Equilibrium analysis and corporate social
responsibility for supply chain integration. European Journal of Operational Research, 190 (1): 116-129.
14. Knowledge@Wharton., 2012. From Fringe to Mainstream: Companies Integrate CSR
Initiatives into Everyday Business,http://www.governance.com.au/board-matters/fx-
view-article.cfm?loadref=2&article_id=3782172A-BB69-7410-6C9FD1349159AEAB, last accessed March 25, 2016.
15. Kopel, M., Lamantia, F. and Szidarovszky, F., 2014. Evolutionary competition in a mixed market with socially concerned firms. Journal of Economic Dynamics & Control , 48: 394-409.
16. KPMG., 2011. International Survey of Corporate Responsibility Reporting of 2011. 17. https://www.kpmg.com/Global/en/IssuesAndInsights/ArticlesPublications/corporate-
responsibility/Documents/2011-survey.pdf, last accessed March 25, 2016. 18. Lacourbe, P., Loch, C. H. and Kavadias, S., 2009. Product Positioning in a Two-
Dimensional Market Space. Production and Operations Management, 18(3): 315-332. 19. Macleod, W. Norman, B., G. and Thisse, J-F., 1985. Price Discrimination and Equilibrium
in Monopolistic Competition. (CORE Discussion Paper 8506). 20. McWilliams, A. and Siegel, D., 2001. Corporate social responsibility: a theory of the firm
perspective. Academy of Management Review, 26(1): 117–127. 21. Robins, R., 2011. Does Corporate Social Responsibility Increase Profits?
http://www.environmentalleader.com/2011/05/26/does-corporate-social-responsibility-increase-profits/, last accessed March 25, 2016.
22. Shaked, A. and Sutton, J., 1982. Relaxing Price Competition Through Product Differentiation. The Review of Economic Studies, 49(1): 3-13.
23. Siegel, D. S. and Vitaliano, D. F., 2007. An Empirical Analysis of the Strategic Use of Corporate Social Responsibility. Journal of Economics and Management Strategy, 16(3): 773-92.

27 Journal of Economic and Social Development – Vol 4. No 1., March 2017
24. Thisse, J. F., and Vives, X., 1988. On the strategic choice of spatial price policy. The American Economic Review, 78(1): 122-137.
25. Van Wassenhove, L. N., 2006.Humanitarian aid logistics: supply chain management in high gear. The Journal of the Operational Research Society, 57 (5), 475-489.
Zhu, Q., Liu, J. and Lai, K-H., 2016. Corporate social responsibility practices and performance improvement among Chinese national state-owned enterprises. International Journal of Production Economics, 171(3) : 417-426.

28
THE CASE OF BREXIT:
AN ANALYSIS OF THE POLITICAL AND ECONOMIC FACTORS
THE CASE OF BREXIT: AN ANALYSIS OF THE POLITICAL AND ECONOMIC FACTORS
Filip Kokotovic
University College of International Relations and Diplomacy Dag Hammarskjöld Zagreb, Ilica 242, Croatia [email protected]
Petar Kurecic
University North, Department of Business Economics, Varaždin, 104. brigade 3, Croatia [email protected]
ABSTRACT
This paper analyses the short-term economic, as well as the long-term political consequences of Brexit. In order to analyse the short-term economic impact, we implement Chow’s test for a structural break on the main stock exchange indexes. Another significant part of this paper is an analysis of the factors that have an impact on the exports of the United Kingdom and whether the potential decrease of the exchange rate will be more relevant than the anticipated decrease of FDI and GDP. This paper concludes that there is significant evidence that there was a negative short-term economic impact caused by Brexit, as well that it might have a detrimental impact on the long-term exports of the United Kingdom. This paper further concludes that Brexit was a unnecessary and avoidable event that might not have happened had there been an accountable political class that fairly and objectively presented the potential consequences of Brexit. Keywords: Brexit, EU, VAR analysis, trade deficit, Chow structural brake test
1. INTRODUCTION On June the 23rd the people of the United Kingdom (further used: UK) delivered a powerful message to the entirety of the European Union (further used: EU) and to their own political establishment. The message at least 52% of them delivered was that they were deeply unsatisfied with the establishment force they perceived the EU to be. There are very few other rational explanations why the people of the UK would choose to inflict economic self-mutilation and bring about a long-term period of political and economic instability, as predicted by Ottaviano et al. (2014) that economic growth would slow down, Springford and White (2014) that it would have a detrimental effect on London as a centre of commerce, as well as the fact that it would have a negative impact on various segments of the economy, especially agriculture as stated by Lang and Schoen (2016), and would not be viewed favourably by any of the UK’s most closest allies (Oliver, 2016:13). All of these predictions,
29 Journal of Economic and Social Development – Vol 4. No 1., March 2017
made between several months and two years prior to Brexit, are now coming true. The promises of the Leave Campaign were constantly refuted by all relevant economic experts, as well as the fact that they were deeply contradictive. Even accepting the absurd claim that leaving the EU would mean 350 million pounds more for the UK every week, the Leave Campaign promised to distribute this money to: maintaining the level of scientific and research work, maintaining European-level payments for less developed regions, ensuring that the NHS would be funded with an increase of 350 million pounds and many other absurd claims that seem difficult to believe that the public accepted.1 The pure level of ignorance involved is displayed by the fact that the next day, the second most searched phrase in the popular search engine google was, ‘what is the EU’.2
Indeed, both the political and the economic backlash of this decision will be felt in the period of at least 5 to 10 years. Of all of the many accomplishments that a country strives towards in such a period, it is difficult to understand why should it spend its time renegotiating trade deals and ensuring that it somehow retains access to the EU Single Market while at the same time not having to adhere to the principle of the free movement of labour. If this seems as an unlikely scenario, especially in the current circumstances where Marine Le Pen is one of the frontrunners for the French 2017 presidency,3 it is that more difficult to understand the unusual decision of the people of the UK. The Brussels institutions will not allow the UK to specify what it desires from post-EU membership because the number of countries that would follow might cause the complete and total dissolution of the European Union.4
So while trying to understand the decisions of the public, one can perhaps correctly state that part of them were deceived by the blatant lies presented by the Leave Campaign and were seduced by an optimistic vision where they could ‘’Take back their future’’.5 It is highly difficult to understand how they plan to have these promises ensured and why the people have such high regard for the concept of the nation-state that has so clearly failed them. But perhaps even less understandable is the decision of the Conservative Party, mainly the former Prime Minister David Cameron, to ever propose such a referendum when he should have been aware of the dangerous and adverse effects that it would have on the economy of his country. Kux and Sverdrup (2007) explained the potential benefits of Norway and Switzerland as non-EU member-states, yet through the arguments presented it will be clarified that the case the United Kingdom currently faces is not comparable to that of Norway or Switzerland. This article will attempt to assess the long-term political fallout of Brexit, as well as empirically asses the short-term economic shortcomings of such a decision.
1These and several others, as well as further information are available
at:http://www.theguardian.com/politics/2016/jun/27/eu-referendum-reality-check-leave-campaign-promises . 2Other popular choices were questions such as ‘What does it mean to leave the EU’ and ‘Which countries are in
the EU’. For further information see: http://www.npr.org/sections/alltechconsidered/2016/06/24/480949383/britains-google-searches-for-what-is-the-eu-spike-after-brexit-vote . 3http://www.irishtimes.com/news/world/europe/favourites-emerge-ahead-of-2017-french-presidential-election-1.2619748 4For further information see: http://www.brusselstimes.com/world/5877/brexit-london-cannot-choose-a-la-carte-what-it-wants-from-the-eu-warns-merkel . 5For further information see: http://www.express.co.uk/news/world/684339/Donald-Trump-Brexit-Britain-America-US-Future-European-Union-Referendum.

30
THE CASE OF BREXIT:
AN ANALYSIS OF THE POLITICAL AND ECONOMIC FACTORS
2. THE POLITICAL AFTERMATH Perhaps the first question that should be asked is what will remain of the United Kingdom as a direct result of this referendum. The second EU referendum clearly paved the path to a second referendum on Scottish secession from the UK.6 This was obvious to perhaps even the casual observer and it should have been something that gave David Cameron and the Tory Party cause for both worry and caution. Perhaps Cameron never believed his own words and scepticism regarding the EU and saw the referendum as an attempt to satisfy both the right wing of his party and to try and further marginalise UKIP. Perhaps, as polls at the time of his re-election indicated, David Cameron never thought he would need to fulfil his promise on an EU referendum.7 If so, he is as guilty of gross negligence as the political elite that have misled the people of the UK into thinking that there will be no economic fallout from Brexit. As emphasized by Copsey and Haughton (2014), the infamous 2013 Cameron speech was perhaps the most radical change in policy from the Tory party towards the EU since the first EU referendum in 1975.
Aside from the potential of Scotland seceding, there is also the potential that the EU institutions and leaders of key states will be less than willing to allow Theresa May and her successors into negotiating a deal that somehow includes complete and non-tariff access to the free market without accepting the full principles of the free movement of labour. Perhaps one clarification should be made here, when talking about access to the Single Market, if at some point the United Kingdom does activate Article 50 of the Lisbon Treaty and complete the (at least) two-year-long negotiating process, the United Kingdom will still be able to have access to the European market. This is guaranteed by the World Trade Organisation. The difference is that it would not have free access to the European market, there could be various tariffs imposed. This could have a potentially adverse effect on the export of the UK, taking into account that it already has a trade deficit.
Many speculated that the fall of David Cameron was imminent in the case the UK voted for leave; many even speculated that in the event of a close vote to remain a challenge was more than likely. Probably, this was the outcome Boris Johnson desired, a very narrow defeat for Leave in which he could have claimed moral victory as a figure that worked against the wishes of the majority of the UK establishment. Johnson as a two-term London Mayor provided the needed legitimacy that many other members of the Leave Campaign clearly did not have. Nigel Farage was known to the wider UK audience, but was far the most part known for his unusual style in the European Parliament rather than political and rhetorical acumen. Michael Gove lacked the leadership skills and has stated on multiple accounts that he was not suited for being the leader of the Tory Party, even using the phrase ‘I did not want it, indeed I did almost everything not be a candidate for the leadership of this party’ at the launch of his campaign.8 This way Johnson was upgraded to the post of Minister
6For further information see:
http://www.heraldscotland.com/news/14464159.Nicola_Sturgeon__Second_referendum_while_I_am_First_Minister/. 7http://www.telegraph.co.uk/news/politics/11010212/Poll-data-David-Camerons-prospects-for-victory-in-2015-cant-be-guaranteed.html 8http://www.theguardian.com/politics/2016/jul/01/michael-gove-launches-tory-leadership-bid-with-brexit-promise.
31 Journal of Economic and Social Development – Vol 4. No 1., March 2017
of Foreign Affairs where he will certainly bare a large amount of responsibility for the Brexit negotiations.
Perhaps the best the UK can hope for is achieving some sort of a compromise that would keep it within the EEA, similarly as Norway. Dhingra and Sampson (2016) advocate such an option, yet what such an option does not take into account is that the positions of Norway and the current positions of the UK are in no way comparable. The UK managed to negotiate a deal that released it from the ‘Ever closer Union’ phrase, as well as several other benefits during the time of the migrant crisis. Due to the timetable Cameron set out, high-ranking EU officials were forced to devote time and effort to keeping the UK in the EU during what might have been one of the most challenging crises since the founding of the EU and in the end several members of Cameron’s own party were key advocates of the Leave campaign. The positions of Norway, that refused to even enter the EU via a referendum in a much less troubled time, and the current position of the UK one year before several key elections in Europe are in no way comparable. The position regarding Norway is also conclusive with the findings of Pettersen, Jenssen and Litshaug (1996:257) that there are no significantly differing patterns in the way that the population of Norway voted in the two referendums. Norway never wanted to be a member-state of the EU, while the UK is perceived as a member that always had its reservations and pursued its own interests beyond any reasonable measure during the time of the 2016 migrant crisis.
3. METHODOLOGY As stated by Coulter and Hancké (2016), it is difficult to attempt to make any objective cost-benefit analysis on Brexit due to the fact that many of the perceived gains, such as the concept of new-gained sovereignty, are simply not quantifiable. The first thing that the paper aims to assess is whether the referendum caused a structural break in significant short-run data that can be observed. Perhaps the most relevant economic short-term data that can be examined is the value of various indexes that display the strength of the companies on the London Stock Exchange. Thus we observe the value of the various UK stock exchange indexes: FTSE 100, FTSE 250 and FTSE SmallCap. In their respected order, these indexes provide us with the value of the top 100 companies listed on the stock exchange (FTSE 100), the 101st to the 351th largest company listed on the London Stock Exchange (FTSE 250) and the 351st to the 619th largest listed companies (FTSE SmallCap) on the London Stock Exchange. The data was extracted from the official website of the London Stock Exchange (2016).
The analysis of these indexes will be conducted by simply regressing each variable on the lags of themselves, as it is not the intention of this article to forecast the future values or test hypotheses. This will be done by using a simple Ordinary Least Squares (OLS) Regression with the basic function:
𝑙𝑛(𝐹𝑇𝑆𝐸𝑡) = 𝛼0 + 𝑙𝑛(𝐹𝑇𝑆𝐸𝑡−1) + ⋯+ 𝑙𝑛(𝐹𝑇𝑆𝐸𝑡−𝑛) + 𝜀𝑡 (1)
Thus, this includes a constant, an error term and the number of lags (n) of the dependent variable that will ensure that the explanatory value of the model is high enough in order for the results to be statistically relevant. After viewing the regression results, the structural break test introduced by Chow (1960) will be conducted.

32
THE CASE OF BREXIT:
AN ANALYSIS OF THE POLITICAL AND ECONOMIC FACTORS
The second part of the empirical analysis will focus on trade. We examine the impact of other relevant variables on trade, which we examine as the dependent variable. All of the variables, as well as the sources of these variables, are presented in Table 1.
Table 1. Variables observed
Variable Abbreviation Source
Trade value Trade UK Office for National Statistics Gross Domestic Value GDP UK Office for National Statistics
Foreign Direct Investment inflows
FDI UK Office for National Statistics
Exchange rate between sterling and the dollar
ER Bank of England
The data is observed for the period from the first quarter of 1998 to the first quarter of 2016, meaning that our overall study has 72 observations for each variable. In theory, based on the research presented in the introduction, following Brexit a decline in GDP and FDI is expected and the ER is supposed to decrease, although based on some research that might actually help increase trade. We discuss this issue in greater detail in the following section. Prior to conducting the model we conduct the stationarity test introduced by Dickey and Fuller (1976). Upon confirming that the variables reject the null hypothesis of non-stationarity, we employ a Vector Autoregressive (VAR) framework, where we focus on the following equation:
𝑇𝑟𝑎𝑑𝑒𝑡 = 𝛼0 + 𝛼1𝐺𝐷𝑃𝑡−1 + ⋯ + 𝛼1,2𝐺𝐷𝑃𝑡−𝑛 + 𝛼2𝑇𝑟𝑎𝑑𝑒𝑡−1 + ⋯+ 𝛼2,1𝑇𝑟𝑎𝑑𝑒𝑡−𝑛 +𝛼3𝐹𝐷𝐼𝑡−1 + ⋯+ 𝛼3,1𝐹𝐷𝐼𝑡−𝑛 + 𝛼4𝐸𝑅𝑡−1 + 𝛼4,1𝐸𝑅𝑡−𝑛 + 𝜀𝑡 (2)
Therefore, we include a constant, an error term and the number of lags (n) as proposed by the information criterion originally introduced by Akaike (1974) and the variables are abbreviated as described in Table 1. Based on the VAR model, we will examine the Impulse Response Functions (IRFs) based on the work of Sims (1980) that will display how Trade reacts to an impulse of each of the explanatory variables while holding the value of the variables whose impulse is not being examined constant. Based upon these results, as well as the results of the variance decomposition, it will be possible to evaluate the short-term economic results that are highly probable because of the Brexit.
4. RESULTS AND DISCUSSION The plotted figures of the FTSE 250 index is presented in Figure 1, as we can clearly see there has been a mostly decreasing trend in the value of the indexes for the majority of the year. The summary statistics are provided in the appendix.

33 Journal of Economic and Social Development – Vol 4. No 1., March 2017
Figure 1. FTSE 250 value Source: London Stock Exchange, http://www.londonstockexchange.com/statistics/ftse/ftse.htm(30/07/2016)
As we can clearly see from the value of the FTSE 250 index, the value of the index started to decline strongly in February, which coincides with the formal start of the referendum campaigns. The mostly stable values after that can to a degree be explained by the market regaining confidence because most polls indicated, up until a month prior to Brexit, that remain would prevail. Generally, the market, a large part of the Tory and Labour Party and indeed most of the country appeared to have sleepwalked into Brexit largely unprepared. The second strong shock occurs of 24th of July, when the FTSE 250 index declined by more than 7%. The decline persisted on the 25th, but since then the market has partially recovered. In Table 1 the results of the Chow test for structural break, as well as other key statistics of the regressions, are displayed.
Table 2. Chow test and key regression statistics
FTSE 100 FTSE 250 FTSE SmallCap
R-squared 0.9118 0.7847 0.9139 Adjusted R-squared 0.9103 0.7769 0.9132
Lag length 2 4 1 F statistic 594.56**
(0.000) 101.12** (0.000)
1241.97** (0.000)
Akaike criterion −715.012 -667.58 −801.92 Standard error of
regression 0.0115 0.013 0.0083
Durbin Watson statistic 1.987 1.889 2.353 Chow test statistic for
structural break on June 23th
2.773* (0.044)
3.3873** (0.007)
5.513** (0.005)
Source: Authors’ calculations and GRETLE output Note: values in the parenthesis represent the p value. * and ** indicate statistical significance at the respected 0.05 and 0.01 levels of significance.
13500140001450015000155001600016500170001750018000
FTSE 250

34
THE CASE OF BREXIT:
AN ANALYSIS OF THE POLITICAL AND ECONOMIC FACTORS
As can be seen from Table 1, all of the models are statistically significant based on the value of the F statistic at the 1% significance level. The explanatory value of all 3 models is relatively high, with an R-squared value between 0.7847 and 0.9139. The results of the Chow structural break test indicate that we find evidence of a structural break in all 3 of the observed indexes. In the indexes that measure the value of smaller companies, we may reject the null hypothesis of no structural break at the 1% significance level, while the null hypothesis of no structural break in FTSE 100 can be rejected at the 5% significance level. This clearly means that there was a negative impact on all of the indexes observed caused by Brexit. The smaller companies seem to have had a more pronounced negative impact in comparison to FTSE, where the structural brake was not as pronounced. After analysing the FTSE indexes, we perform an analysis on the effect on Britain’s trade. The UK already has a trade deficit and one of the arguments of the Brexit campaign was that even if the value of sterling decreases, it will help promote increased exports. The UK currently does have a trade deficit and most of its exports are to EU member-states (UK Office for National Statistics, 2016). In Table 3, we provide key statistics regarding the VAR model where Trade is the dependent variable, which is specified at the lag length of 2, based upon the Akaike information criterion.
Table 3. Key statistics of Trade VAR model
R-squared 0.6153 Adjusted R-squared 0.5648 Mean dependent var 10.572 S.D. dependent var 0.084
Sum squared resid 0.1889 S.E. of regression 0.0556 Autocorrelation LM
test statistic 4.937
Autocorrelation test
statistic P value 0.0948
F(8, 61) 12.193 P-value(F) 0.000
Source: Authors’ calculations and GRETLE output
The explanatory value of the model is satisfactory and the model is statistically significant at the 1% significance level, which enables us to perform the IRFs and view the results of the variance decomposition. The results of the tests for autocorrelation is presented in Table 1 and indicates that we fail to reject the null hypothesis at the 5% significance level, while the VAR inverse roots in relation to the unit circle may be viewed in the appendix. The results of all these tests confirm that the model is adequately specified. In Figure 1, we present the IRF for an impulse of a shock in GDP, FDI and ER in Trade.
Figure following on the next page
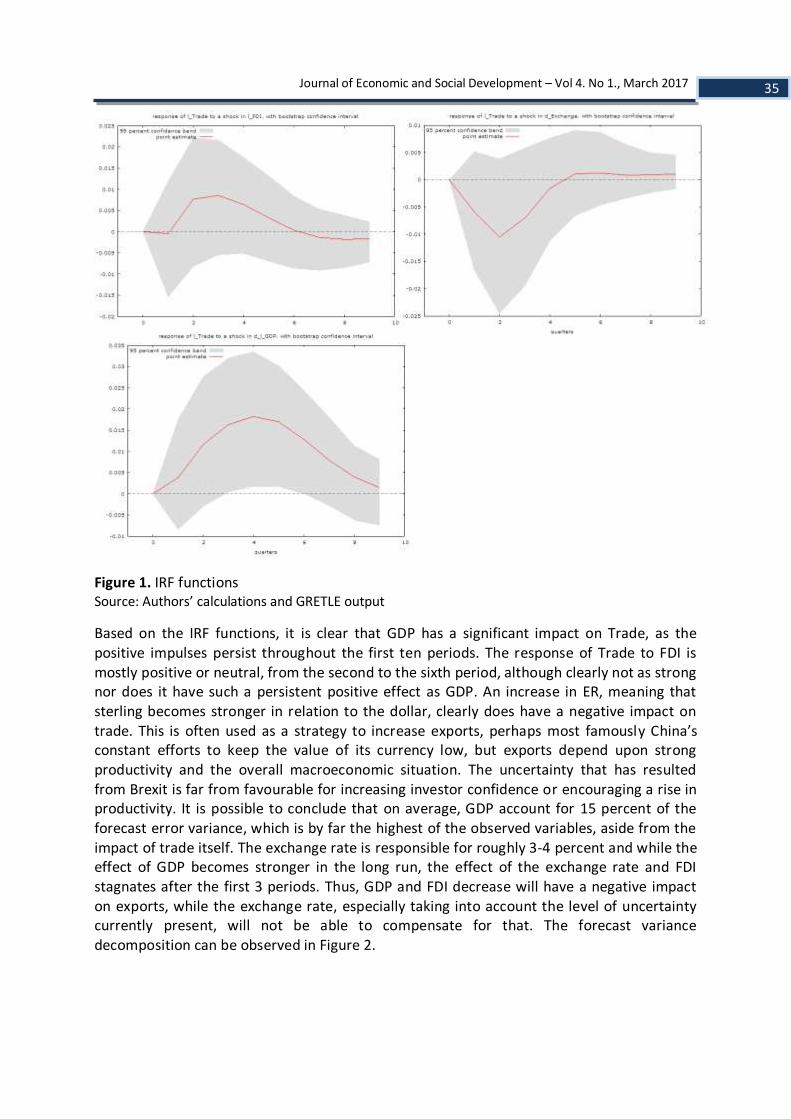
35 Journal of Economic and Social Development – Vol 4. No 1., March 2017
Figure 1. IRF functions Source: Authors’ calculations and GRETLE output
Based on the IRF functions, it is clear that GDP has a significant impact on Trade, as the positive impulses persist throughout the first ten periods. The response of Trade to FDI is mostly positive or neutral, from the second to the sixth period, although clearly not as strong nor does it have such a persistent positive effect as GDP. An increase in ER, meaning that sterling becomes stronger in relation to the dollar, clearly does have a negative impact on trade. This is often used as a strategy to increase exports, perhaps most famously China’s constant efforts to keep the value of its currency low, but exports depend upon strong productivity and the overall macroeconomic situation. The uncertainty that has resulted from Brexit is far from favourable for increasing investor confidence or encouraging a rise in productivity. It is possible to conclude that on average, GDP account for 15 percent of the forecast error variance, which is by far the highest of the observed variables, aside from the impact of trade itself. The exchange rate is responsible for roughly 3-4 percent and while the effect of GDP becomes stronger in the long run, the effect of the exchange rate and FDI stagnates after the first 3 periods. Thus, GDP and FDI decrease will have a negative impact on exports, while the exchange rate, especially taking into account the level of uncertainty currently present, will not be able to compensate for that. The forecast variance decomposition can be observed in Figure 2.
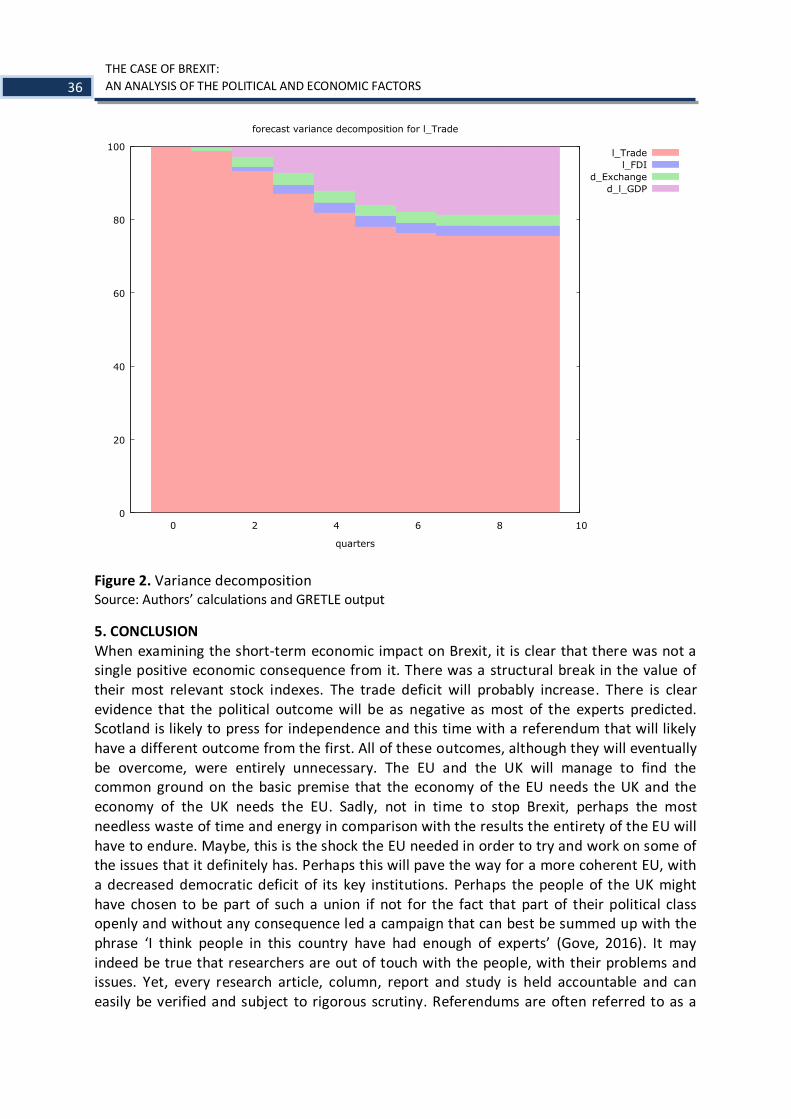
36
THE CASE OF BREXIT:
AN ANALYSIS OF THE POLITICAL AND ECONOMIC FACTORS
Figure 2. Variance decomposition Source: Authors’ calculations and GRETLE output
5. CONCLUSION When examining the short-term economic impact on Brexit, it is clear that there was not a single positive economic consequence from it. There was a structural break in the value of their most relevant stock indexes. The trade deficit will probably increase. There is clear evidence that the political outcome will be as negative as most of the experts predicted. Scotland is likely to press for independence and this time with a referendum that will likely have a different outcome from the first. All of these outcomes, although they will eventually be overcome, were entirely unnecessary. The EU and the UK will manage to find the common ground on the basic premise that the economy of the EU needs the UK and the economy of the UK needs the EU. Sadly, not in time to stop Brexit, perhaps the most needless waste of time and energy in comparison with the results the entirety of the EU will have to endure. Maybe, this is the shock the EU needed in order to try and work on some of the issues that it definitely has. Perhaps this will pave the way for a more coherent EU, with a decreased democratic deficit of its key institutions. Perhaps the people of the UK might have chosen to be part of such a union if not for the fact that part of their political class openly and without any consequence led a campaign that can best be summed up with the phrase ‘I think people in this country have had enough of experts’ (Gove, 2016). It may indeed be true that researchers are out of touch with the people, with their problems and issues. Yet, every research article, column, report and study is held accountable and can easily be verified and subject to rigorous scrutiny. Referendums are often referred to as a
0
20
40
60
80
100
0 2 4 6 8 10
quarters
forecast variance decomposition for l_Trade
l_Trade
l_FDI
d_Exchange
d_l_GDP

37 Journal of Economic and Social Development – Vol 4. No 1., March 2017
‘festival of democracy’ and it is truly sad when they are marked by blatant lies and the people rethinking their vote the following day. A potentially historic decision was made, but several premises upon which the people made their decision were clearly not based on any fact, especially the 350 million pound-per-week promise. Clearly, the EU is not the only one facing its fair share of difficulties. In the trying times ahead it will become increasingly important to have a political class that works based on accountability and understanding of the facts rather than manipulating people’s feeling about facts that are not necessarily true.
LITERATURE:
1. Akaike, H. (1974). “A new look at the statistical model identification”. IEEE Transactions
on Automatic Control 19(6): 716-723.
2. Bank of England. http://www.bankofengland.co.uk/statistics (01/08/2016)
3. Chow, G.C. (1960). ‘’Test of Equality between Sets of Coefficients in two Linear
Regressions’’. Econometrica 28(3): 591-605.
4. Copsey, N. and T. Haughton. (2014). ‘’Farewell Britannia? ‘Issue Capture’ and the Politics
of David Cameron's 2013 EU Referendum Pledge’’. Journal of Common Market Studies
52: 74-89.
5. Coulter, S. and B. Hancké. (2016). ‘’A Bonfire of the Regulations, or Business as Usual?
The UK Labour Market and the Political Economy of Brexit’’. The Political Quarterly 87(2):
148–156.
6. Dhingra, S. and T. Sampson. (2016). ‘’Life after BREXIT: What are the UK’s options outside
the European Union?’’. Centre for Economic Performance. Available from:
http://cep.lse.ac.uk/pubs/download/brexit01.pdf (15/07/2016)
7. Dickey, D.A. and W.A. Fuller. (1979). “Distribution of the Estimators for Autoregressive
Time Series with a Unit Root”. Journal of the American Statistical Association 74: 427-
431.
8. Gove, M. Statement in referendum debate. Available from:
http://www.telegraph.co.uk/news/2016/06/06/eu-referendum-who-needs-experts-
when-weve-got-michael-gove/ (03/08/2016)
9. Kux, S. and U. Sverdrup. (2007). ‘’Fuzzy borders and adaptive outsiders: Norway,
Switzerland and the EU’’. Journal of European Integration 22(3): 237 – 270.
10. Lang, T. and V. Schoen. (2016). ‘’Food, the UK and the EU: Brexit or Bremain?’’ Food
Research Collaboration. Available from: http://openaccess.city.ac.uk/14896/
(30/07/2016)
11. Official Web-site of the London Stock Exchange.
http://www.londonstockexchange.com/statistics/ftse/ftse.htm (30/07/2016)
12. Oliver, T. (2016). ‘’A European Union without the United Kingdom: The Geopolitics of a
British Exit from the EU. ‘’ LSE IDEAS Strategic Update. Available from:
http://www.lse.ac.uk/IDEAS/publications/reports/pdf/A-EU-without-the-UK-LSE-IDEAS-
Strategic-Update.pdf (30/07/2016)

38
THE CASE OF BREXIT:
AN ANALYSIS OF THE POLITICAL AND ECONOMIC FACTORS
13. Ottaiano G. et al. (2014). ‘’Brexit or Fixit? The Trade and Welfare Effects of Leaving the
European Union’’. Centre for Economic Performance. Available from:
http://eprints.lse.ac.uk/57958/1/__lse.ac.uk_storage_LIBRARY_Secondary_libfile_shared
_repository_Content_Centre_for_Economic_Performance_Policy%20Analysis_pa016.pdf
(30/07/2016)
14. Pettersen, P.A., A.T Jensssen and O. Litshaug. (1996). ‘’The 1994 EU Referendum in
Norway: Continuity and Change’’. Scandinavian Political Studies 19(3): 257 – 281.
15. Sims, C.A. (1980). ‘’Macroeconomics and Reality’’.Econometrica, 48: 1 – 48.
16. Springford, J. and P. Whyte. (2014). ‘’The consequences of Brexit for the City of London’’.
Centre for European Reform. Available from:
http://www.cer.org.uk/sites/default/files/publications/attachments/pdf/2014/pb_city_b
rexit_js_pw_8may14-8816.pdf (30/07/2016)
17. United Kingdom Office for National Statistics. www.ons.gov.uk (02/08/2016)
18. http://www.brusselstimes.com/world/5877/brexit-london-cannot-choose-a-la-carte-
what-it-wants-from-the-eu-warns-merkel (15/07/2016)
19. http://www.express.co.uk/news/world/684339/Donald-Trump-Brexit-Britain-America-
US-Future-European-Union-Referendum (15/07/2016)
20. http://www.heraldscotland.com/news/14464159.Nicola_Sturgeon__Second_referendu
m_while_I_am_First_Minister/ (16/07/2016)
21. http://www.npr.org/sections/alltechconsidered/2016/06/24/480949383/britains-
google-searches-for-what-is-the-eu-spike-after-brexit-vote (15/07/2016)
22. http://www.irishtimes.com/news/world/europe/favourites-emerge-ahead-of-2017-
french-presidential-election-1.2619748 (15/07/2016)
23. http://www.telegraph.co.uk/news/politics/11010212/Poll-data-David-Camerons-
prospects-for-victory-in-2015-cant-be-guaranteed.htm (15/07/2016)
24. http://www.theguardian.com/politics/2016/jun/27/eu-referendum-reality-check-leave-
campaign-promises (15/07/2016)
25. http://www.theguardian.com/politics/2016/jul/01/michael-gove-launches-tory-
leadership-bid-with-brexit-promise (16/07/2016
APPENDIX
In Table A1, key descriptive statistics regarding the FTSE indexes are provided.
Table A1. Summary statistics of FTSE indexes
FTSE 100 FTSE 250 FTSE SmallCap
Mean 6226.4 16666 4516.5 Median 4541.1 16789 4541.1
Minimum 4145.6 14968 4145.6 Maximum 4774.9 17334 4774.9
Standard deviation 247.13 477.90 126.22 Skewness 0.21087 -1.3957 -1.0137

39 Journal of Economic and Social Development – Vol 4. No 1., March 2017
Source: Authors’ calculations and GRETLE output
In figure A1, it is possible to see that the VAR inverse roots conform to the stability condition
and that the model is adequately specified.
Figure A1. VAR inverse roots in relation to the unit circle
Source: Authors’ calculations and GRETLE output
0 0.5 1
VAR inverse roots in relation to the unit circle
40
EXPLORING INTERNATIONAL TOURISM TRENDS IN THE MEDITERRANEAN:
CONVERGENCE OR BIG DIVERGENCE
EXPLORING INTERNATIONAL TOURISM TRENDS IN THE MEDITERRANEAN: CONVERGENCE OR BIG DIVERGENCE
Zdravko Sergo
Institute of Agriculture and Tourism Poreč, Croatia [email protected]
Grzinic Jasmina
University Jurja Dobrile in Pula, Croatia [email protected]
ABSTRACT Triggered by the phenomenon of globalisation and unrest on both sides of Mediterranean, during recent decades there has been a process of tourism travelling re-switching in the tourism expenditure domain; hence the debate over convergence or divergence of the international tourism flows, caused by abruptly fall out of vogue of some destinations due to negative shocks produced by unrest in that volatile region, has never ended. Following on the extensive multidisciplinary literature on this issue, the purpose of this paper is two-fold 1) to apply a traditional analysis of convergence (sigma and beta convergence) in tourism demand flows and Principal Component and Cluster Analyses to investigate on the existence of different international tourism models, 2) to analyse tourism receipts expressed as a share of total and derive a possible classification of the countries and its profiles by means of a multivariate approach. This paper tries to test the hypothesis of convergence of tourism demand in Mediterranean area. We considered a sample of 20 Mediterranean countries, and used data from the World Indicator Database 1995-2015, keeping all relevant variables that interfere with international tourism demand in that region. The excepted results of this paper can be interpreted as a further contribution to the literature on contemporary positive economics in the international tourism domain. Keywords:Tourism demand, receipts, arrivals, convergence, Principal Component Analysis, Cluster Analysis
1. INTRODUCTION After the post-WWII emergence of mass travel, the richness of the scenery of its coastal environment, its mild climate, and its impressive cultural heritage turned the Mediterranean into
a significant tourist draw. The Mediterranean basin, if considered as a single area, is by far the largest global tourism destination, attracting almost a third of the world’s international tourists (306 million out of 980 million worldwide) and generating more than a quarter of international tourism receipts (190 out of 738 billion Euro worldwide). It is forecasted that
41 Journal of Economic and Social Development – Vol 4. No 1., March 2017
the Mediterranean region will reach 500 million of international tourist arrivals by 2030 (UNWTO 2012). (GRID-Arendal, 2013). Do the tourism economy on Mediterranean region and its sector economy shares within countries in the region: converge? The following research question is asked in this paper in an effort to analyze the main problem: whether tourism trends in recent decades push the regional tourism growth in a convergence direction and can we explain and predict the probability that a hypothetical country (saying Croatia, particularly) constitute specific profile linked to convergence? The paper is organized as follows. The next section begins by literature overview and theoretical considerations about tourism convergence in the region, and after mapping out the research strategy, we introduce the dataset. The next chapter shows descriptive analyses carried out on these international tourism flow trends, while in proceeding we carry out the convergence analyses on the whole dataset. The subsequent section presents and discusses the empirical results in Principal Component Analysis (PCA) and Cluster Analysis (CA), and the final section concludes. 2. LITERATURE PREVIEW Our research introduces the clustering of tourism countries in Mediterranean region with the intention of explaining the convergence hypothesis within the design methodology. In the existing tourism economics literature, we have not found a valid justification for such a direction of research, most probably due to our original design. We will refer only to a smaller portion of recent empirical research relating to convergence in regard to tourism. Korres et al(2008) investigates and attempts to explain the role and socio-economic effects of tourism activities in the convergence and divergence process of European regions (in an attempt to interpret the so-called Dutch Disease phenomenon). Narayan (2007) test the convergence hypothesis by examining visitor arrivals to Fiji from eight tourist sources markets, and find strong statistical evidence by unit root and cointegration testing that Fiji’s tourism markets converge.Ozan Bahar at al ( 2013) analyze whether or not there is any convergence between top ten countries, listed by World Tourism Organization, which have the largest volume of visitor arrivals in similar venue by cointegration technique. In the context of analyzing services confidence convergence among old and new EU Member States, Vojinovid at al(2016) put a special focus on convergence in tourism sector. By analyzing β convergence they tested the volume of tourist arrivals and nights spent by tourists and find no convergence. 3. THE MEDITERRANEAN BASIN AND TOURISM CONVERGENCE Each Mediterranean state traditionally has viewed its tourist product as competing with that of neighboring states (Apostolopoulosk; Sönmez, 2000). Any single Mediterranean country is small with respect to the global tourism market. In regard to convergence idea, once the small Mediterranean country finds a tourism supply niche in which it can compete, it can expand. What matters is a country’s relative endowment of the natural resource, rather than its absolute size (Lanza; Pigliaru, 2000).As it does, a country specialized, learns, achieves greater scale, and becomes more efficient in attracting tourism demand. Saying, we assume that a one Mediterranean country has 10 percent market share in the region. Now suppose the tourism induced invisible export is growing 15 percent a year while the global tourism demand is growing at 5 percent. Then, after a year, the market share of the tourism export sector for that country will be 11 percent, not a large change in absolute numbers, but the

42
EXPLORING INTERNATIONAL TOURISM TRENDS IN THE MEDITERRANEAN:
CONVERGENCE OR BIG DIVERGENCE
growth rate is very high. But the hard part about convergence on account of equalizing comparative advantage (mainly compose of various rental objects as a antiquities, culture, history, sun, sea, sand, and fun at Mediterranean costal states) is that is not a static condition. It shifts continuously over time, in parallel with investment, tour operator oligopolistic strategy, wars and political turning points, and ultimately, with prices and wages. Tourism demand shifts around the regional tourism economy, driving structural shifts in both developing and advanced tourism economies along Mediterranean coastal tourism centers. 4. DATA AND METHODOLOGY We consider a sample of 20 Mediterraneancountries: Albania, Algeria, Bosnia and Herzegovina, Croatia, Cyprus, Egypt, France, Greece, Israel, Italy, Lebanon, Libya, Malta, Montenegro, Morocco, Slovenia, Spain, Syria, Tunisia, Turkey; we use data on international tourism flows registered for the period 1995-2014 by the WTO World Development Indicator Database (http://data.worldbank.org/data-catalog/world-development-indicators). The time interval chosen is particularly interesting for a study on tourism flow trends as it is characterized by increasedvolatility. For the Mediterranean in particular, there are at least few possible explanationsfor the high volatility of inbound tourism. First, the region has been continuously subject to dramatic events that endanger the safety of visitors. Among these are theBalkan Wars (1991 -1999); the Arab Springs and wars as an aftermath (2009-2014); debt crisis in Greece (2011- ), the terrorist acts, and recently, the refuge crisis (2013- ).The frequency and severity of suchoccurrences strongly influence the risk perception of prospective travelers to theregion, causing them to switch to alternative destinations most likely from one country (that become and stays loser for some time) to another (winner) along the Mediterranean rim. The definition of international tourism variables sourced from the WTO development indicator Database and used in the analysis are: 1.AS=number of arrivals (arrivals in relation to the region’s total territory); 2.RCD=receipts in current US$ (receipts in relation to the region’s total territory); 3.RXPZS=receipts (% of total exports, receipts in relation to the region’s total territory); 4.RTRFRCD=receipts for passenger transport items in current US$ (receipts in relation to the region’s total territory); 5.RTVLITCD=receipts for travel items in current US$ (receipts in relation to the region’s total territory); 6.AIRPAS=air transport, passengers carried (passengers in relation to the region’s total territory); 7.ASPOP=number of arrivals to population ratio (arrivals to population in relation to the region’s total territory); 8.REXP=receipts to expenditures in current US$ (ratio, in relation to the region’s total territory); 9.RCDGDP=receipts divided to GDP in current US$ (in relation to the region’s total territory).As the primary focus of the paper is comparing data on national tourism levels, we use all variables expressed as a percentage or share in the region's total. Figure following on the next page

43 Journal of Economic and Social Development – Vol 4. No 1., March 2017
Figure 1: International Tourism Trends in the Mediterranean region (Author's calculation, all variables are at their means) 5. DESCRIPTIVE ANALYSIS Figure 1 shows the average level of international tourism variables (and other than interfere to tourism, as air passengers carried for example) registered in our sample for 4 of the time interval studied: 1995-99, 2000-04, 2005-09, 2010-14. The first variable illustrates arrivals divided by countries of destination, with countries classified according to WTO criteria. The decline in statistical mean highlights an important stylized fact: starting from an initial situation dominated by France, Spain and Italy (majority of arrivals in Mediterranean region), the period 1995-2014 witnessed a progressive shift in the geographical distribution of arrivals. The all three major destination noticed fall of arrival share. For France, the shift in arrival share was more striking (from 37% to 26.5%), and that fact would prop up very likely convergence hypothesis in affirmative direction, later on, in formal part of analysis. Generally speaking, such redistribution favored a few countries in the region, foremost: Croatia, Morocco, and Turkey. But the greatest beneficiary of this redistribution was despite all Croatia (passing from a share of 0.9% in 1995 to a share of 3.7 % in 2014). Into majority of countries in the region international arrivals share grew quite slowly (Algeria, Albania, Lebanon, Egypt), or nothing at all (B&H, Malta, Libya, Israel, Greece, Slovenia, Tunisia, Syria) during the
period 1995-2014.Comparing dynamics of 1995-99 to 2010-14, an obviously decrease in tourism mean share appears evident in other areas referring to international receipts. The sectors labeled RXPZS, ASPOP, REXP and RCDGDP, despite the trend of falling share in 1995-2009 increased during the period considered afterwards. Figures 2 show RCDGDP trends for each of the countries in our sample as compared with the regional share value. Among them the RCDGDP as additional variable shows somehow atypical or dysfunctional behavior characterizes over the last period analyzed.
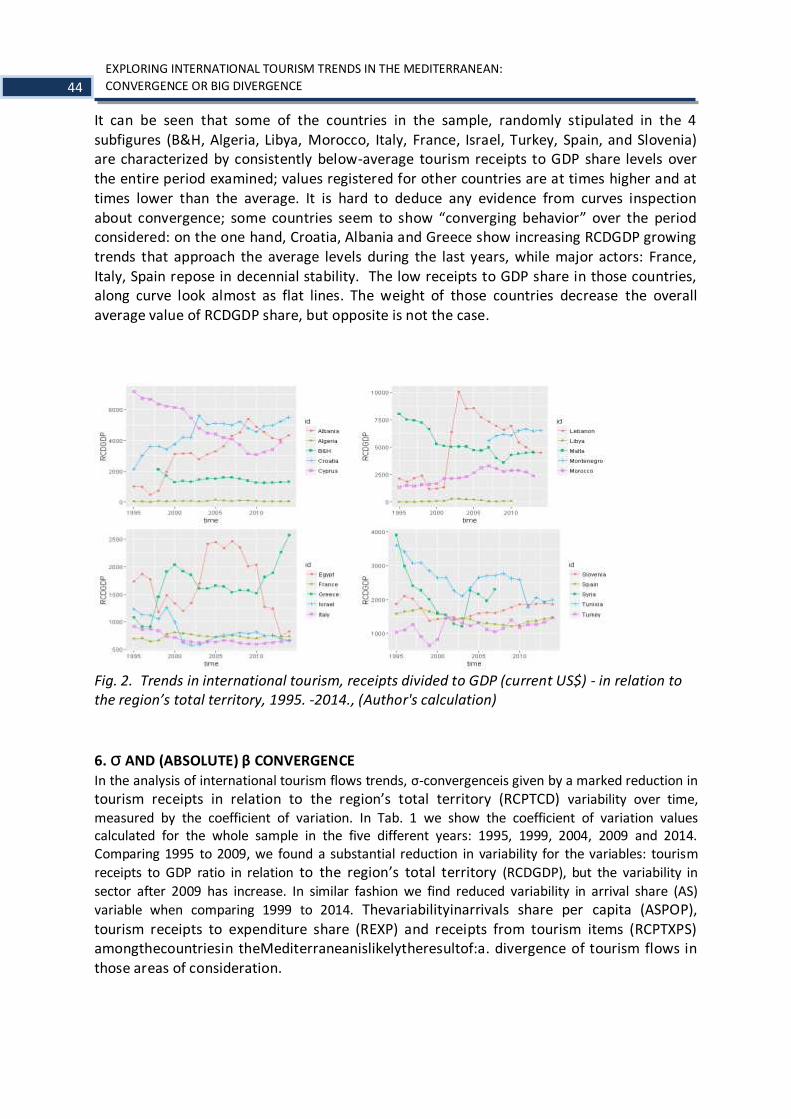
44
EXPLORING INTERNATIONAL TOURISM TRENDS IN THE MEDITERRANEAN:
CONVERGENCE OR BIG DIVERGENCE
It can be seen that some of the countries in the sample, randomly stipulated in the 4 subfigures (B&H, Algeria, Libya, Morocco, Italy, France, Israel, Turkey, Spain, and Slovenia) are characterized by consistently below-average tourism receipts to GDP share levels over the entire period examined; values registered for other countries are at times higher and at times lower than the average. It is hard to deduce any evidence from curves inspection about convergence; some countries seem to show “converging behavior” over the period considered: on the one hand, Croatia, Albania and Greece show increasing RCDGDP growing trends that approach the average levels during the last years, while major actors: France, Italy, Spain repose in decennial stability. The low receipts to GDP share in those countries, along curve look almost as flat lines. The weight of those countries decrease the overall average value of RCDGDP share, but opposite is not the case.
Fig. 2. Trends in international tourism, receipts divided to GDP (current US$) - in relation to the region’s total territory, 1995. -2014., (Author's calculation)
6. σ AND (ABSOLUTE) β CONVERGENCE In the analysis of international tourism flows trends, σ-convergenceis given by a marked reduction in
tourism receipts in relation to the region’s total territory (RCPTCD) variability over time,
measured by the coefficient of variation. In Tab. 1 we show the coefficient of variation values calculated for the whole sample in the five different years: 1995, 1999, 2004, 2009 and 2014. Comparing 1995 to 2009, we found a substantial reduction in variability for the variables: tourism
receipts to GDP ratio in relation to the region’s total territory (RCDGDP), but the variability in
sector after 2009 has increase. In similar fashion we find reduced variability in arrival share (AS)
variable when comparing 1999 to 2014. Thevariabilityinarrivals share per capita (ASPOP), tourism receipts to expenditure share (REXP) and receipts from tourism items (RCPTXPS) amongthecountriesin theMediterraneanislikelytheresultof:a. divergence of tourism flows in those areas of consideration.
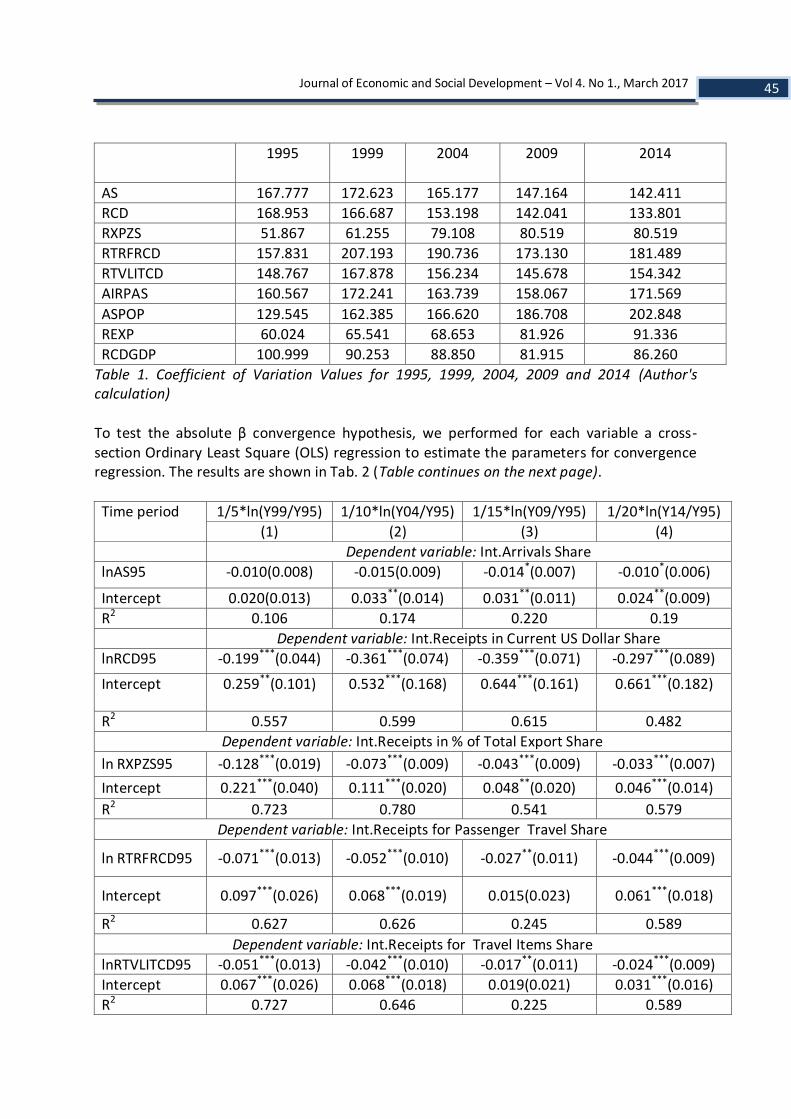
45 Journal of Economic and Social Development – Vol 4. No 1., March 2017
1995 1999 2004 2009 2014
AS 167.777 172.623 165.177 147.164 142.411
RCD 168.953 166.687 153.198 142.041 133.801
RXPZS 51.867 61.255 79.108 80.519 80.519
RTRFRCD 157.831 207.193 190.736 173.130 181.489
RTVLITCD 148.767 167.878 156.234 145.678 154.342
AIRPAS 160.567 172.241 163.739 158.067 171.569
ASPOP 129.545 162.385 166.620 186.708 202.848
REXP 60.024 65.541 68.653 81.926 91.336
RCDGDP 100.999 90.253 88.850 81.915 86.260
Table 1. Coefficient of Variation Values for 1995, 1999, 2004, 2009 and 2014 (Author's calculation) To test the absolute β convergence hypothesis, we performed for each variable a cross-section Ordinary Least Square (OLS) regression to estimate the parameters for convergence regression. The results are shown in Tab. 2 (Table continues on the next page).
Time period 1/5*ln(Y99/Y95) 1/10*ln(Y04/Y95) 1/15*ln(Y09/Y95) 1/20*ln(Y14/Y95)
(1) (2) (3) (4)
Dependent variable: Int.Arrivals Share
lnAS95 -0.010(0.008) -0.015(0.009) -0.014*(0.007) -0.010*(0.006)
Intercept 0.020(0.013) 0.033**(0.014) 0.031**(0.011) 0.024**(0.009)
R2 0.106 0.174 0.220 0.19
Dependent variable: Int.Receipts in Current US Dollar Share
lnRCD95 -0.199***(0.044) -0.361***(0.074) -0.359***(0.071) -0.297***(0.089)
Intercept 0.259**(0.101) 0.532***(0.168) 0.644***(0.161) 0.661***(0.182)
R2 0.557 0.599 0.615 0.482
Dependent variable: Int.Receipts in % of Total Export Share
ln RXPZS95 -0.128***(0.019) -0.073***(0.009) -0.043***(0.009) -0.033***(0.007)
Intercept 0.221***(0.040) 0.111***(0.020) 0.048**(0.020) 0.046***(0.014)
R2 0.723 0.780 0.541 0.579
Dependent variable: Int.Receipts for Passenger Travel Share
ln RTRFRCD95 -0.071***(0.013) -0.052***(0.010) -0.027**(0.011) -0.044***(0.009)
Intercept 0.097***(0.026) 0.068***(0.019) 0.015(0.023) 0.061***(0.018)
R2 0.627 0.626 0.245 0.589
Dependent variable: Int.Receipts for Travel Items Share
lnRTVLITCD95 -0.051***(0.013) -0.042***(0.010) -0.017**(0.011) -0.024***(0.009)
Intercept 0.067***(0.026) 0.068***(0.018) 0.019(0.021) 0.031***(0.016)
R2 0.727 0.646 0.225 0.589

46
EXPLORING INTERNATIONAL TOURISM TRENDS IN THE MEDITERRANEAN:
CONVERGENCE OR BIG DIVERGENCE
Dependent variable: Air Transport Share Share
lnAIRPAS95 -0.128***(0.019) -0.073***(0.009) -0.043***(0.009) -0.033***(0.007)
Intercept 0.221***(0.040) 0.111***(0.020) 0.048**(0.020) 0.046***(0.014)
R2 0.723 0.780 0.541 0.579
Dependent variable: Int.Arrivals Share /Population Share*10
lnASPOP95 -0.038(0.045) -0.016(0.021) -0.004(0.013) 0.001(0.009)
Intercept 0.194***(0.066) 0.379***(0.032) 0.117***(0.019) 0.142***(0.014)
R2 0.038 0.030 0.005 0.0002
Dependent variable: Int.Receipts/Expenditure in Current US Dollar Share
lnREXP95 -0.032***(0.010) -0.043***(0.010) -0.018**(0.007) -0.031***(0.007)
Intercept 0.012(0.012) 0.013(0.012) 0.009(0.009) 0.013(0.008)
R2 0.354 0.524 0.251 0.544
Dependent variable: Int.Receipts/GDP in Current US Dollar Share
lnRCDGDP95 -0.052**(0.024) -0.046***(0.009) -0.028***(0.006) -0.031***(0.006)
Intercept -0.012(0.040) 0.034**(0.015) 0.025**(0.011) 0.020*(0.011)
R2 0.205 0.584 0.512 0.573
Note: # observ.= 20 countries; *p<0.1; **p<0.05; ***p<0.01 Table 2: Absolute beta convergence. Cross-section OLS regression results, (Author's calculation)
Support for the absolute β convergencehypothesis is found for the all considered variables excluding only: AS and ASPOP. In the paper of Vojnid at al (2013), regarding the results of testing β convergence for arrivals and overnight stays variables in tourism sector, over the period between the years 2003 and 2011, no convergence was found; either. For all these variables, regression results show an acceptable value of R2, while all coefficients are significant at least 5% and, as expected, have a negative sign.
7. PRINCIPAL COMPONENT AND CLUSTER ANALYSES The results of the previous paragraph show convergence for almost all of the variables considered (besides two variables that referring to international arrivals). Anyway, in order to obtain more detailed information about the position of each country as regards convergence variables and time span 1995-2014 considered, we decided to perform a multidimensional analysis (MDA) by means of a Hierarchical Cluster Analysis based on a Principal Component Analysis (PCA). In the proceeding our analysis is processed using FactoMineR&factoextra packages adopted by R (Husson at al, 2007; Kassambara & Mundt, 2016). The variables considered are the same as for the convergence analysis, without AS and ASPOP. We consider the average value in the period 1995-2014, for included variables. This solution helps to obtain a factorial plan and to reduce the bias of all possible expenditure outliers in a single year. On the other hand panel structure (time and cross-sectional data) in cluster analysis have no sense, because one country can be positioned in multiple clusters. PCA projects observations (Mediterranean country), thereby reducing a 7-dimensional space (7 initial variables) to a lower dimensional space while preserving as much information as possible.

47 Journal of Economic and Social Development – Vol 4. No 1., March 2017
The first couple of eigenvalues have a cumulative percentage of variance of 87.32%, which entails a 12.68% information loss for a bidimensional space for the analysis. Our present result is a model case for clear-cut analysis. The first two principal components explain more than 87% of the variance. The best situation is when the first two or three components "explain" about 80% of total variance (Escaith, Gaudin, 2014). From this point on, a new research direction appears, as we can use these two factors, nominate it and use it for a hierarchisation of the countries, visible in a space of only two dimension and not 7 dimensions, one for each variable, as it was before the PCA. ThePCA reduces a p-multiple dimensional space (p: number of initial variables, 7 in the present case) to a lower dimensional space, correlated with the initial dimensions (see Table 3) while preserving as much information (or variance) as possible.
Our auxiliary figure (which due to lack of space in this paper is missing) draw the results of the projection of variables according to the first two principal components; to facilitate the interpretation of these two factorial axes, Table 3 displays the main correlations between the two first axis and the variables.
Variable F1: receipts &flyingafargreater
F2: economiesdependentontourism
RCD 0.949 0.289
RXPZS -0.418 0.734
RTRFRCD 0.926 0.280
RTVLITCD 0.940 0.293
AIRPAS 0.966 0.249
REXP -0.339 0.762
RCDGDP -0.599 0.686
Notes: Variables are bolded when their correlation coefficient with F1 or F2 is greater than or equal to 0.5 in absolute value; all values are averaged for 1995-2014 Table 3: Correlation of selected variables with the first two factorial components (Author's calculation) Basically, this matrix shows the correlations between the variables and the principal components. According to the table, some of international tourism receipt share (RCD,RTRFRCD, RTVLITCD) excluding RXPZS plus AIRPASdoes matter substantially when the word is about forming the first principal component: the RXPZS does not qualify for the selection criteria (|R|>0.5); correlation of those variables with the first axis is almost 1 (0.949, 0.926, 0.94, and 0.966, respectively). This says that the name for our first factor should be generally related with some combination of tourism receipts share and the air passenger share. This factor is amalgam of international receipts on account of visitors that entered the country throughairports. Tourismresearch in this domain shows that high intensity air traffic implies an economically strong impulse, in generating tourism receipts for too far and not so well developed country. Therefore, since we desire a high value for that indicator, a proper name to suggest its meaning could be "Receipts &flyingafargreater factor" showing us how relevant is a certain country from the point of view of its carried air passengers and its international tourism receipts capacity.The second principal component is

48
EXPLORING INTERNATIONAL TOURISM TRENDS IN THE MEDITERRANEAN:
CONVERGENCE OR BIG DIVERGENCE
much less correlated with the same variables, but it is obvious that some variables that mimic receipts (and that are negatively correlated with first factor) are present here also. Two variables are contained in the second factor are in fact some kind of transformed receipt shares: REXP (receipts/expenditure share) and RCDGDP (receipts/ GDP share) forming so, latent variable, the tourism economy dependency rate. The very high F2 can be important for countries whoseeconomiesare heavilydependentontourism.
We used cluster analysis to view how the Mediterranean countries are clustering on principal components formed, maintaining the same group. To decide the number of clusters for each group, we applied hierarchical cluster analysis. The data processing detected 6 clusters that give an idea of the tourism flows convergence trends of the countries considered. The detected clusters (see Tab. 4. & Fig. 3) are: Cluster 1characterized by a high level for REXP (T value 3.426), RCDGDP (T value 2.377), and RXPZS (2.229). In this cluster are Montenegro, and Croatia. These economiesare the most heavilydependentontourism. This cluster is primary formed by F2 and is defined as the “East Adriatic model”. Cluster 2characterized by a high RXPZS level (T value 2.529) but and RCDGDP (T value 2.065). The countries that form this cluster for all periods are Lebanon, Cyprus and Albania; we label this cluster “Levant model”. Cluster 3 include following countries: Morocco, Malta, Tunisia, Greece, Egypt, Syria, Bosnia and Herzegovina Due to specific working methodology, the relevant statistics of these countries in cluster 3 is missing. Hence there is not label for this cluster. Cluster 4characterized by a low level of own economiesdependent on tourism, inherited: low REXP (T value – 2.033), low value of RCDGDP (T value - 2.065), and RXPZS (T value -2.542). This cluster includes, for the whole period, Slovenia, Israel, Algeria and the Libya. This cluster is labeled “Tourism as a secondary business “. Cluster 6characterized by a high level of tourism receipts for various receipt variables considered beside RXPZS (positive T value), and high level of air traffic share (positive T value). Spain falls into cluster 6 and France as well. Those countries are the tourism receipt lieder, hence this cluster is labeled “Tourism Top country“. It is surprising that Turkey and Italy remain in cluster 5 for the whole period (also without noticing T-testing about difference in means. Yet, this cluster gravitated toward cluster 6 (Tourism top country), because it is positioned in close neighborhood. Table following on the next page
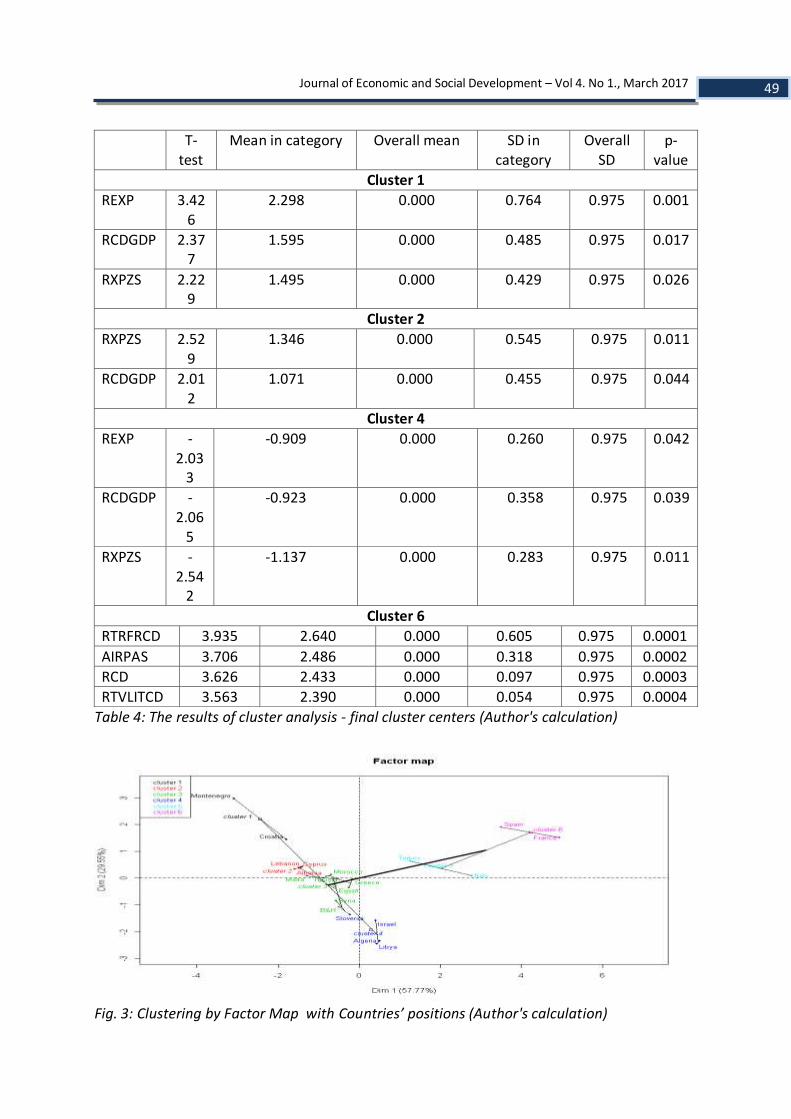
49 Journal of Economic and Social Development – Vol 4. No 1., March 2017
T-test
Mean in category Overall mean SD in category
Overall SD
p-value
Cluster 1
REXP 3.426
2.298 0.000 0.764 0.975 0.001
RCDGDP 2.377
1.595 0.000 0.485 0.975 0.017
RXPZS 2.229
1.495 0.000 0.429 0.975 0.026
Cluster 2
RXPZS 2.529
1.346 0.000 0.545 0.975 0.011
RCDGDP 2.012
1.071 0.000 0.455 0.975 0.044
Cluster 4
REXP -2.03
3
-0.909 0.000 0.260 0.975 0.042
RCDGDP -2.06
5
-0.923 0.000 0.358 0.975 0.039
RXPZS -2.54
2
-1.137 0.000 0.283 0.975 0.011
Cluster 6
RTRFRCD 3.935 2.640 0.000 0.605 0.975 0.0001
AIRPAS 3.706 2.486 0.000 0.318 0.975 0.0002
RCD 3.626 2.433 0.000 0.097 0.975 0.0003
RTVLITCD 3.563 2.390 0.000 0.054 0.975 0.0004
Table 4: The results of cluster analysis - final cluster centers (Author's calculation)
Fig. 3: Clustering by Factor Map with Countries’ positions (Author's calculation)

50
EXPLORING INTERNATIONAL TOURISM TRENDS IN THE MEDITERRANEAN:
CONVERGENCE OR BIG DIVERGENCE
8. CONCLUSION This paper aimed at investigating convergence for a large group of Mediterranean countries, over a time span of twenty years (from 1995 to 2014). Monovariate and convergence analyses, carried out by means of the traditional instruments of descriptive analysis and σ and β absolute convergence, reveal that for international tourism arrival shares (AS and ASPOP), the convergence hypothesis is not supported. Multivariate analysis, a further tool for studying the convergence dynamics among the other variables, revealed that the harmonization process in the tourism flows domain was not so overwhelming as to support the emergence of a single Mediterranean tourism growth model. We are find even six different models of tourism convergence. The most important cluster for us is the first. Many countries, especially transition nations from former Yugoslavia, by opening up to foreign investors, have gradually become more dependent on tourism as a source of revenue enable them to build the muscle of their economy. The cluster analysis results showed that the two east- Adriatic countries generally retained their singularities because both of them fall into the first cluster over time despite considerable movements inside each cluster that translate into convergence displacements on the factorial plan. Those countries are Croatia and Montenegro. Croatia is the top country in the world in regard share of tourism in GDP formation. Despite success in attracting international tourists those trends recalling on careful diversify future development in both countries, persisting in at the same time on policy of sustainable tourism.
LITERATURE: 1. Apostolopoulos, Y., Sönmez, S. (2000). New Directions in Mediterranean Tourism: Restructuring
and Cooperative Marketing in the Era of Globalization, Thunderbird International Business Review, 42(4): 381–392.
2. Bahar, O., Bozkurt, K., Dogan, B. (2013). Striving for service quality: reality, problems and solutions, Empirical Testing of Convergence Hypothesis of International Tourism Sector, Socialiniai Mokslai, 1(79).
http://www.erem.ktu.lt/index.php/test/article/viewFile/5122/2775 3. Kassambara A, Mundt, F. (2016). Package ‘factoextra’: Extract and Visualize the Results of
Multivariate Data Analyses, http://www.sthda.com/english/rpkgs/factoextra 4. Le, S., Josse J., Husson F. (2008). FactoMineR: An R Package for Multivariate Analysis, Journal of
statistical software, 25(1), https://cran.r-project.org/web/packages/FactoMineR/vignettes/FactoMineR.pdf 5. Lanza, A., Pigliaru, F. (2000). Tourism and economic growth: does country's size matter?Rivista
Internazionale di Scienze Economiche e Commerciali, 47 (1):77-86. 6. Narayan, P.K. (2007). Testing convergence of Fiji’ s tourism markets, Pacific Economic Review,
12(5): 651–663. 7. The State of the Mediterranean Marine and Coastal Environment (2013).GRID-Arendal, A centre
collaborating with UNEP, http://www.grida.no/publications/med 8. Tsombanoglou, G., Kokkinou, A. (2008). The role of tourism in European regional growth,
Marketing and Management Sciences, Proceedings of the International Conference on ICMMS 2008, Sakas, D.P., Konstantopoulos, N. (ed), Athens, Greece, p. 339-343.
9. Vojinovic, B., Brezovnik, B.,, Oplotnik, Z.J. (2016). Measuring Services and Tourism Convergence Among Five Old and Five New EU Member States, Inzinerine Ekonomika-Engineering Economics, 27(3), 285–293.

51 Journal of Economic and Social Development – Vol 4. No 1., March 2017
10. World Development Indicators, http://data.worldbank.org/data-catalog/world-development-indicators

52
ASSESSMENT OF INTER-REGIONAL CONVERGENCE IN THE SOCIAL WELFARE
BASED ON THE A. SEN FUNCTION: RUSSIAN CASE STUDY
ASSESSMENT OF INTER-REGIONAL CONVERGENCE IN THE SOCIAL WELFARE BASED ON THE A. SEN FUNCTION: RUSSIAN CASE STUDY
Marina Malkina
Lobachevsky State University of Nizhni Novgorod, Russia [email protected]
ABSTRACT
The aim of this study is estimation of social welfare in Russian regions in 2004-2014 based on the A. Sen abbreviated function, the assessment of regions convergence in welfare and factors contributing to it. We adjusted the A. Sen welfare function by the cost of living in regions and presented it as a four-factor multiplicative model. By use of the coefficient of variation (CV) we estimated the inter-regional inequality in welfare in statics and dynamics. The technique of decomposition of the squared CV for logarithm of welfare function enabled us to evaluate the contribution of main and intersect factors to Russian regions' convergence in welfare. As a result we assessed Russian regions social welfare in dynamics and evaluated factors contributing to its growth. Based on the weighted CV we discovered the negative impact of the recession of 2009 on the regions convergence in welfare, and unweighted CV even more revealed the turning point in the convergence tendency occurring in 2012. We discovered that in statics the redistributive factor makes the greatest and increasing contribution to inter-regional convergence in welfare, whilst the cost of living and intra-regional income inequality factors have moderate and decreasing influence on it. The dynamic analysis revealed two factors predominantly contributing to regions' temporal convergence in welfare, namely growing convergence in GRP per capita and significant but unstable influence of distributive factor.Two other factors, the cost of living and intra-regional income inequality, counteracted to temporal convergence mainly due to attenuation of their negative correlation to nominal and real income per capita respectively. The results obtained may be applicable to both inter-budgetary and regional policy development. Keywords: Abbreviated functions, Convergence, Decomposition, Factors, Inequality, Region, Coefficient of Variation, Welfare
1. INTRODUCTION The inter-regional inequality in welfare is a phenomenon naturally occurring in countries with considerable spatial diversity in the resources provision and in the level of regional economic development. Such an inequality may increase because of migration of resources

53 Journal of Economic and Social Development – Vol 4. No 1., March 2017
and may decrease due to redistributive policy and management of institutional environment. Many authors study inequality in gross regional product (GRP) or income per capita (Lakner, Milanovic, 2013). Apparently, these indicators are incomplete and do not fully describe the well-being. The welfare in a broad sense includes a number of elements beyond and behind GDP ensuring people satisfaction with life. The simple welfare functions are based on the main development indicator and its adjustment by other indicators characterizing the socio-economic processes accompanying the economic development and affecting the people well-being. The economists who initially studied the problem usually considered two main side effects of development commonly appearing at its lower stages: environmental (pollution) and social (increase in inequality) costs. Later researchers proposed complex assessment of welfare based on various parameters of development, such as consumption, leisure time, life expectancy, level of health and education, pollution etc. They devised integrated indices of welfare, e.g. the Human Development Index and the Quality of Life Index, now frequently used for comparison of states or regions and for measurement of spatial inequality (Grasso, Canova, 2008; Jordá, Sarabia, 2015). These indices are applied for assessment of welfare of Russian regions as well (Rating of Russian regions, 2015; Human Development Report, 2013). Nevertheless, the more complex measurement of welfare was presented by H. Daly and J. Cobb (Daly, Cobb, 1989) who developed the Index of Sustainable Economic Welfare (ISEW). Following some modifications it was transformed into the Genuine Progress Indicator (GNI). Today these measures are also employed in a range of comparative studies (Bleys, 2013; Andrade, Garcia, 2015). However, the calculation of the integral index of welfare requires collection and processing of a large amount of information, and some data may be obtained only through sociological surveys. Accordingly to (Lawn, 2003), the methods of construction of integrated indices are still controversial. Whilst (Jordá, Trueba, Sarabia, 2013) indicate that these methods should take into account that welfare components may be complementary or substitutionary. Therefore, we postpone the complex assessment of the welfare of Russian regions until appropriate time. In the current research we focus on abbreviated welfare functions taking into account only level of development and income inequality because they are evidently interrelated. According to previous researches, the vast majority of Russian regions demonstrate growing inequality over the last decade and movement on the ascending branch of the S. Kuznets curve (Malkina, 2014a). It explains our primary interest to adjustment of the regions average income with income inequality that would obviously lower the estimations of regions' convergence. At first the inequality-based approach to welfare was suggested by A. Sen in the form of “the abbreviated social welfare functions” (Sen, 1976). The A. Sen welfare
function takes the following form: )1( GS , where average income per capita, G
the Gini coefficient. Alternatively, N. Kakwani (Kakwani, 1981) incorporated a penalty for inequality in the welfare function and additionally took into account the reduction in life expectancy. R. Lambert represented the welfare function as direct dependency on income and inverse dependency on inequality (Lambert, 2002). Some advanced welfare functions incorporate people's attitude to inequality. Thus, in the C. Dagum’ approach an individual’s welfare depends on the number of people with higher earnings (Dagum, 1990). In other approaches

54
ASSESSMENT OF INTER-REGIONAL CONVERGENCE IN THE SOCIAL WELFARE
BASED ON THE A. SEN FUNCTION: RUSSIAN CASE STUDY
the Gini coefficient was replaced by the A.B. Atkinson index, based on the utilitarian function of income with the diminishing marginal utility and taking into account the society perception of inequality (Atkinson, 1970). In this function the “e” parameter indicates the level of public aversion to inequality (Carlsson, Daruvala, Johansson-Stenman, 2005; Howarth, Kennedy, 2016). Some authors used all the family of “inequality-adjusted aggregate welfare functions”to complete the picture (Grüen, Klasen, 2008). In our paper, we employ the A. Sen abbreviated function for assessment of the Russian Federation regions social welfare. Bearing in mind different level of prices and the cost of living in Russian regions, we substitute the nominal income for the real income. Further, based on the calculation of indices of inter-regional inequality we evaluate the degree of convergence / divergence of Russian regions in welfare in 2004-2014 years. Then we propose the method of decomposition of inequality index, which allows us to assess the factors’ contributions to the inter-regional convergence (divergence) in the A. Sen welfare. 2. DATA AND METHODS Our research is based on the official sources of information provided by the Federal Service of State Statistics of RF. We used annual data on 80 Russian regions for 2004-2014, including the number of population, GRP, personal incomes, the cost of a fixed basket of consumer goods and services, incomes inequality (measured by the Gini coefficient). The algorithm of our study includes several stages. 2.1.Measurement of regions welfare We presented the A. Sen social welfare function as the product of the following factors:
i
r
i
n
iii
ii
i
i
ii gcyG
CI
CI
Y
D
N
YS
i
i
)1(
_
, (1)
where i
ii
N
Yy nominal gross regional product (GRP) per capita in “ i ” region;
i
ii
Y
D
the ratio of personal incomes to GRP in each region; i
iCI
CIc
_
index, inverse to the relative
cost of living in “ i ” region, calculated as the ratio of the cost of a fixed basket of consumer
goods and services in the country to the cost of this set in each particular region; ii Gg 1
income erosion, iG intra-regional Gini coefficient for the nominal personal incomes in “ i
” region. Note that due to the lack of statistical data on the cost of the consumer basket for the various groups of the population it is impossible to calculate the Gini coefficient for the real incomes. At each subsequent stage we obtained new parameter of the model:
iii yn nominal personal incomes per capita; iiii cyr real personal incomes per
capita in “ i ” region. Further we calculated the logarithms for the A. Sen welfare for three reasons. Firstly, by this way we pass to the welfare utility function with diminishing marginal utility. Secondly, thus we approach normal distribution of welfare. Thirdly, the indices based on logarithms of

55 Journal of Economic and Social Development – Vol 4. No 1., March 2017
some variable are easily decomposed, when this variable is represented in multiplicative form.
)ln()ln()ln()ln()ln( iiiii gcyS . (2)
Next, to simplify we make the following substitutions: )ln(* ii SS ; )ln(* ii yy ;
)ln(* ii ; )ln(* ii cc ; )ln(* ii gg .
2.2. Evaluation of inter-regional inequality in welfare The inter-regional inequality is usually assessed with different methods (Ayala, Jurado, Pedraja, 2010, p. 240). In our study for this purpose we chose the coefficient of variation (CV) both for the logarithms of the A. Sen welfare and its components. The population-weighted CV for each “x” variable measures the scale of inequality, while the unweighted CV measures the sharpness of inequality. The first one takes the form:
*
**1
2
x
xx
CV
n
i
ii
x
. (3)
Here ix * average value of some variable in “ i ” region,
i the share of “ i ” region in total
population of the country,
n
i
ii xx1
** the mean value of ix * variable, n the number
of regions. To obtain the unweighted CV we should replace the shares of regions in
population i for their shares in number of regions, 1/n.
2.3. Decomposition of inter-regional inequality in welfare We propose following method of decomposition of the squared CV for the logarithm of the A. Sen welfare function:
.*
*,*2*
*
*
*
*,*2*
*
*
*
*,*2*
*
**
*
**
2
2
2
2
2
2
2
2
2
2
2
2
S
grCovgCV
S
g
S
сnCovcCV
S
с
S
yCovCV
SyCV
S
ySCV
iii
iii
iiiii
(4)
We denoted ixCVS
x*
*
* 2
2
as )(xM for all main *x variables. Accordingly we made
substitutions
),(*
*,*22
xzInterS
xzCov ii
for all intersections of each main *x variable
with the collected parameter *z achieved at each previous stage of the A. Sen function formation. Consequently, full decomposition of the squared CV takes the form:
).,()(),()(),()()(*2 grIntergMcnIntercMyInterMyMsCV i (5)
Thus, inter-regional inequality in budget expenditures per capita is fully decomposed to the contribution of main parameters and intersections of the model (1).

56
ASSESSMENT OF INTER-REGIONAL CONVERGENCE IN THE SOCIAL WELFARE
BASED ON THE A. SEN FUNCTION: RUSSIAN CASE STUDY
Based on our previous research (Malkina, 2014b), we can assume the positive correlation between the Gini coefficient and average real personal income in Russian regions. Besides, in the regions with higher nominal personal incomes a higher level of consumer prices should be observed on average. Finally, regions with a higher GDP per capita tend to have lower share of personal incomes in GRP. Given our parameters designed, all the Inter values should be negative. Now we can formulatethe hypothesis of the study. We presume that in the chain “nominal
GRP per capita nominal personal incomes per capita real personal incomes per capita
the A. Sen welfare per capita” each subsequent parameter should demonstrate even less inter-regional inequality compared to the previous one. Ultimately, the decomposition of the squared CV for the A. Sen welfare function by components enables us to evaluate the contribution of main and intersect parameters of the model (1) into the Russian regions’ convergence (divergence) in welfare both in statics and dynamics.
3. RESULTS AND DISCUSSION 3.1. Analysis of the A. Sen welfare functions in Russian regions By calculation of social welfare using formula (1) we have obtained the estimations and ranks of Russian regions by welfare in dynamics. The figure 1 demonstrates the distribution of welfare among Russian regions in 2014. According to the A. Sen function, the most affluent Russian regions are neighboring mining territories with gas and oil production, namely: Yamalo-Nenets (S=26245) and Khanty–Mansi Autonomous Okrug – Yugra (S=19622), located in the Ural Federal District, and Nenets Autonomous Okrug (S=26405), subject of the Northwestern Federal District. They are followed by the Moscow city (S=21257), Russian managerial and financial center, and some extra mining territories located in the Far East: Chukotka Autonomous District (S=20640) and Sakhalin Oblast (S=19193), and Republic of Tatarstan (19184), located in the Volga Federal District. The least prosperous regions, according to the A. Sen function, are also some boarder territories: Republic of Kalmykia in the Southern Federal District (S=8395), Republic of Tyva (S=9405) and neighboring Republic of Altai (9858), located in the Siberian Federal District. The group of deprived regions also includes three backward North Caucasian republics: Karachay-Cherkess Republic (S=10481), Kabardino-Balkar Republic (S=11084) and the Republic of Ingushetia (S=10111). Figure following on the next page

57 Journal of Economic and Social Development – Vol 4. No 1., March 2017
8395 10032 11669 13307 14944 16581 18219 19856 21493 23131 24768 26405
Figure 1: The map of the Russian regions by the A. Sen social welfare in 2014
(author calculations based on the Russian Federation Federal State Statistics Service data)
The average population-weighted welfare in Russian regions has increased 4.48 times over 2004-2014. At the same time the largest increase in the welfare is observed mainly in the poorer regions: Chechen Republic (8.47 times), Republic of Ingushetia (7.75 times), Republic of Dagestan (6.56), Ivanovo Oblast (6.61), and the Republic of Adygea (6.43). The first three are again the subjects of the North Caucasian Federal District. The lowest growth of welfare is marked both in some rich regions: Tyumen region, including Khanty-Mansi and Yamalo-Nenets Autonomous Okrugs (3.53 times), the city of Moscow (3.73) and St. Petersburg (3.69), and in some relatively poorer regions: Republic of Karelia (3.59), Kemerovo Oblast (3.59), Republic of Komi (3.62) and the Tomsk Oblast (3.69). The last four regions have lost in the welfare ranking 38, 26, 11 and 39 points respectively. Besides, the large drop in welfare ranking is observed in Pskov Oblast (39 p.), Volgograd Oblast (32 p.) and Leningrad Oblast (26 p.). By means of logarithmic method of factor analysis we have decomposed welfare growth in Russian regions and measured the main components' contribution. Some results are presented in the table 1. It indicates that the welfare increase is predominantly attributable to the growth of GRP, whereas two other components, the share of personal income and income inequality, have demonstrated a moderate influence on welfare growth. Meanwhile, the factors contributions to the welfare growth differ a lot in the regions. Thus, theGRP factor showed a greatest impact on welfare of some North Caucasian republics: Chechnya, Ingushetia and Dagestan, and again of the Republic of Adygea, the subject of the

58
ASSESSMENT OF INTER-REGIONAL CONVERGENCE IN THE SOCIAL WELFARE
BASED ON THE A. SEN FUNCTION: RUSSIAN CASE STUDY
Southern Federal District. These are all backward regions, in fact demonstrating catching-up effect in development. But simultaneously large increase in GRP per capita has been observed in the Sakhalin Oblast, one of the highest-level welfare regions. On the contrary, the lagging growth of GRP per capita in Vologda, Pskov, Kemerovo, Tomsk, Omsk and Tyumen regions has considerably let them down in the welfare ranking.
Table 1: The results of decomposition of the welfare growth rate, % (author calculations)
Minimum value (region)
Maximum value (region)
Average (Russian Federation value)
Standard deviation
GRP 196,9 (Vologda Oblast)
700,5 (Chechen Republic)
331,9 85,8
Share of personal incomes in GRP
-173,7 (Sakhalin Oblast)
179,1 (Lipetsk Oblast)
8,6 51,6
Relative cost of living
-35,3 (Vladimir Oblast)
68,0 (Chukotka Okrug)
0,0 18,4
Income inequality -45,4 (Chechen Republic)
54,2 (City of Moscow)
7,3 11,5
Welfare (based on the A. Sen function)
253,0 (Tyumen region)
746,9 (Chechen Republic)
347,8 87,1
The advancing increase in the share of personal income in GRP has picked Ivanovo and Lipetsk Oblast up in the welfare ranking. However, the negative contribution of this factor to welfare of the Moscow city (-80.2%) has not influenced its rank, albeit has decreased its gap with less prosperous regions. In some regions the relative cheapening of the consumer basket compared to the average state-wide one has led to additional gain in welfare. Apart from Chukotka mentioned in the table 1, it is the case of some other Eastern territories such as Sakhalin Oblast and the Republic of Sakha (Yakutia), and also of the Republic of Ingushetia. Simultaneously, some Western and Central regions, specifically Smolensk, Pskov and Vladimir Oblast, have demonstrated significant negative impact of the relative growth in cost of living on change in the welfare. The similar negative influence is established in some Northern Caucasian regions: Karachay-Cherkess and Chechen republics. Ultimately, considerable decrease of intra-regional inequality in the Moscow city proved to be an important factor maintained its welfare gap with other regions as well as its high position in the ranking. The backward Northern Caucasian republics, although growing at a higher rate, have been again thrown back in welfare due to rise in intra-regional inequality accompanying their development. 3.2. Analysis of the Russian regions convergence / divergence in the A. Sen welfare Both population-weighted and unweighted regional disparities in welfare, assessed by the formula (3), point at the regions convergence (Fig. 2). In general, the inter-regional inequality in welfare has decreased approximately by 43% over 11 years. However, the unweighted approach demonstrates a smooth process of regions’ convergence in welfare with decreasing rate after 2008, turning to inverse tendency of divergence since 2012. In comparison, the weighted approach demonstrates irregular tendency of convergence during the entire period analyzed, but it proves to be more sensitive to the 2009 recession. The distinct results obtained through the two approaches

59 Journal of Economic and Social Development – Vol 4. No 1., March 2017
are obviously related to the concentration of population in the more prosperous regions, as well as different impact of crises on poor and rich regions.
Figure 2:Tendencies of convergence of Russian regions by the A. Sen welfare function
(author calculations based on the Russian Federation Federal State Statistics Service data)
3.3. The results of decomposition of the Russian regions inequality in welfare The decomposition of the squared CV based on the formulaы (4) and (5) demonstrates positive impact of the main four factors and negative impact of three intersect factors on the total inequality for each year (Figure 3).
Figure 3:The results of decomposition of the inter-regional inequality in welfare in Russia (author
calculations based on the Russian Federation Federal State Statistics Service data) Initially, we consider the group of the main factors of inequality as independent. The inter-regional differences in welfare are largely attributable to uneven distribution of GRP relatively to distribution of population in the regions. The share of this factor among all main factors of the model has been predominant throughout all the period under study, but
gradually decreasing (76.971.0%). The inter-regional unevenness of another factor, the share of personal incomes in GRP, has increased, thus its relative influence has grown, but even in 2014 it did not exceed 24%. On the contrary, the contributions of the cost of living

60
ASSESSMENT OF INTER-REGIONAL CONVERGENCE IN THE SOCIAL WELFARE
BASED ON THE A. SEN FUNCTION: RUSSIAN CASE STUDY
and intra-regional inequality to welfare disparities were smallest and only decreasing over time. However, it should be noted that the main factors were acting along with intersect factors, all of which negatively contributed to regions’ welfare inequality, thereby supporting their convergence in statics. Firstly, in the regions with higher level of GRP per capita the share of personal incomes in GRP proved to be lower on average. This factor, (re)distributive by nature, had the greatest impact on convergence. Moreover, its contribution has increased 1.81 times over 11 years, supporting equalization of the welfare at the stage of income distribution. Secondly, in the regions with higher level of nominal income per capita the average level of consumer prices turned to be higher. However, due to contraction of potential convergence in cost of living, the impact of inflationary factor has decreased almost twice (by 48%). Thirdly, in the regions with higher level of real income per capita the intra-regional income disparities are again higher on average. Due to the Sigma-convergence of poor and rich regions, the contribution of the “income erosion” factor to the welfare leveling has fallen 3.8 times. The proportional method of factor analysis allowed us to calculate the factors’ contributions to the regions welfare convergence in dynamics. In the table 2 we have combined the influences of each main component of our model (formula 1) and its intersection with the parameter achieved at previous stage of the welfare formation.
Table 2: The factors’ contribution to Russian regions convergence in the A. Sen social welfare, by an
accrual basis since 2004, %(author calculations) Contribution to the convergence
GRP production Distribution Inflation Intra-regional inequality
Total
2005/2004 51.67 -90.62 22.29 10.55 -6.12
2006/2004 6.23 -93.20 39.14 23.39 -24.43
2007/2004 -37.71 -77.66 54.09 29.28 -32.00
2008/2004 -79.48 -118.99 86.98 53.97 -57.53
2009/2004 -146.95 -38.04 82.53 50.41 -52.04
2010/2004 -142.90 -63.23 92.13 57.36 -56.64
2011/2004 -144.29 -70.99 95.15 59.70 -60.44
2012/2004 -175.26 -56.81 102.59 66.25 -63.23
2013/2004 -195.71 -40.17 101.86 67.49 -66.53
2014/2004 -211.37 -43.63 114.77 72.73 -67.50
Based on the results obtained, we may affirm the positive increasing influence of GRP convergence as well as positive unstable influence of incomes (re)distribution on the reduction in regions’ welfare disparities. On the contrary, two other factors, the cost of living and the intra-regional inequality, have been evidently counteracting to the process of convergence in dynamics.
4. CONSLUSION

61 Journal of Economic and Social Development – Vol 4. No 1., March 2017
The previous researchers have developed a number of approaches to assessing the welfare of countries and regions, some of which were referred to the abbreviated social welfare functions based on income per capita and income inequality. The adoption of the A. Sen welfare function allowed us to estimate the welfare of Russian regions in dynamics for 2004-2014. Based on the measurement of inter-regional inequality in welfare we have revealed the tendency of the Russian regions convergence, which was temporarily disrupted with the shock of divergence in 2009 (according to the weighted coefficient of variation for logarithm of the A. Sen function) and even turned to the opposite tendency in 2012 (according to the unweighted coefficient of variation for this function). We suggested the four-factor multiplicative model for the A. Sen welfare function and proposed the logarithmic technique for its decomposition. This allowed us to evaluate impact of the main components and the intersections on the regions’ convergence in welfare. The growing influence of production factor along with significant yet unstable impact of re-distribution factor indirectly indicates the efficiency of inter-budgetary equalization policy. It also confirms the findings of one previous econometric study (Yushkov, 2015). The positive correlations between regions’ average income, on one side, and cost of living and internal inequality, on the other side, have contributed to some reduction in regional disparities in statics. This result is consistent with (Malkina, 2014a). However, the faster growth of the cost of living and inequality in the poorest regions restrained the regions convergence in welfare in dynamics. The further extension of the research is possible by way of adaptation of complex w elfare functions, e.g Index of Sustainable Economic Welfare and Genuine Progress Indicator for the Russian regions, with paying attention to embedded features of the Russian statistics. The development of such measures should facilitate a more accurate assessment of convergence / divergence of the Russian regions in terms of welfare, taking into account diverse social, environmental, demographic and other costs and benefits of development.
ACKNOWLEDGMENT: This research was supported by the Ministry of education and science of Russia as a part of the state assignment, Project Number 2648. LITERATURE: 1. Andrade, G.A., Garcia, J.R. (2015). Estimating the Genuine Progress Indicator (GPI) for
Brazil from 1970 to 2010. Ecological Economics, 118, 49-56. doi:10.1016/j.ecolecon.2015.07.018.
2. Atkinson, A.B. (1970). On the measurement of inequality. Journal of Economic Theory, 2 (3), 244–263. doi:10.1016/0022-0531(70)90039-6.
3. Ayala L., Jurado A., Pedraja F. (2010). Inequality and Welfare in Intra-Territorial Income Distribution / In: Regional Policy, Economic Growth and Convergence. Chapter 11. Springer-Verlag Berlin Heidelberg, pp. 233-260.
4. Bleys, B. (2013). The Regional Index of Sustainable Economic Welfare for Flanders, Belgium. Sustainability, 5, 496-523. doi:10.3390/su5020496.
5. Carlsson, F., Daruvala, D., Johansson-Stenman, O. (2005). Are people inequality-averse, or just risk-averse? Economica, 72 (287), 375–396. doi: 10.1111/j.0013-0427.2005.00421.x.

62
ASSESSMENT OF INTER-REGIONAL CONVERGENCE IN THE SOCIAL WELFARE
BASED ON THE A. SEN FUNCTION: RUSSIAN CASE STUDY
6. Dagum, C. (1990). On the relationship between income inequality measures and social welfare functions. Journal of Econometrics, 43 (1-2), 91-102. doi:10.1016/0304-4076(90)90109-7.
7. Daly, H., Cobb, J. (1989). For the Common Good: Redirecting the Economy toward Community, the Environment and a Sustainable Future; Beacon Press: Boston, MA, USA, 534.
8. Grasso, M., Canova, L. (2008). An Assessment of the Quality of Life in the European Union Based on the Social Indicators Approach. Social Indicators Research: An International and Interdisciplinary Journal for Quality-of-Life Measurement, Springer, 87(1), 1-25. doi:10.1007/s11205-007-9158-7.
9. Grüen C., Klasen S. (2008). Growth, Inequality, and Welfare: Comparisons across Space and Time. Oxford Economic Papers, New Series, 60 (2): 212-236.
10. Howarth, R.B., Kennedy, K. (2016). Economic growth, inequality, and well-being. Ecological Economics, 121, 231–236. doi:10.1016/j.ecolecon.2015.10.005.
11. Human Development Report for the Russian Federation for 2013 / Edited by S.N. Bobylev. LLC “RA ILF”, 2013. 202 p. Pp. 149-153.
12. Jordá, V., Sarabia, J.M. (2015). International convergence in ell-being indicators. Social Indicators Research: An International and Interdisciplinary Journal for Quality-of-Life Measurement, Springer, vol. 120(1), 1-27, January.doi:10.1007/s11205-014-0588-8.
13. Jordá, V., Trueba, C., Sarabia, J.M. (2013). Assessing global inequality in well-being using generalized entropy measures. Procedia Economics and Finance, 5, 361–367. International Conference On Applied Economics (ICOAE) 2013. doi:10.1016/S2212-5671(13)00043-9.
14. Kakwani, N. (1981). Welfare measures: An international comparisons. Journal of Development Economics, 8 (1), 21–45. doi:10.1016/0304-3878(81)90044-4.
15. Lakner, C., Milanovic, B. (2013). Global income distribution : from the fall of the Berlin Wall to the great recession. Policy Research Working Paper Series 6719, The World Bank, 60 p.URL: http://documents.worldbank.org/curated/en/914431468162277879/pdf/WPS6719.pdf.
16. Lambert, R.J. (2002). The Distribution and Redistribution of Income; third ed., Manchester University Press. – Manchester: UK, 336.
17. Lawn P.A.(2003). A theoretical foundation to support the Index of Sustainable Economic Welfare (ISEW), Genuine Progress Indicator (GPI), and other related indexes. Ecological Economics, 44: 105-118.
18. Malkina, M.Yu. (2014a). Dynamics and Determinants of Intra and Inter-Regional Income Differentiation of the Population of the Russian Federation. Spatial Economics, 3, 44-66. doi: 10.14530/se.2014.3.44-66.
19. Malkina, M.Yu. (2014b). Study of the relationship between the development level and degree of income inequality in the Russian regions. Economy of Region, 2 (38), 238-248.
20. Rating of Russian regions for quality of life. 2015. Moscow. RIA Ranking, 2016. 62 p. URL: http://vid1.rian.ru/ig/ratings/life_2015.pdf (accessed 13.06.2016).
21. Sen, A. (1976). Real national income. Review of Economic Studies, 43 (1), 19-39. doi: 10.2307/2296597.
Yushkov, A. (2015). Fiscal decentralization and regional economic growth: Theory, empirics,
and the Russian experience. Russian Journal of Economics, 1: 404–418.

63 Journal of Economic and Social Development – Vol 4. No 1., March 2017
DEVELOPMENT OF REGIONS AND MUNICIPALITIES OF THE SLOVAK REPUBLIC BY APPLICATION OF EUROPEAN COHESION POLICY
Katarina Rentkova
Comenius University in Bratislava, Faculty of Management, Slovakia [email protected]
ABSTRACT
The Slovak republic, entering the European Union on the 1st May 2004, got the impulse on the improvement and growth also via the application of the Cohesion policy. For the programming period 2007-2013, the amount of 11.3 milliards Euros for the application of the Cohesion policy have been provided to the Slovak republic. In the present time, the programming period is finished and the Slovak republic meets the critical reviews in the area of the effective use and maintenance of projects and application of the Cohesion policy on its territory.Many specialists, economists and analysts try to reveal the errors, identify the subjects that enter into the project cycle wrongly or to identify the bodies that have the most important influence on the low level of the financial instruments use and they also try to deal with the criticism of the European Commission as to the project realization.From this point of view, the theme of the research is very actual and imperative because the research tries to enlighten and to analyze the application of the cohesion policy within the territory of the Slovak republic and so, to state recommendations for more effective application for the following programming period. The article is created by analyzing the application of the European cohesion policy in the programming period 2007 - 2013 in the Slovak Republic.The main objective of the article is to analyze and define the cohesion policy of the European Union and one of the partial objectives is to execute the analysis on the implementation state of the Cohesion policy on the level of the chosen regions in the Slovak republic and then, to propose and to create recommendations and techniques for its effective functioning. Keywords: structural funds, Slovak Republic, regional development, cohesion policy, programming period 2007 - 2013 1. INTRODUCTION Regional policy is a strategic investment policy which focuses on all regions and cities in the European Union (hereinafter EU). By application and realization of the regional policy (also known as the Structural policy or the Cohesion policy) the effective and respectable
64
DEVELOPMENT OF REGIONS AND MUNICIPALITIES OF THE
SLOVAK REPUBLIC BY APPLICATION OF EUROPEAN COHESION POLICY
development on the national level may be ensured, but also the local level is really important. 2. RESEARCH OBJECTIVE The aim is to boost economic growth and to improve the quality of people's lives. Solidarity is the main feature of the policy, because policy focuses on support for less developed regions. A fundamental aspect of regional development is to reduce disparities between the regions and cities. Cohesion policy includes ideas of solidarity policy for which main principles and objectives are based on structural policy. The Lisbon Treaty defines this policy as an economic, social and territorial cohesion and solidarity among states. The main issue of this article is the regional development, especially we observe the application of European cohesion policy in the Slovak Republic and we analyze the situation in Nitra Self-Governing Region (hereinafter NSR). NSR represents the region at the regional level NUTS 3. The general object of our research is the Slovak republic and their regions. We analyze the socio-economic indicators in one of our last paper - “The analysis of regional disparities in the Slovak Republic“ (Rentková – Roštárová – Mazanovský (2016)). The aim of this paper was to analyze the indicators by using which we can observe, analyze and compare the regional disparities and the regional development. Regional disparities were defined as the differences in levels of socio-economic development. Empirical research was carried out and was based on a case study. The case study analyzed the actual socio-economic situation in the Slovak Republic at the regional level NUTS 3. Economic and social indicators were detailed analyzed. We concluded that it is necessary to analyze the situation in the NSG, based on the last analysis. 3. METHODS AND METHODOLOGY The research is processed by using a wide scale of the scientific methods and procedures. The specific range of methods was based on the research needs of the individual parts. The intention is to follow the logical continuity of the articles’ parts, the correctness and the adequacy of information and data. First part is focused on the different definitions – the regional policy, the cohesion policy. This section is prepared by using the analytical methods – the analysis, the casual analysis, the synthesis. We analyzed scientific publications and scientific articles, papers by various authors (e.g. Rentková, K. (2012), Pawera, R. et all. (2013), Šlahor, Ľ. – Majerčáková, D. – Barteková, M. (2016), Roštárová – Janad (2014), Komorník – Majerčáková (2016), Janad – Mariak (2013)). The first part is based on preparation and explanation of key terms. Results part consists of the main findings.A questionnaire survey has been carried during the research for diploma thesis (Janšíková (2016)). The survey was conducted in the NSG. 355 villages and towns are located in NSG, but only 166 municipalities answered to our questionnaire survey. Return rate was 46.7%. Analysis of the results of the questionnaire takes into account only the municipalities that responded to the questionnaire. Aim of this survey was:
- To establish whether the villages know the possibility of funding their development throgh the Structural Funds.
- To establish whether the municipalities use the Structural funds. - To identify problems with application of the Cohesion policy.
4. LITERATURE REVIEW

65 Journal of Economic and Social Development – Vol 4. No 1., March 2017
Foundations of he EU date to 1952 but the issue of the unequal development has been incorporated into Community law until 1986. The term "economic and social cohesion" was included in primary legislation through the Single European Act (hereinafter SEA). SEA, article 130a: “In order to promote its overall harmonious development, the Community shall develop and pursue its actions leading to the strengthening of its economic and social cohesion. In particular the Community shall aim at reducing disparities between the various regions and the backwardness of the least-favoured regions.“ The Council instructed the Commission to make a proposal by which the action of structural funds would be harmonized. These funds operated independently at this time. So we can talk about definition of the regional policy since 1986. The role of regional policy is to find differences and causes of unequal development of regions. Recommendations, strategies, plans and objectives can be determine by application of this policy to eliminate these disparities.Over time, the action of regional policy targeted at the structural differences in the sectors and subsectors, application of policy crossed the borders of one country and the action was targeted to the whole territory. Later, problems came with the accession of new countries and their degree of economic divergence and economic development. Policy was again redefined. Nowadays, regional policy exceeds the borders of EU and hte support is directed not only to the Member States and candidate countries, but the EU shows solidarity and cohesion to many other countries.Many authors, scientists and experts deal with the definition of regional policy, so we can find many definitions. Goodall (1987) mentions regional policy as "an integral part of state policy, which affects the distribution of the main economic resources and activities throughout the national territory or in its part. Regional policy includes measures to help increase the degree of economic activity in the territory where there is high unemployment and little hope for natural economic growth, on the other hand, measures serve to control the economic activities in the territories with overgrowth." Rajčáková defines regional policy as: "regional policy is represented by the activities of the state institutions and the territorial scope institutions. It is directed to the creation of favorable conditions for versatile and dynamic development of the regions in maximizing their economic, geographic and human potential." Regional policy is an instrument for removing the economic disparities. According Lipková (2006), regional policy "is looking for the causes of the unequal development of regions, it shows how to know the consequences of unequal regional development and it forms the recommendations and strategies for the elimination of gaps in development between regions." Robson (Cihelková, 2007) defines regional policy with regard to the conclusions of the classical theory of integration. Regional Policy is defined as "controlled intervention seeking to modify the natural distribution of economic activities and to reduce social and economic disparities between regions." Robson defines regional policy through economic activities which take place in the examined regions. He analyzes a link between regional development and the reduction of social and economic inequalities through the correct allocation and management of selected economic activities.Cohesion Policy, which operates currently, incorporates the base of the policy of solidarity, the main principles and objectives are based on structural policy. The Lisbon Treaty defines the economic, social and territorial cohesion and solidarity between states. Cohesion policy therefore represents one of the most important instruments of economic and social development of the territory. It operates through structural, regional and social policy. Local development is carried out in a particular place - the village or town and regional development is, in terms of EU cohesion policy,

66
DEVELOPMENT OF REGIONS AND MUNICIPALITIES OF THE
SLOVAK REPUBLIC BY APPLICATION OF EUROPEAN COHESION POLICY
largely associated specifically with regional governments, as well as with classification NUTS 2. Cohesion policy is targeted to the regional level NUTS 2. According to Skokan (Stejskal - Kovárník, 2009), regional development is represented by "complex processes in a complex system of regions. Systemic approach is needed to influence and control these processes." Stough and Roberts (Stejskal - Kovárník, 2009) have dealt with the issue of defining the regional development. According to them, it is the "application of processes and resources available in the region by which we can observe the sustainable development and desired economic results for the region. These results satisfy the expectations of businesses, residents as well as non-residents." If a municipality or a city is the most elementary unit of regional development and their development is realized at the local level, as it is defined by the EU legislation, the local development is understood as development realized at the area which is less than the region, i.e. only in part of the observed region. (Stejskal – Kovárnik, 2009) In our approach, town and village constitute only a certain part of the region in which the policy is implemented. In context of the EU cohesion policy, the municipality or city represent the elementary territorial unit in which cohesion policy is implemented. In Slovakia, the territory is divided into three regional levels (NUTS) and 2 local levels (LAU), which is made by the Statistical Office Decree no. 438/2004 Coll. as amended. Tabl e 1 shows the classification of regions in the Slovak republic. The role of cohesion policy is to finance concrete projects for regions, towns, cities and their habitants. Slovak Republic, as an equal member of the EU, can use resources of EU in the form of so-called Structural funds. The basic definition of the policy stipulates that all Member States and all regions can to profit from Structural funds. Of course, this is not entirely true. Not all European regions are eligible regions, i.e. regions that can benefit from one or more Structural funds. Eligible region is one that fulfills specified criteria. Table 1 - The NUTS classification in Slovakia and the average size recommended (European Parliament and Council Regulation (EC) No. 1059/2003 of 26 May 2003 on the establishment of a common classification of Territorial Units for Statistics (NUTS) and Decree no. 438/2004 Coll., Issuing the classification of territorial units for statistics)
NUTS classification
Nombre Territorial-administrative units falling under NUTS appropriate in the Slovak Republic
EU recommendations for NUTS - the average size of NUTS regions (population)
MINIMUM MAXIMUM
NUTS 1 1 Slovak Republic 3 000 000 7 000 000
NUTS 2 4 Bratislava Self-Governing Region, Western Slovakia, Central Slovakia, Easatern Slovakia
800 000 3 000 000
NUTS 3 8 Bratislava Self-Governing Region, Trnava Self-Governing Region, Trenčín Self-Governing Region, Nitra Self-Governing Region, Banská Bystrica Self-Governing Region, Žilina Self-Governing Region, Košice Self-Governing Region,
150 000 800 000

67 Journal of Economic and Social Development – Vol 4. No 1., March 2017
Prešov Self-Governing Region
LAU 1 79 Township
LAU 2 2891 Municipalities
We consider the main causes of regional disparities - the natural potential, residential structure, position attractiveness, demographic structure, economic specialization of regions, as well as territorial and administrative organization. The territory of Slovak Republic was divided into relevant statistical territorial units by the Government Resolution no. 156/2002. These statistical territorial units fulfill the conditions for using the pre-accession aid, but especially the financial aid through regional policy. The division of the Slovak Republic into NUTS units is shown in Figure 1. (Sloboda, 2014)
Fig. 1 - NUTS classification of territorial statistical units in Slovakia 5. PROGRAMMING PERIOD 2007-2013 Cohesion policy is characterized by a number of specifics that are defined in EU legislation. Financial resources from the EU budget were earmarked for the 7 year period. The objectives must be identified, tools defined and principles of implementation adopted and the policy can be implemented. In the programming period 2007 – 2013, policy fulfilled three objectives: the Convergence, the Regional competitiveness and employment and the European territorial cooperation. 1. Target – Convergence. Target aims to stimulate growth and employment in the least developed regions. It highlights on the innovation and the knowledge society, the adaptability to economic and social changes, the environmental quality and the efficiency of the administration. Activities were directed to research, innovation and upgrading skills, promotion of knowledge economy, human capital development through targeted education and training, as well as training and support the SMEs. 2. Target - Regional competitiveness and employment. The growth of regional competitiveness and employment contribute to strengthening the competitiveness and

68
DEVELOPMENT OF REGIONS AND MUNICIPALITIES OF THE
SLOVAK REPUBLIC BY APPLICATION OF EUROPEAN COHESION POLICY
attractiveness as well as employment by emphasizing the importance anticipation of economic and social changes. The funds are used in the field of risk reduction of poverty and promotion of active labor market policies, but also to promote the role of social economy and create quality jobs, to promote innovation. The benefits are also for the development of rural areas. Regional competitiveness and employment is financed from structural funds. 3. Target - European Territorial Cooperation. European territorial cooperation is a complement to the previous targets because eligible territories are under objectives of the Convergence, the Regional competitiveness and employment. It is a goal that smoothly follows the INTERREG. Its mission is to promote the harmonious and balanced development of urban, rural and coastal areas, development of economic relations and the establishment of small and medium-sized enterprises.
6. PROGRAMMING PERIOD 2007-2013 IN THE SLOVAK REPUBLIC Policy objectives and financial resources are defined for regions at the NUTS 2 level. The programme period of 2007 – 2013 was the first programme period during which the Slovak Republic was able to draw from the EU funds in its entire duration. The document known as the National Strategic Reference Framework for the period of 2007 – 2013 (hereinafter NSRF) provided the baseline for this drawing. This strategic document has been drawn up pursuant to the new regulations of the EU for the Structural Funds and Cohesion Fund. The Government of the Slovek Republic approved the document on December 6, 2006 and the European Commission on August 17, 2007. The main strategic goal formulated in the NSRF was "significantly increase by 2013, the competitiveness of the regions and the Slovak economy and employment while respecting sustainable development." During the programming period 2007 – 2013, 14 operational programs was set up. The Slovak Republic had the opportunity to draw on a financial liability of 11 482.76 million EUR, but Slovak Republic exhausted only 89.47% of the funds, which is 10 394.81 million EUR (till 31.12.2015). Funding was also possible as pre-financing from the state budget, so we must adjust spending and we must increase funding. Slovak Republic exhausted 10 826.03 million EUR (93.19%, till 31.12.2015) after adjustments. NSR is subject to the study. SWOT analysis provides the basis for building a good strategy. Appropriately selected SWOT analysis forms the basis for formulating development strategies and strategic objectives. Table following on the next page

69 Journal of Economic and Social Development – Vol 4. No 1., March 2017
Table 2 – SWOT analysis of NSR (authors´ work accoring to own research and www.unsk.sk)
Strengths - A good natural-geographical position - Plenty of brown and green zones - The sectors with high added value - Educated human potential - Existence of businesses - operating in
the trade, services, manufacturing, transportation
- Good conditions for the development of agriculture, forestry
- Skilled labor - Potential in industry and agriculture - Geothermal water
Weaknesses - Low level of entrepreneurial activity - Insufficiently developed tertiary
sector - A wide disparity in economic
performance of sub-regions - Low level of utilization of alternative
energy sources - The low level of economic
diversification - Poor co - partnerships - High regional unemployment rate -
municipalities, graduates - Stagnation in the development of
SMEs
Opportunities - Development of industries based on
position potential of the region (combined transport)
- Development of industries - chemical industry, the electrical industry
- Development of the tertiary sector - civil services, crafts, counseling and information services
- Increasing the attractiveness of the territory for investors - completion of transport infrastructure
- Increasing the attractiveness of the region - tourism - restoration of historical and cultural monuments
- The possibility of using the river
Threats - The risk of ecological disaster -
environmental burdens - Insufficient use of EU funds for the
economy - Lack of participation of scientists and
researchers in international research and innovation networks
- Lack of integration of research institutions
- Young people moving abroad - Strong competition market - Low attractiveness of the region for
investors
Analysis of socio-economic indicators pointed to regional disparities in Slovakia. Differences were seen throughout the period, some disparities increase. Bratislava Self-Governing Region held a dominant position. NSG lagged behind in many indicators. SWOT analysis shows that positive factors dominate over the negatives. NSG is classified among the developing regions with the growth potential. Analysis of status of implementation of the Structural Funds can help to better analyze the observed object, Nitra Self-Governing Region (NSR). In the programming period 2004-2006, NSR realized 810 projects. Table 3 shows the

70
DEVELOPMENT OF REGIONS AND MUNICIPALITIES OF THE
SLOVAK REPUBLIC BY APPLICATION OF EUROPEAN COHESION POLICY
Status of implementation of regional projects of the Structural Funds according to the Operational program during 2007-2013 in NSG. Table 3 - Status of implementation of regional projects of the Structural Funds according to the Operational program during 2007-2013 in NSR (authors´ work according to own research and http://www.nsrr.sk/cerpanie/)
Operational program
Operations submitted (number)
Contracted operations (number)
Contracted operations
(budget)
Realised/declared expenditure
Informatisation of Society
9 8 11 602 396,00 6 278 477,60
Competitiveness and Economic
growth 732 311 168 020 141,24 107 295 047,95
Research and development
87 38 104 920 162,46 84 400 152,46
Education 333 103 30 002 586,42 20 941 359,84
Environment 397 86 214 671 037,46 151 967 961,82
Bratislava region 0 0 0,00 0,00
Transportation 0 0 0,00 0,00
Technical assistance 0 0 0,00 0,00
Employment and Social inclusion 367 156 22 560 005,81 13 301 555,30
Healthcare 48 12 42 853 705,78 41 708 933,47
Regional operational
program 574 333 225 507 413,05 198 254 618,90
Sum 2 547 1 047 820 137 448,22 624 148 107,34
We can say that the issue of drawing of funds from the European Union may be critical in NSR. 2,547 projects were submitted, but only 1,047 projects were contracted. Drawing represents also a problem. Based on statistical findings, a questionnaire survey was conducted in the region, during the research for diploma thesis. 166 towns / cities took part in the questionnaire survey. Survey resulst are:

71 Journal of Economic and Social Development – Vol 4. No 1., March 2017
- 14% of respondents have not implemented a project financed by the Structural Funds. 22% of respondents have implemented one project, 16% of respondents implemented two projects. 48% of respondents have implemented 3 or more projects.
- The issue of lack of interest on the implementation of the Structural Funds was interesting for analysis. They were the most common causes: corruption perceptions in drawing (40%), high cost of preparation of the project (39%), lack of funds to co-finance the project (37%), bureaucracy (35%).
- The least problematic areas are - lack of information, inability to develop project documentation.
- 69% said that they wanted to draw EU funds, but the project was not successful. The problems identified in the spending of EU funds were - public procurement (20%), difficulty in spending (13%), the European Commission was not satisfied with the outcome of the project (6%), loans (2%).
7. CONSLUSION Implementation of cohesion policy is a complex process involving an large number of subjects and objects that make up a policy. They implement, monitor, evaluate and ultimately carry out the policy. According to the adopted plan and the objectives of cohesion policy, output is represented by a demonstrable reduction of regional disparities. The base is a strategic, financial and legislative definition of policy in Slovakia, as well as the creation of conditions for the grant applicants. Only if we will have the correct setting and application of basic criteria, the policy can be implemented effectively. LITERATURE:
1. CIHELKOVÁ, E. (2010). Regionalismus a multilateralismus – základy nového světového obchodního řádu. (1. edition). Praha: C. H. Beck.
2. CIHELKOVÁ, E. (2007). Nový regionalismus – teorie a případová studie (Evropská unie). (1.edition). Praha: C. H. Beck.
3. Čerpanie a zoznamy. Retrived 15.10.2016 from http://www.nsrr.sk/cerpanie/ 4. GOODALL, B. (1987). Dictionary of Human Geography. (1.edition). London: Penguin
Group. 5. JANAD, J. – MARIAK, V. (2013), Budúcnosť systému starobného dôchodkového
zabezpečenia v Slovenskej republike. Proceedings of Horizonty podnikateľského prostredia II. zo 08.11.2013. Bratislava: Fakulta managementu UK, Katedra ekonómie a financií.
6. JANŠÍKOVÁ, D. (2016). Analýza čerpania finančných prostriedkov Európskej únie v Nitrianskom samosprávnom kraji. (Diploma thesis). Comenius University in Bratislava, Faculty of Management.
7. KOMORNÍK, J. – MAJERČÁKOVÁ, D. (2016). Základy finančného manažmentu. Bratislava: Kartprint.
8. LIPKOVÁ, Ľ. (2006). Európska únia. (1. Edition). Bratislava: Sprint.

72
DEVELOPMENT OF REGIONS AND MUNICIPALITIES OF THE
SLOVAK REPUBLIC BY APPLICATION OF EUROPEAN COHESION POLICY
9. National Strategic Reference Framework for the period of 2007 -2013. Retrived 15.10.2016 from http://www.nsrr.sk/en/narodny-strategicky-referencny-ramec-2007-2013/
10. PAWERA, R. A KOL. (2013). Regionálna politika a politika súdržnosti Európskej únie a jej vplyv na Slovensku. Bratislava: Univerzita Komenského, 2013.
11. RENTKOVÁ, K. (2012). Manažment projektov financovaných zo štrukturálnych fondov Európskej únie. Theory of management 6 – the selected problems for the development support of management knowledge base. Žilina: Edis.
12. RENTKOVÁ, K. (2012). Európska politika súdržnosti aplikovaná na rozvoj regiónov a obcí Slovenskej republiky.(Dissertation). Comenius University in Bratislava, Faculty of Management.
13. RENTKOVÁ, K. – ROŠTÁROVÁ, M. – MAZANOVSKÝ, M. (2016) The Analysis of Regional Disparities in the Slovak Republic. Norristown, PA: IBIMA, 2016.
14. ROŠTÁROVÁ, M. – JANAD, J. (2014). Analýza podnikateľského prostredia v Srbsku. In: Horizonty podnikateľského prostredia, Bratislava: Univerzita Komenského v Bratislave.
15. SLOBODA, D. (2014). Slovensko. Kraje alebo župy?. Piešťany: Komunálne výskumné a poradenské centrum, n.o.. Retrived 15.10.2016 from http://www.komunal.eu/images/pdf/Slovensko_kraje_alebo_zupy_2014.pdf
16. ŠLAHOR, Ľ. – MAJERČÁKOVÁ, D. – BARTEKOVÁ, M. (2016). Implications of low/negative interest rates for banks´ asset and liability management – an example. Proceedings of the 13th International scientific conference, Brno: Masaryk University.
17. STEJSKAL, J. – KOVÁRNÍK, J. (2009). Regionální politika a její nástroje. Praha: Portal. 18. ŠVECOVÁ, A. – RAJČÁKOVÁ, E. (2013). Regionálne disparity v sociálno-ekonomickej
úrovni regiónov Slovenska v rokoch 2001-2013. Retrived 15.10.2016 from http://www.regionalnageografia.sk/publikacie/pub/RDS/11_svecova_rajcakova.pdf
UNSK. Nitriansky samosprávny kraj. Retrived 15.10.2016 from http://www.unsk.sk

73 Journal of Economic and Social Development – Vol 4. No 1., March 2017
ETHICAL ISSUES IN THE EMPLOYMENT OF EXPATRIATE LEADERS IN CORPORATIONS
Anona F. Armstrong
Victoria University, Australia [email protected]
Ronald D. Francis
Victoria University, Australia [email protected]
Heath S. Grow
Victoria University, Australia [email protected]
ABSTRACT
This paper draws upon theories of leadership and ethics to add to the understanding of ethical and cultural factors that impact on expatriates’ experiences. The paper discusses issues for expatriates, particularly relevant for those who are appointed as leaders of corporations in other countries.The paper addresses a wide range of cultural issues and how expatriates might manage the conflicts and risks emerging from different cultural values, attitudes and practices. Examples of the difficulties faced are given, as are consequences. The article concludes with some general observations, particularly relevant to those people employed as corporate expatriate managers. Keywords: ethical leadership, ethics, expatriates 1. INTRODUCTION As trade barriers fall, enterprises and their leaders are moving across boundaries to take advantage of the opportunities offered by global trade. At the same time, in response to the continuous disclosure of poor and unethical decision making and behaviour, society is demanding that our leaders respond by recognising the human rights of communities, employees and other stakeholders, are socially responsible and protect the environment. In this context, the attributes, competencies and ethics of expatriates has become an important issue. While there are many papers about leadership, there are few which examine how culture and ethics influence leadership. The paper examines who are

74
ETHICAL ISSUES IN THE EMPLOYMENT
OF EXPATRIATE LEADERS IN CORPORATIONS
expatriates, the difficulties for individual, families, the cultural differences encountered, ethical issues and how the way they are addressed is influenced by individual personality, ethical stance and perceptions of the expectations of their followers. Examples of the difficulties faced are given, as are consequences. The article begins by defining who expatriates are. 2. WHO ARE EXPATRIATES? An expatriate is a person temporarily or permanently residing, as an immigrant, in a country other than that of their citizenship. The word comes from the Latin terms ex (out) and patria (native land). In common usage, the term is often used in the context of professionals or skilled workers sent abroad by their companies. Unlike migrants, the intention of expatriates is to return to their home country at some stage. A distinction can be made between corporate expatriates sent overseas by their companies, and self-initiated expatriates who, rather than being sent overseas, are recruited by local companies. Being a self-initiated expatriate (SIE) in general refers to expatriates who are hired individually on a contractual basis and are thus not transferred overseas by a parent organization (Andresen, Bergdolt & Margenfeld 2012). Selmer and Lauring (2010) define SIEs with regard to three specific characteristics, namely that they had acquired their current job independently (self-initiated), that their current job was a steady position (regular job) and that their nationality was different from that of their host country (expatriate). Among these are the employees who live in one country, but commute to another for work. Typically a worker will spend a week or two at the work location and return home at weekends. This is common for domestic employees in Asia, and in the mining companies of far Western Australia the miners will commute from Perth or another major city, i.e. fly in and fly out (FIFO) according to their work schedule. Many not-for-profit organisations, such as Red Cross and Médecins Sans Frontières, operate in this way, flying their staff expatriates into and out of disaster and war zones to provide assistance. To these could be added a growing number of people who follow the sun, often backpackers, or retirees owning homes in both their birthplace and overseas. In some cities, the expatriate population outnumbers the locals. In Dubai, for example, expatriates from India, Pakistan, Bangladesh, Philippines and Western countries represent 80 per cent of the residents. There are further distinctions between those who travel with no intention of remaining; those sent by their company to provide expertise or learn; those who choose to live elsewhere with the clear intention of returning home at some stage; and those who have a working holiday in order to further their experience. Another category of people are students and academics, who go abroad temporarily for education purposes. Recently the OECD (2016) reported that six per cent of all tertiary students in the OECD (approximately 4.5 million students) were studying in a country other than that of their citizenship. It would be a significant omission not to mention those who choose to retire abroad. The commonly given motivations of older expatriates are a lower cost of living, a less stressful

75 Journal of Economic and Social Development – Vol 4. No 1., March 2017
lifestyle, and better weather (Eisenberg 2015). They certainly got the first and third, but doubtfully the second – lower stress. Among the several attractions are cheaper living, a warmer climate, the affordability of health care, and the attraction of fellow citizens abroad. Against that one must put the challenges from absence from family and friends, an alien language, and coping with a foreign culture. That study, an American one of 389 expatriates living in South America, may or may not be generalisable. What was also found is that expatriate retirees did contemplate returning home. Eisenberg’s (2015) study reported 85 per cent who were satisfied, but that necessarily excluded those who had returned home, and thus the dissatisfaction level may be much higher. According to the HSBC Bank (2017) survey of expatriates, Canada has the most retirees living abroad (31% compared to the global average of 11%). Of the available definitions the one that seems to be most apt defines an expatriate as: ‘a person temporarily or permanently residing, as an immigrant, in a country other than that of their citizenship’. This is distinct from that of migrants who intend to settle elsewhere and become permanent residents. The foreign-born are therefore a large class of people living beyond their place of birth, and expatriates are a part of that cohort. Here, the focus is upon expatriates rather than upon migrants and, in particular on those appointed to leadership positions in their temporary home. The advantage to multi-national companies of appointing expatriates to lead their global subsidiaries is that they can transfer their knowledge and skills, expand into new markets and maintain on on-the-ground control of operations. This is of particular importance to maintaining the reputation and brand of the parent company. Local companies who employ expatriates can access the skills and experiences of their multi-national competitors and also fill gaps in a local employment market. 3. DIFFICULTIES ENCOUNTERED BY EXPATRIATES Among the difficulties that expatriates may encounter are lack of support, leaving families behind, unwillingness of family and spouse to move, spouse employment, education options for children, lack of cross-cultural training, or rejection by the host community. Most of all is the appropriateness of responses to a different culture. The problems arising from cultural insensitivity include such issues as attitude to time and punctuality, the importance of personal relationships, loyalty, gifting, and social responsibility. The ways in which theses are addressed can be a function of a person’s personality. Personality During the process of selecting and training appropriate expatriates, numerous individual factors related to adjustment have been studied. Personality, personal skills, previous international experience, and family situation are among the most important factors influencing the expatriates' adjustment.
76
ETHICAL ISSUES IN THE EMPLOYMENT
OF EXPATRIATE LEADERS IN CORPORATIONS
The personalities of people, including intelligence, a sense of adventurousness, a willingness to favour those less fortunate, and a readiness to deal with uncertainty and even endure sub-optimal conditions may be essential attributes for successfully coping with a new and especially a challenging environment. While intelligence has a long and distinguished research history there recently was a development by Goleman (1996). His analysis involved what came to be called ‘emotional intelligence’, and involves being sensitive to emotions (Conte 2005). Misunderstandings can easily occur. For example, should an expatriate be stopped by police, their emotional responses in an unfamiliar manner may be misinterpreted as arrogant or insolent. Those from some cultures find the over-exercise of power by petty functionaries difficult to understand, and never to be admired. By way of contrast, there are cultures in which the firm exercise of bureaucratic function is seen as both normative and right (Francis 2014). Cultural intelligence is defined as the specific ability to adapt attitudes and behaviour to new cultures, see McNulty and Inkson (2013). To these definitions of intelligence, can be added the concept of ethical intelligence. While emotional intelligence is related to understanding emotion: ethical intelligence, on the other hand, involves being concerned rather than just understanding. This becomes a major issue for people working in non-profit organisations who may find themselves negotiating with local power factions for resources or even gaining permission or protection to operate as has happened in times of environmental disasters or other crises such as the war in Syria. A balance here, in some contexts, is between becoming involved in local disputes and achieving humanitarian aims. Personality represents an individual level of cultural analysis while more group and social perspectives have been applied to analysis of national and business cultures. Culture Culture is shared values, beliefs, customs, attitudes, ideas and ideals: it is the common frame of reference that allows people to cope with their daily lives. As such, culture is a metonym for a significant part of our identity. Although values such as courtesy and honesty can be included among universal values, there are vast differences in how these are practiced. There is also a vast di fference between cultures on beliefs and attitudes. Attitudes about women are an example. The range is from the requirement of total subjugation to the clear emancipation (and perhaps even elements of strident feminism). In Saudi Arabia, for example, there are strict rules that govern what women may or may not do. Women do not have the same rights as men in the matter of divorce, nor may they marry outside Islam. If a Saudi woman wants to go to hospital, she needs permission from a male relative, women must attend separate schools, and they are not allowed to drive. Cultural values may collide on several issues. Among such are the notion of collective responsibility, attitudes to women, and judgments about body shape, animal rights, bribery, secret commissions, and loyalty-to-family versus loyalty-to-principle. Important themes in

77 Journal of Economic and Social Development – Vol 4. No 1., March 2017
international dealings are those of the need to resolve issues of values in relation to different cultures, and to try to find principles that transcend culture. At a personal level one might make the same observation: people do not necessarily come in fixed packages, and not all people from one culture hold the same degree of value attachment to different objects, issues, and principles. 4. RESEARCH INTO BUSINESS CULTURES Research into culture in organisation is extensive. Hofstede (2005), Trompenaars and Hampden-Turner (2002) and House et al (2004) have all defined various dimensions that describe international and business cultures. Hofstede (2005) categorised cultures along dimensions of power distance, uncertainty avoidance, individualism/collectivism, masculinity/feminism, long-term/short term outlook, and indulgence/restraint. Trompenaars’ and Hampden-Turner’s (2002) cultural dimensions were universalism/particularism, individualism/collectivism, specific/diffuse roles, achievement/ascription of social values, a past/future time perspective and relationship (control) with the environment. Nine cultural dimensions emerged from House et al’s (2004) study of Global Leadership and Organisational Behaviour Effectiveness (the GLOBE study) adding two further dimensions (gender egalitarianism and performance orientation) to the above. Steers, Sánchez-Runde and Nardon (2010) concluded that all these models have contributed to our understanding of global management and the world of business but that many of the dimensions overlapped. Their response was to draw the constructs together in a composite model of five core cultural dimensions that was applicable to a contemporary environment. These were: power distribution: hierarchical versus egalitarian; social relationships: individual versus collective; environmental relationships: mastery versus harmony; time and work patterns: monochromic versus polychromic (managing one thing at a time or everything at once); and uncertainty and social control: rules versus relationships based. While the above studies were important in understanding culture, the relationships between culture and leadership have also been explored in studies with a focus on leadership models (Grow & Armstrong 2017; Muenjohn & Armstrong 2007). 5. LEADERSHIP AND CULTURE Hofstede’s cultural dimensions provided the framework for Muenjohn’s and Armstrong’s (2007) study of the differences in values between Western (Australian) and Asian (Thai) leaders. Individualism-collectivism described the Western tradition of self-reliance and entrepreneurial behaviour contrasted with the commitment to the good of the group seen in Asian cultures. Those who valued individualism were expected to be more self-oriented and interested in promoting their own interests. In contrast those who were collectivists put a higher value on the values of their social group, family and their corporation. Power distance described the relationships between people in a business hierarchy. Leaders in a high ‘power distance’ were respected because of their position and assumed much authority. In more egalitarian countries, leaders are often the ‘one among equals’ who must earn both personal authority and position power. Australian culture registers as comparatively ‘low’ on power

78
ETHICAL ISSUES IN THE EMPLOYMENT
OF EXPATRIATE LEADERS IN CORPORATIONS
distance, ‘medium’ on uncertainty avoidance, ‘high’ in individualism and comparatively ‘high’ in masculinity (Hofstede 2005). The masculinity-femininity dimension suggests that strongly aggressive and competitive values dominate masculine type societies in contrast to the less competitive and more collaborative feminine style of leader. Uncertainty avoidance describes the need for structure, stability and certainty. Members of a community high in uncertainty avoidance are likely to be insecure, less tolerant of deviance and more aggressive in the workplace. Two further scales Hofstede related to culture were Short-terminism and Indulgent self-restraint. Long-term vs short term was one of the two further scales. Hofstede found that leaders with a short-term orientation were more likely to look for quick results. In an indulgent community people feel less restrained by peer group and cultural values and expectations. The conclusions from Muenjohn’s and Armstrong’s (2007) study confirmed the collectiveness nature of the Thai society and the dislike of uncertainty in the workplace. Thai subordinates exhibited a high sense of group identity and respect for authority. They also expected a high degree of paternalism from their leaders. Leaders were expected to take an interest in their families, respond to personal problems and be active participants in social activities. In their study of different national leadership styles Grow and Armstrong (2017) aimed to determine the preferred leadership style of Australian and Chinese leaders from the hospitality industry and the impact of cultural and socio-economic variables on their leadership styles. The methodology was a survey of 500 hospitality industry employees from each country which collected data on demographics and leadership styles using the Multifactor Leadership Questionnaire and a structured questionnaire (Grow & Armstrong 2017). Research into the components of the Full Range Leadership Model has been extensive (see Muenjohn, Armstrong and Francis (2010) for a review). The validity of the model has been confirmed in numerous investigations of components of the model (Bass & Riggio 2006; Muenjohn & Armstrong 2008), cross-cultural research (Muenjohn & Armstrong 2007) applications in industry (Grow & Armstrong 2013, 2015) relationships with organisation performance (Krüger, Rowold, Borgmann, Staufenbiel & Heinitz 2011; Lam & O’Higgins 2012) and increased creativity in followers (Eisenbeiß & Boerner 2013). The findings of Grow’s and Armstrong’s (2017) study confirmed that Australian and Chinese managers use both transformational and transactional leadership styles, but Australians prefer transformational leadership more so than their Chinese counterparts. Age, education, sex and ethnicity were all correlated with leadership style. Persons who were older and with higher levels of education were more likely to use transformational leadership and those who were younger (20-30) preferred transactional leadership styles. The less educated were more likely to use Laissez-Faire leadership. There was more similarities than differences between participants due to sex.

79 Journal of Economic and Social Development – Vol 4. No 1., March 2017
6. LEADERSHIP AND ETHICS In their review, Muenjohn et al. (2010) described research into the model’s three major factors, Laissez-Faire, Transactional and Transformational leadership. Laissez-Faire leadership represents a lack of leadership, in which case no transaction occurs between leaders and followers. Research into Laissez-Faire leadership found that followers would turn to other sources for guidance or attempt to usurp the role of the legitimate appointed leader (Avolio & Bass 1994). Transactional leaders are seen to be concerned with day-to-day management of a particular work group or department. Behaviour displayed by transactional leaders is strongly aligned with generic conceptions of ‘management’ rather than ‘leadership’. Transactional leaders reward their followers for completion of tasks and punish them for non-compliance or poor performance (Grow 2014). While transactional leaders focus on day-to-day management, transformational leaders engage in a more strategic style of ‘leadership’ which communicates the organisation’s long-term vision (Bass & Riggio 2006) while encouraging followers to increase their skillset and personal capacity to perform. While the Full Range Leadership model appears to present a binary view of leadership, and is often misinterpreted as ‘transactional = bad and transformational = good’, this is not the case. An emerging body of leadership is gaining attention in academic circles is that of the ‘corporate psycopath’ (Grow & Armstrong 2015). Such leaders are thought to exhibit outwardly and publicly the characteristics of transactional leadership. Within the organisation, that is inwardly and privately, the same leaders pay scant regard to ethics, and display a toxic style of leadership wherein they bully their followers and encourage disruptive and counterproductive work practices while hindering organisational productivity to promote their own self interest (Boddy 2013). In the context of leadership style, Bass and Riggio (2006) described this as the concept of “Pseudo Leadership” which occurred when transformational leaders “use their abilities to inspire and lead followers to destructive, selfish and even evil ends” (p. 5). Several researchers following this notion have investigated the ‘dark side of transformational leadership’ – see Armstrong and Francis (2017) for a review. In contrast, when a leader subjects their vision and its implementation to scrutiny to determine if it has a higher purpose, they are exhibiting ethical leadership. The terms ethics and morals are sometimes used interchangeably, although one can make distinctions (the word ethics is from Greek, whereas the word morals is from Latin). Ethics determine what is good or right for individuals and society, what goals people and society ought to pursue, and what actions they ought to perform. More commonly, the word moralsrefers to the standards held by the community, often in a form not explicitly articulated. Morality is therefore influenced by social norms and beliefs. As discussed above, leaders values and followers expectations are influenced by cultural norms. So what is seen as moral in one society may not be seen so in another. Similarly, acting according to one’s conscience is not always acceptable action in another culture. Good corporate governance practices such as standards for whistleblowing promote ethical behaviour (Francis & Armstrong 2011). In studies of whistleblowing (Armstrong & Francis 2009, 2016; Dussuyer, Smith & Armstrong 2016; Francis & Armstrong 2010) cultural norms and context play a major role in motivating employees to ‘blow the whistle’. The expatriate who was appointed to be CEO of a leading Japanese technology company, blew the whistle on the fraud he uncovered only to find

80
ETHICAL ISSUES IN THE EMPLOYMENT
OF EXPATRIATE LEADERS IN CORPORATIONS
himself fleeing for his life. Whistleblowing studies also reveal the conflict between doing the right thing by disclosing corruption but being punished with ‘exile’ by their company culture. According to Bass (1985) transformational leadership was a process in which leadership behaviour sought to increase awareness in followers of what was right and important for the organisation. This process was associated with motivating followers to perform beyond expectation their self-interest for the good of the group or organisation. Leaders influenced followers by their vision and putting followers and organisation needs ahead of their own, expressing high expectations and confidence in followers, seeking their participation in decisions, and treating and recognising followers as individuals rather than being one of a group. In turn, followers identified with the vision or aspirations of the leader, developed their skills and felt valued and important (Muenjohn et al. 2010). Transformational leadership has been most successful in giving significant insight into how leaders can influence their followers. Leaders can advance strategies that influence followers in various ways. They are therefore well placed to take advantage of their followers’ loyalty, to enhance the performance of followers and their organisations. Alternatively, because of their knowledge, they may also, perhaps, manipulate them in ways that are to the leaders’ advantage, and not always to the advantage of their followers or their organisations. Transactional leaders responded to followers’ needs and desires as long as followers ‘did the job’ and achieved desired outcomes of transactional leaders. The most important factor here was a consistent strategy using contingent reinforcement (recognition, bonuses, or promotion). Transactional leadership, while it appears to lack the higher order values or aspirations of transformational leadership is very effective in some contexts such as sales and the hospitality industry (Grow & Armstrong 2013). The weakness in using this leadership style was the difficulty faced by leaders in identifying the needs of their followers, the appropriate rewards, and the difficulty for a leader who did not have the power or resources to give the awards. The latter is likely to occur in start-up ventures or in mature companies should they be impacted by rapid growth or market changes that reduce cash-flow. 7. CONCLUSION Although the focus of the two studies described above differs. There are practical implications drawn from these two studies for expatriate leaders. The type of leaderships that will ensure success depends on:
Knowing the industry context. Working in a competitive multinational financial firm in Dubai will require a different approach to that used in a non-profit charity such as Red Cross. This means that leaders must understand the context in which they work.
Understanding cultural norms and expectations. Cultural dimensions external to the group reflect national values that affect both subordinates’ and leader’s values and behaviours. Active social participation requires an understanding of social mores and norms. Leaders and followers are influenced by national cultural values. Sensitivity to dress appropriately is a very basic requirement but not respecting local norm and traditions can be a disaster. Subordinates expecting transactional leadership, firm direction and clarity of financial arrangements with individuals will be equally as confused as those from a collectivist transformational culture expecting team work and

81 Journal of Economic and Social Development – Vol 4. No 1., March 2017
group participation. It is vital for leaders to be aware of these differences if leaders are to know what is expected of them and to also identify opportunities to lead and shape the expectations of followers.
Acting in ways that engender trust and confidence. This requires a sound knowledge of the leader’s own attitudes, biases and competencies. Acting consistently in ways that reduce uncertainty and build certainty, not slavishly following local practices but balancing expectations of leadership, with achieving the right outputs. What is ‘right’ is not always obvious and most ethical decisions require balancing the protection of individual rights and needs against and alongside of the rights and needs of others.
LITERATURE: 1. Andresen, M, Bergdolt, F & Margenfeld, J 2012, ‘What distinguishes self-initiated
expatriates from assigned expatriates and migrants? A literature-based definition and differentiation of terms’, in M Andresen, A Al Ariss & M Walther (eds), Organizations and self-initiated expatriation: individual, organizational, and national perspectives, Taylor and Francis, New York, pp. 11–42.
2. Armstrong, A & Francis, RD 2009, ‘Ethical dilemmas in the management of international humanitarian organisations’, paper presented to 27th International Symposium on Economic Crime at Jesus College, University of Cambridge: The Enemy Within – internal threats to the stability and integrity of financial institutions, Cambridge, United Kingdom, 30 August–6 September 2009.
3. —— 2016, ‘Migration and corruption: an empirical study in search of meaning’, paper presented to 34th International Symposium on Economic Crime at Jesus College, University of Cambridge: Economic Crime – where does the buck stop? Who is responsible – facilitators, controllers and or their advisers?, Cambridge, United Kingdom, 4–11 September 2016.
4. —— 2017, ‘The trouble with leadership: theories of good and troubled leadership and their ethical implications’, in N Muenjohn & A McMurray (eds), The Palgrave handbook of leadership in transforming Asia, Palgrave Macmillan, London, p. Ch. 8 [ in press ].
5. Avolio, BJ & Bass, BM 1994, Improving organizational effectiveness through transformational leadership, SAGE, Thousand Oaks.
6. Bass, BM 1985, Leadership and performance beyond expectations, Free Press, New York. 7. Bass, BM & Riggio, RE 2006, Transformational leadership, 2nd edn, Lawrence Erlbaum
Associates, Mahwah, NJ. 8. Boddy, CR 2013, ‘Corporate psychopaths, conflict, employee affective well-being and
counterproductive work behaviour’, Journal of Business Ethics, vol. April 2013 (Online), pp. 1–15.
9. Conte, JM 2005, ‘A review and critique of emotional intelligence measures’, Journal of Organizational Behavior, vol. 26, no. 4, pp. 433-40.
10. Dussuyer, I, Smith, R & Armstrong, A 2016, ‘What happens to whistleblowers after misconduct is reported?’, paper presented to Governance and Law: across all borders, Melbourne, 28–29 April 2016.
11. Eisenbeiß, SA & Boerner, S 2013, ‘A double-edged sword: transformational leadership and individual creativity’, British Journal of Management, vol. 24, no. 1, pp. 54–68.

82
ETHICAL ISSUES IN THE EMPLOYMENT
OF EXPATRIATE LEADERS IN CORPORATIONS
12. Eisenberg, R 2015, Expat retirees reveal how life has turned out, Next Avenue, viewed 17 January 2016, http://www.nextavenue.org/expat-retirees-reveal-how-life-has-turned-out/.
13. Francis, R & Armstrong, A 2010, ‘Corruption and whistleblowing in international humanitarian agencies’, paper presented to 28th International Symposium on Economic Crime at Jesus College, University of Cambridge: The New Deal – ensuring integrity, stability and survival, Cambridge, United Kingdom, 5–12 September 2010.
14. Francis, R & Armstrong, A 2011, ‘Formal meetings as an aid to corruption prevention in international humanitarian aid agencies’, paper presented to 29th International Symposium on Economic Crime at Jesus College, University of Cambridge: Responsibility for Risk, Cambridge, United Kingdom, 4–11 September 2011.
15. Francis, RD 2014, Birthplace, migration and crime: the Australian experience, Palgrave Macmillan, Basingstoke, United Kingdom.
16. Goleman, D 1996, Emotional intelligence: why it can matter more than IQ, Bloomsbury, London.
17. Grow, HS 2014, ‘Praeesse in hospitio’, Doctor of Philosophy thesis, Victoria University. 18. Grow, HS & Armstrong, A 2013, ‘Melburnia: transforming the transaction’, in JM
Fountain & K Moore (eds), Proceedings of CAUTHE 2013 Tourism and Global Change – on the edge of something big, Lincoln University, Lincoln, New Zealand, pp. 251–67.
19. —— 2015, ‘Academic leadership: a lost profession?’, paper presented to Australasian Law Teachers Association 2015 Conference: Legal Education and Access to Justice, Melbourne, 16–18 July 2015.
20. —— 2017, ‘Leadership, diversity and cross-cultural leadership in China and Australia’, in N Muenjohn & A McMurray (eds), The Palgrave handbook of leadership in transforming Asia, Palgrave Macmillan, London, p. Ch.1 [ in press ].
21. Hofstede, GH 2005, Culture’s consequences: international differences in work-related values, 20th (abridged) edn, SAGE, Newbury Park, Calif.
22. House, RJ & GLOBE Research Program 2004, Culture, leadership, and organizations: the GLOBE study of 62 societies, SAGE, Thousand Oaks.
23. HSBC Bank 2017, Expat Explorer Survey – Findings, HSBC Bank International Limited, viewed 18 January 2017, https://www.expatexplorer.hsbc.com/survey/findings.
24. Krüger, C, Rowold, J, Borgmann, L, Staufenbiel, K & Heinitz, K 2011, ‘The discriminant validity of transformational and transactional leadership: a multitrait-multimethod analysis of and norms for the German Transformational Leadership Inventory (TLI)’, Journal of Personnel Psychology, vol. 10, no. 2, pp. 49–60.
25. Lam, CS & O’Higgins, ERE 2012, ‘Enhancing employee outcomes: the interrelated influences of managers’ emotional intelligence and leadership style’, Leadership & Organization Development Journal, vol. 33, no. 2, pp. 149–74.
26. McNulty, Y & Inkson, K 2013, Managing expatriates: a return on investment approach, Business Expert Press, New York.
27. Muenjohn, N & Armstrong, A 2007, ‘Transformational leadership: the influence of culture on the leadership behaviours of expatriate managers’, International Journal of Business and Information, vol. 2, no. 2, pp. 265–83.
28. —— 2008, ‘Evaluating the structural validity of the Multifactor Leadership Questionnaire (MLQ), capturing the leadership factors of transformational-transactional leadership’, Contemporary Management Research, vol. 4, no. 1, pp. 3–14.

83 Journal of Economic and Social Development – Vol 4. No 1., March 2017
29. Muenjohn, N, Armstrong, A & Francis, R 2010, Leadership in Asia Pacific: readings and research, Cengage Learning Australia, South Melbourne, Victoria.
30. OECD 2016, Education at a glance 2016: OECD indicators, OECD Publishing, Paris. 31. Selmer, J & Lauring, J 2010, ‘Self-initiated academic expatriates: inherent demographics
and reasons to expatriate’, European Management Review, vol. 7, no. 3, pp. 169-79. 32. Steers, RM, Sánchez-Runde, C & Nardon, L 2010, Management across cultures:
challenges and strategies, Cambridge University Press, Cambridge, United Kingdom.
33. Trompenaars, F & Hampden-Turner, C 2002, Riding the waves of culture: understanding
cultural diversity in business, 2nd edn, Nicholas Brealey, London.

84
CORPORATE GOVERNANCE IN INDIA:
AN ANALYSIS
CORPORATE GOVERNANCE IN INDIA: AN ANALYSIS
Meghna Thapar
Hidayatullah National Law University, Raipur, Chhattisgarh, India [email protected]
Arjun Sharma
Hidayatullah National Law University, Raipur, Chhattisgarh, India [email protected]
ABSTRACT
Corporate governance is a process, relation and mechanism set up for the corporations and firms based on certain guidelines and principles by which a company is controlled and directed. The principles provided in the system ensure that the company is governed in a way that it is able to set and achieve its goals and objectives in the context of the social, regulatory and market environment, and is able to maximize profits and also benefit those whose interest is involved in it, in the long run. The division and distribution of rights and responsibilities among different participants in the corporation (such as the board of directors, managers, shareholders, creditors, auditors, regulators, and other stakeholders) and inclusion of the rules and procedures for making decisions in corporate affairs are identified with the help of Corporate Governance mechanism and guidelines.The need to make corporate governance in India transparent was felt after the high profile corporate governance failure scams like the stock market scam, the UTI scam, Ketan Parikh scam, Satyam scam, which were severely criticized by the shareholders. Thus, Corporate Governance is not just company administration but more than that and includes monitoring the actions, policies, practices, and decisions of corporations, their agents, and affected stakeholders thereby ensuring fair, efficient and transparent functioning of the corporate management system.By this paper, the authors intend to examine the concept of corporate governance in India with regard to the provisions of corporate governance under the Companies Act 2013. The paper will highlight the importance and need of corporate governance in India. We will also discuss the important case laws which contributed immensely in the emergence of corporate governance in India. Keywords:Corporate governance Mechanism, Companies, Firms, Companies Act 2013

85 Journal of Economic and Social Development – Vol 4. No 1., March 2017
1. INTRODUCTION Corporate governance defined as "the set of conditions that shapes the ex post bargaining over the quasi-rents generated by a firm.”1
Corporate governance has also been more narrowly defined as "a system of law and sound approaches by which corporations are directed and controlled focusing on the internal and external corporate structures with the intention of monitoring the actions of management and directors and thereby, mitigating agency risks which may stem from the misdeeds of corporate officers.”2
We may infer that Corporate governance is a process, relation and mechanism set up for the corporations and firms based on certain guidelines and principles by which a company is controlled and directed. The principles provided in the system ensure that the company is governed in a way that it is able to set and achieve its goals and objectives in the context of the social, regulatory and market environment, and is able to maximize profits and also benefit those whose interest is involved in it, in the long run. The division and distribution of rights and responsibilities among different participants in the corporation (such as the board of directors, managers, shareholders, creditors, auditors, regulators, and other stakeholders) and inclusion of the rules and procedures for making decisions in corporate affairs are identified with the help of Corporate Governance mechanism and guidelines.
The framework of corporate governance consists of:
(1) Express or implied contracts between the stakeholders and the company for the distribution of rights, duties, rewards and liabilities,etc among different participants in the corporation.
(2) Procedure for proper control and supervision of information flow in the company, i.e., a proper mechanism of checks-and-balances, and
(3) Procedures for resolving and reconciling the conflicting interests and decisions of different participants in the corporation.
This mechanism ensures accountability of the Board of Directors to all stakeholders of the corporation i.e. managers, shareholders, suppliers, creditors, auditors, regulators, employees, customers and society in general; for giving the company a fair, clear and efficient administration. So it is not just mere company administration but a corporate management system. It is a code of conduct that must be followed for running and proper functioning of a corporate entity.
2. CORPORATE GOVERNANCE FRAMEWORK IN INDIA Ever since India's biggest-ever corporate fraud and governance failure unearthed at Satyam Computer Services Limited, the concerns about good Corporate Governance have increased phenomenally.
1Luigi Zingales, 2008. "corporate governance," The New Palgrave Dictionary of Economics, 2nd Edition. Abstract. 2Sifuna, Anazett Pacy (2012). "Disclose or Abstain: The Prohibition of Insider Trading on Trial". Journal of International Banking Law and Regulation.
86
CORPORATE GOVERNANCE IN INDIA:
AN ANALYSIS
Internationally, there has been a great deal of debate going on for quite some time. The famous Cadbury Committee defined "Corporate Governance" in its Report (Financial Aspects of Corporate Governance, published in 1992) as "the system by which companies are directed and controlled".
The Organisation for Economic Cooperation and Development (OECD), which, in 1999, published its Principles of Corporate Governance gives a very comprehensive definition of corporate governance, as under:
"a set of relationships between a company's management, its board, its shareholders and other stakeholders. Corporate governance also provides the structure through which the objectives of the company are set, and the means of attaining those objectives and monitoring performance are determined. Good corporate governance should provide proper incentives for the board and management to pursue objectives that are in the interests of the company and shareholders, and should facilitate effective monitoring, thereby encouraging firms to use recourses more efficiently."
2.1. Regulatory framework on corporate governance The Indian statutory framework has, by and large, been in consonance with the international best practices of corporate governance. Broadly speaking, the corporate governance mechanism for companies in India is enumerated in the following enactments/ regulations/ guidelines/ listing agreement:
1. The Companies Act, 2013inter alia contains provisions relating to board constitution, board meetings, board processes, independent directors, general meetings, audit committees, related party transactions, disclosure requirements in financial statements, etc.
2. Securities and Exchange Board of India (SEBI) Guidelines: SEBI is a regulatory authority having jurisdiction over listed companies and which issues regulations, rules and guidelines to companies to ensure protection of investors.
3. Standard Listing Agreement of Stock Exchanges: For companies whose shares are listed on the stock exchanges.
4. Accounting Standards issued by the Institute of Chartered Accountants of India (ICAI): ICAI is an autonomous body, which issues accounting standards providing guidelines for disclosures of financial information. Section 129 of the New Companies Act inter alia provides that the financial statements shall give a true and fair view of the state of affairs of the company or companies, comply with the accounting standards notified under s 133 of the New Companies Act. It is further provided that items contained in such financial statements shall be in accordance with the accounting standards.
5. Secretarial Standards issued by the Institute of Company Secretaries of India (ICSI): ICSI is an autonomous body, which issues secretarial standards in terms of the provisions of the New Companies Act. So far, the ICSI has issued Secretarial Standard on "Meetings of the Board of Directors" (SS-1) and Secretarial Standards on "General Meetings" (SS-2). These Secretarial Standards have come into force w.e.f. July 1, 2015. Section 118(10) of the New Companies Act provide that every company (other than one person company) shall observe
87 Journal of Economic and Social Development – Vol 4. No 1., March 2017
Secretarial Standards specified as such by the ICSI with respect to general and board meetings.
3. CORPORATE GOVERNANCE UNDER THE COMPANIES ACT, 2013 Many high profile corporate governance failure scams like the stock market scam, the UTI scam, Ketan Parikh scam, Satyam scam, which was severely criticized by the shareholders, called for a need to make corporate governance in India transparent as it greatly affects the development of the country.
The Indian Companies Act of 2013 introduced some progressive and transparent processes which benefit stakeholders, directors as well as the management of companies. Investment advisory services and proxy firms provide concise information to the shareholders about these newly introduced processes and regulations, which aim to improve the corporate governance in India.
Corporate advisory services are offered by advisory firms to efficiently manage the activities of companies to ensure stability and growth of the business, maintain the reputation and reliability for customers and clients. The top management that consists of the board of directors is responsible for governance. They must have effective control over affairs of the company in the interest of the company and minority shareholders. Corporate governance ensures strict and efficient application of management practices along with legal compliance in the continually changing business scenario in India.
Corporate governance was guided by Clause 49 of the Listing Agreement before introduction of the Companies Act of 2013. As per the new provision, SEBI has also approved certain amendments in the Listing Agreement so as to improve the transparency in transactions of listed companies and giving a bigger say to minority stakeholders in influencing the decisions of management. These amendments have become effective from 1st October 2014.
3.1. A Few New Provision for Directors and Shareholders •One or more women directors are recommended for certain classes of companies
•Every company in India must have a resident directory
•The maximum permissible directors cannot exceed 15 in a public limited company. If more directors have to be appointed, it can be done only with approval of the shareholders after passing a Special Resolution
•The Independent Directors are a newly introduced concept under the Act. A code of conduct is prescribed and so are other functions and duties
•The Independent directors must attend at least one meeting a year
•Every company must appoint an individual or firm as an auditor. The responsibility of the Audit committee has increased
•Filing and disclosures with the Registrar of Companies has increased
•Top management recognizes the rights of the shareholders and ensures strong co-operation between the company and the stakeholders

88
CORPORATE GOVERNANCE IN INDIA:
AN ANALYSIS
•Every company has to make accurate disclosure of financial situations, performance , material matter, ownership and governance
3.2. Additional Provisions • Related Party Transactions – A Related Party Transaction (RPT) is the transfer of resources or facilities between a company and another specific party. The company devises policies which must be disclosed on the website and in the annual report. All these transactions must be approved by the shareholders by passing a Special Resolution as the Companies Act of 2013. Promoters of the company cannot vote on a resolution for a related party transaction.
•Changes in Clause 35B – The e-voting facility has to be provided to the shareholder for any resolution is a legal binding for the company.
•Corporate Social Responsibility – The company has the responsibility to promote social development in order to return something that is beneficial for the society.
•Whistle Blower Policy – This is a mandatory provision by SEBI which is a vigil mechanism to report the wrong or unethical conduct of any director of the company.
4. NEED FOR CORPORATE GOVERNANCE The need for corporate governance is highlighted by the following factors:
(i) Wide Spread of Shareholders:
Today a company has a very large number of shareholders spread all over the nation and even the world; and a majority of shareholders being unorganised and having an indifferent attitude towards corporate affairs. The idea of shareholders’ democracy remains confined only to the law and the Articles of Association; which requires a practical implementation through a code of conduct of corporate governance.
(ii) Changing Ownership Structure:
The pattern of corporate ownership has changed considerably, in the present-day-times; with institutional investors (foreign as well Indian) and mutual funds becoming largest shareholders in large corporate private sector. These investors have become the greatest challenge to corporate managements, forcing the latter to abide by some established code of corporate governance to build up its image in society.
(iii) Corporate Scams or Scandals:
Corporate scams (or frauds) in the recent years of the past have shaken public confidence in corporate management. The event of Harshad Mehta scandal, which is perhaps, one biggest scandal, is in the heart and mind of all, connected with corporate shareholding or otherwise being educated and socially conscious.
The need for corporate governance is, then, imperative for reviving investors’ confidence in the corporate sector towards the economic development of society.
(iv) Greater Expectations of Society of the Corporate Sector:

89 Journal of Economic and Social Development – Vol 4. No 1., March 2017
Society of today holds greater expectations of the corporate sector in terms of reasonable price, better quality, pollution control, best utilisation of resources etc. To meet social expectations, there is a need for a code of corporate governance, for the best management of company in economic and social terms.
(v) Hostile Take-Overs:
Hostile take-overs of corporations witnessed in several countries, put a question mark on the efficiency of managements of take-over companies. This factors also points out to the need for corporate governance, in the form of an efficient code of conduct for corporate managements.
(vi) Huge Increase in Top Management Compensation:
It has been observed in both developing and developed economies that there has been a great increase in the monetary payments (compensation) packages of top level corporate executives. There is no justification for exorbitant payments to top ranking managers, out of corporate funds, which are a property of shareholders and society.
This factor necessitates corporate governance to contain the ill-practices of top managements of companies.
(vii) Globalisation:
Desire of more and more Indian companies to get listed on international stock exchanges also focuses on a need for corporate governance. In fact, corporate governance has become a buzzword in the corporate sector. There is no doubt that international capital market recognises only companies well-managed according to standard codes of corporate governance.
5. IMPORTANCE OF CORPORATE GOVERNANCE IN INDIA / CONCLUSION A company that has good corporate governance has a much higher level of confidence amongst the shareholders associated with that company. Active and independent directors contribute towards a positive outlook of the company in the financial market, positively influencing share prices. Corporate Governance is one of the important criteria for foreign institutional investors to decide on which company to invest in.The corporate practices in India emphasize the functions of audit and finances that have legal, moral and ethical implications for the business and its impact on the shareholders. The Indian Companies Act of 2013 introduced innovative measures to appropriately balance legislative and regulatory reforms for the growth of the enterprise and to increase foreign investment, keeping in mind international practices. The rules and regulations are measures that increase the involvement of the shareholders in decision making and introduce transparency in corporate governance, which ultimately safeguards the interest of the society and shareholders.Corporate governance safeguards not only the management but the interests of the stakeholders as well and fosters the economic progress of India in the roaring economies of the world.
LITERATURE:

90
CORPORATE GOVERNANCE IN INDIA:
AN ANALYSIS
1. T. N. Satheesh Kumar, ‘Corporate Governance: Principles and Practices’, Pearson Education India; 4 edition (2011).
2. Prasad K, ‘Corporate Governance’, Prentice Hall India Learning Private Limited; 2 edition (2011).
3. Asish K. Bhattacharyya, ‘Corporate Governance in India: Change and Continuity’, Oxford University Press (19 September 2016).
4. Indian Institute of Corporate Affairs, “Corporate Governance’, Taxmann; 2015 edition (2016).
5. Das S. C., Corporate Governance in India: An evaluation, Taxmann; 2015 edition (2016). 6. Fernando, ‘Business Ethics and Corporate Governance’, Pearson Education India; 2
edition (2012). 7. Tricker, ‘Corporate Governance: Principles, Policies and Practices’, Oxford University
Press India; Second edition (14 January 2013).

INSTRUCTIONS TO AUTHORS The official language for writing the paper is English. All papers have to be written in .doc or .docx format (MS Office Word 97-2003 or higher). Bibliography must be listed as an autonomous final chapter. Specific units of sources must be numbered and listed in alphabetical order by the author surnames or by the publication title in the event of anonymous authors. Lenght: Up to 10 pages Font: Calibri Size: 12 Alignment: both-side Margins: 2,5 cm all around Spacing: single Paper must include: Title Name of Author(s) Author(s) Institution and Institutional Address Author(s) email Address Abstract (Body Text) Keywords (3-5 Keywords in Alphabetical Order) Introduction Chapters Subchapters Conclusion Literature
TITLE OF PAPER [FONT CALIBRI, SIZE 12, BOLD]
Author 1 Name and surname [font Calibri, size 12, bold]
Organisation, Country Email [font Calibri, size 12, italic]
Author 2 Name and surname [font Calibri, size 12, bold]
Organisation, Country Email [font Calibri, size 12, italic]
Abstract[font Calibri, size 12, italic, bold] Body text [font Calibri, size 10, italic]
Keywords: Keyword1, Keyword2, Keyword3,... (in Alphabetical order)[font Calibri, size 12,
italic] 1. Intorduction [font Calibri, size 12, BOLD] Body text goes here [font Calibri, size 12]
*****