Embed Size (px)
Citation preview
Journal Name RSCPublishing
ARTICLE
This journal is © The Royal Society of Chemistry 2013 J. Name., 2013, 00, 1-3 | 1
Electronic Supplementary Information (ESI)
Highly homogeneous core-sheath polyaniline nanofibers by polymerisation on wire-shaped template
Rossella Castagna1, Roberto Momentè1, Giorgio Pariani2, Giuseppe Zerbi1, Andrea Bianco2, Chiara Bertarelli1,3*
1Dipartimento di Chimica Materiali e Ingegneria Chimica “G. Natta”, Politecnico di Milano, piazza Leonardo da Vinci 32, 20133 Milano, Italy
2Istituto Nazionale di Astrofisica, Osservatorio Astronomico di Brera, via E. Bianchi 46, 23807 Merate, Italy
3Center for Nano Science and Technology @PoliMi, Istituto Italiano di Tecnologia, Via Pascoli 70/3, 20133 Milano, Italy
Table of contents:
Figure 1 : SEM images of N-FeA nanofibers.Figure 2 : Optical images of N-FeH nanofibers.Figure 3 : SEM images of N-ADPA nanofibers.Figure 4 : UV- vis reflectance spectra of N6, N-sADPA and N-ADPA nanofibers.Figure 5 : FTIR spectra of N6, N-sADPA nanofibers and ADPA molecule.Figure 6 : SEM images of N-sADPA after oxidative polymerization. Figure 7 : UV-vis reflectance spectra of N-sADPA after oxidative polimerization.Figure 8 : UV-vis reflectance spectra of N-sADPA after doping treatment. Figure 9 : Diameter distribution of N-sFeH electrospun nanofibers after diffusion stepFigure 10: Diameter distribution of N-sADPA electrospun nanofibers before and after oxidative polymerization.Figure 11: FTIR spectra of N-sADPA before and after base treatmentTable 1 : Assignment of the main IR band.
Electronic Supplementary Material (ESI) for Polymer Chemistry.This journal is © The Royal Society of Chemistry 2014

ARTICLE Journal Name
2 | J. Name., 2012, 00, 1-3 This journal is © The Royal Society of Chemistry 2012
Figure 1. SEM images of N-FeA electrospun nanofibers (on the left) and N-FeH electrospun nanofibers (on the right) at 15 kV with a flow rate of 0.05 mL/h.
Figure 2. OM images of N-FeH (8,85% FeCl3 ∙ 6H2O) electrospun nanofibers after polymerization treatment (left: tDIFF = 60’ + tOX = 30’; right: tDIFF = 75’ + tOX = 60’).
Figure 3. SEM images of N-ADPA (67 wt% ADPA) electrospun nanofibers at different magnifications.

Journal Name ARTICLE
This journal is © The Royal Society of Chemistry 2012 J. Name., 2012, 00, 1-3 | 3
Figure 4. UV-Vis reflectance spectra of N6 fibers and N-sADPA nanofibers (blue); N-ADPA nanofibers (red). Magnification of the region between 300 and 700 nm.
0.015
0.020
0.025
0.030
0.035
0.040
0.045
0.050
Abs
orba
nce
2800 3000 3200 3400 Wavenumbers (cm-1)
Figure 5. FTIR spectra in the region 3500-2600 cm-1 of electrospun N6 (blue line) and N-sADPA mats (red line), and ADPA film (green line).
Ù
ARTICLE Journal Name
4 | J. Name., 2012, 00, 1-3 This journal is © The Royal Society of Chemistry 2012
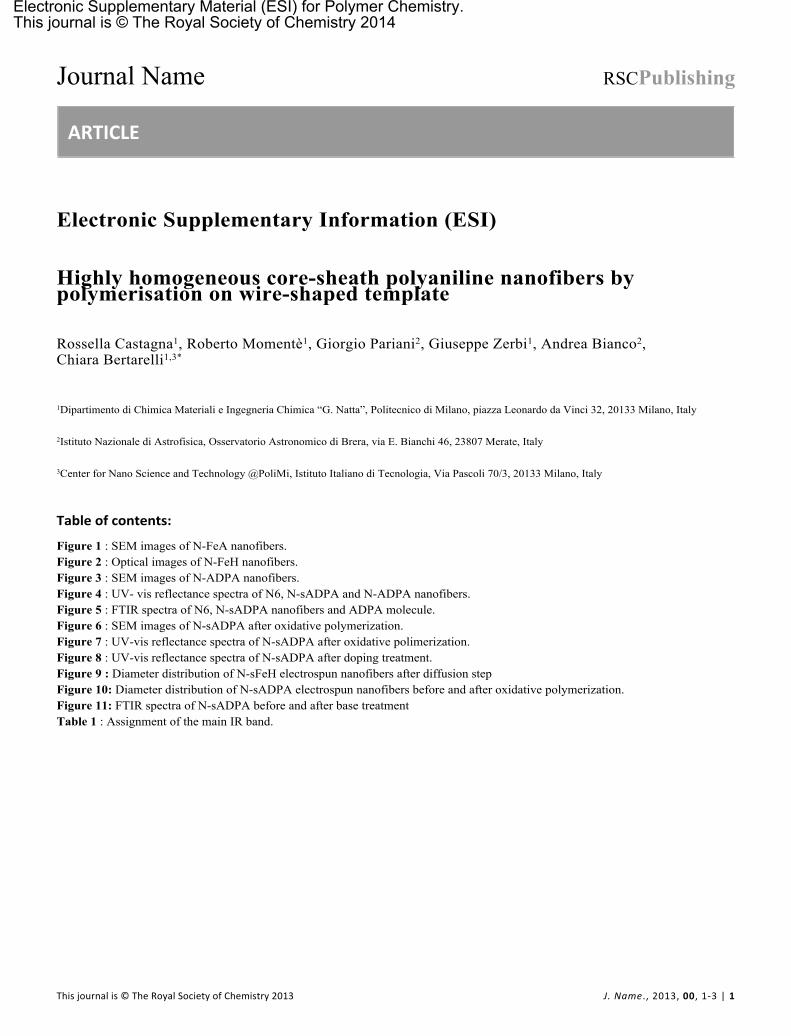
Figure 6. SEM images of N-sADPA (67 wt% ADPA) electrospun fibers polymerized in an oxidation bath containing p-TSA (0.175 M) after an oxidative polymerization treatment (tOX = 150 s).
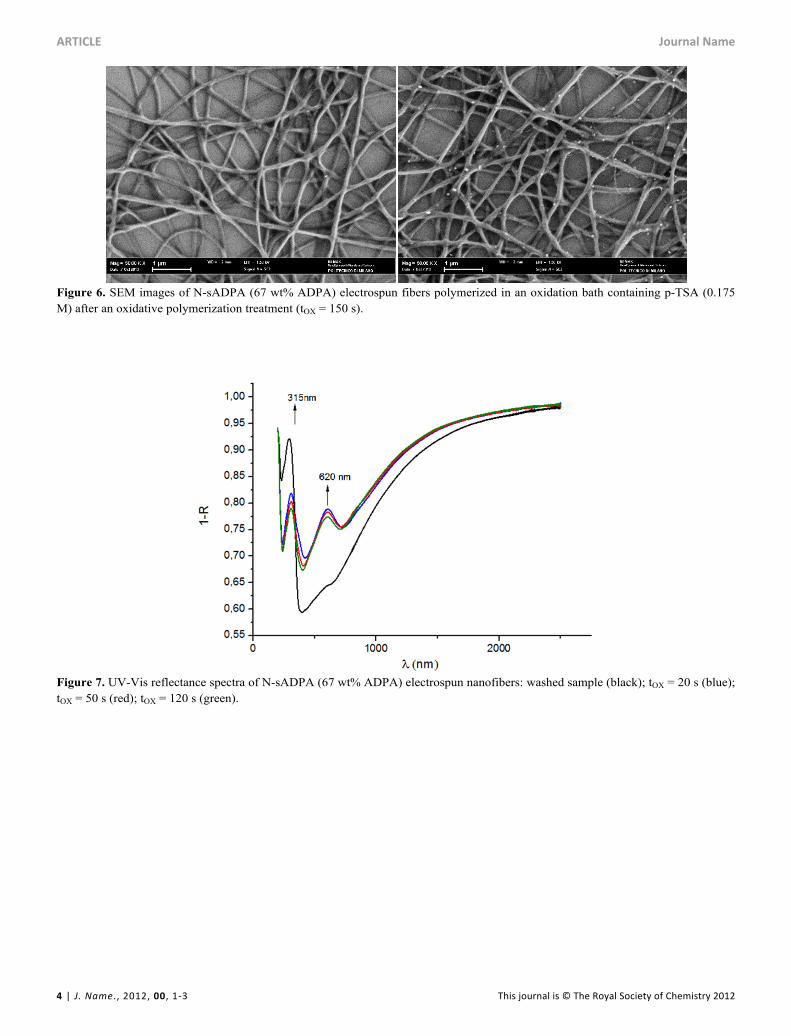
Figure 7. UV-Vis reflectance spectra of N-sADPA (67 wt% ADPA) electrospun nanofibers: washed sample (black); tOX = 20 s (blue); tOX = 50 s (red); tOX = 120 s (green).

Journal Name ARTICLE
This journal is © The Royal Society of Chemistry 2012 J. Name., 2012, 00, 1-3 | 5
Figure 8. UV-Vis reflectance spectra of N-sADPA (67 wt% ADPA) electrospun nanofibers: tOX = 150 s (black); tDOP = 30 s (green); tDOP = 60 s (red); tDOP = 60 s after 1 h (blue).
Figure 9. Diameter distribution of N-sFeH electrospun nanofibers after diffusion step: tDIFF = 120’ (red) mean diameter is 214 ± 35 nm and tDIFF = 180’ (green) mean diameter is 200 ± 30 nm.
Figure 10. Diameter distribution of N-sADPA electrospun nanofibers: a) as spun; b) after oxidative polymerization (tox = 150s).

ARTICLE Journal Name
6 | J. Name., 2012, 00, 1-3 This journal is © The Royal Society of Chemistry 2012
Figure 11. FTIR spectra of N-sADPA (67 wt% ADPA vs Nylon 6) in wavenumbers range 1700-500 cm-1: mat before and after base treatment (KOH 0.175 M). The red arrow indicates the band disappearing by treatment with base.
Wavenumber (cm-1) Assignment Material* Wavenumber (cm-1) Assignment Material*
3450Aromatic secondary
amine:N-H stretching
ADPA 1600Primary amine:N-H bending
ADPA
3380Aromatic primary
amine:N-H stretching
ADPA 1542 Amide II Nylon 6
3300Aliphatic secondary
amine:N-H stretching
Nylon 6 1520-1490Aromatic ring: stretch
ADPA
3100 - 3000Aromatic ringC-H stretching
ADPA 1460-1440-(CH2)-bending
Nylon 6
2930-(CH2)-asymmetric C-H
stretchingNylon 6 1360
-(CH2)-wagging
Nylon 6
2850-(CH2)-symmetric C-H
stretchingNylon 6 1350-1280
Aromatic secondary amine
C-N stretchADPA
1650 Amide I Nylon 6 830
Aromatic C-H 1,4- disubstituited phenyl
out-of-plane bending
ADPA
1620Aromatic ring: stretching
ADPA 750 - 700
Aromatic C-H Monosubstituited phenyl
out-of-plane bending
ADPA
Table 1. Assignment of the main IR bands: main wavenumbers, IR mode and material correlation. (*N-phenyl-1,4-phenylenediamine - ADPA)