Embed Size (px)
DESCRIPTION
Audit experience
Citation preview

Journal of Accounting,Auditing & Finance
2015, Vol. 30(1) 78–100�The Author(s) 2014
Reprints and permissions:sagepub.com/journalsPermissions.nav
DOI: 10.1177/0148558X14544503jaf.sagepub.com
The Effect of Audit Experienceon Audit Fees and AuditQuality
Steven F. Cahan1 and Jerry Sun2
Abstract
Prior research on audit experience focuses on behavioral studies that are conducted byrunning experiments. Although these studies provide evidence on the role of experience incompleting specific audit tasks, they do not shed light on how experience affects a com-plete audit engagement. We conduct an archival study to examine the effect of audit experi-ence on audit fees and audit quality. Using unique data from China, where the signees ofthe audit report can be identified and linked with a government database containing per-sonal information about certified public accountants, we find that experience is positivelyassociated with audit fees and negatively associated with absolute discretionary accruals.Furthermore, we extend the research on personal characteristics of audit partners by con-sidering the incremental effects of gender, education, engagement tenure, industry speciali-zation, and client importance after controlling for overall audit experience. Overall, ourresults suggest that the auditors’ personal characteristics may serve as a signal of the levelof care that will be exercised during the audit process. Our results also have implicationsfor China’s recently announced regulation that would require localization of Big 4 offices inChina.
Keywords
audit experience, individual auditors, audit fees, audit quality, audit partners
Introduction
We examine the effect of an individual’s overall audit experience on audit fees and audit
quality using unique archival data. Prior behavioral research examines the relationship
between individual auditors’ audit experience and audit judgments (e.g., Bonner, 1990;
Libby & Frederick, 1990; Moeckel, 1990; Simnett, 1996). These behavioral studies argue
that experienced auditors have greater knowledge and more developed memory structures
than inexperienced auditors, which leads to more accurate judgments by experienced audi-
tors, but the results of these studies are mixed. Bonner (1990) contends that the mixed
1The University of Auckland, New Zealand2University of Windsor, Ontario, Canada
Corresponding Author:
Jerry Sun, Odette School of Business, University of Windsor, 401 Sunset Ave., Windsor, Ontario, Canada N9B
3P4.
Email: [email protected]
Article
at Universitas Diponegoro PARENT on May 25, 2015jaf.sagepub.comDownloaded from

findings could result from a failure to incorporate task-specific knowledge in the test instru-
ment, suggesting that the results may be sensitive to the experimental design. Moreover,
behavioral research focuses on manipulated specific audit tasks rather than the body of
audit work completed for a client. To complement this stream of behavioral research, we
examine the effects of audit experience using an archival approach.
Archival research based on individual auditors’ personal characteristics is extremely rare
because of limited data availability. The difficulty of using individual auditors’ data in
archival research usually arises for two reasons: (a) the audit partner’s name is not dis-
closed in the audit report, and (b) even where the partner’s name is disclosed in the audit
report, information about the personal characteristics of that partner has not been publicly
available. A few studies focus on audit partner tenure (e.g., Carey & Simnett, 2006; C. Y.
Chen, Lin, & Lin, 2008; Manry, Mock, & Turner, 2008). These studies use the number of
years for which a partner has served as the engagement partner for the same company.
However, strictly speaking, audit partner tenure for a particular company is not a personal
characteristic of the partner; rather, it is an engagement characteristic. In this study, we
focus on the audit partner’s overall experience, that is, the number of years that an individ-
ual has been engaged in audit work, using unique data from China.
The Chinese audit context is unique because regulations require that the names of the
two Certified Public Accountants (CPAs) who sign the audit report be disclosed and
because it is possible to obtain some personal information about individual auditors from
the Chinese Securities Regulatory Commission (CSRC), which oversees the licensing of
auditors who audit listed companies. Thus, we are able to examine the effect of an auditor’s
overall audit experience (as opposed to engagement experience) on audit fees and audit
quality after controlling for gender, education, industry experience, engagement tenure, and
client importance. We document a positive association between audit fees and the aggre-
gate audit experience of the two signee auditors, suggesting that clients pay fee premiums
to have their audits led by more experienced CPAs. As the audit fee reflects the hours and
billing rates of the entire audit team, it is unlikely that this result is merely reflecting the
higher charge out rate of more experienced lead auditors. More important, we find that cli-
ents of more experienced CPAs have lower absolute discretionary accruals than clients of
less experienced CPAs, suggesting that experienced auditors are better able to constrain
earnings management. Combined, this suggests that more experienced lead auditors can
conduct higher quality audits and that clients are willing to pay a premium for this quality.
Overall, our results suggest that the lead auditors’ personal characteristics may proxy for
the level of care that will be exercised during the audit process, and thus may help mitigate
information problems in a setting where the client cannot fully observe the quality of the
audit.
Our study complements the work of Gul, Wu, and Yang (2013) who also use data from
individual auditors in China. They focus on estimating individual auditor fixed effects and
find that including these fixed effects significantly improves the explanatory power of
regression models that seek to explain differences in audit quality (e.g., abnormal accruals,
small profits). However, they find that only a small portion of the individual auditor fixed
effects can be explained by demographic characteristics related to the auditor. Rather than
focus on individual auditor fixed effects, we focus on the average effect of auditor experi-
ence. That is, we are not interested in how the auditor experience-audit quality relation dif-
fers between individual auditors; instead, we are interested in whether auditor experience is
related to audit quality at a general level. Furthermore, while Gul et al. (2013) consider
auditor experience specifically, they define it based on the number of years of Big N
Cahan and Sun 79
at Universitas Diponegoro PARENT on May 25, 2015jaf.sagepub.comDownloaded from
experience. We define experience as overall auditor experience which is important because,
as Gul et al. (2013) note, the Big N have relatively small market shares in China. Finally,
we also consider how auditor experience affects the price of an audit while Gul et al.
(2013) do not.
Our study contributes to the literature in two additional ways. First, our research com-
plements the behavioral research on audit experience. The behavioral studies document
mixed evidence on the relationship between audit experience and audit judgments. As these
studies were conducted by designing specific audit tasks, they are unable to test the effect
of audit experience on the complete audit engagement. Thus, unlike behavioral research,
we are able to examine the implications of audit experience in a broader context. Second,
our study extends a small but important stream of archival research that focuses on individ-
ual audit partners. Prior studies focus on engagement tenure rather than overall audit expe-
rience. The effects of a longer engagement tenure should mainly reflect the auditor’s
client-specific knowledge. By controlling for engagement tenure as well as auditors’ indus-
try experience, we are able to isolate the role of overall experience—a measure of general
knowledge—from client-specific knowledge and industry knowledge. We find evidence
that greater general knowledge can reduce earnings management and increase audit quality.
Our research has also practical importance. In May 2012, the Ministry of Finance in
China regulated that foreign partners in a Big 4 Chinese office should be not more than
20% by 2017, and the chief partner of the office should be a Chinese citizen. This regula-
tion was announced 1 day after the Securities and Exchange Commission (SEC) charged
Deloitte’s Shanghai office for failing to produce audit documents for a Chinese client, a
violation of the Sarbanes–Oxley Act that requires the Public Company Accounting
Oversight Board (PCAOB) to inspect non-U.S. auditors who audit U.S.-listed firms (e.g.,
‘‘Accounting in China,’’ 2012). Together, these events raise questions about the quality and
experience of Chinese auditors. Our results suggest that audit quality increases with overall
audit experience, which suggests that increasing Chinese auditor involvement in Big 4
offices in China is unlikely to diminish audit quality in the long run as Chinese auditors
gain greater experience as a result of the new regulation. Whether audit quality will suffer
in the short term is outside the scope of our study, but is an interesting issue for future
research.
The rest of the article is organized as follows. ‘‘Institutional Background’’ section intro-
duces the institutional background. ‘‘Literature Review’’ section reviews the literature.
‘‘Hypotheses’’ section develops the hypotheses. ‘‘Research Design’’ section designs the
research. ‘‘Empirical Results’’ section reports the results. ‘‘Conclusion’’ section concludes.
Institutional Background
On December 25, 1995, the Chinese Ministry of Finance issued the first batch of indepen-
dent audit standards since the People’s Republic of China (PRC) was established in 1949.1
These standards became effective on January 1, 1996. No. 7 Independent Audit
Standards—Audit Report regulated the practices of CPAs issuing audit reports. According
to the standards, CPAs issuing audit reports were required to sign and stamp their individ-
ual names, and to also stamp their accounting firm’s name on the audit report.
Nevertheless, there were no specific requirements on whose names or how many CPAs’
names should be signed and stamped on the audit report.
To reinforce the accountability of CPAs who issue audit reports, the Ministry of Finance
released a supplementary regulation on the signing and stamping CPAs’ names on audit
80 Journal of Accounting, Auditing & Finance
at Universitas Diponegoro PARENT on May 25, 2015jaf.sagepub.comDownloaded from
reports on July 2, 2001. This regulation, Notice of the Ministry of Finance on Related
Issues of CPAs’ Signature and Seal on Audit Reports, required that the audit report should
be signed and sealed by two CPAs who are licensed to issue the related audit report2 and
should be sealed by the accounting firm of the two CPAs. More specifically, the regulation
requires that the signers should include the audit partner, chief CPA or an entrusted deputy
chief CPA, who makes the final review of the audit, and another CPA who is in charge of
the daily work on the audit.
On April 13, 2003, the Ministry of Finance issued a revised version of No. 7
Independent Audit Standards—Audit Report, which became effective on July 1, 2003.
Similar to the original version, the revised version states that audit reports should be signed
and sealed by CPAs, and also sealed by the accounting firm. In addition, the revised ver-
sion provided a template for the audit reports, which indicated that two CPAs were required
to sign and stamp their names.
On February 15, 2006, the Ministry of Finance issued No. 1501 Audit Standards of
Chinese CPAs—Audit Report to replace No. 7 Independent Audit Standards—Audit Report.
This batch of audit standards became effective from January 1, 2007. With respect to the
requirements on the signature and seal of CPAs on audit reports, it is identical to the prior
audit standard revised in 2003. The specific requirements on who should sign and seal
audit reports are still the same as set out in the Ministry’s Notice that was issued in 2001.
Thus, China has a relatively long history of requiring signatures of the two key auditors on
an engagement.
Literature Review
Audit Experience
Prior research on audit experience was generally conducted by designing experiments or
cases to examine the effect of audit experience on individual auditors’ judgments. Farmer,
Rittenberg, and Trompeter (1987) document that experienced auditors are less likely to
agree with the client’s preferred accounting treatment than inexperienced auditors, whereas
Abdolmohammadi and Wright (1987) find a negative relation between audit experience
and the likelihood of proposing an audit adjustment or qualified opinion. Biggs, Mock, and
Watkins (1988) compare the analytical review of two audit managers with 7 years of audit
experience and two senior auditors with 3 years of audit experience in a case study. They
find that the senior auditors increased workload throughout the revenue cycle, while the
audit managers did so more selectively. Libby and Frederick (1990) investigate the relation
between error frequency knowledge and audit experience.3 Their findings indicate that per-
ceptions about the source of the financial statement error are more accurate for experienced
auditors than for inexperienced auditors.
Moeckel (1990) examines the effect of audit experience on the frequency of two types
of memory errors including failure to integrate and reconstruction.4 She finds that inexper-
ienced auditors fail to integrate more often than experienced auditors, whereas experienced
auditors reconstruct more often than inexperienced auditors. As reconstructions impair
experienced auditors’ ability to integrate and to detect the integration failures of their sub-
ordinates, Moeckel indicates that her findings challenge the intuition that experienced audi-
tors will perform better at all aspects of work paper review. Bonner (1990) notes that the
mixed results on the effect of audit experience on audit judgments may have arisen because
some studies did not consider the role of task-specific knowledge in experimental designs.
Cahan and Sun 81
at Universitas Diponegoro PARENT on May 25, 2015jaf.sagepub.comDownloaded from
In a study of the effect of information selection, information processing, and task com-
plexity on predictive accuracy of auditors, Simnett (1996) finds that audit experience can
mitigate some of the limitations arising from information selection, but not from informa-
tion processing. Davis (1996) examines whether audit experience affects auditors’
approaches to selecting relevant information and whether selection of more relevant infor-
mation improves auditors’ judgment performance for preliminary control risk assessments.
By comparing new audit seniors and experienced audit seniors from a non-Big 6 account-
ing firm, he finds that experienced senior auditors exhibited a higher level of selective
attention to relevant information than new senior auditors. Moreover, experienced senior
auditors exhibited more consistency between the selected relevant information and the con-
trol risk assessment response, selected fewer cues, and made judgments in less time. In
sum, these experimental studies provide valuable insights about the effects of experience in
specific settings. We complement this research by examining the role of experience on the
overall audit engagement.
Audit Fees and Audit Quality
Although there is a vast literature on audit fees, prior research has not considered how the
personal characteristics of the lead auditors might affect the fee that is charged to clients.
Instead, the prior research focuses on characteristics of the client firm, characteristics of the
audit firm delivering the service, or characteristics of the specific engagement. In a meta-
analysis, Hay, Knechel, and Wong (2006) find significant support for a Big 8/6/5/4
premium based on 85 different studies. Just as the Big N premium is due to reputational
inferences made by investors, detailed knowledge of the personal characteristics of lead
members of the audit team may influence the reputational inferences made by the client
firm.
Audit Partner Tenure
Audit firm size and industry specialization are organization-level variables. Recently, sev-
eral archival studies have focused on audit partner tenure, which is a partner/engagement-
level variable. That is, it reflects the partner’s experience on a particular audit, but says
nothing about the partner’s other clients or overall work experience. Still, these studies
shed light on the value of partner rotation, which is an important issue from a regulatory
perspective.
Carey and Simnett (2006) examine the relation between audit partner tenure and audit
quality. They measure audit partner tenure as the number of years for which a partner has
served as the engagement partner for the sample company. Using an Australian sample,
they document that financial distressed firms with long audit partner tenure are less likely
to receive a going-concern audit opinion. They also document some evidence that firms
with long audit partner tenure are more likely to just beat earnings benchmarks, but no evi-
dence on the association between audit partner tenure and discretionary working capital
accruals. Using data from Taiwan, where audit reports of public companies should be certi-
fied by two audit partners whose names must be disclosed in the audit report, C. Y. Chen
et al. (2008) identify audit partner tenure, and find that firms with long audit partner tenure
have lower absolute discretionary accruals, inconsistent with the argument that long tenure
audit partners provide lower quality services.
82 Journal of Accounting, Auditing & Finance
at Universitas Diponegoro PARENT on May 25, 2015jaf.sagepub.comDownloaded from
Manry et al. (2008) examine the association between audit partner tenure and discretion-
ary accruals based on the data from multiple U.S. offices of three large international
accounting firms. They find that audit partner tenure is negatively associated with discre-
tionary accruals. Furthermore, they find that the significant and negative association
between audit partner tenure and discretionary accruals is only for small clients with part-
ner tenure of more than 7 years. Bedard and Johnstone (2010) investigate the relation
between audit partner tenure and audit planning and pricing in United States. They find no
association between audit partner tenure and planned audit hours, and a positive association
between audit partner tenure and planned realization rates.5
Hypotheses
Behavioral auditing research suggests that audit experience affects the accuracy of auditors’
judgments. When auditors make judgments, they need to recall information necessary to
perform tasks from memory (Bonner, 1990). The judgment accuracy depends on how much
recalled information is matched to the task requirement (Libby & Frederick, 1990). As
experienced auditors have developed vast and complex memory structures, they are able to
use more adequate information in decision making, resulting in more accurate judgments.
Moreover, these memory structures are precursors as they interpret the meaning and impli-
cations of domain-specific information, and thus affect auditors’ selection, understanding,
and reaction to the task environment (Gibbins, 1984; Waller & Felix, 1984). Audit experi-
ence also affects the selection and weighting of information cues. Experienced auditors
have knowledge structures that enable them to identify the particular information cues that
should be selected and appropriately weighted to form their judgments (Bonner, 1990).
Thus, audit experience can lead to more accurate audit judgments.
Signees of the audit report are audit partners or chief CPAs of accounting firms who are
responsible for the final review of the audit, or CPAs who are in charge of the audit proj-
ect. In a field experiment, Pratt and Jiambalvo (1981) find that in-charge auditors’ beha-
viors significantly affect the performance of audit teams supervised by those auditors.
More experienced audit team leaders are more likely to behave in a way to increase audit
team performance. These team leaders have more knowledge and expertise to effectively
guide and monitor subordinates’ work.
The importance of personal characteristics can be linked to the economic theory of
auditing. Auditing is a credence good because the client cannot determine the amount of
service required ex ante and because the client cannot determine the quality of the service
ex post (e.g., Causholli & Knechel, 2012; Emons, 1997). In such a setting, Dye (1993)
expects that observable characteristics, such as the auditor’s wealth, will proxy for the
unobserved audit quality. An auditor’s wealth is important because wealthy auditors have
more to lose if they are sued for a substandard audit. DeAngelo (1981) makes a similar
argument for audit firm size but focuses on quasi-rents. In our setting, the personal charac-
teristics of the auditor may serve as an observable signal of the level of care that will be
exercised during the audit process. Thus, knowledge of the lead auditors’ personal charac-
teristics may mitigate information problems for the client firm.
Prior research (e.g., Francis, 1984; Palmrose, 1986) indicates that auditors charge higher
fees on higher quality audits. If experienced auditors make better decisions as the experi-
mental research suggests, they may increase audit fees to better reflect the higher quality of
their audits. This quality differential may result in the higher audit fees charged by experi-
enced signees. On the contrary, more experienced auditors may be able to conduct the
Cahan and Sun 83
at Universitas Diponegoro PARENT on May 25, 2015jaf.sagepub.comDownloaded from

audit more efficiently. However, the audit firm may not pass these cost savings on to
clients.
Consequently, we examine two hypotheses. First, we examine whether there is a positive
association between signees’ audit experience and audit fees. Second, to the extent experi-
enced auditors charge higher fees, we consider whether the higher fees are due to experi-
enced auditors providing higher audit quality. More formally, we test the following two
hypotheses:
Hypothesis 1 (H1): Audit fees are positively associated with signees’ audit
experience.
Hypothesis 2 (H2): Audit quality is positively associated with signees’ audit
experience.
Research Design
Data Collection
We begin to select sample firms from the CSMAR-Audit Opinion database, which provides
the data including audit fees of auditing the annual financial statements, the names of
CPAs who signed the audit report, and the name of the audit firm, from all companies
listed on both the Shanghai Stock Exchange and the Shenzhen Stock Exchange for the
years 2007 to 2010.6 Using the data for years 1990 to 2010 from the CSMAR-Audit
Opinion database, we identify the audit tenure of both signees and the audit firm.
We then manually collect the data on signees’ audit experience, gender, and education
background from the official website of the CSRC (i.e., www.csrc.gov.cn), which is the
government agency to regulate the Chinese securities markets.7 To be allowed to audit
Chinese listed companies, audit firms and their CPAs must have a license from the CSRC.
The CSRC provides the basic information of licensed audit firms and their individual
licensed CPAs on its website including the number of years for which an individual CPA
has been engaged in audit work, which is used in this study to measure the individual
CPA’s audit experience.
Next, we manually collect the data on the number of each company’s business segments
and the number of each company’s consolidated subsidiaries from the annual report, which
is downloaded from the official websites of the Shanghai Stock Exchange and the
Shenzhen Stock Exchange (i.e., www.sse.com.cn and www.szse.cn). We also acquire the
data on each audit firm’s total revenue publicly released by the Chinese Institute of
Certified Public Accountants (CICPA). Finally, we collect the data of financial statements
from the Compustat Global database to compute other variables used in the statistical
analysis. After the exclusion of firms with missing data and firms not covered by the
databases, the final sample consists of 1,917 firm-year observations over the period 2007 to
2010.
Table 1 reports the breakdown of the final sample across 50 two-digit Standard
Industrial Classification (SIC) industries, of which chemicals and allied products (18.36%),
electrical and electronic equipment (10.12%), machinery and computer equipment (8.50%),
primary metal industries (5.89%), transportation equipment (5.32%), and electric, gas, and
sanitary services (5.32%) are the most representative industries in the sample.
84 Journal of Accounting, Auditing & Finance
at Universitas Diponegoro PARENT on May 25, 2015jaf.sagepub.comDownloaded from

Models
We test the first hypothesis by estimating the following regression model:
AFEE =a0 +a1SEXP +a2SFM +a3SEDU +a4STEN +a5SIS +a6AFTEN +a7AFIS
+a8AFSIZE +a9AFINT +a10SIZE +a11ROA+a12DEBT +a13LOSS +a14NSEG
+a15NSUBS +a16REC +a17INV +a18AUOP + industry dummies + e,
ð1Þ
where AFEE = audit fees, measured as the natural logarithm of audit fees for auditing the
company’s annual financial statements; SEXP = signee audit experience, measured as the
natural logarithm of the sum of years for which two signees have engaged in audit work;
SFM = female signees, coded ‘‘2,’’ ‘‘1,’’ and ‘‘0’’ if both signees, one of the two signees,
and no signees are female, respectively; SEDU = signee education, measured as the sum of
two signees’ education level, which is coded ‘‘3,’’ ‘‘2,’’ and ‘‘1’’ if a signee has a PhD
degree, master’s degree, and undergraduate degree or others, respectively; STEN = signee
tenure, measured as the natural logarithm of the sum of years for which the two signees
have audited the client; SIS = signee industry specialization, measured as the sum of the
two signees’ industry specialization, which is the ratio of the sales of the clients of a signee
Table 1. Sample Breakdown by Industry.
Two-digit SIC code Industry description Frequency %
12 Coal mining 25 1.3016 Heavy construction contractors 28 1.4620 Food and kindred products 75 3.9122 Textile mill products 74 3.8626 Paper and allied products 28 1.4628 Chemicals and allied products 352 18.3630 Rubber and miscellaneous plastics products 32 1.6732 Stone, clay, glass, and concrete products 55 2.8733 Primary metal industries 113 5.8935 Machinery and computer equipment 163 8.5036 Electrical and electronic equipment 194 10.1237 Transportation equipment 102 5.3238 Measuring and analyzing instruments 22 1.1544 Water transportation 26 1.3647 Transportation services 40 2.0948 Communications 20 1.0549 Electric, gas, and sanitary services 102 5.3250 Wholesale trade-durable goods 40 2.0951 Wholesale trade-non-durable goods 37 1.9353 General merchandise stores 52 2.7173 Business services 50 2.6199 Nonclassifiable establishments 37 1.93
Others 250 13.04Total 1,917 100.00
Note. SIC = Standard Industrial Classification.
Cahan and Sun 85
at Universitas Diponegoro PARENT on May 25, 2015jaf.sagepub.comDownloaded from

in a two-digit SIC industry to the total sum of the sales of all companies in that industry;
AFTEN = audit firm tenure, measured as the natural logarithm of the maximum number of
years for which the audit firm has audited the client; AFIS = audit firm industry specializa-
tion, measured as the ratio of the sales of the clients of the audit firm in a two-digit SIC
industry to the total sum of the sales of all companies in that industry; AFSIZE = audit firm
size, measured as the natural logarithm of the total revenue of the audit firm; AFINT =
audit firm international alliance, coded ‘‘1’’ if the audit firm is a member of an interna-
tional audit firm alliance, and ‘‘0’’ otherwise; SIZE = client size, measured as the natural
logarithm of total assets; ROA = return on assets, measured as the ratio of income before
extraordinary items to total assets; DEBT = debt ratio, measured as the ratio of long-term
debt to total assets; LOSS = loss making, coded ‘‘1’’ if income before extraordinary items
is negative and ‘‘0’’ otherwise; NSEG = segment, measured as the natural logarithm of the
number of business segments; NSUBS = subsidiary, measured as the natural logarithm of
the number of consolidated subsidiaries; REC = receivables intensiveness, measured as the
ratio of receivables to total assets; INV = inventory intensiveness, measured as the ratio of
inventory to total assets; AUOP = audit opinion, coded ‘‘1’’ if a modified audit opinion is
issued, and ‘‘0’’ otherwise.
In Equation 1, the coefficient on SEXP is expected to be positive and significant if the
first hypothesis is supported.8 Because we use the panel data for years 2007 to 2010, stan-
dard errors are clustered by year.
We include control variables for other personal characteristics that might affect audit
fees or quality. Numerous studies examine the role of gender in business settings. For
example, Adams and Ferreira (2009) find that gender-diverse boards devote more effort to
monitoring, and prior research (e.g., Lund, 2008; Nguyen, Basuray, Smith, Kopka, &
McGulloh, 2008) suggests that women may be more ethical and effective than men. In an
audit context, a few experimental studies examine the effect of gender on audit judgments.
Estes and Reames (1988) find that female auditors differ from male auditors in terms of
confidence in their materiality decisions. J. Chung and Monroe (2001) find that women
auditors outperform male auditor in an inventory valuation task. Gold, Hunton, and Gomaa
(2009) find that female auditors are less likely to be swayed by unverified client-provided
explanations, but are more (less) likely to be persuaded by male (female) clients when com-
pared with male auditors. To control for gender effects, we include SFM in the model.
As education level reflects an individual’s knowledge and skill base (Hambrick &
Mason, 1984), we control for SEDU in the model. Very few studies examine the effects of
education on auditor’s decision making. Estes and Reames (1988) find no difference in
auditors’ material decisions based on various measures of education. Grant, Ciccotello, and
Dickie (2002) find the 150-hr rule adopted in many U.S. states had only marginal impact
on student’s CPA exam success. In a survey, Ethridge and Heminway (1993) find only
31% of respondents thought individuals with an accounting master’s degree perform better
than individuals with an accounting bachelor’s degree.
We include STEN in the model because, as discussed above, prior research (e.g., Carey
& Simnett, 2006; Ghosh & Moon, 2005; Manry et al., 2008) indicates a positive effect of
audit partner tenure and audit firm tenure on audit quality. We control for STEN so we can
disentangle the effects of the audit partner’s firm-specific knowledge and general
knowledge.
To examine the effects of industry-specific knowledge, we control for industry speciali-
zation for each signees of the audit report. Solomon, Shields, and Whittington (1999) find
that industry-specific knowledge leads to more accurate non-error frequency knowledge.
86 Journal of Accounting, Auditing & Finance
at Universitas Diponegoro PARENT on May 25, 2015jaf.sagepub.comDownloaded from

Owhoso, Messier, and Lynch (2002) find that industry specialists are better at detecting
errors, and Low (2004) finds that specialists provide superior risk assessment and audit
planning decisions. Thus, SIS and STEN allow us to examine the effect of general audit
experience that is incremental to the lead auditors’ industry-specific knowledge and firm-
specific knowledge.
Consistent with the prior literature, we also include several variables measured at the
audit firm level. Palmrose (1986) documents a positive relationship between audit fees and
audit firm absolute size, and Becker, DeFond, Jiambalvo, and Subramanyam (1998) find
that auditor size is positively associated with audit quality. Thus, AFSIZE is added to the
model. As audit firms develop areas of expertise and can build teams of experts (e.g.,
Cahan, Jeter, & Naiker, 2011), we include AFIS to capture industry specialization at the
audit firm level. As prior research shows an association between audit firm tenure and earn-
ings quality (e.g., Ghosh & Moon, 2005; Myers, Myers, & Omer, 2003), we include
AFTEN. Finally, as audit firms may benefit from being part of an international accounting
firm alliance (e.g., Carson, 2009), we include AFINT. As China is a developing economy,
such alliances may be particularly important in terms of users’ perceptions about audit
quality and reputation.
In addition, we include several client-related variables. SIZE, NSUBS, and REC in the
model as prior research (e.g., Abbott, Parker, Peters, & Raghunandan, 2003; Francis &
Simon, 1987; Simon & Francis, 1988) finds that audit fees are positively associated with
the three variables. As Carcello, Hermanson, Neal, and Riley (2002) indicate that LOSS,
SEG, and INV positively affect audit fees, these three variables are also added to Equation
1. According to Larcker and Richardson (2004), ROA and DEBT are included in the model.
AUOP is used as a control variable in Equation 1 as it is found to be positively related to
audit fees (Francis & Simon, 1987; Simon & Francis, 1988). Finally, industry dummies are
added in the model to control for fixed industry effects.
The second hypothesis is tested by estimating the following regression model:
ADAC =b0 +b1SEXP +b2SFM +b3SEDU +b4STEN +b5SIS +b6SCIM +b7AFTEN
+b8AFIS +b9AFCIM +b10AFSIZE +b11AFINT +b12SIZE +b13ROA+b14DEBT
+b15LOSS +b16SGROW +b17CFO+ industry dummies + e:
ð2Þ
All the variables in Equation 2 have been defined for Equation 1 except for the follow-
ing variables: ADAC = absolute discretionary accruals, measured as the absolute value of
discretionary accruals; SCIM = signee client importance, measured as the sum of the two
signees’ client importance, which is the ratio of the natural logarithm of the client’s total
assets to the sum of the natural logarithm of total assets of all clients audited by a signee;
AFCIM = audit firm client importance, measured as the ratio of the natural logarithm of
the client’s total assets to the sum of the natural logarithm of total assets of all clients
audited by the audit firm; SGROW = sales growth, measured as the annual percentage
change in sales; CFO = cash flow, measured as the absolute value of cash flow from opera-
tions deflated by total assets.
Like prior research (e.g., Becker et al., 1998; Francis, Maydew, & Sparks, 1999), we use
discretionary accruals to measure audit quality. Following S. Chen, Sun, and Wu (2010),
we also use the propensity of issuing modified audit opinions as an alternative measure of
audit quality. To measure discretionary accruals, we estimate the Jones (1991) model
Cahan and Sun 87
at Universitas Diponegoro PARENT on May 25, 2015jaf.sagepub.comDownloaded from
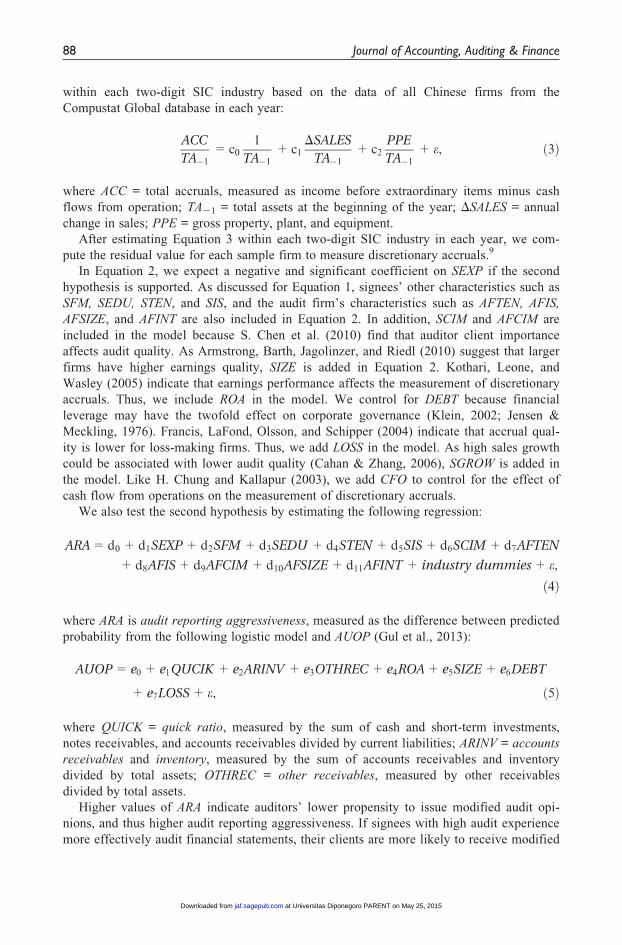
within each two-digit SIC industry based on the data of all Chinese firms from the
Compustat Global database in each year:
ACC
TA�1=c0
1
TA�1+c1
DSALES
TA�1+ c2
PPE
TA�1+ e, ð3Þ
where ACC = total accruals, measured as income before extraordinary items minus cash
flows from operation; TA21 = total assets at the beginning of the year; DSALES = annual
change in sales; PPE = gross property, plant, and equipment.
After estimating Equation 3 within each two-digit SIC industry in each year, we com-
pute the residual value for each sample firm to measure discretionary accruals.9
In Equation 2, we expect a negative and significant coefficient on SEXP if the second
hypothesis is supported. As discussed for Equation 1, signees’ other characteristics such as
SFM, SEDU, STEN, and SIS, and the audit firm’s characteristics such as AFTEN, AFIS,
AFSIZE, and AFINT are also included in Equation 2. In addition, SCIM and AFCIM are
included in the model because S. Chen et al. (2010) find that auditor client importance
affects audit quality. As Armstrong, Barth, Jagolinzer, and Riedl (2010) suggest that larger
firms have higher earnings quality, SIZE is added in Equation 2. Kothari, Leone, and
Wasley (2005) indicate that earnings performance affects the measurement of discretionary
accruals. Thus, we include ROA in the model. We control for DEBT because financial
leverage may have the twofold effect on corporate governance (Klein, 2002; Jensen &
Meckling, 1976). Francis, LaFond, Olsson, and Schipper (2004) indicate that accrual qual-
ity is lower for loss-making firms. Thus, we add LOSS in the model. As high sales growth
could be associated with lower audit quality (Cahan & Zhang, 2006), SGROW is added in
the model. Like H. Chung and Kallapur (2003), we add CFO to control for the effect of
cash flow from operations on the measurement of discretionary accruals.
We also test the second hypothesis by estimating the following regression:
ARA=d0 +d1SEXP +d2SFM +d3SEDU +d4STEN +d5SIS +d6SCIM +d7AFTEN
+d8AFIS +d9AFCIM +d10AFSIZE +d11AFINT + industry dummies + e,
ð4Þ
where ARA is audit reporting aggressiveness, measured as the difference between predicted
probability from the following logistic model and AUOP (Gul et al., 2013):
AUOP = e0 + e1QUCIK + e2ARINV + e3OTHREC + e4ROA+ e5SIZE + e6DEBT
+ e7LOSS + e, ð5Þ
where QUICK = quick ratio, measured by the sum of cash and short-term investments,
notes receivables, and accounts receivables divided by current liabilities; ARINV = accounts
receivables and inventory, measured by the sum of accounts receivables and inventory
divided by total assets; OTHREC = other receivables, measured by other receivables
divided by total assets.
Higher values of ARA indicate auditors’ lower propensity to issue modified audit opi-
nions, and thus higher audit reporting aggressiveness. If signees with high audit experience
more effectively audit financial statements, their clients are more likely to receive modified
88 Journal of Accounting, Auditing & Finance
at Universitas Diponegoro PARENT on May 25, 2015jaf.sagepub.comDownloaded from

audit opinions. We expect a negative and significant coefficient on SEXP in Equation 4 if
the second hypothesis is supported.
Empirical Results
All variables are defined in the appendix. The descriptive statistics of variables are reported
in Table 2. The mean and median natural logarithm values of audit fees are 13.219 and
13.122 in RMB yuans, equivalent to RMB U550,730 and RMB U499,818 for the mean and
median audit fees, respectively. The mean and median natural logarithm values of audit
experience are 3.042 and 3.219 years, indicating that the mean and median of the sum of
years for which two signees have engaged in audit work are 21 and 25 years. Table 3 pre-
sents the Pearson correlations of independent variables. The correlation between SIS and
AFIS is extremely high (r = .84). To mitigate this multicollinearity issue, SIS is dropped
from Equations 1, 2, and 4. We find that the results are not substantially changed if SIS is
not dropped from the models.
Table 4 provides the results on audit fees. We find that the coefficient on SEXP is posi-
tive and significant (t statistic = 3.86), consistent with H1. Thus, clients pay audit fee pre-
miums to signees with higher audit experience, suggesting that experienced CPAs conduct
higher quality audits. We also find that the coefficient on SEDU is positive and significant
(t statistic = 4.13), suggesting that signees with graduate degrees receive audit fee
Table 2. Descriptive Statistics.
Variable M Median SD Q1 Q3
AFEE 13.219 13.122 0.585 12.821 13.527ADAC 0.063 0.044 0.062 0.019 0.086ARA 20.001 0.003 0.164 0.000 0.018SEXP 3.042 3.219 0.650 2.833 3.466SFM 0.547 0.000 0.647 0.000 1.000SEDU 2.252 2.000 0.501 2.000 2.000STEN 1.547 1.609 0.556 1.099 1.946SIS 0.108 0.027 0.241 0.010 0.074SCIM 1.176 1.192 0.503 0.728 1.498AFTEN 1.307 1.386 0.811 0.693 2.079AFIS 0.087 0.036 0.141 0.013 0.091AFCIM 0.034 0.023 0.041 0.013 0.038AFSIZE 9.827 9.887 0.993 9.073 10.354AFINT 0.364 0.000 0.481 0.000 1.000SIZE 7.780 7.664 1.156 7.015 8.474ROA 0.032 0.029 0.064 0.010 0.058DEBT 0.063 0.016 0.098 0.000 0.087LOSS 0.114 0.000 0.318 0.000 0.000NSEG 0.751 0.693 0.627 0.000 1.099NSUBS 1.838 1.792 0.860 1.386 2.398REC 0.136 0.116 0.102 0.054 0.190INV 0.157 0.136 0.123 0.067 0.214SGROW 0.172 0.138 0.314 20.007 0.303CFO 0.058 0.053 0.075 0.015 0.096
Note. All variables are defined in the appendix.
Cahan and Sun 89
at Universitas Diponegoro PARENT on May 25, 2015jaf.sagepub.comDownloaded from

Tab
le3.
Pear
son
Corr
elat
ions.
Var
iable
SFM
SED
UST
EN
SIS
SCIM
AFT
EN
AFI
SAFC
IMAFS
IZE
AFI
NT
SIZ
ERO
AD
EBT
LOSS
AUO
PN
SEG
NSU
BS
REC
INV
SGRO
WCFO
SEX
P.0
9***
2.1
0***
.14***
.02
2.0
2.1
1***
.04
.03
2.1
5***
2.0
1.0
8***
.06**
.01
2.0
6**
2.0
5**
.02
.07***
2.0
02
.02
.05**
2.0
3
SFM
2.1
1***
2.0
0.0
7***
.04*
.04
.04
.01
2.0
1.0
6**
.02
.01
.01
2.0
22
.03
.01
.05**
2.0
2.0
3.0
1.0
1
SED
U2
.05**
2.0
2.0
02
.05**
2.0
4.0
7***
.06**
.08***
2.0
22
.03
2.0
32
.04
.04
.00
2.0
4*.0
12
.03
.04*
.02
STEN
.02
2.1
8***
.56***
.01
2.0
12
.01
.03
.12***
.02
.11***
2.0
4*
2.1
3***
.12***
.05**
2.1
5***
.03
2.0
1.0
9***
SIS
.01
.03
.84***
2.0
3.0
9***
.09***
.31***
.05**
.03
2.0
7***
2.0
4*.1
1***
.19***
.02
2.0
2.0
8***
.06**
SCIM
2.0
9***
.02
.25***
2.0
2.0
2.0
9***
.05**
.02
2.0
6**
.03
.04
.03
2.0
12
.03
.03
2.0
1
AFT
EN
.01
.05*
2.0
2.0
0.1
4***
.03
.07***
2.0
6**
2.0
8***
.09***
.03
2.1
5***
2.0
4*
.01
.06**
AFI
S2
.14***
.13***
.11***
.31***
.02
.08***
2.0
5*
2.0
7***
.08***
.18***
.01
2.0
4*
.09***
.03
AFC
IM2
.15***
2.0
2.0
32
.01
.01
2.0
4.0
2.0
1.0
2.0
0.0
4.0
2.0
1
AFS
IZE
.37***
.12***
.02
.00
2.0
02
.03
2.0
1.0
6**
2.0
3.0
3.0
1.0
6**
AFI
NT
.08***
.00
.02
2.0
0.0
1.0
0.0
1.0
3.0
12
.01
2.0
5*
SIZ
E.1
3***
.38***
2.1
7***
2.2
4***
.05**
.26***
2.1
7***
.02
.22***
.06**
RO
A2
.08***
2.6
8***
2.3
0***
2.0
4*2
.02
.06**
2.0
1.3
0***
.34***
DEBT
.00
2.1
0***
.03
.02
2.3
2***
2.2
1***
.07***
2.0
2
LOSS
.31***
.01
2.0
12
.08***
2.0
4*
2.2
4***
2.1
6***
AUO
P.0
1.0
2.0
5**
2.1
0***
2.1
8***
2.1
1***
NSE
G.3
3***
2.0
7***
2.0
02
.03
2.0
4*
NSU
BS
.00
.04
.01
.00
REC
.13***
.03
2.1
6***
INV
.03
2.1
8***
SGRO
W.0
9***
Not
e.A
llva
riab
les
are
def
ined
inth
eap
pen
dix
.
***,**,an
d*
den
ote
sign
ifica
nce
at1%
,5%
,an
d10%
leve
l,re
spec
tive
ly(t
wo-t
aile
dte
sts)
.
90
at Universitas Diponegoro PARENT on May 25, 2015jaf.sagepub.comDownloaded from
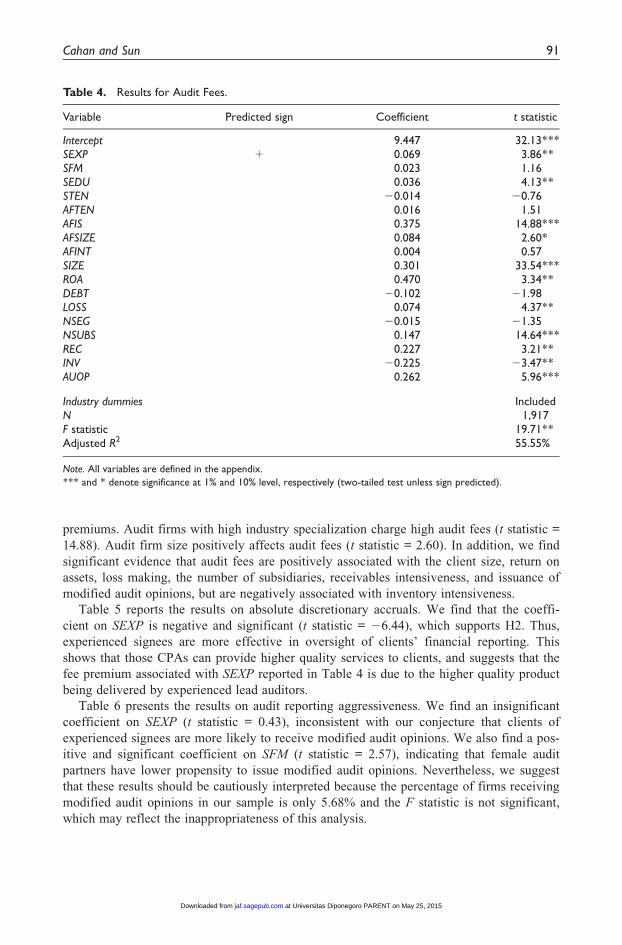
premiums. Audit firms with high industry specialization charge high audit fees (t statistic =
14.88). Audit firm size positively affects audit fees (t statistic = 2.60). In addition, we find
significant evidence that audit fees are positively associated with the client size, return on
assets, loss making, the number of subsidiaries, receivables intensiveness, and issuance of
modified audit opinions, but are negatively associated with inventory intensiveness.
Table 5 reports the results on absolute discretionary accruals. We find that the coeffi-
cient on SEXP is negative and significant (t statistic = 26.44), which supports H2. Thus,
experienced signees are more effective in oversight of clients’ financial reporting. This
shows that those CPAs can provide higher quality services to clients, and suggests that the
fee premium associated with SEXP reported in Table 4 is due to the higher quality product
being delivered by experienced lead auditors.
Table 6 presents the results on audit reporting aggressiveness. We find an insignificant
coefficient on SEXP (t statistic = 0.43), inconsistent with our conjecture that clients of
experienced signees are more likely to receive modified audit opinions. We also find a pos-
itive and significant coefficient on SFM (t statistic = 2.57), indicating that female audit
partners have lower propensity to issue modified audit opinions. Nevertheless, we suggest
that these results should be cautiously interpreted because the percentage of firms receiving
modified audit opinions in our sample is only 5.68% and the F statistic is not significant,
which may reflect the inappropriateness of this analysis.
Table 4. Results for Audit Fees.
Variable Predicted sign Coefficient t statistic
Intercept 9.447 32.13***SEXP + 0.069 3.86**SFM 0.023 1.16SEDU 0.036 4.13**STEN 20.014 20.76AFTEN 0.016 1.51AFIS 0.375 14.88***AFSIZE 0.084 2.60*AFINT 0.004 0.57SIZE 0.301 33.54***ROA 0.470 3.34**DEBT 20.102 21.98LOSS 0.074 4.37**NSEG 20.015 21.35NSUBS 0.147 14.64***REC 0.227 3.21**INV 20.225 23.47**AUOP 0.262 5.96***
Industry dummies IncludedN 1,917F statistic 19.71**Adjusted R2 55.55%
Note. All variables are defined in the appendix.
*** and * denote significance at 1% and 10% level, respectively (two-tailed test unless sign predicted).
Cahan and Sun 91
at Universitas Diponegoro PARENT on May 25, 2015jaf.sagepub.comDownloaded from

Table 5. Results for Absolute Discretionary Accruals.
Variable Predicted sign Coefficient t statistic
Intercept 0.119 2.75*SEXP 2 20.004 26.44***SFM 20.000 21.95SEDU 0.001 0.21STEN 20.005 21.91SCIM 20.003 21.40AFTEN 20.001 20.52AFIS 20.008 20.44AFCIM 0.064 1.46AFSIZE 0.001 0.76AFINT 20.004 22.10SIZE 20.008 22.84*ROA 0.098 1.38DEBT 20.022 22.45*LOSS 0.043 4.91**SGROW 0.015 2.54*CFO 0.032 0.42Industry dummies Includedn 1,600F statistic 74.85***Adjusted R2 9.61%
Note. All variables are defined in the appendix.
***, **, and * denote significance at 1%, 5%, and 10% level, respectively (two-tailed test unless sign predicted).
Table 6. Results for Audit Reporting Aggressiveness.
Variable Predicted sign Coefficient t statistic
Intercept 20.113 21.75SEXP 2 0.004 0.43SFM 0.007 2.57*SEDU 0.001 0.12STEN 0.014 1.39SCIM 20.011 21.74AFTEN 0.006 0.91AFIS 20.028 21.22AFCIM 0.028 0.24AFSIZE 0.007 1.49AFINT 20.013 21.63Industry dummies Includedn 1,600F statistic 3.93Adjusted R2 3.45%
Note. All variables are defined in the appendix.
***, **, and * denote significance at 1%, 5%, and 10% level, respectively (two-tailed test unless sign predicted).
92 Journal of Accounting, Auditing & Finance
at Universitas Diponegoro PARENT on May 25, 2015jaf.sagepub.comDownloaded from

We conduct additional analyses as follows. First, we test the hypotheses by controlling
for experienced signees’ self-selection bias. Based on the auditor selection model used in
prior research (e.g., Khurana & Raman, 2004), we estimate the following logistic model:
SEXPI =f0 +f1SHORT +f2LONG +f3PE +f4ISSUE +f5SIZE +f6DEBT +f7LOSS + e,
ð6Þ
where SEXPI = an indicator variable of experienced signees; SHORT = absolute value of
short-term accruals in income deflated by sales; LONG = absolute value of long-term
accruals in income deflated by sales; PE = ratio of price to earnings per share; ISSUE =
new equity issue, coded ‘‘1’’ if change in equity is greater than 10% and ‘‘0’’ otherwise.
The indicator variable is coded ‘‘1’’ if the sum of the first and second signees’ audit
experience is greater than 32 years, which is the 75th percentile of the distribution of the
two signees’ audit experience. We use the fitted value from Equation 6 to compute the
inverse Mills ratio. Then, we include the inverse Mills ratio in Equations 1, 2, and 4 to cor-
rect for the self-selection bias (Heckman, 1979).
Table 7 includes the results after controlling for the self-selection bias. From Equation
1, we find that the audit experience is positively associated with audit fees (t statistic =
3.37). From Equation 2, we find that audit experience is negatively associated with absolute
discretionary accruals (t statistic = 23.12). Thus, the results after allowing for the experi-
enced signees’ self-selection bias still support H1 and H2. From Equation 4, we find that
there is an insignificant association between audit experience and the issuance of modified
audit opinions (t statistic = 0.64), which is consistent with the findings without controlling
for the experienced signees’ self-selection bias.
Second, we estimate Equation 2 by using income-increasing or income-decreasing dis-
cretionary accruals as the dependent variable separately. Like the results on absolute discre-
tionary accruals, we find that the coefficient on SEXP remains negative and significant for
income-increasing discretionary accruals (non-tabulated t statistic = 23.35). The coefficient
on SEXP is positive and insignificant for income-decreasing discretionary accruals (non-
tabulated t statistic = 0.81). Overall, our results still support H2 when signed discretionary
accruals are used as the dependent variable in Equation 2; in particular, more experienced
auditors are more likely to constrain aggressive income-increasing accruals.
Third, we separate SEXP into SEXP1 and SEXP2 in the equations, where SEXP1 is the
first signee’s audit experience and SEXP2 is the second signee’s audit experience.10 From
Equation 1, we find that the coefficients on SEXP1 and SEXP2 are positive and significant
(non-tabulated t statistics = 3.59 and 2.92, respectively), consistent with H1. From
Equation 2, we find that the coefficients on SEXP1 and SEXP2 are negative and significant
(non-tabulated t statistics = 23.34 and 24.21, respectively), consistent with H2. From
Equation 4, we find negative and insignificant coefficients on SEXP1 and SEXP2 (non-
tabulated t statistics = 20.43 and 0.29, respectively). Thus, the results are inconsistent with
the results on SEXP.
Fourth, we re-run the analyses by measuring SEXP as the maximum value of the first or
second signees’ audit experience. Similar to the results on the sum of the first and second
signees’ audit experience, the maximum value of SEXP1 or SEXP2 is positively associated
with audit fees (non-tabulated t statistic = 2.93), and is negatively associated with absolute
discretionary accruals (non-tabulated t statistic = 23.37). Likewise, clients’ likelihood of
Cahan and Sun 93
at Universitas Diponegoro PARENT on May 25, 2015jaf.sagepub.comDownloaded from

Tab
le7.
Res
ults
Aft
erC
ontr
olli
ng
for
Self-
Sele
ctio
nB
ias.
Var
iable
Audit
fees
Abso
lute
dis
cret
ionar
yac
crual
sA
udit
report
ing
aggr
essi
venes
s
Pre
dic
ted
sign
Coef
ficie
nt
tst
atis
tic
Var
iable
Pre
dic
ted
sign
Coef
ficie
nt
tst
atis
tic
Var
iable
Pre
dic
ted
sign
Coef
ficie
nt
tst
atis
tic
Inte
rcep
t9.3
37
27.0
3***
Inte
rcep
t0.1
10
2.2
0In
terc
ept
20.1
15
21.8
1SE
XP
+0.0
67
3.3
7**
SEX
P2
20.0
04
23.1
2**
SEX
P2
0.0
07
0.6
4SF
M0.0
13
0.7
2SF
M2
0.0
01
21.0
7SF
M0.0
06
1.6
7SE
DU
0.0
31
1.5
8SE
DU
20.0
01
20.3
7SE
DU
0.0
05
0.5
0ST
EN
20.0
10
20.6
3ST
EN
20.0
04
21.7
7ST
EN
0.0
19
1.8
7AFT
EN
0.0
19
1.7
7SC
IM2
0.0
03
21.0
1SC
IM2
0.0
22
24.6
2**
AFI
S0.4
02
14.8
6***
AFT
EN
20.0
01
20.3
0AFT
EN
20.0
02
20.4
0AFS
IZE
0.0
93
2.5
2*
AFI
S2
0.0
13
20.5
6AFI
S2
0.0
17
20.9
4AFI
NT
20.0
10
20.8
8AFC
IM0.0
64
2.3
9*
AFC
IM0.0
49
0.5
6SI
ZE
0.3
05
26.0
9***
AFS
IZE
0.0
02
0.8
8AFS
IZE
0.0
05
1.1
4RO
A0.3
68
2.6
4*
AFI
NT
20.0
04
21.6
8AFI
NT
20.0
03
20.6
5D
EBT
20.1
26
21.5
7SI
ZE
20.0
06
21.6
7IM
R2
0.0
01
20.2
6LO
SS0.0
97
4.0
5**
RO
A0.0
46
0.5
9N
SEG
20.0
15
20.9
7D
EBT
20.0
32
22.5
6*
NSU
BS
0.1
53
10.0
3***
LOSS
0.0
41
4.0
1**
REC
0.2
14
2.6
8*
SGRO
W0.0
13
1.5
1IN
V2
0.1
93
22.3
4CFO
0.0
80
1.3
0AU
OP
0.2
27
3.1
4*
IMR
20.0
01
22.7
0*
IMR
0.0
11
1.9
1In
dust
rydu
mm
ies
Incl
uded
Indu
stry
dum
mie
sIn
cluded
Indu
stry
dum
mie
sIn
cluded
n1,7
32
n1,4
51
n1,4
51
Fst
atis
tic
20.9
1**
Fst
atis
tic
21.2
1**
Fst
atis
tic
4.2
8A
dju
sted
R2
56.1
9%
Adju
sted
R2
9.6
2%
Adju
sted
R2
4.7
7%
Not
e.A
llva
riab
les
are
def
ined
inth
eap
pen
dix
.
***,**,an
d*
den
ote
sign
ifica
nce
at1%
,5%
,an
d10%
leve
l,re
spec
tive
ly(t
wo-t
aile
dte
stunle
sssi
gnpre
dic
ted).
94
at Universitas Diponegoro PARENT on May 25, 2015jaf.sagepub.comDownloaded from
receiving modified audit opinions is not associated with the maximum value of SEXP1 or
SEXP2 (non-tabulated t statistic = 0.83).
Fifth, we measure discretionary accruals using the performance-matched discretionary
accruals developed by Kothari et al. (2005). For absolute discretionary accruals, we find a
negative but insignificant coefficient on SEXP (non-tabulated t statistic = 20.70). The coef-
ficient on SEXP is negative and significant for income-increasing discretionary accruals
(non-tabulated t statistic = 24.65), and is insignificant for income-decreasing discretionary
accruals (non-tabulated t statistic = 0.13), consistent with the results of non-performance-
matched discretionary accruals. The coefficient on SEXP1 is negative and significant
(non-tabulated t statistic = 21.71), whereas the coefficient on SEXP2 is insignificant (non-
tabulated t statistic = 20.00). Overall, we still find some evidence to support H2. Recently,
Keung and Shih (2014) show that the performance matching approach significantly under-
estimates discretionary accruals and increases the frequency of Type II errors.
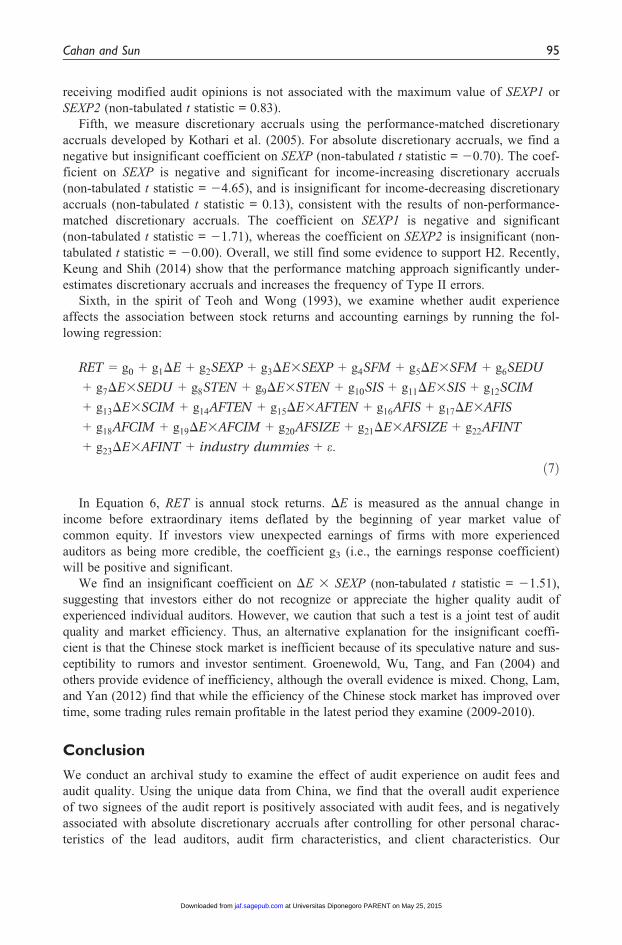
Sixth, in the spirit of Teoh and Wong (1993), we examine whether audit experience
affects the association between stock returns and accounting earnings by running the fol-
lowing regression:
RET =g0 +g1DE +g2SEXP +g3DE3SEXP +g4SFM +g5DE3SFM +g6SEDU
+g7DE3SEDU +g8STEN +g9DE3STEN +g10SIS +g11DE3SIS +g12SCIM
+g13DE3SCIM +g14AFTEN +g15DE3AFTEN +g16AFIS +g17DE3AFIS
+g18AFCIM +g19DE3AFCIM +g20AFSIZE +g21DE3AFSIZE +g22AFINT
+g23DE3AFINT + industry dummies + e:
ð7Þ
In Equation 6, RET is annual stock returns. DE is measured as the annual change in
income before extraordinary items deflated by the beginning of year market value of
common equity. If investors view unexpected earnings of firms with more experienced
auditors as being more credible, the coefficient g3 (i.e., the earnings response coefficient)
will be positive and significant.
We find an insignificant coefficient on DE 3 SEXP (non-tabulated t statistic = 21.51),
suggesting that investors either do not recognize or appreciate the higher quality audit of
experienced individual auditors. However, we caution that such a test is a joint test of audit
quality and market efficiency. Thus, an alternative explanation for the insignificant coeffi-
cient is that the Chinese stock market is inefficient because of its speculative nature and sus-
ceptibility to rumors and investor sentiment. Groenewold, Wu, Tang, and Fan (2004) and
others provide evidence of inefficiency, although the overall evidence is mixed. Chong, Lam,
and Yan (2012) find that while the efficiency of the Chinese stock market has improved over
time, some trading rules remain profitable in the latest period they examine (2009-2010).
Conclusion
We conduct an archival study to examine the effect of audit experience on audit fees and
audit quality. Using the unique data from China, we find that the overall audit experience
of two signees of the audit report is positively associated with audit fees, and is negatively
associated with absolute discretionary accruals after controlling for other personal charac-
teristics of the lead auditors, audit firm characteristics, and client characteristics. Our
Cahan and Sun 95
at Universitas Diponegoro PARENT on May 25, 2015jaf.sagepub.comDownloaded from
findings suggest that more experienced CPAs provide higher quality audit services than
less experienced CPAs.
Prior research on audit experience focuses on behavioral studies that are conducted by
running experiments. These studies only provide experimental and task-based results.
Based on those results, it is not possible to determine how audit experience affects the com-
plete audit engagement. Thus, archival evidence could complement the prior behavioral
studies in an important way, but obtaining personal characteristics of auditors in a large
sample has been difficult. Using unique data from China, we are able to help fill this void
in the literature. Furthermore, we extend the research on audit partners by considering the
incremental effects of gender, education, engagement tenure, industry specialization, and
client importance after controlling for overall audit experience. Overall, our results suggest
that the lead auditors’ personal characteristics may serve as a signal of the level of care
that will be exercised during the audit process. In this way, personal characteristics help
mitigate adverse selection problems for the client in a setting where audit quality is not
fully observable, that is, a credence good.
Our study complements the work of Gul et al. (2013). Although they examine the effects
of demographic characteristics of Chinese auditors at an individual level, we focus on the
average effect across individual auditors. Finally, our study has implications for the
recently announced Chinese regulation that would require the localization of Big 4 offices
in China. Our results suggest that audit quality increases with the experience of Chinese
auditors. Thus, giving Chinese auditors more experience by increasing their involvement in
Big 4 offices will benefit auditing in China in the long run.
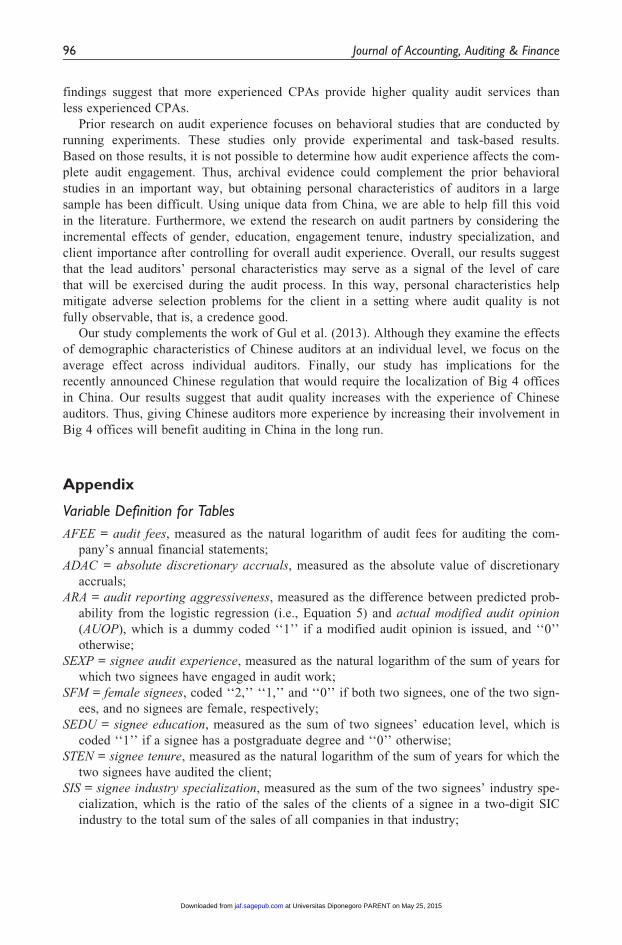
Appendix
Variable Definition for Tables
AFEE = audit fees, measured as the natural logarithm of audit fees for auditing the com-
pany’s annual financial statements;
ADAC = absolute discretionary accruals, measured as the absolute value of discretionary
accruals;
ARA = audit reporting aggressiveness, measured as the difference between predicted prob-
ability from the logistic regression (i.e., Equation 5) and actual modified audit opinion
(AUOP), which is a dummy coded ‘‘1’’ if a modified audit opinion is issued, and ‘‘0’’
otherwise;
SEXP = signee audit experience, measured as the natural logarithm of the sum of years for
which two signees have engaged in audit work;
SFM = female signees, coded ‘‘2,’’ ‘‘1,’’ and ‘‘0’’ if both two signees, one of the two sign-
ees, and no signees are female, respectively;
SEDU = signee education, measured as the sum of two signees’ education level, which is
coded ‘‘1’’ if a signee has a postgraduate degree and ‘‘0’’ otherwise;
STEN = signee tenure, measured as the natural logarithm of the sum of years for which the
two signees have audited the client;
SIS = signee industry specialization, measured as the sum of the two signees’ industry spe-
cialization, which is the ratio of the sales of the clients of a signee in a two-digit SIC
industry to the total sum of the sales of all companies in that industry;
96 Journal of Accounting, Auditing & Finance
at Universitas Diponegoro PARENT on May 25, 2015jaf.sagepub.comDownloaded from

SCIM = signee client importance, measured as the sum of the two signees’ client impor-
tance, which is the ratio of the natural logarithm of the client’s total assets to the sum of
the natural logarithm of total assets of all clients audited by a signee;
AFTEN = audit firm tenure, measured as the natural logarithm of the number of years for
which the audit firm has audited the client;
AFIS = audit firm industry specialization, measured as the ratio of the sales of the clients
of the audit firm in a two-digit SIC industry to the total sum of the sales of all compa-
nies in that industry;
AFCIM = audit firm client importance, measured as the ratio of the natural logarithm of
the client’s total assets to the sum of the natural logarithm of total assets of all clients
audited by the audit firm;
AFSIZE = audit firm size, measured as the natural logarithm of the total revenue of the
audit firm;
AFINT = audit firm international alliance, coded ‘‘1’’ if the audit firm is a member of an
international accounting firm alliance, and ‘‘0’’ otherwise;
SIZE = client size, measured as the natural logarithm of total assets;
ROA = return on assets, measured as the ratio of income before extraordinary items to total
assets;
DEBT = debt ratio, measured as the ratio of long-term debt to total assets;
LOSS = loss making, coded ‘‘1’’ if income before extraordinary items is negative and ‘‘0’’
otherwise;
NSEG = segment, measured as the natural logarithm of the number of business segments;
NSUBS = subsidiary, measured as the natural logarithm of the number of consolidated
subsidiaries;
REC = receivables intensiveness, measured as the ratio of receivables to total assets;
INV = inventory intensiveness, measured as the ratio of inventory to total assets;
SGROW = sales growth, measured as the annual percentage change in sales;
CFO = cash flow, measured as cash flow from operations deflated by total assets;
IMR = inverse Mills ratio, computed using the fitted value from Equation 6.
Acknowledgment
We thank Bharat Sarath (the editor), Matthew Reidenbach, two anonymous reviewers, and participants
at the 2012 American Accounting Association (AAA) Annual Meeting for their valuable comments.
We appreciate Huanwen Jiao, Siwen Li, Hong Zhao, and Ya Zhou for their research assistance.
Declaration of Conflicting Interests
The author(s) declared no potential conflicts of interest with respect to the research, authorship, and/
or publication of this article.
Funding
The author(s) received no financial support for the research, authorship, and/or publication of this
article.
Notes
1. In China, only the Ministry of Finance can issue accounting and audit standards. The Chinese
Institute of Certified Public Accountants (CPAs) is actually a government agency under the
Ministry of Finance, which is responsible for developing audit standards.
Cahan and Sun 97
at Universitas Diponegoro PARENT on May 25, 2015jaf.sagepub.comDownloaded from

2. For example, some CPAs do not have a license to issue audit reports on listed companies.
3. Error frequency knowledge is the knowledge of the base rates associated with error occurrences.
4. Failure to integrate is defined as failure to make mental connections between separately received
pieces of information. Reconstruction is defined as altering the mental representation of informa-
tion to be consistent with existing knowledge or memories.
5. The planned realization rate is the ratio of the planned audit fee to the sum of planned labor
hours times the standard billing rate.
6. We use 2007 as the first year of the sample period because China adopted International
Financial Reporting Standards (IFRS) in that year. We want to ensure that the financial state-
ments during our sample period are prepared using a consistent set of accounting standards. 2010
is the last year in our sample period because data about individual signees were not available in
the CSMAR-Audit Opinion database after 2010. All firms in our sample have December 31
fiscal year ends.
7. The Chinese Securities Regulatory Commission (CSRC) has not disclosed information on indi-
vidual auditors since 2012, which adds to the uniqueness of our data.
8. All continuous variables in the regression models are winsorized at 1% and 99% levels.
9. There are at least 20 firms in each two-digit Standard Industrial Classification (SIC) industry to
estimate the Jones model.
10. The first signee is an individual auditor whose signature is placed on the left side of the audit
report, whereas the second signee is an individual auditor whose signature is placed on the right
side of the audit report.
References
Abbott, L. J., Parker, S., Peters, G., & Raghunandan, K. (2003). The association between audit com-
mittee characteristics and audit fees. Auditing: A Journal of Practice & Theory, 22, 17-32.
Abdolmohammadi, M., & Wright, A. (1987). An examination of the effects of experience and task
complexity and audit judgments. The Accounting Review, 62, 1-13.
Accounting in China: Internal controls. (2012, May 19). The Economist, p. 74.
Adams, R., & Ferreira, D. (2009). Women in the boardroom and their impact on governance and per-
formance. Journal of Financial Economics, 94, 291-309.
Armstrong, C. S., Barth, M. E., Jagolinzer, A. D., & Riedl, E. J. (2010). Market reaction to the adop-
tion of IFRS in Europe. The Accounting Review, 85, 31-61.
Becker, C., DeFond, M., Jiambalvo, J., & Subramanyam, K. (1998). The effect of audit quality on
earnings management. Contemporary Accounting Research, 16, 1-24.
Bedard, J. C., & Johnstone, K. M. (2010). Audit partner tenure and audit planning and pricing.
Auditing: A Journal of Practice & Theory, 29, 45-70.
Biggs, S. F., Mock, T. J., & Watkins, P. R. (1988). Auditors use of analytical review in audit program
design. The Accounting Review, 63, 148-161.
Bonner, S. E. (1990). Experience effects in auditing: The role of task-specific knowledge. The
Accounting Review, 66, 72-92.
Cahan, S. F., Jeter, D. C., & Naiker, V. (2011). Are all industry specialists the same? Auditing: A
Journal of Theory & Practice, 30, 191-222.
Cahan, S. F., & Zhang, W. (2006). After Enron: Audit conservatism and ex-Andersen clients. The
Accounting Review, 81, 49-82.
Carcello, J. V., Hermanson, D. R., Neal, T. L., & Riley, R. A., Jr. (2002). Board characteristics and
audit fees. Contemporary Accounting Research, 19, 365-384.
Carey, P., & Simnett, R. (2006). Audit partner tenure and audit quality. The Accounting Review, 81,
653-676.
Carson, E. (2009). Industry specialization by global audit firms networks. The Accounting Review, 84,
355-382.
98 Journal of Accounting, Auditing & Finance
at Universitas Diponegoro PARENT on May 25, 2015jaf.sagepub.comDownloaded from

Causholli, M., & Knechel, W. R. (2012). An examination of the credence attributes of an audit.
Accounting Horizons, 26, 631-656.
Chen, C. Y., Lin, C. J., & Lin, Y. C. (2008). Audit partner tenure, audit firm tenure, and discretionary
accruals: Does long auditor tenure impair earnings quality? Contemporary Accounting Research,
25, 415-445.
Chen, S., Sun, S. Y. J., & Wu, D. (2010). Client importance, institutional improvements, and audit
quality in China: An office and individual auditor level analysis. The Accounting Review, 85,
127-158.
Chong, T. T.-L., Lam, T.-H., & Yan, I. K.-M. (2012). Is the Chinese stock market really inefficient?
China Economic Review, 23, 122-137.
Chung, H., & Kallapur, S. (2003). Client importance, nonaudit services, and abnormal accruals. The
Accounting Review, 78, 931-955.
Chung, J., & Monroe, G. (2001). A research note on the effects of gender and task complexity on an
audit judgment. Behavioral Research in Accounting, 13, 111-125.
Davis, J. (1996). Experience and auditor’s selection of relevant information for preliminary control
risk assessments. Auditing: A Journal of Practice & Theory, 15, 16-37.
DeAngelo, L. (1981). Auditor size and auditor quality. Journal of Accounting & Economics, 1,
183-199.
Dye, R. A. (1993). Auditing standards, legal liability, and auditor wealth. Journal of Political
Economy, 101, 887-914.
Emons, W. (1997). Credence goods and fraudulent experts. RAND Journal of Economics, 28,
107-119.
Estes, R., & Reames, D. D. (1988). Effects of personal characteristics on materiality decisions: A
multivariate analysis. Accounting & Business Research, 18, 291-296.
Ethridge, J. R., & Heminway, J. R. (1993). Industry’s view of the 150-hour requirements. The CPA
Journal, 63, 67-69.
Farmer, T. A., Rittenberg, L. E., & Trompeter, G. M. (1987). An investigation of the impact of eco-
nomic and organizational factors on audit independence. Auditing: A Journal of Practice &
Theory, 7, 1-14.
Francis, J. R. (1984). The effect of audit firm size on audit prices: A study of the Australian market.
Journal of Accounting & Economics, 6, 133-151.
Francis, J. R., LaFond, R., Olsson, P. M., & Schipper, K. (2004). Costs of equity and earnings attri-
butes. The Accounting Review, 79, 967-1010.
Francis, J. R., Maydew, E., & Sparks, H. (1999). The role of Big 6 auditors in the credible reporting
of accruals. Auditing: A Journal of Practice & Theory, 18, 17-34.
Francis, J. R., & Simon, D. T. (1987). A test of audit pricing in the small client segment of the U.S.
audit market. The Accounting Review, 62, 145-157.
Ghosh, A., & Moon, D. (2005). Auditor tenure and perceptions of audit quality. The Accounting
Review, 80, 585-612.
Gibbins, M. (1984). Propositions about the psychology of professional judgment in public accounting.
Journal of Accounting Research, 22, 103-125.
Gold, A., Hunton, J., & Gomaa, M. (2009). The impact of client and auditor gender on auditors’ judg-
ments. Accounting Horizons, 23, 1-18.
Grant, C. T., Ciccotello, C. S., & Dickie, M. (2002). Barriers to professional entry: How effective is
the 150-hour rule? Journal of Accounting and Public Policy, 21, 71-93.
Groenewold, N., Wu, Y., Tang, S. H. K., & Fan, X. M. (2004). The Chinese stock market: Efficiency,
predictability and profitability. Cheltenham, UK: Edward Elgar.
Gul, F. A., Wu, D., & Yang, Z. (2013). Do individual auditors affect audit quality? Evidence from
archival data. The Accounting Review, 88, 1993-2023.
Hambrick, D. C., & Mason, P. A. (1984). Upper echelons: The organization as a reflection of its top
managers. Academy of Management Review, 9, 193-206.
Cahan and Sun 99
at Universitas Diponegoro PARENT on May 25, 2015jaf.sagepub.comDownloaded from

Hay, D., Knechel, W., & Wong, N. (2006). Audit fees: A meta-analysis of the effect of demand and
supply attributes. Contemporary Accounting Research, 23, 141-191.
Heckman, J. (1979). Sample selection bias as a specification error. Econometrica, 7, 53-61.
Jensen, M. C., & Meckling, W. (1976). Theory of the firm: Managerial behaviour, agency costs, and
ownership structure. Journal of Financial Economics, 3, 305-360.
Jones, J. J. (1991). Earnings management during import relief investigation. Journal of Accounting
Research, 29, 193-228.
Keung, E., & Shih, M. (2014). Measuring discretionary accruals: Are ROA-matched models better
than the original Jones-type models? Review of Accounting Studies, 19, 736-768.
Khurana, I. K., & Raman, K. K. (2004). Litigation risk and the financial reporting credibility of Big 4
versus non-Big 4 audits: Evidence from Anglo-American countries. The Accounting Review, 79,
473-498.
Klein, A. (2002). Audit committee, board of director characteristics, and earnings management.
Journal of Accounting & Economics, 33, 375-400.
Kothari, S. P., Leone, A. J., & Wasley, C. E. (2005). Performance matched discretionary accrual mea-
sures. Journal of Accounting & Economics, 39, 163-197.
Larcker, D., & Richardson, S. (2004). Fees paid to audit firms, accrual choices, and corporate govern-
ance. Journal of Accounting Research, 42, 625-658.
Libby, R., & Frederick, D. M. (1990). Experience and the ability to explain audit findings. Journal of
Accounting Research, 28, 348-367.
Low, K. Y. (2004). The effects of industry specialization on audit risk assessments and audit-planning
decisions. The Accounting Review, 79, 201-219.
Lund, D. B. (2008). Gender differences in ethics judgment of marketing professionals in the United
States. Journal of Business Ethics, 77, 501-515.
Manry, D., Mock, T., & Turner, J. (2008). Does increased partner tenure reduce audit quality?
Journal of Accounting, Auditing & Finance, 23, 553-572.
Moeckel, C. (1990). The effect of experience on auditors’ memory errors. Journal of Accounting
Research, 28, 368-387.
Myers, J. N., Myers, L. A., & Omer, T. C. (2003). Exploring the term of the auditor-client relation-
ship and the quality of earnings: A case for mandatory auditor rotation? The Accounting Review,
78, 779-799.
Nguyen, T. N., Basuray, M. T., Smith, W. P., Kopka, D., & McGulloh, D. (2008). Moral issues and
gender differences in ethical judgment using Reidenbach and Robin’s (1990) multidimensional
ethics scale: Implications in teaching of business ethics. Journal of Business Ethics, 77, 417-430.
Owhoso, V. E., Messier, W. F., & Lynch, J. G. (2002). Error detection by industry specialized teams
during sequential audit review. Journal of Accounting Research, 40, 883-900.
Palmrose, Z.-V. (1986). Audit fees and auditor size: Further evidence. Journal of Accounting
Research, 24, 97-110.
Pratt, J., & Jiambalvo, J. (1981). Relationships between leader behaviors and audit team performance.
Accounting, Organization & Society, 6, 133-142.
Simnett, R. (1996). The effect of information selection, information processing and task complexity
on predictive accuracy of auditors. Accounting, Organizations & Society, 21, 699-717.
Simon, D. T., & Francis, J. (1988). The effects of auditor change on audit fees: Tests of price cutting
and price recovery. The Accounting Review, 63, 255-269.
Solomon, I., Shields, M. D., & Whittington, O. R. (1999). What do industry-specialist auditors know?
Journal of Accounting Research, 37, 191-208.
Teoh, S. H., & Wong, T. J. (1993). Perceived auditor quality and the earnings response coefficient.
The Accounting Review, 68, 346-366.
Waller, W. S., & Felix, W. I. (1984). The auditor and learning from experience: Some conjectures.
Accounting, Organizations & Society, 9, 383-406.
100 Journal of Accounting, Auditing & Finance
at Universitas Diponegoro PARENT on May 25, 2015jaf.sagepub.comDownloaded from