Embed Size (px)
Citation preview

1
Hydro Aluminium
Performance and strategic progress
Jon-Harald Nilsen Executive Vice President
Capital Markets DayDecember 11, 2003

2
47 34 7 Hy dr o Me dia 1 2 2 00 3 2 Hyd ro Alu mini um
Presentation outline
! Market
! Performance
! Strategy - portfolio
! Special update! Primary Metal cost position! Rolled products segment! Extrusion and Automotive segment

3
47 34 7 Hy dr o Me dia 1 2 2 00 3 3 Hyd ro Alu mini um
What we saidWhat we said What we have doneWhat we have done
What we said and what we have done
Ahead of plan
Alouette expansion, litho expansion, best practise sharing
On track – ahead in selected segments
Controllable cost elements and projects on track.
Out: Flexpack, VAW-IMCO JV, SøderbergIn: Alunorte II, Comalco, Talum, Sayansk
Continued improvements in 2003
Deliver improvement programs and value capturing as planned
Further enhance value of HAL-VAW
Win mar ket share based on strengths
Improve relati ve cos t position for smelter system
Continue active portfolio management
Meet 10% CROGI target 2004 (normalized prices)
At the last year’s Capital Market Day Hydro Aluminium listed certain priorities for 2003, and this is the summary of what we have done through 2003. The summary is that Hydro Aluminium is on or ahead of plan. We deliver.
Changes in our portfolio. • Since last t ime we met, Hydro Aluminium has closed the sale of Flexible packing, worth approx. 400 mill Euro on a 100 % - basis. Our partner IMCO in the VAW-IMCO 50/50 JV – focused on recycling in Germany - redeemed Hydro’s shares last year after the acquisition of VAW. The deal is now closed. The sale gave an insignificant net, positive P&L-effect.
• Over the last 12 months Hydro Aluminium has made important moves in the alumina area; -starting up Alunorte 1 – expansion, agreeing to start expansion II immediately, and signing the 26 year deal with Comalco to buy 500.000 tonnes annually from 2005.
• We have secured new sources for metal products, through the casthouse technology deal withRusal, giving us access to up to 80.000 of Extrusion Ingot annually, as well as the new deal with Talum in Slovenia, securing us approx. 70.000 tonnes per annum of foundry alloys.

4
47 34 7 Hy dr o Me dia 1 2 2 00 3 4 Hyd ro Alu mini um
Bauxite/alumina
Electrolysismetal
Casthouse products
Rolling Extru-sion
Hydro Aluminium’s value chain
Fabrication& Sys tems
Automoti ve
Hydro is one of the three largest integrated global aluminium companies.
•Upstream:Hydro Aluminium is engaged in a long value chain, starting withbauxite mining in Brazil. Next step is alumina production, through equity ownership in companies in Brazil, Jamaica, and Germany. Hydro’s electrolysis production takes place in Norway, Germany, Canada and Australia. Liquid metal is not a tradable product.
•Midstream: The next step in the value chain is therefore the production of metal products, which is used for further processing downstream. Processing takes place in casthouses at smelters, as well as in specialised remelters close to customers. Input material will be liquid metal, process scrap, old scrap and ingots.
• Downstream: In semifabrication processes Hydro is engaged in extrusion production globally, with flat rolled production mainly in Europe.
Fabrication and systems business, and automotive products, represent the end of Hydro’s value chain. The production is driven by customer orders, and there is a high degree of differentiation opportunities.

5
47 34 7 Hy dr o Me dia 1 2 2 00 3 5 Hyd ro Alu mini um
Recyclability up to 90% Only 5% energy use in recycling
4 – 4.5% global growth going forward
Solid growth expected Packaging Construction
material Sav ing weight
in cars
An important basis for our business is that we are working with a material with very strong growth expectations medium and long term.
We expect that primary aluminium consumption – based on its valuable properties in many applications - will have a strong growth going forward mid-and long term. Globally the long term growth rate is 4 – 4.5 % annually – mainly driven by China and CIS - while the growth rate in the Western World is about 2.5 %. .The outlook is more positive than for many other materials also due to the materials recyclability. Recycled aluminium has the same properties as primary and can be recycled with use of only 5 % of the energy used to produce electrolysis metal. Aluminium can really contribute to a more viable society, and we are working hard to develop new applications with our customers to meet all stakeholders needs.Our ambition is – based on a profitable business strategy - to reduce or eliminate possible negative impacts on nature and society, and in many cases use of aluminium to the benefit of nature and society at large.

6
47 34 7 Hy dr o Me dia 1 2 2 00 3 6 Hyd ro Alu mini um
9.38.3
5.77.1
8
10.8
0
2
4
6
8
10
12
1998 1999 2000 2001 2002 3Q 2003 YTD
2004 CROGI targ et(normalized*) 9 - 10%
CROGI 1998 – 2003: Actual prices
* With normalized LME price (USD 1 500/tonne) and 8 NOK/USDMetal products margins and downstream margins are not normalized, neither metal part nor currency
%
Key elem ents 0 3 -04! Impro vem ent prog rams! Continuous c ost reductio ns! New volum e Su nnd al,
Alunorte! Gain mar ket s hares
Continuous CROGI improvement
Despite the challenging market conditions along the value chain with low growth and downward margin pressure over the last 2 years, we have improved our CROGI-performance year by year from 2001. From a level less than 6 pct in 2001, also influenced by the closure of Porsgrunn, we are now at a level of approx. 8 pct.
Our focus has been on self-help-measures, like cost improvement programs, and to gain profitable market shares based on our value propositions to the customers.
We have faced a substantial income reduction over recent years as a result of the change in the dollar rate. If the 2001-LME and NOK/USD-rate had been actual prices for 2003, our results would have been approx. 3.1 bn NOK higher in the Primary Metal sector (of this 2.6 bn NOK is the effect of the NOK/USD-change). This is to show the negative effect we are faced with with USD-income and a substantial part of our cost in local currency.
For 2004 our target is further improvement. Because that the economic recovery is coming later than expected – and this delays the improvement in downstream volumes and margins, the target for 2004 is 9 - 10 pct on a normalised basis. (Note: In this context have in mind that we only normalise the primary results for LME and currency. We do not adjust the margins or volume in metal products or volume or margins downstream)
Included in the above target are also some negative effects from costs connected to future restructuring or improvement programs. Such effects will be negative for 2004, and clearly positive the years thereafter. The potential closure of the plant in Leeds is one example.

7
47 34 7 Hy dr o Me dia 1 2 2 00 3 7 Hyd ro Alu mini um
0
250
500
750
1 000
1 250
Underlying"oversupply"speed 2002
Net 2003restarts /new
closures
Net new c apacity Increasedconsumption
(primaryshipments )
Change exportChina
Total inventoryincrease
1 000 tonnes
Metal balance 2003 better than expected
The development of the primary metal balance in 2003 has been somewhat better than expected.. • The underlying oversupply (i.e. inventory increase if there were no changes in demand or supply) from 2002 was 600.000 tonnes. Out of this approx 250.000 tonnes was net export from China in 2002.• It was expected that restarts would bring some idled capacity back to the market this year. Instead we have seen more closures, mainly in the US North-West. Aggregated closures are now approx. 1.9 mill.tonnes in the Western World. • Net new capacity outside China and CIS is around 500.000 tonnes compared to last year. This is mainly coming from Asia and Africa. The increase in consumption (shipments) in 2003 is expected to be somewhat lower than we estimated 8 months ago, approx. 800.000 tonnes. • The export from China is estimated to increase only 100.000 tonnes, and is estimated to reach 350.000 tonnes. This is clearly lower than estimated by most sources last year and early this year. • In total this means that our current estimate for inventory increase is approx. 300.000 tonnes this year – approx 2-300.000 tonnes lower than consensus estimate early this year. Reported stocks as of end October were at the same level as year end 2002, and some of the expected increase in total stocks is likely to relate to unreported stocks.• All in all the primary metal balance is somewhat better than expected some months ago, and this has supported an increase in LME-prices to above 1500 USD/ton in the last weeks..
8
47 34 7 Hy dr o Me dia 1 2 2 00 3 8 Hyd ro Alu mini um
-3.2
4.12.8
7.4
2.2
-6
-4
-2
0
2
4
6
8
0.7 1.3
-4.4
4.2
6.0
-6
-4
-2
0
2
4
6
8
Annual c hange in %
Source: EAA
Extrusion shipments Rolled products shipments
1995-1999 2001 2003E 2002 2000
Annual c hange in %
1995-1999 2001 2003E 2002 2000
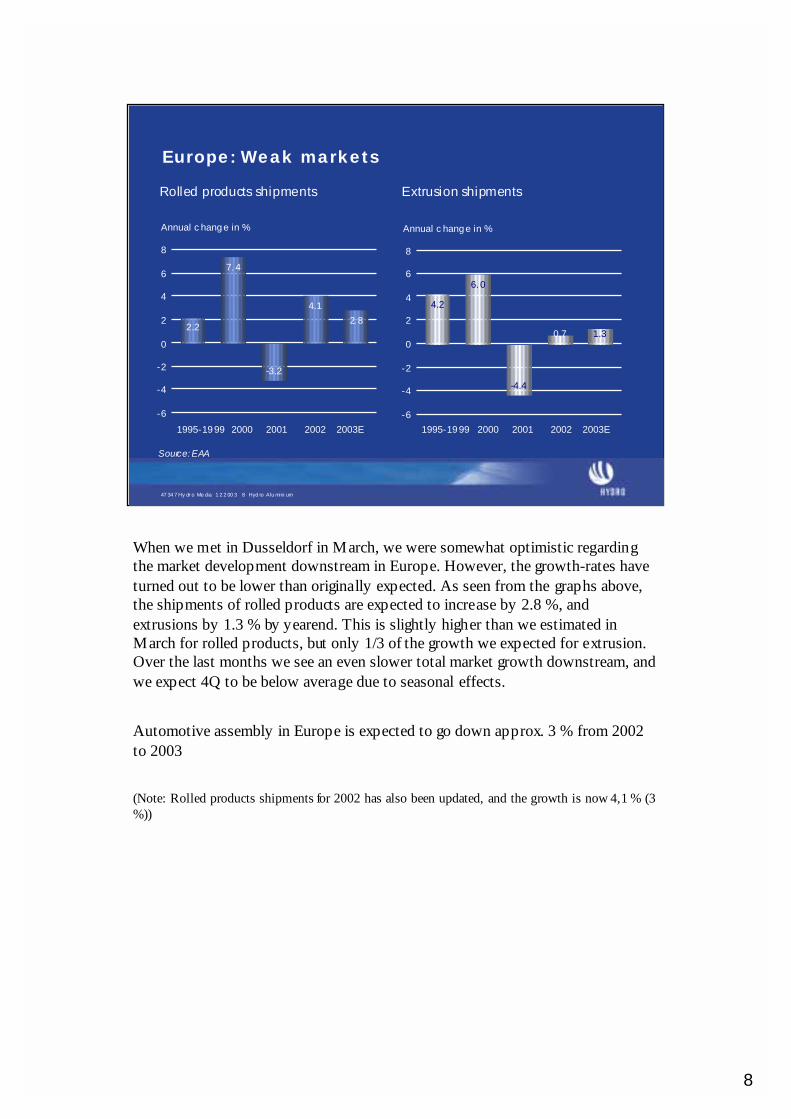
Europe: Weak markets
When we met in Dusseldorf in March, we were somewhat optimistic regarding the market development downstream in Europe. However, the growth-rates have turned out to be lower than originally expected. As seen from the graphs above, the shipments of rolled products are expected to increase by 2.8 %, and extrusions by 1.3 % by yearend. This is slightly higher than we estimated in March for rolled products, but only 1/3 of the growth we expected for extrusion. Over the last months we see an even slower total market growth downstream, and we expect 4Q to be below average due to seasonal effects.
Automotive assembly in Europe is expected to go down approx. 3 % from 2002 to 2003
(Note: Rolled products shipments for 2002 has also been updated, and the growth is now 4,1 % (3 %))

9
47 34 7 Hy dr o Me dia 1 2 2 00 3 9 Hyd ro Alu mini um
0.82.6
-8.9
4.6
-2.4
-24
-20
-16
-12
-8
-4
0
4
8
Rolled products shipments Extrusion shipments
5. 5
-21.1
-0.1
-0.8 -2
-24
-20
-16
-12
-8
-4
0
4
8
1995-99 2001 2003E 2002 2000 1995-1999 2001 2003E 2002 2000
Sources: CRU, AA
US Markets still weak
Annual c hange in %Annual c hange in %
Markets in the US have not recovered through 2003. We see especially in extrusions that we have the 3rd year at minus 20 percent compared to the level in 2000. While the forecast eight months ago was 4,5 % market growth, the latest estimate is a continued fall of 2 %. (Note: Estimate for rolled products shipments for 2003 has also been revised down, and the growth is now 0,8 % (1,9 %))
Macroeconomic data points at a strong growth in the GDP in the US in 3rd Q, and industry starts to show first signs of recovery in the aluminium market. We expect some recovery for next year.
Automotive assembly in the NAFTA areas is estimated to be reduced with 2 % from 2002 to 2003.
All in all the downstream consumption has been weak in Europe and US in total, and this has put a constant downward pressure on margins.
With the relative weak downstream markets in both Europe and the US, - why is the LME so high, - around 1500 USD/ton? The main reasons as we see it are:• Future recovery is factored into the price• Strong continued consumption growth in China and lower export of primary than expected• Some hundred thousand tonnes of primary have been used in the secondary industry instead of scrap (availability, price)• Continued high power cost in the Northwest and high alumina spot prices have kept a significant portion of primary capacity out of the market

10
47 34 7 Hy dr o Me dia 1 2 2 00 3 1 0 Hy dr o Al umi niu m
0
200400
600800
10001200
140016001800
YTDQ3/02
YTDQ4/02
Q1 03
YTDQ2 03
YTDQ3 03
Target2003
Aluminium Magnesi um
0
500
1000
1500
2000
2500
3000
YTDQ3/02
YTDQ4 02
YTDQ1 03
YTDQ2 03
YTDQ3 03
Target2003
Target2004
Aluminium Magnesi um
50010991**)300 *)-A lum inium
714240-10700Magnesium
Total
Es timate200320022001
RemainingRealizedRestructuring and rationalization c osts (NOK million)
Workforce and cost reductions relative to 2001*of which NOK 89 million charged to VAW opening balance**of which NOK 14 million is infrequent
Cost reductionsNOK millionFTEs
Announced improvement programs deliveredWorkforce reduction
We have announced earlier that are on track to deliver the improvement programs. Today we announce that by the end of the year, we will have achieved a run-rate of improvements showing that we will meet our 2004-target.
By end of 3 Q we had reduced manning by 1630 out the 1700 targeted in the programs. Cost reductions are slightly ahead of plan as well.
The original cost estimate for restructuring of our aluminium activities to reach the above targets was 700 mill NOK. This is now reduced to 500 mill.NOK. The remaining charge of 109 mill.NOK will be split between 4 Q and 2004.
11
47 34 7 Hy dr o Me dia 1 2 2 00 3 1 1 Hy dr o Al umi niu m
05
101520253035404550
1997 1998 1999 2000 2001 2002 Q3 2003YTD
Hydro Aluminium excl. VAW VAW only HAL
Total recordable injuriesper mill ion worked hours
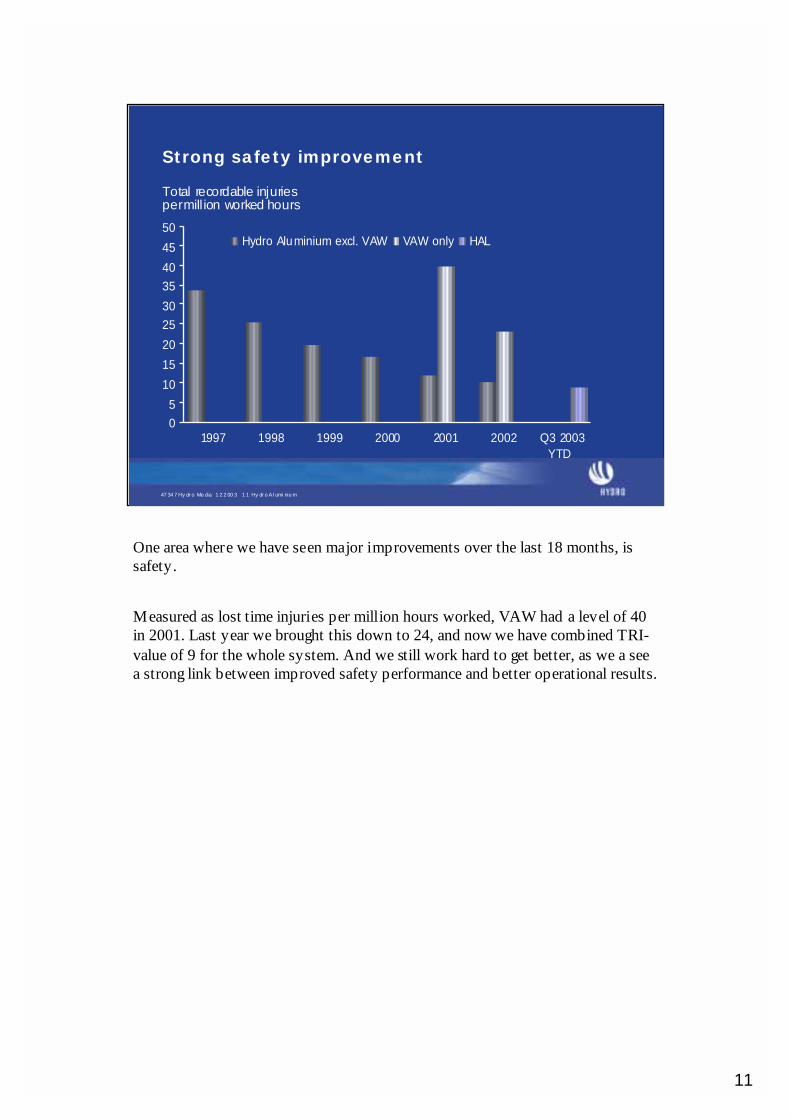
Strong safety improvement
One area where we have seen major improvements over the last 18 months, is safety.
Measured as lost time injuries per million hours worked, VAW had a level of 40 in 2001. Last year we brought this down to 24, and now we have combined TRI-value of 9 for the whole system. And we still work hard to get better, as we a see a strong link between improved safety performance and better operational results.

12
47 34 7 Hy dr o Me dia 1 2 2 00 3 1 2 Hy dr o Al umi niu m
0 %
2 %
4 %
6 %
8 %
10 %
12 %
1998 1999 2000 2001 2002 2003*
CROGI proxy
*EBIT DA less reported tax/gross inves tment, Hydro Alum inium figures as reported 2003 figures are es timated roll ing average las t 4 quarters (Q4 2002 – Q3 2003).
Source: Annual and quarterly reports, Hydro estimates
Profit level for the industry still a challenge
AlcoaAlcan
Pechiney
Hydro Aluminium
The economic downturn in the Western World since mid-2001 has hit the aluminium industry hard. The graph shows that all companies have had low returns on capital over the last 3 years.(Note: 2000-figure for Hydro Aluminium was positively affected by high NOK/USD, while in 2001 the charges for closure of the magnesium plant in Porsgrunn affected the CROGI negatively)
The above measure is a CROGI-proxi based on available information in annual and quarterly reports. For 2003 we have used last 4 quarters. (Note: The calculation of the CROGI-proxi for Hydro Aluminium does not necessarily reflect what the CROGIwould have been i f Hydro Aluminium was a stand-alone company. Certain unallocated corporate costs in Hydro have not been allocat ed to Hydro Aluminium, including amortization of unrecognised losses regarding pension schemes in Norway and Germany. Income tax for Hydro Aluminium has been calculated based on an assumed income tax rate of 30 %.)
Even though there are uncertainties in this method, we believe that the trends are right. We have improved our performance over the last 2 years.
However, we are not satisfied with the level we have achieved so far, since we are still below our internal target.
(Note: Results above are all based on actual prices, no normalisation)

13
47 34 7 Hy dr o Me dia 1 2 2 00 3 1 3 Hy dr o Al umi niu m
DownstreamMetal products
Hydro Aluminium metal flow- more margin business
Own casthouses and
remelters
Partners’ Partners’ casthousescasthouses
Sources
ScrapScrap
Standard ingot Standard ingot from strategicfrom strategicpartnerspartners
ElectrolysisElectrolysis
Key elements in HAL’s metal flow are shown here. • Four main sources of metal:
•Own liquid metal from own smelter capacity (approx. 1.47 mill.t this year)•Metal from 3rd party alliances. Typical alliance partners are Albras and Rusal• Scrap from own downstream-activity (process scrap), and external scrap, - both process scrap and “old scrap” (real recycling)• As a fourth element, we have agreements with partners to handle their casthouse products, examples are Talum in Slovenia and Slovalco in Slovakia.
•Next step is the special business we have created in Metal products; - a total business volume of approx. 3,3 mill.ton is sold to market, and most of it is processed in our own casthouses and remelters. • Approx. 2 mill.tonnes metal products are used by our downstream system (Approx. 1,5 mill. downstream products sold, the rest is process scrap)
•Hedging policy:• As a general rule, Hydro Aluminiums’s own electrolysis production is fully exposed to LME volatility.•Main exception, is a strategic hedge of the Sunndal expansion (volumes, see annual report) where part of the expansion production is hedged at about 1500 $/ t LME and NOK to USD of about 9.30 through 2007. (Note: Quali fies for hedge accounting & is included in Metals results when realized)
•The rest of the value chain are margin businesses. Revenues & certain raw materials are economically hedged in terms of LME & currency with the purpose of “locking in margins” on such transactions. This avoids LME & currency risk. (Note: These “ price”hedges do not qualify for hedge accounting. Realized LME effects are included with the business results while unrealised gains & losses are included at the HAL level. Effects of currency hedges are included as financial items below EBITDA.)

14
47 34 7 Hy dr o Me dia 1 2 2 00 3 1 4 Hy dr o Al umi niu m
700
1400
1400 820
515
650
67
700
830
290
Alumina *)
Electrolysis metal
Metal products
Downstream
Equity3rd partyal l ianc es
Remelt own s c rap
Rol led Extr. & Autom. Cas tings
* Aluminium equivalents (2 tonnes alumina per tonne aluminium)
Remelt external
Medium/long term c ontrac tsEquity
1 000 tonnes
Equity
A unique portfolio compositionProforma 2002 figures
What creates the unique portfolio, and what are the benefits?1. We are short on alumina. Approx. 50 % of our need is covered through long-term contracts.
Bauxite and alumina are business more and more operated through mining companies, like RioTinto, Comalco and Billiton, in addition to Alcoa’s strong position. We are convinced that our portfolio gives us the best risk/reward balance, and allow us to spend management time and capital in other areas where we could be leading.
2. Metal Products: We have created a special business platform in this part of the value chain. Based on commercial and technical skills we go to market with a volume of more than twice our primary production, with limited extra capital employed. In addition to alliance partners, we get material from the scrap market and through ingot sources in remote regions. Benefits; strong market positions, capitalise on competence, create flexibility for be able to source of downstream expansions.
3. We have a different balance downstream between rolling and extrusions than other companies: The volume relation is for us less than 1.5 – 1, while for Alcan it is 20 – 1 and for Alcoa 3 – 1. Benefits; - Extrusion requires less capital invested per ton – or per million revenue - than rolled products (a “capital light” downstream focus). Extrusion is for us a sound, profitable business, delivering above profit targets. Easier to exploit step by step growth opportunities, and create value through integration and productivity gains, less fixed cost, easier to expand geographically
4. The fourth differentiating element is the one you do not see here: We are not into Flexible packaging – a major part of both Alcoa and Alcan, especially after the acquisition of Pechiney. We can focus attention on a shorter value chain.
(Note: Proforma 2002: As if Hydro had owned VAW from 1.1.2002)

15
47 34 7 Hy dr o Me dia 1 2 2 00 3 1 5 Hy dr o Al umi niu m
1700
850 850700
1400
1400
830
820
515
650
67
290
700Alumina *)
Electrolysis metal
Metal products
Downstream
Equity3rd partyal l ianc es
Remelt own s c rap
Rol led Extr. & Auto. Cas tings
Remelt external
Medium/long term c ontrac tsEquity
1 000 tonnes
Equity
A unique portfolio composition2002 versus 2005 estimate
* Aluminium equivalents (2 tonnes alumina per tonne aluminium)
Let me use also this figure to give you an update of strategic progress since last year, and some expected changes up to 2005
1. We focused on improved cost situation upstream, and in the alumina area the alumina supply is strengthened through increased volumes in Alunorte I and later from Alunorte II. The new Comalco 26-year contract is an important pillar in our long term contract portfolio.
2. In the electrolysis we produce approx. 70.000 tonnes more this year, mainly due to expansion in the new cost effective Sunndal plant. Towards 2005 the low-cost plant Alouette will expand with 60.000 tonnes. All this will contribute to improve our metal cost position, and total production will grow to approx. 1,7 mill.tonnes. At latest by end of 2006 we will close down high cost Søderberg-capacity in Høyanger and Årdal.
3. In the metal products area our strategy is to pursue the European leadership and grow globally. Over the last 12 months we have signed new key sourcing contracts (Sayansk, Talum), and we take profitable market shares both in Europe and globally.
4. Downstream leadership in selected segments; - yes, we see profitable growth in extrusion and we expand volumes in high-margin niches like litho and foil. In automotive we see continued growth for our precision tubing business, and we also expand globally with a new plant in China. In total we continue to improve our downstream portfolio, including fixing, selling or closing under-performing activity.

16
47 34 7 Hy dr o Me dia 1 2 2 00 3 1 6 Hy dr o Al umi niu m
0 .0
0 .2
0 .4
0 .6
0 .8
1 .0
1 .2
1 .4
1997 1998 1999 2000 2001 2002 2003*
Revenues / Gross Investments
Source: Company reports, Hydro estimates. Proxy figures where needed to get comparative figures. *2003 estimated rolling average last four quarters (4Q 2002 – 3Q 2003.)
0
5
10
15
20
25
1997 1998 1999 2000 2001 2002 2003*
EBITDA / Revenues%
Hy dro Aluminium
Alcoa
Alcan
Alcoa
Alcan
Factor
A unique portfolio: Higher capital turnover
Hy dro Aluminium
The difference in portfolio also makes a difference to the others when it comes to key figures. The graph shows that we have a much higher capital turnover than Alcoa and Alcan. Main reasons are- Short alumina position- Our business model in metal products (alliances, scrap conversion, trading)- Relatively more extrusion downstream
As the consequence of our portfolio, we have lower EBITDA-margins than the others. Over the last 2 years we can show a strong improvement in the EBITDA-margin, partly due to cost improvement programs. The improvement is also strong compared to peers.
Combining these two key figures – and deduct tax from EBITDA – we get the CROGI-figure. And as showed earlier, our lower margin is more than compensated through higher capital turnover, so we get a CROGI-figure ahead of peers
We are not different by default, we are different, and pursue a different strategy, because it’s to the benefit of our results. Where we are strong, we will focus our growth. Where we see opportunities some years ahead, or we see imperfections; - we add management attention. This is how you should recognise us in Hydro Aluminium. We will continue to strengthen our unique position to the benefits of our results and shareholders.
(Note: On this slide Alcan does not include Pechiney proforma)
17
Hydro Aluminium
Special update
- Primary cost position- Rolled products segment- Extrusion and Automotive segment

18
47 34 7 Hy dr o Me dia 1 2 2 00 3 1 8 Hy dr o Al umi niu m
Note: Cash operating c os t c alculated as the s um of liquid m etal c os t, c as thous e c os t, c as ting los ses, si te overhead c os t, freight cos t, in teres t on work in progress , m argin c os t and head office cost. Source: CRU. Assumptions LME 2002: USD 1364. USD/NOK 2002: 7.98
600
800
1000
1200
1400
1600
1800
0 4 8 12 16 20 24 28Cumulat ive product ion (m illion tonnes)
Cash operating c os t 2002: A verage = USD1000/tonne
Cost USD/tonne
Hydro
S unndal K arm øyK urri K urriA louette (20%)T om ago (12.4%)2005: Total 1 m il lion tonnes
E lbewerkHøyangerRheinwerkÅ rdalS øral (50%) Ham burg (33%) S lovalc o (20%)2005: Total 0.7 m il lion tonnes
Smelter cost curve 2002
CRU Illustration: Cash operating cost on Y-axis. Accumulated global production X-axis. • New capacity in the industry mainly added to the left, at low cost. Examples are South-America, South Africa and in the Gulf States. Cost in new Chinese smelters are more uncertain. • Any plant will be ”carried to the right” when new, low cost capacity is added. A plant is also carried to the right if improvement is lower than others. • Hydro Aluminium is slightly better than average on the curve
• 0,7 mill tpy will be above average in 2005. Of this 70.000 tonnes will close latest in 2006. However many of these plants have the advantage of being close to market (logistics savings, casthouses with product delivery). • 1 mill tons to the left of average: An increase of 300.000 tons in larger plants. Expansion in Sunndal and Alouette move us to the left. This is where we put money for new capacity.
Challenges in Europe:•. Annual cost and wage increases
Must be compensated through continuous efficiency measures• Structural cost – some small smelters, high manning intensity
Restructuring – step changes in labour productivity. •Energy-situation
Main principle: Long term contracts. Shorter contracts in Germany – expiry is approaching in a few years time
• USD-currency
We work hard through improvement programs and restructuring to improve our relative cost position continuously.

19
47 34 7 Hy dr o Me dia 1 2 2 00 3 1 9 Hy dr o Al umi niu m
! Industry returns in Europe has been low for many years
! Capacity utilization at < 80%
! Industry restructuring continues
* Others include im portsS ourc e: E AA , Hydro Aluminium es tim ates
Alcan24%
Pechiney16%
Hydro18%
Alcoa11%
Corus6%
Elval6%
Other19%
Market shares Europe 2002Total sales 3,520 kt
Neuf-Brisach +
50% Norf +
Rolled Products:Further industry restructuring
*
Our overall market share is around 18 %, with stronger positions in Litho (44 %), foil and automotive (21 – 25 %).
As known from the ruling by the European Commission, Alcan will have to divest either Neuf Brisach or the 50 % share in Norf, both options with smaller plants in addition. Potential divestment volumes from the above represent between approx. 13 % and 18 % of the European market. In the end Alcan’s market share may therefore not experience a major change.
It is however critical from an industrial point of view that the new owner can contribute to develop a professional rolling industry in Europe, and give a satisfactory return on invested capital.
The rolled product industry in Europe has not been at satisfactory returns on capital over the last years. In the US the returns have been more satisfactory. Capacity utilisation is still low in Europe, and big parts of the market are facing severe margin pressure as a result of too high supply.

20
47 34 7 Hy dr o Me dia 1 2 2 00 3 2 0 Hy dr o Al umi niu m
● Improve relative cost position
● Optimize production system
● Continue to grow in high-margin segments
● Expand product offerings –commercial and technical services
● Stronger focus on margins
*) For explanation of adjustments to underlying EBIT DA see appendix
Rolled Products:Closing the performance gap
Underlying EBITDA*
0
200
400
600
800
1000
1200
1400
1600
2002 Q3 2003 YTDAnnualized
NOK million
Financial improvement in the Rolled Poducts segment is one of Hydro Aluminium’s top priorities. Since last year we have made substantial progress in underlying performance (excl. infrequent items like VAW-integration cost and restructuring cost, and also excluding LME effect on inventory value).
The remaining gap cannot be closed through any single action. A number of measures are needed, - and we are working on all internal potentials.
Cost reductions will have to be a key measure going forward, included also an optimised product mix between the plants.
This is an industry traditionally very sensitive to volume – due to the high capital involved. An increased focus on margin management is needed, and we will also work to strengthen our product offerings, based on our successful experiences in extrusion and metal products.
Conclusion: There will be a strong, continued focus on improvements, and we look forward to give you progress updates ahead.
(Note: See also appendix for details )

21
47 34 7 Hy dr o Me dia 1 2 2 00 3 2 1 Hy dr o Al umi niu m
CAPEX vs depreciation
0102030405060708090
100
'98-02 '03 E '04 E
EUR
mill
ion
CAPEX Depreciation
Historical figures: Hydro + VAW consolidatedCAPEX for VAW acquisition excluded
CAPEX in % revenues
0
1
2
3
4
5
6
'98-02 '03 E '04 E
Rolled Products: Improved net cash flow ahead
Rolled Products has been through a period with large investments. It includes upgrades of the old Reynolds mills bought by VAW in 1998 (Hamburg, Italy, Spain), acquisition of a mill in Malaysia including upgrade, as well as new dedicated lines in some product areas, to be able to produce specialized products with higher margins.
The investments will now go somewhat down, and be at approx the same level as depreciation.
The investments made have improved our cost position and improved our mix. We therefore see a strong improvement in CAPEX ratio to revenues, going from 5 % in the period 98 – 02 to 4 % this year and approx. 3 % next year.
At this investment level we are below the level of our peers .

22
47 34 7 Hy dr o Me dia 1 2 2 00 3 2 2 Hy dr o Al umi niu m
Employ ees
0
100
200
300
400
500
600
Q1 Q2 Q3 Est. Q4
● Cost focus
0
200
400
600
800
1000
Q1 Q2 Q3 Est . Q4
Thin gauge mill productiv ity(meters/minute)
● Competence sharing
0 %
5 %
10 %
15 %
20 %
25 %
30 %
Q1 Q2 Q3 Est. Q4
Heat exchanger & foil – share of production
● Product optimisation – higher margin segments
Rolled Products:The Holmestrand turnaround
Holmestrand is a rather small part of our rolling system, approx. 10 % of the revenues from the rolling segment. Last year the plant’s result turned dramatically negative due to higher prices on scrap and operational problems.
A major turnaround program was initiated early this year, and the results are positive so far
1. Manning is reduced with almost 20 %
2. High competence available from the former VAW-organisation is being used to support operations, which has boosted the plant’s productivity level
3. A change in product mix of higher margin products starts to pay off.
However, there is still a way to go until we reach a satisfactory return.

23
47 34 7 Hy dr o Me dia 1 2 2 00 3 2 3 Hy dr o Al umi niu m
Turnover is Q1 – Q3 2003 annualized
ExtrusionExtrusion
Revenue: NOK 12.5 bn
Above profit target
Selective growth
North AmericaNorth America
Revenue: NOK 5 bn
Below profit-target
Gap to be closed through continued operational improvement, volume growth and i mproved product mi x
AutomotiveAutomotive
Revenue: NOK 7.5 bn
Below profit target
Improving: Gap to be closed through cost improvements, focused portfolio and selective growth
Extrusion and Automotive segment
Our second reported downstream segment is the Extrusion and Automotive segment, which includes three business sectors in Hydro Aluminium.
-Extrusion, focused on general extrusion and building systems globally excl. North America. Extrusion has since long produced very good results for Hydro, and we will continue to grow this business selectively.
- North-American-sector, responsible for extrusion plants in North-America, and also including metal products and with 6 remelters with approx. 400.000 tonnes capacity. In North America we have had a very tough job to improve operations, while experiencing difficult markets.
- Automotive focus on three product groups heat exchangers, structures and castings. In Automotive focus has been on a turnaround of under-performing units for the last 2 years, and relentless focus on cost reductions in all three product groups continues

24
47 34 7 Hy dr o Me dia 1 2 2 00 3 2 4 Hy dr o Al umi niu m
308228 215
93
392
0
50
100
150
200
250
300
350
400
HydroA lco
a
A lcan/Pechin
ey
Sapa/R
emy C
.Coru
s
Estimated for Western Europe based on figures from 2002. Proforma figures for SAPA/Remy C. and Alcan/Pechiney. Includes extrusions in Automotive Source: Annual reports, Hydro estimates, CRU, Alken
Extrusion:Leading in EuropeSales, 1 000 tonnes
Hydro Aluminium has grown slightly faster than the market for extrusions for many years, both organically and through small acquisitions. Today we are actually approx. 30 % bigger than Alcoa, and recognised as the market leader. Our products to market can be split in three major groups
1. General extrusion (Extrusion sector)2. Building Systems (Extrusion Sector)3. Automotive Products (Automotive Sector)
Volumes from all three are included above, to make it comparable to other companies.
Hydro has built this position stepwise, based on a separate, strong business model and operational philosophy.
(Note:European market consumption 2,4 mill tonnes (EAA)Shipment data used as market share indicators – ignoring exports outside Europe)

25
47 34 7 Hy dr o Me dia 1 2 2 00 3 2 5 Hy dr o Al umi niu m
0 .0
0 .5
1 .0
1 .5
2 .0
2 .5
1999 2000 2001 2002 2003*
Revenues / Gross Investments
Source: Company reports. Hydro estimates. Proxy figures where needed to get comparative figures. *2003 3Q YTD figures
0
2
4
6
8
10
12
14
1999 2000 2001 2002 2003*
EBITDA / Revenues%
Hy droExtrusion
Sapa
Sapa
Hy droExtrusion
Factor
Extrusion Sector:High capital turnover – attractive profit
Both Hydro and Sapa are leading extrusion companies in Europe.
Within the activity of the Extrusion Sector (Extrusions and Building Systems ex North America) Hydro has delivered a return above our CROGI-target for many years, and we have grown with solid profit.
Above you see a comparison with SAPA, a listed company in Sweden. As you can see, we have a substantially higher capital turnover than SAPA, and they have a somewhat higher margin. This is partly due to product-mix, but our high capital turnover is also a result of consistent focus on net operating capital and lean assets.
Combining these figures, and deduction tax from EBITDA, will give a CROGI-proxy. Figures shows that we over this period have been in line with, or slightly ahead of SAPA.
(Note: Sapa had gains from sales of assets in 2000 and 2001 included above)

26
47 34 7 Hy dr o Me dia 1 2 2 00 3 2 6 Hy dr o Al umi niu m
0
20
40
60
80
100
120
140
160
180
1986 1990 1994 1998 2002
Extrusion Europe & South AmericaKg/presshour (index,1986=100)
Productivity in acquiredcompanies at acq. point
HAEX annual av erage
Extrusion North AmericaKg/presshour (index, European 1986=100)
0
20
40
60
80
100
120
140
160
180
2000 2001 2002 2003
Productivity in acquiredcompanies at acq. point
HALNA annual av erage Industry average
Sept.
Operational excellence –best practice deployment
A key strength for Hydro’s extrusion business has been the business and organisational model. Graphs showing productivity development for Hydro’s extrusion activity: Index Hydro Aluminium Extrusion’s productivity in 1986 = 100• Europe: Impressive development, 3% annual improvement
•including all low-productivity plants bought• Strong focus on performance (benchmarking, best practice sharing)• Big system – local dedicated plants serving local markets• Strong management system
• US: Productivity 50 % lower than in Europe. Hydro average still above industry average in the US• Our target to improve productivity and close the gap to Hydro’s European performance through:
• Better management systems• Transfer of and development of competence• Higher quality products
• We therefore see a substantial value creation potential if we close the gap•Transfer management• Best pactise, competence
• No major investments to get there.• Systematic work still to come in the near future.

27
47 34 7 Hy dr o Me dia 1 2 2 00 3 2 7 Hy dr o Al umi niu m
49
8 0
10
20
30
40
50
Year End 2001 YTD 2003
H2
Safety – TRI rate
Press productiv ity
14 0015 0016 0017 0018 0019 0020 0021 0022 0023 0024 00
Apr
May
Jun
Jul
Aug
Sep
Oct
Nov
Dec
Jan
Feb
Mar
Apr
May
Jun
Jul
Aug
Sept
Oct
lbs/
hr
" Closed plant" Closed presses" Fewer shifts" Operational improv ement
North America:Closing the performance gap
On time delivery, %
66
7176
81
8691
96
Jun
Jul
Aug
Sep
Oct
Nov
Dec
Jan
Feb
Mar
Apr
May Ju
n
Jul
Aug
Sep
Strong operational improvement
Created a much better platform for improved customer and product portfolio and future growth.
However, in 2003 a weak financial year, due to low market, and a 20 mill USD accrual for loss in Goldendale.

28
47 34 7 Hy dr o Me dia 1 2 2 00 3 2 8 Hy dr o Al umi niu m
Casting Casting (NOK 2.8 (NOK 2.8 billionn billionn revenues)revenues)
!! Completion of new production Completion of new production line in Dillingen (G) for diesel line in Dillingen (G) for diesel engine (2004)engine (2004)
!! RestructuringRestructuring!! Low cost Mexico and HungaryLow cost Mexico and Hungary!! Restructuring LeedsRestructuring Leeds
Precision tubing Precision tubing (NOK 2 billion revenues)(NOK 2 billion revenues)
!! Continue to grow Continue to grow ––small niches with strong small niches with strong positionspositions
!! China China –– new plant to be builtnew plant to be builtin 2004in 2004
Automotive:Closing the performance gap
Structures (NOK 2.7 billion revenues)Structures (NOK 2.7 billion revenues)
!! Ramp up ongoing Ramp up ongoing –– still high cost still high cost !! Strong improvement from 2002, ambition to close gap by 2005Strong improvement from 2002, ambition to close gap by 2005
!! High quality asset base and leading competenceHigh quality asset base and leading competence
!! Focus portfolio tFocus portfolio too niches with strong positionsniches with strong positions!! Strong v olume growth ahead Strong v olume growth ahead
based on existing contracts based on existing contracts
Precision Tubing; - growing from strong position.
Castings; - VAW was not able to deliver satisfactory returns in this business, and even though we have made improvements, we are not satisfied with the profit level. We will therefore continue to reduce cost and expand in low cost areas. We are looking at a potential closing of our facility in Leeds, and consultations with workers are in its final stage.
Structures; - we still have too high cost compared to the revenue level, as we still ramp up certain products. Very strong focus on cost improvements, and slimming down the portfolio. Focus on high volume orders going forward, as these seem to give a more satisfactory return.

29
47 34 7 Hy dr o Me dia 1 2 2 00 3 2 9 Hy dr o Al umi niu m
! Continue to improve our competit ive posit ion in a market w ith strong grow th expected
! Relentless focus on cost reductions throughout the value chain
! Improve relative cost position primary - execute on large projects
! Strengthen European leadership - exploit the global platform! Differentiation – selected segments
! Strengthen our unique portfolio profile ! Metal products, extrusion value chain, selected rolled segments
! Active portfolio management
Priorities for Hydro Aluminium

30
Hydro Aluminium
Appendix

31
47 34 7 Hy dr o Me dia 1 2 2 00 3 3 1 Hy dr o Al umi niu m
0
200
400
600
800
1 000
1 200
Repor te d 1 .1. - 15.3 . Infreque nt** LME effe ctinve ntory(*)
Adjusted fornon-recurring items
Adjusted alsofor recurring items
NOK million
Non-recurring Recurring
*) Inventory losses from falling metal prices **) Infrequent items mainly include items related to VAW integration (inventory adjustment to fair value, integration cost and rationalization)
Rolled Products underlying EBITDA 2002

32
47 34 7 Hy dr o Me dia 1 2 2 00 3 3 2 Hy dr o Al umi niu m
0
200
400
600
800
1 000
1 200
Reported Infrequent LME effect i nventory(*)Adjusted fornon-recurring items
Adjusted alsofor recurring items
NOK millionNon-recurring Recurring
*) Inventory losses from falling metal prices**) YTD Q3 * (4/3)
Annualized 03**
Rolled ProductsUnderlying EBITDA 2003 YTD

33
47347 Hydro Media 12 2003 33 Hydro Aluminium
In order to utilize t he “safe harbour" provisions of t he U nited States Private Sec urities Litigation Reform Act o f 1995 , H ydro is providing the f ollowi ng cautionar y statement: T his presenta tion contai ns certai n for ward-looking statements wit h respect t o t he fi nanci al condition , results of operati ons and business of t he C ompany and certain of t he plans and objecti ves of t he Company with res pect to thes e items. B y t heir nature, for ward-looki ng statements invol ve ris k and uncertai nt y because they relate to events and depend on circumstances that will occ ur in t he future. The actual results and developmen ts may dif fer materiall y from thos e expressed or implied i n the f orwar d-looking statements due to any number o f diff eren t fac tors. These factors include, bu t are no t limited t o, changes in costs and prices, c hanges in economic c onditions, and changes in demand for t he Company's products . A dditional informa tion, includi ng information on factors which may af fect H ydro's business, is c ontained in t he C ompany's 2002 A nnual Report on Form 20-F filed with the U.S. Sec urities and E xc hange Commission .
With res pect to each non-GAA P financial measure H ydro us es in c onnection with its financial reporting and o ther public c ommunications, H ydro provides a presentati on of what H ydro believes to be the most directl y c omparable G AAP financial meas ure and a reconciliation between the non-GAA P and G AAP measur es. This in formation can be found in H ydro’s earnings press releas es, quarterly reports and other written c ommunications, all of whic h have been posted to H ydro’s website ( www.hydro.c om).
Forward-Looking Statements/Use of Non-GAAP Financial Measures
Analysis and evaluation of strategic options for the three business areas and for Hydro up to June 2003 found attractive business opportunities in all three of ourbusiness areas. Financial and managerial capacity constraints might limit possibilities for realizing these opportunities within the present corporate structure.A decision was made to concentrate Hydro’s future development on realizing themany attractive possibilities for value creation in Oil and Energy and in Aluminium. Both Agri and Hydro’s shareholders were found to be best served by having Agri develop its strong potential as a separate company. With these decisions our ongoing discussions of the Group’s portfolio are completed. The decision to move ahead with Oil & Energy and Aluminium as the core business areas will stand and is not up for re-evaluation.


![Innovative services and tools for NorduGrid (NGIn) Nordunet 2008, 11.04.08 Jon Kerr Nilsen e-mail: j.k.nilsen[at]fys.uio.no University of Oslo, Department](https://img.dokumen.tips/doc/110x75/55149e92550346f06e8b591a/innovative-services-and-tools-for-nordugrid-ngin-nordunet-2008-110408-jon-kerr-nilsen-e-mail-jknilsenatfysuiono-university-of-oslo-department.jpg)