Embed Size (px)
Citation preview

2257-5
Joint ICTP-IAEA School of Nuclear Energy Management
Pier Roberto Danesi
8 - 26 August 2011
Istituto Universitario di Studi Superiori Pavia Italy
Socio-Economic Aspects of Non-Power Nuclear Technologies (Nuclear Applications)

1
nsmail-5.doc
Socio-economics full report 1 rev.doc
Consultant Report
Socio-Economic Aspects of
Non-Power Nuclear Technologies
(Nuclear Applications)
International Atomic Energy Agency
Pier Roberto Danesi
22 April 2005
Pier Robero Danesi, Consultant,
Arsenal, Objekt 3/30, 1030 Vienna, Austria
e-mail: [email protected]
Tel and fax +43-1-7968936

2
This draft summarises the work done by the consultant during the period of his SSA with
NA (14 March –22 April 2005).
I wish to thank:
Mr. Werner Burkart (DDG-NA) for the opportunity he gave me to get involved in
this interesting topic;
Mr. Jim Reed (NA-DDG-Office), for having permitted this work to be carried out,
the support received, and the many helpful chats;
Mr. Michael Rosenthal (NA-DDG-Office) for the helpful discussions and kindly
editing the English language of Part I and II;
Mrs. Lena Isaksson (Economist and Sociologists at the International Institute for
Applied Systems, Laxemburg, Austria) for having taking the time to read Part I and
II and the encouraging and positive comments provided;
Mr. Pedro Andreo (DIR-NAHU) for the valuable information provided on socio and
economic aspects of nuclear applications in human health;
Mr. Jim Dargie (DIR-NAFA), Mr. Jorge Hendrichs (NAFA), Mr.Walther Enkerlin
(NAFA), Mr. Pierre Jean Lagoda (NAFA). Mr. David Byron (NAFA), Mr. Gudni
Hardarson (NAAL), Mrs. Gabrielle Voigt (DIR-NAAL), Mr. Sergey Fesenko
(NAAL), Mr. Mohammed Haji-Saeid (NAPC), Mr. Therenska (NAPC), Mr.
Andrzej Chmielewski (NAPC) for having provided copies of relevant publications
and other documentation as well as for the collaborative attitudes;
Mrs Lucille Langlois (NE-PESS) for having made available to me considerable
former documentation on the subject.

3
Background
During the SAGNA meeting of 21-25 June 2004 a paper entitled “SOCIO-ECONOMICS OF
NUCLEAR APPLICATIONS” (SAGNA PAPER 06/6) was distributed to the participants and
subsequently discussed. SAGNA concluded that the issue was important and deserved
inclusions in future agendas.
SAGNA also made the following major considerations:
There is a need to assess the socio-economics of nuclear applications at the level of the
Major Programme from a point of view of impact on the public.
Social scientists need to be involved.
There is a need to interact with a wider audience, including NGOs,
Communications with the wider audience should not only be on a technical basis.
The process should start by looking at success stories and known economic indicators.
SAGNA also recognised that it was not appropriate at this point in time to prepare a formal
action plan and that the topic had to be developed and understood over several meetings.
In order to respond to SAGNA‟s request the NA Department considered that it was first
necessary to review briefly some general conceptual issues related to assessing the socio-
economic impact of (nuclear) technologies; mention the pros and cons of some
methodological approaches that can be used to this aim; report on already conducted studies
using cost-benefit analysis; and initiate a more systematic survey of the work done so far by
the Department in this area by collecting already available economic and social information
on nuclear applications.
Although the NA Department and the Agency at large have already addressed in the past most
of the the five points above, it is expected that this work will represent the basis not only for
addressing the points made by SAGNA in a more comprehensive, objective and scientifically
underpinned manner, but also for making available to decision makers in IAEA‟s Member
Sates and the Agency a better tool for decision making.
This document is structured in three parts. Part I addresses the general issue of assessing
socio-economic aspects of technologies. Part II describes a general simplified methodology
for cost benefit analysis of nuclear applications, its limitations and the difficulties associated
to developing a more rigorous approach. Part III summarizes some economic and social
information on selected nuclear applications collected and/or estimated by the IAEA‟s
Department of Nuclear Sciences and Applications.

4
Part I. Assessing the Socio-Economic Aspects of Technologies
I.1. Introduction
Identifying the particular effects of technologies on economic and social systems has received
the attention of economists, social scientists and other professional investigators at least since
the time of the industrial revolution. Nevertheless systematic studies focused to seeing all
effects together and to assess their broader implications for society as a whole is recent and
still a formidable challenge [1]. One of the reasons is that this identification requires joint, co-
operative efforts and the use of a “common language” among different academic disciplines.
Moreover, different socio-economic indicators have to be established and measured in a
reliable manner, possibly on a common unit. As a result, efforts to understand and explicate
the interaction between technological change, whether it is based on nuclear or non-nuclear
applications, and socio-economical change have often led to a number of facile, one
dimensional and partial views about the nature of the interaction. Absence of knowledge has
often encouraged myths or the comfortable illusion that simplified analyses could represent a
meaningful tool for decision makers. Regretfully the complexity of the issue must be a
warning to look with prudence at the conclusions of any study dealing with the socio-
economic impact of a given technology.
Generally speaking new technologies (including the ones based on nuclear sciences) induce
social changes in two principal, closely interrelated ways. They create new opportunities for
individuals and societies and also generate new problems for them. They have both positive
and negative effects and usually the two may occur in virtue of each other. Thus new
technologies can increase economic growth, productivity, living standards or lifetimes. New
technologies may also affect the environment or the amounts and kinds of labour skills and of
supporting services that each industry utilizes. We can quote as an example from the past the
jobs for makers of wagon wheels and horseshoes that were virtually eliminated when the
automobile technology took hold. This did happen but many more workers were engaged in
automobile manufacturing than were ever involved in equipping horses and carriages.
Simultaneously the advent of the motorcar eliminated the problems of disposing large
quantities of horse manure that was afflicting many urban environments. Other examples are
the change introduced from the shift from coal to oil and natural gas for residential heating
and the partial displacement of steel and tin by paper and plastics in the container industry.
Such changes brought about dislocation of buisiness and employment patterns, which were by
some perceived as the negative counterparts of technological development and economic
growth. At the same time oil and gas reduced environmental pollution while the disposal of
paper and plastic containers created new environmental issues. Therefore it is now fully
accepted that while new technology can make some jobs or skills obsolete, others are created
as new industries develop and new products are marketed. Simultaneously old environmental
problems are solved and new ones are created. These considerations are particularly relevant
when discussing the socio-economic impact of nuclear applications on developing countries.
Another relevant consideration is that in the interval from the time a new technology is
introduced to the time the socio-economic impact is measured, socio-economic systems may
experience transition periods, whose duration will be different from case to case. This is a
first reason why in any socio-economic consideration of the impact of any technology the
time variable must be introduced.
5
Moreover, since this impact is in general characterised by a number of positive and negative
feed backs, attempts to evaluate quantitatively socio-economic aspects through socio-
economic mathematical models (such as for example cost-benefit analyses) may lead to a
situation that in mathematical terminology is described as “a multi-dimensional system
controlled by non-linear dynamics”. This may translate into the apparently paradoxical
conclusion that the more refined the cost-benefit analyses of complex socio-economic systems
are, the higher will be the possibility that the system may exhibit an unpredictable behaviour.
In other words, the analysis may show that, although a socio-economic system is in principle
deterministic, no conclusion can be drawn except that results are “not predictable”.
I.2. Some general considerations on socio-economic indicators
Some general considerations on socio-economic indicators are here briefly reported.
To qualitatively or quantitatively evaluate socio-economic changes and impacts of
technologies requires the establishment of economic and social indicators that in turn have to
be measured in a credible manner.
Many economic indicators are routinely used by economists. However they are generally
utilized to measure very aggregated parameters such as economic growth, productivity,
employment, inflation, expenditures, investment, consumption and income distribution in
global, regional and national economic systems. Typical economic indicators are for example,
GDP, GPD deflator index, annual growth, price index, agriculture output, retail sale turnover,
foreign trade turnover, export and import of commodities, real wages, real monetary income,
consumer price index. More recently also environmental and social indicators have been
introduced. In general this second type of indicator is are more difficult to define and
quantify. They have been defined in general terms as “a statistic of direct normative interest
that facilitates concise, comprehensive and balanced judgements about condition of major
aspects of the society. It is in all cases a direct measure of welfare and it is subject to the
interpretation that, if it changes in the “right” direction, while other things remain equal,
things have gotten better, or people are “better off’ [1a].
Examples of environmental and social indicators related to Agenda 21 issues, the United
Nations Millennium Declaration, and the labour market provided by the United Nations
International Labour Organization, are shown in Appendix 1. These and many other available
socio-economic indicators are generally significant only at the macro-scale and as a rule are
of little use to evaluate the socio-economic impact of a nuclear application as most of the time
this represents only a component of a larger technology. For nuclear applications ad-hoc
micro-scale indicators have to be developed and utilized.
It must also be observed that considerable difficulties exist with constructing and using social
and environmental indicators [1]. Many are methodological in nature. A few are worth
mentioning. Should the indicator represent an input to, or an output of, the social system (for
example money expended to reduce the presence of a given pollutant or average degree of
pollution reduction)? In addition, as in many areas data extending over long time frames do
not exist, and there are difficulties in ascertaining the base line for the indicators.
Another problem, already mentioned earlier, is the unit that should be used. In this regard
pure economic indicators are easier to define as money is the unit selected. When we move
away from monetary indicators lack of comparability between different quantities is a major
6
difficulty. We cannot express trade-offs the way the economic market does using selling
prices. It is also often very subjective how to effectively aggregate and weigh different
variables. Typical questions are: how many units of sulphur dioxide pollution can be made
equivalent to a unit of airborne particulate? And, if pollution is a problem, how do we
measure it in terms of summing up contaminated air, dirty water, noise, pesticides,
radiological exposure, diminution of biotic diversity or altered possibilities for scenic and
aesthetic experience ? In addition individual preferences cannot be easily aggregated and
great uncertainty always remains on the most appropriate scale for defining local, national,
regional or global issues. Another problem relates to the actual measuring of the variable of
interest. For example there are several techniques for measuring the amount of a pollutant in
the environment and the interpretation of the number arrived at may be dependent on the
location of the measuring station. Extrapolations and inferences add other difficulties. In this
respect we can quote the concept of “poverty line”. This is generally derived from the
estimate of expenditures for one requirement, namely food, for a limited period (therefore not
accounting for long term nutrition) multiplied for a factor derived from government statistics.
Other judgmental problems arise in establishing what is “good” and what is “better” and to
which extent social indicators are non-ideological. Finally for many indicators cause and
effect relationships in a social system are not are not yet understood and the best that can be
done is to work only with correlations.
In conclusion it can be stated that the complexities and uncertainties associated with
establishing and measuring socio-economic indicators represent a serious limitation in
conducting quantitative or qualitative socio-economic cost-benefit analysis of the impact of a
technology and calls for extra care when using them as decision tools. As highlighted earlier,
these limitations are particularly pronounced when dealing with nuclear applications as these
often contribute to a given technological approach only in part and frequently even the extent
of this contribution may be difficult to evaluate.
I.3. Generalities on cost-benefit analysis (CBA)
Many books on the theory and practice of cost-benefit analysis have been written and
excellent books also exist making the subject accessible to non-economists [2]. However,
traditional economic theories are largely concerned with equilibrium situations among
economic agents with perfect foresights. On the other hand examples from physics and
biology teach us that certain dynamical situations do not produce equilibrium but a rather
unpredictable time evolution, characterised by wild and apparently random fluctuations.
One important feature that many economic systems share is that they are systems with many
feed back and self-regulatory mechanisms. The existence of these kind of inherent
mechanisms has profound and surprising implications for the ways in which markets, prices
and economies can behave. The self-regulatory mechanisms can be extremely intricate,
reflecting the effects of human psychology, social behaviour and, to some extent, rational
thought. Presently it is extremely difficult and in many cases impossible to model such
systems in detail even if the prospect of gaining deeper insight into the behaviour of such
systems by recognizing their intrinsic non-linear structure is enormously exciting and
promising [3].
The issue of technological change by means of the perspectives and methods of complex
dynamic systems (evolutionary economics) has been dealt with in a number of books and
publications where concepts such as non-linearity, path dependency, self-organization and

7
chaos in economics are extensively described and to which the reader is referred for an in
depth treatment of the subject [4-7]. Earnest efforts have been made to analyse financial data
(which are known with much better precision than economic data) in the hope of isolating a
moderately complicated dynamical system. Nevertheless, theoretical understanding even in
this domain remains very limited and the analyst is still facing a situation where time
evolutions somewhat similar to those of chaotic physical systems are observed that at this
time cannot be analysed [8,9].
In spite of the limitations described above, cost benefit analysis of technologies that take into
account many socio-economic parameters have been attempted and have provided useful
insight into several socio-economic systems.

8
Part II. Cost-Benefit Analysis of Nuclear Applications
II.1. Introduction
Non-power nuclear technologies/applications have been promoted by the Agency for their
merit in addressing important human needs such as producing more and cheaper food in a
sustainable manner, better managing scarce fresh water resources, improving human health,
improving industrial production and processes, and protecting our environment. A number of
exemplary cases have been reported in IAEA publications (mostly information brochures) to
justify their merit utilizing ad-hoc chosen parameters. However, to ensure efficiency in
resource allocation, better establish priorities and achieve maximum gains in social welfare,
evaluation procedures that are based on more systematic and careful assessment of several
options under consideration, may be needed.
One such procedure is cost-benefit analysis (CBA), a method distinctively developed for the
evaluation of public policy issues. The CBA methodology tries to identify all potential gains
and losses from a proposal and convert them into monetary units. Once all relevant
information is gathered, properly quantified and compared, using such methods as for
example the net present value, internal rate of return, and/or benefit cost ratios, the decision
maker may better decide whether the proposal is beneficial from society‟s point of view.
CBA, differently from pure financial analyses, tries to measure costs and benefits in terms of
social utility gains and losses rather than just cash or revenues flows. Moreover, external costs
and benefits are included in the evaluation. Therefore CBA not only draws on the
fundamental principles of welfare economics and public finance, but can also be regarded as a
way of thinking as it provides guidance for public policy makers in their search for resources
allocation that is best suited to society‟s efficiency. This is why the specialists conducting
CBAs are at the same time economists and social scientists.
CBAs generally proceeds in three essential steps: (a) identification of relevant costs and
benefits, (b) quantification of costs and benefits in monetary terms, and (c) comparison of
costs and benefit streams accruing during the lifetime of a project.
II.2. Description of the CBA methodology recently used by the NA Department for a
selected nuclear application
The IAEA Department of Nuclear Sciences and Applications has since 2002 collaborated
with an IIASA expert (economist and social scientist) to develop a methodology to conduct
CBAs of nuclear applications and preliminarily applied it to a few specific cases [10,11]. In
consideration of the intrinsic difficulties that characterize more rigorous approaches, as
highlighted in the previous sections, the methodology, although of general applicability, is
based on a simplified approach.
This methodology, described in detail in the two above quoted references, is briefly
summarized below.
Price vs. quantity diagrams are utilized to identify for a given good a number of functions
such as the marginal cost of production, the willingness-to-pay, the net welfare from
production, the net welfare loss for over-utilization, the society‟s marginal cost of utilization,
the private marginal cost of utilization and the marginal benefit. The overall society‟s welfare
of a nuclear technology, defined as the sum of the private and public welfare, is then

9
calculated. The first is obtained by adding the profit (sales revenues minus production cost)
and the consumer utility surplus (willingness-to-pay minus sales expenditures). The latter is
more difficult to obtain as it consists of the use (or consumption) of public goods not having a
market value such as clean air, water, a peaceful and secure society, public health care and
education schemes. Therefore they must be converted into monetary units using methods
based on the willingness-to-pay, evaluation of hedonic (pleasant and/or unpleasant sensations)
prices, and the value of health and human life.
One simplification used is the assumption that one is dealing with a “perfect working
market”, a situation rarely, or perhaps never, encountered in practice. A “perfect working
market” is one where the producers and consumers are operating under full competition, with
full information about the benefits and costs of producing and consuming goods and in
absence of external costs and benefits that are not reflected in the market price. An additional
simplification is introduced by considering that benefit and costs, which do not remain
constant over time, change with time according to a “discount rate”. This has to be
additionally estimated through “intelligent and educated formulas” by the analyst . However
this opens the door to considerable arbitrariness, especially for public goods, which can be
affected by many unpredictable factors and characterized by non-linear positive and negative
feed backs.
In spite of these inevitable limitations (mentioned in the quoted references), the developed
CBA methodology still represents a better tool for decision making than just specific cases
judged as “successful” on the basis of partial and ad-hoc chosen parameters. This is
particularly true when the CBA is utilized to make choices between alternative options. In this
instance it is only the change in welfare between different options and not the total welfare of
a single option that has to be measured. Here some of the difficulties highlighted above are
not present as some of the “untreatable” variables might cancel out.
In order to show how a cost benefit-analysis of nuclear application can be conducted and how
welfare effects can be measured when the alternatives compared involve different types of
benefits and costs, examples reflecting the use of nuclear applications have been considered.
The analyst clearly highlighted that the situation considered was hypothetical and
oversimplified, therefore not necessarily representative of the actual world.
The study evaluated as examples three limiting cases, namely:
(a) the net welfare when both the benefits and costs affected are private and tradable in a
market at market price (radiation to obtain a mutant fruit, which can be produced at a lower
cost or of higher quality);
(b) the difference in the net effect on welfare when the nuclear application is unique and when
there exists an alternative non-nuclear technology (radiation for fast-drying inks when
radiation is the only technology available);
(c) the net welfare effects when non-market values are involved and the use of the nuclear
technology is compared both to a current situation or to an alternative policy option (isotope
measurements to reduce overuse of fertilizers in agriculture in absence and in presence of a
fertilizers‟ tax).
The developed methodology was then utilized to conduct a CBA of food irradiation. The
conclusion was that the net benefit was definitely positive (in the range 7.7 to 58.8 M Euro) at
a 10% share of irradiated food. A summary of this study is reported in Sections III.2

10
The overall general conclusions of these CBA studies are best summarised by quoting
verbatim the words used in the reference [11] : “Nuclear technologies are applicable in a wide range of areas. ….. Sometimes the benefits to society follow
immediately after application and sometimes the benefits are reaped over many generations. The very disparate
characteristics of the benefits make it difficult to estimate their total magnitude in a credible way, without doing
it in a case by case manner. Each case will require unique listings of benefits and costs and these will have to be
estimated using suitable methods of valuation.
Cost-benefit analysis would be the recommended method to evaluate the contribution of a nuclear application
technology to society’s welfare. The effect on society’s welfare is measured as the net effect on costs and benefits
of using a nuclear technology in comparison with a second-best alternative technology. Cost-benefit analysis is
consistent with economic theory because it recognizes that the decision to use a certain technology is a choice
among many different options. There is always a second-best alternative to the choice actually made.
Benefits can be measured in both monetary and non-monetary units. When a technology is applied to improve
products or production processes of goods traded in well-functioning markets, the welfare effect is reflected in
an increased supply of goods at a lower price. In this case, the net welfare effect can be expressed in monetary
units by studying how the introduction of the technology affects market prices and market quantities and how
sensitive consumer demand is to changes in the price of the good. Benefits that are not tradable in markets are
more difficult to express in monetary units. Still, values that are not traded in markets make up a considerable
part of society’s welfare, e.g., in the form of improved environmental quality or improved health and food
security. It is therefore very important to include such benefits in evaluations of the effects of nuclear application
technologies on society’s welfare. It may not always be necessary to express the benefits in monetary units. If the
result of the evaluation is to be used for making choices between options measured in the same unit, e.g., lives
saved or number of patients treated, it is recommended to express the benefits in these units, since all valuations
in monetary terms involve more uncertainty. Conversion of benefit values to a generic unit like the monetary is,
however, necessary when choices are to be made between options involving benefits measured in different units,
e.g., for a decision-maker about to distribute resources in an optimal way to the health and primary education
sectors, it is necessary for a comparison to convert the welfare effects into a generic unit like the monetary, since
the benefits of the two sectors come in very disparate units. Methodologies have been developed in economics to
value benefits that are not traded in markets. The use of these methods is usually resource intensive and
expensive. Results in the literature from a growing number of valuation studies on a wide range of areas can,
however, in many cases be used to express the monetary values of non-tradable benefits of nuclear application
technologies.”
II.3. Some comments on the CBA methodology used
The methodology used correctly identifies many of the costs and benefits that each of the
cases analysed imply.
For example, in the study of food irradiation the following costs and benefits were identified
Costs Benefits (as tangible costs saved) Benefits (as intangible costs
saved)
Capital (investment) costs of
irradiation facilities
Lost income (production) due to
illness and caring for ill family
members
Cost of lives saved
Radiation source cost Public medical health
expenditures
Losses in future work potential
Maintenance costs Private medical health
expenditures
Losses in the quality of life
Labour cost Cost of investigating bacteria
outbreaks
Costs of pain and suffering
Costs due to scale of facility, e.g.
increased food transport costs
Loss in sales revenue/buisiness for
producers and retailers directly
affected by an outbreak
Lost leisure time
Costs of informing and educating
consumers on food irradiation
Costs of recalling and substituting
contaminated food

11
Effects on third-party, e.g. costs of
bad publicity on other producers
and exporters form an affected
region or on tourism
Government expenditures if
financial support is provided for
temporarily save jobs and
restructure a badly hit food sector
Identification of all benefits and costs at a given time is in general difficult and even when
conducted in the most thorough, professional manner, it possible that by a new analysis others
could be identified and some discarded as not significant. While it is obvious that a more
complete analysis could correct this problem, it has to be emphasized that the process would
be in any case time consuming and expensive (considerable expertise is necessary).
It must be pointed out that the use of the net welfare effects may also present the additional
problem of the so called “distributional inequity”, a parameter difficult to take into account
correctly in monetary form. “Distributional inequity” indicates that the benefits and costs do
not necessarily accrue to the same individuals or population. For example the benefit derived
by installing a power plant station for electricity production are shared among a population
extending many kilometres from the station. On the other hand the amenity costs (loss of
visual privileges, excess traffic for fuel transport, higher pollution etc.) are largely born by a
local group living close to the station.
In addition, one feature common to all cost and benefits identified in the studies is that they
refer to a fixed time or, at best, they are corrected for their time variation by applying a simple
discount rate and are treated as independent variables, neglecting that benefits and costs are
often correlated and can vary over the time horizon taken into consideration.
As in reality each cost and benefit can have a different time dependence and each one may
introduce positive or negative feedback that may be characterized by different and complex
(and most of the time unknown) time dynamics, the simplified methodology used may lead to
misleading conclusions, especially when considering different time intervals. For example the
cost of informing and educating the consumer on food irradiation may be influenced by the
benefit of increasing the number of lives saved which in turn may reflect on public and
private medical expenditures. More meaningful CBA related to a technology should then not
only try to identify the most relevant costs and benefits but also their individual time
functions, the various time-dependent feed backs, and integrate the result over the time period
one wants to arrive to a conclusion. Regretfully at the present time this appears to be a very
difficult, if not impossible, task.
II. 4. A more complete (but yet untreatable) conceptual approach
A primary problem in setting up a formal structure for a cost-benefit analysis is the time lapse
between the introduction of a nuclear technology and the time one evaluates the benefits and
costs. Benefits and costs, in addition to being often incommensurate and related quantities, do
not generally accrue at one time. This can be described in mathematical terminology by
saying that each cost and benefit will be in general a function of time, other costs, and other
benefits. Therefore they should be correctly described in a mathematical socio-economic
model by differential equations that can be non-linear.

12
In order to conduct the analysis, after having defined as B(t) and C(t) each benefit and cost as
time dependent functions, we have then to introduce some factors, also functions of time,
(B,t) and (C,t), that reduce benefits and costs to a common (for example monetary) scale.
On this scale the “net worth” related to the introduction of a nuclear technology will be given
by:
W(t) = i (B,t) B(t) - j (C,t) C(t) [1]
where the two summations extend over all benefits (i) and costs (j) identified and B(t), C(t),
(B,t) and (C,t) are differential equations with respect to time, depending in principle on all
other benefit and cost functions.
We can then obtain a “ net present value (NPV)” or “ overall society‟s welfare” through the
integral:
W(t) dt [2]
where the integral should be calculated from t = 0 and t =T, the time horizon for the analysis.
This is the distance into the future taken into account in the analysis (in business decisions T
generally ranges from 1 to 10 years; for nuclear technologies this time could be very
different). As in the previously discussed methodology the simplest prescription for decisions
should be that the nuclear technology should be pursued if NPV is positive and avoided if
NPV is negative.
It is immediately recognized that with the exception of very few oversimplified cases where:
linear relationships occur,
the functions B, C, (B) and (C) are independent of time (or a
simple discount rate can be introduced),
benefits and costs are not influenced form each other,
the complex system of non-linear differential equations may easily lead to a very complex
behaviour. This may happen even in the most optimistic case (probably never attainable in the
real world) when all benefits and costs functions are identified, reduced to a common
monetary scale, and expressed in correct mathematical terms.
This means that if by a computer we could calculate NPV (overall society‟s welfare) at
different times, even for a rigorously and thoroughly described socio-economic system
behaving in fully deterministic manner, we would observe some regions characterised by
stabilities, intermixed with periodic and non-periodic (apparently random) oscillations and
regions of fully chaotic behaviour [12]. This translates in everyday language by saying that
complex socio-economic systems, although controlled by deterministic laws, can be
“unpredictable” and in many cases the best we can do is to “predict their unpredictability”.
Therefore when for the sake of practicality simplifications and approximations are made in
the estimation of benefits and costs, we should remain aware that even in the absence of these
simplifications and approximations CBAs may lead to “weird” conclusions. This complex
behaviour has been the subject of numerous and in-depth studies and discussions during the
last 20 years. It is still intensively studied in a number of research centres such as the Santa Fe
Institute (New Mexico, USA), where mathematicians, economists, physicists and biologists

13
work in multidisciplinary teams on complexity-related problems, including socio-economic
systems [13].
What is shortly mentioned above indicates that, although CBAs are still useful for
understanding the complexities of the socio-economic impacts of a technology, extra care
must be used and all simplifications and assumptions must be clearly stated, when presenting
and drawing conclusions. As a minimum precaution to be recommended is that the
uncertainty of the CBA should be reported at least in terms of upper and lower limits. By
successive refinements of the model and as long that the approximations and assumptions
initially introduced are verified and more parameters numerically evaluated, the uncertainty of
the prediction may be reduced and consequently the usefulness of the results may increase.
14
Part III. Some Economic and Social Information on Selected Nuclear Applications
Collected and/or Estimated by the NA Department
In this section some information of economic or social relevance on nuclear applications
collected and/or estimated in publications and reports produced by the NA Department is
summarized. Additional information is reported in Appendices 1 to 7 and in the references.
The value, quality and quantity of information of socio-economic relevance significantly
varies in the summarised studies, reflecting the specific objectives and scope of the
documents, and the methodology (or lack of methodology) used to conduct the analyses.
Only the information reported in sections III.1.b. and III.2. was obtained using the
methodology described in section II.2.
III.1.a Physical and Chemical Applications: radiation and isotopes for industrial
applications
Radioisotope technology has been the subject of continuous development for over 40 years
and today experience in the application of this technology also exists in many developing
countries. Stimulated by an ever increasing demand from large production plants, many
techniques have evolved to provide fast and effective solutions to plant and process problems.
They are used in prospecting for natural resources, to interrogate and assess geological
deposits and reservoirs, the assessment of raw materials and feedstock for suitability and
quality conformance, and process control systems for the purpose of consistent and efficient
manufacturing of quality products.
In the early 1960‟s IAEA conducted an international survey on the global savings from the
industrial use of radiotracers, sealed sources and nucleonic gauges [14]. It was then estimated
that the global savings were in the range US$ 296 - 400 million/yr. Almost half of them were
form the use of nucleonic gauges. More recently, some economic and technical benefits of
radioisotope technology (radiotracers, sealed sources and nucleonic gauges) applied in
industry have been reviewed [15].
The major radioisotope techniques routinely applied in industry are:
Radiotracer Residence Time Distribution (RTD) for troubleshooting and analysis
Radioisotope Gamma Scanning for columns and pipes troubleshooting inspection
Neutron backscattering for level and interface detection
Radiotracers for leak detection in heat exchangers
Radiotracers for flowrate measurement of liquid and gas fluids in pipes
Thin Layer Activation (TLA) technique for wear and corrosion monitoring
Radiotracer for transit characteristics determination between injection and production well
in oil fields (interwell communications).
Nucleonic gauges or nucleonic control systems (NCS) are nuclear instruments for
measurement and analysis based on the interaction between ionising radiation and matter.
They are applied to on-line and off-line processes and for in-situ and laboratory analytical
measurements.
Many NCS are commercially available from several manufacturers. Nevertheless, significant
types of NCS are not yet in the realm of commercially available services. The development of
15
supporting technologies such as compact electronics, fast computers, high-resolution
detectors, small reliable neutron tubes, and dedicated computer modelling codes has resulted
in expanded technical viability and economic advantages. Therefore the development of new
NCS is still in progress.
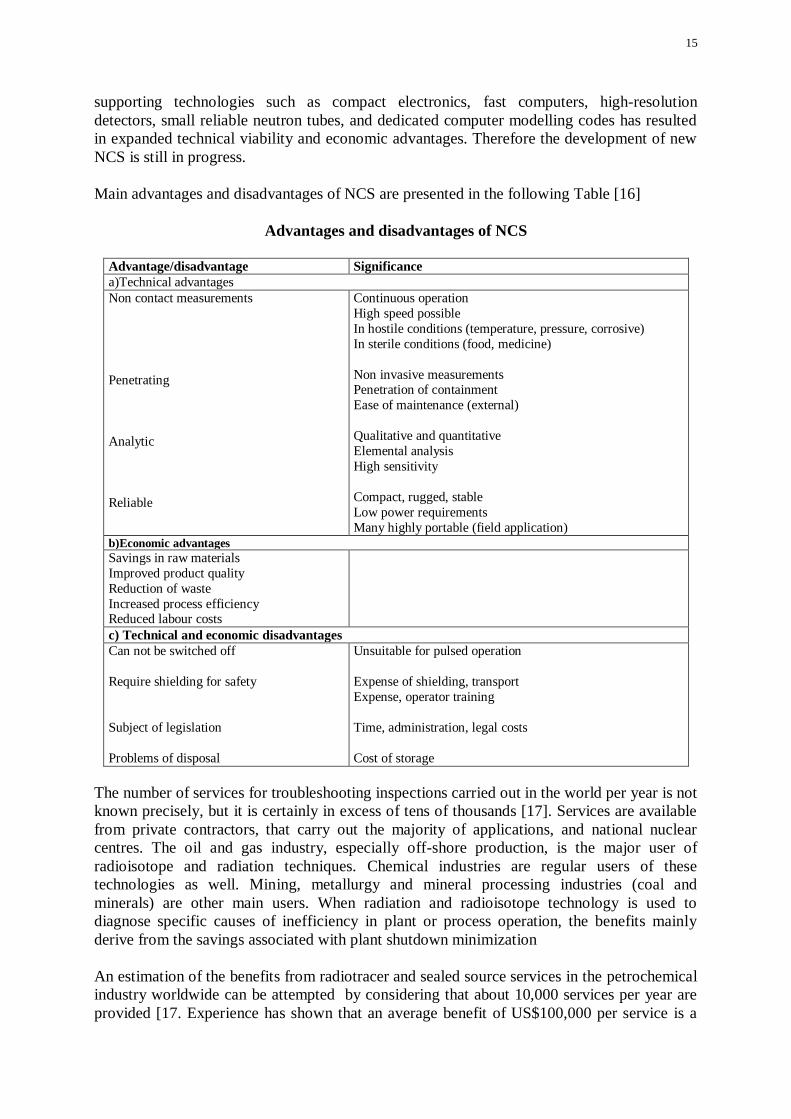
Main advantages and disadvantages of NCS are presented in the following Table [16]
Advantages and disadvantages of NCS
Advantage/disadvantage Significance
a)Technical advantages
Non contact measurements
Penetrating
Analytic
Reliable
Continuous operation
High speed possible
In hostile conditions (temperature, pressure, corrosive)
In sterile conditions (food, medicine)
Non invasive measurements Penetration of containment
Ease of maintenance (external)
Qualitative and quantitative
Elemental analysis
High sensitivity
Compact, rugged, stable
Low power requirements
Many highly portable (field application)
b)Economic advantages
Savings in raw materials
Improved product quality
Reduction of waste
Increased process efficiency Reduced labour costs
c) Technical and economic disadvantages
Can not be switched off
Require shielding for safety
Subject of legislation
Problems of disposal
Unsuitable for pulsed operation
Expense of shielding, transport
Expense, operator training
Time, administration, legal costs
Cost of storage
The number of services for troubleshooting inspections carried out in the world per year is not
known precisely, but it is certainly in excess of tens of thousands [17]. Services are available
from private contractors, that carry out the majority of applications, and national nuclear
centres. The oil and gas industry, especially off-shore production, is the major user of
radioisotope and radiation techniques. Chemical industries are regular users of these
technologies as well. Mining, metallurgy and mineral processing industries (coal and
minerals) are other main users. When radiation and radioisotope technology is used to
diagnose specific causes of inefficiency in plant or process operation, the benefits mainly
derive from the savings associated with plant shutdown minimization
An estimation of the benefits from radiotracer and sealed source services in the petrochemical
industry worldwide can be attempted by considering that about 10,000 services per year are
provided [17. Experience has shown that an average benefit of US$100,000 per service is a

16
reasonable estimation. Therefore the overall savings should be around US$1 billion per year.
This is a conservative estimate because it considers only the troubleshooting of isolated
processing units (column or vessel), neglecting that shutting down one unit may also affect all
processing lines, with losses that can be as high as US $1 million per year.
An overall rough estimation of all radioisotope applications (radiotracers, sealed sources and
nucleonic gauges) in industry worldwide, calculated from various partial surveys, collection
of case studies, reports of some countries and reasonable extrapolation gives figures in the
range of US$ 3.5 – 4,5 billion/yr.
Some case studies, described in Appendix 2, exemplify some benefits derived by using
radiotracers, sealed sources and nucleonic gauges in industrial troubleshooting and process
optimisation.
To estimate the major tangible advantage of radiation and radioisotope technologies
frequently the benefit to cost ratio has been used. This is defined as the ratio of the net profit
increase (user‟s savings and benefits) to the cost of the services (charged by the provider of
the services). Unfortunately, for a variety of reasons, industrial companies are reluctant to
release information on the magnitude of the profits they have derived. Moreover, benefits in
terms of increased safety and better protection of the environment are more difficult to
quantify.
III.1.b. Physical and Chemical Applications: isotope technology for process plant
inspections.
Using the methodology described in Section II.2 the case of isotope technology for inspection
of a refinery column has been analysed [11]. The cost was compared to that of a conventional
visual inspection. The analysis considered the frequency of inspections required, the different
shut-down times of the column and the corresponding production losses, and the actual costs
of one visual and one isotope inspection. The conclusion was that the annual net benefit due
to isotope inspection was about 100,000 US$/year.
III.2.a. Food and agriculture: food irradiation
The methodology described in Section II.2 was used in the case of food irradiation [10]. The
cost-benefit analysis concerned the irradiation of meat, fish and seafood for health purposes in
the European Union (15 countries) to reduce the prevalence of Salmonella, Campylobacter,
Listeria monocytogenes and E. coli O157:H7. The benefit of reduced illness were identified
as the current costs of illness caused by these bacteria as made up of the costs of lost lives,
lost production due to illness and caring for the family members, public and private medical
health expenditures, losses in future income, cost for investigating bacteria outbreaks, cost to
food producers and retailers for cleaning equipment and recalling and destructing infected
food, effects on third party such as cost of bad publicity for other producers or exporters or in
the tourist industry, losses in life quality due to chronic illness, cost of pain and suffering and
losses in leisure time. The costs of reducing illness through food irradiation were considered
as the investment and operation costs of the irradiation facility, the radiation source cost, the
transport costs due to a minimum scale requirement of the facility, the cost of informing and
educating consumers. As in the time-limit of the study all benefits and costs could not be
evaluated a selection of the most important ones was made. The conclusion was that the sum
of the estimated costs is in the range 3.2 to 4.4 billion Euro/year (in 2000). The benefits

17
(sensitive to scale) were calculated for different assumptions about the share of food being
treated by irradiation. The results indicated that the net benefit was definitely positive (in the
range 7.7 to 58.8 M Euro) at a 10% share of irradiated food.
III.2.b. Food and Agriculture: the sterile insect technique (SIT)
Area-wide integrated pest management programmes, that use the sterile insect technique
(SIT) to control insect pests of economic significance, are designed to have a positive impact
on society. They allow the production of more and better-quality horticultural products and
healthier cattle at a lower cost, and this increases the food supply, diversifies markets, creates
new jobs, but still protects the environment. In the case of the tsetse fly benefits also accrue as
improved human health. In the past decade, several studies have assessed the economic
feasibility of area-wide integrated pest management programmes, that use the sterile insect
technique. These studies have been the basis for deciding to invest or not to invest in such
programmes. Similar studies to measure the economic returns and impact of programmes at
different stages of implementation have also been conducted [19].
Based on the status of the target pest in the area of interest, fruit fly programmes integrating
the SIT can be grouped into four main strategic options, as follows: (1) eradication (it
eliminates from an area an established pest or an outbreak of an introduced pest), (2)
suppression (it reduces pest populations), (3) containment (it applies phytosanitary and
regulatory measures in and around an infested area to prevent the spread of the pest), and (4)
prevention (it applies phytosanitary and regulatory measures to prevent the introduction or
reintroduction of a pest into a pest-free area). Suppression, eradication, containment, and
prevention programmes provide the same types of direct and indirect benefits. However, in
terms of economic returns and subsequent impact, there are marked differences among the
four control strategies.
The most profitable strategy is prevention. It is always much more cost-effective to
proactively protect a pest-free area from the introduction and establishment of a pest, than
having to “live with” or eradicate it. However, when the target pest is already established in
an area, the options for using the SIT to control the pest are suppression, containment, or
eradication.
The following table reports examples of area-wide insect pest control programmes integrating
the SIT and estimated benefits [18].
Insect Species/Objective Country Benefit
Mediterranean fruit fly
Suppression
Israel Estimated annual net-benefit of US $25 million in exports of
vegetables from the Arava Valley
An estimated benefit to cost ratio of 10 to 1.
Source: Cayol et al 2004
Mediterranean fruit fly
Suppression
South Africa An estimated annual net-benefit of US $ 370,000 in: savings in
table grape rejections during the certification process and in
chemical sprays
An estimated benefit to cost ratio of 2.8 to 1.
Source: IAEA 2002
Oriental fruit fly
Suppression
Thailand An estimated annual net-benefit of US $ 1.3 million in mango
sold in domestic and export markets that discriminate for fruit
fly and residue levels.

18
An estimated benefit to cost ratio of 7 to 1
Source: Sutantawong et al 2005
Mediterranean fruit fly
Eradication
Chile Estimated annual net-benefit of US $ 1,600 million in
horticultural exports.
Estimated benefit to cost ratio of 400 to 1.
Source: MAG-SAG 1995
Lindquist and Enkerlin 2002
Mediterranean fruit fly
Eradication
Mexico Estimated annual net-benefit of US $1,788 in protection of
Mexico‟s horticulture industry (only potential production and
market loss)
An estimated benefit to cost ratio of 100 to 1.
Source: Gutierrez 1976, Reyes et al. 1991
New World screwworm
Eradication
Lybia Annual net-benefit for Libya alone of US $18.9 million
equivalent to an estimated benefit to cost ratio of 10 to 1.
A net-benefit of US $ 300 million for North Africa equivalent to
a benefit to cost ratio of 50 to 1
Source: FAO 1992
Tsetse (G. austeni)
Eradication
Tanzania
(Zanzibar)
Farms raising indigenous cattle: 31% in 1985 and 94% in 2002
Average number of indigenous cattle per farm: 2.2 in 1999 and
5.5 in 2002
Farms with improved cattle breeds: 2% in 1985 and 24% in
2002
Milk yield: 1 liter/cow/day in 1985 to 2.5 liters/cow/day in 2002
Production of beef: 7% increase 1999 and 2001
Source: IAEA 2003
Mediterranean fruit fly
Prevention
USA
(California)
Estimated annual net-benefit of US $1,300 to 1,900 in:
protection of horticultural industry from yield loss, savings in
insecticide use, export markets and annual quarantine
compliance cost
An estimated benefit to cost ratio of 100-146 to 1.
Source: CDFA 2002
Tthe benefits generated by programmes that use the SIT to control fruit fly pests of economic
significant have been recently reviewed in detail by the Joint FAO/IAEA Division of Nuclear
Techniques In Food and Agriculture [19]. Direct beneficiaries of these programmes are the
producers and traders of horticultural products. However benefits impact the whole food chain
system from farmers to consumers, passing through all the intermediate links of packing,
shipping, distributing to wholesale and retail markets, and selling. In addition, the benefits
branch out to other related businesses, such as suppliers of raw materials and some other
services.
Inefficient pest control practices, or no control at all, result in direct and indirect losses from
fruit flies that translate into direct and indirect benefits when using more effective alternative
control methods such as the SIT. For example, if direct fruit fly damage would normally cause
a 25% loss in fruit yield, the area-wide application of an improved technology that reduces
damage by 80% would lead to a direct benefit of a 20% increase in yield. Another example is
the indirect damage from secondary pest outbreaks caused by killing natural enemies with
regular insecticide “cover” sprays. If an effective and environment-friendly control
technology is used, the amount of insecticide applied is reduced and more natural enemies

19
survive to suppress secondary pest populations; in this situation a 10% indirect loss would
become a 10% indirect benefit. The benefits generated by programmes that control fruit flies
with an “integrated SIT approach” will be determined and shaped by some obvious factors:
the characteristics of the pest problem, and the programme objectives and scope set by the
participating organizations and stakeholders. There are other not-so-obvious factors that will
influence the benefits: the type of organizational structure used to execute the programme, the
level of participation of the main stakeholders, and the strategic approach selected to achieve
programme objectives.
The direct benefits commonly used to measure the impact of programmes integrating the SIT
are:
Increase in fruit yield and quality through reduced damage
Reduction in production costs through a more cost-effective control method.
The indirect benefits commonly used to measure the impact of programmes integrating the
SIT are:
Increase in fruit and vegetable export volumes, and market retention or
diversification, through effective control of quarantine pests
Increase in export volumes through reduced rejections of commodities which do not
comply with the insecticide residue levels
Increase in fruit yield through reduced secondary pest outbreaks
Savings in medical costs, and occasionally deaths, through reduced exposure to
insecticides, and also in legal costs arising from damage to private or public property as
a result of insecticide misuse
Greater protection of beehives resulting in increased fruit yield through increased
crop pollination
New jobs created in the horticulture industry and related industries
Better human nutrition due to a per capita increase in fresh-fruit intake
Savings in public health and environmental costs through reduced insecticide residues
in fruit, water reservoirs, and soil.
Moreover, one of the unique features of the integrated application of the SIT is that, since its
application is area-wide, the benefits spread beyond commercial fruit and vegetable producers
to backyard gardens and subsistence farms in poor rural areas. The indirect benefits are very
difficult to assess, and in most cases have been accounted for only qualitatively. Therefore the
impact of programmes integrating the SIT has focused mostly on the direct benefits.
Nevertheless attempts have been made to quantify some indirect benefits using ad hoc
methodologies .
The overall conclusions of these studies was that the benefit/cost ratio achieved in some major
fruit fly programmes integrating the SIT is high, ranging from 2.8 to 400, clearly showing that
the SIT technology, when properly integrated with other methods and applied on an area-wide
basis, is economically feasible. Even when the types of benefits accrued from these
programmes were similar, the economic returns varied widely, even among programmes with
common fruit fly pest problems, similar objectives and strategic approaches. This was due to
the different intrinsic characteristics of each programme, e.g. the magnitude of the pest
damage, size and value of the crops being protected, commitment of the main stakeholders,
resources available to execute the programme, and efficiency in programme management.

20
In general the high economic returns from some fruit fly programmes that integrate the SIT
were possible primarily because of the environment-friendly and area-wide nature of the SIT
technology. This is a major advantage of the SIT technology when compared with more
conventional pest control methods such as insecticides. The worldwide benefit/cost ratio of
insecticides has been estimated at 4:1, if indirect costs are excluded, and only a 2:1 ratio if
indirect environmental and public health costs are included.
The reader will find detailed descriptions of the economic and social benefits of the
programme conducted in USA, Chile, Japan, South Africa, Mexico and Guatemala in the
reference [19].
As an example the results of a study on the economic and social benefits accrued from a fruit
fly propramme conducted in Mexico is reported in Appendix 3.
III.2.c Food and Agriculture: radiation-induced mutations for crop improvement
The global impact of mutation-derived varieties on food production and quality enhancement
and the economic contribution of the selected mutant varieties of cereals, grain legumes, oil
and industrial seed crops and fruits, has been reviewed in reference [20]. Some information on
the economic impact of mutant varieties is reported in Appendix 4. An extended summary of
the value of the mutant varieties is reported in Appendix 5. Below some general
considerations, abstracted from reference [20] are reported.
In several mutation-derived varieties, the changed traits have resulted in synergistic effect on
increasing the yield and quality of the crop, improving agronomic inputs, crop rotation, and
consumer acceptance. In contrast to the currently protected plant varieties or germplasm and
increasing restrictions on their use, the induced mutants have been freely available for plant
breeding. Many radiation-induced mutations have made transnational impact on increasing
yield and quality of several seed propagated crops. Induced mutations had also an important
role in creating crop varieties with traits such as modified oil, protein and starch quality,
enhanced uptake of specific metals, deeper rooting system, and resistance to drought, diseases
and salinity as a major component of the environmentally sustainable agriculture.
During the past seventy years, more than 2,252 mutant varieties have been officially released .
Of these, 60% were released from 1985 onwards. Most mutant varieties were released in
China (26.8%), India (11.5%), USSR and Russia (9.3%), the Netherlands (7.8%), USA
(5.7%) and Japan (5.3%). Many induced mutants were released directly as new varieties;
others were used as parents to derive new varieties. Mutation induction with radiation was the
most frequently used method to develop direct mutant varieties (89%). The use of chemical
mutagens was relatively infrequent. Gamma rays were employed to develop 64% of the
radiation-induced mutant varieties, followed by X-rays (22%). Of the 2,252 accessions, 75%
are in 188 crops and 25% in ornamental and decorative plants. Most crop mutant varieties
(1,603) were released in seed-propagated species, which include 1,072 cereals and 311
legumes.
The prime strategy in mutation-based breeding has been to upgrade the well-adapted plant
varieties by altering one or two major traits. These include characters such as plant height,
maturity, seed shattering, and disease resistance, which contribute to increased yield and
quality traits, e.g. modified oil profile and content, malting quality, and size and quality of
starch granules. However, in many cases, the changed traits had a synergistic effect on the
cultivation of the crop, agronomic inputs, crop rotation and utilization. For example, the short
height genotypes in rice, wheat, barley and maize have contributed significantly to increasing
21
grain yield because of their resistance to lodging and high planting density. The short height
trait also allowed the use of relatively high doses of nitrogen application. The early maturity
of some mutants resulted in timely planting of the follow-up crop; for example early maturity
of cotton in Pakistan allowed early planting of the wheat crop, resulting in higher wheat yield.
The induction of thermo-sensitive genic male-sterile mutant in japonica rice, which is
controlled by a single recessive gene, contributed significantly to develop strategies for the
production of hybrid rice varieties. Similar mutants have been induced by gamma rays in
indica rice „26 Zhaizao‟ in China.
The economic value of a new variety was assessed from several parameters. These included:
Area planted to the variety and percentage of the area under the
crop in the region.
Increased yield.
Enhanced quality.
Reduced use of pesticides and fungicides (e.g. in varieties resistant
to diseases and insect pests).
Savings in water (short duration of growth and drought tolerance).
Increased land use through early maturity to facilitate crop rotation.
Improved/intensified cropping systems with changed maturity or
response to photoperiod.
Improved processing quality and value of the products (e.g., oil,
starch, malt, beer and whisky).
Quality preference by the consumer (new flower and foliage colour
in ornamentals, skin and flesh colour in root and tuber crops and
fruit crops, aroma and glutinous nature in rice, and kernel colour in
wheat).
Increased nutritive value, high lysine and vitamins, increased oil-
shelf life, reduced toxins.
Increased yield of essential oils.
Ease of harvest, threshing.
Increase in export earnings.
Reduction in imports.
Leading mutants of high value have been released in 175 crop and plant species, including
many important crops such as rice, wheat, cotton, rapeseed, sun-flower, sesame, grapefruit
and banana. Among these, some have made a major economic impact and include rice
varieties in Australia, China, India, Pakistan and Thailand; cotton in Pakistan, Japanese pear
in Japan, grapefruit in USA; barley varieties in Europe, durum wheat in Italy, sunflower in
USA; sorghum in Mali and wheat varieties in North Western Frontier Province in Pakistan;
groundnut and pulse crops in India, peppermint in USA, and ornamentals in India, the
Netherlands and Germany. The economic contribution of selected mutant varieties is listed in
Appendix 3. This value should not be taken as the absolute contribution of a mutated gene or
of the mutant variety. The increased yield and enhanced quality of a new variety includes
several other components such as its subsequent use for breeding, additional gains from
heterosis in hybrid cultivars, response to increased agronomic inputs, and consumer
preference. Hence, the overall economic value of a mutated gene in absolute terms cannot be
determined as genes function only in concert with all the other genes in a genome to alter the
yield and quality of the end product.

22
The survey evidenced that the plant cultivars derived from induced mutations have
contributed billions of dollars to the economies of many countries. The main beneficiaries
have been not only developing countries (e.g. India, China, and Pakistan), but also North
American and European countries. Whereas the emphasis in the developing countries has
been on food crops such as rice, North America and Europe have used mutants to improve
crops for the processing industry e.g., edible oils from sunflower, rapeseed, and linseed, juice
quality of grapefruit, essential oil from mint, and barley for brewing and malting industry.
III.2.d Food and Agriculture: cost comparison between nitrogen fertilizers and
symbiotic nitrogen fixation by grain legumes
A great challenge lies in devising more sustainable farming systems without compromising
food production levels and food security. World wide, the environmental factors that most
severely restrict plant growth are the availability of water and nitrogen. The challenges in
developing countries are to find ways of meeting this additional nitrogen demand without
concomitant degrading natural productivity. Widespread adoption of biological nitrogen
fixation (BNF) would contribute to this goal. BNF, together with adequate N management in
the ecosystem, appears to be the most promising alternative to increasing the use of inorganic
fertiliser nitrogen. BNF technologies represent economic, sustainable and environmentally
friendly means of ensuring the nitrogen requirement of an agro-ecosystem.
Isotope-based methods offer the most sensitive measures of total nitrogen fixation over the
growth of legumes crops. Direct exposure of plants to N-15 with enrichment greater than the
natural abundance of the isotope in air (0.3663%) is applied in controlled environments. In the
field, methods involving the growth of both a nitrogen fixing and a non-fixing plant in soil
that has been enriched with the isotope N-15 by the addition of labelled organic or inorganic
fertilizers, are instead used.
In reference [21] the value of BNF by grain legumes was investigated and compared to the
cost of nitrogen fertilizer used in developing countries. The data reported in Appendix 6
indicate that major grain legumes fix approximately 11,1 million metric tons of nitrogen per
annum in developing countries. If this N was supplied by inorganic fertiliser one would have
to apply at least double that amount to achieve the same yields. This would cost
approximately 6,7 billion US$. As the eight major grain legumes grown in developing
countries contribute 30 - 40% of the annual N requirement, the contribution of BNF is of
great economic and environmental importance.
III.3. Protection of the Marine and Terrestrial Environment: remediation strategies for
sustainable development of contaminated areas
After the Chernobyl Nuclear Power Plant (ChNPP) accident large parts of the territories of
Belarus, Ukraine and Russia covered by natural and artificial forests were contaminated with
long-lived radionuclides, especially 137
Cs. To protect people against exposure associated with
forest contamination in the most affected regions, countermeasures have been developed and
recommended for the forest management.
In reference [22] a decision making framework to optimise forest countermeasures in the long
term was presented. The objective of the study was to develop a flexible approach to optimise
forest countermeasures combining site specific monitoring data on contaminated forests,
radioecological models, cost-effectiveness analysis and a multi-attribute-utility analysis
23
(MAUA) within one decision making framework. The approach was based on the analysis of
the main exposure pathways and application of radiological, socio-economical and ecological
criteria for the selection of the optimal countermeasures strategies.
The results of this approach were then applied to a specific region, namely the Novozybkov
district in the Bryansk region of the Russian Federation. The results obtained led to the
conclusion that application of forest countermeasures will be necessary for several decades.
Restrictive options as well as soil based forest countermeasures were judged not applicable in
the long term and more attention was recommended to the optimisation of forest and forest
products usage. The optimal forest countermeasures were found to be: “limitation on
mushrooms and berries collections to the species with low accumulation of radionuclides”
and “mushrooms processing before consumption” for the whole population, and combined
“application of Prussian Blue” and “limitation of tree harvesting to the sites with low doses”
for the critical population group.
An extended summary of this study is reported in Appendix 7.
III.4 Human Health
Radiation and isotopes are used in medicine for the prevention, diagnosis and treatment of
health problems. Nuclear and radiation techniques are often the sole means of diagnosis and
treatment. However, due to their effectiveness, they are also widely used in a large number of
other medical procedures as a complement to non-nuclear techniques. Worldwide, more than
two million people work in the field of medical radiation.
Below examples of applications radiation and isotopes in medicine containing elements
relevant to their social aspects are reported [23]
III.4.a Human Health - Nuclear Medicine : sentinel lymph node detection in breast
cancer [23]
Breast cancer is the most common type of cancer in women. The survival rate is strictly
related to the stage of the disease at the time of its detection. Screening programmes are
therefore being increasingly implemented in many health care systems to improve survival.
Until a few years ago, mastectomy and/or quadrantectomy was usually associated with
removal of limphnodes at the axilla level (axillary limph node dissection, ALND) which was
the standard surgical approach, not only as a therapeutic procedure but also as an important
means of staging disease dissemination. With the introduction of screening programmes,
breast cancer is increasingly being detected at a very early stage and the number of negative
axillary dissections is becoming unacceptably high, because the ALND procedure is often
associated with a number of complications, e.g. pain, paraesthesia, infection, lymphoedema
and impaired shoulder function.
The sentinel lymph node detection (SNLD) procedure is based upon the concept that
metastatic dissemination through lymph proceeds in an orderly fashion: the tumor drains
directly to one or few first lymph nodes, called sentinel node(s), from which further
connections with so-called second echelon nodes exist. If a suitable radioactive tracer is
injected in the tumor area, it will be drained through the same pathway of limph and then
accumulate in the first node(s) which drain that particular area. Radioactivity at the first

24
(sentinel) node level can be detected through a dedicated small piece of equipment (gamma
probe) in the operating theatre and the node removed and sent to hystopathology. If negative,
ALND could be avoided. Therefore, when properly applied, SNLD can provide accurate
staging, minimizing the number of unnecessary ALNDs and decreasing the risk of avoidable
morbidity. This technique was investigated through an IAEA Coordinated Research Project,
“Radiopharmaceutical imaging to predict and evaluate the response of breast cancer to
neoadjuvant chemotherapy” and disseminated through several training courses attended by
professionals from several countries (Bangladesh, 2000; Bulgaria, 2000; Poland, 2000;
Pakistan, 2001; Italy, 2001; Lithuania, 2003; Namibia, 2003; India, 2003).
III.4.b Human Health - Nuclear Medicine: early diagnosis of helicobacter pylori
infection [23]
Helicobacter pylori infection is the most common infection worldwide. Its prevalence is very
high in developing countries where about 50–60% of children under 5 years of age are
infected. Infection is typically acquired in childhood and persists throughout life, causing
chronic gastritis, a risk factor for gastric atrophy and gastric cancer. An important
consequence of chronic Helicobacter pylori gastritis and gastric atrophy is low gastric output,
resulting in an “impaired gastric barrier” which is associated with increased susceptibility to
enteric infections, a major public health concern linked to diarrhoea, undernutrition and
growth failure in children in developing countries. In addition, Helicobacter pylori infection
has been associated with anaemia and iron deficiency, although the nature of the interactions
has not been established. Early diagnosis and effective treatment are essential to combat the
consequences of this major public health problem.
A non-invasive diagnostic test based on the administration of 13
C-labeled urea, followed by
collection of expired breath (Urea Breath Test, UBT), is the “golden standard” technique to
diagnose Helicobacter pylori infection. The methodology is highly sensitive and specific to
the infection. Furthermore, as the methodology is based on the administration of a stable
(non-radioactive) isotope, the test can be used in vulnerable population groups such as
children.
The IAEA was and still is actively involved in the training and transfer of technology to
several countries in the use of UBT, in particular in Latin America. A regional Technical
Cooperation project started in 2002 with twelve participating countries. Three laboratories in
the region are now fully equipped to provide analytical services to countries participating in
the project, and a training course for 26 junior scientists on the application of UBT was
organized in Mexico. In addition, training courses and seminars on UBT have been organized
in Pakistan, Senegal and Thailand, and a manual has been prepared on the use of UBT.
III.4.c Human Health - Applied Radiation Biology and Radiotherapy: treatment
protocol for radiotherapy of head and neck cancer [23]
Cancer of the head-and-neck region is a common and serious public health problem in
developing countries. It affects over half a million patients each year, and this number is
expected to rise to over one million/year during the next 20 years. Most patients die from
uncontrolled cancer at the primary site or in the neck. Radiotherapy is the mainstay of its
treatment but improvements in the rate of tumor control are needed.
The addition of chemotherapy to radiotherapy as well as the delivery of hyperfractionated
radiotherapy twice a day (instead of the conventional once/day) has proved to improve the
tumor control. Both these strategies, however, expend substantial additional resources. When

25
a twice per day treatment is used, only half as many patients can be treated with the often
scarce radiotherapy equipment present in many developing countries. Moreover, the addition
of chemotherapy imposes additional costs for the drugs, hospitalization, antibiotics,
laboratory tests, etc., in addition to requiring more personnel.
The IAEA has conducted a multi-institutional prospective randomized trial thorough a
Coordinated Research Project that compared the standard five treatments per week versus an
accelerated fractionation regimen consisting of six treatments/week, while maintaining the
same total dose and number of fractions. This required no additional machines or drugs. The
hypothesis was that the reduction of tumor repopulation occurring during the weekends would
improve the tumor control. The statistical design of this study required 900 patients. The
preliminary analysis of the data suggested a definite advantage to the 6-treatments-per-week
arm. The magnitude of the improvement appears similar to that observed with the addition of
chemotherapy. Toxicity was relatively mild and the quality control was good. If the advantage
is confirmed in the final analysis, scheduled for later in 2005, it will mean not only a clinical
advantage in terms of disease control but a very significant advantage compared with the
socio-economic burden associated with combined chemo-radiotherapy or hyperfractionated
radiotherapy regimens.
III.4.d Human Health - Dosimetry and Medical Radiation Physics: radiotherapy
machines and dosimetric services [23]
IAEA has been assisting developing countries in increasing their the capacity to diagnose and
treat patients by enhancing access to equipment for radiation medicine, transferring
infrastructural technology and promoting education aimed at improving the ability to deliver
radiation medicine services at a high level of quality. During the last decade the Agency
provided 24 cobalt therapy machines to 7 developing counties in Africa, Asia, Latin America
and Europe. Since each machine can treat about 500 patients per year, this programme
represents a cumulated increase in annual treatment capacity of 12,000 patients.
When equipment was supplied, the technical support involved assistance in facility design,
equipment specification and commissioning, and the establishment of suitable training venues
to achieve sustainability of the technology. As a result of this assistance patients who without
therapy could have rapidly died of cancer had the possibility to be treated and survive. In
addition, patients with widely disseminated disease received radiotherapy to relieve pain and
improve their quality of life.
Many IAEA‟s projects were also directed at transferring technology to support the
infrastructure needed to deliver high quality services. An instrument calibration service was
offered to enable laboratories and hospitals to measure radiation dose. In addit ion, a dosimetry
0.5
0.6
0.7
0.8
0.9
1.0
1990 1992 1994 1996 1998 2000 2002 2004
Fra
cti
on
of
resu
lts w
ith
in 5
% l
imit
Year
after follow-up
1st check

26
verification service to audit the ability of Member States to deliver the dose properly under
reference conditions, was provided. As a result of these two services and the publication of
dosimetry codes of practice, the ability of hospitals and laboratories in dosimetry improved
dramatically. This is indicated in the figure below, showing how the fraction of institutions
that can establish the radiation dose accurately, namely within a tolerance of 5%, increased in
the period1990-2004.
Prior to 1990 only about 60% of the facilities tested were able to meet the 5% criterion,
whereas in 2004 about 95% were in compliance. This indicates that the capability in accurate
dosimetry improved by almost a factor of two.
The data are unequivocal in demonstrating the improvement in the capability in dosimetry,
Nevertheless, other issues have to be examined in order to assess the socio-economic impact
of these projects, such as:
The ability to perform dosimetry under reference conditions. This is essential but
not sufficient to ensure that patients are treated properly. However, it has been
observed that generally the ability to properly measure the dose under reference
conditions (i.e., to perform accurate dosimetry) is strongly correlated with the ability
of a clinic to deliver accurate dose to cancer patients.
The dosimetric accuracy. This is particularly important for those patients being
treated curatively. Since cancer patients in developing countries tend to be treated at
a stage when their disease is far advanced, it can be estimated that only 25% of them
are treated with curative intent. Given that about 800,000 people are treated per
year, this would mean that about 200,000 patients per year can benefit from accurate
dosimetry.
Understanding the relevance of a dose error exceeding 5%. This is the action level
in the dosimetry auditing programme. A report published by the International
Commission on Radiation Protection in 2000 (Report 86) indicates that dose errors
of 5% to 25% represent an increase in the probability of an unacceptable outcome of
radiotherapy treatment due to an increased rate of tumour complications (from an
over-dosage) or failure to achieve tumour control (from an under-dosage). The
actual impact on a particular patient depend on many factors including the disease
site and type of tissue irradiated, the stage of disease, the volume irradiated and the
fractionation scheme used.
By assuming that the assumptions implied in the three points listed above hold, it can be
estimated that these IAEA‟s projects have had a positive impact on the lives of more than
100,000 cancer patients per year.

27
Appendix 1
Environmental and social indicators related to Agenda 21 issues, the United Nations Millennium
Declaration, and the labour market (as analysed by the United Nations International Labour
Organization)
Environmental and social indicators related to Agenda 21 Issues (Clusters) [http://unstats.un.org/unsd/environment/indicators.htm] have been developed for example by UNSD (United
Nations Statistical Division) and divided into categories (Agenda 21) such as (i)socio-economic activities,
events,(ii) impacts and effects, (iii) response to impacts,(iv)inventories, stocks, background conditions. As
example we can quote in
Cluster Economic Issues: (category i) real GDP per capita growth rate, production and consumption patterns;
(category ii) capital accumulation; (category iii) environmental protection expenditures as % of GDP,
environmental taxes and subsidies as % of government revenues; (category iv) produced capital stock.
Cluster Social/Demographic Issues: (category i) population growth rate; population density; calories supplied
per capita (category ii) % of urban population exposed to sulphur oxide, particulate, ozone, CO and Pb, infant
mortality rate, incidence of environmentally related diseases; (category iv) population living in absolute poverty,
adult literacy, life expectancy at birth, females per 100 males in secondary schools.
Cluster Air Climate: (category i) emission of carbon dioxide, sulphur oxide NOx; (category ii) ambient
concentrations of carbon dioxide, sulphur oxide NOx , suspended particulate in urban areas; (category iii)
expenditure on air pollution abatement, reduction in consumption of substances and emissions, (category iv)
weather and climate conditions.
Cluster Land/Soil : (category i) land usage change, use of fertilizers, use of agriculture pesticides; (category ii)
area affected by soil erosion. Land affected by desertification; area affected by salinization and water logging;
(category iii) protected land as % of total land area; (category iv) arable land per capita.
Cluster Fresh Water Resources: (category i) industrial, agricultural and municipal discharges, annual
withdrawal of ground and surface water, domestic consumption of water per capita, (category ii) concentration
of Pb, Cd, Hg, and pesticides in water, concentration of faecal coliform, acidification of water; (category iii)
waste water treatment, access to safe drinking water; (category iv) ground water reserves.
Cluster wastes: (category i) municipal waste disposal, generation of hazardous waste; (category ii) area of land
contaminated by toxic wastes; (category iii) expenditure on waste collection and treatment, waste recycling;
Indicators have also been develop fore United Nations Millennium Declaration (Goals and Targets)
[http://millenniumindicators.un.org/unsd/mi/mi_goals.asp].
As examples we can quote:
Goal 1 (Eradicate Extreme Poverty and Hunger),
Target 2 (halve by 2015 the proportion of people who suffer from hunger): prevalence of underweight children
under five years of age, proportion of population below minimum level of dietary energy consumption.
Goal 5 (Improve Maternal Health),
Target 6 (reduce by three quarters by 2015 the maternal mortality ratio)
maternal mortality ratio, proportion of births attended by skilled health personnel.
Goal 7 (Ensure Environmental Sustainability),
Target 9 (integrate the principle of sustainable development into country policies and programmes and reverse
the loss of environmental resources): proportion of land area covered by forest, ratio of area protected to
maintain biological diversity to surface area, carbon dioxide emissions per capita and consumption of ozone
depleting CFC.
Target 10 (halve by 2015 the proportion of people without sustainable access to safe drinking water and
sanitation): proportion of urban and rural population with sustainable access to an improved water source,
proportion of urban and rural population with access to improved sanitation.
Social indicators related to the labour market have been developed by ILO (United Nations International Labour
Organization) and categorised in 20 Tables.
[http://www.ilo.org/public/English/employment/strat/kilm/chartsind.htm] .
As examples we can quote:
Table 1 (Labour Force Participation Rate): labour force participation rates of persons aged 15 and over, female
labour force participation rates by age group;

28
Table 2 (Employment to population ratio); employment to population ratios, employment to population ratios
of males and females by regional groupings.
Table 4 (Employment by Sector): employment distribution by sector, employment in manufacturing.
Table 8 (Unemployment): total unemployment rates, % change in total unemployment rates.
Table 15 (manufacturing Wage Indices): % change in real wages for selected economies, real manufacturing
wage indices for selected developed countries, selected transition economies, selected sub-Saharan economies.
Table 17 (Hourly Compensation Costs): relatively hourly compensation cost, proportion of non-wage costs to
total compensation costs.
Table 19 (labour Market Flows): flows form unemployment to employment as p% of total employment inflows,
reintegration rates.
Table 20 (Poverty and Income Distribution): % point change in proportion of population living below the
national poverty line, GDP per capita at purchasing power parity by regional groups.
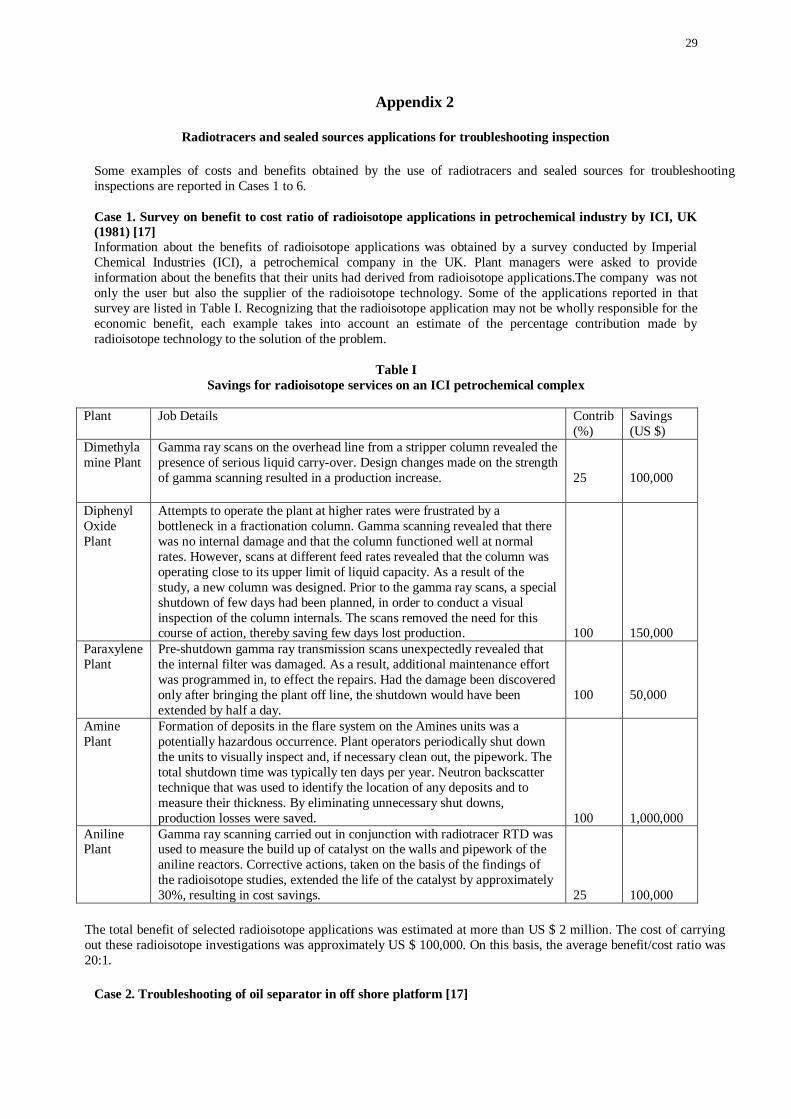
29
Appendix 2
Radiotracers and sealed sources applications for troubleshooting inspection
Some examples of costs and benefits obtained by the use of radiotracers and sealed sources for troubleshooting
inspections are reported in Cases 1 to 6.
Case 1. Survey on benefit to cost ratio of radioisotope applications in petrochemical industry by ICI, UK
(1981) [17]
Information about the benefits of radioisotope applications was obtained by a survey conducted by Imperial
Chemical Industries (ICI), a petrochemical company in the UK. Plant managers were asked to provide
information about the benefits that their units had derived from radioisotope applications.The company was not
only the user but also the supplier of the radioisotope technology. Some of the applications reported in that
survey are listed in Table I. Recognizing that the radioisotope application may not be wholly responsible for the
economic benefit, each example takes into account an estimate of the percentage contribution made by
radioisotope technology to the solution of the problem.
Table I
Savings for radioisotope services on an ICI petrochemical complex
Plant Job Details Contrib
(%)
Savings
(US $)
Dimethyla
mine Plant
Gamma ray scans on the overhead line from a stripper column revealed the
presence of serious liquid carry-over. Design changes made on the strength
of gamma scanning resulted in a production increase.
25
100,000
Diphenyl
Oxide
Plant
Attempts to operate the plant at higher rates were frustrated by a
bottleneck in a fractionation column. Gamma scanning revealed that there
was no internal damage and that the column functioned well at normal
rates. However, scans at different feed rates revealed that the column was
operating close to its upper limit of liquid capacity. As a result of the
study, a new column was designed. Prior to the gamma ray scans, a special
shutdown of few days had been planned, in order to conduct a visual
inspection of the column internals. The scans removed the need for this course of action, thereby saving few days lost production.
100
150,000
Paraxylene
Plant
Pre-shutdown gamma ray transmission scans unexpectedly revealed that
the internal filter was damaged. As a result, additional maintenance effort
was programmed in, to effect the repairs. Had the damage been discovered
only after bringing the plant off line, the shutdown would have been
extended by half a day.
100
50,000
Amine
Plant
Formation of deposits in the flare system on the Amines units was a
potentially hazardous occurrence. Plant operators periodically shut down
the units to visually inspect and, if necessary clean out, the pipework. The
total shutdown time was typically ten days per year. Neutron backscatter
technique that was used to identify the location of any deposits and to
measure their thickness. By eliminating unnecessary shut downs,
production losses were saved.
100
1,000,000
Aniline Plant
Gamma ray scanning carried out in conjunction with radiotracer RTD was used to measure the build up of catalyst on the walls and pipework of the
aniline reactors. Corrective actions, taken on the basis of the findings of
the radioisotope studies, extended the life of the catalyst by approximately
30%, resulting in cost savings.
25
100,000
The total benefit of selected radioisotope applications was estimated at more than US $ 2 million. The cost of carrying
out these radioisotope investigations was approximately US $ 100,000. On this basis, the average benefit/cost ratio was
20:1.
Case 2. Troubleshooting of oil separator in off shore platform [17]

30
The Engineering Group at the Research Centre of a major oil company was asked to investigate the performance
of a malfunctioning separation train on an oil production platform in the Norwegian Sector of the North Sea [1].
The separators were unable to dehydrate the oil to the level required for export through their pipeline. The effect
of this was to restrict production to 70 000 barrels/day rather than the targeted 80 000 barrels/day. Attempts had been made to improve matters by injecting various chemical agents, but the problem still persisted. ICI Synetix,
a contract supplier of radioisotope applications, then conducted a series of on-line investigations of the operating
parameters of the separators. Firstly, neutron backscatter scanning was used to investigate the oil/water interface.
The scans showed that the interface was too high, thereby allowing water to exit the vessel with the oil phase.
However, this alone was not deemed to be sufficient to fully account for the poor performance of the system.
Radiotracer studies of the residence times of the organic and the aqueous phase were therefore carried out using
a standard impulse injection measuring technique. The results showed that the mean residence times of both the oil and the water were approximately 60 seconds, as opposed to the four-minute residence times for which the
vessels had been designed. The problem was solved by installing baffles in the lower section of the separator to
increase the mean residence time. This made it possible to increase production to the target 80,000 barrels/day
and subsequently, with further modifications, to 100,000 barrels/day. With crude oil costing approximately US $
25 per barrel, the resulting benefit was of the order of US$ hundreds of million a year, with a benefit-cost ratio of
about 4000:1.
Case 3. Tracers in oil fields [T. Bjornstad, IAEA Technical Meeting Report on R&D in Radiotracer and NCS technologies, June 2002] Natural production mechanisms, or primary production, normally extract from the reservoir about 25% of the
original oil in place. This means that 75% of the existing oil remains in the pores and fissures of the rocks . The
enhancement of the oil production from the investigation of the secondary recovery processes by radiotracers is estimated to 10-15 % of the residual oil for each oil field. For example a reservoir in Colombia was naturally and
heavily compartmentalised. Information about fluid flow across faults, and therefore the effect of water injection,
could only be studied by the use of tracers. Several wells were uniquely labelled, and the exercise showed that there
was an unexpectedly good communication across a fault that originally was a suspected barrier. The cost of two
additional wells (approximately US $ 10-15 million) needed to ensure sufficiently good volumetric sweep in the
compartment if the fault in question had been sealing, was saved. The whole tracer operation was carried out to a
cost of approximately US$150 000, giving a benefit-to-cost ratio of between 70 and 100.
Case 4. TLA technique for wear and corrosion measurement of car parts [A. Delvigne et al., The comparison with
gravimetric technique, for wear, cavitation rates and lubrication, Mercedes, GM and Toyota use of TLA, Materials World, April 1995] Thin layer activation (TLA) technique is very accurate and competitive for monitoring wear and corrosion in
industry. Some costs and benefits for TLA application in monitoring wear of car parts is presented below
TLA application to car parts
Measurement Method Gravimetric TLA
accuracy of measurement 10 mg <10mg
measurement time, 1 point >100 hrs <10 hrs
number of points per measurement 10 10
total duration of measurements 1000 hrs 100 hrs
interventions for measurement Dismantle none
installation of measurement equipment None Prior to measurement
cost of isotopic labelling None $ 6000
cost of test bench (US$125/hr) US$125 000 US$12 500
activation technique (US$125/hr) None US$12 500
cost for 1 test configuration US$125 000 US$31 000
cost for 5 test configurations US$625 000 US$155 000
Cost saving US$ 470 000
Case 5. Radioisotope applications for troubleshooting in South Africa [A. Hills, Guidebook on radiotracer and sealed
source applications in industry. Case studies from South Africa. South Africa, 1998.]
Some economic benefits arising from applications of radioisotope technology in this country are reported below. The cost of a typical heat exchanger leak detection test is nearly US$ 5000. The benefit is estimated
around US$ 200,000, with a cost to benefit ratio of 1: 40.
In gold leaching process the RTD measurement provides important parameters to optimize the
process. The cost of tracer experiment is nearly US$5,000 and the profit is estimated to around US$
0.5 million. This means a cost to benefit ratio of 1:100.

31
Flow meter calibration is needed in many processing lines. The typical tracer cost test is around
US$3,000 for liquid phase and US$5,000 for gas phase. Savings in material and energy can be
estimated at US $ 60,000 for liquid and at US $ 100,000 for gas lines. The cost to benefit ratio
estimation is 1: 20.
Mixing and blending is of importance in many industrial processes. The tracer test cost amounts to
US $ 3,000. The benefit in saved energy and increased production can be estimated to US $ 100,000
with a cost benefit ration of 1:30.
A typical column gamma scanning costs around US $ 3,000 bringing saving of US $ 120,000, with a
cost benefit ratio of 1: 40.
Case 6. Gamma scanning for troubleshooting and predictive maintenance in Malaysia [J.B.Abdullah, Gamma
Scanning for Troubleshooting, Optimisation and Predictive Maintenance of Distillation Columns in Petroleum Refineries and Chemical
Plants, Proceedings of the International Nuclear Conference 2002, Kuala Lumpur, Malaysia, 2002] A petroleum company in Negeri Sembilan had been experiencing a poor specification of kerosene product due to
separation problems in its main fractionation column. It was suspected that the column malfunctions such as tray
flooding, tray dislocation or vapour entrainment were the possible causes of the problem. On-line gamma ray
scans were conducted when the column was performing under normal conditions and when it was under upset
conditions. The scanning results proved that one of the downcomer of bubble-cap trays was partially blocked.
The cost of the service was US $5,000 and the benefit was estimated around US $ 200,000. Some examples of costs and benefits obtained by the use of nucleonic gauges are reported in Cases 7 to 11.
Case 7. Off-line nucleonic gauge for analyzing copper and zinc concentrations [TC project BGD/8/015]
The X- ray fluorescence technique was used to measure copper and zinc concentration in the ore processing line.
The measurements were performed off line taking samples at time intervals. The benefit in cooper and zinc
concentrates coming from optimal monitoring of the concentrates was estimated for one year production time.
The cost of an off-line XRF mineral ore concentration nucleonic gauge is in the range US$ 100.000 to 300.000. The estimated benefit for copper concentrate, calculated as the difference in incomes with and without the
nucleonic gauge, was US $ 250,000 for copper and US $ 180,000 for Zinc.
For iron the annual saving introduced by using on-line a similar nucleonic guge (X- ray fluorescence) to measure
iron ore concentration before entering a grinding mill was estimated at US $ 400,000. The application permitted
to maintain the iron feed rate constant by changing the conveyor belt velocity in such a way to compensate for
variables iron concentrations in the ore.
Case 8. Nucleonic gauge for monitoring the thickness of paper sheets in Bangladesh [TC project
BGD/8/015] A nucleonic control system was used for monitoring the thickness of paper sheets. A medium size
paper mill produced paper with thickness between 97 and 117 μm with a mean value of 107 μm . After installing
the nucleonic gauge the tolerance was reduced to 6 μm and the mean value of the thickness was decreased to
100 μm. This permitted to save 7% of raw material. The investment cost was about US $ 150,000 and the annual
saving up to US $ 150,000.
Case 9. Spectrometric borehole logging gamma technique for coal analysis [J. Charbucinski, Nucleonic gauges in
Australian mining and exploration industries. IAEA, AGM Report, 5-8 May 1998, Vienna.]
CSIRO Exploration and Mining in Australia developed an in-situ spectrometric borehole logging technology,
known as SIROLOG, for routine applications in mining deposits of coal and iron ore [8, 23]. Because of the close correlation between the SIROLOG estimates and the laboratory-analysed ash and Fe, the need for cored
hole drilling and laboratory sample analysis was significantly reduced. Before 1993, up to 50% of all exploration
holes drilled were cored holes. Following the introduction of SIROLOG at the Callide Coalfields in 1993, the
number of cored holes drilled for coal quality was reduced by 90%.
Out of 150 exploration holes drilled each year, 60 were replaced by chipped rotary holes. As the average depth
of an exploration hole was 120 metres, and the drilling costs are around A$ 130 per metre (conventional
technology) and A$ 25 per metre (rotary chip and SIROLOG-logged hole), the following cost benfits were
quantified:
Costs of drilling 60 cored holes of 120m depth at A$ 130 per metre: A$ 936,000
Costs of drilling 60 chipped holes (the same depth) at $25 per metre: A$ 180,000
Benefit generated from savings on drilling costs: ~ A$ 750,000
Costs of assaying 60 cored holes at ~A$1,800 per hole: A$ 108, 000
Costs of geophysical logging 60 chipped holes at ~A$110: A$ 7,260
Benefit generated from savings on assaying costs: ~A$ 100,000

32
The total saving of ~A$ 850,000 per year is significant, when compared with the cost of acquiring the SIROLOG
logging system (A$ 170,000).
Case 10. On-line Coal ash analysers [J. Charbucinski, Nucleonic gauges in Australian mining and exploration industries. IAEA,
AGM Report, 5-8 May 1998, Vienna.] The Coalscan nucleonic gauge, based on a dual-energy gamma ray transmission manufactured in Australia, is
used for on-line coal quality analysis in a wide range of applications including mine grade control, raw coal
monitoring, coal sorting, coal blending, stockpile management, power station feed monitoring and blending, and
ash monitoring at coal shipping ports. A single scintillation detector measures intensities of collinear beams
originated from Cs-137 and Am-241 sources. This system is most widely used for the on-line (on-belt)
monitoring of the ash content of coal. The absorption of the lower energy gamma rays (Am-241) depends on ash content, while absorption of higher energy gamma rays (Cs-137) depends almost entirely on the mass per unit
area of coal in the beam. Ash content is determined by combining measurements of the two beams. The
determination is independent of both the bed thickness and the mass of the coal. The main advantages of the
gauge are simplicity, direct on-belt measurement and relatively low cost. The most important disadvantage of
this technique is its relatively high dependence on variable composition of ash (high Fe and Ca content). An
economic evaluation, by an independent consulting company, of benefits to the Australian mining industry
resulting from use of Coalscan nucleonic gauges assessed the costs and benefits over the period 1973 to 1993,
allowing a maximum five-year benefit from any one installation. The total benefit to Australia from productivity
gains in the coal industry was estimated to be US $130 million (1988 dollars).
Case 11. Density gauges in sugar production plants..[J. Wisnieski et al., Effectiveness of Implementation of
Isotopic Density Gauges in Sugar Plants. Internal Reports of Institute of Nuclear Research, no 45/B3E/79, July
1979 (in Polish)].
85 density gauges were installed in 17 sugar plants in Poland. An independent group carried out a study of the
effectiveness of this application and concluded that the ratio of annual net savings to the investment cost was 2:1,
indicating that the installation of one gauge could be paid back in half a year

33
Appendix 3
Selected example: Fruit Fly Suppression/Eradication/Prevention Programme in Mexico
[W. R. Enkerlin, Impact of Fruit Fly Control Programmes Using the Sterile Insect Technique, in V. A. Dyck, J. Hendricks and A. S.
Robinson editors, The Sterile technique principles and Practice In Area-wide Integarated Pest Management, Springer Publishing, The
Netherlands. 2005 (in press)].
Problem Definition.
Mexico has more than 1 million hectares planted to fruit crops, with an estimated annual production value of more
than USD 2.5 billion . The fruit industry is significantly hindered by four fruit fly species: Mexican fruit fly, West
Indian fruit fly, guava fruit fly Anastrepha striata Schiner, and sapote fruit fly Anastrepha serpentina . The annual
direct damage that these fruit flies cause is more than USD 230 million . This amount does not include the cost of
insecticide applications, and the losses due to restrictions in fruit commercialization. These restrictions prevent the
industry from benefiting from price differentials, and more importantly from market diversification, negatively affecting the general development of the industry. Some other losses are also not included, e.g. the cost to human
health from moderate and acute poisoning arising from applying insecticides, shortage in the supply of fruits, and a
negative impact on the environment.
Major Achievements
Fruit flies of economic importance have been eradicated in more than 35,000 hectares of commercial plantations of citrus, mango, apple, and peach in north-west Mexico, completely
freeing from fruit flies of economic importance the States of Chihuahua, Sonora, Baja California
Norte, and Baja California Sur.
In the north-east region, SIT suppression activities have reduced fruit fly populations to low-
prevalence levels in parts of the more than 30,000 hectares of commercial citrus production.
By creating federal legal instruments in support of the campaign, the construction of additional
interstate quarantine checkpoints, and installation of X-ray equipment at specific ports of entry,
have been possible. This has strengthened the international and national quarantine system,
providing greater protection from exotic fruit flies and other pests of plants and animals.
Through training courses and workshops, a work force of hundreds of professional scientists,
specialized in the large-scale and area-wide operation of phytosanitary campaigns, has been deployed throughout the country.
Estimated Benefits
In the first 4 years after 1997, when fruit fly eradication in north-west Mexico was officially declared, the direct
benefits (reduced fruit fly damage and increased yield) amount to USD 25 million. In addition, in the same time
period, the benefits obtained from the price differential paid by export markets, and savings in postharvest
treatments, total approximately USD 35 million. Thus the total benefits in the fruit fly-free areas over 4 years
amount to USD 60 million (SAGAR/IICA 2001).
A more specific case is citrus production in the fly-free area of the state of Sonora in north-western Mexico. The state grows 10 000 hectares of citrus, and more than 90% of the production is for the export market with no
phytosanitary restrictions. In 6 years, the total amount exported was more than 130 000 tonnes, with an estimated
value of USD 10.3 million. The crop generates 2000 jobs per year, equivalent to USD 3.2 million (CNCMF
2002).
The eradication of fruit flies, and subsequent maintenance of the fruit fly-free status, have opened the possibility
in the north-western states of expanding the area planted to fruit crops to 50 000 hectares. No doubt this has
resulted in substantial economic and social benefits to that region of Mexico.

34
Appendix 4
Economic impact of mutant varieties
[B.S. Ahloowalia, M. Maluszynski and K. Nichterlein, Global impact of mutation derived varieties, Euphytica 135,187-204, 2004]
Country Mutant variety Basis of value assessment Value or area
Cereal: rice
Thailand RD6 and RD15 Total crop value at farm gate for the period 1989–98 US$ 16.9 billion
China Zhefu 802 Cumulative planted area between1986–1994 10.6 million ha
Japan 18 varieties Total crop value in 1997 US$ 937 million
India PNR-102 and Annual crop value US$ 1,748 million
PNR-381
Australia Amaroo Current annual planted area 60–70% rice growing
area in Australia
Costa Rica Camago 8 Current annual planted area 30% rice growing area
in Costa Rica
Vietnam TNDB100 Total planted area in 1999 220,000 ha
and THDB
Myanmar Shwewartun Total planted area in 1993 800,000 ha
Cereal: bread wheat
Pakistan Jauhar 78, Soghat 90 Additional income to farmers during 1991–99 US$ 87.1 million
and Kiran 95
Cereal: durum wheat
Italy Creso Additional income to farmers during 1983–93 US$ 1.8 billion
Cereal: barley
UK-Scotland Golden Promise Crop value (1977–2001) US$ 417 million
Numerous Diamant Area planted in 1972 2.86 million ha
European and derived
Countries varieties
Legume: chickpea
Pakistan CM 88; CM 98 Additional annual income to the growers US$ 9.6 million
Legume: blackgram (urdbean)
India, Maharashtra TAU-1 Value of increased production in season 1998–1999 US$ 64.7 million
State
Industrial Crops and Oil: Cotton
Pakistan NIAB-78 Total value of crop from 1983–1993 US$ 3 billion
NIAB-78 Additional income to growers from 1983 onwards US$ 486 million
Industrial Crops and Oil: Sunflower
USA NuSun Grown area in 1994 50,000 ha
Fruit: Japanese pear
Japan Gold Nijisseiki Additional annual income to growers US$ 30 million
Fruit: Grapefruit
USA, Texas Rio Star Grown area (year 2000) 7 ,300 ha (75% of total area)

35
Appendix 5
Value of Mutant Varieties
[B.S. Ahloowalia, M. Maluszynski and K. Nichterlein, Global impact of mutation derived varieties, Euphytica 135,187-204, 2004]
Cereals
Rice. Rice is the major source of food for more than 50% of the global population and even more so in Asia.
Mutation techniques have played a significant role in increasing rice production in the Asia-Pacific Region. 434
mutant varieties of rice have been released with improved characters such as semi-dwarf height, early maturity,
improved grain yield, disease- and cold-tolerance, and improved grain quality. Of these, 225 (56%) were induced
with gamma rays, 16 with X-rays, 7 with fast neutrons and 12 with other radiation sources.
Barley. The high-yielding and short-height mutant cultivars of barley „Diamant‟ and „Golden Promise‟ have
made a major impact on the brewing industry in Europe. The mutants have also been used as parents of many
leading barley cultivars. For example, more than 150 leading barley cultivars in several countries in Europe,
North America and Asia were derived from crosses involving Diamant. The gamma-ray induced cultivar
Diamant was officially released in Czechoslovakia in 1965. The cultivars Golden Promise and Diamant have
added billions of dollars to the value of the brewing and malting industry. For example, during the 1960‟s and
70‟s, the cultivar Golden Promise was widely used by the brewing industry in the UK and Ireland for the
production of beers and whisky. This cultivar had stiff straw, high yield and improved malting quality, and was
produced by gamma ray irradiation of seeds of the well-knownmalting cultivar „Maythorpe‟. Even 30 years after
its release, Golden Promise is still popular for its high quality in the production of premium quality ales and
whisky by selected breweries in Scotland. Between 1977–2001, Golden Promise contributed US$ 417 million to grain production, primarily for brewing and malt in Scotland, as estimated from the sale of Certified Seed and
based on average yield of 4.5 t/ha. During the same period Golden Promise was planted over an estimated area
of 542,200 ha. In addition, during 1977–2001, the Certified Seed of Golden Promise was worth US$ 86.8
million, based on an average price of US$ 366/t .The added value from the production and sale of beer and
whisky was several times more than that of the grain. Recent studies have shown that Golden Promise is also
salt-tolerant whereas the parent cultivar is salt-sensitive.
Wheat. A durum wheat cultivar „Creso‟ was developed in 1974 in Italy by crossing „Cappelli‟ mutant „Cp
B144‟ and spread over a large area within a short period. Already in 1984 this mutant cultivar shared 53.3% of
the market of certified wheat seeds in Italy and was grown on 400,000 ha. The estimated additional grain yield
contribution of Creso was valued at US$ 180 million per year and US$ 1,800 million over a decade of its
cultivation . At least five other cultivars were derived by crossing Creso with others cultivars and have been extensively cultivated. In Pakistan, three wheat cultivars were released in Sind Province, Pakistan. The mutant
cultivar, „Jauhar 78‟ derived from „Nayab‟ after neutrons treatment had high yield, wide adaptability, amber
grain, and resistance to shattering. The cultivar Kiran 95 was planted on over 30% of the area under wheat, and
added US$ 47.5 million to farm income during the last five years. The wheat cultivar „Sharbati Sonora‟, a mutant
of „Sonora 64‟, released in 1967, had better acceptance for grain colour by the consumer in the early years of the
„Green Revolution‟ in India.
Grain legumes
Pulse crops are an important and major source of protein for the vast population of Asia. Of the six major pulse
crops (mungbean, urdbean, lentil, grass pea, rajmash and field pea) mungbean and urdbeans are cultivated on over 6 million ha in India, which is more than 25% of the area under all pulse crops. In India, 8 mutant cultivars
of mungbean (Vigna radiata L.Wilczek), 4 of urdbean (blackgram – Vigna mungo L. Hepper) and 3 of lentil
(Lens culinaris Medik.) with high yielding capacity have contributed several million dollars to the country‟s
agriculture.
Mungbean. In India, the release of early maturing cultivars resistant to Yellow Mosaic Virus (YMV) and their
suitability to different cropping systems has resulted in an increased area and production in several states
particularly, Bihar, Gujrat, Maharashtra, Rajasthan and Punjab. Early maturity made it possible to plant these
cultivars during spring and summer after the harvest of potato, sugarcane, wheat and mustrad These cultivars
include several mutant cultivars.In Pakistan, nine mutant cultivars of mungbean with induced early and uniform
maturity, short stature and large seed size have been released.

36
Urdbean. In urdbean (also known as blackgram), the early maturing cultivars have made it possible to grow
them during spring under assured irrigation in the plains of North and Southern states of India. These cultivars
are widely grown and form almost 50% of the total breeder seed of urdbean in India. The Bhaba Atomic
Research Center, Trombay,Mumbai released varaieties that were developed through crosses with large seeded
neutron induced mutants. The mutants had 1000-grain weight of 56 and 69 g compared with 50 g of the parent
cultivar. During 1989–99, the mutant cultivar TAU-1 covered more than 95% of the area under the crop in the
State of Maharashtra, and contributed an estimated US$ 64.7 million from increased production of urdbean. It
has been estimated that in the province Vidarbha alone the economic gain would amount to US$ 1.1 million (Rs
55,000,000).
Chickpea. As a result of radiation-treatment of local cultivars and subsequent selection for disease resistance in segregating mutant populations, the first high yielding chickpea mutant cultivar resistant to Ascochyta blight was
released in Pakistan in 1983. Between 1988–90, in the North Western Frontier Province the chickpea yields were
44–45% higher than the average of the previous five years, mainly because of the cultivation of this excellent
disease-resistant cultivar. In 1995, a new mutant cultivar was released with multiple resistance (Ascochyta blight
and Fusarium wilt) and recently another variety, which is disease resistant and high yielding. The current area
covered by these mutant cultivars is 350,000 ha, more than 30% of the total area under chickpea. The additional
income to farmers has been estimated at US$ 9.6 million per year. More than 800 new disease resistant and
morphological mutants have been produced to broaden the chickpea gene pool in the country.
Soybean. In Vietnam, nearly 45% of the cultivars currently grown are from induced mutations. The varieties have improved yield, large grains and suitability for cultivation of 2–3 crops per year. Over the last 20 years the
cultivated area has increased by 228% and the output by 552%. Eleven soybean cultivars were released in after
mutagenic treatment with X-rays or gamma rays or by crossing mutants with other cultivars. From 1967
onwards, 54 mutant cultivars of soybean were officially released in China with important mutant traits such as
early maturity, improved yield, virus and disease resistance, lodging resistance, drought tolerance, improved
protein and oil content, and hyper-nodulation. In USA, soybean is a major crop and an important source for
edible oil production.
Common bean. In common bean radiation-induced early bush type mutants. Their derivatives were widely used
in the pedigrees of many white-seeded bean cultivars in North America. During the 1970 and 1980‟s most of the
white-seeded bean cultivation area in Michigan was covered by bush mutant derivatives. Currently, 40% of the 300,00 acres of white beans in Michigan are under cultivars derived from these mutamts.
Pea. In pea, a gamma ray induced mutant cultivar with tendrils instead of leaves (afila) was released in Poland in
1979. An afila type cultivar „Piast‟ was released in Poland in 1995. This cultivar combines high yield with good
standing power and has been released in Great Britain in 1998 as „Ramrod‟. The plant habit leads to a plant
architecture that allows good aeration, better light penetration, improved colour and high standing power that
allows harvesting without choking the combines.
Oil and industrial seed crops
Perhaps the greatest global impact of plant breeding in oil seed crops has been in rapeseed and sunflower in which spontaneous and induced mutants have been used in combination with conventional breeding methods to
modify oil composition and increase yield.
Rapeseed – canola. Rapeseed has high erucic acid content in oil and high glucosinolates in meal. Both erucic
acid and glucosinolates are nutritionally undesirable. Breeders have reduced the amount of erucic acid and
gulcosinolates and have developed canola. Canola cultivars have less than 2% erucic acid in oil and less than 30
µm/g of aliphatic glucosinolates in the meal. Efforts were also made by breeders to improve the meal quality by reducing the antinutritional glucosinolates. Plant breeders also recognized that by changing other fatty acids,
different nutrient and processing characteristics could be produced in rapeseed oil, and that mutation techniques
were utilized to further modify the fatty acid composition. Mutants were utilized in breeding programmes in
Canada, Australia and Europe for low linolenic acid varieties. A further modification of canola oil was achieved
with increased oleic acid content from 63 to 79%, and reduced linoleic content from 20 to 7%. The high oleic
acid canola also has lower levels of saturated palmitic and stearic acids. Compared to sunflower and olive,
oilseed rape has a much wider climatic adaptation and can be grown in many parts of the world. As a result of these breeding activities, at least 24 new registered cultivars with modified fatty acid composition have been
developed in Canada that directly or indirectly descend from induced mutations. Microspore mutagenesis has

37
also been used in combination with in vitro screening for the development of a variety tolerant to the herbicides
imidazoline and chlorosulfuron. The contribution of canola cultivars to the Canadian economy has been
outstanding and Canola is now Canada‟s third most important grain export, after wheat and barley. During 2000,
Canada planted 5,564,000 ha under canola, and harvested 4,815,900 ha with production of 7,118,700 tons seed,
with exports of canola oil of 869,932 tons valued at US$ 350.5 million (US$ 4,745 million during 1995–99. The
germplasm with the desired oil composition has spread widely among the plant breeders and the benefits reaped
have been global.
Groundnut. The release of a peanut cultivars of in India has contributed many million dollars to the Indian
economy. A recently released peanut mutant cultivar developed at Bhabha Atomic Research Center, Bombay,
India yielded 4,6 t/ha nuts, an increase of 6.4–40.9% over the checks. In China, 14.7% of the new peanut cultivars were produced through the direct use of induced mutants or by the use of mutants in cross breeding.
The cumulative cultivated area of these 33 mutant cultivars accounts for 19.5% of the total area under peanut in
China.
Cotton. A gamma ray induced, high yielding mutant cultivar of cotton was released in 1983, and was grown
mostly in Punjab, Pakistan. It had a marked influence on sustaining the textile industry of Pakistan, and
contributed to its economy in several ways. The cultivar has a shorter stature, determinate growth habit,
tolerance to heat, and escaped bollworm attack due to its early maturity. Its early maturity made it an ideal
cultivar in the cotton-wheat rotation. Within five years of release, its cultivation doubled cotton production in
Pakistan and covered about 70.8% of the total cotton area in Punjab in 1988. It is estimated that during the ten
years following its release, it contributed more than US$ 3.0 billion in cotton production, and saved the textile industry of Pakistan that was threatened by reduction in cotton production from insect pests. The added income
to cotton growers from has been estimated at US$ 486 million. Its production value for the year 1999–2000 was
estimated at US$ 38.4 million. During 1999–2000, it was planted over more than 90% of the area under cotton in
the Province of Sind, Pakistan. It has proven to be a remarkable cultivar in its wide adaptability and tolerance to
stress. Even after 14 years of its first release, nearly 25% of the area under cotton in Pakistan is planted to this
cultivar. A new mutant cultivar released in 1996 has improved heat tolerance and high yield potential. It has
been cultivated on 486,000 ha and brought farmers US $ 17 millions income. In China a the cotton cultivar
derived from gamma ray treatment was released in 1974 and has been one of the most widely grown cotton
cultivars since then. This high yielding cultivar‟s annual cultivation area exceeded 1 million hectares in 1990.
Non-narcotic poppies. Scientists in India have developed the alkaloid-free opium-less poppy (Papaver
somniferum L.) cultivar „Sujata‟. Breeders irradiated seed with 15 Gy gamma rays and found one plant containing no opium. The current cultivar is now in its seventh generation as an experimental crop. The cultivar
might result in a non-narcotic version of a seed crop that is high in fatty acids.
Vegetatively propagated plants
In the vegetatively propagated species, the entries in the mutant cultivar database are limited to only 97 out of
1700 crop cultivars.Despite the small number, some of them have made considerable economic impact.
Peppermint. In peppermint, Mentha piperita L., two cultivars with tolerance to Verticillium wilt were released
in 1971 and 1976, respectively. These cultivars were developed after neutron and X-ray treatment of a wilt-
susceptible cultivar followed by extensive screening in infested fields. The two mutants are among the three cultivars recommended for controlling Verticillium wilt in USA, where 90% of the world‟s peppermint oil is
produced. The global production of mint oil is estimated at around 5,000 t with 5% annual increase in
consumption. Based on average bulk sale price of US$ 50/kg, the current production of 4,000 t of mint oil in
USA is worth US$ 200 million. After packaging, mint oil is sold for US$ 27.92 per 120 ml bottle on the global
market. Based on this price, its current market value would be approximately US$ 930 million.
Fruits. The first commercial grapefruit cultivar with red-pigmented fruit and blushed peel, originated from a
spontaneous mutation discovered in Texas in 1929. However, its flesh color faded as the harvest season
progressed, and the juice colour was not accepted. A redder grapefruit was desired. Seeds and bud wood were
irradiated and two new cultivars were obtained. One, released in Texas in 1970, was obtained by thermal neutron
irradiation. It is seedless, red flesh and has gained wide acceptance, but its yield is variable. The other, released
in 1984, was derived from irradiated bud wood with thermal neutrons. It has red flesh and a good yield. This has now become the preferred cultivar in Texas and in other grapefruit growing areas. It is currently grown on 7,300
ha, which is 75% of the grapefruit production area in Texas. The economic impact of a new cultivar of a
Japanese pear is well documented. This cultivar was developed with chronic radiation in a gamma field. It is

38
more resistant to black spot disease than its parent . The additional annual income by growing this cultivar is
almost US$ 30 million. In 1997, the over all economic contribution of mutants of rice, pear, soybean and peach
in Japan has been estimated at US$ 973.2 million.
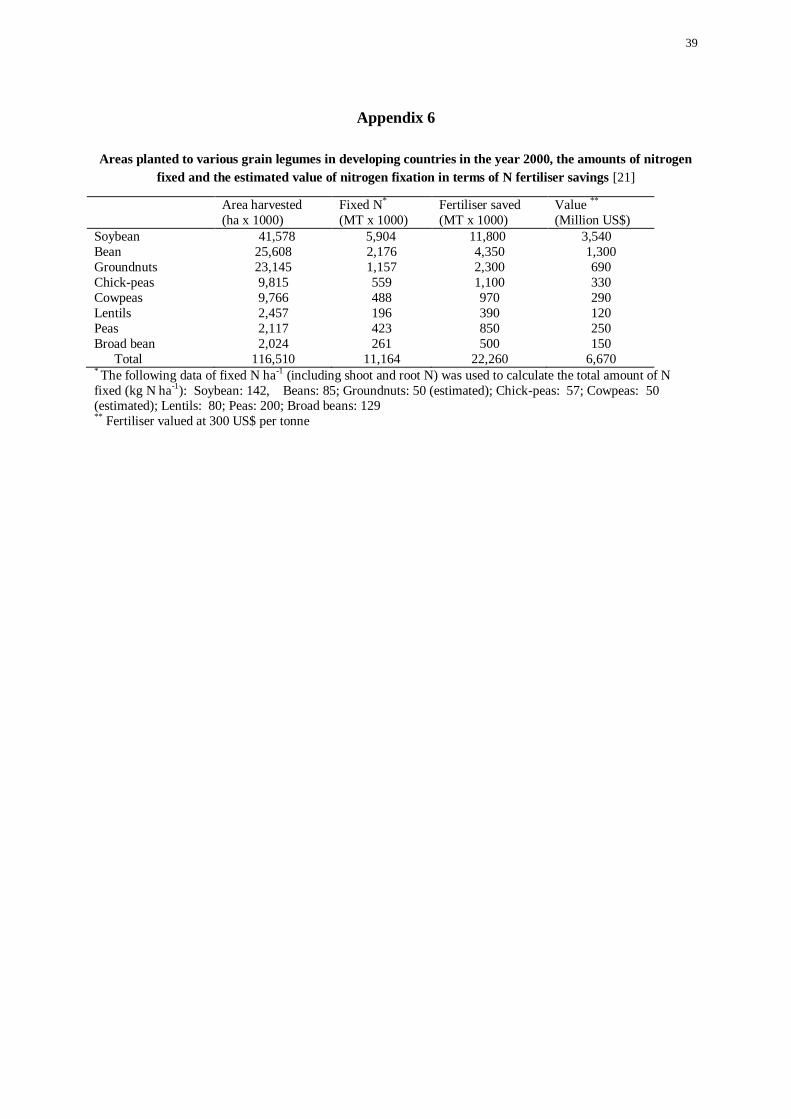
39
Appendix 6
Areas planted to various grain legumes in developing countries in the year 2000, the amounts of nitrogen
fixed and the estimated value of nitrogen fixation in terms of N fertiliser savings [21]
Area harvested
(ha x 1000)
Fixed N*
(MT x 1000)
Fertiliser saved
(MT x 1000)
Value **
(Million US$)
Soybean 41,578 5,904 11,800 3,540
Bean 25,608 2,176 4,350 1,300
Groundnuts 23,145 1,157 2,300 690
Chick-peas 9,815 559 1,100 330
Cowpeas 9,766 488 970 290
Lentils 2,457 196 390 120
Peas 2,117 423 850 250
Broad bean 2,024 261 500 150
Total 116,510 11,164 22,260 6,670 * The following data of fixed N ha-1 (including shoot and root N) was used to calculate the total amount of N
fixed (kg N ha-1): Soybean: 142, Beans: 85; Groundnuts: 50 (estimated); Chick-peas: 57; Cowpeas: 50 (estimated); Lentils: 80; Peas: 200; Broad beans: 129 ** Fertiliser valued at 300 US$ per tonne

40
Apendix 7 Remediation strategies for areas contaminated by
the Chernobyl Nuclear Power Plant accident [22]
In accordance with the Federal law of the Russian Federation «On radiation protection of the population»,
countermeasures to reduce annual effective dose to the population can be optionally applied in areas where the additional irradiation of the population exceeds 1 mSv a-1; countermeasures are considered as necessary when
doses are exceeding 5 mSv per year. In the dose range from 1 to 5 mSv countermeasures can be applied on an
optimised basis.
Forest countermeasures were considered under four aspects: radiological, economic, environmental or ecological
and social. Economic and social consequences, connected with the restrictions of access in the contaminated
forests as well as the extra expenses for countermeasure implementation, were considered. The restrictions result
in losses or reduction of wood and other forest products such as mushrooms, berries and medical herbs in which
radionuclide content exceed permissible levels. Besides, some countermeasures can have negative secondary ecological effects as they may decrease the ecological stability of the forest.
A set of different criteria including social acceptability, provided in a multi-attribute-utility analysis (MAUA),
was applied to justify the optimised countermeasures selection. The justification for countermeasure
implementation in contaminated forests was considered in several steps. The first step is the identification of
forest areas where t products exceed permissible levels and settlements where annual effective doses are above 1
mSv/ year. The duration of the countermeasures is evaluated with the aid of radioecological and dose predictive models. The general importance of a forest dose pathway in comparison with the others is estimated and
conclusion about the necessity for forest countermeasures is documented. The second step is to justify the most
important ways for countermeasures implementation. The third step is the identification of countermeasures
strategies, which can provide maximal effect. This step includes a comparative analysis of the effectiveness of
possible countermeasures and evaluation of secondary ecological (indirect) effects, which are specific for each
forest area.
The criteria for evaluating the effectiveness of countermeasures for forests are complex as forests contribute to
the collective dose received by population living outside the contaminated territories (exported dose) and also
determine the individual dose to the rural population living in a settlement located inside (or near) a forested
area. The final objective is the justification of the time scale in which forest countermeasures should be applied taking into account results of cost-benefit analyses and the evaluation of the time dependence of the cost of 1
man-Sv being averted. Among these criteria, the following should be listed:
Reduction of individual dose to the population and the members of critical population group;
Feasibility and cost of countermeasures implementation;
Cost of averted dose of 1 man-Sv;
Secondary ecological effects;
Social acceptability.
Secondary ecological effect and social acceptability are often expressed qualitatively and only expert judgment procedure can be used for their ranking.
The effectiveness of some countermeasure options can be evaluated by a „reduction factor‟, i.e. a reduction in the
radionuclide activity concentrations in the forest products and reduction of the doses received by the population
group of interest.
Based on countermeasures that have been already introduced in the Chernobyl contaminated areas, the following can be considered:
Restrictive countermeasures Restrictive countermeasures may have severe negative ecological, economic and
psychological consequences (secondary effects) and their application should be carefully justified.
Optimised usage of forest and forest products. These countermeasures are (i) limitation of tree harvesting to
areas with low doses; (ii) limitation of tree harvesting, mushrooms and berry gathering to areas with low
accumulation of radionuclides; (iii) limitation on mushrooms and berry gathering to the species with low
accumulation of radionuclides and recommendation on processing of mushrooms before consumption; (iv)
changing in hunting time.
41
Soil based countermeasures. These countermeasures involve chemical, physical or mechanical actions applied to
the properties of forest soils. However, their acceptability is low because they can cause considerable damage to
forest ecosystems.
Animal based countermeasures. At present it is practically impossible to implement effective measures to reduce
contamination of animal fodder. Therefore, the use of caesium binders, such as Prussian Blue, in animals has
been one of the most effective options.
The case study area
The average deposition density of 137Cs on the territory of the Novozybkov district was about 750 kBq m-2 and
the contamination of forest soils varied in a range from 150 to 2500 kBq m-2. For countermeasure
implementation the forests of the Novozybkov district were divided into 3 zones, corresponding to different levels of 137Cs deposition: 1500-1900 kBq m-2 (zone A), 750-1100 kBq m-2 (zone B), 360-620 kBq m-2 (zone C).
Forests with the level of deposits above 555 kBq m-2 were completely excluded from economic use. Timber
production was partially suspended and any usage of forest products (mushrooms, berries, medical herbs, etc.)
was also prohibited. Restrictions on berries and mushrooms gathering were also imposed in forests belonging to
group C.
Information on the internal and external doses to inhabitants of the settlements located on the contaminated
territory was available for several years after the accident. Mean data of annual effective doses in the settlements
of different zones, indicated that the application of countermeasures will be of importance up to 2025, 2015 and
2005 in zones A, B and C, respectively, if the annual effective dose to population has to be kept at or below 1
mSv.
A comparative analysis of the main forest pathways within the study area permitted the further identification of
the most important impacts of the countermeasures applications. The highest contribution to the total dose to the
population was the external dose within (or near) settlements, followed by internal doses due to milk and meat
products, mushrooms and berries and the external dose associated with the forest contamination.
Contribution of forest pathways to the total dose varies across zones between 18% and 24%. Based on these
results, the potential effectiveness of forest countermeasures in terms of dose reduction to critical population
group could be ranked as follows: “forest milk consumption”>”mushrooms consumption”>”external dose in the
forest (to foresters)>”berries consumption”>“visiting forest for recreation and mushrooms (berries) gathering”.
This information indicated that forest countermeasures allow considerable reducing of effective doses to both
population‟ groups. However, the analysis of other parameters (such as cost, feasibility, acceptability and secondary effects) was also necessary.
The effectiveness of forest countermeasures in terms of percentage of the estimated total dose reduction as well
as related cost per hectare of forested area, their acceptability and cost of one man-Sv averted are given in Tables
I and II. The cost of one man-Sv averted, defined as the ratio of application cost to averted dose, is often used as
an integral indicator of countermeasures effectiveness. Collective doses, which can be averted due to forest
countermeasures were calculated. The cost included the necessary resources, manpower, equipment and
consumable. The data in Table I show that the most effective way to reduce the impact of contaminated forests
on the population is the application of options for reducing exposure from mushrooms consumption. As for the
critical population group, a more effective option is to decrease the “forest milk” exposure pathway. Soil-based
countermeasures have the lowest dose reduction as well as the highest cost and low acceptability.
A decision analytic tool based on a PRIME (Preference Ratios In Multi Attribute Evaluations) technique was
applied to justify optimal countermeasure strategies. The following steps allowing the identification of a
reasonable decision were considered:
Identification of the alternatives and their attributes;
Preference assessment;
Determination of the best alternative.
Numeric values for the three attributes were derived from the data in Tables I and II and five levels of
acceptability were transformed into numeric scale by applying a score from 0 to 100, i.e.: “Very low” = 5,
“Low”= 25, “Moderate” = 50, “High” = 75, “Very high” = 90.
The objective of the preference assessment was to identify priorities in the selection of optimal forest
countermeasures strategies. To this aim a weight should be assigned with respect to their relevance to the general
objectives. The weight ranging from 0 to 100 is a subjective ranking based on expert judgement.

42
Three main possible strategies of forest countermeasures in the long term were considered: the first one (dose
reduction strategy) is based on the maximal reduction of annual effective dose to both the population groups
considered; the second one (acceptability strategy) is based on maximal acceptability of countermeasures in the
long term. Taking into account these preferences, attributes (parameters of countermeasures effectiveness) were
weighted in the two following ways: reduction of effective dose (100-100)>acceptability (70-90)> cost of 1 man-
Sv averted (60-80)> cost for countermeasure application (40-50); reduction of the effective dose (70-90)>
acceptability (100-100)>cost of 1 man-Sv averted (60-80)> cost for countermeasure application (40-50). The
third strategy consists in the selection of optimal alternatives, taking into account the preferences identified in
step two. They include “value intervals” and decision rules, which allow the selection of the optimal alternative
(countermeasures). For the critical population group the countermeasures “Abandonment” (alternative A) and
“No felling” (B) are the least “optimal”. As for the rest population, similar conclusion could be made for such options as “No public access” (C), “Restriction on mushroom collection” (E) and “Restriction of berries
collection” (F). This leads to consider the restriction on using forest grass for fodder (alternative D) or using
Prussian blue to decrease “forest milk” contamination (J) in combination with limitation of tree harvesting to the
area with low doses (alternatives D&G and J&G) are the optimal countermeasures options for foresters. As for
the rest population, the results show that a combination of forest countermeasures such as “Limitation on
mushrooms and berries collections to the species with low accumulation of radionuclides in the combination”
and “Mushrooms processing before consumption” (alternative “H&I”) are best option.
The final step in the methodology is the estimation of time periods when the countermeasures should be applied.
The ICRP Publication No. 37 (ICRP, 1983) considers measures justified when the cost of reducing the collective
dose by 1 man-Sv is within the range of 10-20 thousand US $. The results of the study indicate that for the normal population the time periods when the cost of 1 man-Sv being averted is less than 20 thousand US $ for
application of the H+I alternative are close to those of where average affective doses are exceeding 1 mSv per year. The conclusion is that these countermeasures can be considered as optimised for the whole period.
As for the combined application of “Prussian Blue” and “limitation of tree harvesting”, (J + G), to decrease
exposure of the critical population group to the area with low doses is also in agreement with the cost of the 1
man-Sievert requirements. However, in this case the cost of 1 man-Sv being averted will exceed 20 thousand USD only in 2015, 2034 and 2053 in zones A, B and C, respectively.
Table I
Effectiveness of forest countermeasures in terms of annual effective dose reduction, cost and acceptability
Countermeasures Decrease of effective dose, % Cost Accept-
Critical population
group
The rest population US $ per ha ability
Restrictive countermeasures
A. Abandonment 83-88 18-24 105-107 Very low
B. No foresters access (except for forest
service) – No felling
79-84 - 109-111 Low
C. No public access 18-24 103-104 Low
D. Restriction on grazing of domestic
animals or using forest grass for fodder
54-58 - 4.3 Moderate
E. Restriction on mushroom collection
(including education of public)
9-11 13-19 24-26 Low
F. Restriction on berries collection (including education of public)
0.9-1.8 1-2 14-15 Low
Optimisation in forest management
G. Limitation of tree harvesting to the areas with low doses
2-5 - 0.48 Very high
H. Limitation on mushrooms collections
to the species with low accumulation of
radionuclides (including education of
public)
3-4 3-4 0.64 Moderate
I. Mushrooms processing before
consumption (including education of
public)
3-4 3-4 0.46 Moderate

43
Application of Cs binders
J. Using Prussian Blue to decrease contamination of “forest milk”
30-49 - 0.14 High
Soil based countermeasures
K. Liming (only for berries) 0.5-1.0 0.6-1.2 12.7 Low L. Application of potassium (only for
berries)
0.4-0.9 0.5-1.0 130 Low
Table II
Cost of one man-Sv being averted after countermeasures application for 2003, thousand USD
Type of countermeasures Zones
A B C
Restrictive countermeasures
A. Abandonment 297 471 866
B. No foresters access (except for forest service)
– No felling
231 362 770
C. No public access 295 468 861
D. Restriction on grazing of domestic animals
or using forest grass for fodder
16.5 27.4 53.7
E. Restriction of mushroom collection(including education of public)
14.2 28.2 53.4
F. Restriction of berries collection (including
education of public)
87.8 161 305
Optimisation in forest management
G. Limitation of tree harvesting to the area with
low doses 246 423 785
H. Limitation on mushrooms and berries
collections to the species with low accumulation
of radionuclides (including education of public) 5.8 11.4 21.6
I. Mushrooms processing before consumption
(including education of public) 6.6 13.0 24.6
Application of Cs binders
J. Using Prussian Blue 1.5 3.2 5.2
44
References
[1] P. L. Bereano, Technology as a Social and Political Phenomenon, , John Wiley & Sons, New York,
1976
[1a] Toward a Social Report, U.S. Department of Health, Education and Welfare, Washington,
Government Printing Office, 1969]. [2] Tevfik F. Nas, Cost-Benefit Analysis: Theory and Applications, Sage Publications, Inc.,
Thousands Oaks, London, New Delhi, 1996.
[3] R. Savit, When Random is not Random: An Introduction to Chaos in Market Prices, J. Future Markets, Vol. 8, p.271, 1988 .
[4] L. Leydersdorff and P. Van den Besselaar (eds.), Evolutionary Economics and Chaos Theory: New
Directions In Technology Studies, Pinter, London, 1944 [5] W. A. Brock, D. H. Hsieh and B. LeBaron, Non-Linear Dynamics, Chaos and Instability:
Statistical Theory and Economic Evidence, The MIT Press, 1991
[6] W. Hildebrand and H. Sonnenshein, Hanbook of Mathematical Economics, Vol. 4., Noth-Holland,
Elsevier, 1991; [7] J. Benhabib, On Cycles and Chaos in Economics: Studies in Nonlinear Dynamics and
Econometrics, Vol,1, No.1, Article 1, 1996
[8] P. W.Anderson, K. J. Arrow, and D. Pines, eds., The Economy as an Evolving System, Redwood City, Calif., Addison-Weseley, 1988
[9] D. Ruelle, Chance and Chaos, Chapter 13, Economics, Penguin Books, Princeton University Press,
1993 [10] L. H. Hoeglund Isaksson, A Study of the Possibilities to Value Benefits and Costs of Food
Irradiation and Radiation Oncology, IAEA Internal Report, Vienna , Austria, March-April 2002
[11] L. H. Hoeglund Isaksson, Economic Valuation of Nuclear Application Technologies, in
Economic and Social Benefits of Applications of Radiation, IAEA-TECDOC 2005 [12] C. S. Bertuglia and F. Vaio, Non-Linearity, Chaos and Complexity: dynamics of natural and
social systems, Bollati Boringhieri, Torino, Italy, 2003
[13] www.santafe.edu [14] Technical Reports Series No. 40. Industrial Radioisotopes Economics. The findings of the
International Survey on the Use of Radioisotopes in Industry, Study Group Meeting on Radioisotope
Economics, Vienna March 1964, Published in 1965
[15] M. Haji-Saeid, A.G. Chmielewski, J. Thereska, J-H. Jin, Benefits from Radioisotopes Applications in Industry, paper presented at the IAEA consultants meeting on Economic and Social
Benefits of Applications of Radiation, Vienna, 6-9 December 2004
[16] J. B. R. Hadden, Radionuclides for Process Control and Inspection, Isotopenpraxis, 23, 112, 1987 [17] S. Charlton, IAEA Technical Meeting Report on R&D in Radiotracer and NCS technologies, June
2002
[18] J. Hendricks, personal communication, March 2005 [19] W. R. Enkerlin, Impact of Fruit Fly Control Programmes Using the Sterile Insect Technique, in
V. A. Dyck, J. Hendrichs and A. S. Robinson editors, The Sterile Technique Principles and Practice In
Area-wide Integrated Pest Management, Springer Publishing, The Netherlands. 2005 (in press)
[20] B.S. Ahloowalia, M. Maluszynski and K. Nichterlein, Global Impact of Mutation Derived Varieties, Euphytica 135,187-204, 2004
[21] G. Hardarson, S. Bunning, A. Montanez & A. McMillan, The value of Symbiotic Nitrogen
Fixation by Grain Legumes in Comparison to the Cost of Nitrogen Fertilizer Used in Developed
Countries, in Maximizing the Use of Biological Nitrogen Fixation in Agriculture, G. Hardarsson and
W. J. Broughton (eds.), Kluwier Academic Press and FAO-IAEA, pp. 213-220 (2003)]
[22] S.V. Fesenko, G. Voigt, S.I. Spiridonov, I.A. Gontarenko, Decision Making Framework
for Application of Forest Countermeasures in the Long Term after the Chernobyl Accidnet, J.
Env.. Rad.. in press, 2005
[23] P. Andreo, Success Stories, personal communication, April 2005