Embed Size (px)
Citation preview

NO. 57, FALL 2017
IN THIS ISSUE 1 NEWS IN THIS QUARTER
Assimilation of GPM Microwave Imager Clear-Sky Radiance in Improving Hurricane Forecasts
Satellite Radiance Data Assimilation Impacts within the Operational Hourly Updated Rapid Refresh
Recent Cross-track Infrared Sounder (CrIS) Changes in the Gridpoint Statistical Interpolation (GSI) Software
18 MEETING REPORT2017 Joint GSI and EnKF Community Tutorial
19 PEOPLEWelcome Sandra Claar
19 CAREER OPPORTUNITIES
20 EDITOR’S NOTE
21 SCIENCE CALENDAR
NEWS IN THIS QUARTER SCIENCE UPDATE
Assimilation of GPM Microwave Imager Clear-Sky Radiance in Improving Hurricane ForecastsThe Global Precipitation Measurement (GPM) mission is a constellation-based satellite mis-sion initiated by National Aeronautics and Space Administration (NASA) and the Japan Aerospace Exploration Agency (JAXA). Building upon the success of its predecessor, the Tropical Rainfall Measurement Mission (TRMM), GPM aims to unify and advance the next-generation precipitation measurement from a constellation of both research and operational satellites (Hou et al. 2014).
Launched on February 28, 2014, the GPM core observatory is equipped with the first space-borne dual-frequency precipitation radar, the DPR, and a conical-scanning multichannel mi-crowave imager, the GMI. Specifically, GMI not only inherits the nine channels of TRMM Mi-crowave Imager (TMI) to detect heavy to light precipitation but also includes four additional high-frequency channels (166 GHz and 183 GHz) to improve sensitivity to snowfall detection.
GMI at least doubles the spatial resolution of the channels in TMI and is of the highest resolution among the group of GPM constellation satellites. Furthermore, the outstanding calibration of GMI also serves as the calibration reference for the inter-calibration of other microwave imagers in the GPM constellation to ensure a physically consistent brightness temperature. Through improved measurements of rain and snow, GPM provides new ob-servations of hurricanes and typhoons as they transition from the tropics to mid-latitudes (Skofronick-Jackson et al. 2017).
(continued on page 2)
JCSDA QuarterlyJOINT CENTER FOR SATELLITE DATA ASSIMILATION
NOAA | NASA | US NAVY | US AIR FORCE
https://doi.org/10.7289/V50P0X8R

2 JCSDA QUARTERLY NO. 57, FALL 2017
Assimilation of satellite radiance observa-tions in the numerical models had been known to be able to significantly reduce error in numerical weather prediction, specifically over regions where conventional observa-tions are sparse (Derber and Wu 1998; Mc-Nally et al. 2000; Bauer et al. 2006). Tropical cyclone (TC) forecasting, in particular, ben-efits greatly from the large spatial coverage over oceans and high temporal resolution of satellite observations. Meanwhile, it is found that satellite microwave imagery such as TMI is particularly useful for understanding moist processes associated with hurricanes, owing to its unique capability in depicting precipi-tation structure and moisture processes (e.g., Pu et al. 2002; Hou et al. 2004). Because of the numerous improvements that GPM brings along, it is expected that assimilating GMI radiances could result in positive impact on hurricane track and intensity forecasts.
As a highly collaborative effort, in this study we examine the impact of assimilating GMI clear-sky radiance on hurricane track and in-tensity forecast with the Hurricane Weather Research and Forecast (HWRF) model (Go-palakrishnan et al. 2011; Tallapragada et al. 2015) and the National Centers for Environ-mental Prediction (NCEP) Grid Point Statisti-cal Interpolation (GSI)-based hybrid ensem-ble three-dimensional variational (3DVar) data assimilation system (e.g., Wang et. al. 2013). In the GSI system, the Community Radiative Transfer Model (CRTM; Han et al. 2006) developed by the Joint Center for Satel-lite Data Assimilation (JCSDA) is used as the radiative transfer component of the observa-tion operator to achieve direction assimila-tion of radiance. The numerical experiments used the HWRF version 3.7 (Tallapragada et al. 2015) with a three-level nested domain at 18 km, 6 km, and 2 km horizontal resolution.
Experiments and Results
The numerical experiments assimilated GMI Level 1C-R common calibrated and co-reg-istered high-frequency and low-frequency brightness temperature data. A two-step bias correction approach, which combines a linear regression procedure and variational bias correction (BC) was used and found to be efficient. Specifically, a rough estimation of the BC coefficients is computed using a linear regression on a representative set of obser-vations minus forecasts (O-F) derived from multiple days (e.g., 14 days) of GMI over-passes in the region of interest (e.g., the re-gion of tropical cyclone evolves). This rough estimation of coefficients is then treated as an initial guess for a variational BC inside of GSI through an iteration process over a short peri-od of data assimilation cycles (e.g., following Zhu et al. 2014) to obtain the temporal varia-tion of the coefficients. It is found this two-step approach speeds up the convergence of BC coefficient as it offers a better initial guess of BC coefficient through the linear regres-sion (Yu et al. 2017). Figure 1 shows sample results with the observation minus first guess (O-F) before and after the BC, as well as a histogram of the first-guess departure before and after BC, revealing that after BC, O-F dis-tribution becomes less biased with a normal distribution around zero.
The quality control for GMI clear-sky radi-ance in the GSI data assimilation system uses two parameters associated with cloud liquid water (CLW) and cloud ice, and three param-eters associated with surface emissivity. For clear-sky data satellite radiance assimilation, almost all the data over the hurricane inner core region were rejected by the QC process.
(continued on page 3)
JOINT CENTER FOR SATELLITE DATA ASSIMILATION
5830 University Research Court College Park, Maryland 20740
Website: www.jcsda.noaa.gov
EDITORIAL BOARD
Editor: James G. Yoe
Assistant Editor: Biljana Orescanin
Director: Thomas Auligné
Chief Administrative Officer:James G. Yoe

3 JCSDA QUARTERLY NO. 57, FALL 2017
To demonstrate the impact of assimilation of GMI clear-sky radiance on hurricane track and intensity forecasts, two notable recent hurricane cases, Hurricane Joaquin (2015) and Hurricane Matthew (2016), were chosen as case studies. For Hurricane Joaquin, the mature phase during its hairpin turn is em-phasized. The model is spun up at 00 UTC October 1, 2015, and the cycled data assimi-
lation is performed from 0600 UTC October 1 to 1800 UTC October 2, 2015, then fol-lowed by short-range forecasts. For Hurri-cane Matthew, both the genesis and mature phases are included. For its genesis phase, the model is spun up at 1200 UTC Septem-ber 27, 2016, and the cycled data assimila-
(continued on page 4)
Figure 1: O-F statistics against CLW predictor before (left) and after BC (middle). Histogram of O-F values is shown in the right column. Data sample consists of assimilated GMI observations from four analysis cycles of the mature phase of Joaquin that have major GMI overpasses in the parent domain (0600 UTC October 1, 1800 UTC October 1, 0200 UTC October 2, and 0600 UTC October 2, 2015).

4 JCSDA QUARTERLY NO. 57, FALL 2017
tion is performed from 1800 UTC September 27 to 0000 UTC September 29, 2016. For its mature phase, the model is spun up at 1800 UTC October 2, 2016, and the cycled data as-similation is performed from 0000 UTC Oc-tober 3 to 1200 UTC October 4, 2016.
Figure 2 reveals a comparison of the aggre-gated track forecasts between the control ex-periment without assimilation of GMI data (CTRL1) and the experiment with the assimi-lation of GMI data (GMI1) during the cycling periods from 0600 UTC October 1 to 1800 UTC
October 2, 2015. It is obvious that the control experiment shows systematic biases of fore-cast tracks toward the northwest side of the best track during the hairpin turn of Joaquin. In contrast, the experiment with GMI data as-similation shows a greater reduction in the track biases. Track errors of CTRL1 exceed 200 km after 30 hours of the forecast, while GMI1 retains a track error of less than 140 km throughout the entire 72-hour forecast period. The 60-hour mean track error for CTRL1 and
(continued on page 5)
Figure 2: Comparison between NHC best track (black curve) with track forecasts (colored lines) of Hurricane Joaquin from the seven 6-hourly analysis/forecast cycles for (a) CTRL1 (without GMI data assimilation) and (b) GMI1 (with GMI data assimilation) from different initial times (as listed in the legend). (c) is the 60-hour mean track error averaged over the forecasts started from seven analysis-forecast cycles during the mature phase of Joaquin (6-hourly from 0600 UTC October 1 to 1800 UTC October 2, 2015), for CTRL1 (red) and GMI1 (blue).

5 JCSDA QUARTERLY NO. 57, FALL 2017
GMI1 (as shown in Figures 2a and b), aver-aged for all 7 cycles is compared against the NHC best-track data (Figure 2c). A consistent improvement in the track forecast is seen after the assimilation of GMI data, with a roughly 20 percent reduction in track error overall.
Compared to Joaquin, Hurricane Mat-thew exhibited less uncertainty in its track throughout its life cycle. The track forecast of Matthew during its genesis phase has small uncertainty. Assimilating GMI clear-sky radiance does not have a significant impact on the track forecast (not shown). Figure 3 shows a comparison of the mini-mum sea level pressure forecasts between the experiments without (CTRL2) and with (GMI2) GMI data assimilation from different forecast lead times at the genesis phase of Matthew. Figure 3 displays the mean of 60-h minimum sea-level pressure and maximum wind forecast errors. Overall, during the genesis phase of Matthew, the assimilation of GMI data results in consistent positive
impacts on both minimum SLP and maxi-mum wind for the first 48-hour forecast.
The mature phase of Matthew exhibits small uncertainty in both track and intensity fore-casts. The assimilation of GMI clear-sky ra-diance has a neutral impact for the mature phase of Matthew (not shown).
Discussion
Hurricane Joaquin in 2015 and Matthew in 2016 are used as case studies to evaluate the impact of assimilating GPM-GMI clear-sky radiance on hurricane analysis and forecasts. It is found that assimilation of GMI clear-sky radiances results in a positive or neutral im-pact on track and intensity forecasts.
For the mature phase of Joaquin, assimi-lating GMI radiance results in significant improvement in the track forecast, espe-cially during its hairpin turn. Further di-
(continued on page 6)
Figure 3: 60-hour mean forecast errors against the NHC best track data for (a) minimum central sea-level pressure and (b) maximum surface wind, averaged over the forecasts from six analysis cycles (6-hourly from 1800 UTC September 27 to 0000 UTC September 29, 2016). CTRL2 (red) denotes the experiment without GMI data assimilation and GMI2 (blue) represents the experiment with GMI data assimilation for Hurricane Matthew.

6 JCSDA QUARTERLY NO. 57, FALL 2017
agnosis (Yu et al. 2017) indicates that more realistic interaction between the simulated hurricane vortex and the nearby mid- to upper-level trough is represented in the experiment with the assimilation of GMI clear-sky radiance. The impact on the inten-sity forecast of the mature phase of Joaquin, on the other hand, is relatively modest. This is mostly because clear-sky radiance obser-vations occur away from the inner-core re-gion of the hurricane.
For the genesis phase of Matthew, forecast results show that assimilating GMI radiance improves the intensity forecast, especially during the first 48-hour forecast. Close ex-amination of the forecast result using GFS analysis shows that assimilating GMI clear-sky radiance improves the forecast of mid- to lower-level cold air aggregated on the northeast side of the storm, which causes Matthew’s intensification to slow down. Using GFS analysis as reference, the over-all root-mean-square-error statistics show a clear improvement of GMI data assimilation in temperature throughout the entire tropo-sphere and in low- to mid-level specific hu-midity in the near-hurricane environment (radius less than 500 km), even when other microwave imagers are present (e.g., AMSU-A, ATMS, MHS, etc.). Detailed results are documented in a journal paper submitted to Monthly Weather Review (Yu et al. 2017).
The ongoing and future efforts are empha-sized on the 2017 and future hurricane sea-sons in a quasi-operational environment. In addition, all-sky radiances data assimilation with GMI is under development.
Zhaoxia Pu and Chaulam Yu (Department of Atmospheric Sciences, University of Utah) [email protected]
Vijay Tallapragada (Environmental Modeling Center, NCEP/NOAA) Jianjun Jin (Goddard Earth Sciences Technol-ogy and Research, Universities Space Research Association) Will McCarty (Global Modeling and Assimila-tion Office, NASA Goddard Space Flight Center)
Acknowledgements:This study is supported by JCSDA through research grant #NA15NES4400004 and NASA Award #NNX17AE95G. Computer resources provided by NOAA ESRL Jet su-percomputer, NOAA/JCSDA S4 computer system, and the University of Utah’s Center for High-Performance Computing (CHPC) are greatly appreciated.
References:Bauer, P., P. Lopez, A. Benedetti, D. Sal-mond, and E. Moreau, 2006: Implemen-tation of 1D4D-Var assimilation of pre-cipitation affected microwave radiances at ECMWF. I: 1D-Var. Quart. J. Roy. Meteor. Soc., 132, 2277–2306.
Derber, J.C., and W.-S. Wu, 1998: The use of TOVS cloud-cleared radiances in the NCEP SSI analysis system. Mon. Wea. Rev., 126, 2287–2299.
Gopalakrishnan, S.G., F. Marks, X. Zhang, J.-W. Bao, K.-S. Yeh, and R. Atlas, 2011: The Experimental HWRF System: A study on the influence of horizontal resolution on the structure and intensity changes in tropical cyclones using an idealized frame-work. Mon. Wea. Rev., 139, 1762–1784, doi:10.1175/2010MWR3535.1.
Han, Y., P. van Delst, Q. Liu, F. Weng, B. Yan, R.
(continued on page 7)

7 JCSDA QUARTERLY NO. 57, FALL 2017
Treadon, and J. Derber, 2006: JCSDA Commu-nity Radiative Transfer Model (CRTM)—ver-sion 1. NOAA Tech. Rep., NESDIS 122, 40 pp.
Hou, A.Y., and Coauthors, 2014: The Global Precipitation Measurement mission. Bull. Amer. Meteor. Soc., 95, 701–722, doi:10.1175/BAMS-D-13-00164.1
Hou, A.Y., S.Q. Zhang, and O. Reale, 2004: Variational continuous assimilation of TMI and SSM/I rain rates: Impact on GEOS-3 hurricane analyses and forecasts. Mon. Wea. Rev., 132, 2094–2109.
McNally, P., J.C. Derber, W. Wu, and B.B. Katz, 2000: The use of TOVS level-1b ra-diances in the NCEP SSI analysis system. Quart. J. Roy. Meteor. Soc., 126, 689–724.
Pu, Z., W.-K. Tao, S. Braun, J. Simpson, Y. Jia, J. Halverson, W. Olson, and A. Hou, 2002: The impact of TRMM data on mesoscale nu-merical simulation of Supertyphoon Paka. Mon. Wea. Rev., 130, 2448–2458.
Skofronick-Jackson, G., W. Petersen, W. Berg, C. Kidd, E. Stocker, D. Kirschbaum, R. Kakar, S. Braun, G. Huffman, T. Iguchi, P. Kirstetter, C. Kummerow, R. Meneghini, R. Oki, W. Olson, Y. Takayabu, K. Furukawa, and T. Wilheit, 2017: The Global Precipita-
tion Measurement (GPM) Mission for Sci-ence and Society. Bull. Amer. Meteor. Soc., doi:10.1175/BAMS-D-15-00306.1, (in press).
Tallapragada, V., and Coauthors, 2015: Hur-ricane weather research and forecasting (HWRF) Model: 2015 scientific documenta-tion. NCAR Development Testbed Center Rep., 119 pp. [Available online at http://nldr.library.ucar.edu/collections/technotes/TECH-NOTE-000-000-000-893.pdf.]
Wang, X., D. Parrish, D. Kleist, and J. Whita-ker, 2013: GSI 3DVAR-based ensemble–vari-ational hybrid data assimilation for NCEP Global Forecast System: Single-resolution experiments. Mon. Wea. Rev., 141, 4098–4117.
Yu, C, Z. Pu, V. Tallapragada, J. Jin, W. Mc-Carty, 2017: The Impact of Assimilation of GPM microwave imager clear-sky radiance on numerical simulations of Hurricanes Joa-quin (2015) and Matthew (2016) with the HWRF model. Mon. Wea. Rev., (submitted).
Zhu, Y., J. Derber, A. Collard, D. Dee, R. Treadon, G. Gayno, and J. A. Jung, 2014: Enhanced radiance bias correction in the National Centers for Environmental Pre-diction’s Gridpoint Statistical Interpolation data assimilation system. Q.J.R. Meteorol. Soc., 140, 1479–1492.
8 JCSDA QUARTERLY NO. 57, FALL 2017
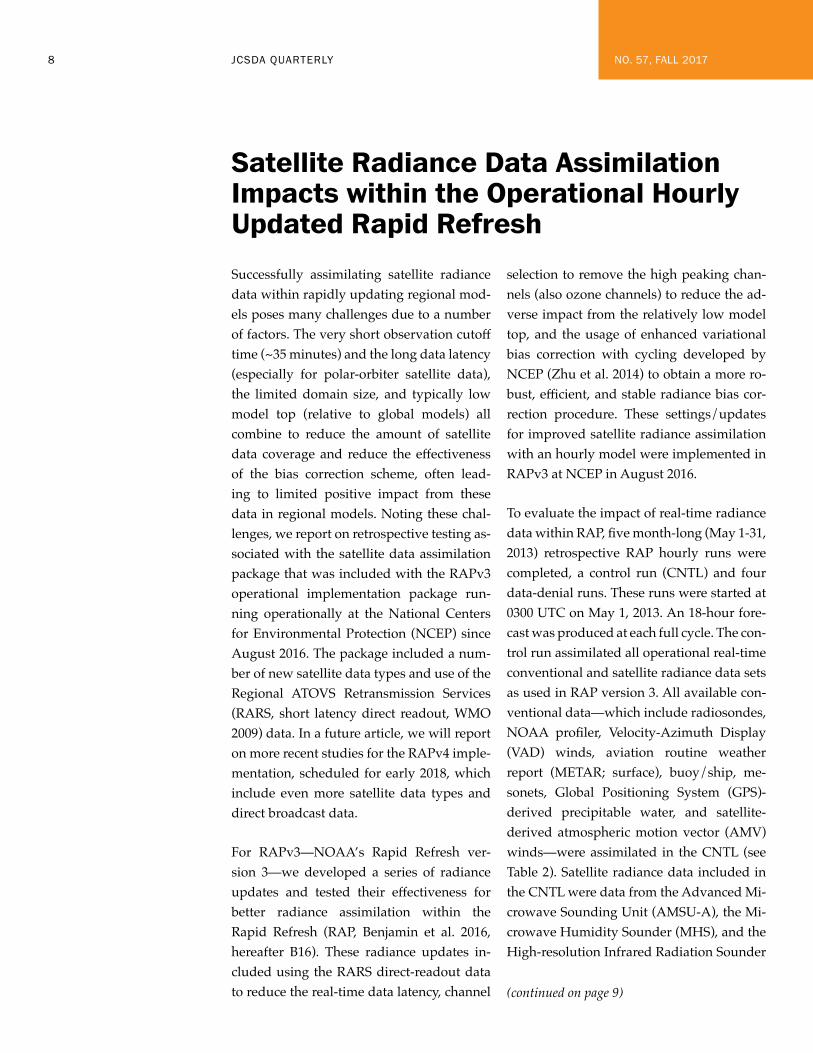
Successfully assimilating satellite radiance data within rapidly updating regional mod-els poses many challenges due to a number of factors. The very short observation cutoff time (~35 minutes) and the long data latency (especially for polar-orbiter satellite data), the limited domain size, and typically low model top (relative to global models) all combine to reduce the amount of satellite data coverage and reduce the effectiveness of the bias correction scheme, often lead-ing to limited positive impact from these data in regional models. Noting these chal-lenges, we report on retrospective testing as-sociated with the satellite data assimilation package that was included with the RAPv3 operational implementation package run-ning operationally at the National Centers for Environmental Protection (NCEP) since August 2016. The package included a num-ber of new satellite data types and use of the Regional ATOVS Retransmission Services (RARS, short latency direct readout, WMO 2009) data. In a future article, we will report on more recent studies for the RAPv4 imple-mentation, scheduled for early 2018, which include even more satellite data types and direct broadcast data.
For RAPv3—NOAA’s Rapid Refresh ver-sion 3—we developed a series of radiance updates and tested their effectiveness for better radiance assimilation within the Rapid Refresh (RAP, Benjamin et al. 2016, hereafter B16). These radiance updates in-cluded using the RARS direct-readout data to reduce the real-time data latency, channel
selection to remove the high peaking chan-nels (also ozone channels) to reduce the ad-verse impact from the relatively low model top, and the usage of enhanced variational bias correction with cycling developed by NCEP (Zhu et al. 2014) to obtain a more ro-bust, efficient, and stable radiance bias cor-rection procedure. These settings/updates for improved satellite radiance assimilation with an hourly model were implemented in RAPv3 at NCEP in August 2016.
To evaluate the impact of real-time radiance data within RAP, five month-long (May 1-31, 2013) retrospective RAP hourly runs were completed, a control run (CNTL) and four data-denial runs. These runs were started at 0300 UTC on May 1, 2013. An 18-hour fore-cast was produced at each full cycle. The con-trol run assimilated all operational real-time conventional and satellite radiance data sets as used in RAP version 3. All available con-ventional data—which include radiosondes, NOAA profiler, Velocity-Azimuth Display (VAD) winds, aviation routine weather report (METAR; surface), buoy/ship, me-sonets, Global Positioning System (GPS)-derived precipitable water, and satellite-derived atmospheric motion vector (AMV) winds—were assimilated in the CNTL (see Table 2). Satellite radiance data included in the CNTL were data from the Advanced Mi-crowave Sounding Unit (AMSU-A), the Mi-crowave Humidity Sounder (MHS), and the High-resolution Infrared Radiation Sounder
Satellite Radiance Data Assimilation Impacts within the Operational Hourly Updated Rapid Refresh
(continued on page 9)

9 JCSDA QUARTERLY NO. 57, FALL 2017
(HIRS-4). RARS data are used for radiance transmission for these RAP experiments. In this study, the RARS data are applicable to AMSU-A and MHS data on NOAA-18, NOAA-19, METOP-A, and METOP-B sat-ellite planforms. Four data-denial experi-ments were performed, including RARS, all-radiance, aircraft, and radiosonde denial. Table 1 shows the list of these five retrospec-tive runs with observation types withheld. The RARS data-denial experiment (remov-ing the RARS direct readout radiance data only; all other data retained as with CNTL) was used to evaluate the added impact from the real-time RARS data as well as to pre-evaluate the benefits from future direct readout data. The all-radiance data-denial run (removing all radiance data, including RARS data) was used to evaluate the overall impact from radiance data within RAP. This also showed the impact from radiance data within the operational RAP, the RAP version 3. In order to show the relative impact of ra-diance data on other observations, two more data-denial runs were conducted, one for aircraft (including temperature, wind, and relative humidity) and one for radiosonde (including temperature, relative humidity, wind, and surface pressure).
All the four data-denial experiments can be compared with the CNTL through the radio-sonde verification for temperature, relative humidity, and wind. We evaluate the data impact through the comparison of all four data-denial experiments with the CNTL as verified against the available rawinsonde data in the RAP domain over a one-month period. In these data-denial experiments, we compare forecast results of the CNTL when all data are used against the selective denial of certain data classes as noted in Table 1. A positive impact of a data source thus in-dicates that the CNTL, with that data type present, produced better forecasts than the experiment in which that data type was not used. The metric for the quantitative impact of a data source is normalized reduction in root-mean-square error (RMSE)—that is, (EXPT – CNTL)/CNTL, where EXPT is the RMSE of the experiment in which the given data type is not used and CNTL is the RMSE of the control experiment in which all data are used. (More details about the normal-ized percentage impact can be found in Ben-jamin et al. 2004.)
EXPERIMENT CONTROL— ALL OBSERVATIONS USED
OBSERVATION TYPE AND VARIABLE DENIED
No RARS radiance Radiance brightness temperature (AMSU-A, MHS) from RARS direct readout data
No radiance Radiance brightness temperature (AMSU-A, MHS, HIRS-4, GOES sounder) including RARS data
No aircraft Aircraft T, V. RH
No radiosonde Rawinsonde T, V, RH, Ps
(continued on page 10)
Table 1: Observation impact experiments in this study. Those observational variables denied to the RAP are shown for each experiment: radiance, temperature (T), horizontal wind (V), relative humidity (RH), and surface pressure (Ps)

10 JCSDA QUARTERLY NO. 57, FALL 2017
First, we look at the impact from the RARS data and from all-radiance data. Figure 1 shows the normalized 1–18 hour forecast RMSE reduction (against radiosonde data, 1000–100 hPa averaged) of RARS data-de-nial (blue) and all-radiance data-denial (red) runs compared with the CNTL, respectively. We note that since the 6-hour and 18-hour forecasts are initialized at times that have the longest interval since the introduction of Global Forecast System (GFS) information, which occurs at the end of each partial cycle (0900 UTC and 2100 UTC, see B16, section 2 for more details), the strongest data impact should be anticipated for these forecasts. It can be seen that radiance data have a very consistent small positive impact for all vari-ables (temperature, relative humidity, and wind) and for all forecast lead times (1-18 h), with confidence at the 95 percent level. For temperature, the normalized impact is from
0.7 percent–1.6 percent; 1-hour and 18-hour forecasts have the biggest impact, nearly 0.01 K and 0.025 K RMS error reduction. For relative humidity, the normalized impact is from 0.7 percent–1.1 percent; 6-hour and 18-hour forecasts have the biggest impact, near-ly 0.25 percent and 0.3 percent RMS error reduction. For wind, the normalized impact is from 1.0 percent–1.6 percent; 6-hour and 18-hour forecasts have the biggest impact, nearly 0.06 m/s and 0.07 m/s RMS error re-duction. The real-time RARS data alone also have positive impact, with averaged nor-malized impact of 0.3–0.9 percent for tem-perature, 0.2 percent–0.3 percent for relative humidity and wind. Depending on variables and forecast hours, it is noted that use of the RARS data contributes about 10–35 percent of the data impact from all-radiance data. It
(continued on page 11)
Figure 1: Normalized RMSE reduction [(EXPT – CNTL)]: (upper left) temperature (K), (upper right) relative humidity (%), (lower right) vector wind magnitude (m s-1)] from the RARS denial run (blue) and all-radiance denial run (red) 1–18 hour forecasts against rawinsonde observations. Statistics are computed for 1000-100-hPa layer over the RAP domain. The retrospective period is May 1-31, 2013. The error bar indicates the ±1.96 standard error from the mean impact, representing the 95 percent confidence threshold for significance.
11 JCSDA QUARTERLY NO. 57, FALL 2017
is also expected that other future low data latency direct readout/broadcast data and/or low latency geostationary data could con-tribute significantly if used within RAP.
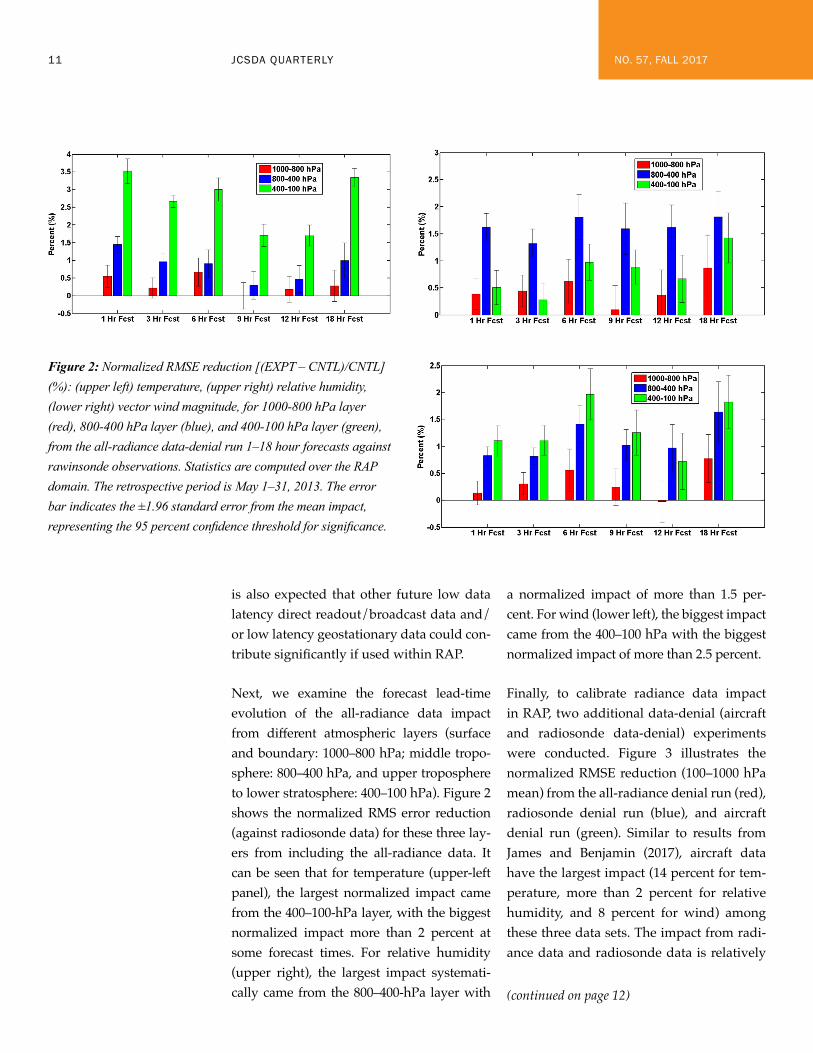
Next, we examine the forecast lead-time evolution of the all-radiance data impact from different atmospheric layers (surface and boundary: 1000–800 hPa; middle tropo-sphere: 800–400 hPa, and upper troposphere to lower stratosphere: 400–100 hPa). Figure 2 shows the normalized RMS error reduction (against radiosonde data) for these three lay-ers from including the all-radiance data. It can be seen that for temperature (upper-left panel), the largest normalized impact came from the 400–100-hPa layer, with the biggest normalized impact more than 2 percent at some forecast times. For relative humidity (upper right), the largest impact systemati-cally came from the 800–400-hPa layer with
a normalized impact of more than 1.5 per-cent. For wind (lower left), the biggest impact came from the 400–100 hPa with the biggest normalized impact of more than 2.5 percent.
Finally, to calibrate radiance data impact in RAP, two additional data-denial (aircraft and radiosonde data-denial) experiments were conducted. Figure 3 illustrates the normalized RMSE reduction (100–1000 hPa mean) from the all-radiance denial run (red), radiosonde denial run (blue), and aircraft denial run (green). Similar to results from James and Benjamin (2017), aircraft data have the largest impact (14 percent for tem-perature, more than 2 percent for relative humidity, and 8 percent for wind) among these three data sets. The impact from radi-ance data and radiosonde data is relatively
(continued on page 12)
Figure 2: Normalized RMSE reduction [(EXPT – CNTL)/CNTL] (%): (upper left) temperature, (upper right) relative humidity, (lower right) vector wind magnitude, for 1000-800 hPa layer (red), 800-400 hPa layer (blue), and 400-100 hPa layer (green), from the all-radiance data-denial run 1–18 hour forecasts against rawinsonde observations. Statistics are computed over the RAP domain. The retrospective period is May 1–31, 2013. The error bar indicates the ±1.96 standard error from the mean impact, representing the 95 percent confidence threshold for significance.

12 JCSDA QUARTERLY NO. 57, FALL 2017
small compared with the impact from air-craft data, especially for temperature and wind. Radiance data impact is comparable with (sometimes superior to) the impact from radiosonde data.
Satellite radiance data have been shown to have small but consistent positive impact with significance for the hourly updated RAP model system. Currently, we are test-ing and finalizing the radiance updates for the RAP version 4 (planned operational implementation in the early of 2018), which includes new data sets (e.g., ATMS, CrIS, IASI etc.) through direct broadcast with low latency. Some additional positive impact has been seen from the RAPv4 radiance up-dates through our preliminary work. We plan to expand this preliminary work to a longer retrospective period and report it in the future. We also plan to incorporate the
ABI data from GOES-16 into RAP and the High-Resolution Rapid Refresh (HRRR) in the future.
Haidao Lin (CIRA/CSU and NOAA-ESRL/GSD), Steve Weygandt and Stan Benjamin (NOAA-ESRL/GSD)[email protected]
This news item is based on the following ar-ticle: Lin, H., S.S. Weygandt, S.G. Benjamin, and M. Hu, 2017: Satellite Radiance Data Assimi-lation within the Hourly Updated Rapid Refresh. Wea. Forecasting, 32, 1273–1287, https://doi.org/10.1175/WAF-D-16-0215.1.
©American Meteorological Society. Used with permission.
Figure 3: Normalized RMSE reduction [(EXPT – CNTL)/CNTL] (%): (upper left) temperature, (upper right) relative humidity, (lower right) vector wind magnitude, from the all-radiance data-denial run (red), radiosonde data-denial run (blue), and aircraft data-denial run (green) 1–18 hour forecasts against rawinsonde observations. Statistics are computed for 1000-100-hPa layer over the RAP domain.
(continued on page 13)

13 JCSDA QUARTERLY NO. 57, FALL 2017
References:Benjamin, S.G., B.E. Schwartz, E.J. Szoke, and S.E. Koch, 2004: The value of wind pro-filer data in U.S. weather forecasting. Bull. Amer. Meteor. Soc., 85, 1871–1886, doi:http://dx.doi.org/10.1175/BAMS-85-12-1871.
Benjamin, S.G., and Coauthors, 2016: A North American hourly assimilation and model forecast cycle: The Rapid Refresh. Mon. Wea. Rev., 144, 1669-1694, doi:http://dx.doi.org/10.1175/MWR-D-15-0242.1.
James, E., and S.G. Benjamin, 2017: Obser-vation system experiments with the hourly updating Rapid Refresh model using GSI hybrid ensemble/variational data assimi-
lation. Mon. Wea. Rev., doi:10.1175/MWR-D-16-0398.1, in press.
WMO, 2009: Final report of the WMO RARS Implementation Group and IGDDS Imple-mentation Group joint third meeting, 37 pp. [Available online at http://www.wmo.int/pages/prog/sat/documents/RARS-IGDDS-IG-3_Final-Report.pdf.]
Zhu, Y., J. Derber, A. Collard, D. Dee, R. Treadon, G. Gayno, and J.A. Jung, 2014: Enhanced radiance bias correction in the National Centers for Environmental Pre-diction’s Gridpoint Statistical Interpolation data assimilation system. Quart. J. Roy. Mete-or. Soc., 140, 1479–1492, doi:10.1002/qj.2233.
This article highlights recent logistics and modifications to the Gridpoint Statistical In-terpolation (GSI) software to accommodate upstream and downstream changes associ-ated with using CrIS and CrIS-FSR data.
New CrIS Full Spectral Resolution Data
The Joint Polar Satellite System (JPSS) Pro-gram Office and JPSS Science Teams im-proved the spectral resolution of the Cross-track Infrared Sounder (CrIS) on Suomi National Polar-orbiting Partnership (SNPP). This change shortened the spectral resolu-tion and increased the channel counts for band-2 and band-3 (midwave and short-wave regions respectively). The CrIS chan-nel counts increased from 1305 to 2211. These data are typically identified as CrIS
Full Spectral Resolution or CrIS-FSR. CrIS-FSR is expected to be the standard CrIS reso-lution for JPSS-1 (NOAA-20) and beyond.
To identify the two different resolutions, The National Environmental Satellite, Data, and Information Service (NESDIS) Center for Satellite Applications and Research (STAR) Algorithm Scientific Software Integration and System Transition Team (ASSIST) incor-porated a new flag MTYP to the CrIS BUFR template. When the flag is set to FSR the full spectral resolution data follows. The guard channels were also added to the BUFR for anyone wanting to remove the apodization. The rest of the CrIS-FSR BUFR template re-
Recent Cross-track Infrared Sounder (CrIS) Changes in the Gridpoint Statistical Interpolation (GSI) Software
(continued on page 14)

14 JCSDA QUARTERLY NO. 57, FALL 2017
mains the same as the current CrIS. NES-DIS/STAR/ASSIST is generating the CrIS-FSR 2211 channel data in near real time, and they are available at: ftp://ftp.star.nesdis.noaa.gov/pub/smcd/opdb/letitias/NU-CAPS/CrIS_HR_BUFR/
The GSI software was modified and tested to read both the CrIS and CrIS-FSR data. These changes have passed the GSI Review Com-mittee’s requirements and are now available to all GSI users. The National Centers for En-vironmental Prediction (NCEP) has incorpo-rated these GSI changes into their parallel tests and implemented them as part of the NCEP Environmental Modeling Center (EMC) 2017 Global Forecast System Update package.
Hyperspectral Infrared Channel Subset Modifications
GSI users have found it difficult to use all of the channels from the hyperspectral infra-red instruments. Channels which couldn’t be used in their assimilation systems, for various reasons, had to be kept throughout the GSI. The alternative was to develop a subset for the various instruments such as the Atmospheric Infrared Sounder (AIRS) 281, AIRS 325, Infrared Atmospheric Sound-ing Interferometer (IASI) 300, IASI 616, IASI 500, and CrIS 399. In the past, GSI users were constrained to assimilating one of these designated subsets or receiving all of the channels. A few years ago the Community Radiative Transfer Model (CRTM) Team de-veloped the ability to accommodate a user-defined subset of channels. This was the first step toward removing the specific channel subset constraints in the GSI.
The software modifications have now been incorporated into the GSI to take advantage of these user-defined subset capabilities
for the hyperspectral infrared instruments. Channel use is now defined by editing the channel entries in the satinfo file. If a chan-nel is not defined in the satinfo file, it is basi-cally ignored by the system. The channel is not counted for array allocations, is ignored during the read routine, and the CRTM for-ward model is not run. This has the potential to save memory and computer time.
NCEP has taken this one step further and rejects all the monitored hyperspectral infra-red channels in their early run of the global forecast model. The GSI user community now has the capability to read the full chan-nel files (e.g., AIRS 2378, CrIS1305, CrIS-FSR 2211, and IASI 8641) or any subset of hyper-spectral infrared channels, and to assimilate and monitor only those channels suitable to their current requirements.
The GSI software was modified and tested to use these subset modifications for the hyperspectral infrared instruments. These changes have passed the GSI Review Com-mittee’s requirements and are also available to all GSI users. To take advantage of these changes for AIRS, IASI and CrIS, a recent version of the CRTM is required. NCEP has incorporated these GSI and CRTM changes in their parallel tests and implemented them as part of the NCEP/EMC 2017 Global Fore-cast System Update package.
EARS/RARS and Direct Broadcast Data
Some Numerical Weather Prediction (NWP) Centers also get satellite data via the Euro-pean Organisation for the Exploitation of Me-teorological Satellite (EUMETSAT)’s Early Ad-vanced Retransmission Service (EARS)/Direct Readout And Relay System (RARS) and/or
(continued on page 15)

15 JCSDA QUARTERLY NO. 57, FALL 2017
the Direct Broadcast (DB) data available at the Space Science and Engineering Center (SSEC) at the University of Wisconsin. These data are similar, and in most cases identical, to data col-lected at the official satellite downlink sites and broadcast by NESDIS and EUMETSAT. The main advantage is the EARS/RARS and DB data are available with less latency for shorter data cutoff times of regional forecast models.
The GSI has had the capability to use most of the EARS/RARS data for several years. The main sensors were the Advanced Microwave Sounding Unit (AMSU-A/B), Microwave Hu-midity Sensor (MHS) and the High Resolution Infrared Radiation Sounder (HIRS). This ca-pability is now expanded to include IASI, the Advanced Technology Microwave Sounder (ATMS), CrIS, and CrIS-FSR. An error was dis-covered in the antenna correction removal for MHS within the CRTM. This was fixed in the CRTM’s coefficient files and now can be add-ed to the useable DB/RARS sensor list.
The GSI reads the RARS/EARS and DB data as separate files. The data are also treated
separately in the GSI’s thinning routine. Pri-ority is given to data from the official down-link sites, then to RARS/EARS and DB. The effect of this is to fill in gaps in the official data with the RARS/EARS and DB. All the data then goes through the appropriate quality control, cloud tests and is assimilat-ed regardless of its origin.
A note is in order here: IASI data from RARS/EARS contains 500 channels versus the 616 distributed by NESDIS. The hyper-spectral infrared channel subset modifica-tions must be in place and connected to the proper CRTM coefficient files to properly use the IASI files interchangeably. All of the pieces exist but must be installed. Also, be-fore using the MHS instruments, users must have a version of the CRTM that has the proper antenna removal coefficient files.
NCEP/EMC and the Science and Technol-ogy Corporation (STC), in collaboration with other NWP Centers, have worked out
(continued on page 16)
Figure 1: Channel correlation matrix for CrIS-FSR. This matrix is used by the GSI to account for various channel cross-correlations. Using this matrix allows for better characterization of each channel and more optimal use. Courtesy of Kristen Bathmann (NCEP/EMC/IMSG).

16 JCSDA QUARTERLY NO. 57, FALL 2017
a 431 CrIS-FSR channel subset. This new subset is expected to be used to distribute CrIS-FSR data from the EARS/RARS and DB sites. Recently NESDIS/STAR/ASSIST has also started generating a CrIS-FSR 431 channel subset. It is available at: ftp://ftp.star.nesdis.noaa.gov/pub/smcd/opdb/le-titias/NUCAPS/CrIS_HR_BUFR_Subset/. The CrIS-FSR 431 subset was also tested and the GSI is ready when this dataset becomes available from RARS/EARS and DB.
The GSI was modified and tested to use all of the currently available instrument/satellite combinations. These changes have passed the GSI Review Committee’s requirements and are also available to all GSI users. NCEP has also incorporated these GSI changes in its par-allel tests and implemented them for a portion of the sensors as part of the NCEP/EMC 2017 Global Forecast System Update package. Not all of the data and CRTM changes were avail-able by the parallel start date.
Review CrIS Quality Control and Thin-ning Routines
Current projects are to review and poten-tially improve the quality control, thinning criteria, and performance of the read_cris subroutine in the GSI. The design of the CrIS instrument posed some unique challenges to the way it is used, specifically the fields of view within a field of regard twist along the scan line. A post-launch change also includ-ed adding cloud information into the BUFR file, which can be used for quality control.
Two quality control procedure changes are also being tested. All FOVs within a FOR are now reviewed instead of FOV=5, and the channel validity check is now last. In look-ing at all FOVs, the scan angle tests were up-dated to account for the sensor twist. Adding
all of the FOVs increased the total number of profiles by about 500 in each GDAS cycle. The channel validity check converts the ra-diances in the BUFR file to Brightness Tem-peratures, then checks to see if the Bright-ness Temperatures are reasonable. The time needed to convert radiances to brightness temperatures increases as the number of channels increases. Moving this conversion and validity check to be the final test allows all of the other tests to reject a profile before the time is taken to do this conversion.
Cloud information (cloud amount, cloud height) derived from the Visible Infrared Im-aging Radiometer Suite (VIIRS) was added to the BUFR file after SNPP launch and is cur-rently being updated. This information is now part of the thinning routine where the profile with the lowest clouds (or no clouds) is cho-sen. If the VIIRS cloud information is missing, the read_cris subroutine reverts to using a sur-face channel to determine the clearest profile.
The original test chose the profile with the warmest brightness temperature. This has been modified to use the profile with the warmest surface channel temperature which is colder than the model surface tem-perature. Any profile with a surface channel temperature warmer than the model surface temperature is considered clear. If there are multiple clear profiles, the one closest to the center of the thinning “box” is chosen. The GSI software modifications for this project are currently in a branch within NCEP’s Software Management System (subversion) and are starting the review process.
Tests are being conducted with NESDIS/STAR/ASSIST, NESDIS Advanced Satellite
(continued on page 17)

17 JCSDA QUARTERLY NO. 57, FALL 2017
Products Branch (ASPB) and the STAR JPSS Cloud Team to improve the cloud informa-tion in the CrIS-FSR BUFR file. Once com-pleted, the new VIIRS cloud algorithm will be transitioned to NESDIS Operations and be included in the CrIS-FSR BUFR for JPSS-1.
Review the CrIS Channel Selection Used by NCEP’s GDAS/GFS
When the radiances from certain instru-ments, like CrIS and IASI, are apodized, their channel errors become correlated with neighboring channels. NWP Centers are moving toward using channel correla-tion matrices to characterize these channel inter-dependencies and to more effectively use various channels in their assimilation systems. The Centers are showing modest forecast skill improvements by doing this. As a result, the Cooperative Institute for Meteorological Satellite Studies (CIMSS) is working with NCEP/EMC to generate this matrix for CrIS-FSR. Some modifications to the matrix generation software as well as
two different techniques are being investi-gated. Figure 1 is a CrIS-FSR correlation ma-trix derived from the technique NCEP/EMC currently plans to use.
James Jung (CIMSS, University of Wisconsin, Madison, WI)[email protected]
Acknowledgements:These projects would not have been success-ful without the coordination with and con-tributions from people at: the JPSS Program Office; EMC and Central Operations (NCO) branches of NCEP; ASSIST, JPSS Science Teams and ASPB within NESDIS/STAR; the Global Modeling and Assimilation Office (GMAO) and the Center for Climate Simu-lation (NCCS) within the National Aero-nautical and Space Administration (NASA); SSEC; Science Technology Corporation; and the CRTM Team. This work was supported by JPSS through Grant NA15NES4320001.

18 JCSDA QUARTERLY NO. 57, FALL 2017
On July 11–14, the Community Gridpoint Sta-tistical Interpolation and Ensemble Kalman Filter (GSI/EnKF) Data Assimilation System Tutorial was successfully hosted by the De-velopmental Testbed Center (DTC), the NCEP Environmental Modeling Center (EMC), and the JCSDA, in a collaborative effort.
The NOAA Center for Weather and Climate Prediction (NCWCP) hosted the first three days of the tutorial and the last half-day of the tutorial took place on the campus of Uni-versity of Maryland, College Park, Maryland.
This marked the seventh Community GSI tu-torial and the second for EnKF. This joint tu-torial continues to be an important outreach event for the data assimilation community, providing descriptions and usage details for these operational data assimilation systems.
The latest tutorial reached maximum ca-pacity with 53 registered participants. They came from government, academia, and the private sector, from both the United States and the international community.
This tutorial included both lectures by invit-
ed speakers and practical hands-on sessions, tailored for the latest GSI and EnKF code to be released by September 2017. Speakers came from major development and sup-port teams, including NCEP, NASA, NOAA, NCAR, JCSDA, the DTC, and University of Maryland. The lectures covered fundamen-tal topics (compilation, run, and diagnostics) and advanced topics (e.g., pre-processing, radiance and radar data assimilation, EnVar, and code infrastructure). Practical sessions throughout the tutorial included instructed practice as well as an open forum where par-ticipants installed and ran GSI and EnKF, us-ing their cases on their own computers.
The presentations and lectures from this tu-torial are posted at http://www.dtcenter.org/com-GSI/users/docs/index.php.
For more information on the GSI and EnKF systems and their joint community support, please visit: http://www.dtcenter.org/com-GSI/users/index.php and http://www.dt-center.org/EnKF/users/.
Hui Shao (Developmental Testbed Center)[email protected]
2017 Joint GSI and EnKF Community Tutorial MEETING REPORT

19 JCSDA QUARTERLY NO. 57, FALL 2017
Sandra Claar is delighted to be returning to NOAA after nearly a four-year separation. Sandra is replacing Ana Carrion as the face of the Joint Center for Satellite Data Assimi-lation and will be providing administration support. Previously Sandra was an Action Officer, working for more than five years with both the National Polar-orbiting Operational Environmental Satellite System (NPOESS) and Joint Polar Satellite System (JPSS). After being on the side of building the satellites, she is looking forward to learning about the data coming from those satellites.
Working for the nation’s weather satellites program feels full circle for her. Sandra’s original career goal was to be a planetari-um director. She not only wanted to run the equipment; she also wanted to write and design the shows. To that end, she skipped through a number of majors in college to get an arts and science background. She started as an Earth and Space Science Edu-cation major and graduated with a Theater degree. It goes without saying that she has a passion for both.
Sandra spent more than 10 years working professionally in theater, focusing on the technical and business sides of the industry. She is not an actor but she does have one professional acting credit. Sandra was the understudy to the understudy to the dead body in “Arsenic and Old Lace” and yes, she did get on stage once. You can laugh now. (Bonus points if you know that title!)
When she is not working at the JCSDA, San-dra enjoys playing with her two fur-sons, Sebastian (a 8-year-old English cocker span-iel named for Sebastian Cabot) and Scotty (a 7-month-old orange tabby named for Lt. Commander Montgomery Scott). (More bo-nus points if you know both those referenc-es!) Her other interests include archaeology, travel, science fiction and fantasy, and meta-physics and the paranormal. Sandra is also a writer, currently studying copywriting, and is researching several creative projects. Her goal is to move to Hawaii and live out her days writing on the beach.
Welcome Sandra ClaarPEOPLE
CAREER OPPORTUNITIES The Joint Center for Satellite Data Assimilation is currently seeing qualified candidates to fill several varied job openings. Descriptions of these positions and directions for applying may be found via the University Corporation for Atmospheric Research the Cooperative Programs for the Advancement of Earth System Science (UCAR/CPAESS) webpage: https://cpaess.ucar.edu/employment-announcements.
Opportunities in support of JCSDA may also be found at http://www.jcsda.noaa.gov/careers.php as they become available.

20 JCSDA QUARTERLY NO. 57, FALL 2017
EDITOR’S NOTE I hope you have found this edition of the JCSDA newsletter interesting and informa-tive. I am always grateful for the time and effort taken by contributing authors to doc-ument their work for this audience. In the course of preparing the last several issues, I have become even more grateful, perhaps, for the diligence of assistant editor Biljana Orescanin, who has sought out contributors and maintained contact with them through the process, preparing and editing articles so that the finished publication is well writ-ten—and timely. It is no exaggeration to state that the Quarterly has been revitalized as a consequence of her unflagging zeal.
It is appropriate now to consider how to make the newsletter even better and more relevant. When I reflect upon which publi-cations are most meaningful to me, I notice that they share a common distinguishing factor, namely that they facilitate commu-
nication within and among a community, and not merely to that community. With the goal of evolving to such a state, I challenge our readership—you!—to become more proactive with the newsletter. I encourage you to reach out to the editorial staff with your own suggestions for articles. More-over, I welcome comments on previously published articles, opinion pieces, and let-ters to the editor, and of course, notices of upcoming events and opportunities of in-terest to the JCSDA readers.
I appreciate the opportunity to extend this proposal to you. The regular Note from the Director will return in this space in the next issue!
Best regards,
Jim YoeJCSDA Chief Administrative Officer and [email protected]
Unsolicited articles for the JCSDA Quarterly Newsletter are encouraged as are suggestions for seminar speakers or topics. Please send them to Biljana Orescanin, [email protected].

21 JCSDA QUARTERLY NO. 57, FALL 2017
UPCOMING EVENTSSCIENCE CALENDAR
MEETINGS OF INTEREST
DATE LOCATION WEBSITE TITLE
September 11–15, 2017
Florianopolis, Brazil
http://www.cptec.inpe.br/das2017/ Seventh International WMO Symposium on Data Assimilation
October 23-27, 2017 ECMWF (Reading, UK)
https://events.oma.be/indico/event/18/page/7
13th Stratosphere-troposphere Processes And their Role in Climate (SPARC) Data Assimilation workshop
November 29– December 5, 2017
Darmstadt, Germany
https://cimss.ssec.wisc.edu/itwg/itsc/itsc21/index.html
21st International TOVS Study Conference
December 11–15, 2017 New Orleans, USA http://fallmeeting.agu.org/2016/future-meetings/
American Geophysical Union Fall Meeting
January 7–11, 2018 Austin, TX https://annual.ametsoc.org/2018/ 98th AMS Annual Meeting
MEETINGS AND EVENTS SPONSORED BY JCSDA
DATE LOCATION TITLE
Tentative Dates: July 22-August 3, 2018
Tentative Location: Bozeman, MT
JCSDA Summer Colloquium on Satellite Data Assimilation*
TBD 2018 TBD JCSDA 16th Technical Review Meeting & Science Workshop on Satellite Data Assimilation
JCSDA seminars are generally held on the third Wednesday of each month at the NOAA Center for Weather and Cli-mate Prediction, 5830 University Research Court, College Park, MD. Presentations are posted at http://www.jcsda.noaa.gov/JCSDASeminars.php prior to each seminar. Off-site personnel may view and listen to the seminars via web-cast and conference call. Audio recordings of the seminars are posted at the website the day after the seminar. If you would like to present a seminar, contact Ling Liu, [email protected], or Biljana Orescanin, [email protected].
* More information to come in the next issue or in a separate announcement.