Embed Size (px)
Citation preview

John Keells Holdings PLC
Annual Report 2016/17
CorporateCraftsmanship


The John Keells Group is and has always been, a benchmark of corporate
excellence in Sri Lanka, with diversified investments across several key
growth sectors that have made us the largest listed conglomerate on the
Colombo Stock Exchange. Over the years we have crafted your Company
to be a model of business excellence; deepening our local sector expertise,
strengthening our partnerships with the communities and people whose
lives we touch and developing a reputation for delivering to the highest of
standards with innovation, creativity and finesse.
We have honed our tradecraft, applying our own distinctive management
skills to the design and administration of our portfolio, using our wide
experience to execute the right decisions at the right time; strategically
entering and exiting markets while ensuring that our vision and virtuosity
remain the guiding principles of all that we do.
Today we are a multi-faceted organisation possessing the imagination,
insight and understanding required to keep such a complex group of
companies vibrant and strong. We have selectively shaped the strengths
and synergies that now set us apart; the talent and flair of our human capital,
the focus on triple bottom line performance, the inspired management of
our portfolio and the principles of good governance we now exemplify.
Our commitment to long-term partnerships, entrepreneurship and
sustainable growth remains strong. Our desire to constantly renew our
capabilities and stay relevant is obsessive, as we continuously evolve our
chain of value to accelerate the Group into the future. Now, we look forward
to crafting the future by unleashing our potential for growth and expansion
in the years ahead; setting the standards in all that we undertake to do.

2 John Keells Holdings PLC | Annual Report 2016/17
Group Highlights
04 Introduction to the Report
06 Our Business Model
08 Organisational Structure
09 Year at a Glance
10 Performance Highlights
12 Chairman’s Message
Governance
21 Board of Directors
23 Group Executive Committee
24 Group Operating Committee
26 Corporate Governance Commentary
Management Discussion and Analysis
Group Consolidated Review
60 The Economy
63 Capital Management Review
Financial and Manufactured Capital
Natural Capital
Human Capital
Social and Relationship Capital
Intellectual Capital
83 Outlook
85 Strategy, Resource Allocation and Portfolio Management
91 Materiality and Stakeholder Relationships
101 Risks, Opportunities and Internal Controls
106 Share and Warrant Information
Industry Group Review
116 Transportation
124 Leisure
136 Property
144 Consumer Foods and Retail
154 Financial Services
160 Information Technology
166 Other including Plantation Services
Contents
166 Other including
Plantation Services
124 Leisure
116 Transportation
136 Property
144 Consumer Foods and Retail
154 Financial Services
160 Information Technology

Group Highlights | Governance | Management Discussion & Analysis | Financial Statements | Supplementary Information 3
www.keells.com
Financial Statements
175 Annual Report of the Board of Directors
180 The Statement of Directors’ Responsibility
181 Independent Auditors’ Report
182 Income Statement
183 Statement of Comprehensive Income
184 Statement of Financial Position
185 Statement of Cash Flows
186 Statement of Changes in Equity
191 Notes to the Financial Statements
Supplementary Information
261 History of the John Keells Group
262 Economic Value Statement
264 Decade at a Glance
266 Indicative US Dollar Financial Statements
268 Sri Lankan Economy
270 Group Real Estate Portfolio
272 Memberships Maintained by the Group
273 Independent Assurance Statement on Non-Financial Reporting
276 Group Directory
283 GRI G4 Content Index
288 Glossary of Financial Terms
289 Notice of Meeting
290 Corporate Information
291 Proxy Form
About UsJohn Keells Holdings PLC (JKH) is one of
the largest listed firms on the Colombo
Stock Exchange, with business interests in
Transportation, Leisure, Property, Consumer
Foods and Retail, Financial Services,
Information Technology and Plantations
among others.
Started in the early 1870s as a produce
and exchange broking business by two
Englishmen, Edwin and George John, the
Group has been known to constantly re-align,
re-position, and re-invent itself in pursuing
growth sectors of the time.
JKH was incorporated as a public limited
liability company in 1979, and listed on the
Colombo Stock Exchange in 1986. By way of
issuing Global Depository Receipts (GDRs) on
the Luxembourg Stock Exchange, the firm
subsequently went on to become the first Sri
Lankan company to be listed overseas. Today,
the firm’s market capitalisation exceeds USD
1.5 billion.
The Group’s investment philosophy is
based on a positive outlook, bold approach,
commitment to delivery, and flexibility to
change. JKH is also committed to maintaining
integrity, ethical dealings, sustainable
development, and greater social responsibility
in a multi-stakeholder context. JKH is a full
member of the World Economic Forum and a
member of the UN Global Compact.
The Holding Company of the Group - John
Keells Holdings PLC, is based at 117, Sir
Chittampalam A. Gardiner Mawatha, Colombo
2, and has offices and businesses located
across Sri Lanka, India, and the Maldives.
12 Chairman’s Message
63 Capital Management Review
85Strategy, Resource Allocation and
Portfolio Management
101Risks, Opportunities and Internal
Controls
106 Share and Warrant Information
289 Notice of Meeting

4 John Keells Holdings PLC | Annual Report 2016/17
Introduction to this Report
We are pleased to present our second
Integrated Report in accordance with the
Integrated Reporting Framework of the
International Integrated Reporting Council
(IIRC).
This report reflects on:
• The value creation model of the Group
which combines different forms of Capital
in the short, medium, and long term
• Governance, risk management, and
sustainability frameworks entrenched
within the John Keells Group
• Financial, operational, environmental, and
social review, together with the results of
the Group
In keeping this Report concise and pertinent
to the year under review, whilst being
comprehensive and detailed, we have
ensured that the commentaries in certain
sections are limited to a helicopter view of the
events and progress within the year, whilst
the Group’s standard policies, operating
guidelines and management approaches are
available on the corporate website.
Scope and BoundaryThe John Keells Annual Report 2016/17 is a
reflection of the Group’s integrated approach
of management (during the period from 1
April 2016 to 31 March 2017), and strives to
deliver a balanced and relevant report that
will bring clarity and detail to the complex
task of reporting a year of diverse business
operations across multiple industry groups.
Material events post this reporting period, up
to the sign off date by the Board of Directors
on 26 May 2017, have been included in this
Report, ensuring a more relevant and up to
date Report.
All Group subsidiary and equity accounted
investees were considered in capturing its
financial performance. For the purpose of
reporting its sustainability performance, the
Group has considered the companies in its
sphere of influence which are the legal entities
for which the Group remains accountable and
has direct control. The companies not included
for reporting on sustainability performance
are companies in which the Group does not
exercise significant management control,
non-operational companies, investment
companies, and companies owning only
land. Such companies have been clearly
identified in the reporting boundary specified
in the Group Directory 2016/17. In expanding
its sustainability scope, going forward, the
Group will also seek to report on companies
over which it does not exercise significant
management control, where relevant.
Adoption of the Integrated Reporting
GuidelinesIn keeping with our attempts to achieve a more
cohesive and efficient approach to corporate
reporting, the Group voluntarily adopted the
Integrated Reporting Framework of the IIRC.
Given the complex task of reporting a year of
operations of a conglomerate, the Group has
strived to deliver a comprehensive, balanced
and relevant Report, while adhering to the
recommendations of the IIRC.
The seven guiding principles in integrated
reporting; strategic focus and future
orientation, connectivity of information,
stakeholder relationships, materiality,
conciseness, reliability and completeness,
consistency and comparability; have been
given due consideration when preparing and
presenting this Report.
Standards and PrinciplesReporting
• Integrated Reporting Framework of the International Integrated Reporting
Council (IIRC)
Governance, Risk Management and Operations
• Laws and regulations of the Companies Act No. 7 of 2007
• Listing Rules of the Colombo Stock Exchange (CSE) and subsequent revisions to
date
• Code of Best Practices on Corporate Governance jointly advocated by the
Securities and Exchange Commission of Sri Lanka (SEC) and the Institute of
Chartered Accountants of Sri Lanka (CA Sri Lanka)
• UK Corporate Governance Code (formerly known as the Combined Code of
2010)
Financial Reporting
• Sri Lanka Accounting Standards (SLFRS/LKAS) issued by the Institute of
Chartered Accountants of Sri Lanka (CA Sri Lanka)
Sustainability and Corporate Social Responsibility Reporting
• 'in accordance' -core option of the Global Reporting Initiative GRI G4 Sustainability
Reporting Guidelines
• United Nations Sustainable Development Goals
• United Nations Global Compact Active Principles
G4 - 17 G4 - 18 G4 - 23
The seven guiding principles in
integrated reporting; strategic
focus and future orientation,
connectivity of information,
stakeholder relationships,
materiality, conciseness, reliability
and completeness, consistency
and comparability; have been
given due consideration when
preparing and presenting this
Report.
Group Highlights | Governance | Management Discussion & Analysis | Financial Statements | Supplementary Information 5
Information VerificationThe accuracy and reliability of information contained in this report has been
reviewed, as applicable, by:
• The Board of Directors
• The Group Executive Committee
• Audit Committee of the Company
• An independent auditor confirming the accuracy of the annual financial statements
• An independent assurance engagement for the non-financial information
prepared 'in-accordance' -core option on GRI G4 guidelines
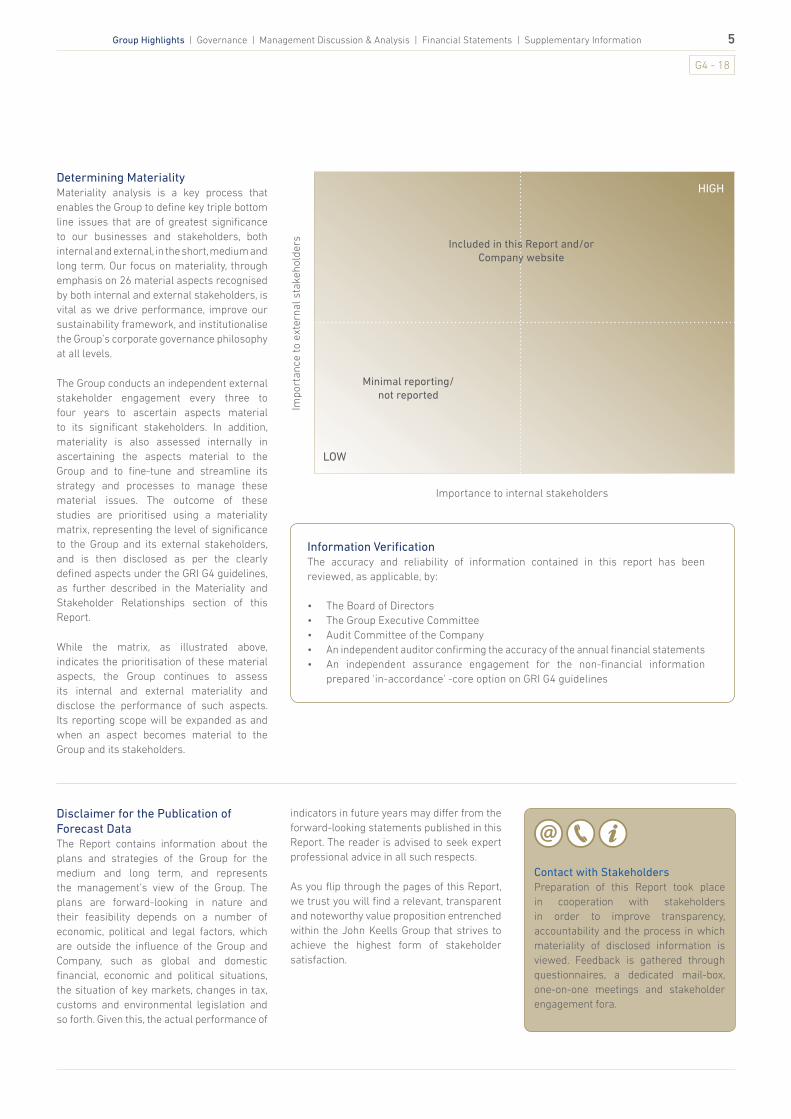
Determining MaterialityMateriality analysis is a key process that
enables the Group to define key triple bottom
line issues that are of greatest significance
to our businesses and stakeholders, both
internal and external, in the short, medium and
long term. Our focus on materiality, through
emphasis on 26 material aspects recognised
by both internal and external stakeholders, is
vital as we drive performance, improve our
sustainability framework, and institutionalise
the Group’s corporate governance philosophy
at all levels.
The Group conducts an independent external
stakeholder engagement every three to
four years to ascertain aspects material
to its significant stakeholders. In addition,
materiality is also assessed internally in
ascertaining the aspects material to the
Group and to fine-tune and streamline its
strategy and processes to manage these
material issues. The outcome of these
studies are prioritised using a materiality
matrix, representing the level of significance
to the Group and its external stakeholders,
and is then disclosed as per the clearly
defined aspects under the GRI G4 guidelines,
as further described in the Materiality and
Stakeholder Relationships section of this
Report.
While the matrix, as illustrated above,
indicates the prioritisation of these material
aspects, the Group continues to assess
its internal and external materiality and
disclose the performance of such aspects.
Its reporting scope will be expanded as and
when an aspect becomes material to the
Group and its stakeholders.
Disclaimer for the Publication of
Forecast DataThe Report contains information about the
plans and strategies of the Group for the
medium and long term, and represents
the management’s view of the Group. The
plans are forward-looking in nature and
their feasibility depends on a number of
economic, political and legal factors, which
are outside the influence of the Group and
Company, such as global and domestic
financial, economic and political situations,
the situation of key markets, changes in tax,
customs and environmental legislation and
so forth. Given this, the actual performance of
Contact with Stakeholders
Preparation of this Report took place
in cooperation with stakeholders
in order to improve transparency,
accountability and the process in which
materiality of disclosed information is
viewed. Feedback is gathered through
questionnaires, a dedicated mail-box,
one-on-one meetings and stakeholder
engagement fora.
indicators in future years may differ from the
forward-looking statements published in this
Report. The reader is advised to seek expert
professional advice in all such respects.
As you flip through the pages of this Report,
we trust you will find a relevant, transparent
and noteworthy value proposition entrenched
within the John Keells Group that strives to
achieve the highest form of stakeholder
satisfaction.
HIGH
LOW
Imp
ort
an
ce t
o e
xte
rna
l sta
ke
ho
lde
rs
Importance to internal stakeholders
Minimal reporting/
not reported
Included in this Report and/or
Company website
G4 - 18

6 John Keells Holdings PLC | Annual Report 2016/17
Our Business Model
Vision: Building businesses that are leaders in the region
Values: Caring, Excellence, Trust, Innovation, Integrity
Sta
keh
old
er r
etu
rns
an
d e
ng
ag
emen
t
Th
e b
asi
c ty
pe
s o
f ca
pit
al d
ep
loye
d b
y JK
HV
alu
e c
rea
tio
n le
vers
Tra
nsf
orm
ed
ca
pit
al w
hic
h c
rea
tes
sta
keh
old
er
valu
e
INPUTS
OUTPUTS
Financial and Manufactured
Capital
Financial and Manufactured
Capital
Natural Capital
Natural Capital
Human Capital
Human Capital
Social and Relationship Capital
Social and Relationship Capital
Intellectual Capital
Intellectual Capital
| Corporate Governance
|
En
terp
ris
e R
isk
Ma
na
ge
me
nt
Sys
tem
|
IT G
overnance | Sustainability Framework | Hum
an R
eso
urce
Ma
na
ge
me
nt | C
orporate Social Responsibility
Corporate Governance | Corporate Social Responsi
bility
Our business activities: Transportation,
Leisure, Property, Consumer Foods and Retail,
Financial Services, Information Technology,
and Other including Plantation Services
Strategy, Resource
Allocation,
and Portfolio
Management
Business Outlook
Financial and
Non-Financial
Performance
during the year
Risks and
Opportunities
• Debt and equity• Cash flow from
operations• Fixed asset base
• Shareholder returns and dividends
• Payments to other stakeholders
• Share price appreciation
• Energy• Water• Other natural
resources
• Efficient disposal of effluent and waste
• Reduction of carbon footprint
• Reduced utility consumption
• Diversity• Experience
• Staff motivation • Talented, efficient
workforce • Job satisfaction • Career progression • Safe and equitable
environment
• Stakeholder engagement
• Relationship building
• Community skill development
• Well informed and sound investment decisions
• Better supplier/distributor and stakeholder relations
• Brand stewardship• Technological
expertise• Research and
development
• Intellectual property - Patents - Copyrights
nability Frce | Sustai

Group Highlights | Governance | Management Discussion & Analysis | Financial Statements | Supplementary Information 7
Inputs Activities Outputs Outcomes
Financial and Manufactured
Capital• Financial Capital: The pool of
funds that is available for use in
the production of goods or the
provision of services.
• Manufactured Capital:
Manufactured physical objects
that are available to the Group
for use in the production of goods
or the provision of services
• Shareholder
funds and debt
• Cash flow from
operations
• Land bank
• Machinery and
equipment
• Effective and responsible investments
of shareholder funds
• Business development activities
• Cost reduction initiatives
• Shareholder returns
and dividends
• Payments to other
stakeholders
• Share price
appreciation
• Financial stability
• Financial growth
• Creation of wealth
Natural CapitalAll renewable and non-renewable
environmental stocks that
provide goods and services for
the Group
• Energy
• Water
• Other natural
resources
• Adoption of Global Goals
• Environmental impact assessments
and mitigation of impact
• Roll-out of carbon footprint and
energy initiatives
• Strengthening of water and waste
management processes
• Disposal of all effluent
and waste efficiently
• Reduction of carbon
footprint
• Reduced resource
consumption through
better monitoring
• Sustainable
natural resource
utilisation
• Bio-diversity
preservation
Human CapitalThe employees’ competencies,
capabilities and experience,
including their ability to understand,
develop and implement the Group’s
strategy. This encompasses their
motivation for improving processes,
goods and services, and their ability
to lead, manage and collaborate
• Employee
diversity
• Experience
• Channelling of employee skills and
expertise for business growth
• Training and development of
employee cadre
• Performance management and
appraisals
• Employee survey initiatives
• Structured career development
programmes
• Staff motivation
• Talented and efficient
workforce
• Job satisfaction
• Career progression
• Safe and equitable
environment
• Alignment of
workforce with
Group vision
• Profitable
businesses
through improved
productivity and
efficiency
Social and Relationship
CapitalThe institutions and relationships
established within and between
each community, group of
stakeholders and other networks
to enhance individual and
collective well-being. Social and
relationship capital includes
key relationships, and the trust
and loyalty that the Group has
developed and strives to build
and protect with customers,
suppliers and business partners
• Occupational
health and safety
initiatives
• Dedicated CSR
team within the
Group
• Community
development
• Investor relations
and stakeholder
management
• Investment in community and
livelihood development
• Regular dialogue with investors,
analysts and other stakeholders
• Social impact assessments
• Identification of key stakeholders and
material aspects in relation to them
• Awareness creation and engagement
of suppliers through the Supplier
Management Framework
• Social needs assessment based on
Sustainable Development Goals (SDGs)
/UN Global Compact/national agenda
• Community skill
development
• Well informed and
sound investment
decisions
• Better supplier/
distributor and
stakeholder relations
• Brand visibility and
reputation
• Strengthened
supply chain
• Adherence to UN
SDGs
Intellectual CapitalIntangibles that provide
competitive advantage, including:
• Intellectual property, such as
patents, copyrights, software
systems, procedures and
protocols
• The intangibles that are
associated with the brand and
reputation that the Group has
developed over time
• Brand
stewardship
• Research and
development
• Technological
expertise
• Development of intangible
infrastructure, processes and
procedures to improve efficiency
• New product development
• Innovation
• Intellectual property
products
- Patents
- Copyrights
• Evolving
businesses to suit
the ever changing,
dynamic consumer
• An organisation
better prepared
to face disruptive
business models

8 John Keells Holdings PLC | Annual Report 2016/17
INDUSTRY GROUPS, SECTORS AND PRIMARY BRANDS
TRANSPORTATION
Ports and Shipping
Transportation
Centre Functions
Corporate Communications Group Human Resources Legal and Secretarial
Corporate Finance and Strategy Group Tax New Business Development
Group Business Process Review and
Insurance
Group Treasury Strategic Group Information
Technology
Group Finance John Keells Research Sustainability, Enterprise Risk
Management and Group Initiatives
Organisational Structure
Property Development
Real Estate
PROPERTY DEVELOPMENT
City Hotels
Sri Lankan Resorts
Maldivian Resorts
Destination Management
Hotel Management
LEISURE
Consumer Foods
Retail
CONSUMER FOODS AND RETAIL
Information Technology
Office Automation
IT Enabled Services
INFORMATION TECHNOLOGY
Insurance
Banking and Leasing
Stock Broking
FINANCIAL SERVICES
Plantation Services
Other
OTHER INCLUDING PLANTATION SERVICES
John Keells Foundation
KKRREESTSSKREST

Group Highlights | Governance | Management Discussion & Analysis | Financial Statements | Supplementary Information 9
• JKH concluded the conversion of 57.4
million 2016 Warrants in to ordinary
shares and received Rs.3.18 billion from
21.3 million 2016 Warrants that were
exercised and accepted
December 2016• John Keells Research filed for its first
patent for a novel energy source material
that was developed through a research
project undertaken in collaboration
with the National Metallurgical Lab of
the Council for Scientific and Industrial
Research (CSIR-NML) in India
• The premium ice cream range of Elephant
House ice creams was relaunched as
“Imorich”
• JKH was awarded the Gold award for
“Overall Excellence in Annual Financial
Reporting” at the 52nd Annual Report
Awards Ceremony organised by the
Institute of Chartered Accountants of Sri
Lanka
June 2016• JKH announced a subdivision of shares,
whereby 7 of its existing shares were
subdivided into 8 shares
• "John Keells X: Open Innovation Challenge
2016" was launched, creating a unique
platform for disruptive and innovative
solutions. The challenge provides the
initial investments required for start-up
businesses and technologies with the
goal of empowering startups and local
entrepreneurs
September 2016• The second residential tower of the
“Cinnamon Life” project, “The Suites
at Cinnamon Life”, comprising of 196
apartment units was launched
November 2016 • In line with the succession plan of the
Group, Messrs. Krishan Balendra and
Gihan Cooray were appointed as Executive
Directors to the Board of John Keells
Holdings PLC
January 2017• Union Assurance PLC launched “GOYO”,
an app based personal health advisor
that provides rewards to customers for
achieving fitness goals
February 2017• JKH emerged as the “Overall Sustainability
Reporting Award” winner at the ACCA Sri
Lanka Sustainability Awards 2017
• SAGT was awarded "The Best Terminal
in South Asia" by the Singapore based
Global Ports Forum
March 2017• JKH conducted its first e-auction for
Group Initiatives on the newly launched
online sourcing platform
• JKH Group revenue exceeded Rs.100
billion for the first time in the Company’s
147 year operating history
Year at a Glance 2016/17
Financial Achievements and Goals
Indicator (%) Goal Achievement
2016/17 2015/16 2014/15
EBIT growth >20 15.5 5.0 16.3
EPS growth (fully diluted) >20 12.6 (15.3) 15.7
Cash EPS growth (fully diluted) >20 (1.0) (6.2) 13.9
Long term return on capital employed (ROCE) 15 11.5 11.1 11.5
Long term return on equity (ROE) 18 9.8 9.6 11.0
Net debt (cash) to equity 50 (28.5) (30.8) (28.8)

10 John Keells Holdings PLC | Annual Report 2016/17
Year ended 31 March 2016/17 2015/16 (%) 2014/15
Earnings highlights and ratios
Group revenue - consolidated Rs. million 106,273 93,710 13 91,852
Group revenue - including equity accounted investees Rs. million 119,623 105,183 14 98,090
Group profit before interest and tax (EBIT) Rs. million 23,324 20,192 16 19,226
Group profit before tax Rs. million 22,888 19,198 19 18,557
Group profit after tax Rs. million 18,117 15,792 15 15,746
Group profit attributable to shareholders Rs. million 16,275 14,070 16 14,348
Dividends1 Rs. million 7,280 8,038 (9) 3,476
Diluted earnings per share Rs. 11.84 10.52 13 12.41
Cash earnings per share Rs. 13.89 14.03 (1) 14.96
Interest cover No. of times 52.8 51.5 3 27.7
Return on equity (ROE) % 9.8 9.6 2 11.0
Pre-tax return on capital employed (ROCE) % 11.5 11.1 4 11.5
Balance sheet highlights and ratios
Total assets Rs. million 277,272 240,975 15 218,086
Total debt Rs. million 22,766 20,750 10 23,934
Net debt (cash)2 Rs. million (55,309) (51,849) 7 (43,224)
Total shareholders' funds Rs. million 178,635 154,982 15 137,798
No. of shares in issue Millions 1,387 1,189 17 997
Net assets per share3 Rs. 128.75 111.70 15 99.32
Debt/equity % 11.7 12.3 (5) 15.9
Net debt (cash)/ equity2 % (28.5) (30.8) (7) (28.8)
Debt/total assets % 8.2 8.6 (5) 11.0
Market / shareholder information
Market price of share as at 31 March (actual) Rs. 137.90 148.00 (7) 199.40
Market price of share as at 31 March (diluted) Rs. 137.90 129.50 6 152.67
Market capitalisation Rs. million 191,332 176,032 9 198,899
Enterprise value2 Rs. million 136,022 124,182 10 155,675
Total shareholder return4 % 10.0 (12.2) - (12.0)
Price earnings ratio (PER) (diluted) No. of times 11.6 12.3 (6) 12.3
Dividend announced for the financial year Rs. 6.00 7.00 (14) 3.50
Dividend payout for the financial year1 % 45.9 46.7 (2) 33.5
Dividend paid per share1 Rs. 5.50 7.00 (21) 3.50
Dividend yield1 % 3.99 5.41 (26) 2.29
1 Cash dividends paid during the year
2 Customer advances in the Property Development sector and cash and cash equivalents relating to the UA Life fund has been excluded
3 Net assets per share have been calculated, for all periods, based on the number of shares in issue as at 31 March 2017
4 Includes the proportionate impact arising from the ownership of the 2015 and 2016 Warrants
FINANCIAL HIGHLIGHTS - THREE YEAR PERFORMANCE
Performance Highlights

Group Highlights | Governance | Management Discussion & Analysis | Financial Statements | Supplementary Information 11
Indicator 2016/17 2015/16 2014/15
FINANCIAL CAPITAL
EC1 Economic value retained (Rs. million) 12,731 9,873 14,589
NATURAL CAPITAL
EN3 Energy consumption - non renewable sources (GJ) 220,911 213,7471 223,321
Energy consumption - non renewable sources (GJ) per Rs. million of revenue 2.05 2.26 2.40
Energy consumption - renewable sources (GJ) 101,112 111,061 130,067
Energy consumption - renewable sources (GJ) per Rs. million of revenue 0.94 1.18 1.40
Purchased energy - national grid 350,486 332,9611 311,263
Purchased energy - national grid (GJ) per Rs. million of revenue 3.24 3.521 3.4
EN15 Direct greenhouse gas emissions - scope 1 (MT) 16,134 15,6211 16,332
Greenhouse gas emissions from combustion of biomass 11,181 12,284 14,254
EN16 Indirect greenhouse gas emissions - scope 2 (MT) 66,359 63,0411 58,933
Total carbon footprint (MT) 82,492 78,6611 75,264
Total carbon footprint (MT) per Rs. million of revenue 0.76 0.83 0.82
EN8 Water withdrawal (m3) 2,021,739 1,995,0081 1,803,061
Water withdrawal (m3) per Rs. million of revenue 18.72 21.111 19.72
EN22 Water discharge (m3) 1,460,799 1,439,1381 1,390,650
EN23 Volume of hazardous waste generated (MT) 329 285 134
Volume of non - hazardous waste generated (MT) 8,517 7,967 7,669
Waste recycled/reused by Group companies and through third party contractors (%) 42 43 43
EN29 Significant environmental fines4 Nil Nil Nil
HUMAN CAPITAL
Total workforce (employees and contractors’ staff) 20,100 19,522 18,981
EC3 Employee benefit liability as of 31 March (Rs. million) 1,880 1,650 1,495
LA1 Total attrition (%) 24 21 24
New hires (%) 55 50 45
LA6 Number of injuries and diseases 213 217 199
Injury rate (number of injuries per 100 employees) 1.06 1.11 1.05
Lost day rate (%) 0.04 0.05 0.05
Number of people educated on serious diseases5 199,802 21,384 16,323
LA9 Average hours of training per employee 41 35 40
LA11 Employees receiving performance reviews (%) 100 100 100
HR5 Incidents of child labour (below age 16) Nil Nil Nil
Incidents of young workers (aged 16-18)2 Nil Nil Nil
HR6 Incidents of forced labour during the year Nil Nil Nil
SOCIAL AND RELATIONSHIP CAPITAL
EC7 Community services and infrastructure projects (Rs. million) 150 105 58
EC9 Proportion of purchases from suppliers within Sri Lanka (%) 83 81 81
SO1 Community engagement (number of persons impacted)3 1,010,200 855,364 59,278
Sustainability integration awareness (number of business partners) 80 80 80
Business partners screened for labour, environment and human rights 90 100 90
PR3 Proportion of labels carrying ingredients used (%) 81 81 80
Proportion of labels carrying information on disposal (%) 93 76 60
Proportion of labels carrying sourcing of components (%) 1 1 1
PR7 Voluntary standards relating to advertising Group policy based on ICC code
PR9 Significant fines for product/service issues4 Nil Nil Nil
SO2 Proportion of businesses analysed for risk of corruption (%) 100 100 100
SO8 Significant fines for violation of laws/regulations4 Nil Nil Nil
1 Figure has been restated
2 Young workers are employed under the guidelines of the Employers’ Federation of Ceylon
3 This excludes people impacted indirectly and includes the commuters using the Slave Island Railway Station
4 Significant fines are defined as fines over Rs.1 million
5 Significant increase due to islandwide awareness programme conducted by UA
NON FINANCIAL HIGHLIGHTS - THREE YEAR PERFORMANCE

12 John Keells Holdings PLC | Annual Report 2016/17
• Group revenue increased by 13 per cent to Rs.106.27 billion
• Group profit before tax increased by 19 per cent to Rs.22.89 billion. Recurring
profit before tax, excluding the impacts of fair value gains on investment property,
increased by 18 per cent to Rs.22.40 billion
• Profit attributable to equity holders of the parent increased by 16 per cent to Rs.16.28
billion. Recurring profit attributable to equity holders of the parent increased by 15
per cent to Rs.15.86 billion
• Net cash flow from operating activities was Rs.21.02 billion
• Return on capital employed (ROCE) increased to 11.5 per cent from 11.1 per cent in
the previous year
• Return on equity (ROE) increased to 9.8 per cent from 9.6 per cent in the previous year
• The adjusted ROCE and the ROE are 14.4 per cent and 11.5 per cent respectively, as
explained below
• Debt to equity ratio decreased to 11.7 per cent compared with 12.3 per cent in the
previous financial year
• The Company PBT decreased by 3 per cent to Rs.17.25 billion
• Diluted earnings per share increased by 13 per cent to Rs.11.84
• Cash earnings per share decreased by 1 per cent to Rs.13.89
• The total shareholder return (TSR) in 2016/17 was 10.7 per cent
• The carbon footprint per one million rupees of revenue decreased by 8 per cent to
0.76 metric tons
This is the second Annual Report prepared in
conformance with the Integrated Reporting
Framework of the International Integrated
Reporting Council. This year’s Report
strives to provide our stakeholders with
an in-depth understanding of the Group’s
value creation process and the strategies in
managing the diverse portfolio of businesses
towards driving sustainable growth. The
integrated nature of this report exemplifies
the stakeholder centric strategies and
actions which are founded on the principles
of compliance, conformance, governance,
ethical conduct and sustainable development.
The Group profit before tax (PBT) increased
by 19 per cent to Rs.22.89 billion for the
financial year ended 31 March 2017. The
profit attributable to equity holders of the
parent was Rs.16.28 billion, representing
an increase of 16 per cent over the Rs.14.07
billion recorded in the previous year.
As was highlighted last year, the investment
in the “Cinnamon Life” project which is under
construction and the regular revaluation of
assets under fair value accounting principles
have short to medium term implications on
our ROCE and ROE ratios. This is discussed
in detail in the Group Consolidated Review
section of this Report. The ROCE and the ROE,
adjusted for these impacts and other one-
off non-operating incomes are 14.4 per cent
and 11.5 per cent respectively. We remain
confident that the investments which we
are making today, and the strategies we are
employing, in pursuing a sustainable long
term future will result in improved returns
on our capital employed, and our shareholder
funds, in the medium to long term.
Despite the policy uncertainty which prevailed
during the period with regards to taxation and
other reforms, I am pleased to state that your
Group remained agile and adapted to the
changing conditions, with the administration
and operating expenses increasing by less
than market norms despite the increased
activity and the resultant 13 per cent growth
in revenue. The increased contribution from
the Consumer Foods and Retail industry
group to overall revenue and profitability has
resulted in a more balanced portfolio. In this
context, it is pleasing to note that with the
exception of Leisure and Property, where
monetisation of property assets have a “lag”
effect, all industry groups achieved ROCE's in
excess of the Group’s hurdle rate of 15 per
cent. Given our strong balance sheet and
anticipated robust cash generation, the Group
is currently evaluating significant investment
opportunities across its industry groups,
some of which are morefully described
in the Industry Group Review section, and
Strategy, Resource Allocation and Portfolio
Management sections of this Report.
Summarised below are the key financial highlights of our operating performance during the
year under review.
Rs.22.89Bn Group PBTA growth of 19 per cent
I am pleased to present the Integrated
Annual Report and the Financial
Statements for the financial year
ended 31 March 2017.
Vision and virtuosity remain the guiding principles of all that we do....
Chairman’s Message
Given our strong balance sheet
and anticipated robust cash
generation, the Group is currently
evaluating significant investment
opportunities across its industry
groups, some of which are
morefully described in the Industry
Group Review section, and
Strategy, Resource Allocation and
Portfolio Management sections of
this Report.

Group Highlights | Governance | Management Discussion & Analysis | Financial Statements | Supplementary Information 13
The increased room inventory arising out
of entrants into the 3-5 star segments of
the market, and the resultant competitive
pricing, exerted pressure on the city sector’s
average room rates during the period under
review. However, with this capacity being
gradually absorbed during the financial year,
overall occupancy in the city was strong
and this is an encouraging trend. Despite
the aforementioned increase in competition,
the Group’s City Hotels sector witnessed an
increase in both occupancy and average room
rates compared to the previous financial year.
The profitability of the City Hotels sector for
the year under review included a full year
of operations for Cinnamon Lakeside, which
was partially closed for refurbishment for six
months in 2015/16. Cinnamon red continued
to perform beyond expectations.
The Group will seek to optimise the returns
of its Leisure business by re-evaluating the
effective capital deployed in its existing hotel
portfolio, and, where relevant, following an
asset light investment model in new projects.
With new capacity expected to come in
over the next few years, especially into the
city, there is an urgent need for the country
to enhance its product and entertainment
offering to attract the higher spending
tourists.
The Sri Lankan Resorts segment recorded
an overall improvement in occupancy and
average room rates, despite the increase in
competition within the sector, particularly in
the coastal areas of the island.
Tourist arrivals to the Maldives displayed
signs of a recovery with an increase of 4 per
cent during the calendar year 2016. Despite
increased activity in the informal sector, the
The Annual Report contains discussions on the
macro-economic factors and its impact on our
businesses as well as a detailed discussion
and analysis of each of the industry groups. As
such, I will focus on a high level summation
of the performance of each industry group
during the financial year 2016/17.
Transportation Industry GroupThe Transportation industry group reported
revenues, including the share of revenues
from the equity accounted investees, of
Rs.18.44 billion and a PAT of Rs.2.98 billion,
contributing 15 per cent and 16 per cent to
Group revenue and PAT respectively. The
2016/17 PAT increased by 21 per cent over
the previous year. The significant increase in
profitability is mainly attributable to the Ports
and Shipping, and Bunkering businesses.
During the financial year, volumes at the Port of
Colombo witnessed a year on year growth of 9
per cent whilst South Asia Gateway Terminals
(SAGT) recorded an encouraging throughput
increase of 22 per cent. You will be pleased to
note that SAGT was recognised as the "Best
Terminal in South Asia", awarded by the Global
Ports Forum in February 2017. Since the
expansion of capacity with the commissioning
of the South Container Terminal, the overall
capacity utilisation of the Port of Colombo is
now in excess of 70 per cent, demonstrating
the strong potential for capacity led growth.
In this context, timely development of the
deep-draft East Container Terminal (ECT)
is critical to ensure that capacity continues
to be enhanced towards attracting further
volumes and sustain continued growth at
the Port. Subsequent to the Expression of
Interest submitted in September 2016 in this
regard, the Group will look to leverage on
this investment opportunity considering the
overall prospects for the Port of Colombo.
Revenue and profitability of the Group’s
Bunkering business improved as a result of
the increase in base fuel prices during the
year and growth in volumes. The Logistics
business recorded a strong performance due
to an increase in throughput in its warehouse
facilities while DHL Keells improved its market
leadership position in the year under review.
Leisure Industry GroupThe Leisure industry group reported
revenues, including share of revenues from
equity accounted investees, of Rs.26.14 billion
and a PAT of Rs.5.01 billion, contributing 22
per cent and 28 per cent to Group revenue
and PAT respectively. The 2016/17 PAT
increased by 15 per cent over the previous
year. During the calendar year 2016, arrivals
to Sri Lanka reached 2,050,832, representing
a year-on-year growth of 14 per cent. China
and India, being the two largest source
markets, recorded a 24 per cent and 13 per
cent increase in arrivals in 2016, respectively,
whilst arrivals from other regions also
demonstrated encouraging growth.
In keeping with the present growth
opportunities within the sector, better physical
infrastructure such as enhanced connectivity
through road networks and the expansion of
the passenger handling capacity of the airport
by expediting the planned new terminal, is a
priority. The partial closure of the Bandaranaike
International Airport to resurface and expand
the runway was handled commendably by the
authorities demonstrating the capability to
handle the growth in the volume of traffic.
Since the expansion of capacity
with the commissioning of the
South Container Terminal, the
overall capacity utilisation of the
Port of Colombo is now in excess
of 70 per cent, demonstrating
the strong potential for capacity
led growth. In this context, timely
development of the deep-draft East
Container Terminal (ECT) is critical
to ensure that capacity continues
to be enhanced towards attracting
further volumes and sustain
continued growth at the Port.
Read more on Transportation on page 116
The Group will seek to optimise
the returns of its Leisure business
by re-evaluating the effective
capital deployed in its existing
hotel portfolio, and, where
relevant, following an asset light
investment model in new projects.
Read more on Leisure on page 124
Rs.5.01BnLeisure PATA growth of 15 per cent
Rs.2.98BnTransportation industry group PATA growth of 21 per cent

14 John Keells Holdings PLC | Annual Report 2016/17
was approved and construction is currently
underway with expected completion in
the first quarter of 2018/19. Similarly, the
installation of a new bottling line at a cost of
approximately Rs.2.50 billion is expected to
commence shortly.
The Retail sector recorded a strong
performance on the back of significant
growth driven by contributions from newly
opened outlets and an encouraging growth
in footfall. The continued emphasis on
improving the service quality, and product
offering, is contributing towards enhancing
the overall shopping experience. It is pleasing
to note that the outlets opened in recent years
are performing above expectations. The
penetration of modern Fast Moving Consumer
Goods (FMCG) retail in the country is still
low, compared to more developed regional
countries, and this presents a significant
opportunity for growth. With a number of
new locations having been already identified,
the sector will continue to strategically
expand its store network and distribution
capabilities in gaining market share. It is
with a view to complementing its growth
plans and further improving its productivity
and product offering that the sector plans
to shortly commence construction of a new
distribution centre, which is expected to be
operational in the first half of the calendar
year 2019. This distribution centre will be
operated in collaboration with the Group’s
logistics arm, John Keells Logistics. The
Nexus mobile loyalty programme, which
enables the business to identify key trends in
Chairman’s Message
Maldivian Resorts segment experienced
growth on the back of improved occupancy,
which was well above the industry average,
and improved average room rates.
Bentota Beach by Cinnamon will be closed for
construction of a new hotel. Construction is
planned in a manner to conserve the original
structure designed by Geoffrey Bawa. This,
together with the partial closure of Cinnamon
Ellaidhoo and Dhonveli for the refurbishment
of rooms, details of which are more fully
described in the Leisure Industry Group
Review section of this Report, will impact
profitability in 2017/18.
Property Industry GroupThe Property industry group reported
revenues of Rs.1.12 billion and a PAT of Rs.623
million, contributing 1 per cent and 3 per cent
to Group revenue and PAT respectively. The
2016/17 PAT decreased by 61 per cent over
the previous year. The decline is on account
of the revenue recognition cycle, where the
majority of the revenue of the "7th Sense"
on Gregory’s Road residential project was
recorded in the previous financial year.
The Group is cognizant of the fact that
revenue recognition in the Property industry
group has shown volatility in the past
years due to the lack of a robust pipeline
of projects. Given the opportunities arising
from landmark infrastructure projects
such as Port City Colombo and the Western
Region Megapolis Planning Project, the
Group will seek to establish a continuum of
projects, in both commercial and residential
spaces. In this light, land parcels in the city
and the suburbs have been identified and
negotiations and due diligence exercises are
currently under way. More specifically, the
Group has entered into a Memorandum of
Understanding with a partner in relation to
one such prospective property development
project in central Colombo. Subject to the
finalisation of the concept, cost parameters
and other approvals, the project is expected
to be launched in early 2018.
The construction of the “Cinnamon Life”
project is progressing with encouraging
momentum, where much of the complex sub
structural work has been completed. The
construction of the six lane bridge, which will
be the main access point to the project, was
commissioned during the year, and work is in
progress. The demand for the residential and
commercial buildings of the project remains
encouraging. The second residential building,
“The Suites at Cinnamon Life”, comprising of
196 units, was launched in September 2016.
Consumer Foods and Retail Industry
GroupThe Consumer Foods and Retail industry
group recorded revenues of Rs.45.81 billion
and a PAT of Rs.3.90 billion, contributing
38 per cent and 22 per cent to Group
revenue and PAT respectively. The 2016/17
PAT increased by 21 per cent over the
previous year, with both the Consumer
Foods sector and Retail sector contributing
to the improved performance. However, a
tapering of demand was witnessed in the
last quarter, and continues so, in the face of
subdued consumer discretionary spending
arising from the increases in value added tax,
interest rates and inflation.
Profitability of the Beverage and Frozen
Confectionery businesses was driven by
robust volume growth combined with the
expansion of the product portfolio in line with
evolving consumer tastes and preferences.
Continued focus on the distribution network,
production efficiencies and cost control
further contributed towards this growth.
In order to cater to the envisaged demand
and address existing capacity constraints,
an investment of approximately Rs.3.80
billion in a new frozen confectionery plant
Rs.3.90Bn Consumer Foods and Retail PAT A growth of 21 per cent
The penetration of modern Fast
Moving Consumer Goods (FMCG)
retail in the country is still low,
compared to more developed
regional countries, and this
presents a significant opportunity
for growth. With a number of
new locations having been
already identified, the sector will
continue to strategically expand
its store network and distribution
capabilities in gaining market
share.
Read more on Consumer Foods and
Retail on page 144
The Group has entered into a
Memorandum of Understanding
with a partner in relation to
one such prospective property
development project in central
Colombo. Subject to the
finalisation of the concept, cost
parameters and other approvals,
the project is expected to be
launched in early 2018.
Read more on Property on page 136

Group Highlights | Governance | Management Discussion & Analysis | Financial Statements | Supplementary Information 15
customers and shopping lifestyles using data
analytics, proved to be a key tool in retaining
and attracting customers and in enhancing
customer experience. During the year under
review, the loyalty programme membership
exceeded the 650,000 mark.
Financial Services Industry GroupThe Financial Services industry group
recorded revenues, including the share of
revenues from equity accounted investees, of
Rs.14.06 billion and a PAT of Rs.2.04 billion,
contributing 12 per cent and 11 per cent to
Group revenue and PAT. The 2016/17 PAT
increased by 19 per cent over the previous
year.
Other including Plantation ServicesThe Plantation Services sector recorded
revenues of Rs.2.80 billion and a PAT of Rs.245
million, contributing 2 per cent and 1 per cent
to Group revenue and PAT respectively. The
2016/17 PAT increased significantly over the
previous year. The Plantation Services sector
recorded an improvement in profitability as
a result of improved tea prices and other
operational efficiencies.
Other, comprising of the Holding Company
and other investments, and the Plantation
Services sector, together, recorded revenues
of Rs.2.95 billion and a PAT of Rs.3.10
billion for 2016/17, contributing 2 per cent
and 17 per cent to Group revenue and PAT
respectively. The 2016/17 PAT increased
by 32 per cent over the previous year. The
increased PAT is mainly attributable to the
interest income generated on the Group’s
Rupee and US Dollar portfolios and exchange
gains recorded at the Company on its foreign
currency denominated cash holdings.
unique advantages of biocompatibility and a
lower cost per unit of power stored. JKR is
in the process of building a prototype energy
storage device that utilises the patented
technology to enhance the Technology
Readiness Level (TRL) of the intellectual
property and assess the commercial viability
of a prototype product.
During the year under review, the Group
made a concerted effort to drive a culture of
disruptive innovative amongst our employees
and businesses. To this end, the Group
launched “John Keells X: An Open Innovation
Challenge 2016”, to create a conducive
ecosystem for young entrepreneurs to
thrive, and to encourage businesses at
JKH to engage in a model of open sourced
innovation. An award on Disruptive Innovation
was presented for the inaugural time at the
JKH Chairman’s Awards 2016, to recognise
businesses which have made disruptive
innovation an integral part of their operating
culture and have formulated successful
responses to address current, and emerging,
business disruption.
Rs.11.11Bn Information Technology revenue A growth of 34 per cent
Rs.3.10Bn Other, including Plantations Services PAT A growth of 32 per cent
Rs.2.04Bn Financial Services PAT A growth of 19 per cent
During the year under review, Union
Assurance PLC (UA) continued to record
encouraging double digit growth in Gross
Written Premiums (GWP).
The banking industry recorded healthy
growth driven mainly by the strong credit
demand stemming from both the private and
public sectors. However, performance was
dampened, to an extent, by the increased
pressure on net interest margins due to rising
funding costs and intensified competitive
pressures. Notwithstanding the challenging
operating environment, Nations Trust Bank
(NTB) recorded a double digit growth in both
deposits and credit, which trended above the
industry average.
Information Technology Industry GroupThe Information Technology industry group
recorded revenues of Rs.11.11 billion and
a PAT of Rs.468 million, contributing 9 per
cent and 3 per cent to Group revenue and
PAT respectively. The 2016/17 PAT increased
significantly over the previous year. The Office
Automation (OA) business improved its market
share in both the mobile and copier markets,
driven by increased volumes and revenue
from new products. The increase in consumer
purchasing power, particularly in the early
part of the financial year, coupled with the
increased substitution of feature phones with
smart phones drove volumes in the Mobile
Phone segment. The OA business's extensive
dealer network also enabled a growth in the
market share of the Copier segment.
Research and Innovation The year under review marked a significant
development for John Keells Research
(JKR), the research and development arm
of the Group, which was established to drive
science based innovation in the Group with a
view to creating a portfolio of projects with
intellectual property. In this light, JKR filed
for its first patent for a novel energy source
material that was developed through a
research project undertaken in collaboration
with the National Metallurgical Lab of the
Council for Scientific and Industrial Research
(CSIR-NML) in India, based on an idea
generated by JKR. The patent application
which was filed at the Indian patent office in
December 2016 is in respect of a composite
nanomaterial which could be used in energy
storage. The composite material has the
The year under review marked
a significant development for
John Keells Research (JKR), the
research and development arm of
the Group, which was established
to drive science based innovation
in the Group with a view to
creating a portfolio of projects
with intellectual property. In this
light, JKR filed for its first patent
for a novel energy source material
that was developed through a
research project undertaken in
collaboration with the National
Metallurgical Lab of the Council for
Scientific and Industrial Research
(CSIR-NML) in India, based on an
idea generated by JKR.

16 John Keells Holdings PLC | Annual Report 2016/17
Retirement and SuccessionAs you are aware, in November 2016, we
announced plans for the succession of the
Deputy Chairman and the Group Finance
Director, who retire at the end of December
2017, and myself, as I am due to retire at the
end of December 2018. In addition, plans
for succession of various Key Management
Personnel who are due to retire by the end
of the calendar year 2018 were internally
announced in February 2017. I am delighted
to say that the announcements were well
received amongst our employees and other
stakeholders. The Group has, over the years,
developed a substantial pool of young,
talented individuals and I am confident that
the depth of leadership augurs well for the
Group’s future.
EmployeesAs we mark the conclusion of a successful
year, I wish to acknowledge with gratitude
the contribution and commitment of our
employees during a year which saw many
challenges and opportunities. Our employees
are an integral part of our success and
a key pillar of our Corporate Governance
System. We will continue to implement
processes by which we attract, and retain
talent, as an employer of choice. During the
year, the Group carried out the Great Place
to Work (GPTW) survey and it is pleasing to
note improvements in the scores on every
dimension.
The Corporate Governance Commentary and
the Group Consolidated Review sections of
this Report explain in further detail the best
practices, policies and procedures that are
in place to ensure that John Keells is “More
Than Just a Work Place”.
Corporate GovernanceI am pleased to state that there were no
departures from any of the mandatory
provisions of the Code of Business Conduct
and Ethics of the Code of Best Practice of
Corporate Governance, jointly advocated by
the Securities and Exchange Commission
of Sri Lanka and the Institute of Chartered
Accountants of Sri Lanka. Further details on
compliance can be found in the Corporate
Governance Commentary of this Report.
SustainabilityAs in the previous years, this Integrated
Annual Report has been prepared 'in
accordance'-core option of the GRI (G4)
Guidelines and has successfully completed
the GRI Materiality Disclosures service. The
Report contains the overall sustainability
strategy, framework and performance of
the Group and has also been independently
assured by DNV GL which is represented in
Sri Lanka by DNV Business Assurance Lanka
(Private) Limited.
This year, I am pleased to announce that the
Group has established energy and water
reduction goals for the first time, as a pivotal
stride in its sustainability journey. These
goals have been set on the basis of empirical
evidence gathered through in-depth energy
and water audits carried out across,
approximately, 90 operational sites. As a goal,
the Group will strive to achieve a 12 per cent
reduction in its energy usage and a 6 per cent
reduction in its water usage by the year 2020,
against its 2015/16 baseline figures.
As part of its sustainability strategy,
and alongside its comprehensive
risk management process, the Group
continuously seeks to conserve energy
and water, dispose of waste responsibly,
provide training and development, maintain
a safe working environment and ensure the
highest standards of product stewardship.
This has extended to its value chain in
recent years through ongoing engagements
and awareness creation with key suppliers
through regular fora, and the supplier code
of conduct and on-site assessments. During
the year under review, the Group’s proven
central sourcing process was shifted to an
online platform which facilitated increased
effectiveness, reduced paper usage, enabled
information retention and provided our
significant supply chain partners access to an
international market place.
I am pleased to announce that this year, too,
we made significant progress on the agenda
items reported in last year’s Integrated
Annual Report. Although the Group’s carbon
footprint increased by 5 per cent to 82,492
MT, in absolute terms, as a result of higher
levels of operational activity during the year
under review, key industry groups such as
Leisure and Consumer Foods and Retail
experienced a combined reduction of 8 per
cent in carbon footprint per million rupees
of revenue, reflecting the positive results of
the initiatives embarked upon in these areas.
Similarly, although the water withdrawal,
during the year under review, increased by 1
per cent to 2,021,739 cubic meters in these
key industry groups, there was a reduction
of 11 per cent in water withdrawal per
million rupees of revenue. Waste generated
increased by 7 per cent to 8,846 MT due to
the aforementioned increase in operational
activity across the Group.
From an employee perspective, 213 incidents
of occupational injuries and diseases were
recorded this year, whilst Group employees
received, on average, 41 hours of training
per person. It should be noted that the
training hours for employees are determined
on a needs basis, where business specific
training gaps are identified in respect of both
operating and roof competencies in keeping
with the Group Learning and Development
policy guidelines.
Chairman’s Message
This year, I am pleased to announce that the Group has established
energy and water reduction goals for the first time, as a pivotal stride
in its sustainability journey. These goals have been set on the basis of
empirical evidence gathered through in-depth energy and water audits
carried out across, approximately, 90 operational sites. As a goal, the
Group will strive to achieve a 12 per cent reduction in its energy usage
and a 6 per cent reduction in its water usage by the year 2020, against
its 2015/16 baseline figures.
The Group has, over the years,
developed a substantial pool of
young, talented individuals and
I am confident that the depth of
leadership augurs well for the
Group’s future.

Group Highlights | Governance | Management Discussion & Analysis | Financial Statements | Supplementary Information 17
Corporate Social ResponsibilityThe John Keells Group is fully committed
to our responsibility to make a positive
difference in the communities that we
operate in. Corporate Social Responsibility
(CSR) is an integral part of our business
ethos, permeating naturally throughout the
organisation and is now a part of the DNA of
our employees. Staff volunteerism is a key
component of our CSR, and has enabled our
staff to enrich their personal experiences
through community involvement and service.
Our CSR activities continue to be on six
key areas, namely, Education, Health,
Environment, Livelihood Development, Arts
and Culture and Disaster Relief. During
the year, focused initiatives in the form of
“Promises” were established in respect
of each of these areas, towards enabling
strategic focus. All projects undertaken are
inspired and sustained by our CSR vision of
“Empowering the Nation for Tomorrow”. The
CSR initiatives of the Group are centrally
planned and implemented by John Keells
Foundation (Foundation), a company limited
by guarantee which is also registered as
a “Voluntary Social Service Organisation”
with the Ministry of Social Welfare. The
Foundation is also a participant of the United
Nations Global Compact and ensures that
its activities are aligned to the Sustainable
Development Goals and national priorities.
Whilst further details are available under
the Group Consolidated Review and Industry
Group Review sections of this Report, some
of the highlights of the Foundation’s work
during the year are listed below.
English Language Scholarship Programme
A total of 1,148 school children completed
courses under the foundation, pre-
intermediate and intermediate levels. A
customised programme for the senior
students of the School for the Blind in
Ratmalana was also initiated.
Promoting Science Education amongst
School Children
The Foundation, in collaboration with the
Sri Lanka Association for the Advancement
of Science, conducted 7 Science Day
Programmes (SDPs) aimed at promoting an
interest in science among school children.
The SDPs were conducted in Anuradhapura,
Monaragala, Ratnapura, Jaffna, Ampara and
Vavuniya, and benefitted 1,536 students from
approximately 94 schools.
Project WAVE (Working Against Violence
through Education)
This project, aimed, particularly, at combating
gender based violence and child abuse
through awareness raising, made substantive
strides in its third year, sensitising a total of
6,269 persons including Group staff, police
officers and lawyers. A public awareness
campaign targeting sexual harassment on
public transport was also initiated with the
support of Group volunteers involving the
pasting of 2,300 stickers (in Sinhala and
Tamil) inside 1,150 buses, as well as depot
precincts, and the distribution of over 30,000
information cards to commuters.
The John Keells Vision Project
A total of 133 eye camps were conducted
resulting in the completion of 1,185 cataract
surgeries. Under the School Screening
Programme in the Colombo District,
collaboration between Ceylon Cold Stores
PLC and the Ministry of Health, vision
screening was conducted in 103 schools,
testing over 54,600 school children whilst
3,465 spectacles were donated.
HIV and AIDS Awareness Campaign
A total of 23,758 persons were sensitised on
HIV and AIDS, including over 10,243 trainees
of the National Cadet Corps. The Foundation’s
HIV and AIDS e-learning platform, which
provides awareness free of charge via its
website, attracted more than 622 visitors
with 125 persons completing the module.
Village Adoption
The construction of a 3-classroom block at
Iranaipalai R.C.M.V. in the Mullaitivu District
was completed, while a family empowerment
programme was initiated, in collaboration
with Sri Lanka Red Cross Society (SLRCS),
for low income families in Iranaipalai
and Puthumathalan GS Divisions. In the
Morawewa North GS Division, rehabilitation
work of a tank was completed towards
addressing the water scarcity in the area.
The Foundation also initiated a youth
empowerment programme, in collaboration
with SLRCS, for school dropouts, towards
guiding them in embarking on livelihoods.
Chronic Kidney Disease (CKD) Prevention
The Foundation continued its partnership
with the National Water Supply and Drainage
Board (NWSDB) by funding two more Reverse
Osmosis (RO) filtration systems in the
Anuradhapura District as part of an overall
plan to address CKD issues.
Project Leopard
This long-term project, done in collaboration
with Cinnamon Nature Trails, has made
significant strides, being selected as a finalist
for the World Travel and Council Award during
the reporting period. The project involves
a simple, yet effective, way of minimising
the human - leopard conflict through the
donation of steel cattle pens to farmers in
areas adjacent to the Yala National Park. This
has facilitated the safeguarding and uplifting
of livelihoods of cattle farmers.
Our CSR activities continue to be on six key areas, namely, Education,
Health, Environment, Livelihood Development, Arts and Culture and
Disaster Relief. During the year, focused initiatives in the form of
“Promises” were established in respect of each of these areas, towards
enabling strategic focus.
A public awareness campaign
targeting sexual harassment
on public transport was also
initiated with the support of Group
volunteers involving the pasting
of 2,300 stickers (in Sinhala
and Tamil) inside 1,150 buses,
as well as depot precincts, and
the distribution of over 30,000
information cards to commuters.

18 John Keells Holdings PLC | Annual Report 2016/17
Our Volunteers
During the year in review, the Foundation
recorded a total of 7,649 hours of CSR
volunteerism by 1,008 staff volunteers
across the John Keells Group in respect
of activities conducted by the Group. This
number excludes the substantial volunteer
activities at the business or sector level.
DividendsYour Board declared a third and final dividend
of Rs.2.00 per share to be paid on 16 June
2017. The first and second interim dividends
for the year of Rs.2.00 per share, each, were
paid in October 2016 and February 2017,
respectively.
The Company increased its dividend per
share to Rs.6.00, paid out of profits for
the financial year 2016/17, from Rs.3.50
per share (excluding the special dividend
of Rs.3.50 per share which was paid on
account of the cash inflow of Rs.4.14 billion
to the Company from the share repurchase
of Union Assurance PLC), paid out of profits in
the previous year. The Group believes that a
higher dividend per share is warranted given
the current, and anticipated, robust cash
flows of the businesses.
From a cash flow perspective, excluding
the special dividend paid in the financial
year 2015/16 (Rs.3.50 per share), the total
dividend payout in the financial year 2016/17
(Rs.5.50 per share) increased significantly by
88 per cent to Rs.7.28 billion from Rs.3.88
billion recorded in the previous year.
2016 Warrant Subsequent to the exercise and conversion of
the 2016 Warrant, 21,279,672 voting shares
of the Company were listed on the Colombo
Stock Exchange on 1 December 2016. Based
on the final conversion of 2016 Warrants
into ordinary shares, the Company received
a sum of Rs.3.18 billion. The equity and debt
financing requirement for the Cinnamon Life
Project remains secured with the conclusion
of the required debt financing for the Project
and the availability of cash reserves to meet
equity commitments through the capital
raised via the 2013 Rights Issue, 2015 and
2016 Warrants and internally generated cash.
Subdivision of SharesSubsequent to receiving shareholder
approval on 24 June 2016, the Company
completed the subdivision of its ordinary
shares whereby seven shares were
subdivided into eight shares.
Resignation and Appointment of
DirectorsDr. Indrajit Coomaraswamy resigned from
the Board with effect from 3 July 2016
consequent to his appointment as the
Governor of the Central Bank of Sri Lanka.
I would like to place on record our deep
appreciation of the invaluable contribution
made by Dr. Coomaraswamy during his
tenure on the Board.
I welcome Dr. Hans Wijasuriya who was
appointed to the Board with effect from 4
October 2016 and Messrs. Krishan Balendra
and Gihan Cooray who were appointed to the
Board with effect from 5 November 2016.
ConclusionIn conclusion, on behalf of the Board of
Directors and all employees of the John
Keells Group, I thank all our stakeholders for
the support extended to the Group during the
year.
Finally, I thank my colleagues on the Board
and the Group Executive Committee for their
guidance and support extended to me during
the year.
Susantha Ratnayake
Chairman
26 May 2017
Chairman’s Message
The total dividend payout in
the financial year 2016/17 was
Rs.7.28 billion.

This section introduces the Board of Directors and Senior
Management Committees that oversee the Group of
Companies. It also offers a detailed analysis of the John
Keells Group governance framework; the mandatory
requirements complied with as well as the Group’s own
internal benchmarks of good governance.
21 Board of Directors • 23 Group Executive Committee • 24 Group Operating Committee • 26 Corporate Governance Commentary
G O V E R N A N C E
Shaping Success


21
Board of Directors
Susantha Ratnayake*Chairman
Susantha Ratnayake was appointed as the
Chairman and CEO of John Keells Holdings
PLC (JKH) in January 2006 and has served
on the JKH Board since 1992/1993 and has
38 years of management experience, all of
which is within the John Keells Group. He is
a past Chairman of the Sri Lanka Tea Board,
Ceylon Chamber of Commerce, and the
Employers’ Federation of Ceylon.
Ajit Gunewardene*Deputy Chairman
Ajit Gunewardene is the Deputy Chairman
of John Keells Holdings PLC and has been a
member of the Board for over 24 years. He is
a Director of several companies in the John
Keells Group and is the Chairman of Union
Assurance PLC. He is a member of the Board
of SLINTEC, a company established for the
development of nanotechnology in Sri Lanka
under the auspices of the Ministry of Science
and Technology. He is also a member of the
Tourism Advisory Committee appointed by
the Minister of Tourism Development. He has
also served as the Chairman of the Colombo
Stock Exchange and Nations Trust Bank PLC.
Ajit has a degree in Economics and brings
over 34 years of management experience.
Ronnie Peiris*
Group Finance Director
Appointed to the John Keells Holdings PLC
Board during 2002/03, Ronnie, as Group
Finance Director, has overall responsibility
for the Group’s Finance and Accounting,
Taxation, Corporate Finance and Strategy,
Treasury, and the Information Technology
functions. He is also a Director of several
companies in the John Keells Group. He
was previously the Managing Director of
Anglo American Corporation (Central Africa)
Limited in Zambia.
He has over 40 years of finance and general
management experience in Sri Lanka and
abroad. He is a Fellow of the Chartered
Institute of Management Accountants,
UK, Association of Chartered Certified
Accountants, UK, and the Society of Certified
Management Accountants, Sri Lanka and
holds an MBA from the University of Cape
Town, South Africa. Previously, the Chairman
of the Sri Lanka Institute of Directors, he is
currently a member of the Committee of the
Ceylon Chamber of Commerce.
Krishan Balendra*
Executive Director
Krishan Balendra has responsibility for the
Leisure industry group and John Keells Stock
Brokers. He also serves as the Chairman
of Nations Trust Bank PLC and is the Hon.
Consul General of the Republic of Poland
in Sri Lanka. He is a former Chairman of
the Colombo Stock Exchange. He started
his professional career at UBS Warburg,
Hong Kong, in investment banking, focusing
primarily on equity capital markets. After a
four year stint in Hong Kong, he continued his
career in corporate finance at Aitken Spence
PLC, Sri Lanka prior to joining JKH. Krishan
holds a law degree (LLB) from the University
of London and an MBA from INSEAD.
Gihan Cooray*Executive Director
Gihan Cooray is responsible for the Retail
sector, the Corporate Finance and Strategy
division, Group Treasury function, John Keells
Capital - the investment banking arm of the
Group and John Keells Research. He is also a
Non-Executive Director of Nations Trust Bank
PLC. Gihan holds an MBA from the Jesse
H. Jones Graduate School of Management
at Rice University, Houston, Texas. He is an
Associate member of the Chartered Institute
of Management Accountants, UK, a certified
management accountant of the Institute
of Certified Management Accountants,
Australia and has a Diploma in Marketing
from the Chartered Institute of Marketing,
UK. He serves as a member of the Economic
Planning Steering Committee of the Ceylon
Chamber of Commerce.
Amal CabraalNon-Executive Director
Appointed a Director on 1 November 2013,
Amal Cabraal is a former Chairman and Chief
Executive Officer of Unilever Sri Lanka. He
has over 3 decades of business experience
in general management, marketing and
sales in Sri Lanka, the United Kingdom, India
and Bangladesh. He is presently the Non-
Executive Chairman of CIC Feeds (Private)
Limited and an Independent Non-Executive
Director of Hatton National Bank PLC, Ceylon
Beverage Holdings PLC, Lion Brewery (Ceylon)
PLC, Silvermill Investment Holdings (Pvt) Ltd
and a member of the Supervisory Board of
Associated Motorways (Private) Ltd. He has
recently been appointed to the Monetary
Policy Consultative Committee of the Central
Bank of Sri Lanka and is a committee member
of the Ceylon Chamber of Commerce and also
serves on the Management Committee of
the Mercantile Services Provident Society. A
Chartered Marketer by profession and a Fellow
of the Chartered Institute of Marketing - UK, he
holds a MBA from the University of Colombo
and is an alumnus of INSEAD-France.
Nihal FonsekaNon-Executive Director
Nihal Fonseka is a career banker and served
as the Chief Executive Officer/Ex-Officio
Director of DFCC Bank from 2000 until his
retirement in 2013. He is currently a Member
of the Monetary Board of the Central Bank of
Sri Lanka, Non-Executive Director of Phoenix
Ventures Pvt Ltd, Chairman of the Group Audit
Committee of Brandix Lanka Limited and
President of the Sri Lanka National Advisory
Council of the Chartered Institute of Securities
and Investments, UK.
Prior to joining the DFCC Bank, he was the
Deputy Chief Executive of HSBC Sri Lanka.
He is a past Chairman of the Colombo Stock
Exchange and the Association of Development
Financing Institutions in Asia and the Pacific
(ADFIAP). He has also served as a Director
of the Employees’ Trust Fund Board and as
a member of the Presidential Commission
on Taxation (2009), National Procurement
Commission and Strategic Enterprise
Management Agency (SEMA). He holds a BSc
from the University of Ceylon, Colombo, is a
Fellow of the Institute of Financial Studies, (FIB)
UK and a member of the Chartered Institute of
Securities and Investments, (MCSI) UK.
* Refer Group Directory for Directorships held by Executive Directors in other Group companies
Group Highlights | Governance | Management Discussion & Analysis | Financial Statements | Supplementary Information

22 John Keells Holdings PLC | Annual Report 2016/17
Board of Directors
Ashroff OmarNon-Executive Director
Ashroff Omar is the Chief Executive Officer
of the Brandix Group. He also serves as a
Director on numerous corporate Boards
including subsidiaries under the umbrella
of Phoenix Ventures, and the national body
of the Sri Lanka Institute of Nanotechnology
(SLINTEC). He also serves as a Member of the
Board of Directors of the United States-Sri
Lanka Fulbright Commission.
He is the Founder Chair of the Joint Apparel
Association Forum (JAAF), the apex body of
the Sri Lankan apparel industry, in addition to
chairing the Advisory Committee on Garments
of the Sri Lanka Export Development Board
and being a frequent spokesperson for
the apparel industry both in Sri Lanka and
abroad. He has also spearheaded the Sri
Lanka Apparel Exporters Association as its
Chair.
Premila Perera
Non-Executive Director
Premila Perera was appointed to the Board
of the Company with effect from 1 July 2014
as an Independent Non-Executive Director.
Premila Perera, formerly a Partner, KPMG
in Sri Lanka, also served as the Global
Firms Regional Tax Director for ASPAC in
2000/01, as a member of the Global Task
Force commissioned in 1998, to advise
the International Board of KPMG on future
directions in determining long term strategic
plans, and faculty of the KPMG International
Tax Business School.
She also served a period of secondment
with the US Firm’s National Tax Office in
Washington DC, and was a participant at the
KPMG-INSEAD International Banking School
programme. She is a Fellow of the Institute
of Chartered Accountants of Sri Lanka,
currently serves as an Independent Director
and Chairperson of the Audit Committee of
Ceylon Tobacco Company PLC, and served as
a Non-Executive Director of Holcim (Lanka)
Limited until August 2016.
Dr Hans WijayasuriyaNon-Executive Director
In his capacity as the Regional CEO for South
Asia, Dr. Hans Wijayasuriya heads the South
Asian Operations of the Axiata Group Bhd.,
spanning Bangladesh, Nepal, Sri Lanka,
Pakistan and India. Axiata is Asia’s second
largest Telecommunications Group.
Up to and including the year 2016, he
additionally functioned as the Group Chief
Executive of Dialog Axiata PLC. He is a past
Chairman of GSM Asia Pacific - the regional
interest group of the GSM Association, and
also serves on the Board of the TM Forum
(TMF), and was also honoured by the GSM
Association as the first recipient of the
“Outstanding Contribution to the Asian Mobile
Industry” Award in 2016.
Dr. Wijayasuriya graduated from the
University of Cambridge, UK in 1989. He
subsequently obtained his PhD in Digital
Mobile Communications from the University
of Bristol UK in 1994. A Chartered Engineer
and Fellow of the Institute of Engineering
Technology UK, Dr. Wijayasuriya also holds
an MBA from the University of Warwick, UK.
Dr. Wijayasuriya has published widely on the
subject of digital mobile communications,
including research papers in publications
of the Institute of Electrical and Electronic
Engineers (IEEE) USA, Royal Society and the
Institute of Engineering Technology (IET) UK.

23
Group Executive Committee
Dilani AlagaratnamPresident
Dilani Alagaratnam is a member of the Group
Executive Committee of John Keells Holdings
PLC, the President with overall responsibility
for Human Resources, Legal and Secretarial,
Corporate Communications, Sustainability
and Enterprise Risk Management, and
Group Initiatives functions of the Group. She
is also a Director of Union Assurance PLC
and several unlisted companies within the
John Keells Group. A Lawyer by profession,
she has been with John Keells Holdings
PLC since 1992 and is a law graduate and a
holder of a Masters’ Degree in Law. Currently,
she is the Chairperson of the Legislation
Sub Committee of the Ceylon Chamber of
Commerce, member of the National Labour
Advisory Committee, and a Council member
of the Sri Lanka Institute of Directors.
Romesh David
President
Romesh David leads the Transportation
industry group of JKH. He has been with
the JKH Group for 37 years during which
he has served in the Leisure, Domestic and
International Trade and IT sectors of the Group
in addition to Transportation. He presently
serves as a Vice President of the Indo-Lanka
Chamber of Commerce and Co-Chair of the
CCC National Agenda Committee on Logistics
and Transport. He is a Chartered member
of the Chartered Institute of Logistics and
Transport and serves on the International
Management Committee of the Institute as
International Vice President for South Asia.
He is a past Chairman of the Chartered
Institute of Logistics and Transport - Sri
Lanka, the Sri Lanka Logistics and Freight
Forwarders Association and the Council for
Business with Britain.
Jitendra GunaratnePresident
Jitendra Gunaratne is responsible for
the Consumer Foods sector. Prior to his
appointment as President, he oversaw the
Plantations and Retail sectors. His 37 years
of management experience in the Group also
covers Leisure and Property. He is a Director
of Ceylon Cold Stores PLC and Keells Food
Products PLC and is also the President of
the Beverage Association of Sri Lanka. He is
a member of the Council of the Employers'
Federation of Ceylon and a member of the
Food Advisory Committee of the Ministry of
Health.
Suresh RajendraPresident
Suresh Rajendra is responsible for the
Property industry group of the John Keells
Group and also serves as a Director of
Union Assurance PLC and Asian Hotels and
Properties PLC. He has over 22 years of
experience in the fields of finance, property
and real estate, travel and tourism, and
business development acquired both in Sri
Lanka and overseas. Prior to joining the
Group, he was the head of commercial and
business development for NRMA Motoring
and Services in Sydney, Australia, Director/
General Manager of Aitken Spence Hotel
Managements (Private) Limited, and also
served on the Boards of the hotel companies
of the Aitken Spence Group. Suresh is a Fellow
of the Chartered Institute of Management
Accountants, UK.
Group Highlights | Governance | Management Discussion & Analysis | Financial Statements | Supplementary Information

24 John Keells Holdings PLC | Annual Report 2016/17
Group Operating Committee
Zafir Hashim Executive Vice President
Zafir Hashim is the Head of the Transportation
Sector and has been with the Group for 14
years. He joined the Group in 2003, seconded
to Lanka Marine Services where he served
as CEO from 2005-2015. He has also served
as a member of the Transportation Sector
Committee from 2005. During the last 13
years he has held the position of CEO at John
Keells Logistics Lanka Ltd., for a short time,
and Mackinnons Mackenzie Shipping Co. Ltd.
He has an MSc in Chemical Engineering from
the University of Birmingham (UK).
Sanjeewa Jayaweera Executive Vice President
Sanjeewa Jayaweera, Chief Financial Officer
for the Consumer Foods and Retail industry
group, has been with the Group for 24 years,
during which he served in the Resort Hotels
sector of the Leisure industry group and was
the Sector Financial Controller for Resort
Hotels from 1998 to 2005. Prior to joining
the Group, Sanjeewa was based in the United
Kingdom and worked for several years as an
Audit Manager.
Rohan Karunarajah Executive Vice President
Rohan Karunarajah, Sector Head of the
City Hotels sector, currently overlooks
the management of the Cinnamon Grand,
Cinnamon Lakeside and Cinnamon red. A
career hotelier counting over three decades,
both in the local and international hospitality
industry; he held the position of General
Manager in several hotels in the United
Kingdom, lastly being the Marriott Marble
Arch, London. He is a Director of Asian Hotels
and Properties PLC and Trans Asia Hotels
PLC. He read for his Masters in Hospitality
and Business Studies from the Thames
Valley University, London.
Vasantha Leelananda Executive Vice President
Vasantha Leelananda is Head of the
Destination Management sector and counts
over 38 years in the Leisure industry group
with the John Keells Group. He served as
the Managing Director of Walkers Tours
from 1997 to 2005 and heads inbound travel
operations in Sri Lanka. Vasantha holds an
MBA from the University of Leicester.
He is a past President of the Sri Lanka
Association of Inbound Tour Operators
(SLAITO), a Board member of the Sri Lanka
Convention Bureau from 2003 to 2007, Board
member of the Sri Lanka Institute of Tourism
and Hotel Management from 2007 to 2010
and served as a Board member of American
Chamber of Commerce (AMCHAM) from 2012
to 2014. He is currently a Board member of
the Responsible Tourism Partnership which
is affiliated to the Travel Foundation UK, Board
member of the Sri Lanka Tourism Promotion
Bureau (SLTPB) and a Director of Sri Lanka
Business and Biodiversity Platform.
Chandrika Perera Executive Vice President
Chandrika Perera was appointed as the Chief
Financial Officer of the Leisure industry group
in March 2005 and has been with the Group
for 34 years. She was the Group Financial
Controller from 1999 to 2005. She has also
held the position of Sector Financial Controller
in Food and Beverage, Property Development
and Consumer Foods. She is a member
of the Group Management Committee for
the Leisure industry group. A Fellow of
the Institute of Chartered Accountants of
Sri Lanka (CA Sri Lanka) and the Society
of Certified Management Accountants, Sri
Lanka, she holds an MBA (Finance) from the
University of Southern Queensland, Australia.
She is currently serving on the Technical
Committee for the National Conference of
Chartered Accountants.
Mano RajakariarExecutive Vice President
Mano Rajakariar, has been the Group
Financial Controller since April 2005. He
has been with the Group for over 21 years
in many capacities including serving as
the Sector Financial Controller of the
Plantations sector and heading the Shared
Services implementation within the Group.
He has over 28 years of experience in audit,
finance and general management acquired
both in Sri Lanka and overseas. Mano is a
Fellow member of the Institute of Chartered
Accountants of Sri Lanka (CA Sri Lanka)
and the Chartered Institute of Management
Accountants, UK. He currently serves as
a member of the Statutory Accounting
Standards Committee, the Financial
Reporting Standards Implementation
and Interpretation Committee, the IFRS
Education Committee, the Tax Faculty and
the Examinations Committee of the Institute
of Chartered Accountants of Sri Lanka. He
also serves in the Board of Management of
the Integrated Reporting Council of Sri Lanka.
Mano is also a member of the Taxation
sub-committee of the Ceylon Chamber of
Commerce. He also serves in the Finance
Committee of the Sri Lanka Cancer Society.
Waruna Rajapaksa Executive Vice President
Waruna Rajapaksa, Head of New Business
Development for the John Keells Group
and Head of Operations for the “Cinnamon
Life” integrated project, has over 30 of
experience in Sri Lanka and in the UK,
primarily in management consultancy,
project infrastructure, finance, and audit.
Prior to joining the Group in 2002, he worked
for the Government as an Executive Director
at the Bureau of Infrastructure Investment,
Informatics International Limited (UK) and at
Ernst & Young. He is a member of the Board
of Directors of South Asia Gateway Terminals
(Private) Limited. Waruna is a Fellow member
of the Chartered Institute of Management
Accountants, UK, and an Associate member
of the Institute of Chartered Accountants of
Sri Lanka. He also holds an MBA from City
University Cass Business School, London, UK.

25
Sunimal Senanayake Executive Vice President
Sunimal Senanayake is an Executive Vice
President of the John Keells Group and the
Sector Head of the Resorts sector (Sri Lanka
and Maldives). He is also a member of the
Group Operating Committee and has over 30
years of experience in the Leisure Industry,
both in Hotels and Inbound Tourism. He
served as the Managing Director of Walkers
Tours Limited from 1991 - 1997. He is a
past President of the Sri Lanka Association
of Inbound Tour Operators (SLAITO) and
has held many positions in travel trade
related associations and committees. He has
also been a member of the Tourist Hotels
Classification Committee and Chairman /
Member of the Advisory Board of the Sri Lanka
Institute of Tourism and Hotel Management.
Ramesh Shanmuganathan Executive Vice President
Ramesh Shanmuganathan is the Group’s Chief
Information Officer, a member of the Group
Management Committee for the Information
Technology industry group as well as Chief
Executive Officer of John Keells IT (JKCS cum
SGIT). He has over 21 years of experience in
the ICT industry both in Sri Lanka and the USA,
with over 16 years in C-level management.
Ramesh is a Hayes-Fulbright Scholar and
holds to his credit a MSc (Information
Technology and Computer Science) with Phi
Kappa Phi Honours from Rochester Institute
of Technology (New York, USA), Master of
Business Administration from Postgraduate
Institute of Management, University of Sri
Jayewardenepura, Bachelor of Science
in Electronics and Telecommunications
Engineering with First Class Honours from
the University of Moratuwa. He is reading for
his Doctor of Business Administration (DBA)
at the International School of Management,
Paris at present. He is a Chartered Engineer,
Chartered IT Professional and a Fellow of
the British Computer Society. He has active
memberships in several other professional
institutions and is a visiting faculty member
for several post-graduate programmes. He
is also the Chair of the Sri Lanka SAP User
Group (SLSUG) and is actively involved with
the ICTA, SLASSCOM as well as other bodies
in steering IT to greater heights within the
country. He is also a member of the Gartner
Research Circle.
Charitha Subasinghe Executive Vice President
Charitha Subasinghe is the Sector Head of
the Retail sector. He has been with the John
Keells Group since 2003. He was the Sector
Financial Controller of the Retail sector,
before being appointed as the Chief Executive
Officer in 2005. He was also employed at
Aitken Spence Hotel Management as the
Sector Financial Controller before moving
over to John Keells. He is an Associate
Member of the Chartered Institute of
Management Accountants (UK) as well as a
Diploma Holder of the Chartered Institute of
Marketing (UK). He also holds a MBA from the
University of Colombo.
Nadija Tambiah Executive Vice President
Nadija Tambiah, Head of Legal and
Secretarial is a law graduate from the
University of Manchester, United Kingdom,
a Barrister at Law (Middle Temple), UK and
is also qualified an Attorney at Law in Sri
Lanka. She also heads the Corporate Social
Responsibility arm of John Keells Holdings
PLC. She has been involved in most of the
strategic transactions of the John Keells
Group during her 21 year tenure. She serves
as a member of the Steering Committee
on Arbitration and Mediation at the Ceylon
Chamber of Commerce.
Devika Weerasinghe Executive Vice President
Devika Weerasinghe, Chief Financial Officer of
the Transportation industry group previously
held the position of Sector Financial
Controller of the Transportation sector. She
also served as the Sector Financial Controller
of the Airlines SBU of the Transportation
sector during the period 1998-2004. An
Associate member of the Chartered Institute
of Management Accountants UK, Devika
also holds a Bachelor’s Degree in Business
Administration, from the University of Sri
Jayawardenepura.
Suran Wijesinghe Executive Vice President
Suran Wijesinghe, joined the Group in January
2004 as the Sector Financial Controller of
the Financial Services industry group and
was appointed as the Chief Financial Officer
of the same industry group in July 2010.
He is a Director of Nations Trust Bank PLC
and has over 30 years of experience in the
fields of auditing and financial and general
management which has been acquired
while serving in organisations both locally
and overseas. Suran is a Fellow member of
both the Institute of Chartered Accountants of
Sri Lanka (CA Sri Lanka) and the Chartered
Institute of Management Accountants, UK.
Group Highlights | Governance | Management Discussion & Analysis | Financial Statements | Supplementary Information

26 John Keells Holdings PLC | Annual Report 2016/17
Corporate Governance Commentary
Executive SummaryThe corporate governance framework at
John Keells Holdings PLC (JKH) is built on the
core principles of accountability, participation
and transparency and is the bedrock for the
creation, enhancement and maintenance of
a sustainable business model. It has been
institutionalised across all levels through a
strong set of Corporate Values, a written Code
of Conduct, a well articulated Operating Model
and a proven Performance Management
System and is designed to be a working
structure for principled actions, effective
decision making and appropriate monitoring
of both compliance and performance.
Against this backdrop, the Group confirms
that it is fully compliant with all the
mandatory provisions of the Companies Act,
Listing Rules of the Colombo Stock Exchange
(CSE) and the Securities and Exchange
Commission of Sri Lanka Act (SEC) and all
other legislation and rules applicable to the
businesses of the Group. Further, the Group’s
practices are in line with the Code of Best
Practices on Corporate Governance jointly
advocated by the SEC and the Institute of
Chartered Accountants of Sri Lanka (CA
Sri Lanka). All systems and procedures
are continuously reviewed to provide
transparency and accountability, and as such,
are continuously updated to adhere to the
stipulated guidelines.
The ensuing sections will describe in greater
detail, where material and relevant, the
components of the JKH Corporate Governance
System; the mechanisms in place to ensure
strict adherence to the Group’s governance
policy and gain assurance of its disciplined
application and effectiveness, and an outlook
and summation of the emerging challenges
in the area of corporate governance.
Highlights of the 37th Annual General Meeting held on 24 June 2016
• Mr. R Peiris, who retired in terms of Article 84 of the Articles of Association of the Company,
was re-elected as a Director of the Company
• Mr. A Omar, who retired in terms of Article 84 of the Articles of Association of the Company,
was re-elected as a Director of the Company
• Ernst & Young were re-appointed as the External Auditors of the Company
This Corporate Governance Commentary is available on our corporate website at www.keells.com/governance
• Plans of succession of the Deputy
Chairman, and the Group Finance
Director, who retire at the end of
December 2017, and the Chairman, who
retires at the end of December 2018,
were announced in November 2016
• Plans of succession of various Key
Management Personnel who are due to
retire by the end of the calendar year
2018 were announced in February 2017
• In line with the Group’s digitisation
initiatives, as elaborated in last year’s
Report, the Group businesses invested
in information technology systems. As a
step towards supporting the digitisation
drive, the Strategic Group Information
Technology division of the Group
revamped its service offerings for the
financial year 2016/17. The “John Keells
X - Open Innovation Challenge 2016”
was also launched, as part of a broader
digitisation drive with the aim of providing
a platform for innovative ideas that can
disrupt traditional business models
and open new avenues for enhancing
customer experiences
• The Group Business Process Review
division implemented a digital forensic
tool, Forestpin, to analyse transactional
data from key systems using techniques
such as standard deviations, Z-scores,
and time series analysis in detecting
outliers and raising alerts for
management actions and responses. It
further serves to enhance the internal
audit function by providing a platform
for regular management reporting
around existing processes and controls
that safeguard stakeholder interest for
improved assurances
• The Group has embarked on the first steps
of the “Framework for Improving Critical
Infrastructure Cybersecurity” as developed
by the National Institute of Standards and
Technology (NIST) in addressing cyber
risks. Approval has been received, and
funds have been allocated, to address
security in a systematic manner, within a
culture of enhanced security awareness, to
facilitate an environment which supports
the Group’s ongoing digitisation initiatives.
The Group is in the process of establishing
a Managed Security Operations Centre
(MSOC). This will strengthen our present
layered security filters and ensure that
our critical IT assets, concentrated in our
data centers and cloud platforms, are
optimally protected from cyber threats
and intrusions
• A new automated, centralised
procurement platform was implemented
to assist in enhancing the sourcing,
contracting and supplier management
initiatives
• The Group engaged a global software
company, to provide a software solution
for its Enterprise Risk, Audit and Incident
Management processes. As the system
offers real-time and online visibility of
the risks and audit framework across
the companies within the Group, this
platform will enable the Group to move
towards a digitally driven internal audit
function
Key corporate governance initiatives undertaken at JKH for the year 2016/17
In order to ensure a clear dissemination of information, a two-tier structure has been employed in
authoring this Commentary. As such, key details with regard to the JKH corporate governance framework
will be discussed in the ensuing sections, whilst, detailed regulatory related information will be discussed
in the compliance tables that follow this Commentary.

27Group Highlights | Governance | Management Discussion & Analysis | Financial Statements | Supplementary Information
The diagram above depicts the key components
of the JKH Corporate Governance System and
their inter-linkages. The Corporate Governance
Commentary is broadly sequenced in keeping
with this diagram as follows:
Internal Governance Structure
Section 1 of this Commentary - Internal
Governance Structure, discusses and contains
information about the committees which
formulate, execute and monitor strategies,
initiatives, policies and processes, and
procedures employed throughout the Group.
The Corporate Governance SystemJKH Corporate Governance System within a Sustainability Development Framework
Integrated Governance Systems and
Procedures
Section 2 of this Commentary - Integrated
Governance Systems and Procedures,
discusses the overarching frameworks
which govern the key functions of the Group,
which support businesses in conducting their
activities more effectively and efficiently in
keeping with best practices and in line with
ethical and transparent corporate conduct.
Assurance Mechanisms
Section 3 of this Commentary - Assurance
Mechanisms, discusses the “bodies and
mechanisms” which are employed in
enabling regular review of progress against
objectives, with a view to highlighting
deviations and quick redress, and in providing
assurance that actual outcomes are in line
with expectations. Where appropriate, and
relevant, best practices are sought, proposed
and implemented.
LEVEL INTERNAL GOVERNANCE STRUCTURE
Board of Directors and Senior
Management Committees
Integrated Governance
Systems and Procedures
INTEGRATED GOVERNANCE
ASSURANCE MECHANISMS
Key Components
REGULATORY BENCHMARKS
GROUP
GROUP +
INDUSTRY /
FUNCTION
INDUSTRY /
FUNCTION
SECTOR /
FUNCTION /
SUBSECTOR
BUSINESS /
FUNCTION /
BU / DEPT
Human Resources and Compensation
Committee
Nominations Committee
AuditCommittee
Chairman-CEO
Group Executive Committee (GEC)
Group Operating Committee (GOC)
Group Management Committee (GMC)
Sector Committee
Management Committee
Employee Empowerment
Senior
Independent
Director
Strategy
Formulation and
Decision Making
Process
Human Resource
Governance
Integrated Risk
Management
IT Governance
Stakeholder
Management and
Effective
Communication
Sustainability
Governance
Board
Committee
Employee
Participation
Internal
Control
JKH Code
of Conduct
External
Control
Ombudsperson
Companies Act No. 7 of
2007
Mandatory compliance
Related Party Transaction
Review Committee
Listing Rules of the
Colombo Stock
Exchange (CSE)
Mandatory compliance
Recommendations of
the UK Corporate
Governance Code as
practicable in the
context of the nature of
businesses and risk
profiles
Voluntary compliance
The Code of Best
Practice on Corporate
Governance as
published by the
Securities and Exchange
Commission and the
Institute of Chartered
Accountants, Sri Lanka
Voluntary compliance
• All 4 Board Sub-Committees are chaired by Independent Directors appointed by the Board
• The Chairman-CEO attends the Human Resource and Compensation Committee with the Group Finance Director and President - HR as frequent
attendees
• The Audit Committee is attended by Chairman-CEO, Group Finance Director, Group Financial Controller, Head of Group Business Process Review and
External Auditors
• The Group Operating Committee (GOC) acts as the glue binding the various businesses within the Group towards identifying and extracting Group
synergies and driving Group initiatives
• Only the key components are depicted in the diagram due to space constraints

28 John Keells Holdings PLC | Annual Report 2016/17
Corporate Governance Commentary
Regulatory and Performance
Benchmarks
Section 4 of this Commentary - Regulatory and
Performance Benchmarks, summates, among
others, the regulations which govern all JKH
corporate activities from the Companies Act
to the Listing Rules of the CSE and the rules
of the SEC. It also indicates, where relevant,
the benchmarks set for the Group in working
towards local and global practices.
1. Internal Governance StructureThis section details the components that
are embedded within the Group, and as a
result, have an impact on the execution,
and monitoring of all governance related
initiatives, systems and processes. The
Internal Governance Structure encompasses:
i. The Board of Directors
ii. Board Sub Committees
iii. The Combined Role of the Chairman-CEO
iv. Group Executive Committee, Group
Operating Committee and other
Management Committees
v. Employee Empowerment
As depicted in the Governance framework,
the above components in the structure are
strengthened and complemented by internal
policies, processes and procedures such as
strategy formulation and decision making,
human resource governance, integrated risk
management, IT governance, stakeholder
management, and effective communication.
1.1 The Board of Directors
1.1.1 Board Responsibilities
The Board’s key responsibilities include:
• Providing direction and guidance to the
Group in the formulation of high-level
medium, and long term strategies which
are aimed at promoting the sustainable
long term success of the Group
• Reviewing and approving annual plans,
and longer term business plans
• Tracking actual progress against plans
• Reviewing HR processes with emphasis
on succession planning for the top
management
• Appointing and reviewing the
performance of the Chairman-CEO
• Monitoring systems of governance and
compliance
• Overseeing systems of internal control,
risk management, and monitoring and
establishing whistle-blowing conduits
• Determining any changes to the
discretions/authorities delegated from
the Board to the executive levels
• Reviewing and approving major
acquisitions, disposals and capital
expenditure
• Approving any amendments to
constitutional documents
• Approving in principle the issue of JKH
equity/debt securities
Key decisions made by the Board during
the year under review included:
• In May 2016, the Board recommended
an increase of the number of shares of
the Company in issue by way of a share
sub division whereby seven (7) existing
ordinary shares were divided into eight
(8) ordinary shares
• Increasing the dividend pay-out ratio
(excluding any special dividends)
by declaring higher than previously
declared dividends per share in the first
and second interim dividends for the
financial year 2016/17, in October 2016
and February 2017 respectively
• Submission of an Expression of Interest
(EOI) for the East Container Terminal of
the Port of Colombo
• Consideration of a proposal from its
subsidiary, John Keells Hotels PLC, to
extend the head lease on the Dhonveli
Island in Maldives
• Consideration of proposals from its
subsidiary, Ceylon Cold Stores PLC,
to construct two production facilities:
an ice cream plant in the Seethawaka
Export Processing Zone, and a bottling
line in Ranala
• Recommendation to shareholders for
the issue of share options under an
Employee Share Option Plan 9, in which
the shares on offer will be a maximum
of 2.25 per cent of the issued shares of
the Company, of which not more than
0.75 per cent will be issued annually
over a period of three years
1.1.2 Board Composition
The Group’s policy is to maintain a healthy
balance between the Executive, Non-
Executive and Independent Directors with
the Executive Directors bringing in deep
knowledge of the businesses, and Non-
Executive Independent Directors bringing
in experience, objectivity, and independent
oversight.
As at 26 May 2017, the Board comprised of 10
Directors, with 5 of them being Non-Executive
and Independent. The current Board
composition will change on 31 December
2017, following the retirement of the Deputy
Chairman and the Group Finance Director.
Thereafter, the composition of the Board will
comprise of a majority of NEDs, similar to
previous years.
During the year under review, the Board
membership changed as follows:
• Mr. F Amerasinghe and Mr. T Das, who are
over the age of 70 years, and who have
served the Company for over 9 years, did
not offer themselves for re-election and
accordingly ceased to be Board Directors
with effect from 24 June 2016
• Dr. I Coomaraswamy resigned from the
Board with effect from 3 July 2016, in
order to assume duties as the Governor
of the Central Bank of Sri Lanka
• Dr. H Wijayasuriya was appointed as a
Non-Executive Director to the Board with
effect from 4 October 2016
• In keeping with the succession plans
approved by the Board, Mr. K Balendra
and Mr. G Cooray were appointed as
Executive Directors with effect from 5
November 2016
Accordingly, the composition of the Board as
at the end of the financial year is illustrated
as follows:
0 2 4 6 8 10
Designation
Gender
Age group (years)
Board tenure - Executive Directors (years)
Board tenure - Non-Executive Directors (years)
NED SID ED
MaleFemale
40-50 51-60 61-70
<5 5-20 >20
<3 3-7

29
1.1.3 Board Skills
Collectively, the Board brings in a wealth of
diverse exposure in the fields of business,
finance, economics, banking, marketing, tax,
IT, and human resources, which facilitates
constructive and challenging discussions
in the Board room. Further details of their
qualifications and experience are provided
under the Board Profiles section of this
Annual Report.
1.1.4.1 Board Agenda
The Chairman-CEO ensured that all Board
proceedings were conducted in a proper
manner, approving the agenda for each
meeting prepared by the Board Secretary.
The typical Board agenda in 2016/17 was:
• Confirmation of previous minutes
• Ratification of Circular Resolutions
• Matters arising from the previous
minutes
• Board Sub-Committee reports and other
matters exclusive to the Board
In choosing Directors, the Group seeks
individuals who have a very high level of
integrity, business savviness, shareholder
orientation and a genuine interest in JKH. The
Group is conscious of the need to maintain
an appropriate mix of skills and experience
in the Board, and thus, a regular review of
the Board is conducted to ensure that the
skills representation is in alignment with the
current and future needs of the Group.
• Status updates of major projects
• Review of performance - in summary, and
in detail, including high level commentary
on actual performances and outlook
• Summation of strategic issues discussed
at Pre-Board meetings
• Approval of quarterly and annual
financial statements
• Ratification of capital expenditure and
donations
• Ratification of the use of the company
seal and share certificates issued
1.1.4 Board Meetings
During the financial year under review, four
pre-scheduled Board meetings, and three
special meetings were convened. All pre-
scheduled Board meetings are generally
coupled with a Pre-Board meeting, which is
usually held on the day prior to the formal
Board meeting. Pre-Board meetings serve
as a forum to discuss issues of strategic
importance requiring extensive discussions.
The Board also communicates regularly on
routine matters depending on the need.
• New resolutions
• Report on corporate social responsibility
• Review of Group Risks, Sustainability/
CSR, HR practices/updates, Tax and
Treasury updates
• Any other business
Group Highlights | Governance | Management Discussion & Analysis | Financial Statements | Supplementary Information
The attendance at the Board meetings held during the financial year 2016/17 was as follows:
Yea
r o
f
ap
po
intm
en
t to
the
Bo
ard
Board meeting attendance
24
/05
/20
16
25
/05
/20
16
28
/07/
20
16
04
/10
/20
16
04
/11
/20
16
26
/01
/20
17
16
/03
/20
17
Eli
gib
le t
o
att
en
d
Att
en
de
d
Executive
S Ratnayake - Chairman-CEO 1992/93 7 7
A Gunewardene - Deputy Chairman 1992/93 7 7
R Peiris - Group Finance Director 2003/04 7 7
K Balendra+ 2016/17 3 3
G Cooray+ 2016/17 3 3
Senior Independent Non-Executive
F Amerasinghe¡ 1999/00 2 2
N Fonseka 2013/14 7 7
Independent Non-Executive
A Cabraal 2013/14 x 7 6
I Coomaraswamy* 2010/11 2 2
T Das¡ 2000/01 x x 2 0
A Omar 2012/13 7 7
P Perera 2014/15 By Phone By Phone 7 7
H Wijayasuriya+ 2016/17 By Phone 3 3
¡ Ceased to be a Director during the year 2016/17
* Resigned from the Board during the year 2016/17
+ Appointed to the Board during the year 2016/17

30 John Keells Holdings PLC | Annual Report 2016/17
Corporate Governance Commentary
1.1.5 Board Evaluation
The Board conducted its annual Board
performance appraisal for the financial
year 2016/17. This formalised process of
individual appraisal enabled each member
to self-appraise, on an anonymous basis, the
performance of the Board under the areas of:
• Role clarity and effective discharge of
responsibilities
• People mix and structures
• Systems and procedures
• Quality of participation
• Board image
The results of the evaluation revealed that the
Board has improved in all areas mentioned
above in comparison to the previous year,
and consequently, improved Board dynamics.
There was however, a lack of clarity amongst
few Non-Executive Directors regarding
the Board’s decision rights and the Group
Executive Committee’s (GEC) decision rights.
The “Decision Rights Matrix” was circulated
among all Directors subsequently.
We believe in a diverse workforce to serve
our diverse consumer base. Inclusion is the
foundation of a sustainable, strong culture. We
want our people to feel confident, comfortable
and able to reach their potential regardless
of gender, age, ability, background or sexual
preference. The Board acknowledges the
need for diversity and is committed to make
progress in improving the gender diversity of
the Board and the senior management.
1.1.6 Access to Independent Professional
Advice
In order to preserve the independence of the
Board, and also to strengthen its decision
making, the Board encourages its members
to seek independent professional advice, in
furtherance of their duties, at the Group’s
expense. This is coordinated through the
Board Secretary as and when requested.
Prior to appointment Once appointed During Board meetings
Nominees are requested
to make known their
various interests
Directors obtain Board
clearance prior to:
• Accepting a new position
• Engaging in any transaction
that could create or
potentially create a conflict
of interest
All NEDs are required to notify
the Chairman-CEO of any
changes to their current Board
representations or interests
and a new declaration is made
every financial year
Directors who have an interest
in a matter under discussion:
• Excuse themselves from
deliberations on the subject
matter
• Abstain from voting on the
subject matter (abstention
from decisions are duly
minuted)
The independence of all its Non-Executive Directors was reviewed on the basis of criteria
summarised below.
Definition Status of conformity
1. Shareholding carrying not less than 10
per cent of voting rights
None of the individual EDs or NED/IDs
shareholding exceeds 1 per cent
2. Director of another company* None of the NED/IDs are Directors of another
related party company as defined
3. Income/non cash benefit equivalent to
20 per cent of the Director’s income
NED/ID income/cash benefits are less than
20 per cent of individual Director’s income
4. Employment at JKH two years
immediately preceding appointment as
Director
None of the NED/IDs are employed or
have been employed at JKH or any of its
subsidiaries
5. Close family member who is a Director,
CEO or a Key Management Personnel
No family members of the EDs or NED/IDs is
a Director or CEO of a related party company
6. Has served on the Board continuously
for a period exceeding nine years from
the date of the first appointment
No NED has served on the Board for more
than nine years from the date of their first
appointment
* Other companies in which a majority of the other Directors of the listed company are employed, or
are Directors or have a significant shareholding, or have a material business relationship.We believe in a diverse workforce
to serve our diverse consumer
base. Inclusion is the foundation of
a sustainable, strong culture.
1.1.7 Managing Conflicts of Interests and Ensuring Independence
In order to avoid potential conflicts or biases, the Directors make a general disclosure of
interests, as illustrated below, at the time of appointment, at the beginning of every financial
year, and during the year as required. Potential conflicts are reviewed by the Board from time to
time to ensure the integrity of the Board’s independence.

31
1.2 Board Sub-Committees
The Board has delegated some of its functions
to the Board Sub-Committees, whilst
retaining final decision rights. Members of
these Sub-Committees are able to focus on
their designated areas of responsibility and
impart knowledge and oversight in areas
where they have greater expertise.
The four Board Sub-Committees are as follows:
i. Audit Committee
ii. Human Resources and Compensation
Committee
iii. Nominations Committee
iv. Related Party Transaction Review
Committee
During the year, Board Sub-Committees were
reconstituted in order to accommodate new
appointments to, and resignations from, the
Board. The current membership of the four
Board Sub-Committees is as follows:
Group Highlights | Governance | Management Discussion & Analysis | Financial Statements | Supplementary Information
In addition to the profiles of the Directors provided in the Report, the following table illustrates
the total number of Board seats (excluding Group Board seats on the basis of subsidiary or
equity accounted investees) held in other listed companies outside the Group by each serving
Director as at the end of the financial year 2016/17.
Name of Director Directorship status at
JKH
Board seats held in other listed Sri Lankan
companies
Executive capacity Non-Executive capacity
Executive
S Ratnayake Chairman-CEO N/A Ceylon Tobacco Company PLC
A Gunewardene Executive Director N/A Nil
R Peiris Executive Director N/A Nil
K Balendra Executive Director N/A Nil
G Cooray Executive Director N/A Nil
Senior Independent Non-Executive
N Fonseka Non-Executive Director N/A DFCC Bank PLC
Independent Non-Executive
A Cabraal Non-Executive Director Nil Ceylon Beverage Holdings PLC
Hatton National Bank PLC
Lion Brewery (Ceylon) PLC
A Omar Non-Executive Director Nil Textured Jersey Lanka PLC
P Perera Non-Executive Director Nil Ceylon Tobacco Company PLC
H Wijayasuriya Non-Executive Director Nil Dialog Axiata PLC
Board Sub-Committee Membership
(as at 31 March 2017) Audit Committee
Human Resources
and Compensation
Committee
Nominations
Committee
Related Party
Transaction Review
Committee
Executive
S Ratnayake - Chairman-CEO ● ●
A Gunewardene - Deputy Chairman
R Peiris - Group Finance Director
K Balendra
G Cooray
Senior Independent Non-Executive
N Fonseka ●
Independent Non-Executive
A Cabraal ● ●
A Omar ●
P Perera ● ●
H Wijayasuriya ● ●
Committee Chair
● Committee Member
The Board has delegated some of
its functions to the Board Sub-
Committees, whilst retaining final
decision rights.

32 John Keells Holdings PLC | Annual Report 2016/17
Corporate Governance Commentary
1.2.1 Audit Committee
Composition All members to be exclusively Non-Executive, Independent Directors with
at least one member having significant, recent and relevant financial
management and accounting experience and a professional accounting
qualification.
The Chairman-CEO and the Group Finance Director are permanent invitees
for all Committee meetings. The Group Financial Controller is also present
at discussions relating to Group reporting.
Mandate Monitor and supervise management’s financial reporting process in
ensuring:
• Accurate and timely disclosure
• Transparency, integrity and quality of financial reporting
Scope 1. Confirm and assure:
• Independence of External Auditor
• Objectivity of Internal Auditor
2. Review with independent auditors the adequacy of internal controls and
quality of financial reporting
3. Regular review meetings with management, Internal Auditor and
External Auditors in seeking assurance on various matters
Report of the Audit CommitteeRole of the Committee
The role of the Audit Committee is to assist the
Board in fulfilling its oversight responsibilities
in relation to the integrity of the financial
statements of the Company and the Group,
the internal control and risk management
systems of the Group and its compliance
with legal and regulatory requirements, the
External Auditors’ performance, qualifications
and independence, and, the adequacy and
performance of the Internal Audit function,
undertaken by the Group Business Process
Review division (Group BPR). The scope of
functions and responsibilities are adequately
set out, in the terms of reference of the
Committee which has been approved by the
Board and is reviewed annually.
The Committee’s responsibilities pertain
to the Group as a whole and in discharging
its responsibilities, the Committee places
reliance on the work of other Audit
Committees in the Group without prejudicing
the independence of those Committees.
However, to the extent, and in a manner
it considers appropriate, the Committee
provides feedback to those entities for their
consideration and necessary action. An
interactive forum with the participation of
members of Audit Committees of Group
entities was held to discuss ways and
means of improving coordination with Group
BPR and to exchange information on best
practices.
The effectiveness of the Committee is
evaluated annually by each member of the
Committee and the results are communicated
to the Board.
Composition of the Committee and
Meetings
There was a change in the composition of the
Committee during the financial year whereby
Dr. I Coomaraswamy resigned, effective 3
July 2016. Thereafter the Audit Committee
comprised the undersigned and the following
Independent Non-Executive Directors:
A Cabraal
P Perera
The Head of the Group BPR division served as
the Secretary to the Audit Committee.
The Audit Committee convened seven times
during the financial year. Information on
the attendance at these meetings by the
members of the Committee is given in the
ensuing section. The Chairman-CEO, the Group
Finance Director, Group Finance Director-
Designate, Group Financial Controller and the
External Auditors attended most parts of these
meetings by invitation. The Internal Auditors
carrying out outsourced assignments and
other officials of the Company and the Group
also attended these meetings on a needs basis.
The Committee engaged with management to
review key risks faced by the Group as a whole
and the main sectors, with a view to obtaining
assurances that appropriate and effective risk
mitigation strategies were in place.
The activities and views of the Committee
have been communicated to the Board of
Directors quarterly through verbal briefings,
and by tabling the minutes of the Committee’s
meetings.
Financial Reporting
The Audit Committee has reviewed and
discussed the Group’s quarterly and annual
financial statements, prior to publication,
with management and the External Auditors.
The review included ascertaining compliance
of same with the Sri Lanka Accounting
Standards, the appropriateness and
changes in accounting policies and material
judgemental matters. The Committee also
discussed with the External Auditors and
management, any matters communicated
to the Committee by the External Auditors in
their reports to the Committee on the audit
for the year.
The External Auditors were also engaged
to conduct a limited review of the Group’s
interim financial statements for the six
months ended 30th September 2016. The
results of this review were discussed with the
External Auditors and management.
Internal Audit, Risks and Controls
The Committee reviewed the adequacy of
the Internal Audit coverage for the Group
and the Internal Audit Plans for the Group
with the Head of the Group BPR division and
management. The Internal Audit function
of most Group companies is outsourced
to leading professional firms under the
overarching control of the Group BPR division.
The Group BPR division regularly reported
to the Committee on the adequacy and
effectiveness of internal controls in the Group
and compliance with laws and regulations and
established policies and procedures of the
Group. Reports from the outsourced Internal
Auditors on the operations of the Company

33Group Highlights | Governance | Management Discussion & Analysis | Financial Statements | Supplementary Information
and some of the unquoted direct subsidiaries
of the Company were also reviewed by the
Committee. Follow-up action taken on the
recommendations of the outsourced Internal
Auditors and any other significant follow-up
matters were documented and presented to
the Committee on a quarterly basis by the
Head of Group BPR.
During the year, the Group BPR division
successfully implemented a digital forensic
project across the entire Group, for analysing
transactional data, to report on outliers for
management oversight and continuously
improve controls to enhance assurances in
relation to establishing the integrity of data
used for reporting purposes.
The Sustainability and Enterprise Risk
Management division (SRM) reported to the
Committee on the process of identification,
evaluation and management of all significant
risks faced by the Group. The report covered
the overall risk profile of the Group for the
year under review in comparison with that
for the previous year, and the most significant
risks from a Group perspective together with
the remedial measures taken to manage
them.
Formal confirmations and assurances were
obtained from the senior management
of Group companies on a quarterly
basis, regarding the efficacy and status
of the internal control systems and risk
management systems, and compliance with
applicable laws and regulations.
The Committee reviewed the whistleblowing
arrangements for the Group and had direct
access to the Ombudsperson for the Group.
The effectiveness and resource requirements
of the Group BPR division were reviewed and
discussed with management and changes
were effected where considered necessary.
External Audit
The External Auditors’ Letter of Engagement,
including the scope of the audit, was reviewed
and discussed by the Committee with the
External Auditors and management prior to
the commencement of the audit.
The External Auditors kept the Committee
advised on an on-going basis regarding
matters of significance that were pending
resolution. Before the conclusion of the Audit,
the Committee met with the External Auditors
and management to discuss all audit issues
and to agree on their treatment. This included
the discussion of formal reports from the
External Auditors to the Committee. The
Committee also met the External Auditors,
without management being present, prior to
the finalisation of the financial statements.
The External Auditors’ reports on the
audit of the Company and Group financial
statements for the year, were discussed with
management and the auditors.
The Committee is satisfied that the
independence of the External Auditors has
not been impaired by any event or service
that gives rise to a conflict of interest. Due
consideration has been given to the nature of
the services provided by the Auditors and the
level of audit and non-audit fees received by
the Auditors from the John Keells Group. The
Committee also reviewed the arrangements
made by the Auditors to maintain their
independence and confirmation has
been received from the Auditors of their
compliance with the independence guidance
given in the Code of Ethics of the Institute of
Chartered Accountants of Sri Lanka.
The performance of the External Auditors
has been evaluated and discussed with the
senior management of the Company and the
Committee has recommended to the Board
that Ernst & Young be re-appointed as the
Lead/Consolidation Auditors of the Group
for the financial year ending 31 March 2018,
subject to approval by the shareholders at
the Annual General Meeting.
N Fonseka
Chairman of the Audit Committee
26 May 2017
Audit Committee Meeting Attendance
17
.05
.20
16
24
.05
.20
16
27
.07
.20
16
24
.10
.20
16
03
.11
.20
16
25
.01
.20
17
27
.03
.20
17
Eli
gib
le t
o
att
en
d
Att
en
de
d
A Cabraal X 7 6
I Coomaraswamy* 2 2
N Fonseka 7 7
P Perera 7 7
By Invitation
S Ratnayake X 7 6
R Peiris 7 7
* Resigned during the year 2016/17

34 John Keells Holdings PLC | Annual Report 2016/17
Human Resources and Compensation Committee Meeting Attendance
23.06.2016 31.03.2017 Eligible to attend Attended
F Amerasinghe¡ 1 1
A Cabraal 2 2
I Coomaraswamy* 1 1
N Fonseka 1 1
A Omar 2 2
H Wijayasuriya 1 1
By invitation
S Ratnayake 2 2
R Peiris 2 2
¡ Ceased to be a Director during the year 2016/17
* Resigned during the year 2016/17
Corporate Governance Commentary
Report of the Human Resources and
Compensation CommitteeThe Committee met twice during the year.
The Committee, together with the other Board
members, reviewed the outcomes of the
Group-wide “Great Place to Work” Employee
Survey (GPTW survey) which was conducted
in the third quarter of 2016/17. It was noted
that, at the Executive level, the survey has
shown a significant improvement in every
dimension when compared with the overall
GPTW survey results of 2014, and that such
improvement has brought the organisation
closer to the global benchmarks. Whilst this
augurs well for the company, issues which
require attention were noted for further action.
An important task that was carried out during
the year was the deliberation of plans for
succession at the senior management level.
These plans were announced in November
2016 and in the quarter ended 31 March
2017. It is to be noted that further plans
for succession to senior positions will be
announced in a phased manner over the next
two years.
A report from the Chairman of the Committee
continues to be a standing agenda item at the
quarterly Board meetings. The Chairman of
the Committee reports on the developments
which have taken place since the last Board
meeting, if any, and also updates the Board
on various matters, as requested and as
relevant.
The Committee wishes to report that the
Company has complied with the Companies
Act in relation to remuneration of Directors.
The annual appraisal scheme, the calculation
of short term incentives, and the award of
ESOPs were executed in accordance with
the approvals given by the Board on the
basis of discussions conducted between the
Committee and Management.
The performance of the Chairman-CEO was
evaluated and remuneration determined as
per the methodology set out by the Board. The
Chairman-CEO’s evaluation of the performance
of the Executive Directors, and the members
of the Group Executive Committee was
considered by the Committee and accepted.
The remuneration of the Executive Directors
and the other Members of the Group Executive
Committee was determined on the basis of
performance, market comparators, and in line
with Company C&B policy.
I wish to note that Mr. F Amerasinghe and
Dr. I Coomaraswamy served until June
2016 and July 2016 respectively. I thank
Mr. F Amerasinghe for the leadership and
guidance given to the Committee during his
tenure as Chairman.
I wish to thank my colleagues for their
valuable inputs in guiding the Committee
in its deliberations, and the President
responsible for Human Resources of the
Group for enabling fruitful interactions at the
meetings of the Committee.
A Cabraal
Chairman of the Human Resources and
Compensation Committee
26 May 2017
1.2.2 Human Resources and Compensation Committee
Composition The Chairperson must be a Non-Executive Director. Committee should
comprise exclusively of Non-Executive Directors, a majority of whom shall
be independent.
The Chairman-CEO and Group Finance Director are present at all
Committee meetings unless the Chairman-CEO or Executive Director
remuneration is under discussion respectively. The President, Human
Resources and Legal, is also present at all meetings.
Mandate Determine the quantum of compensation (including stock options) for
Chairman and Executive Directors, conduct performance evaluation of
Chairman-CEO, review performance evaluation of the other Executive
Directors and key Executives and establish a Group Remuneration Policy
Scope i. Determine and agree with the Board a framework for remuneration of
the Chairman and Executive Directors
ii. Consider targets, and benchmark principles, for any performance
related pay schemes
iii. Within terms of agreed framework, determine total remuneration
package of each Executive Director, keeping in view;
• Performance • Industry trends • Past remuneration
iv. Succession planning of Key Management Personnel
v. Determining compensation of Non-Executive Directors will not be under
the scope of this Committee
During the year 2016/17, the Great Place to Work (GPTW) survey was conducted across the entire
Group. Following its conclusion, the resultant report was placed before the Board. The management
also briefed the Committee of an action plan geared towards addressing the findings of the survey at
the meeting held on the 31 March 2017. Please see Section 3.4.1 for more information.

35Group Highlights | Governance | Management Discussion & Analysis | Financial Statements | Supplementary Information
Report of the Nominations CommitteeThe Nominations Committee, as of 31 March
2017, consisted of the following.
• A Omar
• P Perera
• S Ratnayake
• H Wijayasuriya
The mandate of the Committee remains;
• To identify suitable persons who could be
considered for appointment to the Board
of JKH PLC or other Listed Company in
the Group as Non-Executive Directors
• To recommend to the Board the process
of selecting the Chairman and Deputy
Chairman.
• Make recommendations on matters
referred to it by the Board.
During the period under review, the
Committee had one formal meeting, with all
members in attendance, and several other
informal discussions.
During the year, the Committee recommended
the following appointments to the various
JKH PLC subsidiaries.
Name of
subsidiary
Name of appointee
Keells Food
Products PLC
Shehara de Silva
Indrajit Samarajiva
Pravir Samarasinghe
Amal Sanderatne
Ceylon Cold
Stores PLC
Sharmini Ratwatte
Dr. Shanthi Wilson
John Keells
Hotels PLC
Anarkali Moonesinghe
John Keells
PLC
Anandhiy Gunawardhana
Aruni Rajakariar
Charitha Wijewardene
Tea
Smallholder
Factories PLC
Manjula de Silva
These recommendations were accepted by
the Board.
The Committee was also apprised, regularly,
by the Chairman - JKH PLC, of the succession
plans in respect of Susantha Ratnayake,
Ajit Gunewardene and Ronnie Peiris. As a
part of such succession plan, the Chairman
nominated Krishan Balendra and Gihan
Cooray to the Board of the Company, and
also as successors to Ajit Gunewardene and
Ronnie Peiris, respectively, who retire at the
end of December 2017. The Nominations
Committee, in discussion with the Board,
considered the Chairman’s recommendation
and agreed with the same.
The Committee, with the undersigned
abstaining, recommended to the Board
that Mr. Ashroff Omar be reappointed as a
Non-Executive Director for a further period
of 3 years commencing 1 March 2016.
The Board ratified its acceptance of such
recommendation at its meeting of 25 May
2016.
A Omar
Chairman of the Nominations Committee
26 May 2017
1.2.3 Nominations Committee
Composition The Chairperson must be a Non-Executive Director. The Chief Executive
Officer should be a member.
Mandate Define and establish the nomination process for Non-Executive Directors,
lead the process of Board appointments and make recommendations to
the Board on the appointment of Non-Executive Directors.
Scope i. Assess skills required on the Board given the needs of the businesses
ii. From time to time assess the extent to which the required skills are
represented on the Board
iii. Prepare a clear description of the role and capabilities required for a
particular appointment
iv. Identify and recommend suitable candidates for appointments to the
Board.
v. Ensure, on appointment to Board, Non-Executive Directors receive a
formal letter of appointment specifying clearly
• Expectation in terms of time commitment
• Involvement outside of the formal Board meetings
• Participation in Committees
The appointment of Chairperson and Executive Directors is a collective
decision of the Board
Nominations Committee Meeting Attendance
28.07.2016 Eligible to attend Attended
A Cabraal* 1 1
A Omar 1 1
P Perera 1 1
S Ratnayake 1 1
H Wijayasuriya* 0 0
* The Committee was re-constituted during the year 2016/17

36 John Keells Holdings PLC | Annual Report 2016/17
Report of the Related Party
Transaction Review CommitteeThe undersigned and the following Directors
served as members of the Committee during
the financial year:
F Amerasinghe (ceased to be a Board member
with effect from 24 June 2016)
A Cabraal
N Fonseka
S Ratnayake
In addition, the Group Finance Director Mr.
Ronnie Peiris, the Group Finance Director -
Designate Mr. Gihan Cooray and the Group
Financial Controller Mr. Mano Rajakariar
attended meetings by invitation, and the Head
of Group Business Process Review, served as
the Secretary to the Committee.
The objective of the Committee is to exercise
oversight on behalf of the Board, of John Keells
Holdings PLC and its listed Subsidiaries,
to ensure compliance with the Code on
Related Party Transactions, as issued by the
Securities and Exchange Commission of Sri
Lanka (“The Code”) and with the Listing Rules
of the Colombo Stock Exchange (CSE). The
Committee has also adopted best practices
as recommended by the Institute of Chartered
Accountants of Sri Lanka and the CSE.
The Committee in discharging its functions
primarily relied on processes that were
validated from time to time and periodic
reporting by the relevant entities and Key
Management Personnel (KMP) with a view to
ensuring that:
• there is compliance with the Code;
• shareholder interests are protected; and
• fairness and transparency are
maintained
The Committee reviewed and pre-approved
all proposed non recurrent RPTs of the
parent, John Keells Holdings PLC, and all its
listed subsidiaries, namely: John Keells PLC,
Tea Smallholder Factories PLC, Asian Hotels
and Properties PLC, Trans Asia Hotels PLC,
John Keells Hotels PLC, Ceylon Cold Stores
PLC, Keells Food Products PLC, and Union
Assurance PLC. Further, recurrent RPTs
were reviewed annually by the Committee.
Other significant transactions of non-
listed subsidiaries were presented to the
Committee for information.
In addition to the Directors, all Presidents,
Executive Vice Presidents, Chief Executive
Officers, Chief Financial Officers and Financial
Controllers of respective companies/sectors
were designated as KMPs in order to increase
transparency and enhance good governance.
Annual disclosures from all KMPs setting
out any RPTs they were associated with,
if any, were obtained and reviewed by the
Committee.
The Committee held four meetings during the
financial year. Information on the attendance
of these meetings by the members of the
Committee is given below.
The activities and views of the Committee
have been communicated to the Board of
Directors, quarterly through verbal briefings,
and by tabling the minutes of the Committee’s
meetings.
P Perera
Chairperson of the Related Party Transaction
Review Committee
28 April 2017
Corporate Governance Commentary
Related Party Transaction Review Committee Meeting Attendance
24
.05
.20
16
27
.07
.20
16
24
.10
.20
16
25
.01
.20
17
Eli
gib
le t
o
att
end
Att
end
ed
F Amerasinghe¡ X 1 0
A Cabraal 4 4
N Fonseka 4 4
P Perera 4 4
S Ratnayake X 4 3
By Invitation
R Peiris 4 4
¡ Ceased to be a Director during the year 2016/17
1.2.4 Related Party Transaction Review Committee
Composition The Chairperson must be a Non-Executive Director. Must include at least
one Executive Director.
The Chairman-CEO, Group Finance Director and Group Financial Controller
are permanent invitees for all Committee meetings.
Mandate To ensure on behalf of the Board that all related party transactions of JKH
and its listed subsidiaries are consistent with the Code of Best Practices on
related party transactions issued by the SEC.
Whilst the above requisitions the minimum required by the CSE, the Group
has broadened the mandate to include senior decision makers in the list
of Key Management Personnel, whose transactions with Group companies
are also reviewed by the Committee.
Scope i. Develop and recommend for adoption by the Board of Directors of JKH
and its listed subsidiaries, a Related Party Transaction Policy which is
consistent with the operating model and the delegated decision rights of
the Group.
ii. Update the Board on related party transactions of each of the listed
companies of the Group on a quarterly basis.
iii. Define and establish threshold values for each of the subject listed
companies in setting a benchmark for related party transactions,
related party transactions which have to be pre-approved by the Board,
related party transactions which require to be reviewed annually and
similar issues relating to listed companies.

37Group Highlights | Governance | Management Discussion & Analysis | Financial Statements | Supplementary Information
1.3 The Combined Role of the Chairman-
CEO
The Group’s Chairman continued to play
the role of the CEO during the financial year
2016/17. The Board deems that combining
the two roles is more appropriate, for the
Group at present, in meeting stakeholder
objectives.
As the head of the Group Executive
Committee, the Chairman-CEO provides
the overall direction and policy execution
framework for the Board’s decisions via this
structure.
Experience has proved that the healthy
balance of the JKH Board composition
coupled with the role of the Senior
Independent Director, and other supporting
Board dynamics, enable him to effectively
balance his role as the Chairman of the Board
and the CEO of the Company and Group.
Given the above, the Chairman-CEO does
not come up for re-election as is the case
with other Executive and Non-Executive
Directors. It should be noted that the Articles
of Association of the Company allow for
this. In order to bolster the Board’s, and
by extension, the Group’s adherence to
corporate governance best practices, the
Senior Independent Director acted as the
independent party to whom concerns could
be voiced on a confidential basis.
1.3.1 Chairman-CEO Appraisal
The Human Resources and Compensation
Committee, chaired by the Senior Independent
Director together with all other Independent
Directors, appraised the performance of the
Chairman-CEO on the basis of pre-agreed
goals for the Group, set in consultation with
the Board, covering the following broad
aspects:
• Creating and adding shareholder value
• Achievement of financial goals
• Execution of sustainability developments
and green agenda
• Success in identifying and implementing
projects
• Sustaining a first class image
• Developing human capital
• Promoting collaboration and team spirit
• Building sustainable external relations
• Leveraging Board members and other
stakeholders
• Ensuring good governance and integrity
in the Group
1.4 Group Executive Committee and
Other Management Committees
The Group Executive Committee and
the other Management Committees met
regularly as per a time table communicated
to the participants 6 months in advance.
In the absence of a compelling reason,
attendance at these Committee meetings is
mandatory for the Committee members. All
the Committees carried out their specific
tasks as expected.
Whilst the Chairman-CEO and Presidents
are ultimately accountable for the Company/
Group and the industry groups, businesses
and functions respectively, all decisions are
taken on a committee structure as described
below.
1.4.1 Group Executive Committee (GEC)
As at 26 May 2017, the 9 member GEC
consisted of the Chairman-CEO, the Deputy
Chairman, the Group Finance Director and
the Presidents of each business/function. The
GEC is the overlay structure that implements,
under the leadership and direction of the
Chairman-CEO, the strategies and policies
determined by the Board. The GEC manages
through delegation and empowerment,
the business and affairs of the Group,
makes portfolio decisions and prioritises
the allocation of capital and technical and
human resources. A key responsibility of the
members of the GEC is to act as enablers
of the Operating Model of the Group. The
members of the GEC are well equipped to
execute these tasks and bring in a wealth
of experience and diversity to the Group in
terms of their expertise and exposure (refer
the GEC Profiles section of this Annual Report
for more details).
1.4.2 Group Operating Committee (GOC)
As at 26 May 2017, the 22 member GOC
consisted of the Chairman-CEO, the Deputy
Chairman, the Group Finance Director, the
Presidents and Executive Vice Presidents. The
GOC provided a forum to share learnings, and
identify synergies, across industry groups,
sectors, business units and functions. The
GOC is instrumental in preserving a common
group identity across diverse business units
(refer the GOC Profiles section of this Annual
Report for more details).
1.4.3 Other Management Committees
These include the Group Management
Committee, Sector Committee and
Management Committee which are
responsible at the industry group level, sector
level and business unit level respectively.
The underlying intention of forming these
Committees is to encourage the respective
business units to take responsibility and
accountability at the grass-root level via
suitably structured Committees and teams in
a “Management by Objectives (MBO)” setting.
Illustrated below is the structure of the three
Committees.
1.5 Employee Empowerment
Given the importance the Group places on its
employees for the growth of the organisation,
policies, processes and systems are in place
to ensure effective recruitment, development
and retention of this vital stakeholder. The
bedrock of these policies is the Group’s
competency framework. To support these
policies, the Group continued with, and
further strengthened, the following practices.
• Top management and other senior staff
are mandated to involve, as appropriate,
all levels of staff in formulating goals,
strategies and plans
• Decision rights were defined for each level
of employment in order to instil a sense
of ownership, reduce bureaucracy and
speed-up the decision making process
• Strategy formulation
• Performance
monitoring
• Career management
and succession
planning
• Risk management
• Implementation of
Group Initiatives
Industry group
Sector
Business unit/ Function
Group Management Committee
Sector Committee
Management Committee
President
Executive Vice President
Vice President/ Assistant Vice President/Manager

38 John Keells Holdings PLC | Annual Report 2016/17
Corporate Governance Commentary
• A bottom-up approach was taken in
the preparation of annual and long-
term plans and the Group also ensured
employee involvement in strategy, and
thereby empowerment, in the process
• Organisational and Committee structures
are designed to enable, and facilitate,
high accessibility of all employees to
every level of management
• Open, honest and constructive
communication was encouraged at all
levels. The Group strongly believes that
constructive disagreement is essential
for optimal decision making
Moreover, the Group provides a safe,
secure and conducive environment for its
employees, allows freedom of association
and collective bargaining, prohibits child
labour, forced or compulsory labour and
any discrimination based on gender, race,
religion, gender identity or sexual orientation,
and promotes workplaces which are free
from physical, verbal or sexual harassment.
In furtherance of this, the Group continued
its CSR initiative, Project WAVE (Working
Against Violence through Education), aimed
at combating gender based violence and
child abuse through awareness creation.
Approximately 10,000 Group employees
have been sensitised under the project as at
31 March 2017. During the year, the Group
continued its project to sensitise employees
regarding gender identity and sexual
orientation towards building a truly inclusive
culture within the Group. Additionally, the
Group strives to incorporate these practices,
where relevant, in its sourcing initiatives
undertaken by the Group.
2. Integrated Governance Systems and
ProceduresListed below are the main governance
systems and procedures of the Group. These
systems and procedures strengthen the
elements of the JKH Internal Governance
Structure, and are benchmarked against
industry best practices.
i. Strategy formulation and decision
making process
ii. Human resource governance
iii. Integrated risk management
iv. IT governance
v. Stakeholder management and effective
communications
vi. Sustainability governance
2.1 Strategy Formulation and Decision
Making Processes
The Group’s investment appraisal
methodology and decision making
process ensures the involvement of all
key stakeholders that are relevant to the
evaluation of the decision.
In this manner:
• Several views, opinions and advice are
obtained prior to making an investment
decision
• A holistic view is taken on the
commercial viability and potential of any
project, including operational, financial,
funding, legal, risk, sustainability and tax
implications
• All investment decisions are
consensual in nature, made through the
aforementioned management committee
structure where no single individual has
unfettered decision making powers over
investment decisions
• The ultimate responsibility and
accountability of the investment decision
rests with the Chairman-CEO
The illustration below depicts the Group’s
strategy formulation process:
The following section further elaborates on
the Group’s project appraisal and execution
process.
2.1.1 Project Approval Process
Projects undertaken at the Group follow
a detailed feasibility report covering
key business considerations under
multiple scenarios, within a framework of
sustainability. The feasibility stage is not
restricted to a financial feasibility only, but
encompasses a wider scope of work covering
risk management, sustainable development
and HR considerations.
Subsequent to the project satisfying the
Group’s investment criteria, the final approval
to proceed will be granted by the Board.
When appropriate, the GEC is empowered
to approve such proposals in terms of the
delegated decision rights with the Board
being kept informed.
GE
C a
pp
rovalse
con
d h
alf o
f the year and obtaining
Re
fore
castin
g ta
rgets for theP
erfo
rman
ce evaluation of the
seco
nd half/
full year
Formulating business strategy,
objectives and risk managem
ent for
each BU for the fi nancial year
GEC
rev
iew
an
d a
pp
rova
l
Business performance evaluation of the fi rst six months
against target
g
evalu
seco R
GEC
re
ntfor
al year
e
Continuous performance monitoring at BU/
sector/industry group level

39Group Highlights | Governance | Management Discussion & Analysis | Financial Statements | Supplementary Information
2.2 Human Resource Governance
The Group human resource governance
framework is designed in a manner that
enables high accessibility by any employee
to every level of management. Constant
dialogue and facilitation are also maintained
ranging from work related issues to matters
pertaining to general interest that could affect
employees and their families. The Group
follows an open door policy for its employees
and this is promoted at all levels of the Group.
The Group performance management
dynamics and compensation policy is
explained in the ensuing sections.
2.2.1 Performance Management
The Performance Management System, as
illustrated below, is at the heart of many
supporting human resource management
processes such as learning and development,
career development, succession planning,
talent management, rewards/recognition
and compensation/benefits.
2.2.2 Succession Planning
Our Board has in place plans to ensure the
progressive renewal of the Board. As part
of the Group’s talent identification initiative,
the Group has continuously introduced
innovative and effective ways of focusing on
promising talent.
For succession planning at senior
management levels, a sub-committee of
the Board - the Human Resources and
Compensation Committee, is mandated
to review the performance evaluation of
Executive Directors and key Executives, apart
from establishing the Group remuneration
policy. The scope of this committee entails
succession planning of Key Management
Personnel.
Annually, the Executive Directors and the
Group Executive Committee are evaluated
based on measurable criteria, which have
been pre-agreed on an individual basis. The
evaluation involves the closer examination
of achieved results in a background of
controllable and/or non-controllable external
conditions which have impacted performance
either favourably or adversely. Further, the
senior management holds regular talent
discussions to further develop and identify
“talent”.
Learning and
Development
Career
Development
Compensation
and Benefits
Succession
Planning
Rewards and
Recognition
Talent
Management
Identification of:
• Long term development plans
• Competency based training needs
• Business focused training needs
Identification of:
• Promotions
• Intercompany transfers
• Inter department transfers
Identification of:
• Jobs at risk
• Suitable successors
• Readiness level of successors
• Development plans
• External recruitments
Identification of
• High performers
• High potential
Nomination for Awards:
• Chairman’s Award
• Employee of the Year
• Champion of the Year
Pay decisions based on:
• Performance rating
• Competency rating
Pay decisions based on:
• Performance rating
• Competency rating
Nomination for Awards:
• Chairman’s Award
• Employee of the Year
• Champion of the Year
Identification of:
• Long term development plans
• Competency based training needs
• Business focused training needs
Identification of:
• Promotions
• Intercompany transfers
• Inter department transfers
Identification of:
• Jobs at risk
• Suitable successors
• Readiness level of successors
• Development plans
• External recruitments
Identification of
• High performers
• High potential
Performance
Management
System
The aforementioned project appraisal framework flow is illustrated below:
Project origination
Feasibility
study
Due
diligence
Review by
the GEC
Board/GEC
approval
Risk management
Sustainability management

40 John Keells Holdings PLC | Annual Report 2016/17
Corporate Governance Commentary
2.2.3 Performance Based Compensation Philosophy
The JKH Group Compensation Policy is as follows:
2.2.3.1 Equity Sharing
Employee Share Option Plans are offered
at defined career levels based on pre-
determined criteria which are uniformly
applied across the eligible levels and
performance levels. These long term
incentives have been instrumental in
inculcating a deep sense of ownership in
the recipients. Share options are awarded to
individuals on the basis of their immediate
performance and potential importance of
their contribution to the Group’s future plans.
2.3 Integrated Risk Management
JKH’s Group-wide risk management
programme focuses on wider sustainability
development, to identify, evaluate and
manage significant Group risks and to stress-
test various risk scenarios. The programme
ensures that a multitude of risks, arising as
a result of the Group’s diverse operations,
are effectively managed in creating and
preserving stakeholder wealth.
The steps taken towards promoting the Group’s
integrated risk management process are:
• Integrating and aligning activities and
processes related to planning, policies/
procedures, culture, competency, internal
audit, financial management, monitoring
and reporting with risk management;
• Supporting executives/managers in
moving the organisation forward in
a cohesive, integrated and aligned
manner to improve performance, while
operating effectively, efficiently, ethically
and legally, within the established limits
for risk taking. The risk management
programmes have allowed greater
visibility and understanding of risk
appetite
Please refer the Risks, Opportunities and
Internal Controls section and Notes to the
Financial Statements of the Annual Report
for a detailed discussion on the Group’s
Integrated Risk Management process and the
key risks identified in achieving the Group’s
strategic business objectives.
2.4 Information Technology (IT)
Governance
IT governance stewardship roles are
governed through layered and nested
committees, cascading from the GEC to the
Group IT Management Committee to the
Group IT Operation Committee with well-
defined roles and responsibilities at a Group,
sector and business unit level.
The IT governance framework used within
the Group leverages best practices and
industry leading models such as CoBIT
(Control Objectives for Information and
Related Technology), ISO 35800, ISO27001,
ISO 9000:2008, COSO (Committee of
Sponsoring Organisations of the Treadway
Commission)/BCP (Business Continuity
Planning), ITIL (Information Technology
Infrastructure Library), in providing a best of
breed framework.
A comprehensive audit of the IT structure
covering the entire Group was performed
during the year to highlight both strengths,
and weaknesses. A priority-based action plan
has been formulated to address issues of
concern that stemmed from the audit.
2.5 Stakeholder Management and
Effective Communication
Following are the key stakeholder
management methodologies adopted by
the Group. Please refer the Materiality and
Stakeholder Relationship section of the
Annual Report for a detailed discussion.
“Pay for Performance”
Greater prominence is given to the incentive component of the total
target compensation
Compensation Policy
• Compensation comprises of fixed (base) payments, short term incentives and long term incentives
• Higher the authority levels within the Group, higher the incentive component as a percentage of total pay
• Greater the decision influencing capability of a role, higher the weight given to organisational performance as opposed to individual
performance
• Long term incentives are in the form of Employee Share Options at JKH
• Remuneration policy is built upon the premise of ensuring equal
pay for equal roles
• Manager and above level roles are banded using the Mercer
methodology for job evaluation, on the basis of the relative worth
of jobs
“More Than Just A Workplace”
Continuously focuses on creating a sound work environment
covering all aspects of employee satisfaction and engagement
• Fixed compensation is set at competitive levels using the median,
65th percentile and 75th percentile of the best comparator set of
companies (from Sri Lanka and the region, as relevant) as a guide
• Regular surveys are done to ensure that employees are not
under/over compensated
Performance Management
Internal Equity
Satisfaction
External Equity

41Group Highlights | Governance | Management Discussion & Analysis | Financial Statements | Supplementary Information
• Presence of an investor relations team
• Social media presence
• Prompt release of information to public/CSE
• Effective communication of AGM related matters
• Measures in place in case of serious loss of capital
• Providing of quality and safe products
• Constant engagement with customers
• Procedures to ensure long term
business relationships with suppliers
• Transactions in compliance with
all relevant laws and regulations,
transparently and ethically
• Zero tolerance policy in ensuring that
all business units meet their statutory
obligations in time and in full
• Provision of formal and
sometimes informal,
access to other key
stakeholders
• Accessibility to all levels
of the management
• Various means for
employee involvement
• Corporate
Communications
• JK Forum
• Young Forum
• Accessibility to all levels
of the management
• Various means for
employee involvement
• Corporate
Communications
• JK Forum
• Young Forum
• Provision of formal and
sometimes informal,
access to other key
stakeholders
• Presence of an investor relations team
• Social media presence
• Prompt release of information to public/CSE
• Effective communication of AGM related matters
• Measures in place in case of serious loss of capital
• Providing of quality and safe products
• Constant engagement with customers
• Procedures to ensure long term
business relationships with suppliers
• Transactions in compliance with
all relevant laws and regulations,
transparently and ethically
• Zero tolerance policy in ensuring that
all business units meet their statutory
obligations in time and in full
Shareholders/
Investors
Customers/
Suppliers
Government
Employees
Other Key
Stakeholders
Stakeholder
Management
2.5.1 Annual General Meeting
The Group adheres to the following
procedures and makes use of the AGM
constructively to enhance relationships with
shareholders.
• Notice of the AGM and related documents
are sent to the shareholders along with
the Annual Report, within the specified
time
• Summary of procedures governing
voting at general meetings are clearly
communicated
• All Executive and Non-Executive
Directors are present at the meeting to
answer queries
• The Chairman-CEO ensures that the
relevant senior managers are also
available at the AGM to answer specific
queries
• Separate resolutions are proposed for
each item
• Proxy votes, those for, against, and
withheld are counted
2.6 Sustainability Governance
The John Keells Group places importance
on sustainable development. The Group
believes that its financial performance and
brand image are closely aligned with sound
corporate governance practices, product and
service excellence, a productive workforce,
environmental stewardship and social
responsibility. Please refer the Materiality
and Stakeholder Relationships section of
the Report for a detailed discussion of the
Group’s strategy of entrenching sustainability
within its business operations, and the scope
and boundary of its sustainability content.
During the year under review, a new
procurement platform was implemented
to streamline the Group’s sourcing, and
supplier management initiatives. The current
Group Initiatives process, though robust, is
manually driven. Through this new platform
it will be transformed in its entirety to an
online, real-time platform, where the entire
sourcing process from supplier identification,
requesting for proposals, submission of
proposals, evaluation, contracting and
supplier management for products and
services sourced from the Group Initiatives
Division will be performed on the platform.
This will enable the Group to have clear
visibility of the sourcing process in real
time, shorten contracting life cycles and
have the ability to make better supplier
related decisions based on better and more
accurate analytics. The Group intends to
enable Business Units of the Group to use
this platform in the near future.
Furthermore, the Group has contracted a
global software developer and vendor, to
provide a solution to manage the Group’s
Enterprise Risk, Audit, and Incident
Management processes. The solution is
able to aid the Group’s Risk Management
functions, by providing the ability to maintain
live, dynamic risk registers which are linked
to business goals and responsible personnel
- along with the provision of timely alerts
on action plans, and escalation processes
for over-due risks. Key Management
Personnel at all levels (CEOs, Sector Heads,
and Presidents) will have visibility of the
structure under management in terms of
risk management, mitigation, and action
plans for better monitoring and control. It
will also enable visibility across sectors, and
the Group, on risk mitigation and knowledge
sharing best practices.
3. Assurance MechanismsThe Assurance Mechanisms comprise of
the various supervisory, monitoring, and
benchmarking elements of the Group
Corporate Governance System which are
used to measure “actuals” against “plan”
with a view to signalling the need for quick
corrective action, when necessary. These
mechanisms also act as “safety nets” and
internal checks in the Governance system,
which are discussed in detail in the ensuing
section.

42 John Keells Holdings PLC | Annual Report 2016/17
Corporate Governance Commentary
3.1 The Code of Conduct
JKH CODE OF CONDUCT
• Allegiance to the Company and the
Group
• Compliance with rules and regulations
applying in the territories that the Group
operates in
• Conduct all business in an ethical
manner at all times in keeping with
acceptable business practices
• Exercise of professionalism and integrity
in all businesses and “public” personal
transactions
The objectives of the Code of Conduct are
strongly affirmed by a strong set of corporate
values which are well institutionalised at all
levels within the Group through structured
communication. The degree of employee
conformance with corporate values and
their degree of adherence to the JKH Code of
Conduct are the key elements of reward and
recognition schemes.
The Group Values are found in the About
Us section of the Annual Report, and are
continuously and consistently referred to by
the Chairman-CEO, Presidents, Sector and
Business Unit Heads during employee and
other key stakeholder engagements, in order
to instill these values in the hearts and DNA
of all employees.
3.2 Senior Independent Director
Considering the combined role of the
Chairman-CEO, the presence of the Senior
Independent Director is important in
ensuring that no one person has unfettered
decision making powers, and that matters
discussed at the Board level are done so in an
environment which facilitates independent
thought by individual Directors.
The Senior Independent Director meets with
other Non-Executive Directors, without the
presence of the Chairman-CEO, at least twice
every year to evaluate the effectiveness of the
Chairman-CEO and has regular meetings with
the other Non-Executive Directors on matters
relating to the effectiveness of the Board as
appropriate. The Senior Independent Director
is also kept informed by the Ombudsperson
of any matters in respect of the JKH Code of
Conduct which has come to his attention.
Report of the Senior Independent DirectorIndependent Directors
F Amerasinghe - (ceased to be a Board member w.e.f. 24 June 2016)
A Cabraal
I Coomaraswamy - (resigned w.e.f. 3 July 2016)
T Das - (ceased to be a Board member w.e.f. 24 June 2016)
N Fonseka
A Omar
P Perera
H Wijayasuriya - (appointed w.e.f. 4 October 2016)
All Independent Directors serving at present have been Directors for less than nine years from
their date of first appointment. The undersigned was appointed by the Board as the Senior
Independent Director on 24 June 2016, succeeding Mr F Amerasinghe.
Apart from unstructured and informal contacts, the Independent Directors had two formal
meetings to discuss matters relevant to their responsibilities as Non-Executive Directors.
These meetings concluded with a wrap up session with the Chairman-CEO, who provided
responses to matters raised, or agreed to provide further information or clarification at Board
meetings. A matter that received the special attention of the Non-Executive Directors was
senior management succession. A plan was approved by the Board during the year and
implementation has commenced.
The meeting minutes of the Group Executive Committee (GEC) are circulated to the Non-
Executive Directors and this ensures that there is a high degree of transparency and
interaction between the Executive and Non-Executive members of the Board.
The Ombudsperson has reported to me that no issues have been brought to his attention that
indicate mismanagement, unfair treatment or justified discontent on the part of any employee
or ex-employee during the financial year.
The Independent Directors thank the Executive Directors, the GEC, Sector Heads and members
of the management team for their openness and co-operation on all matters where their input
was sought by the Non-Executive Directors.
N Fonseka
Senior Independent Director
26 May 2017
3.3 Board Sub-Committees
The Board Sub-Committees play an important supervisory and monitoring role by focusing on
the designated areas of responsibility passed to it by the Board. For more information on the
Board Sub-Committees, refer Section 1.2 of this Commentary.
3.4 Employee Participation in Assurance
The Group is continuously working towards introducing innovative and effective ways of
employee communication and employee awareness. The importance of communication - top-
down, bottom-up, and lateral, in gaining employee commitment to organisational goals has
been conveyed extensively through various communications issued by the Chairman-CEO
and the management. Whilst employees have many opportunities to interact with the senior
management, the Group has created formal channels for such communication through feedback
as listed below.

43
• Skip Level meetings
• Exit interviews
• Young Forum meetings
• 360 degree evaluation
• Employee surveys
• Monthly staff meetings
• Ombudsperson
• Confidential access to Chairman on
“Chairman Direct”
• Access to Senior Independent Director
• Continuously reiterating the “Open-Door”
policy
Additionally, the Group continued with its
whistle-blower policy and securities trading
policy. The Group has witnessed an increased
level of communication flow from employees.
Such communication and feedback received
from the employees by the management
are recorded, irrespective of the level of
anonymity, and subsequently discussed and
followed up. The respective outcomes are
duly recorded.
3.4.1 Great Place to Work
During the year, the Group conducted the
“Great Place To Work” (GPTW) survey among
all its employees. GPTW is conducted by the
Great Place To Work Institute and seeks to
provide a comprehensive insight into how
employees perceive the culture, structure,
and management of an organisation, among
others. The feedback received from this
exercise will be used towards crafting a better
and more cohesive workplace, which will
in turn drive productivity across the Group.
The Group’s management considers the
objective of an engaging, inspiring workplace
which enables, and empowers people, to be a
strategic priority, in keeping with JKH’s goal
to be “More Than Just A Workplace”.
3.5 Internal Controls
The Board has taken necessary steps to
ensure the integrity of the Group’s accounting
and financial reporting systems, and that
internal control systems remain robust and
effective via the review and monitoring of
such systems on a periodic basis.
3.5.1 Internal Compliance
A quarterly self-certification programme
requires the Presidents, Sector Heads and
Chief Financial Officers of industry groups, to
confirm compliance with statutory and other
regulatory procedures, and also identify any
significant deviations from the expected
norms.
3.5.2 System of Internal Control
The Board has, through the involvement of
the Group Business Process Review function,
taken steps to obtain assurance that systems
designed to safeguard the Company’s
assets, maintain proper accounting records
and provide management information, are
in place, are robust, and are functioning
according to expectations.
The risk review programme covering
the internal audit of the whole Group is
outsourced. Reports arising out of such audits
are, in the first instance, considered and
discussed at the business and functional unit
levels, and after review by the Sector Head
and the President of the industry group, are
forwarded to the relevant Audit Committee
on a regular basis. Further, the Audit
Committees also assess the effectiveness
of the risk review process and systems of
internal control on a regular basis.
3.5.3 Segregation of Duties (SoD) under
Sarbanes-Oxley (SOX) Guidelines
As discussed in the Corporate Governance
Commentary section of the JKH Annual
Report 2015/16, the Group reviewed the
Segregation of Duties (SoD) under Sarbanes-
Oxley (SOX) guidelines, and developed a
revised SoD matrix. During the financial year
ended 31 March 2017, the Group took steps
to review and streamline the roles of each
user on its Enterprise Resource Planning
(ERP) system. Furthermore, in line with JKH’s
digitisation initiatives, an authentication
application was developed to enable a more
efficient and transparent process in assigning
roles to users of the ERP system.
3.5.4 Internal Audit
The Group internal audit process is conducted
by outsourced parties at regular intervals,
and coordinated by the Group Business
Process Review function (GBPR) of the Group.
GBPR ensures that the internal audit plan
adequately covers the significant risks of the
Group, reviews the important internal audit
findings and follow-up procedures.
Towards this end, an Internal Audit Process
Facilitation tool is being adopted across the
Group. It is envisaged that this solution, in
addition to enabling a digitally driven internal
audit function, will help increase internal
efficiencies, transparency, accountability, and
build synergy between participating entities,
in order to optimise delivery of impactful
process outcomes.
The Group is currently engaged with its
External Auditors to jointly understand the
extent of realigning the scope of the Auditor’s
report in keeping with reporting best practices
associated with the disclosure of Key Audit
Matters (KAM) to the shareholders. The
proposed revisions to the Auditor’s Report
are expected to enhance the communicative
value and relevance of the report via
reinforced transparency, and will come into
effect together with other applicable financial
reporting requirements, on or after 31 March
2018.
3.6 The Ombudsperson
An Ombudsperson is available to report
any complaints from employees of alleged
violations of the published Code of Conduct if
the complainant feels that the alleged violation
has not been addressed satisfactorily by the
internally available mechanisms.
The findings and the recommendations
of the Ombudsperson, subsequent to
an independent inquiry, is confidentially
communicated to the Chairman-CEO or to
the Senior Independent Director upon which
the involvement duty of the Ombudsperson
ceases.
On matters referred to him by the
Ombudsperson, the Chairman-CEO or the
Senior Independent Director, as the case may
be, will place before the Board:
i. the decision and the recommendations
ii. action taken based on the
recommendations
iii. in the event the Chairman-CEO or the
Senior Independent Director disagrees
with any or all of the findings and or the
recommendations thereon, the areas of
disagreement, and the reasons therefore
In situation (iii), the Board is required to
consider the areas of disagreement and
decide on the way forward. The Chairman-
CEO or the Senior Independent Director is
expected to take such steps as are necessary
to ensure that the complainant is not
victimised, in any manner, for having invoked
this process.
Group Highlights | Governance | Management Discussion & Analysis | Financial Statements | Supplementary Information

44 John Keells Holdings PLC | Annual Report 2016/17
Corporate Governance Commentary
Report of the OmbudspersonMandate and Role
For purposes of easy reference, I set out
below, the Ombudsperson’s mandate and
role:
(a) legal and ethical violations of the Code
of Conduct for employees, but in an
appellate capacity, when a satisfactory
outcome using existing procedures and
processes has not resulted or when the
matter has been inadequately dealt with;
(b) violations referred to above by individuals
at the Executive Vice President, President
and Executive Director levels, including
that of the Chairman/CEO, in which case
the complainant has the option of either
complaining to the Ombudsperson in
the first instance, or first exhausting the
internal remedies;
(c) sexual harassment, in which event the
complainant has the option of either
complaining to the Ombudsperson in
the first instance, or first exhausting the
internal remedies
The mandate excludes disciplinary issues
from the Ombudsperson’s responsibilities.
The right to take disciplinary action is vested
exclusively in the Chairman/CEO and those to
whom this authority has been delegated.
No issues were raised by any member of the
companies covered during the year under
review.
Ombudsperson
26 May 2017
3.7 External Audit
Ernst & Young are the External Auditors of
the Company as well as many of the Group
companies. The individual Group companies
also employed KPMG Ford, Rhodes, Thornton
& Co, PriceWaterhouseCoopers, and Luthra
and Luthra, India as External Auditors.
The appointment/re-appointment of these
auditors was recommended by the individual
Audit Committees to their respective
Boards of Directors. The audit fees paid by
the Company and Group to its auditors are
separately classified in the Notes to the
Financial Statements of the Annual Report.
4. Regulatory and Accounting
Benchmarks The Board, through the Group Legal division,
the Group Finance division and its other
operating structures, strived to ensure that
the Company and all of its subsidiaries and
associates complied with the laws and
regulations of the countries they operated in.
The Board of Directors also took all
reasonable steps to ensure that all financial
statements were prepared in accordance
with the Sri Lanka Accounting Standards
(SLFRS/LKAS) issued by the Institute of
Chartered Accountants of Sri Lanka (CA Sri
Lanka) and the requirements of the CSE and
other applicable authorities. Information
contained in the financial statements of the
Annual Report is supplemented by a detailed
Management Discussion and Analysis which
explains to shareholders, the strategic,
operational, investment, sustainability and
risk related aspects of the Company, and the
means by which value is created and how
it was translated into the reported financial
performance and its likely influence on future
results.
JKH and its subsidiaries are fully compliant
with all the mandatory rules and regulations
stipulated by the:
• Corporate Governance Listing Rules
published by the CSE; and
• Companies Act No. 7 of 2007
Please refer section 6 of this Commentary
for the compliance summary. The Group
has also given due consideration to the Best
Practice on Corporate Governance Reporting
guidelines jointly set out by CA Sri Lanka and
the SEC, and have in all instances, barring
a few, embraced such practices voluntarily,
particularly if such practices have been
identified as relevant and value adding. In the
very few instances where the Group has not
adopted such best practice, the rationale for
such non adoption is articulated.
5. Outlook and Emerging ChallengesIn an ever changing and dynamic world of
corporate governance, JKH is acutely aware
of the need to remain vigilant and geared to
meet the emerging governance needs of the
Group, its stakeholders and the environment
in which the Group operates. As is evident
from the aforesaid Commentary, the Group
has continued to endeavour, in the year under
review, to stay abreast of best practices in the
area of corporate governance.
Summarised below are the more significant
challenges, amongst many others, being
addressed by JKH.
5.1 Gender Diversity on the Board
JKH believes a wide range of people and
experiences is beneficial to achieving a
high performance culture, which enables
innovation and thereby helps us deliver
excellence. Given that women comprise a
significant proportion of the customer and
employee populations, the Group recognises
the value of capitalising on our inclusive
culture to attract, develop, and retain a talent
mix to fuel our competitive advantage.
We acknowledge the challenges of increasing
diversity within our industry, and the
Group will make greater efforts to attract
appropriately qualified women to add to the
diversity of the Board.
5.2 Board Effectiveness and
Refreshment
There is increasing pressure for Boards to
improve effectiveness, maintain the right
combination of skills and experience, and
enhance transparency and accountability.
Our Board strives to take a balance of the
two viewpoints of tenured Directors and the
fresh perspectives of new members. With the
change in Board composition, the average age
of the Board is 57 years as of 31 March 2017,
in comparison to an average age of 63 years
as at 31 March 2016. JKH continues to take
steps to seek Directors with great diversity of
knowledge and experience in order to match
boardroom talent with evolving business
strategies.
5.3 Activist Investors
As stated during the last financial year,
investors around the globe are increasingly
active and are asking questions on issues
that matter most to them - enterprise risk,
strategy and execution. This has primarily
led to Directors being held increasingly
accountable and responsible for the
company’s performance, and the Group
expects this trend to continue. As a result,
effective communication is emerging and
designated Directors are fully prepared to
engage directly with investors on appropriate
matters. The Board will continue to focus on
improving shareholder communication with
a greater level of engagement.

45
5.4 Cyber Security
Along with the organisation becoming more
data driven, there is a significant increase
in the organisation’s reliance on technology.
In such a backdrop, securing and protecting
JKH’s most valuable assets becomes a
priority. The Board accepts that the risk of
a security breach needs to be continually
managed, and that one needs to be well
aware of where the vulnerabilities lie. During
the year under review, necessary steps have
been taken to help curtail the exposure to
cyber-attacks by reducing the threat surface
and any potentially exploitable vulnerabilities.
5.5 Talent Risk Management
As new and complex opportunities and risks
emerge with evolving strategies and growth
markets, having the right people to execute on
strategies is imperative for success. Boards
recognise the crucial role they play in human
capital matters since talent and culture are
arguably the biggest drivers of competitive
advantage. Boards will play an important
role in ensuring that the leadership stays
focused on building the right talent strategy.
The Board will focus on how to prepare for
generational transitions in their organisations
and anticipate the changing dynamics at the
boardroom and management levels.
Group Highlights | Governance | Management Discussion & Analysis | Financial Statements | Supplementary Information
6. Compliance Summary
6.1 Statement of Compliance under Section 7.6 of the Rules of the Colombo Stock Exchange (CSE) on Corporate Governance
CSE Rule 7.6 Compliance
status
Reference in the JKH Annual Report 2016/17
(i) Names of persons who were Directors of the Entity
during the financial year
Complied Board of Directors
(ii) Principal activities of the Entity and its subsidiaries
during the year, and any changes therein
Complied Management Discussion and Analysis
(iii) The names and the number of shares held by the 20
largest holders of voting and non-voting shares and the
percentage of such shares held
Complied Share and Warrant Information
(iv) The public holding percentage Complied Share and Warrant Information
(v) A statement of each Director’s holding and Chief
Executive Officer’s holding in shares of the Entity at the
beginning and end of each financial year
Complied Share and Warrant Information
(vi) Information pertaining to material foreseeable risk
factors of the EntityComplied
Risk, Opportunities and Internal Controls
(vii) Details of material issues pertaining to employees and
industrial relations of the Entity
During the year 2016/17, there were no material issues pertaining to
employees and industrial relations of the Company
(viii) Extents, locations, valuations and the number of
buildings of the Entity’s land holdings and investment
properties
Complied Group Real Estate Portfolio
(ix) Number of shares representing the Entity’s stated capital Complied Share and Warrant Information
(x) A distribution schedule of the number of holders in each
class of equity securities, and the percentage of their
total holdings
Complied Share and Warrant Information
(xi) Financial ratios and market price information Complied Share and Warrant Information
(xii) Significant changes in the Company’s or its subsidiaries’
fixed assets, and the market value of land, if the value
differs substantially from the book value as at the end of
the year
Complied Notes to the Financial Statements
(xiii) Details of funds raised through a public issue, rights
issue and a private placement during the year
Complied Share and Warrant Information
(xiv) Information in respect of Employee Share Ownership or
Stock Option Schemes
Complied Share and Warrant Information
(xv) Disclosures pertaining to corporate governance
practices in terms of Rules 7.10.3, 7.10.5 c. and 7.10.6 c.
of Section 7 of the Listing Rules
Complied Corporate Governance Commentary
(xvi) Related party transactions exceeding 10 per cent of the
equity or 5 per cent of the total assets of the Entity as
per audited financial statements, whichever is lower
Complied Corporate Governance Commentary

46 John Keells Holdings PLC | Annual Report 2016/17
Corporate Governance Commentary
6.2 Statement of Compliance under Section 7.10 of the Rules of the Colombo Stock Exchange (CSE) on Corporate Governance
(Mandatory provisions - fully complied)
CSE Rule Compliance
status
JKH action
7.10 Compliance
a./ b./ c. Compliance with corporate governance rules Complied JKH is in full compliance with the corporate governance
rules. Any deviations are explained where applicable
7.10.1 Non-Executive Directors (NED)
a./ b./ c. At least two members or one third of the Board,
whichever is higher should be NEDs
Complied 5 out of 10 Board members are NEDs
Corporate Governance Commentary - Section 1.1.2
7.10.2 Independent Directors
a. Two or one third of NEDs, whichever is higher shall be
“independent”
Complied All NEDs are independent as of 31 March 2017
b. Each NED to submit a signed and dated declaration of
his/her independence or non-independence
Complied The independence of the Directors has been determined
with reference to the CSE Listing Rules. The 5 Independent
NEDs have submitted signed confirmations of their
independence
7.10.3 Disclosures Relating to Directors
a./ b. Board shall annually determine the independence or
otherwise of NEDs
Complied Each NED discloses a formal declaration to the Board of
all their interests on an annual basis
Corporate Governance Commentary - Section 1.1.7
c. A brief resume of each Director should be included in the
Annual Report including the Directors’ experience
Complied JKH Annual Report 2016/17 - Board of Directors
d. Provide a resume of new Directors appointed to the
Board along with details
Complied The new appointments of Mr. K Balendra, Mr. G Cooray and
Dr. H Wijayasuriya were announced to the CSE along with
the profiles of the Directors
7.10.4 Criteria for Defining Independence
a. to h. Requirements for meeting the criteria to be an
Independent Director
Complied Corporate Governance Commentary - Section 1.1.7
7.10.5 Remuneration Committee
a. Remuneration Committee shall comprise of NEDs, a
majority of whom will be independent
Complied The Human Resources and Compensation Committee
(equivalent of the Remuneration Committee with a wider
scope) only comprises of Independent NEDs
Corporate Governance Commentary - Section 1.2.2
One NED shall be appointed as Chairman of the
Committee by the Board of Directors
Complied The Senior Independent NED is the Chairman of the
Committee
b. Remuneration Committee shall recommend the
remuneration of the CEO and the Executive Directors
Complied The remuneration of the Chairman-CEO and the Executive
Directors is determined as per the remuneration
principles of the Group, and as recommended by the
Human Resources and Compensation Committee
c. The Annual Report should disclose:
(i) The names of Remuneration Committee members
Complied Corporate Governance Commentary - Section 1.2.2
(ii) A Statement of Remuneration policy Complied Corporate Governance Commentary - Section 1.2.2
(iii) The aggregate remuneration paid to Executive and
Non-Executive Directors
Complied Total aggregate of remuneration paid to the Executive
Directors for the year was Rs.154 million of which Rs.41
million was variable based on performance
Total aggregate of remuneration for Non-Executive
Directors for the year was Rs.17 million

47Group Highlights | Governance | Management Discussion & Analysis | Financial Statements | Supplementary Information
CSE Rule Compliance
status
JKH action
7.10.6 Audit Committee
a. Audit Committee (AC) shall comprise of NEDs, a majority
of whom should be independent
Complied The Audit Committee comprises only of Independent NEDs
Corporate Governance Commentary - Section 1.2.1
A NED shall be appointed as Chairman of the committee Complied The Chairman of the Audit Committee is an Independent
NED
CEO and CFO shall attend Audit Committee meetings Complied The Chairman-CEO, Group Finance Director, and the Group
Financial Controller are permanent invitees to all Audit
Committee meetings
Corporate Governance Commentary - Section 1.2.1
The Chairman or one member of the Audit Committee
should be a member of a professional accounting body
Complied One member of the Audit Committee holds membership in
a professional accounting body
b. The functions of the Audit Committee as set in the CSE
Listing Rules 7.10.6
Complied Corporate Governance Commentary - Section 1.2.1
Overseeing the preparation, presentation and adequacy
of disclosures in the financial statements in accordance
with SLFRS/LKAS
Complied The Audit Committee assists the Board in fulfilling its
oversight responsibilities in ensuring the integrity of the
financial statements of the Company and the Group
Overseeing compliance with financial reporting
requirements, and information requirements as per laws
and regulations
Complied The Audit Committee has the overall responsibility for
overseeing the preparation of financial statements in
accordance with the laws and regulations of the country,
and also recommending to the Board, the adoption of
suitable accounting policies
Ensuring that internal and risk management controls are
adequate, to meet the requirements of the SLFRS/LKAS
Complied The Audit Committee assesses the role and the
effectiveness of the Group Business Process Review
division, which is largely responsible for the internal
control and risk management process
Assessment of the independence and performance of
the Entity’s External Auditors
Complied The Audit Committee assesses the External Auditor’s
performance, qualifications and independence
Make recommendations to the Board pertaining to
External Auditors
Complied The Committee is responsible for the appointment, re-
appointment, and removal of External Auditors, and also
the approval of remuneration and terms of engagement
c. Names of Audit Committee members shall be disclosed Complied Corporate Governance Commentary - Section 1.2.1
Audit Committee shall make a determination of the
independence of the External Auditors
Complied Corporate Governance Commentary - Section 1.2.1
Report on the manner in which Audit Committee carried
out its functions
Complied Corporate Governance Commentary - Section 1.2.1

48 John Keells Holdings PLC | Annual Report 2016/17
6.3 Companies Act No. 7 of 2007
Rule 168 Compliance
status
Reference - JKH Annual Report 2016/17
(1) (a) The nature of the business of the Group and the
Company together with any change thereof during the
accounting period
Complied Group Directory
(1) (b) Signed financial statements of the Group and the
Company for the accounting period completed
Complied Financial Statements
(1) (c) Auditors’ Report on financial statements of the Group
and the Company
Complied Independent Auditors’ Report
(1) (d) Accounting policies and any changes therein Complied Notes to the Financial Statements
(1) (e) Particulars of the entries made in the Interests Register
during the accounting period
Complied Annual Report of the Board of Directors
(1) (f) Remuneration and other benefits paid to Directors of the
Company during the accounting period
Complied Notes to the Financial Statements
(1) (g) Corporate donations made by the Company during the
accounting period
Complied Notes to the Financial Statements
(1) (h) Information on the Directorate of the Company and its
subsidiaries during and at the end of the accounting
period
Complied Group Directory
(1) (i) Amounts paid/payable to the External Auditor as audit
fees and fees for other services rendered during the
accounting period
Complied Notes to the Financial Statements
(1) (j) Auditors’ relationship or any interest with the Company
and its subsidiaries
Complied Financial Statements
(1) (k) Acknowledgement of the contents of this Report and
signatures on behalf of the Board
Complied The Statement of Director's Responsibility
6.4 Code of Best practice of Corporate Governance Issued Jointly by the Securities and Exchange Commission of Sri Lanka (SEC)
and the Institute of Chartered Accountants of Sri Lanka (CA - Sri Lanka)
Voluntary provisions - fully complied
A. Directors
Rule Reference
A.1 The Board
A.1.1 Need for the Board to meet regularly Corporate Governance Commentary - Section 1.1.4
A.1.2 The Board should be responsible for matters
including implementation of business strategy,
skills and succession of the management
team, integrity of information, internal controls
and risk management, compliance with laws
and ethical standards, stakeholder interests,
adopting appropriate accounting policies,
fostering compliance with financial regulations
and fulfilling other Board functions
The Board provides direction and guidance to the Group in the formulation of
sustainable high-level medium and long term strategies which are aimed at
promoting growth and sustainability over the long term
Corporate Governance Commentary - Section 1.1.1
A.1.3 Act in accordance with the laws of the
country and obtain independent professional
advice where necessary, at the Company’s
expense
The Group is in full compliance with Corporate Governance rules, and other forms
of applicable legislation in the country it conducts its business. In order to preserve
the independence of the Board and to strengthen decision making, the Board seeks
independent professional advice. This is coordinated through the Board Secretary as
and when required
Corporate Governance Commentary - Section 1.1.6
Corporate Governance Commentary

49Group Highlights | Governance | Management Discussion & Analysis | Financial Statements | Supplementary Information
Rule Reference
A.1.4 All Directors should have access to the
advice and services of the Company
Secretary
The Group ensures that all Directors have access to the advice and services of the
Company Secretary at all times. The President HR, Legal and Secretarial is the
Secretary to the Board. In addition to maintaining Board minutes and Board records, the
Board Secretary has provided support in ensuring that the Board receives timely and
accurate information, advice relating to corporate governance matters and that Board
procedures and applicable rules and regulations are complied with during the year
A.1.5 All Directors should bring independent
judgment
All Directors possess the necessary mix of skills, expertise and knowledge
complemented with a high sense of integrity and independent judgment on issues of
strategy, performance, resources and standard of business conduct. Non-Executive
Directors are responsible for providing independent judgment for the proposals made
by the Chairman and Executive Directors
Corporate Governance Commentary - Section 1.1.3
JKH Annual Report 2016/17 - Board of Directors
A.1.6 Every Director should dedicate adequate
time and effort to matters of the Board and
Company
Directors dedicated sufficient time before Board meetings to review Board papers
and request additional material and information for further clarification as deemed
necessary. This is supplemented by time allocation for discussions of issues of
strategic importance
It is estimated that Non-Executive Directors each devoted a minimum of 30 full time
equivalent days to the Group during the year
50%
Strategy and performance
Assurance and risk management
Other board matters
15%
35%
A.1.7 Board induction and training When Directors are newly appointed to the Board, they undergo a comprehensive
induction where they are apprised, inter-alia, of the Group values and culture, its
operating model, policies, governance framework and processes, the Code of Conduct
and the operational strategies of the Group
The Directors are encouraged to adopt a mind-set of continuous learning in order to
keep abreast of the Group, its dynamic business units, and even their own areas of
expertise
The Board of Directors recognises the need for continuous training and expansion of
knowledge and undertakes such professional development as required in assisting
them to carry out their duties as Directors
A.2 Chairman and Chief Executive Officer (CEO)
A.2.1 Justification for combining the roles of the
Chairman and the CEO
The appropriateness of combining the two roles has been established after rigorous
evaluation and debate internally and externally. The appropriateness continues to be
discussed periodically, and at minimum, at least once per year. These discussions are
supported by international best practices accessed through consultancy services and
experts
Corporate Governance Commentary - Section 1.3
A.3 Chairman’s Role
A.3.1 The Chairman should ensure Board
proceedings are conducted in a proper
manner
The Chairman, together with the Board Secretary continues to ensure that Board
proceedings are conducted in a proper manner
A.4 Financial Acumen
A.4 The Board should ensure the availability
within it of those with sufficient financial
acumen and knowledge to offer guidance on
matters of finance
The present Board possesses the financial acumen, and knowledge to offer guidance
on matters pertaining to finance
Corporate Governance Commentary - Section 1.1.3
JKH Annual Report 2016/17 - Board of Directors

50 John Keells Holdings PLC | Annual Report 2016/17
Rule Reference
A.5 Board Balance
A.5.1 In the event the Chairman and CEO is the
same person, NEDs should comprise a
majority of the Board
As at 26 May 2017, the Board comprised of 10 Directors, with 5 of them being Non-
Executive and Independent. The current Board composition will change by December
2017, following the retirement of the Deputy Chairman and the Group Finance Director
Corporate Governance Commentary - Section 1.1.2
A.5.2 Where the constitution of the Board of
Directors includes only two NEDs, both such
NEDs should be “independent”
N/A
A.5.3 Definition of Independent Directors All Independent Directors of the Group conform to a set of pre-defined criteria, which
JKH recognises as global best practice
Corporate Governance Commentary - Section 1.1.7
A.5.4 Declaration of Independent Directors All Directors make a formal declaration of all their interests on an annual basis
A.5.5 Board determinations on independence or
non-independence of NEDs
In order to avoid potential conflicts or biases, the Directors make a general disclosure
of interests, at the time of appointment, at the beginning of every financial year and
during the year as required. Any potential conflicts are reviewed by the Board from
time to time to ensure the integrity of the Board’s independence
Corporate Governance Commentary - Section 1.1.7
A.5.6 If an Alternate Director is appointed by a
NED such Alternate Director should not be
an Executive of the company
N/A
A.5.7 In the event the Chairman and CEO is the
same person, the Board should appoint one
of the Independent NEDs to be the Senior
Independent Director (SID)
Given the combined role of the Chairman-CEO, the Senior Independent Director, as
part of his role, ensures adherence to the principles of corporate governance, and acts
as the independent party to whom concerns could be voiced on a confidential basis
Corporate Governance Commentary - Section 3.2
A.5.8 The SID should make himself available for
confidential discussions with other Directors
who may have concerns
The Senior Independent Director continues to make himself available to meet with
other Non-Executive Directors, without the presence of the Chairman-CEO (when
required), and evaluates the effectiveness of the Chairman-CEO
Corporate Governance Commentary - Section 3.2
A.5.9 The Chairman should hold meetings with the
NEDs only, without the presence of EDs
The Chairman-CEO conducts direct discussions with the Non-Executive Directors
at meetings with the Non-Executive Directors, convened by the Senior Independent
Director. Issues arising from these discussions are taken up for consultation with the
relevant parties
A.5.10 Where Directors have concerns about the
matters of the Company which cannot be
unanimously resolved, they should ensure
their concerns are recorded in the Board
minutes
The Secretary to the Board is responsible for maintaining Board minutes and Board
records. All concerns raised and unresolved are recorded and have been documented
in sufficient detail
A.6 Supply of Information
A.6.1 Management should provide the Board with
appropriate and timely information
Members of the corporate and senior management team continue to have
independent contact with the Directors and where necessary, make presentations to
the Directors on important issues relating to strategy, risk management, investment
proposals, re-structuring and system procedures
A.6.2 Timely submission of the minutes, agenda
and papers required for the Board Meetings
The Board is provided with the necessary information well in advance (at least 2 weeks
prior to the meeting), by way of Board papers and proposals for all Board meetings, in
order to ensure robust discussions, informed deliberation and effective decision making
A.7 Appointments to the Board
A.7.1 Nomination Committee to make
recommendations on new Board
appointments
Board appointments follow a structured and formal process within the purview of the
Nominations Committee, which identifies and recommends suitable candidates for
appointment to the Board
Corporate Governance Commentary

51Group Highlights | Governance | Management Discussion & Analysis | Financial Statements | Supplementary Information
Rule Reference
A.7.2 Assessment of the capability of the Board to
meet strategic demands of the company
The Board works closely with the Nominations Committee to assess the skills
required on the Board, given the needs of the businesses. In the event a “skills gap”
is identified, a formal document stating a clear description of the role and required
capabilities is prepared. Following this, the Committee identifies and recommends
suitable candidates
The skills inventory of the company is also discussed by the Board during the Annual
JKH Board Evaluation
A.7.3 Disclosure of new Board member profiles
and interests
All new Board members are required to submit their profiles and interests.
Details of new Directors are disclosed to the shareholders at the time of their
appointment by way of public announcement as well as in the Annual Report.
The Directors are required to report any substantial changes in their professional
responsibilities and business associations to the Nominations Committee, which will
examine the facts and circumstances and make recommendations to the Board
JKH Annual Report 2016/17 - Board of Directors
Corporate Governance Commentary - Section 1.1.7
A.8 Re-Election
A.8.1 Non-Executive Directors should be appointed
subject to re-election and to the provisions
in the Companies Act relating to the removal
of a Director
All Non-Executive Directors are appointed for a period of three years, and are eligible
for re-election by shareholders at the first AGM following their appointment
Non-Executive Directors can serve up to a maximum of three successive terms
unless an extended Board tenure is necessitated by the exigencies of the Group
A.8.2 All Directors including the Chairman, should
be subject to election by shareholders at the
first opportunity after their appointment
The Executive Directors, including the Chairman-CEO, are re-elected by shareholders
at the first opportunity after their appointment
A.9 Appraisal of Board Performance
A.9.1 The Board should annually appraise itself on
its performance in the discharge of its key
responsibilities
The Board conducted its annual Board performance appraisal for the financial year
2016/17, to ensure that it is carrying out its responsibilities effectively and on a timely
basis
Corporate Governance Commentary - Section 1.1.5
A.9.2 The Board should also undertake an annual
self-evaluation of its own performance and
that of its Committees
The Board’s annual performance appraisal covers both the Board’s own performance
and that of the Board Sub-Committees
Corporate Governance Commentary - Section 1.1.5
A.9.3 The Board should state how such
performance evaluations have been
conducted
Each member self-appraises, on an anonymous basis, the performance of the Board.
The scoring and open comments are collated by the Senior Independent Director, and
the results are analysed to give the Board an indication of its effectiveness as well as
areas that required addressing and/or strengthening
Despite the original anonymity of the remarks, the open and frank discussions that
follow include some Directors identifying themselves as the person making the
remark reflecting the openness of the Board
A.10 Disclosure of Information in Respect of Directors
A.10.1 Profiles of the Board of Directors and Board
meeting attendance
JKH Annual Report 2016/17 - Board of Directors
Corporate Governance Commentary - Section 1.1.4
A.11 Appraisal of the Chief Executive Officer
A.11.1/
A.11.2
Appraisal of the CEO against the set strategic
targets
The Human Resources and Compensation Committee, chaired by the Senior
Independent Director, appraised the performance of the Chairman-CEO on the basis of
pre-agreed goals for the Group, set in consultation with the Board
Corporate Governance Commentary - Section 1.3.1

52 John Keells Holdings PLC | Annual Report 2016/17
B. Directors Remuneration
Rule Reference
B.1 Remuneration Procedure
B.1.1 The Board of Directors should set up a
Remuneration Committee
The Board has created a Human Resources and Compensation Committee, which
comprises entirely of Non-Executive Directors
Corporate Governance Commentary - Section 1.2.2
B.1.2 Remuneration Committees should consist
exclusively of NEDs
All members of the Remuneration Committee are Non-Executive Directors and are
appointed by the Board
B.1.3 The Chairman and members of the
Remuneration Committee should be listed in
the Annual Report each year
Corporate Governance Commentary - Section 1.2.2
B.1.4 Determination of the remuneration of Non-
Executive Directors
The compensation of Non-Executive Directors is determined in reference to that of
other comparable companies. They are paid additional fees for either chairing or
being a member of a Sub-Committee and do not receive any performance/incentive
payments or share option plans. The total aggregate remuneration of Non-Executive
Directors amounted to Rs.17 million
B.1.5 The Remuneration Committee should
consult the Chairman-CEO about its
proposals relating to the remuneration of
other Executive Directors
The Human Resource and Compensation Committee consults the Chairman-CEO
about any proposals relating to the remuneration of Executive Directors, other than
that of the Chairman-CEO
B.2 The Level and Make Up of Remuneration
B.2.1 The Remuneration Committee should
provide the packages needed to attract,
retain and motivate Executive Directors
The Committee determines the total remuneration package of each Executive
Director in line with market trends, performance and past remuneration
B.2.2 The Remuneration Committee should judge
where to position levels of remuneration of
the Company, relative to other companies
The Human Resources and Compensation Committee understands the value
of retaining high calibre talent within the organisation and thus determines a
framework for remuneration based on industry trends
B.2.3 The Remuneration Committee should be
sensitive to remuneration and employment
conditions elsewhere in the Company or
Group
The “Pay for Performance” scheme is monitored and the CEO-Chairman and
President of Human Resources brief the Human Resources and Compensation
Committee regularly on employee compensation
Corporate Governance Commentary - Section 2.2.3
B.2.4 The performance-related elements of
remuneration of Executive Directors
should be designed to align their interests
with those of the Company and main
stakeholders
The remuneration of Executive Directors has an element which is variable, linked to
the expected return of shareholder funds and the peer adjusted consolidated Group
bottom line
Excluding the Employee Share Options (ESOP) granted, the total aggregate
remuneration paid to Executive Directors for the year under review was Rs.154
million, of which Rs.41 million was the variable portion linked to the performance
benchmark as described above. This is in comparison to the total remuneration paid
in 2015/16 amounting to Rs.163 million, of which Rs.76 million was the variable
portion. The decline in the variable component, paid in June 2016, arises from the
Group not meeting certain performance benchmarks for 2015/16. In addition, the
fixed component of pay was impacted due to the inclusion of the proportionate fixed
remuneration of the two new Executive Directors who were appointed to the Board
with effect from November 2016
2013/14
2014/15
2015/16
2016/17
Fixed Variable
53% 47%
53% 47%
53% 47%
73% 27%
B.2.5 Executive share options should not be
offered at a discount
Employee Share Options are valued using a binomial pricing model, and are granted
at a price that is deemed fair and equitable
JKH Annual Report 2016/17 - Share and Warrants
Corporate Governance Commentary

53Group Highlights | Governance | Management Discussion & Analysis | Financial Statements | Supplementary Information
Rule Reference
B.2.6 Designing schemes of performance-related
remuneration
The Human Resources and Compensation Committee considers targets, and
benchmark principles for any performance related pay schemes
Corporate Governance Commentary - Section 2.2.3
B.2.7 /
B.2.8
Compensation commitments in the event of
early termination of the Directors
In the event of an early termination of a Director, there are no compensation
commitments other than for:
Executive Directors: as per their employment contract similar to any other employee
Non-Executive Director: accrued fees payable, if any, as per the terms of their contract
B.2.9 Level of remuneration of NEDs The compensation of Non-Executive Directors is determined in reference to that of
other comparable companies
B.3 Disclosure of Remuneration
B.3.1 Disclosure of remuneration policy and
aggregate remuneration
The aggregate remuneration paid to Executive and Non-Executive Directors amounted
to Rs.171 million
JKH Annual Report 2016/17 - Notes to the Financial Statements
Corporate Governance Commentary - Section 1.2.2
C. Relations with Shareholders
C.1 Constructive Use of the Annual General Meeting and Conduct of General Meetings
C.1.1 Counting of proxy votes Complied at the Annual General Meeting (AGM)/Extraordinary General Meeting (EGM)
C.1.2 Separate resolution to be proposed for each
substantially separate issue and adoption of
Annual Report and accounts
The Group ensures that separate resolutions are proposed for each issue that is
taken up at the AGM and shareholders are given an opportunity to vote on each issue
separately
C.1.3 Heads of Board Sub-Committees to be
available to answer queries
The Chairpersons of the Audit, Human Resources and Compensation, Nomination and
Related Party Transaction Review Committees are available to answer all shareholder
queries
C.1.4 Notice of Annual General Meeting to be sent
to shareholders with other papers
Notice of the AGM and related documents are sent to the shareholders along with the
Annual Report 30 days prior to the meeting
C.1.5 Procedures governing voting at General
meetings to be informed
The Group ensures that a summary of procedures governing voting is sent to the
shareholders, along with every notice of a general meeting
C.2.1 Channel to reach all shareholders to
disseminate timely information
The Group makes sure that timely information reaches all shareholders by way of
announcements to the CSE, press releases, the AGM and copies of the Annual Report,
and Quarterly Reports
C.2 Communication with Shareholders
C.2.1 Channel to reach all shareholders of the
company to disseminate timely information
The Group has “Board approved” policies of communication with shareholders. The
primary channel of communication is by means of the AGM
C.2.2 Disclose the policy and methodology of
communication with shareholders
The Group focuses on open communication and fair disclosure, with emphasis on
integrity, timeliness, relevance. The Group announcements are made to the CSE, SEC,
and the press as and when appropriate, in compliance with any applicable regulatory
and statutory timelines
C.2.3 Disclose how the above policy is
implemented
Information is provided to shareholders prior to the AGM to give them an opportunity
to raise any issues relating to the businesses of the Group. Shareholders are provided
with the Annual Report of JKH in CD form and may at any time elect to receive it in
printed form, free of charge
Announcements to the CSE and SEC are directed to the said bodies as and when
required, while adhering to established protocol
C.2.4 Disclose details of the contact person for
such disclosure
Questions, comments and requests are addressed to the Company Secretary
C.2.5 Awareness of Directors on major issues and
concerns of shareholders
Shareholders may, at any time, direct questions, and provide comments and
suggestions to Directors or management of the Group by contacting the Secretaries,
the Senior Independent Director or the Chairman. The Investor Relations team also
contributes towards keeping the Board informed of shareholder concerns

54 John Keells Holdings PLC | Annual Report 2016/17
Rule Reference
C.2.6 Contact person for shareholders Shareholders may contact the Company Secretary for queries and in addition, the
Investor Relations team of the Group is responsible for maintaining dialogues and
discussions with shareholders to share highlights of the Group’s performance as well
as to obtain constructive feedback
C.2.7 Process for responding to shareholders The Group has a communication policy approved by the Board
C.3 Major And Material Transactions
C.3.1 Disclosure of all material facts involving all
material transactions including related party
transactions
There were no major or material transactions that materially affected the Group’s
asset base
Corporate Governance Commentary - Section 1.2.4
JKH Annual Report 2016/17 - Notes to the Financial Statements
D. Accountability and Audit
D.1 Financial Reporting
D.1.1 The Board should present interim and other
price-sensitive public reports to regulators.
The Board of Directors, in conjunction with the Audit Committee, is responsible to
ensure the accuracy and timeliness of published information and in presenting a true
and fair view of the results in the quarterly and annual financial statements
All price sensitive information about the Group is promptly communicated to the CSE
and such information is also released to employees, the press and shareholders. The
Group ensures that information is communicated accurately and in such manner as
to avoid the creation, or continuation of a false market
D.1.2 The Directors’ Report, which forms part
of the Annual Report, should contain
declarations by the Directors
JKH Annual Report 2016/17- The Annual Report of the Board of Directors
D.1.3 The Annual Report should contain
statements by Directors and Auditors on
responsibilities towards financial reporting
JKH Annual Report 2016/17 - The Statement of Directors’ Responsibility
JKH Annual Report 2016/17 - The Independent Auditors’ Report
JKH Annual Report 2016/17 - The Annual Report of the Board of Directors
D.1.4 The Annual Report should contain a
Management Discussion and Analysis
section
JKH Annual Report 2016/17 - Management Discussion and Analysis
D.1.5 The Directors should report that the
business is a going concern
The Directors are satisfied that the Group, its subsidiaries and associates, have
adequate resources to continue in operational existence for the foreseeable future
This is further justified, by adopting a going concern basis in preparing the financial
statements
JKH Annual Report 2016/17 - The Statement of Directors’ Responsibility
D.1.6 In the event of a serious loss of capital the
Directors shall summon an extraordinary
general meeting to notify the shareholders
of the position
In the unlikely event that the net assets of the Group fall below half of shareholder
funds, shareholders would be notified and the requisite resolutions would be passed
on the proposed way forward
D.1.7 The Board should adequately and accurately
disclose Related Party Transactions in its
Annual Report
JKH Annual Report 2016/17 - Notes to the Financial Statements
D.2 Internal Control
D.2.1 The Directors should conduct a review of
internal controls at least annually
The Board has taken necessary steps to ensure that internal control systems remain
robust and effective, via the review and monitoring of such systems on a periodic
basis
Corporate Governance Commentary - Section 3.5
D.2.2 Companies should have an Internal Audit
function
The Group internal audit process is conducted by outsourced parties at regular
intervals, and is managed by the Group Business Process Review (GBPR) function
according to an internal audit plan
Corporate Governance Commentary

55Group Highlights | Governance | Management Discussion & Analysis | Financial Statements | Supplementary Information
Rule Reference
D.2.3 The Audit Committee should review
the process and effectiveness of risk
management and internal controls
The Audit Committee receives regular reports on the adequacy and effectiveness of
internal controls, and compliance with laws and regulations of the Group
The Audit Committee carries out regular review meetings with the management and
External Auditors to seek assurance on various matters including internal controls,
risk management systems of the Group and quality of financial reporting along with
independent auditors
Corporate Governance Commentary - Section 1.2.1
D.2.4 Responsibilities of Directors in maintaining a
sound system of internal control and content
of Statement of Internal Control
JKH Annual Report 2016/17 - The Statement of Directors Responsibility
D.3 Audit Committee
D.3.1 The Audit Committee should be comprised
of a minimum of two independent NEDs or
exclusively by NEDs, a majority of whom
should be independent, whichever is higher
As at 31 March 2017, all members including the Chairman of the Audit Committee are
independent NEDs
The Corporate Governance Commentary - Section 1.2.1
D.3.2 The duties of the Audit Committee should
include keeping under review the scope and
results of the audit and the independence
and objectivity of the auditors
Corporate Governance Commentary - Section 1.2.1
D.3.3 The Audit Committee should have a written
Terms of Reference, dealing clearly with its
authority and duties
The Committee has access to a written version of its Terms of Reference, which sets
out clearly its mandate and duties
Corporate Governance Commentary - Section 1.2.1
D.3.4 Disclosure of the Audit Committee Report
and memberships
Corporate Governance Commentary - Section 1.2.1
D.4 Code of Business Conduct and Ethics
D.4.1 Availability of a Code of Business Conduct
and Ethics
The Group abides by the JKH Code of Conduct, which is part of the company’s culture,
and is followed by personnel at all levels
Corporate Governance Commentary - Section 3.1
D.4.2 The Chairman must certify that he/she
is not aware of any violation of any of the
provisions of this Code
The Chairman has certified that he/she is not aware of any violation
JKH Annual Report 2016/17 - Chairman’s Message
D.5 Corporate Governance Disclosures
D.5.1 The Directors should include in the
Company’s Annual Report, a Corporate
Governance Report
A Corporate Governance Report, setting out the manner and extent to which the
company has complied, has been included
JKH Annual Report 2016/17- Corporate Governance Commentary
E. Institutional Investors
E.1 Shareholder Voting
E.1.1 Need to conduct regular and structured
dialogue with shareholders based on a
mutual understanding of objectives
The Group communicates with its shareholders via announcements made to the
CSE, Annual Reports, Quarterly Reports, and the AGM. The Investor Relations team is
primarily responsible for such activities
Corporate Governance Commentary - Section 2.5
E.2 Evaluation of Governance Disclosures
E.2 When evaluating Companies’ governance
arrangements, particularly those relating
to Board structure and composition,
institutional investors should be encouraged
to give due weight to all relevant factors
drawn to their attention
The Group prides itself in its widely acclaimed approach to corporate governance
and as such, encourages investors of all types to give weight to all relevant factors
brought to their attention

56 John Keells Holdings PLC | Annual Report 2016/17
F. Other Investors
Rule Reference
F.1 Investing /Divesting Decision
F.1 Individual shareholders, investing directly in
shares of companies should be encouraged
to carry out adequate analysis or seek
independent advice in investing or divesting
decisions
The Investor Relations team aids investors, both local and foreign, to carry out
adequate analysis on the Group and its subsidiaries. Portfolio managers, and analysts
covering the Group, are given the freedom to conduct structured discussions with the
senior management, through which they are able to obtain all necessary information
in order to form a sound, and accurate view of the economic prospects of the Group,
and the industries it operates in
F.2 Shareholder Voting
F.2 Individual shareholders should be
encouraged to participate in General
Meetings of companies and exercise their
voting rights
The Group encourages all shareholders to participate in the AGM/EGM, and exercise
their voting rights
G. Sustainability Reporting
G. 1 Principles of Sustainability Reporting
G.1.1 /
G.1.7
Disclosure on adherence to sustainability
principles
The Group places great importance on sustainable development. During the 2016/17
financial year, the Group took steps to realign its approach on sustainability to support
the Sustainable Development Goals adopted by the United Nations in 2015
JKH Annual Report 2016/17 - Management Discussion and Analysis
Corporate Governance Commentary

This section of the Report is subdivided into the
Group Consolidated Review and the Industry Group
Review. The Group Consolidated Review analyses
Group performance whilst the Industry Group
Review details the performance of each industry
group in the year under review.
60 Group Consolidated Review • 116 Industry Group Review
M A N A G E M E N T D I S C U S S I O N & A N A LY S I S
Crafting the Future


60 The Economy • 63 Capital Management Review • 83 Outlook
• 85 Strategy, Resource Allocation and Portfolio Management • 91 Materiality and Stakeholder Relationships
• 101 Risks, Opportunities and Internal Controls • 106 Share and Warrant Information
G R O U P C O N S O L I D A T E D R E V I E W
Inspiring Excellence

60 John Keells Holdings PLC | Annual Report 2016/17
In order to provide our stakeholders with
an insightful view of the Group’s operations,
the Management Discussion and Analysis
(MD&A) section of this Report consists of the
following:
• Group Consolidated Review
• Industry Group Review
Whilst the Group Consolidated Review is a
helicopter view of the Group’s performance,
the Industry Group Review section provides
a detailed discussion on each of the industry
group’s performance during the year under
review.
The Group Consolidated Review consists of
the following sections:
• The Economy
• Capital Management Review
• Outlook
• Strategy, Resource Allocation and
Portfolio Management
• Materiality and Stakeholder Relationships
• Risks, Opportunities and Internal Controls
• Share and Warrant Information
The EconomyThe Sri Lankan economy grew by 4.4 per
cent for the calendar year 2016, compared
to 4.8 per cent GDP growth recorded in
2015, primarily as a result of unfavourable
weather conditions, tightening of monetary
policy, measures to contain the fiscal deficit,
heightened volatility and policy uncertainty
due to unanticipated outcomes of global
economic and political developments.
Increased investment expenditure,
particularly in the construction sector, drove
economic growth during the year, which was
off-set by the notable decline in agricultural
activity as a result of supply side disruptions
on account of the aforementioned adverse
weather conditions that prevailed during the
year.
A notable development in June 2016 was
the approval by the International Monetary
Fund (IMF) for a three year USD 1.50 billion
Extended Fund Facility (EFF) to support
the country’s Balance of Payments (BOP)
position and the economic reform agenda of
the Government. The Government’s reform
programme, supported by the IMF, aims
to reduce the fiscal deficit, rebuild foreign
exchange reserves, and introduce a simpler,
more equitable tax system to restore macro-
economic stability and promote inclusive
growth. Under the recommendations of the
IMF, the CBSL is also expected to adopt and
move towards a flexible inflation targeting
(FIT) monetary framework from the previous
monetary targeting framework. It is expected
that the FIT framework for the conduct of
monetary policy would ensure price stability
in the economy on a sustainable basis,
thereby creating an enabling environment for
businesses by boosting confidence, leading
to prospects of higher economic growth.
The following is a discussion on the
movement of the primary macro-economic
variables during the year under review and
the resultant impacts on the performance of
the Group’s businesses. A detailed discussion
on the performance of the Sri Lankan
economy is found under the Supplementary
Information section of this Report. A more
comprehensive discussion of the strategies
and risks pertaining to the industry groups are
covered in the Chairman’s Message, Industry
Group Review and Risks, Opportunities and
Internal Controls sections of this Report.
THE ECONOMY
Group Consolidated Review
This is the second Integrated Report of John Keells Holdings PLC in
accordance with the Integrated Reporting Framework of the International
Integrated Reporting Council. The Report is centered on the theme
“Corporate Craftsmanship”, which resonates with how the Group has built
its portfolio of businesses. The continuous enhancement of our sector
expertise, partnerships with communities and people whose lives we
touch, and our reputation for delivering to the highest of standards with
innovation, creativity and finesse, come together to craft the John Keells
Group to be a model of business excellence.
See page 268 for a discussion
on the Sri Lankan Economy.
This is complemented with a 7 year
summary of key economic indicators.

61Group Highlights | Governance | Management Discussion & Analysis | Financial Statements | Supplementary Information
Movement Cause Impact to JKH
Sri Lanka’s GDP
grew by 4.4 per
cent in 2016
compared to 4.8
per cent in 2015.
The economic growth in 2016 was mainly
supported by the Industries sector,
which recorded a significant growth of
6.7 per cent. Services related activities
also contributed positively to the growth
during the year, expanding by a modest
4.2 per cent compared to 5.7 per cent in
the previous year. The Agriculture sector
witnessed a sizeable decline of 4.2 per cent
from the positive growth of 4.8 per cent
recorded in the previous year. Sri Lanka
sustained its economic growth momentum
despite challenging global and domestic
environments which resulted in reduced
export earnings and an increase in foreign
outflows from Government securities.
The growth in 2016 was largely driven by
increased investment expenditure, whilst
consumption expenditure witnessed
a slowdown in response to the policy
environment in place.
Whilst the overall performance
of the Group demonstrated
significant growth over the
previous year, the slow-down
in economic growth impacted
consumer and business sentiment
leading to a certain moderation
of business activity, particularly
during the fourth quarter of the
year.
Year-on-year
headline inflation,
based on the NCPI,
increased to 8.6
per cent in March
2017 from 2.2
per cent in March
2016. Year-on-
year core inflation,
based on the NCPI
increased to 7.0
per cent in March
2017 from 5.0
per cent in March
2016.
Inflationary pressures during the year
were compounded by the impact of
domestic supply side disruptions,
particularly due to prevailing adverse
weather conditions, increase in value
added tax (VAT) and rising international
commodity prices. Core inflation, which
measures the underlying inflationary
pressures in the economy, reflected
an upward trend in 2016 indicating a
possible sign of demand pressures on the
economy.
Although overall growth for the
consumer focused businesses
remained positive for the year, the
rising inflationary trend during the
financial year partially impacted
consumer discretionary spending
which led to a moderation in the
growth of the Consumer Foods
and Retail industry group during
the fourth quarter of the financial
year. There was no impact on the
margins of the businesses, as there
were no significant impacts on the
price levels of raw materials.
AWPLR increased
to 11.79 per cent
in March 2017
compared to 9.19
per cent in the
previous year.
The three month
Government T-bill
rate was 9.63 per
cent in March
2017 compared
to 8.90 per cent in
March 2016.
The rise in market interest rates since July
2016 reflected the monetary tightening
measures that were adopted in early 2016
in view of rising inflationary pressures and
the pressure on market interest rates due
to foreign selling of Government securities.
At the March 2017 Monetary Board meeting,
it was decided that the SDFR and the
SLFR will be increased by 25 basis points
each, to 7.25 per cent and 8.75 per cent,
respectively, as a precautionary measure
in order to contain the build-up of adverse
inflation expectations and the possible
acceleration of demand side inflationary
pressures through continued monetary and
credit expansion.
The Group witnessed an overall
increase in finance income due to the
higher interest rates and unrealised
gains recorded from short term
equity investments made by Union
Assurance PLC. However, the Group’s
finance expense decreased on account
of the previous year including an
unrealised mark-to-market loss which
is not reflected in finance expense in
the current year. The interest expense
of the Group increased primarily on
account of higher interest rates and
the increase in overall debt. During the
latter half of the year, the Group took
initiatives to invest in more medium
term investments (12 months and
below) based on the Group’s rate
outlook for the year.
GDP growth
Rs. Bn %
0
2,000
4,000
6,000
8,000
10,000
2014 2015 2016
Agriculture
GDP growth
Industries Services
3.0
3.5
4.0
4.5
5.0
5.5
Inflation
NCPI %
Mar
Ap
r
May
Jun
Jul
Au
g
Sep Oct
Nov
Dec
Jan
Feb
Mar
FY 2016/17
NCPI inflation 2016/17 (headline)
FY 2015/16
100
102
104
106
108
110
112
114
116
118
120
122
0
2
4
6
8
10
Domestic interest rates
%
Mar
16
Ap
r 1
6
May
16
Jun
16
Jul 1
6
Au
g 1
6
Sep
16
Oct
16
Nov
16
Dec
16
Jan
17
Feb
17
Mar
17
Average weighted prime lending rate (weekly)
9
10
11
12
13

62 John Keells Holdings PLC | Annual Report 2016/17
THE ECONOMY
Group Consolidated Review
Movement Cause Impact to JKH
3 month USD
LIBOR increased
to 1.15 per cent in
March 2017 from
0.63 per cent in
March 2016.
The 3 month USD LIBOR was generally
stable for the first few months of 2016
and averaged 0.63 per cent. Although the
US Federal Reserve delayed policy rate
hikes, a run-up in the rate was witnessed
since June 2016 due to a mix of structural
changes in the form of regulatory reform
in the US money market fund industry
and financial system uncertainties. As
anticipated, the Federal Reserve Open
Market Committee voted to raise the federal
fund rate by a quarter percentage point to
between 0.5 per cent and 0.75 per cent in
December 2016, which was followed by a
further rate hike in March 2017, to between
0.75 per cent and 1 per cent; which reflects
its confidence in the US economy on the
back of strengthening labour market
conditions and inflation firming up towards
policy makers' 2 per cent target.
The steady rise of 3 month US
Dollar LIBOR rates during most
part of the calendar year was as
expected by the Group. Given the
likelihood of further rate increases
in 2017 and beyond by the Federal
Reserve, and the pricing based on
the interest rate swap curve, the
Group maintains a partial hedge
on the USD 395 million syndicated
loan facility as a prudent measure
to mitigate the Group’s exposure
to rate fluctuations. The Group
also consciously invested its US
Dollar cash holdings in floating rate
deposits which helped more than
off-set the negative impacts arising
from the rise in LIBOR during the
year.
The Rupee
depreciated to
Rs.151.99 as at
31 March 2017
against the US
Dollar compared
to its closing rate
of Rs.144.69 as at
March 2016.
The exchange rate was maintained at
relatively stable levels during the first
half of 2016, with support from the
supply of foreign exchange liquidity
which depleted the reserves of the
CBSL. However, the Rupee depreciated
at a higher rate in the second half of the
year on the back of Dollar demand from
higher imports and net foreign outflows
from Government securities, which
was driven by the expectation and the
subsequent increase in interest rates
by the US Federal Reserve Bank, amidst
which, the CBSL adopted a more flexible
exchange rate policy.
The depreciation of the Rupee
had a positive financial impact
on businesses having Dollar
denominated income streams,
particularly in the Leisure industry
group. However, due to differences
of timing, there were short term
impacts on the translation on foreign
currency debt in Leisure. Given
the higher reliance on imported
inputs, the Consumer Foods and
Office Automation businesses took
proactive steps to mitigate exchange
rate risks. The Consumer Foods
sector was impacted to an extent in
the last two quarters of the financial
year under review, due to increased
global commodity prices towards
the latter part of 2016, although
the impacts were not material in
the context of the Group. In addition
to implementing foreign exchange
exposure management strategies,
the Group continued to maintain, or
where relevant, create a “natural
hedge” to manage the volatility of the
foreign exchange markets. It is noted
that the exchange rate exposure
arising from the “Cinnamon Life”
project is mitigated to an extent
since the functional currency of
the project company, Waterfront
Properties (Private) Limited, is in US
Dollars.
Global interest rates
%
Mar
16
Ap
r 1
6
May
16
Jun
16
Jul 1
6
Au
g 1
6
Sep
16
Oct
16
Nov
16
Dec
16
Jan
17
Feb
17
Mar
17
3 month US Dollar LIBOR
0.5
0.6
0.7
0.8
0.9
1.0
1.1
1.2
1.3
Exchange rates
Rs.
Mar
16
Ap
r 1
6
May
16
Jun
16
Jul 1
6
Au
g 1
6
Sep
16
Oct
16
Nov
16
Dec
16
Jan
17
Feb
17
Mar
17
LKR/USD exchange rate
144
146
148
150
152
154
Note: AWPLR - Average Weighted Prime Lending Rate; CBSL - Central Bank of Sri Lanka; GDP - Gross Domestic Product; LIBOR - London Inter-Bank
Offered Rate; NCPI - National Consumer Price Index; SDFR rate - Standing Deposit Facility Rate; SLFR rate - Standing Lending Facility Rate; SRR -
Statutory Reserve Ratio

63
Financial and Manufactured Capital ReviewRevenue
In the year under review, Group revenue increased by 13 per cent to Rs.106.27 billion [2015/16:
Rs.93.71 billion] with primary contributions from the Consumer Foods and Retail (CF&R), Leisure
and Transportation industry groups. The significant revenue growth of CF&R, particularly from
the Retail sector, offset the decrease in revenue from the Property industry group. The revenue
decline in the Property industry group is on account of the revenue recognition cycle, where the
majority of the revenue of the "7th Sense" on Gregory’s Road residential project was recorded
in the previous financial year. Revenue emanating from domestic sources was Rs.81.78 billion
[2015/16: Rs.79.2 billion].
Group revenue inclusive of equity accounted investees increased by 14 per cent to Rs.119.62
billion [2015/16: Rs.104.75 billion]. Revenue from equity accounted investees increased by
16 per cent to Rs.13.35 billion compared to the Rs.11.47 billion in the previous year. With the
exception of Maersk Lanka, all equity accounted investees recorded an increase in revenue.
The primary increases were from South Asia Gateway Terminals (SAGT) and Fairfirst Insurance
Limited (previously known as Union Assurance General Limited).
Earnings Before Interest and Tax
During the year under review, the earnings before interest and tax (EBIT) increased by 16 per
cent to Rs.23.32 billion [2015/16: Rs.20.19 billion] driven by increases in contributions from the
Other including Plantation Services and CF&R industry groups.
Fair value gains on investment property
were recorded at Rs.484 million in 2016/17,
comprising of gains of Rs.290 million, Rs.101
million and Rs.92 million at Property, Other
including Plantation Services and CF&R,
respectively. This compares with a total of
Rs.263 million recorded in the previous year.
In terms of composition of EBIT, Leisure
was the primary contributor with a 25 per
cent contribution, followed by CF&R and
Other including Plantation Services with
contributions of 24 per cent and 23 per cent,
respectively.
The graph that follows illustrates the Group
EBIT, EBITDA and EBIT margins; indicating
its overall upward trend over the five year
period, demonstrating the robust business
performance of the Group.
2012/13 2013/14 2014/15 2015/16 2016/17
Group EBIT, EBITDA and EBIT margins
Depreciation and amortisation EBIT
EBIT margin
Rs.mn
1
7.7
17
.0
18
.7
1
9.3
1
9.5 %
0
5,000
10,000
15,000
20,000
25,000
30,000
0
4
8
12
16
20
Rs.23.32Bn
Group EBITA growth of 16 per cent
CAPITAL MANAGEMENT REVIEW
Group Consolidated Review
Group revenue composition
15%
38%
9%
3%
Transportation
Leisure
Property
Consumer Foods and Retail
Financial Services
Information Technology
Other including Plantation Services
22% 23%
1%4%
12% 11%
3%
16%
35%
8%
2016/17 2015/16
Group EBIT composition
13%
24%
3%
Transportation
Leisure
Property
Consumer Foods and Retail
Financial Services
Information Technology
Other including Plantation Services
25% 26%
3%8%
23%
9%
11%
13%
22%
1%
19%
2016/17 2015/16
Group Highlights | Governance | Management Discussion & Analysis | Financial Statements | Supplementary Information

64 John Keells Holdings PLC | Annual Report 2016/17
EBIT margins (%)Reported Recurring
2016/17 2015/16 2016/17 2015/16
Transportation 16.9 15.0 16.9 15.0
Leisure 22.7 21.1 22.7 21.1
Property 61.6 38.6 35.7 34.1
Consumer Foods and Retail 12.0 12.3 11.8 12.3
Financial Services 14.9 19.3 14.9 19.3
Information Technology 5.6 1.9 5.6 1.9
Other including Plantation Services 182.3 146.7 178.8 144.8
Group 19.5 19.3 19.1 19.0
Finance income (Rs.‘000s) 2016/17 2015/16
Interest income from life insurance policy holder funds at UA* 3,110,973 2,566,963
Interest income of Group excluding UA 5,905,843 3,659,192
Capital gains from disposals of private equity investments of JKH 9 82,406
Other finance income 1,016,456 1,702,391
Total 10,033,281 8,010,952
* UA - Union Assurance PLC
Group Consolidated Review
CAPITAL MANAGEMENT REVIEW
In addition to the discussion on the financial
performance as reported, the Group
Consolidated Review will also analyse the
Group performance at a recurring level-
where the impacts of fair value gains on
investment property will be excluded, as
these do not arise as a result of the Group’s
ongoing core operations. Accordingly, the
recurring EBIT for the year under review
increased by 15 per cent to Rs.22.84 billion
compared to Rs.19.93 billion in the previous
year.
The above table illustrates the reported and
recurring EBIT margins for each industry
group. The recurring Group EBIT margin
increased marginally to 19.1 per cent from
19.0 per cent in the previous year. With the
exception of Consumer Foods and Retail and
Financial Services, all other industry groups
achieved a growth in recurring EBIT margins.
For detailed discussions on the growth in
EBIT for the respective industry groups, refer
the Industry Group Review section of this
Report.
The increase in the recurring EBIT margin
in the Other including Plantation Services
industry group is driven by the increase in
interest income generated on the Group’s
Rupee and US Dollar portfolios, as a result
of improved interest rates. The increase in
the EBIT margin of Information Technology
is mainly due to a bad debt provision that
was recorded in the previous year, arising
out of the termination of business with a key
client in the BPO business because of non-
settlement. In spite of the CF&R industry
group recording a significant improvement
in overall performance, its EBIT margin is
comparatively lower than the other industry
groups as the Retail industry, which is
increasingly a more significant contributor
to Group performance, is in general
characterised by low EBIT margins, both
locally and globally.
Finance Income
During the period under review, the finance
income of the Group increased by 25 per cent
to Rs.10.03 billion [2015/16: Rs.8.01 billion],
of which the composition is given in the table
below.
Interest income relating to Union Assurance
PLC (UA) of Rs.3.10 billion [2015/16: Rs.2.57
billion], net of related costs, is classified
under operating segment results on the basis
that interest income from the life insurance
funds is considered as operational income.
The increase in interest income of the Group,
including UA, to Rs.9.02 billion is mainly due
to higher interest rates. The decrease in other
finance income to Rs.1.02 billion is mainly
attributable to a decrease in exchange rate
gains on the Company’s foreign currency
denominated cash holdings to Rs.583 million
from Rs.1.61 billion recorded in the previous
year. Further details on finance income
can be found in the Notes to the Financial
Statements section of the Annual Report.
Finance Expense
The finance expense, which includes interest
expense, of the Group decreased to Rs.436
million from Rs.994 million recorded in the
previous year. Finance expense in 2015/16
included mark-to-market losses amounting
to Rs.602 million on short term financial
instruments of the life insurance fund at
Union Assurance PLC, with no corresponding
figure for 2016/17. For the year under review,
a mark-to-market gain of Rs.267 million is
classified under finance income. Excluding
the aforementioned loss from the previous
year, the increase in interest rates had a
negative impact on finance expenses arising
from an increase in interest expense this year
particularly with the increase in total Group
debt.
Leisure accounted for approximately 47 per
cent of the total finance expense, followed by
Other including Plantation Services with 35
per cent, and Property and Transportation
contributing equal amounts of 6 per cent
each, respectively.
During the year, Property and Leisure
contributed to an increase in Group debt,
which was off-set to an extent by the decline in
Other including Plantation Services. Finance
expense incurred under the syndicated
project development facility of "Cinnamon
Life" is capitalised as work-in-progress, in
accordance with the Group accounting policy
and in keeping with accounting standards,
under other non-current assets. The interest
cover of the Group, excluding unrealised
gains and losses from mark-to-market
investments, increased to 52.8 times from
51.5 times in the previous year, on account of
an increase in earnings.
The recurring EBIT for the year
under review increased by 15 per
cent to Rs.22.84 billion compared
to Rs.19.93 billion in the previous
year.

65Group Highlights | Governance | Management Discussion & Analysis | Financial Statements | Supplementary Information
2012/13 2013/14 2014/15 2015/16 2016/17
Interest expense and interest coverage
Interest expense Interest cover
Rs.mn %
0
200
400
600
800
1,000
1,200
1,400
0
10
20
30
40
50
60
15
.3
13
.6
51
.5
27
.7
52
.8
Taxation
During the year under review, Group tax
expense increased by 40 per cent to Rs.4.77
billion [2015/16: Rs.3.41 billion]. The Group
tax expense comprised primarily of Rs.3.82
billion from income tax on Group profits and
Rs.954 million from withholding tax from
inter-company dividends.
The increase in the tax expense of Rs.1.36
billion was mainly on account of an increase
in the income tax on Group profits and
dividend tax amounting to Rs.1.23 billion and
Rs.130 million respectively. The increase in
income tax was primarily on account of the
higher taxes at the Holding Company and the
CF&R industry group. The Holding Company
recorded an increase in interest income
on account of higher interest rates whilst
CF&R recorded an increase in profits, both of
which are taxed at a higher effective tax rate.
Accordingly, the effective tax rate on Group
profits increased to 20.8 per cent as against
17.7 per cent in the previous year.
Other including Plantation Services, CF&R
and Leisure were the highest contributors
to the Group tax expense with Rs.2.13 billion,
Rs.1.57 billion and Rs.713 million respectively.
For further details on tax impacts of the Group
refer to the Notes to the Financial Statements
section of the Annual Report.
Profit After Tax
For the year under review, the Group profit
after taxation (PAT) was Rs.18.12 billion
[2015/16: Rs.15.79 billion]. Of the industry
groups, Leisure, CF&R and Other including
Plantation Services were the highest
contributors to PAT with contributions of
Rs.5.01 billion [2015/16: Rs.4.37 billion],
Rs.3.90 billion [2015/16: Rs.3.23 billion]
and Rs.3.10 billion [2015/16: Rs.2.34
billion], respectively. Excluding the gains on
investment property, the recurring Group PAT
increased by 14 per cent to Rs.17.63 billion
from Rs.15.53 billion in the previous year.
Non-Controlling Interest
Non-controlling interest (NCI) increased by 7
per cent to Rs.1.84 billion [2015/16: Rs.1.72
billion] mainly due to the increase in profits
at Ceylon Cold Stores PLC (CCS), which also
includes the profits from its 100 per cent
owned subsidiary JayKay Marketing Services
Limited, where there is a relatively higher
non-controlling interest. The NCI share of PAT
for 2016/17 is 10 per cent against 11 per cent
in the previous year.
Profit Attributable to Equity Holders of
the Parent
The profit attributable to equity holders
of the parent increased by 16 per cent to
Rs.16.28 billion [2015/16: Rs.14.07 billion].
The net profit margin of the Group increased
marginally to 13.6 per cent from 13.4 per
cent in the previous year.
The recurring net profit attributable to equity
holders increased by 15 per cent to Rs.15.86
billion from Rs.13.85 billion in the previous
year whilst the recurring net profit margin of
the Group increased to 13.3 per cent against
13.2 per cent in the previous year.
2012/13 2013/14 2014/15 2015/16 2016/17
Profit attributable to equity holders
and net profit ratio
Profit attributableto equity holders
Net profit %
Rs.mn %
0
2,000
4,000
6,000
8,000
10,000
12,000
14,000
16,000
18,000
0
2
4
6
8
10
12
14
16
12
.8
12
.1
14
.0
13
.4 13
.6
Group finance expense
6%
4%2%
Transportation
Leisure
Property
Consumer Foods and Retail
Financial Services
Information Technology
Other including Plantation Services
47%
3%
3%
6%
35% 1%17%
2%
61%
14%
2016/17 2015/16
The profit attributable to equity
holders of the parent increased
by 16 per cent to Rs.16.33 billion
[2015/16: Rs.14.07 billion]. The
net profit margin of the Group
increased marginally to 13.6 per
cent from 13.4 per cent in the
previous year.

66 John Keells Holdings PLC | Annual Report 2016/17
Quarterly Performance at a Glance
(Rs. million)2016/17
Q1 Q2 Q3 Q4 Total
Net revenue 22,732 25,756 27,937 29,848 106,273
PBT 3,584 5,171 6,725 7,408 22,888
Transportation 711 668 845 875 3,098
Leisure 558 1,364 1,362 2,437 5,721
Property 57 52 196 359 665
Consumer Foods and Retail 1,302 1,603 1,287 1,274 5,466
Financial Services 196 244 1,140 517 2,097
Information Technology 25 162 195 230 612
Other including Plantation Services 735 1,079 1,700 1,716 5,229
Profit attributable to equity shareholders 2,371 3,769 5,145 4,990 16,275
Total assets 241,123 247,411 260,255 277,272 277,272
Total equity 168,526 173,371 181,402 194,330 194,330
Total debt 20,501 19,896 22,582 22,766 22,766
Group Consolidated Review
CAPITAL MANAGEMENT REVIEW
During the year under review, the Group
return on capital employed (ROCE) increased
to 11.5 per cent in comparison with the
previous year, driven by an improved EBIT
margin and higher capital structure ratio. The
asset turnover ratio remained static at 0.46.
The top line growth was 13 per cent in the
year under review, whilst the average asset
base of the Group increased by 13 per cent to
Rs.259.12 billion [2015/16: Rs.229.53 billion].
The increase in the average asset base
stemmed mainly from the revaluation gain
on property, plant and equipment amounting
to Rs.10.03 billion, the inclusion of work-in-
progress costs relating to the “Cinnamon
Life” project amounting to Rs.5.93 billion
and the increase in short term investments
by Rs.6.54 billion. For further details on the
ROCE of each of the industry groups, refer the
Strategy, Resource Allocation and Portfolio
Management and the Industry Group Analysis
sections of the Report.
Return on Capital Employed
Reported
ROCE (%)=
EBIT
margin (%)x
Asset
turnoverx
Capital
structure
leverage
2016/17 11.5 = 19.5 x 0.46 x 1.28
2015/16 11.1 = 19.3 x 0.46 x 1.26
Economic value statement (Rs. million) 2016/17 2015/16
Direct economic value generated
Revenue 106,273 93,710
Finance income 10,033 8,011
Share of results of equity accounted investees 3,303 2,781
Profit on sale of assets and other income 1,765 2,132
Valuation gain on investment property 484 263
121,858 106,896
Economic value distributed
Operating costs 81,548 69,820
Employee wages and benefits 12,746 11,623
Payments to providers of funds 8,339 10,763
Payments to Government 6,285 4,694
Community investments 144 125
109,062 104,838
Economic value retained
Depreciation 2,875 2,782
Amortisation 926 1,059
Profit after dividends 8,995 6,032
12,796 9,873
Contribution to the Sri Lankan Economy
The following economic value statement depicts the generation of wealth and its distribution
among the stakeholders in all business and social activities throughout the entire value chain. It
also reveals the amounts reinvested for the replacement of assets and retained for the growth and
development of operations. An overview of the Group’s total purchases of goods and raw materials
from its local community is found in the ensuing Social and Relationship Capital discussion and
Industry Group Review section of the Report.
Rs.259.12Bn
Average Group asset baseA growth of 13 per cent

67Group Highlights | Governance | Management Discussion & Analysis | Financial Statements | Supplementary Information
Return on Equity
Reported ROE (%) =Return on assets
(%)x
Common earnings
leveragex
Capital structure
leverage
2016/17 9.8 = 7.0 x 0.90 x 1.55
2015/16 9.6 = 6.9 x 0.89 x 1.57
The Group return on equity (ROE) marginally increased to 9.8 per cent compared to 9.6 per cent recorded in 2015/16, due to similar impacts as
discussed under Group ROCE.
Adjusted ROCE and ROE
Similar to the previous years, in order to provide our readers with further insight on the Group’s ROCE and ROE movements, the following
adjustments are considered in re-assessing the ratios.
ROCE
When considering the Group capital employed for 2016/17, the following items are eliminated from the capital base, given the long gestation
period.
i. Equity and debt funding of the "Cinnamon Life" project:
• Rs.34.25 billion received from the 2013 Rights Issue, and, 2015 and 2016 Warrant Issues.
• Syndicated project development facility amounting to Rs.12.37 billion drawn directly by Waterfront Properties (Private) Limited.
ii. The cumulative finance income portion of Rs.4.92 billion received during the period 2013/14 to 2016/17 on account of the funds from the
2013 Rights Issue and 2015 and 2016 Warrants Issue.
iii. Investment property gains amounting to Rs.796 million for the period 2014/15 to 2016/17.
iv. Revaluation of property, plant and equipment amounting to Rs.13.41 billion for the period 2014/15 to 2016/17.
Similarly, the Group EBIT recorded for the year 2016/17 is adjusted for the following items:
i. Finance income of Rs.1.87 billion received from the investment of the 2013 Rights Issue, and, 2015 and 2016 Warrants Issue funds.
ii. Investment property gains of Rs.484 million.
Based on the above, the adjusted industry group and overall Group ROCE is as illustrated in the table below.
Reported ROCE (%) ROCE adjusted for Rights and
Warrants Issue and Cinnamon
Life debt (%)
ROCE adjusted for Rights and
Warrant Issue, Cinnamon Life
debt, investment property, gains
and revaluations (%)
2016/17 2015/16 2016/17 2015/16 2016/17 2015/16
Transportation 19.2 16.0 19.2 16.0 19.3 16.1
Leisure 10.0 10.0 10.0 10.0 11.4 11.5
Property 1.7 4.8 4.3 10.3 2.6 10.0
Consumer Foods and Retail 60.4 55.7 60.4 55.7 61.4 63.1
Financial Services 28.0 24.2 28.0 24.2 28.2 26.2
Information Technology 26.9 6.8 26.9 6.8 26.9 6.8
Other including Plantation Services 7.9 6.6 7.9 7.0 7.7 7.0
Group 11.5 11.1 13.9 13.4 14.4 14.3
The Group ROCE post the aforementioned adjustment is further analysed as follows:
Adjusted ROCE (%) = EBIT margin (%) x Asset turnover xCapital structure
leverage
2016/17 14.4 = 17.5 x 0.59 x 1.38
2015/16 14.3 = 17.8 x 0.58 x 1.37

68 John Keells Holdings PLC | Annual Report 2016/17
Group Consolidated Review
CAPITAL MANAGEMENT REVIEW
10 20 30 40 50 60 70
Adjusted ROCE, capital employed and EBIT(Size of bubble represents the relative contribution to EBIT in Rs. million)
(10.0)
0
10.0
20.0
30.0
40.0
50.0
60.0
70.0
80.0
ROCE (%)
Capital employed (Rs. Bn)
CF&R
5,394
IT
621
Property
400
Financial Services
2,097 Transportation
3,124
Leisure
5,924Other
3,414
ROE
Similarly, when adjusted for the above described impacts, the adjusted ROE for the Group is;
Reported ROE (%) ROE adjusted for Rights and
Warrants Issue and Cinnamon
Life debt (%)
ROE adjusted for Rights and
Warrant Issue, Cinnamon Life
debt, investment property, gains
and revaluations (%)
2016/17 2015/16 2016/17 2015/16 2016/17 2015/16
Group 9.8 9.6 11.2 11.1 11.5 11.8
A Du-pont analysis of the adjusted Group ROE is as follows;
Adjusted ROE (%) =Return on assets
(%)x
Common earnings
leveragex
Capital structure
leverage
2016/17 11.5 = 7.8 x 0.91 x 1.62
2015/16 11.8 = 8.0 x 0.90 x 1.65
The adjusted ROE declined to 11.5 per cent compared with the previous year due to a decrease in the return on assets an the relative leverage.
The need for a higher debt/equity ratio has been recognised with a view to improving the ROE.
Financial Position
For the period under review, the Group’s
total assets increased by Rs.36.30 billion to
Rs.277.27 billion [2015/16: Rs.240.98 billion],
mainly on account of additions to property,
plant and equipment, other non-current
assets and short term investments. The
increase in other non-current assets was
mainly on account of work-in-progress costs
relating to the “Cinnamon Life” project and
the lease rental advance paid for Cinnamon
Dhonveli Maldives. The cash and short term
investments increased to Rs.84.29 billion
[2015/16: Rs.77.76 billion], mainly on account
of the cash earnings generated during the
year and the cash infusion from the 2016
Warrant Issue.
Assets (Rs. mn) Equity and Liabilities (Rs. mn)
74,634
15,859
69,321
58,272
80,199
14,664
82,488
63,625
87,670
17,293
94,706
77,602
Current liabilities
Non current liabilities
Non controlling interests
Shareholders' funds
Cash, short term investments and other investments
Inventories and receivables
Other non current assets
Property, plant and equipment and leasehold rentals paid in advance
218,086 240,975 277,272
28,049
54,892
15,696
178,635
23,936
48,559
13,499
154,982
35,172
32,837
12,279
137,798
277,272 240,975 218,086
2014/15 2015/16 2016/17 2014/152015/162016/17

69Group Highlights | Governance | Management Discussion & Analysis | Financial Statements | Supplementary Information
Net working capital of the Group increased to
Rs.76.91 billion as at 31 March 2017 [2015/16:
Rs.70.93 billion]. Current assets recorded an
increase on account of the aforementioned
cash infusion from the 2016 Warrant Issue.
Current liabilities also recorded an overall
increase primarily due to an increase in trade
and other payables and bank over drafts.
Considering its strong financial position, the
Group is confident of its ability to comfortably
meet its short and medium term funding
and debt repayment obligations, pursue
organic and acquisitive growth opportunities
and to meet other obligations. In terms of
the composition of the liquid assets of the
Group, Other including Plantation Services
accounted for more than half of the cash
and cash equivalents, of which a majority of
assets are in the Holding Company, followed
by the Financial Services and Leisure
industry groups.
Cash Flow
Cash and cash equivalents decreased by
Rs.755 million to Rs.47.64 billion by the end of
the current financial year [2015/16: Rs.48.40
billion] due to a change in the maturity profile
of investments. Cash and cash equivalents
in the Statement of Cash Flows comprise
of cash, short-term investments with a
maturity of three months or less and net of
outstanding bank overdrafts.
Net cash from operating activities increased
by Rs.507 million to Rs.21.02 billion as at 31
March 2017, mainly due to an increase in
finance income amounting to Rs.1.42 billion.
Net cash used in investing activities increased
to Rs.17.67 billion mainly due to the increase
in the purchases of short term investments
of the life fund of UA and an extension of the
head lease of Cinnamon Dhonveli Maldives.
Net cash used in financing activities was
Rs.4.11 billion in 2016/17 compared against
the Rs.7.72 billion in the previous financial
year. The decrease was primarily due to
the increase in proceeds from short term
borrowings coupled with an increase in debt
drawdown for the “Cinnamon Life” project and
cash infusion from the 2016 Warrant Issue.
Leverage and Capital Structure
Capital Structure
A higher proportion of the Group’s total
assets at Rs.277.27 billion were funded by
shareholder’s funds (64 per cent) whilst the
remainder was funded by a combination of
non-controlling interests (6 per cent), long
term creditors (20 per cent) and short term
creditors (10 per cent). The long term funding
of assets at Rs.249.22 billion contributed to
90 per cent of total assets.
Debt
The consolidated debt of the Group increased
to Rs.22.77 billion from Rs.20.75 billion in
the previous year. The Property and Leisure
industry groups continued to account for a
majority of the Group’s total debt with Rs.13.44
billion and Rs.5.87 billion respectively.
Where businesses have foreign currency
denominated incomes, borrowings in foreign
currency are effected to take advantage of the
comparatively lower cost of foreign currency
debt. This strategy has been practiced in the
Leisure industry group, in particular, where
foreign currency receipts are regularly
monitored to proactively evaluate the
borrowing capacity of the business. Currently,
approximately Rs.15.30 billion of the overall
debt of the Group is denominated in foreign
currency, primarily due to the increased
debt of "Cinnamon Life". The exchange rate
exposure arising from the “Cinnamon Life”
project is mitigated to an extent since the
functional currency of Waterfront Properties
(Private) Limited, its project company, is in US
Dollars.
The Other including Plantation Services
industry group was the highest contributor
to the decrease in Group debt as a result of
the loan balance of the USD 10 million IFC
facility being fully repaid as of 31 March
2017. Except for Other including Plantation
Services, all other industry groups recorded
an increase in debt.
The debt to equity ratio of the Group reduced
to 11.7 per cent in the current year from 12.3
per cent in the previous year. The net debt
(cash) cash to equity ratio was a negative
28.5 per cent as against a negative 30.8 per
cent in the previous year. The debt to EBITDA
cover of the Group stood largely unchanged
at 0.8 times compared to the 0.8 times in
the previous year. This underscores the
Group’s ability to increase its leverage, as and
when required, to fund its future investment
pipeline. Notwithstanding the significant cash
reserves of the Group, which is earmarked for
equity commitments of the "Cinnamon Life"
project and other investments in the pipeline,
the Group is cognizant of the ability to increase
its leverage and optimise equity returns. The
capital structure of recent investments have
been on the basis of increased leverage
at a project company level, although these
investments have been relatively lower in the
context of the assets of the Group.
Liquidity management
Current assets Cash and short term investments Current liabilities
Rs. Bn
2012/13 2013/14 2014/15 2015/16 2016/17
-
20
40
60
80
100
120
Rs.22.77Bn
Group debtA growth of 10 per cent
During the year under review, despite an increase in overall Group debt and the cash equity
infusion of Rs.4.34 billion to the “Cinnamon Life” project, net cash of the Group increased to
Rs.55.31 billion from the Rs.51.85 billion recorded in 2015/16. Net cash, excludes short term
investments of life fund of Union Asssurance PLC and customer advances from "Cinnamon Life".
Working Capital/Liquidity

70 John Keells Holdings PLC | Annual Report 2016/17
Group Consolidated Review
CAPITAL MANAGEMENT REVIEW
The Group long term debt to total debt
decreased to 62.4 per cent from 66.1 per
cent primarily due to a 22 per cent increase
in short term debt in the year under review.
Statement of Changes in Equity
Total equity of the Group increased by Rs.25.90
billion to Rs.194.33 billion [2015/16: 168.48
billion]. The main increases were on account
of the profit after tax of Rs.18.12 billion, other
comprehensive income of Rs.11.69 billion and
the funds generated from the exercise of the
2016 Warrant amounting to Rs.3.18 billion,
which were partially offset by the dividends
paid during the year amounting to Rs.7.28
billion.
Concluding on the Group’s Financial and
Manufactured Capital Review, the section which
follows discusses the third aspect of Capital
Management, this being the Natural Capital. This
section will discuss the Group’s management
of its environmental impacts as well as the
outcomes and value creation processes
through its sustainability and corporate social
responsibility agenda, respectively.
Natural Capital Review The management strategy of Natural Capital
is of vital importance for the long term and
sustainable value creation to the Group. The
Group is committed to establishing policies
and procedures that enable sustainable and
efficient business operations whilst also
growing the bottom line. The Group has a
comprehensive environmental management
system in place through which its efforts
in efficient energy and water usage, waste
management and conservation of biodiversity
and wildlife continued throughout the year, as
discussed in detail in the ensuing sections.
During the year under review, and in
furtherance of its commitment to managing
its Natural Capital with increasing productivity,
2016/17 2015/16
Current ratio (times) 3.7 4.0
Quick ratio (times) 3.5 3.8
Net working capital (Rs. mn) 76,914 70,927
Asset turnover (times) 0.5 0.5
Capital employed (Rs. mn) 217,096 189,230
Total debt (Rs. mn) 22,766 20,750
Net debt (cash) (Rs. mn) (55,309) (51,849)
Debt/equity ratio (%) 11.7 12.3
Net debt (cash)/equity ratio (%) (28.5) (30.8)
Long-term debt to total debt (%) 62.4 66.1
Debt/total assets (%) 8.2 8.6
Liabilities to tangible net worth 0.4 0.4
Debt/EBITDA (times) 0.8 0.8
Net debt/EBITDA (2.0) (2.1)
Sustainability goal for 2019/20Monitoring of
quarterly progression
Monitoring of annual
progression
Achieve 12 per cent reduction in energy
consumption by March 2020
Monitor and update
progression of
committed initiatives
internally
Disclose progression of
committed initiatives
in the Annual Report to
stakeholders each yearAchieve 6 per cent reduction in water usage
by March 2020
the Group established sustainability goals
aimed at conserving energy and optimisation
of water usage - both of which are material
areas. The Group liaised with external
consultants who conducted in-depth studies
to ascertain optimisation strategies and
technologies for the setting of environmental
goals for the Group to be achieved by the
end of the financial year 2020. The year
2015/16 was established as the baseline
for the goal setting process. The goal setting
process commenced with the Leisure and
CF&R industry groups as they account for a
majority of resource utilisation in the areas
of energy and water. The feasibility of the
proposed strategies was analysed, followed
by a commitment by the business units and
sectors to deliver on the actions agreed upon,
after which the Group arrived at the goal for
the financial year 2020. The monitoring of
progress on achievement of goals will be as
follows.
Energy and Carbon Footprint
During the year under review, the total energy consumption within the Group was 672,508 GJ
[2015/16: 657,770 GJ] which was derived from non-renewable and renewable energy sources
and the national grid.
Total power consumed in GJ 2016/17 2015/16 2014/15
1 Energy consumption from non-
renewable sources 220,911 213,747 223,321
Fossil fuel
Diesel 135,227 135,288 138,740
Petrol 16,861 15,009 21,361
Furnace oil 40,405 37,057 38,638
LPG 28,418 26,393 24,717
2 Energy consumption from renewable
sources 101,112 111,061 130,067
3 Purchased energy - national grid 350,486 332,961 311,263
Total energy consumption 672,509 657,769 664,651
The Group liaised with external consultants who conducted in-depth
studies to ascertain optimisation strategies and technologies for the
setting of environmental goals for the Group to be achieved by the end of
the financial year 2020.

71Group Highlights | Governance | Management Discussion & Analysis | Financial Statements | Supplementary Information
The Leisure and CF&R industry groups were
the largest consumers of energy, accounting
for over 75 per cent of the energy consumed
and 89 per cent of the carbon footprint of the
Group.
Leis
ure
Co
nsu
mer
Fo
od
s &
Reta
il
Oth
er/
Pla
nta
tio
n S
erv
ices
Tra
nsp
ort
ati
on
Fin
an
cia
l S
erv
ices
Pro
pert
y
Info
rma
tio
n T
ech
no
log
y
Energy consumption by
industry group/sector
2014/15
GJ '000
0
50
100
150
200
250
300
350
2015/16 2016/17
The Plantation Services sector accounted
for 18 per cent of the Group’s total energy
consumption. However, the sector contributed
only 3 per cent to the Group’s carbon
footprint, primarily due to its continued usage
of renewable energy generated through
biomass. Tea Smallholder Factories PLC (TSF
PLC) was the largest consumer of power in the
Plantation Services sector, obtaining 64 per
cent of its energy through renewable energy.
In addition, during the year under review,
Group companies saved approximately 5,855
GJ, with a resultant estimated saving of
1,108 MT of carbon, through various energy
conservation initiatives, details of which
can be found in the Industry Group Review
section of the Report.
Overall, the Group generated 6.6 million
kWh of power from renewable energy
sources such as firewood purchased from
the surrounding communities and solar
power, constituting 6 per cent of its total
energy requirement. Whilst such practices
have enabled the Group to reduce its
environmental impact and cost of operations,
it has also provided a means of livelihood for
the surrounding communities.
Leis
ure
Co
nsu
mer
Fo
od
s &
Reta
il
Oth
er/
Pla
nta
tio
n S
erv
ices
Tra
nsp
ort
ati
on
Fin
an
cia
l S
erv
ices
Pro
pert
y
Info
rma
tio
n T
ech
no
log
y
Carbon footprint by
industry group/sector
2014/15
CO2 MT '000
0
10
20
30
40
50
2015/16 2016/17
The main contributor to the Group’s carbon
footprint was electricity from the national
grid followed by diesel and furnace oil. Given
that Sri Lanka’s national grid is hydro power
based, the resultant carbon footprint is lower
in comparison to countries producing power
solely through fossil fuels.
Carbon footprint by energy type
12%
4%
81%
1%2%
LPG
Petrol
Furnace oil
Diesel
Electricity
Notwithstanding the increased operational
activity of the Group due to a full year’s
operations at Rajawella Holdings Limited
(RHL), the opening of 15 new Keells Super
outlets resulting in a significant increase
in the square footage and increased
production volumes in the Consumer Foods
sector, the Group demonstrated continuous
improvement in carbon efficiency as it
recorded an increase of only 5 per cent in
its carbon footprint amounting to 82,492
MT [2015/16: 78,661 MT]. The scope 1,
direct energy carbon footprint amounted to
16,134 MT, while scope 2, indirect energy
carbon footprint amounted to 66,359 MT. The
movement over the past five years’ carbon
footprint in metric tons per million rupees of
revenue illustrates an overall declining trend
as depicted in the chart below.
Carbon footprint per Rupees
million of revenue
MT CO2 eq
0.0
0.2
0.4
0.6
0.8
1.0
2012/13 2013/14 2014/15 2015/16 2016/17
Water Management
As part of its Natural Capital management
strategy, the Group monitors and measures
water from all sources, which include ground
water, inland surface water bodies, oceans,
pipe-borne water from the National Water
Supply and Drainage Board and rainwater
harvesting.
Water withdrawal by source
48%
10%
42%
Surface water - wetlands, rivers, lakes, oceans etc
Ground water
Municipality/authority water sources
The Group generated 6.6 million
kWh of power from renewable
energy sources

72 John Keells Holdings PLC | Annual Report 2016/17
Group Consolidated Review
CAPITAL MANAGEMENT REVIEW
The Group withdrew a total of 2,021,739 cubic
meters of water, resulting in a 1 per cent
increase of consumption from the previous
year. This was mainly due to the increase
in operational activity across all sectors of
the Group. Where feasible, the Group seeks
to fulfil part of its requirement from green
water sources through rainwater harvesting.
Given the nature of its operations, the Leisure
and CF&R industry groups account for the
highest proportion of water consumed, with
approximately 92 per cent of the Group’s
water consumed by these industry groups.
Leis
ure
Co
nsu
mer
Fo
od
s &
Reta
il
Oth
er/
Pla
nta
tio
n S
erv
ices
Tra
nsp
ort
ati
on
Fin
an
cia
l S
erv
ices
Pro
pert
y
Info
rma
tio
n T
ech
no
log
y
Water withdrawn by
industry group/sector
2014/15
m3 '000
0
200
400
600
800
1,000
1,200
2015/16 2016/17
Water usage per Rupees
million of revenue
m3
0
5
10
15
20
25
2012/13 2013/14 2014/15 2015/16 2016/17
Where feasible the Group makes best
efforts to reduce its water requirement
through the recycling of treated effluent
and be brought to an acceptable quality. In
any event the Group ensures compliance
with regulatory standards, mentioned in
relevant Environmental Protection Licences
(EPL) when returning such water to the
environment.
Water discharge by method
16%
36%4%
12%
2%
30%
To municipality sewerage/NWSDB drainage lines
Treated and recycled/reused
Treated and discharged
Direct discharge as per guidelines
Through soakage pits
Provided to another organisation outside the Group
During the reporting period, the Group
discharged 1,460,799 cubic meters of
effluent. Of all water discharged to the
environment, 46 per cent was treated
through on-site sewerage treatment plants
at the various operational locations, 36 per
cent was discharged to municipal sewerage
treatment systems, whilst 16 per cent of
water was completely recycled by operations,
which as a percentage of water withdrawn
was 11 per cent. Such water was utilised
for general cleaning, gardening and flushing
mechanisms.
Business units also carry out a range of
initiatives such as awareness campaigns
and installation of water saving fixtures and
equipment. A detailed discussion of water
withdrawal and discharge by industry group, as
well as water saving initiatives, can be found in
the industry group review section of the Report.
Waste Management
Due to increased operational activity across
the Group, waste generated increased to
8,846 MT from 8,251 MT in the previous year.
Of this, 328 MT was classified as hazardous
waste and disposed of through specialised
third party contractors. Of the total waste
produced, 42 per cent was recycled or reused
by the Group’s business units or through
selected third party contractors. The Leisure
and CF&R industry groups contributed to
over 94 per cent of the waste generated by
the Group. Further details of how such waste
was generated, reused and recycled are
available in the industry group review section
of the Report.
Composting yard at Cinnamon Citadel Kandy
Progress Review on Sustainability Commitments
Targets for 2016/17 Comment on Progress
The Group will strive to outperform selected
international benchmarks for carbon
footprint, energy consumption and water
usage whilst also seeking to better its own
performance on said aspects
The Group outperformed both the selected
international benchmarks as well as its own
performance of the previous year.

73Group Highlights | Governance | Management Discussion & Analysis | Financial Statements | Supplementary Information
Leis
ure
Co
nsu
mer
Fo
od
s &
Reta
il
Oth
er/
Pla
nta
tio
n S
erv
ices
Tra
nsp
ort
ati
on
Fin
an
cia
l S
erv
ices
Pro
pert
y
Info
rma
tio
n T
ech
no
log
y
Waste generated by
industry group/sector
2014/15
MT
0
1,000
2,000
3,000
4,000
5,000
2015/16 2016/17
Waste disposal by method
14%
1%
27%37%
21%
Reuse
Recycling
Recovery
Incineration
Landfill
Waste generated per
Rupees million of revenue
MT
0.00
0.02
0.04
0.06
0.08
0.10
0.12
0.14
2012/13 2013/14 2014/15 2015/16 2016/17
Corporate Social Responsibility Projects
Recognising the importance of conserving our
environment for future generations, the John
Keells Group makes a conscious and collective
effort to protect and enhance the environment
via its social responsibility arm, John Keells
Foundation (“Foundation”). Following are
a few of the key initiatives undertaken by
the Foundation. Other key environmental
projects such as Project Leopard, elephant
data gathering and forestry project can also
be found in the industry group review section
of the report.
Nature Field Centre, Rumassala
The Central Environmental Authority
(CEA), in collaboration with the Foundation,
established the Nature Field Centre in
Human Capital Review The Group’s Human Capital is the primary
component of its earning potential,
productivity and long term sustainability. The
Group’s holistic approach to the management
of its Human Capital founded on the core
building blocks of inspiring people, caring
for people and leadership, encompasses
ensuring diversity, encouraging and
facilitating innovation and excellence whilst
always maintaining the integrity of the Group
Values.
Rumassala in 2008 to facilitate experiential
learning on the environment and bio-diversity
conservation, particularly among school
children. As per the CEA’s report, a total of
2,625 visitors, of which 2,469 were school
children, participated in the CEA’s awareness
programmes during the year in review. The
Foundation also initiated discussions with
the CEA on means of making the Centre self-
sufficient and sustainable.
Paper Conservation
During the year in review, waste paper
continued to be collected from each of
the business locations for shredding and
recycling. The impact of this initiative during
the reporting period is summarised as follows:
Sewerage treatment plant at Cinnamon Bey Beruwala
Waste paper
collected
(kg)
Payment
(Rs.) Savings (indirect impact)
Trees
(Nos)
Water
(Litres)
Electricity
(kWh)
Oil (Litres) Landfill (m3)
48,942 342,594 834 1,555,378 195,768 85,891 147
Concluding the Group’s Natural Capital Review, the following section discusses Human Capital
Review the fourth aspect of Capital Management.
Employee Diversity
As an equal opportunity employer the Group
encourages workplace diversity in all its
forms; it promotes and celebrates innovative
thinking whilst raising the bar in everything
they do, as individuals or in teams. The Group
prides it self in continuously updating and
upgrading what it does to create an enabling
environment which promotes a content and
productive workforce.

74 John Keells Holdings PLC | Annual Report 2016/17
Group Consolidated Review
CAPITAL MANAGEMENT REVIEW
As an equal opportunity employer, the
overall Non-Discrimination Policy, which
commits to maintaining a workplace that is
free from physical and verbal harassment
and discrimination on the basis of race,
religion, gender, age, nationality, social origin,
disability, political affiliation or opinion, was
expanded in the previous year to include
sexual orientation and gender identity. The
Group completed its Group wide awareness
campaign to sensitise its employees on the
areas of non-discrimination, with special
emphasis on non-discrimination based on
sexual orientation and gender identity.
Talent Management
The Group continuously monitors its
employee retention and, in particular, seeks
to address staff attrition in typically high
attrition industry groups through proactive
initiatives that engage employees. During
the year under review, the Great Place to
Work (GPTW) survey was conducted for all
Group employees which provided insights
to identify, create and sustain the Group as a
great workplace. The results from the survey
were presented to the GEC in January 2017.
Subsequently, action plans were drawn up
and incorporated into business plans at a
Group level and business unit level.
The Group’s total attrition (for executives
and non-executives) and new hire attrition
rate, excluding the IT Enabled and Retail
sectors, where staff turnover is expected
to be high and is an industry norm, was 24
Total employees by gender
74%
26%
Male Female
Workforce by gender
71%
29%
Male Female
Contractor's personnel by gender
65%
35%
Male Female
The workforce as at 31 March 2017 was
20,100 of which 12,835 were employees and
7,265 were outsourced personnel (neither
staff employees or seasonal workers). Of the
Group’s total employees, 495 are placed in the
Maldives and 484 in India, with the remainder
stationed in Sri Lanka.
8%
Total employees by age
50%
42%
Below 30
Between 30-50
Above 50
Workforce by type of employment
36%
28%
36%
Employees permanent
Employees contract
Contractor's personnel
Diversity at the work place
Of the ten Board Directors of JKH as at 31 March 2017, three members are between the ages
of 30-50 and seven members are over the age of 50, with one female Director. Of the 9 Group
Executive Committee (GEC) members, one GEC member is female, whilst seven members are
over 50 years of age and two members are between the ages of 30-50 years. Excluding the GEC
members, of the thirteen members of the Group Operating Committee (GOC), four are between
the ages of 30-50, and nine are over the age of 50, with three GOC members being female.
The Group monitors the diversity of its workforce
based on age and gender as illustrated by
the following diagrams. The Group has seen
the demographics of the workforce changing
with 50 per cent of its employees being less
than 30 years, bringing with it the opportunity,
dynamism and challenges. The Group has also
seen an increase in the female population of the
Group during the reporting period which will no
doubt augur well for the Group.

75Group Highlights | Governance | Management Discussion & Analysis | Financial Statements | Supplementary Information
per cent and 6 per cent respectively. With
increased supply of hotel rooms, some
pressure on staff retention was faced by
the Sri Lankan Resorts and City Hotels
contributing to a higher attrition rate. Multi
pronged approaches have been put in place
to manage this and the Group is confident of
achieving the desired results. With respect to
staff identified as “Talent”, the attrition has
been negligible with senior management
continuing to place extra emphasis on
developing and nurturing them. The executive
level attrition continues to be relatively lower
than attrition at non-executive levels. Further,
recruitment based on profile mapping was
continued in certain businesses to ensure a
better fit with the needs of the organisation
and thereby ensuring longer retention. This
has paid dividends as reflected in the new
hire attrition rate.
Performance Appraisals
The Group’s performance management cycle
ensures that all employees of the Group
undergo regular appraisals. Formal feedback
is provided on a bi-annual basis to the
executive cadre and once a year to all others,
whilst continuous feedback is encouraged.
Recognition of employees is actively
encouraged and special budgetary allocations
are made for this purpose. Several employee
recognition schemes are in place at a Group
level and at business unit level, reflecting
business specific requirements. During the
year under review, the “Disruptive Innovation
Award” was introduced and awarded at the
presentation of Chairman’s Award held
annually to support the Group’s thrust in the
digital business space.
Learning and Development
The Group’s learning and development
programmes are key policy components of
talent retention and ensuring a sustainable
competitive advantage, with a total of 529,468
training hours [2015/16: 418,726 hours]
provided to Group employees. Each year,
training for employees are determined on a
needs basis, aligning the business specific
requirements. Through the performance
management system, employees can
request for training when conducting self-
appraisals while supervisors also can
nominate employees for training based on
the needs taking advantage of the Group’s
extensive training calendar. The learning is
also facilitated via digital platforms such as
Employees participating in a Development Centre
Attrition by gender
65%
35%
Male Female
Attrition by region
98%
2% 1%
Local Foreign
Attrition by age breakdown
82%
17%
Below 30
Between 30-50
Above 50
New hires by gender
63%
37%
Male Female
New hires by region
94%
6% 1%
Local Foreign
New hires by age group
86%
13%
Below 30
Between 30-50
Above 50

76 John Keells Holdings PLC | Annual Report 2016/17
Group Consolidated Review
CAPITAL MANAGEMENT REVIEW
Yammer, the Group Intranet, and experience
sharing sessions. On average, 41 hours of
training were provided per employee, with
average training hours per annum amounting
to 41 hours for males and 42 hours for
females.
In the year under review, the Group
undertook initiatives to create a “coaching
culture” by identifying individuals at sector
level and business unit level to be trained and
developed as “People Coaches”. This was the
fourth phase of the Team Leader Workshop
series, which was introduced in the year
2015/16 for all team leaders in the executive
cadre.
Total training hours ('000)
0 100 200 300 400 500
Non executives
Executives
Assistant managers
Managers
AVP & above
As part of its career development strategy, the
Group carried out leadership development
programmes, management development
programmes, and Development Centres in
collaboration with reputed international and
local institutes. In addition, “Young Fora” are
continued with the intention of developing
management skills in executive and above
levels through interactions with the business
leaders of the Group. The Group continues its
career support initiatives to ensure that its
employees achieve their full potential.
Collective Bargaining
The Group engages with trade unions on an
ongoing basis through Joint Consultative
Committees and other mechanisms. Formal
agreements are found in the CF&R industry
group, covering over 706 employees
amounting to 6 per cent of the Group’s total
employee count. TSFL follows the wage
structures of the plantation industry of the
country and the Resort Hotels have entered
into a Memorandum of Understanding with
staff representatives from one trade union.
Employee Benefit Plans
In Sri Lanka, employees are eligible for the
Employees’ Provident Fund (EPF) and the
Employees’ Trust Fund (ETF) contributions.
Employees who are Maldivian nationals or
employed in the Maldives are eligible for
the Maldives Retirement Pension Scheme
(MRPS) contributions, whilst employees
based in India are eligible for Employees’
Provident Fund (EPF) contributions according
to the terms of the Employees’ Provident
Fund and Miscellaneous Provisions Act in
India. The total contribution made to the
trust funds for the reporting year was Rs.142
million (3 per cent of salary contributed by
employer) while the total contribution made
to the provident fund was Rs.643 million (12-
20 per cent of salary contributed by employer
and 8-15 per cent of salary contributed by
employee). In Sri Lanka and India, employees
are also entitled to retirement gratuity, The
employee benefit liability as at 31 March
2017 was Rs.1.88 billion.
Corporate Social Responsibility Projects
Staff Volunteerism
Staff volunteerism is at the heart of the
Group’s community engagement strategy.
Most projects carried out by the Foundation
are supported by the Group’s staff volunteers.
This volunteer network enables employees
to reach beyond their day-to-day work
to contribute to the community and the
environment, while the Group’s volunteer
leave policy enables staff to be released for
CSR activities with minimum restraint.
During the year, over 1,008 staff volunteers
engaged in projects undertaken by the
Foundation, recording over 1,954 volunteer
instances and clocking over 7,649 hours,
excluding CSR initiatives that occur at a
sector/business level.
Concluding the Human Capital Review, the
following section discusses the Social and
Relationship Capital, the fifth aspect of Capital
Management.
Health and Safety
The Group places the highest importance on ensuring a safe working environment for all its
employees, taking steps to ensure that health and safety concerns are prioritised and addressed
across the Group. All business units within the Group have been empowered to undertake any
measure it may deem necessary to ensure that it is a “Safe Place to Work”. As part of its Human
Capital management strategy, incidents are logged, recorded and tracked on a continuous basis.
There were no fatalities reported during the year under review.
2016/17 2015/16
Number of staff affected by occupational injuries and diseases 213 217
Gender wise occupational injuries (male: female) 158:55 166:51
Gender wise occupational diseases (male: female) - -
Region-wise occupational injuries (in Sri Lanka: outside Sri Lanka) 211:02 206:11
Region-wise occupational diseases (in Sri Lanka: outside Sri Lanka) - -
Occupational injuries per 100 workforce 1.06 1.11
Total man days lost per 100 workforce days 0.035 0.050
Total absentee days per 100 workforce days 0.0011 0.0022
JKH volunteers participating in a tree planting initiative in Cinnamon Wild Yala

77Group Highlights | Governance | Management Discussion & Analysis | Financial Statements | Supplementary Information
Social and Relationship Capital ReviewProduct Responsibility
The Group strives to ensure and maintain
the highest standards for its products
and services by adhering to all statutory
and regulatory requirements, local and
international, as well as global best practices.
Group companies ensure the highest quality
in processes, responsible marketing and
communications, as well as consumer and
employee health and safety through robust
quality management processes and quality
assurance. The ongoing ISO 9001, ISO 22000,
ISO 14000 and OHSAS 18001 certifications by
the relevant Group companies are testimony
to the Group’s commitment in this regard.
Social Responsibility
The Group understands the value of building
Social and Relationship Capital for the long
term sustainability of any business and
thus strives to create and uphold trust and
reciprocity among its key stakeholders,
whilst creating long term value.
83 per cent of the Group’s economic value
distributed was spent on goods, services and
utilities locally, with Sri Lanka being defined as
local based on the number of operations and
revenue and being the significant location of
operations. Mutually beneficial relationships
are sought in relevant industries through
sustainable sourcing, with Rs.3.35 billion
spent on purchases, mainly fresh produce,
by the Consumer Foods and Retail industry
group and the Sri Lankan Resorts segment,
stimulating local economies and encouraging
small businesses to help fulfil the supply
chain requirements of the Group.
Group companies also undertake corporate
social responsibility initiatives in locations
of operations, across six key areas of
national focus. During the year, through
these initiatives, 1,010,200 people were
impacted, while Rs.150 million was
expended in carrying out community service
and infrastructure projects. Training and
awareness on serious diseases such as HIV
and AIDS, dengue, thalassemia and diabetes
was also carried out, with a total of 199,802
persons educated during the year. There
has been a significant increase in persons
educated due to a increasing number of
awareness programmes conducted.
As a testament to its commitment to
responsible business, the Group had no
environmental, product related or any other
significant fines during the reporting year
and did not have any non-compliance with
regard to marketing communications.
Supply Chain Management
The Group believes that striving to entrench
sustainability along its supply chain helps
create long term value and business
sustainability for all parties. The Group
works closely with its key suppliers to create
awareness and disseminate knowledge on
sustainability best practices, with supplier
fora being carried out for over 80 Group
sourced suppliers in Sri Lanka as well as
significant suppliers in the Maldives.
The Group’s significant suppliers are reviewed
in terms of labour practices, upholding of
human rights and environmental impacts
and assessed for key sustainability impacts,
based on the Group's supply code of conduct,
legal and other requirements. Approximately
90 existing suppliers were assessed during
the year, while all new suppliers are assessed,
prior to being contracted as a pre-requisite to
carrying out business.
The Group Initiatives process also ensures
further integration of sustainability within the
value chain. Tenders and bids received for
high value items sourced by the Group are
assessed not only for quality and price but
also for social and environmental aspects
and impacts.
During the year under review, a new
procurement platform was implemented to
streamline the Group’s sourcing initiatives.
Supplier identification, request for proposals,
submission of proposals, evaluation,
contracting and supplier management for
products and services sourced from the central
sourcing division will now be performed on
the platform. This will enable the Group to
have clear visibility of the sourcing process
in real time, shorten contracting life cycles
and have the ability to make better supplier
related decisions based on more accurate
analytics. In addition, the potential sourcing of
business needs too will be carried out through
this platform in the near future.
Diabetes screening programme conducted by UA
Progress Review on Sustainability Commitments
Targets for 2016/17 Comment on progress
Seek to entrench sustainability and risk
management practices across its significant
value chain partners in an effort to promote
responsible corporate citizenship in its
supply chain whilst reducing the risk of
operations for the John Keells Group
During the year, the Group carried out
reviews of over 90 significant value chain
partners on all areas of the triple bottom
line, whilst also carrying out sustainability
awareness through supplier fora for 80
group suppliers

78 John Keells Holdings PLC | Annual Report 2016/17
Group Consolidated Review
CAPITAL MANAGEMENT REVIEW
Corporate Social Responsibility Projects
The Group’s CSR initiatives represent how
the Group’s values, corporate culture and
operations are intrinsically intertwined and
connected to social, economic and environment
concerns. All initiatives carried out by the
John Keells Foundation (“Foundation”) are
medium to long term strategic and sustainable
projects that fall into one of six focus areas;
Education, Health, Environment, Livelihood
Development, Arts and Culture and Disaster
Relief and is inspired by the Group’s CSR vision
“Empowering the Nation for Tomorrow”.
English Language Scholarship Programme
This project is aimed at enhancing English
language skills of school children and youth
from socially and economically disadvantaged
backgrounds throughout the country in order
to improve their opportunities for higher
learning and sustainable employment. The
main focus is “English for Teens”- with over
1,000 scholarships on offer each year to
students aged 12-14 years from disadvantaged
Government schools throughout the Island,
while high-performing students have the
opportunity to progress to the next level of
the scholarship scheme. In the reporting year,
a total of 1,296 youth registered under the
English Language Scholarship programme
in 24 locations covering 7 provinces while a
During the year in review, the focus area
entitled “Community and Livelihood
Development” was renamed as “Livelihood
Development”. In addition, “Promises” in
respect of each of the Group’s CSR focus
areas were developed, towards enabling
strategic focus and alignment across the
Group. All industry groups of the John Keells
Group also commenced review of their CSR
strategies towards aligning them to the
Foundation’s “Promises” and incorporating
them in their long-term business plans.
At the Foundation, CSR initiatives are aligned
to national priorities and Sustainable
Development Goals (SDGs) to ensure a collective
and targeted focus towards addressing key
universal needs for the development of all
people, focusing on the three dimensions of
sustainable development: economic growth,
social inclusion and environmental protection.
The diagram below indicates our CSR vision,
focus areas and respective promises, aligned
to the SDGs along with the impact and total
investment of the Foundation during the
financial year.
"Empowering the Nation for Tomorrow"
Education
To provide better access to educational
opportunities for those in need towards
enhancing their employability and
entrepreneurship
Health
To foster healthy communities towards
enhancing wellbeing and productivity of
Sri Lanka and Sri Lankans
Livelihood Development
To foster sustainable livelihoods through
relevant skills, capacity and infrastructure
enhancement towards building empowered
and sustainable communities
Arts and Culture
To nurture the livelihoods of artists and
preserve our cultural heritage towards
safeguarding and promoting Sri Lankan
arts and culture
Disaster Relief
To come to the aid of Sri Lankans and global
communities in times of adversity and
disaster towards enabling them to rebuild
their lives and livelihoods
Environment
To minimise the impact of our operations
and promote conservation and sustainability
towards enhancing environmental and
natural capital
Impacting more than 1 million persons per annum
Investment of approximately Rs.150 million per annum
Performance by English scholars of Kurunegala at English Day 2016
Further details of the Corporate Social Responsibility projects are available on
http://www.johnkeellsfoundation.com/

79Group Highlights | Governance | Management Discussion & Analysis | Financial Statements | Supplementary Information
total of 1,148 scholars completed the course
in keeping with attendance requirements.
A speech and drama course for Grades
1-4 students of the School for the Blind in
Ratmalana was introduced during the year in
review. A cumulative total exceeding 13,000
scholarships have been awarded since
project inception in 2005.
Neighbourhood Schools Development
Programme
This project, in collaboration with Cinnamon
Grand and Cinnamon Lakeside, aims to uplift
the quality of education of five disadvantaged
Government schools in Colombo 2. The
following initiatives were conducted in the
reporting year:
• Infrastructure and facility development
amounting to Rs.1.2 million.
• 1,521 students benefited from
English Language and IT scholarship
programmes and revision classes in
preparation for public examinations.
• 34 post-Ordinary Level students
benefitted from a personal effectiveness
and career guidance workshop, including
an overview on career prospects
available within the John Keells Group.
• Youth who were not eligible to pursue
Advanced Level studies were offered
vocational training in either the hospitality
or retail industry.
• A teacher training workshop was
organised in collaboration with the Zonal
Education Office towards enhancing soft
skills and interaction with students.
Soft Skills for University Undergraduates
Although workshops were planned to be held
during the reporting year in the Universities of
Ruhuna and Sri Jayewardenepura, the events
could not be conducted due to union activities
and student unrest affecting the Universities.
Promoting Science Education Amongst
School Children
The Foundation continued its collaboration
with Sri Lanka Association for the
Advancement of Science in conducting
Science Day Programmes (SDPs), aimed
at promoting an interest among school
children in pursuing higher education and
career aspirations in science contributing
to the national development. 7 SDPs were
conducted, benefitting 1,536 students
and 101 teachers from 94 schools in six
disadvantaged districts.
The John Keells Vision Project
This is an island-wide cataract project
aimed at addressing Sri Lanka’s biggest
cause of preventable blindness. During the
year in review, the Foundation continued its
collaboration with the Ministry of Health and
other partner organisations in relation to the
following initiatives:
• Funding and volunteer support for a
total of 133 eye camps in all 9 provinces,
resulting in the screening of 1,770
patients and completion of 1,185 cataract
surgeries. The cumulative number of
cataract surgeries since the launch of the
project in 2004 is 12,144.
• Funding and volunteer support for the
School children’s Vision Screening and
Spectacles Programme in the Colombo
District conducted in collaboration with the
Department of Health Services and Ceylon
Cold Stores PLC. During the reporting
year, vision screening was conducted in
103 schools, testing over 54,670 school
children and donating 3,465 eye glasses
free of charge, resulting in a cumulative
project total of 8,528 eye glasses.
• Donation of Rs.2 million towards the
purchase of a phaco-emulsifier machine
for the use of a mobile eye unit planned
to be operated by the Vision 2020
Secretariat of the Ministry of Health.
JKH volunteers assisting in a school eye screening programme
Teacher training workshop organised by JKF
I have gained better skills in writing
and speaking after the completion
of this course. I believe that this
programme has improved my
knowledge more than enough to
get through my examinations easily
- Thaksila Dilhara, scholar from
Welimada

80 John Keells Holdings PLC | Annual Report 2016/17
Group Consolidated Review
CAPITAL MANAGEMENT REVIEW
John Keells HIV and AIDS Awareness
Campaign
The Foundation continued its long-term drive
against the spread of HIV and AIDS as well as
the stigma and discrimination associated with
the disease. During the year in review, a total
of 23,758 persons were sensitised on HIV and
AIDS, resulting in a cumulative total of 117,268
persons since project inception in 2005. The
awareness sessions are conducted by John
Keells volunteer trainers, with some of the
sessions featuring testimonies by HIV positive
persons as a means of effectively addressing
aspects of stigma and discrimination,
while enabling such persons to develop
economic independence. World AIDS Day was
commemorated through a variety of Group
wide activities including inter-business poster
and quiz competitions and various awareness
programmes.
The Foundation continued to host its
e-learning platform on its website which is
a comprehensive and interactive learning
tool that covers critical information on HIV
and AIDS. It is accessible free of charge by
any member of the public over the age of 18
years. During the reporting year, 125 persons
completed the e-module while a total of 622
persons visited the platform.
Project WAVE (Working Against Violence
through Education)
This project is aimed at combating gender
based violence (GBV) and child abuse through
education and awareness creation in the
context of increasing numbers of reported
incidents in this regard. Since project launch
in 2014, awareness sessions have been
conducted across all sectors of the John Keells
Group, covering almost all staff as at 31 March
2017 (11,456 persons). External awareness
sessions were conducted sensitising 225
lawyers and 793 police officers in the reporting
year.
In addition, the following initiatives were
introduced during the year:
• A public awareness campaign against
sexual harassment targeting commuters
of public transport, in commemoration of
the International Day for the Elimination of
Violence Against Women. 124 John Keells
volunteers actively participated in the
campaign carried out at four of the busiest
bus depots in Colombo. 2,300 stickers (in
Sinhala and Tamil) were pasted inside 1,150
buses as well as depot precincts while
30,000 information cards were distributed
throughout the day, estimated to impact
over 100,000 persons. 150 stickers were
also provided to trishaw drivers for display.
The campaign received encouraging
support of the Sri Lanka Transport Board,
the Western Province Provincial Road
Passenger Transport Authority as well as
bus drivers, conductors and commuters.
Parallel to the public campaign, an internal
campaign involving awareness posters, a
staff pledge board and pinning of the white
ribbon was undertaken across the Group
as a demonstration of staff commitment to
building a workplace free of harassment.
• A two day workshop on gender
sensitisation and communication skills
was conducted in collaboration with The
Asia Foundation for police officers in
Mullaitivu SSP Division towards enhancing
their response towards sensitive issues
concerning women and children. Police
officers who participated in the programme
will be guided towards conducting
community outreach programmes on
gender sensitivity towards building
rapport, confidence and trust between the
community and the police.
• A five year plan for Project WAVE was
developed incorporating planned and
potential key activities under 4 pillars
comprising of Prevention, Capacity
building, Interventions and Campaigning.
Village Adoption
This flagship initiative of John Keells
Foundation is aimed at poverty alleviation
at grass root level through an integrated
and sustainable development programme.
Initiatives are decided upon through
constructive dialogue with all the relevant
stakeholders, translating into a range of
development activities generally spanning
5-10 years towards fostering the spirit
of independence, self-reliance and
entrepreneurship. Currently, 3 villages are
in development including Iranaipalai and
Puthumathalan in Mullaitivu District and
Morawewa North in Trincomalee District.
Below are some of the key activities carried
out during the reporting year:
• Livelihood Development: Three workshops
on cattle rearing, family empowerment
and youth empowerment were conducted
towards enhancing skills for diversified
livelihood and income generation
opportunities.
• Education: Construction of a new school
building in Iranaipalai and revision classes
for public examinations, benefiting an
estimated 844 students.
• Infrastructure Development: Rehabilitation
work on ‘D8’ Tank in Morawewa was
completed while the construction
of a fisheries community centre in
Puthumathalan was initiated for the benefit
of approximately 1,300 persons.
HIV and AIDS awareness session conducted at the Kurunegala Army camp
Many of the bus drivers and conductors
were very supportive towards our
campaign. They said harassment on
buses is very common. I believe this is
a very valuable awareness campaign
that was not only meaningful but
fun to be a part of - Husnun Nazeeyl,
Management Trainee, John Keells
Holdings

81Group Highlights | Governance | Management Discussion & Analysis | Financial Statements | Supplementary Information
• Gender Empowerment: A leadership and
team building workshop was conducted for
women in Morawewa towards promoting
peace, unity and entrepreneurial skills
within the community.
• Further interventions will be decided
following a needs assessment
commissioned via World Vision.
Meanwhile, an impact assessment was
commissioned via the Centre for Poverty
Analysis (CEPA), following the closure of
the Foundation’s development activities in
Halmillewa, its first adopted village, in the
Anuradhapura District, after more than a
decade’s engagement with the transfer
of total responsibility for the village to the
villagers. CEPA commended the Foundation’s
vision, courage and efforts in undertaking this
very ambitious project amidst a challenging
environment, where JKF used a bottom-up
approach and was able to develop rapport
and trust with the villagers which made this
intervention a very successful initiative.
Safe Drinking Water Initiatives
The following two key projects aimed at
providing access to safe drinking water were
undertaken in the reporting year:
• Collaboration with the National Water
Supply and Drainage Board (NWSDB)
to address Chronic Kidney Disease
(CKD) - Continuing the success of the pilot
project in Trincomalee District to provide
two Reverse Osmosis (RO) filtration
systems enabling access to good quality
water for drinking and cooking purposes
in areas known to be at risk of CKD,
the Foundation released funding for
two more RO filtration systems in the
Anuradhapura district.
• United Nations Global Compact (UNGC)’s
Water Stewardship - The pilot project
to provide equitable access to safe
drinking water in the Badulla District
was completed during the reporting year,
which is estimated to directly benefit
approximately 1,100 persons, including 4
schools.
Kala Pola and Digital Art Gallery
John Keells believes in safeguarding and
promoting the cultural heritage of Sri Lanka
through increased engagement in, and
exposure to the arts, whilst also boosting
livelihood opportunities of artists.
Kala Pola, an open air art fair, enabling artists
and sculptors from across the country to
showcase and sell their art, was successfully
conducted for the 24th year, with the
participation of 327 registered artists and an
estimated 22,115 visitors, generating over
Rs.12 million in estimated sales revenue. 145
child artists participated in the Children’s Art
Corner at the event.
The Foundation continued to maintain and
enhance the “Sri Lankan Art Gallery”, a free
digital online gallery established as a means
for visual artists to showcase and market
their creations throughout the year. Currently
the website has registered over 813 artists
with over 1,300 artwork pieces on display.
During the reporting year, approximately
24,000 visitors visited the site.
Flood Relief
In the wake of the severe floods and landslides
in several parts of the country in May 2016,
destroying homes and displacing thousands,
the John Keells Group provided immediate
relief by funding 8,000 relief packs through
the Sirasa Shakthi John Keells Sahana
Yathra. Over 250 John Keells volunteers
were mobilised throughout a 24-hour period
to sort and pack relief items, while staff of
Group businesses located in affected areas
were involved in distribution of relief items
estimated to benefit over 86,000 persons.
The Group also undertook a mass well-
cleaning programme towards facilitating
the resettlement of affected persons in
the Colombo and Gampaha districts in
collaboration with Sri Lanka Red Cross
Society, Jinasena Private Limited and Ceylon
Cold Stores PLC. 1,252 wells were cleaned
under this initiative.
Visitors purchasing a painting at Kala Pola
Community members gather round for their first collection of water from the Reverse Osmosis Plant donated by JKF

82 John Keells Holdings PLC | Annual Report 2016/17
Group Consolidated Review
CAPITAL MANAGEMENT REVIEW
Intellectual Capital ReviewThe Group strongly believes that Intellectual
Capital is a vital source of competitive
advantage, which, in the long term, will
result in a value premium for JKH through
innovation and disruption of business models,
ultimately serving the needs of an evolving
and emerging consumer. Where possible and
relevant, the Group strives to dynamically
manage its Intellectual Capital, interweaving
it to the Group’s strategic management
process. Following are the key components
of the Group’s Intellectual Capital. Refer to the
Industry Group Analysis section of the Report
for further details.
Whilst the Group undertakes research and
development at the business unit level,
John Keells Research (JKR), the research
and development arm of the Group,
was established in an attempt to create
sustainable value through innovation to
enhance the Intellectual Capital base of the
Group. JKR's collaborative research project
with the Human Genetics Unit of the University
of Colombo is in its final phase. Further, the
article titled "Whole genome sequencing and
analysis of Godawee, a salt tolerant indica rice
variety", which was reported in the previous
Annual Report, was accepted and published
in the Journal of Rice Research.
The year under review marked a significant
milestone for JKR as it filed for its first
patent for a novel energy source material
that was developed through a research
project undertaken in collaboration with the
National Metallurgical Lab of the Council for
Scientific and Industrial Research (CSIR-NML)
in India. The patent application which was
filed at the Indian patent office in December
2016 is related to a composite nanomaterial
which could be used in energy storage.
Biocompatibility and low cost per unit of power
stored are the advantages of the material.
JKR is currently in the process of building
prototypes of energy storage devices which
utilises the patented technology to enhance
the Technology Readiness Level (TRL) of
the intellectual property and to examine the
commercial viability of a prototype product.
During the year under review, JKR relocated
to the Technology Incubation Centre at the
Nanotechnology and Science Park in Pitipana,
Homagama, comprising of an in-house
laboratory providing access to sophisticated
equipment and analytical services to ensure
sole ownership of intellectual property by
JKH. The relocation to the Science Park is
expected to provide greater opportunities for
technical collaboration, while contributing
towards creating and nurturing an ecosystem
of innovation. JKR currently collaborates with
leading universities and research institutes in
Sri Lanka and also has projects with a leading
research institute in India and a university in
the United States.
The Group is home to many brands which
have gained recognition in their respective
spheres over many years. The range of
brands under each of the industry groups are
depicted in the Organisational Structure of
this Report. In addition to routine strategies
executed by each of the businesses to
strengthen their respective brands, the
Leisure industry group has placed significant
emphasis on systematically executing the
“Cinnamon” brand strategy. The “Cinnamon”
brand development initiative was continued
in the year under review as an ongoing effort
to create value and brand equity through the
hosting of signature events. Several brand
development initiatives were pioneered in
the operational year to create and enhance
opportunities and offerings to our diverse
stake holders, in keeping with the changing
dynamics and ever evolving trends of the
travel and leisure industry.
During the year under review, the Group
continued to identify emerging or current
disruptive business innovations, focused
on developing the digital quotient (DQ) of
individuals and businesses. This is believed
to increase the productivity and efficiency of
businesses through the employment of digital
technologies and disruptive business models,
which in turn would create sustainable value
to stakeholders. To this end, an award on
Disruptive Innovation was introduced at the
JKH Chairman’s Awards 2016, to recognise
businesses that have made disruptive
innovation an integral part of the organisation
and formulated successful responses to
emerging or current business disruption. In
addition, the Group launched “John Keells X -
Open Innovation Challenge 2016” to create a
conducive ecosystem for young entrepreneurs
to thrive and encourage businesses at JKH to
engage in open innovation. The inaugural JKX
challenge was well received where a total of
148 applications were received with ten of
these applicants being shortlisted for the final
pitch. Considering the success of the inaugural
challenge, the second open innovation
challenge will be launched in May 2017.
While concluding the Group Capital
Management Review, the ensuing sections
will discuss the overall strategy and outlook
for the Group, followed by a materiality and
risk management discussion.
The newly established laboratory of John Keells Research
The year under review marked
a significant milestone for JKR
as it filed for its first patent for
a novel energy source material
that was developed through a
research project undertaken in
collaboration with the National
Metallurgical Lab of the Council for
Scientific and Industrial Research
(CSIR-NML) in India.

83Group Highlights | Governance | Management Discussion & Analysis | Financial Statements | Supplementary Information
Following is a discussion on the economic
outlook for Sri Lanka in the short to
medium term, the high level impacts to our
businesses and the overall business strategy
of the Group. For a detailed discussion on the
strategy and outlook for each industry group,
refer the Industry Group Review section of
this Report.
The acceleration in global growth and the
resultant increase in global interest rates
could have diverse effects on the Sri Lankan
economy. The increase in oil prices, as well
as prices of other commodities, will weigh
negatively in aggregate on the Balance of
Payments (BOP) and domestic price indices,
while stagnant growth in the Middle East
could reduce income from tea exports and
remittances by migrant workers.
The Sri Lankan economy is projected to
continue its current growth momentum in
2017, driven by expansion in the Industry and
Services sectors, with growth in sub sectors
such as construction, utilities, wholesale and
retail trade involving SMEs, financial services,
accommodation and food and beverage
services and housing expected to spearhead
economic expansion. The continuation of
the prevailing drought conditions in the
country, delays and the lack of decisive policy
implementation, developments externally in
the global economy due to Brexit, volatility
in oil prices and the after effects of the US
election are headwinds that the private
sector will have to navigate in the short
term. The higher value added tax (VAT) rate
introduced in November 2016, the increase in
interest rates and inflation, and the increased
emphasis on improving tax collection for
2017 is likely to result in a moderation in
consumer discretionary spending compared
to the previous years. Whilst such short term
moderations in growth and consumption are
expected, given the challenges in balancing
fiscal adjustments and growth oriented
policies, the long term benefits will establish
a favourable and sustainable disposition for
the overall economy.
The re-commencement of large scale
infrastructure projects such as the Port
City Colombo and continued investments
in infrastructure including expansion of the
country’s network of expressways have
spurred economic activity. The execution of
proposed Free Trade Agreements as well
as planned development activities such as
the development of the Hambantota Port,
the Western Region Megapolis Planning
Project and development of industrial zones
in Hambantota, Trincomalee and the North
Western Province will provide fresh impetus
to the private sector.
The Government has stated an interest in
exiting non-core public owned interests to
enable private sector driven investments,
both directly and through public-private
partnerships. Although no firm steps have
been taken in this regard, this should augur
well for the private sector, in general, and for
our Group, in particular.
Sri Lanka entered into an Extended Fund
Facility with the International Monetary
Fund (IMF-EFF) in order to support the
BOP and the Government’s reform agenda.
Further, the external current account deficit
is expected to improve steadily with the
projected developments in the external
sector. An improvement in exports is
projected to emanate in the medium term
from higher export oriented domestic
production supported through improved
trade linkages, including the reinstating of
GSP Plus concessions, and proposed free
trade and economic partnership agreements.
Whilst the Government’s efforts, with the
support of the IMF, to formulate policy
frameworks to address the emerging
challenges are commendable, it is essential
that such policies are implemented swiftly
and in consultation with key stakeholders.
The higher dependency on imports of
petroleum products for electricity generation
amid severe drought conditions and an
environment of volatile prices in oil can pose
challenges in narrowing the trade deficit.
The pressure on the exchange rate is
expected to continue in the short term
due to the substantial increase in import
expenditure, prevailing trade deficit and
contracting earnings from merchandise
exports with the drop in both international
commodity prices and export volumes.
However, the pressure on the Rupee is
expected to ease through the Government’s
proposed fiscal framework which is
embedded in the IMF-EFF arrangement,
aimed at strengthening fiscal sustainability
in the medium term. Further, the conclusion
of a 10 year sovereign bond in April 2017,
raising USD 1.50 billion, underscores investor
confidence in Sri Lanka and their positive
outlook on overall growth prospects for the
country. Whilst, the depreciation of the Rupee
negatively impacted businesses with higher
reliance on imported inputs, the Group also
benefitted through its individual subsidiaries
which have direct and indirect Dollar
denominated income streams, in addition to
the positive impact due to its foreign currency
denominated cash holdings. The Group’s risk
strategy of maintaining “natural hedges”,
where relevant and feasible, will mitigate
to a great extent, the volatility arising from
possible fluctuations in the exchange rate.
The Consumer Foods sector will continue to
focus on expanding its portfolio, remaining
relevant to its consumers by understanding
evolving consumer trends and needs. Whilst
the moderation of consumer spending
witnessed in the fourth quarter of 2016/17
is likely to continue in the short term given
the Government’s fiscal consolidation
efforts and prevailing inflationary pressures,
the long term growth potential for the
business remains strong considering the
low penetration levels in the country. Taking
into account the strong growth in the
previous year, and the anticipated growth
in the ensuing years, the Consumer Foods
sector has commissioned sizeable capacity
enhancements which are expected to come
into effect in due course. These expansions,
coupled with the enhancements in the dealer
management systems, are expected to create
a platform for growth through the increase in
production capacity and widened portfolio
offering to consumers and, provide more real
time information which will result in increased
productivity and efficiency of operations. The
Group’s Retail sector will capitalise on the low
penetration of modern retail in the country,
Group Consolidated ReviewOUTLOOK
Taking into account the strong growth in the previous year, and the
anticipated growth in the ensuing years, the Consumer Foods sector has
commissioned sizeable capacity enhancements which are expected to
come into effect in due course.

84 John Keells Holdings PLC | Annual Report 2016/17
Group Consolidated Review
OUTLOOK
by strategically expanding its retail footprint.
The business continues to seek opportunities
in strategically placed locations to go well
beyond the 15 stores opened in 2016/17,
with an even more aggressive roll out plan
over the next few years. Towards this end,
the sector will be commissioning a state-
of-the-art centralised distribution centre to
maximise on operational efficiencies and to
further improve productivity of the business
whilst also enhancing the offering to its
customers.
The Leisure industry group is well positioned
to capitalise on the growth momentum of
tourist arrivals to the country under the
umbrella of the “Cinnamon” brand. The
encouraging growth momentum of arrivals
is expected to continue given the favourable
fundamentals of the tourism offering in Sri
Lanka, such as diverse experiences within
close proximity, increasing awareness of the
destination, stability in the country, increasing
flight connectivity and gradually improving
tourism infrastructure. The Leisure industry
group will continue to evaluate expansion
opportunities to complete the round trip
offering of its portfolio of hotel. However,
the Group is mindful of the return profile of
hospitality investments and the resultant
impact to the overall returns of the Group
portfolio. To this end, asset light expansion
models will synergise well to manage the
effective capital deployed in the industry
group whilst increasing its room inventory
under management. The Leisure industry
group will continue to harness the benefits of
the branding initiative which was undertaken
in the previous years for a more effective
management of room inventory, yield
management, enhanced guest experiences
and in deriving synergies on common costs
which lend themselves to centralisation.
Further, in the medium to long term, the
opportunity of the Meetings, Incentives,
Conferences and Exhibitions (MICE) market,
particularly from India, will enable the Group
to attract the high spending segment of
tourists which Sri Lanka has hitherto been
unable to satisfy. To this end, “Cinnamon Life”
is uniquely placed to cater to the emerging
requirements of the contemporary tourist
and the increasing MICE traffic, positioning
Colombo as a hub for business and leisure
travel.
Given the strategic location of the country and
the inherent advantage Sri Lanka possesses
as a maritime hub, the Ports, Logistics and
Bunkering businesses are expected to benefit
from the increase in traffic with further
infrastructure expected to support this traffic.
It is pertinent to note that the overall capacity
utilisation of the Port of Colombo is in excess
of 70 per cent within a relatively short
time span since the commissioning of the
South Container Terminal. Given the strong
potential and need for capacity led growth
in the Port of Colombo, the Transportation
industry group will continue to evaluate
opportunities, particularly considering any
developments based on the Government’s
interests in private-public partnerships, such
as with the East Container Terminal of the
Port of Colombo and bunkering and related
services at Hambantota.
In line with Sri Lanka progressing towards an
upper middle income country with growing
urbanisation rates, the Property industry
group will continue to identify unique product
propositions within the residential and
commercial property market, leveraging
on the Group’s sizeable land bank and its
reputation as a leading developer which
also creates opportunities in entering into
partnerships with independent land owners.
The Group is cognizant of the fact that revenue
recognition in the Property industry group
has demonstrated a volatile trend based on
the projects completed, and as discussed
in the Property industry group review, the
business is taking steps to develop a more
robust pipeline of projects.
The Insurance business will continue to
capitalise on the opportunities made available
by the significantly low life insurance
penetration levels within the country,
leveraging on its strong brand presence,
cost efficient processes and differentiated
offerings. Nations Trust Bank, although
facing challenges with the narrowing of net
interest margins, will continue to focus on
initiatives in relation to customer centricity,
and incorporate more technology platforms
and solutions for its customers. The Bank
will also focus on continuing to increase its
market share in the SME sector.
In the year under review, the Group embarked
on a target setting process for key material
impacts such as carbon and water, against
baseline figures. The targets were based
on systematic audits, assessments and
benchmarking carried out for industry groups
such as Leisure and CF&R which contribute
significantly to the Group’s total energy and
water usage. The Group will continue to
strive to outperform selected international
benchmarks for carbon foot prints, energy
consumption and water usage, whilst also
seeking to improve its own performance on
the said aspects.
The Group will also continue to integrate
its risk management process with its
sustainability strategy through consistent
tracking and reporting of key risk indicators
on areas such as green-house gas emissions,
talent attrition, third party claims, non-
compliance and stakeholder concerns
with regards to the Group’s operations.
While maintaining the robust sustainability
performance management framework,
the Group will also work to ensure that
sustainability and risk management
practices are further entrenched across its
significant value chain partners through
the implementation of responsible sourcing
practices, where practical and relevant.
The Leisure industry group is well positioned to capitalise on the
growth momentum of tourist arrivals to the country under the umbrella
of the “Cinnamon” brand. The encouraging growth momentum of
arrivals is expected to continue given the favourable fundamentals of
the tourism offering in Sri Lanka, such as diverse experiences within
close proximity, increasing awareness of the destination, stability in the
country, increasing flight connectivity and gradually improving tourism
infrastructure.

85
This exercise entails the following key
aspects, among others.
• Progress and deviation report of the
strategies formed in the prior year and
current year
• Competitor analysis and competitive
positioning
• Analysis of key risks and opportunities
• Talent Management
• Management of stakeholders such as
suppliers and customers
• Key sustainability related initiatives
• Disruptive innovation and digitisation
initiatives
• Value enhancement through initiatives
centred on the various forms of Capital
under an integrated reporting framework
The strategies of the various business units
operating in diverse industries and markets
will always revolve around the Group’s
strategy, while considering their domain
specific factors. The prime focus always is to
enhance value for all stakeholders.
When allocating funds for various
investments, the project evaluation model,
discussed in detail in the ensuing sections,
strives to strike a balance between optimising
immediate portfolio returns and preserving
medium to long term growth objectives,
whilst ensuring investments will be EPS
accretive in the long term.
The Strategy, Resource Allocation and
Portfolio Management section of this Annual
Report is aimed at providing the stakeholders
of the Group with an insightful view of the
manner in which decisions pertaining to
investments of the Group are made.
As such, the ensuing pages will explain in
detail, the following aspects:
• Strategy of the Group
• Resource allocation and portfolio
management
• Portfolio movements
StrategyThe Group’s vision of “Building businesses that
are leaders in the region” is the cornerstone
of all resource allocation, portfolio evaluation
and operational decisions of the business
units. In pursuing its vision, the Group is
mindful of the governing principles which
form the foundation of all strategies and
initiatives that have been planned, are being
implemented, or have been implemented,
towards achieving the medium to long term
objectives of the Group. These principles are
primarily: a stakeholder focused business
model; a corporate governance philosophy
which emphasises performance, in addition
to compliance and conformance; a risk
identification process and management
philosophy based on a sound enterprise risk
management framework, and a sustainability
development framework which are all in line
with international best practices.
As evident from the past, the Group strives
to constantly align its portfolio of businesses
with the growth sectors of the economy,
both current and futuristic, and continuously
endeavours to ensure that capital resources
are efficiently employed in a manner that
will expand the reach of the portfolio, ensure
relevance and give the ability to compete
at the relevant levels, both globally and
internationally. The Consumer Foods and
Retail, Financial Services, Leisure, Property
and Transportation industry groups are all
poised to grow in the medium to long term
in a local economic environment which is
expected to be progressive, and, in the region,
where we have accumulated competence in
the relevant industry.
The Group’s ambitions are facilitated by an
Operating Model where each business unit
is granted operational autonomy within a
framework of delegated decision rights
The Group’s vision of “Building businesses that are leaders in the region”
is the cornerstone of all resource allocation, portfolio evaluation and
operational decisions of the business units. In pursuing its vision, the
Group is mindful of the governing principles which form the foundation
of all strategies and initiatives that have been planned, are being
implemented, or have been implemented, towards achieving the medium
to long term objectives of the Group.
The strategies of the various business units operating in diverse
industries and markets will always revolve around the Group’s strategy,
while considering their domain specific factors. The prime focus always
is to enhance value for all stakeholders.
Group Consolidated Review
approved by the Group Executive Committee
or Board of Directors, as applicable,
in ensuring speed of decision making,
accountability and agility in responding to
the needs of the market. Given the diversity
and scale of the Group, and the multiple
management layers within it, the agendas,
scope and role of these committees and their
positions are carefully structured to ensure
the efficient flow of information, ethical and
responsible implementation of strategic
initiatives, minimisation of duplication of
effort, and adherence to the Group’s values.
The Group Executive Committee, which gets
its high level direction from the Board and
has a macro focus of the overall direction
of the Group, is accountable for the overall
performance of varied businesses/industry
groups/sectors, and acts as an enabler of the
Operating Model of the Group. The support
functions at the Centre complement and
assist the businesses through a common pool
of knowledge, if and when required. These
knowledge centres are able to complement
the business units, as required from time to
time, and are an effective synergising force
across the Group. Thus, the Operating Model
of the Group is designed to create a value
premium, where the Group, as a whole,
creates more value to JKH stakeholders than
the sum of each business taken individually.
Strategy mapping exercises concentrating on
the short, medium and long term aspirations
of each business, are conducted annually
and are reviewed at a minimum, quarterly/
bi-annually, or as and when a situation so
demands.
STRATEGY, RESOURCE ALLOCATION, AND PORTFOLIO MANAGEMENT
Group Highlights | Governance | Management Discussion & Analysis | Financial Statements | Supplementary Information

86 John Keells Holdings PLC | Annual Report 2016/17
Similar to the previous year, the Group
continued to encourage all businesses to
engage in “disruptive innovation” challenging
the traditional ways of doing business by
utilising current and emerging technology. As
a result, several business units and functions
within the Group have conceptualised and
implemented digitally enabled workflow
and process optimisation solutions into their
key business processes, with the goals of
enhancing the customer experience, internal
productivity and organisational efficiency.
Further details on the strategy formulation
and decision making process can be
found under the Corporate Governance
Commentary of this Report. Group-wide
strategies are discussed in detail under the
Strategy and Outlook section of each of the
industry group reviews.
Resource Allocation and Portfolio
Management Resource allocation and portfolio
management is an imperative action in
creating value to all stakeholders through
an evaluation of the Group’s fundamentals,
which are centred on the forms of Capital.
Whilst the Group is frequently presented
with opportunities in diverse industries, it
continues to follow its structured four-step
methodology indicated below in evaluating,
and managing its portfolio.
Regular Assessment of Risk and Reward
All verticals and businesses within each
industry group are regularly assessed on key
dimensions such as customer orientation
and bargaining power, supplier concentration
and power, JV partner affiliations and
dependence, cyclicality, regulatory structure,
performance against the industry and the Sri
Lankan economy, and economic, procedural,
through the use of a project specific cost of
debt and a foreign currency denominated
equity return benchmark commensurate
with the investment, which in turn, would be
comparatively analysed against projects with
similar risk profiles.
Conceptualising Portfolio Performance
The Group aims to strike a balance between
optimising immediate portfolio returns
against returns in the future. As such,
emphasis is placed on both return generating
capabilities of the business against its capital
employed, and the earnings potential of the
business or project. The Group is conscious
of the quantum of capital deployed to
businesses, and to this end, places a strong
emphasis on evaluating projects in such
manner which optimises capital efficiency,
especially in capital intensive businesses
such as Leisure. In order to manage the
effective quantum of capital deployed, the
Group will continue to explore investment
structuring options such as asset-light
investment models for future hotel projects.
Being a portfolio of businesses, the Group has
benefitted from contributions from different
businesses at varying points of time based
on their growth cycle and correlation with
overall economic growth in the country. Over
the last few years the Group has witnessed a
shift in the composition of its earnings with
a greater contribution from higher ROCE
earning industry groups such as Consumer
Foods and Retail, and Financial Services.
The conscious and planned strategies of
driving growth in these industry groups will,
all things being equal, contribute towards
an improvement in the ROCE for the Group,
whilst concurrently driving absolute earnings
growth.
regulatory or technological factors that
obstruct or restrict operations, entry or exit
of both the unit and competitors, et cetera.
The capital structures for new ventures are
stress tested under varied scenarios, which
often leads to taking proactive measures,
particularly in managing potential risks,
especially those relating to foreign exchange
and taxation during both the development
and operating phases. Further, ongoing
projects are regularly tested and evaluated
in partnership with independent and
recognised parties to ensure clear, impartial
judgement on matters relating to capital
structure, economic implications and other
key operating risks.
JKH’s Hurdle Rate/Required Rate of
Return
The present hurdle rate of JKH is at 15 per
cent, which is a function of the weighted
average cost of capital (WACC). The WACC is
derived from the Group’s cost of equity, cost
of debt, target capital structure, tax rates, and
the value creation premium required over
and above the WACC. Whilst the cost of debt
has increased towards the end of the period
under review, the hurdle rate has not been
revised on the basis that it is a long term
target, and any revision would be warranted
only if the above factors are expected to
sustain over the long term.
Even though this hurdle rate is utilised as the
initial benchmark rate in evaluating feasibility
and opportunity in all projects of the Group,
project specific modifiers are also used in
order to get a holistic view of the project under
consideration. As such, a country specific risk
modifier would be applied for investments
with a high proportion of foreign currency
investment costs and operational cash flows,
Fin
an
cia
l fi
lte
r
Cornerstone of the
decision criteria based
on the JKH hurdle rate
Gro
wth
fil
ter
Evaluates the industry
attractiveness and
growth potential based
on the industry lifecycle
Str
ate
gic
fit
Evaluates the long term
competitive advantage
of a business/industry
by closely evaluating
the competitive forces,
specific industry/
business risks, ability to
control value drivers and
the competencies and
critical success factors
inherent to the Group
Co
mp
lexi
ty f
ilte
r
Considers factors such
as senior management
time and the risk to
brand image and
reputation in conjunction
with the anticipated
returns
Group Consolidated Review
STRATEGY, RESOURCE ALLOCATION, AND PORTFOLIO MANAGEMENT

87Group Highlights | Governance | Management Discussion & Analysis | Financial Statements | Supplementary Information
Modifier II - Adjustment for investment
property and revaluations
Properties which have been re-rated in
keeping with the principle of fair value
accounting have been adjusted for the
preceding three years in order to obtain a
clear and un-skewed view of the ROCE. The
need for such a modifier is exacerbated as
a result of the significant increase in the
value of land in the recent few years, where
monetisation of such properties would have
a time lag.
Further to the discussion in the Group
Consolidated Review section of this Report,
the ensuing section discusses the return
on capital employed (ROCE) under two key
modifiers.
Modifier I - Adjustment for land re-allocations
Properties that are not under the operational
banner of the non-property related business
units, and are excess to their current and
foreseeable operational requirements, have
been allocated to the Property industry
group along with the corresponding income.
However, it is noted that real estate belonging
to the Sri Lankan Resorts segment is excluded
as such properties constitute the land bank of
the segment for future hotel developments.
The properties re-allocated will be a part of
a “property play” and plans for development
and operation are the responsibility of the
Property industry group. “Cinnamon Life” is
recognised as a stand-alone play.
2016/17 2015/16 2014/15
Unadjusted ROCE
(%)
ROCE after modifier
I (%)
ROCE after modifier
I and II (%)
ROCE after modifier
I and II (%)
ROCE after modifier
I and II (%)
Hotel Management 129.4 129.4 129.4 91.0 76.6
City Hotels 8.5 8.9 11.5 10.2 11.6
Sri Lankan Resorts 8.6 8.6 9.3 8.1 8.5
Destination Management 25.0 25.0 25.0 46.2 46.2
Maldivian Resorts 8.8 8.8 8.8 9.6 9.6
Transportation 19.2 19.2 19.3 16.3 16.4
Consumer Foods 59.2 60.6 61.7 65.0 77.5
Retail 63.5 63.5 64.2 61.8 61.9
Financial Services 28.0 28.0 28.2 24.5 24.5
Property (Excl. Cinnamon Life) 12.5 10.3 7.5 19.4 13.1
Cinnamon Life (0.1) (0.1) (0.1) (0.2) (0.2)
Information Technology 26.9 26.9 26.9 6.8 6.8
Plantation Services 14.3 15.4 13.7 0.8 1.5
The adjusted ROCE following the two modifiers is graphically depicted below. Key highlights of the graph are discussed in the ensuing section.
Adjusted
ROCE (%)
Adjusted effective average capital employed(Rs. Bn)
Hotel Management - 129.4
Destination
Management - 25.0
Consumer Foods - 61.7
Retail - 64.2
Property
(Excl. Cinnamon Life) - 7.5
Information Technology - 26.9
Hurdle rate - 15.0
Plantation
Services - 13.7
Financial Services - 28.2
SL Resorts - 9.3 MaldivianResorts - 8.8
Transportation - 19.3
City Hotels - 11.5
Cinnamon Life - (0.1)
(20)
0
10 20 30 40 50 60 70 80 90 100
20
40
60
80
100
120
140

88 John Keells Holdings PLC | Annual Report 2016/17
During the year under review, the adjusted
ROCE of the City Hotels increased to 11.5
per cent, compared to 10.2 per cent for the
previous year. The sector’s performance
was driven by higher Average Room Rates
(ARR) and improved occupancy levels. The
previous year’s profitability was impacted by
the partial closure of Cinnamon Lakeside. The
Sri Lankan resorts segment also recorded
a growth in ARRs, and thus recorded an
improvement in adjusted ROCE at 9.3
per cent compared to 8.1 per cent for the
previous year.
It is pertinent that, as part of its future
expansion plans, the asset base of the Sri
Lankan Resorts segment includes a large
land bank earmarked for development of
hotel properties. While monetisation of
these properties in the future will be based
on development potential, their effects on
the capital base due to re-rating have been
adjusted for, as mentioned above under the
“Modifier II” section. For further details on
the land bank refer the Group Real Estate
Portfolio section of this Report.
Given its service oriented disposition, the
Hotel Management sector and the Destination
Management sector continued to record
ROCEs well above the hurdle rate. The Hotel
Management sector witnessed an increase in
its adjusted ROCE to 129.4 per cent [2015/16:
91.0 per cent], primarily due to a decline in
the capital base.
The strong long term growth prospects for
tourism in the country present the Leisure
industry group with expansion opportunities,
which the Group intends to capitalise on
through an asset light expansion model. It is
envisaged that this would result in an optimal
deployment of capital that is accretive to
Group portfolio returns.
The Destination Management sector on the
other hand, witnessed a decline in its ROCE
to 25.0 per cent [2015/16: 46.2 per cent],
which is attributable to a reduction in its
EBIT due to increasing competition in the
industry. Consequently, EBIT margins came
under pressure, and declined to 6.0 per cent
compared to 9.0 per cent for the previous
year.
The Maldivian Resorts segment has been
included in the aforementioned graph and
the ROCE analysis, to ensure capturing of all
sectors/industry groups. However, it should
properties that are not under the operational
banner of the non-property related business
units, and are excess to its current and
foreseeable operational needs, have been
included under this segment. Despite the re-
rating of the properties under this segment,
the Group is of the view that there is a lag
effect in returns adjusting for the increased
capital base of such properties and thus,
warrants it impossible to employ such
properties in immediate return generating
projects. Hence such revaluations, as defined
under “modifier 2”, have been adjusted
for in calculating the adjusted ROCE. The
Group is cognizant of the fact that revenue
recognition in the Property industry group
has demonstrated a volatile trend based on
the projects completed, and as discussed
in the Property industry group review, the
business is taking steps to develop a more
robust pipeline of projects.
Unlike the analysis done on adjusted ROCE
under the Group Consolidated Review section
of the Report, debt and equity infused in to
“Cinnamon Life” have not been adjusted, as
the project is separately evaluated in the
ensuing section.
During the year, Rs.4.34 billion of cash equity
and Rs.1.22 billion of debt was infused to
"Cinnamon Life" to finance the development
costs of the project. As at 31 March 2017, the
cumulative figures stood at Rs.15.00 billion
and Rs.12.37 billion for cash equity and debt
respectively. The aforementioned cash equity
investment at “Cinnamon Life” excludes the
land transferred by JKH and its subsidiaries.
Note that all project related costs, unless
explicitly mentioned as above, are capitalised
in accordance with Sri Lanka Accounting
Standards (SLFRS/LKAS). Additionally, it
is highlighted that the revenue from the
“Cinnamon Life” project will only be recognised
post the commencement of operations.
The Consumer Foods sector recorded a
decrease in the adjusted ROCE to 61.7 per
cent from 65.0 per cent in the previous year.
be noted that the return generated from
the Maldivian Resorts segment should be
appraised against a return of a comparable
dollar financed asset as opposed to the
Group rupee hurdle rate of 15 per cent which
is based on the rupee risk free rate. As shown
above, the return of the segment declined to
8.8 per cent [2015/16: 9.6 per cent], which
can be attributed to an increase in the capital
base due to the extension of the head lease of
Cinnamon Dhonveli Maldives.
The adjusted ROCE of the Transportation
segment increased to 19.3 per cent from 16.3
per cent in the previous year. This increase
stemmed from a growth in EBIT, which
outstripped growth in capital employed,
primarily due to improved operational
performances of the businesses, as
discussed under the Transportation industry
group review.
The Property industry group, excluding
“Cinnamon Life”, witnessed a decline in
adjusted ROCE to 7.5 per cent [2015/16:
19.4 per cent], mainly attributable to the
revenue recognition cycle of its residential
apartments. During the year under review,
the Property industry group’s revenue
primarily comprised of rental income from its
shopping malls. This is in contrast to previous
years where a significant portion of revenue
comprised of income from apartment
sales. As defined above under “modifier 1”,
Group Consolidated Review
STRATEGY, RESOURCE ALLOCATION, AND PORTFOLIO MANAGEMENT
The Group is cognizant of the
fact that revenue recognition in
the Property industry group has
demonstrated a volatile trend
based on the projects completed,
and as discussed in the Property
industry group review, the
business is taking steps to develop
a more robust pipeline of projects.
The strong long term growth prospects for tourism in the country
present the Leisure industry group with expansion opportunities, which
the Group intends to capitalise on through an asset light expansion
model. It is envisaged that this would result in an optimal deployment of
capital that is accretive to Group portfolio returns.

89Group Highlights | Governance | Management Discussion & Analysis | Financial Statements | Supplementary Information
a significant increase in sales volumes of
mobile phones. Operational efficiencies in the
BPO business also contributed towards the
improved profitability of the industry group.
The adjusted ROCE of the Plantations
Services sector increased to 13.7 per cent
compared to 0.8 per cent recorded in the
previous financial year. This marked increase
is attributed to an increase in EBIT on account
of higher prices due to a tighter supply of
leaf tea, as crop yields declined due to the
unfavourable weather conditions prevailing
in the country.
This decrease is attributable to an expansion
in the capital base as a result of borrowings
undertaken to fund new investments, such
as the new ice cream manufacturing facility.
The growth in the capital base was partially
off-set by the increase in profitability driven
by double digit volume growth and changes
made to the sales mix which positively
impacted profit margins.
The Retail sector continued its strong growth
trajectory with a significant increase in
profitability owing to higher overall footfall,
coupled with incremental turnover from
newly opened outlets. As such, the adjusted
ROCE increased to 64.2 per cent [2015/16:
61.8 per cent] despite an increase in capital
employed resulting from the opening of
fifteen new outlets during the year.
The Financial Services sector recorded an
adjusted ROCE of 28.2 per cent compared
to 24.5 per cent recorded in the previous
financial year. The increase in the ratio is
partly stemming from the decline in the
average capital base of the industry group
attributable to the UA share repurchase
which took place in September 2015.
The adjusted ROCE of the Information
Technology industry group increased to 26.9
per cent [2015/16: 6.8 per cent] primarily
stemming from the performance of the
Office Automation business, which witnessed
Portfolio Movements Portfolio movements over the past five years are illustrated in the graph below.
Capital employed
(Rs. Bn)
2012/13 2013/14 2014/15 2015/16 2016/17
Transportation Leisure Property Consumer Foods
and Retail
Financial
Services
Information
Technology
Other including
Plantation Services
-
50
100
150
200
250

90 John Keells Holdings PLC | Annual Report 2016/17
Group Consolidated Review
STRATEGY, RESOURCE ALLOCATION, AND PORTFOLIO MANAGEMENT
Significant Movements of the Portfolio and in Capital Employed
2013/14 2014/15 2015/16 2016/17
Inve
stm
en
ts
JKH raised Rs.23.10 billion through
a Rights issue to fund the equity
contribution of the "Cinnamon Life"
Project
Invested Rs.113 million in Saffron
Aviation (Private) Limited, the
operating company of the domestic
aviation operation Cinnamon Air
Invested Rs.4.73 billion in
Waterfront Properties (Private)
Limited
Invested Rs.4.34 billion in
Waterfront Properties (Private)
Limited
KHL invested Rs.899 million in the
ITHL Rights Issue to infuse equity
to Cinnamon Bey
Invested Rs.100 million in John
Keells Properties Ja-ela (Private)
Limited
Invested Rs.243 million in
Saffron Aviation (Private) Limited,
the operating company of the
domestic aviation operation
Cinnamon Air
Invested Rs.12.06 million in
John Keells Stock Brokers
(Private) Limited
JKH infused Rs.32 million equity
to Saffron Aviation (Private)
Limited, the operating company
of the domestic aviation operation
Cinnamon Air
Invested Rs.585 million in Waterfront
Properties (Private) Limited
JKH, together with its subsidiaries,
increased its shareholding in
Rajawella Holdings Limited (RHL)
from 16.9 per cent to 51.0 per
cent. The total investment in RHL
of Rs.1.04 billion comprised of a
release of an existing sublease
of land held by the JKH Group
in exchange for shares, a partial
buyout from existing shareholders
and cash infusions into RHL on a
staggered basis
Invested Rs.43.17 million
in Saffron Aviation (Private)
Limited, the operating company
of the domestic aviation
operation Cinnamon Air
KHL invested Rs.199 million for the
acquisition of a 426 perch land in
Nuwara Eliya
Entered into a lease agreement with
MOT to acquire Kekuraalhuveli Island
next to Hakuraa, in the Maldives
Div
estm
en
ts
JKH disposed its 24.6 per cent
stake in Central Hospital (Private)
Limited for a consideration of
Rs.1.59 billion
JKH disposed its 4.3 per cent stake
in Expolanka Holdings PLC which
resulted in a capital gain of Rs.389
million
JKH divested its 49 per cent stake
in Information Systems Associates
(ISA) for a consideration of Rs.384
million
JKH disposed its 4.0 per cent stake
in Access Engineering PLC which
resulted in a capital gain of Rs.593
million
Union Assurance PLC (UA) sold a 78
per cent stake of Union Assurance
General Limited for a consideration
of Rs.3.66 billion which resulted in a
capital gain of Rs.1.22 billion
Me
rge
rs a
nd
re
str
uct
uri
ng
/oth
er
JKH’s 100 per cent stake in Nexus
Networks (Private) Limited was
divested to JayKay Marketing
Services (Private) Limited, resulting
in an amalgamation, with the
surviving entity being JayKay
Marketing Services (Private) Limited.
Share repurchase by Asia Power
(Private) Limited resulted in a
capital gain of Rs.82 million
90.44 million shares held by JKH
were repurchased by John Keells
Residential Properties (JKRP) at a
value of Rs.1.60 billion
24.66 million shares held by JKH
were repurchased by UA at a value
of Rs.4.14 billion

91Group Highlights | Governance | Management Discussion & Analysis | Financial Statements | Supplementary Information
The following section provides an overview of the Group’s strategy of entrenching sustainability
within its business operations, the policies and methodologies in place for sustainability
reporting and defining material sustainability aspects and the scope and boundary of the
sustainability content.
Sustainability Management
FrameworkThe Group’s Sustainability Management
framework includes strategies for
entrenchment of sustainability, facilitated
by a sustainability organisational structure,
management information processes for
benchmarking, gap analysis and reporting as
well as awareness creation and sustainability
assurance.
This comprehensive management framework
is constantly updated and improved to
take into consideration the operational
requirements of the various companies of
Sustainability Integration
Over the years, the John Keells Group which operates in seven industry
groups, has placed great importance on sustainable development. The
Group has an integrated approach to ensuring the interlinks between its
financial performance and brand image, its sound corporate governance,
product and service excellence, productive workforce, environmental
stewardship and social responsibility.
Group Consolidated Review
• The Group will strive to conduct its
activities in accordance with the highest
standards of corporate best practice and
in compliance with all applicable local and
international regulatory requirements and
conventions
• The Group monitors and assesses the
quality and environmental impact of
its operations, services and products
whilst striving to include its supply chain
partners and customers, where relevant
and to the extent possible
• The Group is committed to transparency
and open communication about its
environmental and social practices in
addition to its economic performance. It
seeks dialogue with its stakeholders in
order to contribute to the development of
global best practice, while promoting the
same commitment to transparency and
open communication from its partners
and customers
• The Group strives to be an employer of
choice by providing a safe, secure and
non-discriminatory working environment
for its employees whose rights are fully
safeguarded and who can have equal
opportunity to realise their full potential.
All Group companies will abide by national
laws and wherever possible will strive to
emulate global best practice governing
the respective industry groups, seeking
continuous improvement of health and
safety in the workplace
• The Group will promote good relationships
with all communities of which we are a
part and enhance their quality of life and
opportunities while respecting people’s
culture, ways of life and heritage
Group Sustainability Policy
the Group, and includes Standard Operating
Procedures, common IT platforms for
tracking key sustainability indicators and
key risk indicators, internal sustainability
assurance in addition to internal audit and
external assurance processes.
The Group’s sustainability performance
is tracked on a quarterly basis, compared
against local and international benchmarks
and then reported internally and externally.
This has become a proactive process in
assessing a group company’s sustainability
performance, identification of areas of risk
and providing management with timely
information for corrective action.
The Group’s Sustainability Management
framework is also synchronised with the
various management systems including
environmental management, human
resources, health and safety and product
quality as well as business processes such
as risk management, internal audit, legal and
statutory compliance and corporate social
responsibility initiatives.
Sustainability Organisational StructureThe Sustainability, Enterprise Risk
Management and Group Initiatives Division,
along with the Group Executive Committee
and the Group Sustainability Committee
Sustainability Integration Process
su
sta
ina
bility assurance
Inte
rna
l an
d external
Su
stai
nabi
lity
initi
atives to manage
area
s of
c
once
rn and external
repo
rtin
g and awareness
Identification of risks, opportunities
and stakeholder concerns
Sus
tain
abili
ty p
oli
cy a
nd
IT platform for providing management information and
variance control
ITmana
S r
Susta
i
ns
e
nal
ess
Id
Sustainability Integration
m
anag
emen
t fr
am
ew
ork
MATERIALITY AND STAKEHOLDER RELATIONSHIPS

92 John Keells Holdings PLC | Annual Report 2016/17
formulates the Group sustainability
strategy. The Division is responsible for
the operationalisation of the Group’s
Sustainability Management Framework
under which business units carry out
their specific sustainability strategies and
initiatives.
The Division is also responsible for the
process by which the Group identifies its
significant stakeholders, the identification
of materiality issues and sharing of best
practices, carrying out risk reviews and
the overall review and monitoring of the
sustainability drive. Awareness campaigns
are carried out on a regular basis, with one
annual Group-wide awareness campaign
being carried out to broadbase knowledge
and to inculcate a culture of sustainability.
The Group has in place a robust sustainability
structure with oversight from the Group
Executive Committee and the Group
Sustainability Committee, while task groups
for each sustainability aspect are headed
by a member of the Group Operating
Committee. Additionally, each business unit
has a dedicated Sustainability Champion
responsible for sustainability initiatives and
the overall sustainability performance, under
the supervision of their respective Sector
Heads and Heads of Business Units. This
structure is used in integrating sustainability
within the business operations as well as
assessing and developing the value chain in
sustainable practices.
The strategic planning process and annual
plan cycle of Group companies are now
based on a holistic approach and include an
integrated strategy of considering all aspects
of the triple bottom line whilst striving for
optimised financial performance. Business
units identify their material impacts and
commit to medium-term strategies to
minimise such impacts. This has enabled the
Group to further integrate their sustainability
strategies with their business strategies and
has created the need for business units to
assess the hidden costs of operations and
include sustainability initiatives and other
green projects in to their annual objectives.
With business unit strategies and goals
aligned to triple bottom line results, this has
in turn resulted in employee objectives being
aligned to such results, which has enabled
the Group to truly entrench sustainability into
the organisational culture of the Group.
The Group has commenced a focused
strategy of encouraging its significant
suppliers to embrace sustainability as
part of their operations. As such, the Group
currently has in place processes to assess
risks of environmental, labour and social
impacts emanating from its value chain and
to carry out internal assessments of supply
chain partners. An annual drive to create
awareness through supplier fora for the
Group's significant supply chain partners is
also carried out and a Code of Conduct for all
significant suppliers bidding for the Group’s
centrally sourced goods and services has
been introduced.
Sustainability Goal Setting ProcessDuring the year under review, the Group, for
the very first time, established energy and
water reduction goals for the year 2020,
as an innovative stride in its sustainability
journey. The Group engaged expert
international consultants to conduct in-depth
energy and water audits which were carried
out effectively covering approximately 90
operational sites over a span of nine months,
in order to ascertain reduction strategies
and technologies for the setting of the 2020
environmental goals for the Group. The year
2015/16 was established as the baseline for
the goal setting process, with the Leisure,
Consumer Foods and Retail sectors being
identified as the sectors which account for a
majority of resource utilisation in the areas
of energy and water, and as a result aptly
represent the Group’s resource utilisation.
The feasibility of the proposed strategies
were then analysed, with over 300 initiatives
being committed by business units and
industry groups in delivering internal targets,
after which the Group arrived at the final goal
for 2020.
As such, the Group will strive to achieve a 12
per cent reduction in its energy usage and
a 6 per cent reduction in its water usage by
the year 2020, against its 2015/16 baseline
figures. These goals represent 15.8 Mn kWh
of energy reduction and 188,000 m3 of water
reduction respectively.
The Group will strive to achieve a
12 per cent reduction in its energy
usage and a 6 per cent reduction
in its water usage by the year
2020, against its 2015/16 baseline
figures.
Performance Management System
12%reduction
= 15.8 Mn kWh
Energy
6%reduction
= 188,000 m3
Water
John Keells Group Sustainability Goals for 2020
Implementing over 300
initiatives for reduction /
efficiencies / renewables / re-useIn-depth Energy / Water
Audits carried out at over
90 operations sites
Goal Setting Journey
Establishing
2015/2016 Baseline
Group Consolidated Review
MATERIALITY AND STAKEHOLDER RELATIONSHIPS

93Group Highlights | Governance | Management Discussion & Analysis | Financial Statements | Supplementary Information
Report ContentThe annual report is one of the primary
methods used by the Group to respond to
stakeholder concerns during the financial
year. The process of recognising key
sustainability related risks, significant
stakeholders, assessment of the material
aspects based on relative importance to both
the Group and stakeholders, and to formulate
policies and management approaches to
manage and mitigate these aspects have
become an integral part of defining this
report.
Engagement of Significant Stakeholders
section of this Report explains the process
adopted by the Group in determining
the information requirements of its
stakeholders, prioritisation of issues and
establishing materiality. The section titled
‘Key Sustainability Concerns’ explain the
outcomes of the stakeholder engagement
process and establishes the relevance of
the material aspects and key sustainability
indicators that the Group has reported on.
This Report is the Group’s second Integrated
Annual Report, and has been structured as
per the Integrated Reporting framework
of the International Integrated Reporting
Council, and strives to discuss the inter
connections between the six capitals, the
Group’s business model and the creation
of value. Every year, this report provides
a holistic overview including the Group’s
overall strategy, corporate governance
framework, risk management processes
and financial and non-financial performance
covering all aspects of the triple bottom line.
Prior to this, the Group published stand-alone
sustainability reports, which has gradually
evolved over the past four years to reports
that strive to disclose relevant information
to all stakeholders. During the last four
years, the integrated report evolved from
a group-centric approach to an approach
which provided a sectorial analysis and
presentation of relevant material aspects
for each industry group. The report which
provided the highlights of the triple bottom
line performance of each industry group, also
provided similar information from a Group-
wide perspective. This year, as was the case
the previous year, the Report was prepared
'in accordance' -core option of the Global
Reporting Initiative GRI G4 Guidelines.
This year, each industry group section and the
Group Financial and Sustainability Review
also strives to capture the interrelationships
between identified material aspects and the
significance of these aspects in areas such
as financial performance, human capital
and relationships with community and
the environment with a view to providing
information with regard to risks and
opportunities and strategy going forward.
This annual report strives to provide a
clear, concise and balanced overview to all
significant stakeholders identified in the
Engagement of Significant Stakeholder
section of this Report, providing year on
year comparisons for both financial and
non-financial information relevant to such
identified stakeholders. In keeping with
the reporting principles for defining report
content, and in addition to aspects such as
stakeholder inclusiveness and materiality
which are further explained in this Report,
the disclosures also ensure completeness
and contextual information, not only with
regards to the Group’s performance, but also
on sectorial performance of the material
aspects identified for each industry group
as disclosed in the Industry Group Analysis
section of this Report. The Group’s material
aspects and its aspect boundaries are also
covered in the Identification of Sustainability
Aspects section of the Report.
The Report, which is published annually,
has been externally verified and assured
through an independent assurance process
undertaken by DNV GL represented in Sri
Lanka by DNV GL Business Assurance Lanka
(Private) Limited. The data measurement
techniques, calculation methodologies,
assumptions and estimations applied in the
compilation of the sustainability indicators
contained in this Report, are in accordance
with standard industry practices and
indicator protocols provided under the GRI
G4 Guidelines included in the Reporting
Principles and Standard Disclosures and
the Implementation Manual. Such data
measurement techniques, methodologies,
assumptions and estimations are detailed
in the relevant Disclosures of Management
Approach section and can be found online at
www.keells.com/sustainability-and-csr.
The GRI content index has been utilised to
refer to specific information and disclosures
required by the GRI framework. The John
Keells Group has been a part of the United
Nations Global Compact (UNGC) since 2002
and this Report serves as a Communication on
Progress. It also reinforces our commitment
to implement the 10 principles of the UNGC
initiative. Further enhancing its disclosures
to stakeholders, the Group has mapped all
of its projects carried out by the John Keells
Foundation, Group Sustainability, Human
Resources division as well as individual
businesses, to the Sustainable Development
Goals, in turn aligning these with the six
Capitals of Integrated Reporting.
A year on year comparison is possible
subject to the explanations provided with
respect to the divestments mentioned
previously as well as changes in operational
activity as mentioned in the Industry Group
Review sections in this Report. In terms of
restatements in comparison to the previous
year 2015/16, the numbers and statements
have been re-arranged wherever necessary
to conform to the present year’s presentation.
The John Keells Group has been a part of the United Nations Global
Compact (UNGC) since 2002 and this report serves as a communication
on progress. It also reinforces the commitment to implement the 10
principles of the UNGC initiative. Further enhancing its disclosures to
stakeholders, the group has mapped all of its projects carried out by the
John Keells Foundation, Group Sustainability, Human Resources division
as well as individual businesses, to the Sustainable Development Goals,
in turn aligning these with the six Capitals of Integrated Reporting.
G4 - 18 G4 - 22

94 John Keells Holdings PLC | Annual Report 2016/17
Scope and Boundary84 legal entities of the John Keells Group
create the financial reporting boundary of this
report of which, 75 companies are directly
controlled by the Group. The remaining 9
have not been included for sustainability
reporting, as they do not fall within direct
control of the Group. Of the 75 companies, 27
have been excluded for reporting purposes
as they do not carry out any operations that
significantly interact with the environment or
society at large. Such companies are either
non-operational entities, investment entities,
land-only holding companies, managing
companies or companies that rent out office
spaces. The other 48 companies have been
listed in the Group Directory and any other
exclusions made have been clearly explained
under the relevant sustainability aspects.
Apart from Rajawella Holdings Limited
(RHL) and 15 new Keells Super outlets being
included in the reporting scope during the
reporting period, no other significant changes
were made to the reporting scope regarding
the organisation’s size, structure, ownership,
or its supply chain, during the year under
review.
Engagement of Significant
StakeholdersThe Group conducts its commercial
operations in several industry sectors of
the economy across different geographical
markets. This diversity necessitates
developing and sustaining relationships with
various stakeholder groups. Stakeholder
expectations of the Group would be diverse
and numerous considering the large number
of stakeholders that the Group engages with.
The Group has therefore considered only the
stakeholders who have a significant influence
over the Group, or who would be significantly
impacted by the Group’s operations. These
groups are identified in the diagrams in the
ensuing sections.
The Group engages with its significant
stakeholders through formal and informal
consultations, participation, negotiations,
communication, mandatory and voluntary
disclosures, certification, and accreditation.
The various methods of engagement and
frequency of engagement with significant
suppliers have been shown below:
Group Consolidated Review
G4 - 23 G4 - 24 G4 - 25 G4 - 26
The Report has been externally
verified and assured through
an independent assurance
process undertaken by DNV GL
represented in Sri Lanka by
DNV Business Assurance Lanka
(Pvt) Ltd.
MATERIALITY AND STAKEHOLDER RELATIONSHIPS
Customers - individual, corporate B2B
Expectations - Meeting customer expectations on product and
service features, ensuring high quality and safe products and services
delivered in an environmentally and socially responsible manner.
Frequency Methods of engagement
Annually Road shows, trade fairs and field visits
Bi-annually One-on-one meetings, discussion forums, progress
reviews
Quarterly Customer satisfaction surveys
On-going Through information dissemination through printed
reports, telephone, SMS, e-mail, corporate website,
workshops and business development activities
Society, media, pressure groups, NGOs, environmental groups
Expectations - Carrying out operations in accordance with social
norms, prevailing culture, with minimal impact on society and
environment, whilst adhering to all relevant laws and regulations
and operating as a responsible corporate citizen adopting sound
corporate governance practices
Frequency Methods of engagement
On-going Website, press releases, media briefings, correspondence,
disclosures, media coverage, participation in NGO
forums, certification and accreditation
Institutional investors, fund managers, analysts, leaders, multilateral
lenders
Expectations - Consistent economic performance leading to greater
economic value generation
Frequency Methods of engagement
Annually Annual reports, disclosures and reviews
Quarterly Quarterly reports
Regularly Investor road shows
On-going Phone calls, e-mail, written communication, websites,
one-on-one meetings
Community - neighbours, community, community leaders, society
Expectations - Stimulating local economy through procurement
and providing direct and indirect employment whilst carrying out
operations with minimal impact on shared natural resources.
Frequency Methods of engagement
One-off Engagement with the community is carried out prior to
entry into the community area and on exit via one-on-
one meetings, workshops, forums
Monthly Engagement is then carried out on a monthly basis
while operating via one-on-one meetings, workshops,
forums
On-going Corporate Social Responsibility programmes, creating
awareness and education

95
G4 - 24 G4 - 26
Group Highlights | Governance | Management Discussion & Analysis | Financial Statements | Supplementary Information
Employees - Directors, executives, non-executives
Expectations - Providing a safe and enabling environment, equal
opportunity and a culture of meritocracy, enhancement of skills
and knowledge, continuous engagement, providing feedback and
encouraging work-life balance
Frequency Methods of engagement
Annually Employee satisfaction surveys and dip stick surveys
such as Great Place To Work (GPTW), VOE (Voice of
Employee), Group-wide year end get-together.
Bi-annually Formal performance reviews, skip level meetings
Regularly Intranet communications through JK Connect and My
Portal
On-going Professional training, development activities and team
building through internal and external programmes,
joint consultative committees, open door policy at all
management levels, sports events, Corporate Social
Responsibility programmes
Government, government institutions and departments
Expectations - Contribution to the country’s economy through
strategic investments, creating direct and indirect employment,
timely payment of taxes and levies and stimulating local economies
Frequency Methods of engagement
Quarterly The senior management are members of chambers
and industry associations who meet at least on a
quarterly basis
On-going Engagement with the government is carried out on an
on-going basis through meetings, business forums,
newsletters, circulars, presentations and briefings,
advisory meetings of industry associates
Business partners, principals, suppliers
Expectations - Fostering long term business relations and benefitting
from the growth of the Group, adherence to contractual obligations,
knowledge sharing and active representation in business councils
and committees in the relevant industry sectors
Frequency Methods of engagement
Annually Distributor conferences, contract renegotiations and
reviews, road shows, supplier assessments, supplier
fora
Quarterly Supplier review meetings, one-on-one meetings
Regularly Market reports
On-going Conference calls, e-mails, circulars, corporate website
and sourcing, contracting and supplier management
platform
Industry peers and competition
Expectations - Carrying out operations in a fair and ethical manner,
active participation in business councils and committees and
discouraging anti-competitive behaviour
Frequency Methods of engagement
Quarterly The senior management are members of chambers
and industry associations who meet at least on a
quarterly basis
Regularly Communication through membership of trade
associations, conferences, discussion forums
Legal and regulatory bodies
Expectations - Carrying out operations in compliance with all relevant
laws and regulations and operating as a responsible corporate citizen
adhering to sound corporate governance practices
Frequency Methods of engagement
Quarterly The senior management are members of chambers
and industry associations who meet at least on a
quarterly basis
On-going Engagement with the legal and regulatory bodies is
carried out on an on-going basis through meetings,
periodic disclosures, correspondence with bodies
such as local authorities, municipal councils and
other institutions such as Consumer Affairs Authority,
Department of Inland Revenue, Customs Department,
Securities and Exchange Commission, Colombo Stock
Exchange and the Tourist Board of Sri Lanka

96 John Keells Holdings PLC | Annual Report 2016/17
Group Consolidated Review
Key Sustainability ConcernsThere is a strong confidence among
stakeholders on the Group’s corporate and
sustainability strategies and performance
based on the fact that no adverse reports
relating to environmental and social concerns
pertaining to the operations of the Group or
its companies have been highlighted during
the reporting year. This conclusion has been
reached by the Group through continuously
monitoring print and electronic media
throughout the period, which also now forms
part of the Group’s process of tracking key
risk indicators.
Once in every two years, a group-wide
comprehensive “Great Place to Work” survey
is carried out to obtain timely feedback from
employees, while the Group conducts a ‘Voice
of Employee” survey which is an in-house
dip stick study, administered online by an
external party to ensure transparency and
confidentiality. The findings of the survey
are incorporated into an action plan and are
used in evaluating manager effectiveness,
influencing policy and process changes,
employee motivation and morale. In 2016
a VOE survey was conducted to ensure the
employee satisfaction status post the GPTW
held in 2014. The survey was based on four
key drivers namely - Caring, Credibility,
Equality and Pride which are accessed
through 16 statements. The Group also
constantly engages with its employees,
identifying areas such as employee welfare,
training and retention of talent as focus areas.
The supplier assessments carried out
during this year helped us identify material
environmental and social concerns
emanating from our value chain partners,
effectively taking the Group’s sustainability
focus to our value chain partners as well. In
addition, supplier performance management
aspects such as quality checks in ensuring
that suppliers adhere to regulations and
best practices are carried out. In instances
where anomalies were found, stakeholder
engagements were carried out to ensure the
development of such suppliers processes to
minimise repetition.
During the year, the Group has responded
to customer feedback in a structured and
consistent manner, driven by the centrally
developed Corporate Communications
policies, especially with regards to social
media platforms.
The primary concern of shareholders is to
ensure not only return on their investment
but consistent returns for the long run.
However in addition to the overall economic
performance of the company, such investors
would also consider the sustainability of the
organisation with regards to its environmental
performance, social performance and
corporate governance. Through its annual
reports the Group has responded to concerns
raised by stakeholders during the year.
During the financial year the Group has
strengthened its policy frameworks and
management approach, where it has become
vital to address its material aspects and
identify potential frontier risks.
Stakeholders such as society, pressure
groups and regulatory authorities constantly
assess the operations of corporate with
regard to the responsible utilisation of
resources, conservation of bio diversity and
environmental protection and these will
continue to be high priority areas for the
Group.
The John Keells Group has always placed
great importance in developing the
communities within which it operates. The
Group's corporate philosophy has always
been to be a responsible corporate citizen; and
will continue to do so as done over the years.
Identification of Sustainability AspectsTaking into consideration the key sustainability
concerns of significant stakeholder groups,
the Group assesses its material aspect
boundary as follows. The Group considers
its business units and employees as internal
stakeholders whilst its external stakeholder
consist of shareholders, investors, lenders,
customers, suppliers, business partners,
government and regulatory authorities,
peers, pressure groups media and the
community. Continuing from the previous
year, this year too, the Group provided greater
focus to suppliers and distribution networks
in an attempt to assess the risks faced by the
Group through its value chain.
The supplier assessments carried out during this year helped us identify
material environmental and social concerns emanating from our value
chain partners, effectively taking the Group’s sustainability focus to
our value chain partners as well. In addition, supplier performance
management aspects such as quality checks in ensuring that suppliers
adhere to regulations and best practices is carried out.
MATERIALITY AND STAKEHOLDER RELATIONSHIPS
G4 - 20 G4 - 21 G4 - 27

97
G4 - 20 G4 - 21
Group Highlights | Governance | Management Discussion & Analysis | Financial Statements | Supplementary Information
Aspect Grouping
Internal External
Economic Performance
Procurement Practices, Indirect Economic Impact
Energy and Emissions
Water, Effluents and Waste
Biodiversity and Environmental Compliance
Employment, Diversity and Equal Opportunity, Labour Relations, Freedom of Association, Training, Occupational Health and Safety
Non-discrimination, Prevention of Child Labour, Prevention of Forced and Compulsory Labour
Local Communities
Anti-corruption and Regulatory Compliance
Supplier Assessment (Environmental and Labour)
Product Quality and Compliance, Labelling, Marketing Communications
External
Leisure, Consumer All Group companies
Leisure,
Leisure, Consumer
employees
All
Gro
up
Leis
ure,
Cons
umer
Foods, Retail
Consumer Foods,
Foods, Retail
Leisure, Plantations
Food
s
companies,
employees
com
pani
es
Foo
ds, R
et
ailRetail, Plantations
Consumer Foods,
Leis
ure,
Con
sum
er
All Group
All Group co
mpan
ies
All Group companies,
Investors, suppliers, Investors, community,
Investors, comm
unity,
Investors, pressure groups,
community
comm
unity, media
pres
sure
gro
ups,
sup
plie
rs, m
edia
investors, regulators, m
edia
Inve
stor
s, s
uppl
iers
,
Inve
stor
s, re
gula
tors
,
suppliers
peers, customers, suppliers
regulators, comm
unity, media
investors, suppliers, community
com
mun
ity, c
usto
mer
s,
groups, community, cu
stomer
s,
Regulators, customers,
Inve
stor
s, r
egul
ator
s,
Government, peers, p
ress
ure
Investors, suppliers,
Investors, suppliers,
regulators, customers,
cust
omer
s, m
edia
cust
omer
s, m
edia,
socie
ty
Government
Internal

98 John Keells Holdings PLC | Annual Report 2016/17
Group Consolidated Review
Colour Code of Category Material Aspects Management Approach
Economic Economic performance, procurement practices, indirect economic impacts Our Investors
Environment Energy, water, biodiversity, emissions, effluents, waste, compliance Our Environment
Employees Employment, training and development, diversity and equal opportunity,
occupational health and safety
Our People
Ethical business and human
rights
Anti-corruption, compliance, prevention of child labour, prevention of forced
and compulsory labour, freedom of association
Our Ethics
Product responsibility Product labelling, responsible advertising, product compliance, customer health
and safety
Our Products
Supplier assessment Assessment of suppliers for environment stewardship, labour practices and
human rights
Our Supply Chain
Social responsibility Local community Our Community
Any clarifications regarding this Report may be obtained from the:
Sustainability, Enterprise Risk Management and Group Initiatives Division, John Keells Holdings PLC
186, Vauxhall Street, Colombo 2, Sri Lanka
Email : [email protected]
Website : www.keells.com/sustainability-and-csr
Disclosures of Management Approach can be found on the
corporate website at www.keells.com/
sustainability-and-csr.
Indigenous Rights
Customer Privacy
Transportation Impacts
Supplier Assessment - Social
Supplier Assessment - Human Rights
Supplier Assessment - Environment
Supplier Assessment - Labour
Employment
Market Presence
Investments
Non-Discrimination
Training
Water
Waste Emissions
Product Compliance
Local PurchasingEconomic Performance
EnergyLabellingBiodiversity
Effluents
Env Compliance
Local Community
Overall Compliance
Freedom of Association
Anti CorruptionOccupational Health & Safety
Responsible Advertising
Customer Health & Safety
Diversity & Equal Opportunity
Child LabourIndirect Economic Impact
Forced Labour
Anti Competitive Behaviour
Public Policy
Env Grievances
Materials
Env ConservationHuman Rights Grievances
Human Rights AssessmentProduct & Services Impacts
Security Practices
Equal Pay
Labour Relations
Labour Grievances
Low Impact to internal stakeholders
Material Aspects
Imp
act
to e
xter
nal
sta
keh
old
ers
Low
High
High
In defining report content, the Group sought to prioritise the material impacts based on their relative importance to internal and external
stakeholders. This prioritisation and identification of material aspects for reporting is shown below.
MATERIALITY AND STAKEHOLDER RELATIONSHIPS
G4 - 19 G4 - 23

99Group Highlights | Governance | Management Discussion & Analysis | Financial Statements | Supplementary Information
Management Approach of Identified Material AspectsA detailed description of the strategies and approach adopted by the Group in managing its material aspects are contained in the Disclosure of
Management Approach section hosted on the Group website www.keells.com/sustainability-and-csr. A summary of this management approach
to the Group’s economic performance, ethics and human capital, environmental responsibility, product stewardship, supply chain management
and social responsibility is contained below.
Our People
Human resources is an appreciating asset bringing continuous
returns and constitutes the catalyst for world class performance.
Being in predominantly service based industries, productivity,
efficiency, customer focus, and skills are of vital importance in
obtaining a competitive advantage.
The Group is committed to being “More than just a Workplace” while
the foundation of its HR philosophy is to be an equal opportunity
employer.
The Group has in place policies with regard to human resources
covering all aspects of employment.
• All Group companies adhere to all relevant local labour laws and
regulations.
• The Group does not discriminate its employees on the basis of
gender, race, nationality, age, social origin, disability, religion, or
any other basis.
• The Group recognises the rights of employees and provides
forums, support groups and policies to address their concerns
and resolve issues and conflicts in a fair and transparent manner.
Details of the Group’s human capital can be found in the
Capital Management Review section.
Our Investors
The Group’s continued success is dependent on its triple bottom
line performance, by providing economic value addition, financial
value through to its shareholders, pay back on investment to its
investors, payment of debt financing to its financiers and benefits to
its employees, whilst also maintaining its social license to operate.
The John Keells Group is committed to delivering sustainable
economic performance and growth to all its diverse stakeholders.
The Group’s sound financial management is based on a diversified
approach aiming to increase economic value whilst ensuring
stringent internal controls and robust Enterprise Risk Management
processes.
• Employees are targeted through a performance centric
compensation culture which results in high levels of efficiency
and productivity.
• The Group seeks to stimulate the economies through its
commitment to developing and working with local suppliers.
The Group’s economic performance can be found in the
Capital Management Review section.
Our Environment
The Group has significant operations in various sectors which have
high environmental impacts such as energy, water consumption,
emissions, waste and effluents and bio diversity. The Group is aware
that it is a custodian of the environment for future generations and as
such take best efforts to minimise negative environmental impacts
and comply with all applicable laws and regulations. The Group is
also aware of the importance of preserving the country’s natural
resources which in turn would enhance the unique value proposition
of the Group’s products and services.
The John Keells Group is committed to promoting sound
environmental practices within our key businesses, through the
establishment of policies and practices that enable us to conduct our
operations in a sustainable and environmentally sound manner.
• The John Keells Group places great importance on the
management and reduction of energy, water consumption,
carbon emissions, waste generation and effluent discharge in
the areas of operations.
• Complementing the overall Environment Policy, the Group has
in place several other policies such as its Energy Management
Policy, Water Management Policy as well as policies such as
the Hazardous Waste Management Policy covering waste
management.
The Group’s environmental performance can be found in
the Capital Management Review section.
Our Ethics
The Group is committed to upholding the universal human rights of
all its stakeholders whilst maintaining the highest ethical standards
in all its business operations.
The John Keells Group places the highest value on ethical practices
and has promulgated a zero tolerance policy towards corruption and
bribery in all its transactions.
• All business units and functions of the Group are required to
include and analyse the risk of corruption as a part of their risk
management process.
• The Group employs stringent checks during its recruitment
process to ensure the minimum age requirements are met.
• The Group ensures that all companies are educated on the
possible sources of forced and compulsory labour.
• The Group has zero tolerance for physical or verbal harassment
based on gender, race, religion, nationality, age, social origin,
disability, political affiliations or opinion.
The Group’s governance mechanism and internal control
procedures can be found in the Governance section.

100 John Keells Holdings PLC | Annual Report 2016/17
Our Products
The delivering of optimal levels of quality and ensuring maximum
satisfaction to all its customers and clients has always been
imperative and material to the Group.
The John Keells Group strives to maintain products and services at
the highest standards in line with all relevant local and international
statutory and regulatory requirements in the markets we serve.
• The Group develops and markets products and services that
meet customer requirements and meet the highest product
quality standards which ensure customer health and safety.
• The Group follows the ICC Code of Advertising and Marketing
Communication for all its products and services
• The Group adheres to all product labelling requirements specified
in all relevant laws and regulations in the countries it operates.
The Group’s product related information can be found in
the relevant Industry Group Review section.
Our Supply Chain
Engaging with a vast number of business partners across its various
industry groups, the Group recognises the importance of entrenching
sustainability across its value chain towards promoting responsible
businesses whilst reducing risk.
The Group engages with its significant suppliers in ensuring that
their working conditions are safe, workers are treated with respect
and dignity, and that operations are carried out in an environmentally
responsible manner.
• The Group has introduced a comprehensive Supplier
Management Framework including a Supplier Code of Conduct.
• Awareness creation and engagement of suppliers are carried out
through supplier fora.
• Significant suppliers are assessed annually on labour practices,
human rights and environmental impacts through an internally
developed supplier checklist.
Details of the Group’s supplier engagements can be found
in the Capital Management Review and the Disclosures of
Management Approach found on the corporate website at
www.keells.com/sustainability-and-csr.
Our Community
The Group aims to be good neighbours and proactively contributes
to the development of the nation through aligning its focus areas to
the Sustainability Development Goals (SDGs) adopted by Sri Lanka.
The Group abides by the values of caring, trust and integrity through
demonstrating our commitment to the community and environment
we operate in staying in line with our CSR Vision “empowering the
nation for tomorrow”.
• The Group focuses on education, health, environment, community
and livelihood development, arts and culture and disaster relief.
• The Group has contributed towards the development of society
through infrastructure, public services and local community
engagement initiatives.
The Group’s social responsibility initiatives can be found in
the Capital Management Review and the Industry Group
Review section.
Group Consolidated Review
Disclosures of Management Approach can be found on the corporate website at www.keells.com/sustainability-and-csr
MATERIALITY AND STAKEHOLDER RELATIONSHIPS

101Group Highlights | Governance | Management Discussion & Analysis | Financial Statements | Supplementary Information
RISKS, OPPORTUNITIES AND INTERNAL CONTROLS
Group Consolidated Review
Enterprise Risk Management Process
Overview
Business Unit/ Sector/ Industry Group
Risks
Each group company carries out its
respective enterprise risk identification and
review process quarterly, bi-annually and
annually, based on a pre-agreed structure.
As such, company specific related risks as
well as sector and industry group common
risks are analysed and reviewed at various
fora such as the monthly Group Management
Committees, the quarterly Board Meetings,
and finally at the bi-annual comprehensive
risk identification and review carried out
centrally by the Sustainability, Enterprise
Risk Management and Group Initiatives
unit and by the Group Executive Committee.
Risks covered at these various levels, include
operational risks, cyber risks, hazard risks,
financial risks, fraud and corruption, labour
related risks, natural disasters, environmental
pollution and supply chain risks. Each Group
company also identifies its core sustainability
risks, which, though having a relatively
low probability of occurrence could have a
significant impact on the sustainability of its
operations.
The Group’s robust corporate governance
structure which encompasses the self-
linking of risk management, sustainability,
corporate social responsibility and internal
audit processes ensures that the impacts
of all risks identified for both the business
unit and the Group are proactively managed.
Continuous horizon scanning helps the Group
identify both risks and opportunities with
regard to global and regional trends.
All business unit risks, once validated
and reviewed at the industry group level
Group Management Committees, are then
presented to the Audit Committees of all
listed companies and to the Boards of the
unlisted companies, together with risk
mitigation plans, at least once a quarter.
Business units are the ultimate owners of the
risks of that business and are responsible
for reviewing and monitoring the agreed
risk control measures on an ongoing basis.
Some components of the agreed risk control
measures are often subject to audit by the
internal audit team which reports to the
respective Audit Committee of the listed
companies and to the Audit Committee of
John Keells Holdings PLC with respect to all
Group companies.
Group Risks
Risks pertaining to the Group, and the
identified critical operating risks at business
unit level, are reviewed bi-annually by
the Group Executive Committee. The risk
management cycle is concluded with an
annual Group Risk Report containing a Group
wide risk status, analysis and profile which is
presented to the Group Audit Committee and
any policy level decisions stemming from
this review are incorporated in the next risk
review cycle.
Risk Management Process
The risk management process and
information flow is depicted below.
Report ContentOperational Units
John Keells Group
Review Risk
Report and Action
BU Review and Sector Risk
Report and Action
BU Risk Report and Action
JKH PLC Audit Committee
Group Executive Committee (GEC)
Listed Company Audit Committee
Group Management Committee (GMC)
Business Unit
Risk
Presentation
Risk
Validation
Integrated Risk
Management
Risk
Identification
Headline RisksExternal
Environment
Business Strategies
and Policies
BusinessProcess
Organisationand People
Analysis and Reporting
Technologyand Data
Sustainability & CSR
Ris
k M
an
ag
em
en
t Te
am
Ris
k a
nd
Co
ntr
ol
Re
vie
w T
ea
m
Su
sta
ina
bil
ity
Inte
gra
tio
n
John Keells Risk Management Process Flow
All business unit risks, once validated and reviewed at the industry group
level Group Management Committees, are then presented to the Audit
Committees of all listed companies and to the Boards of the unlisted
companies, together with risk mitigation plans, at least once a quarter.

102 John Keells Holdings PLC | Annual Report 2016/17
RISKS, OPPORTUNITIES AND INTERNAL CONTROLS
Group Consolidated Review
During the reporting year, the Group also
enhanced its risk management process
by introducing an IT solution to manage
its Enterprise Risk, Audit, and Incident
Management processes. The IT solution
makes the Group’s Risk Management
functions live and virtual, by enabling the
maintenance of live, dynamic risk registers
which are linked to business goals and
responsible personnel - along with the
provision of timely alerts on action plans,
and escalation processes for risks where
action plans are over-due. Key management
personnel at all levels (CEOs, Sector Heads,
and Presidents) will have virtual visibility of
the risks relevant to them. The platform will
also facilitate the sharing of best practices
across the group. The Risk Universe, which
frames the categorisation of risks, has also
been updated for relevance during the year to
reflect topical and emerging risks.
Key Impacts, Risks and Opportunities
Risk management is a firmly entrenched
component of the corporate governance
process of the John Keells Group and has
been instrumental in successful corporate
craftsmanship and the long term sustenance
of the Group. The structured process for risk
management further enhances the Group’s
value creation process for all its significant
stakeholders by ensuring that Group
companies effectively identify and mitigate a
range of operational, structural, financial and
strategic risks. The Group’s risk management
process also identifies aspects from a triple
bottom line perspective, covering risks and
impacts to the Group arising from the socio-
economic environment it operates in, as well
as the risks and impacts emanating from its
own operations as well as that of its value
chain. Good risk management has enabled
the Group to undertake new projects where
the reward to risks factor is optimal.
As such, the Group focused its attention on
key areas such as attracting and retaining
necessary skills, maintaining good labour
relations, enhancing its product responsibility,
contribution to the community through
infrastructure projects and the overall
creation of value for all internal and external
stakeholders, during the year.
The Group’s operational decisions are also
influenced by the “Precautionary Principle”,
particularly, from an environmental
perspective. As such, the Group considers
resource consumption, environmental
pollution, environmental degradation and its
impacts on the local community, as areas of
high priority. As a part of this process, the
Group tracks Key Risk Indicators such as
natural disasters, emissions, climate change
and impacts to biodiversity, ensuring a
minimum impact on the environment within
which it operates.
Given the pervasive nature of risks, discussion
of the same, at a Group Level, are contained
inter alia, in the Capital Management section
of the Group Consolidated Review section,
the Industry Group Review section and the
Financial Statements of this Report. Details
on risks, opportunities and internal controls
specific to business units, sectors and
industry groups are discussed in the Industry
Group Review section of this Report.
Headline RisksMacro-economic and Political Environment
2016/17 2015/16 2014/15
Risk rating Low Low Moderate
Policy uncertainty and the volatility of the
economic environment - both locally and
globally - continued during the year. Despite
the current lack of clarity, and definition on
some of the economic policies, the Group
and the Business Community remain positive
about the future of Sri Lanka’s economy.
Several senior management staff actively
participate in key policy making bodies,
committed to supporting the Government in
its efforts to create sustainable and equitable
economic growth. The conditions in the
Maldives improved, with the Group working
closely with the authorities to support its
economic growth. For the aforesaid reasons,
this risk remains a Low.
Regulatory Environment
2016/17 2015/16 2014/15
Risk rating High High Ultra High
A degree of uncertainty and volatility still
prevails as a result of transitioning legal,
regulatory and tax structures. The prolonged
prevalence of this uncertainty and impact
of the same on our businesses result in the
risk rating remaining at a High. The Group’s
operating model, together with its internal
processes, aims to ensure flexibility with,
and adaptability to, any unexpected changes
in the legal framework. Participation of the
Group’s senior executives in various industry
associations and industry chambers helps to
bring clarity and consistency to Government
policies and regulations.
Financial Exposure
2016/17 2015/16 2014/15
Risk rating Low Low Low
The central Treasury Division, supported
by the Executive and Finance functions
of the businesses, is responsible for the
management of financial risks through
ongoing monitoring. Hedging mechanisms,
liquidity management strategies, capital
structuring, and other Board approved
strategies, where relevant, are applied
across the Group. Given the volatility and
uncertainty in the global and local macro-
economic environment as witnessed in the
previous financial year, the ensuing sub-
section elaborates on the key elements of
financial exposure, the state of the Group’s
readiness and the general outlook relating to
such elements.
The Group remains positive about
the future of Sri Lanka’s economy,
and members of its senior
management actively participate
in key policy making bodies,
committed to supporting the
Government in its efforts towards
creating sustainable and equitable
economic growth.
The Group’s operational decisions are also influenced by the
“Precautionary Principle” and accordingly from an environmental
perspective, the Group considers resource consumption, environmental
pollution, environmental degradation and its impacts on the local
community, as areas of high priority.

103Group Highlights | Governance | Management Discussion & Analysis | Financial Statements | Supplementary Information
Currency / Exchange Rate
Risk rating - Medium
After a volatile move in the first half of the
financial year, the USD/LKR exchange rate
depreciated at a steady pace in the latter
half. The Group adopted prudent measures
to manage the financial impacts arising
from currency fluctuations, underscoring
the importance of matching liabilities with
corresponding inflows and constantly
evaluating such positions. Some of the
initiatives for managing the currency risk
included matching routine foreign currency
conversions with import bill settlements;
matching of Dollar revenue streams with
Dollar denominated debt to architect “natural
hedges”; accumulation of foreign currency
funds, where allowed, and the deferral of
conversions; premature settlement of forex
denominated trade liabilities; and the regular
review of rates and related contractual
pricing in the context of competitiveness.
Interest Rate
Risk rating - Low
The Rupee interest rates saw a steady upward
movement throughout the year as a result of
the Central Bank’s revision of policy rates
twice during this period. However, this did not
have a material impact on the Group since the
Rupee share of debt declined for most part of
the year. Interest cost did however increase
in the last quarter which was commensurate
with the increase in short-term debt for
premature settlement of USD trade liabilities.
This was a more economical alternative
to currency hedges. The Group continued
its strategy of maintaining floating Dollar
denominated debt facilities for a majority
of the currency debt where the operations
of the subject business unit produced forex
denominated revenues. Even so, it continued
to evaluate and enter into hedge instruments,
where feasible, including the creation of a
natural hedge against Dollar denominated
short-term deposits on variable rates of
return.
Given the current outlook for interest rates
in relation to the USD 395 million syndicated
loan facility, obtained by Waterfront Properties
(Private) Limited for the development of
“Cinnamon Life” project, the Group entered
into a partial hedge during the previous
year, as a measure to mitigate the interest
rate exposure of the Group. The Group will
continue to monitor its LIBOR exposure in
relation to the syndicated loan facility, make
periodic updates and recommendation to the
Board as necessary, and take required action
to mitigate exposure and potential risks.
Credit and Counterparty
Risk rating - Low
The Group continued to liaise with only
reputed creditworthy counterparties. All
clients are subject to credit verification
procedures. They are required to submit bank
guarantees/performance bonds/counter
guarantees, where applicable. These clients
are regularly appraised and the subject
arrangements are frequently reviewed.
Internally set up exposure limits mitigate the
concentration risk in any single counterparty
is mitigated due to internally set exposure
limits.
Liquidity
Risk rating - Low
The Group strived to ensure that a product-
mix of short-term investments and undrawn
committed facilities are sufficient to meet
the short, medium and long term capital and
funding requirements, unforeseen obligations
as well as unanticipated opportunities. The
daily cash management processes including
active cash flow forecasts, matches the
duration and profiles of assets and liabilities,
thereby ensuring a prudent balance between
liquidity and earnings.
Note - For further details and quantification
of the aforementioned risks, refer the Notes
to the Financial Statements
Information Technology
2016/17 2015/16 2014/15
Risk rating High High Low
The majority of the Group’s IT systems
are centralised to ensure uniformity and
standardisation across the Group. Whilst
most servers have now been consolidated
into the Group's central data centre, as
such increasing utilisation and reduces unit
costs, this however also increases the risk
of concentration. Such risks are mitigated
via strict IT protocols, firewalls, business
continuity plans and disaster recovery
sites and processes. While the Group is
comfortable with the risk management of the
aforesaid area, the overall score of the risk
remains at a High due to the implications
of contextual and potential risks such as
cyber security. As a preliminary step, the
Group has engaged a reputed third party
service provider to establish and manage an
“Intelligence Managed Security Operations
Center.” While the initial commissioning
is due in the first quarter of 2017/18, the
completion will take place in the second
quarter. The Group recognizes that it has
to employ new technologies in gaining
productive improvements and marketing
sales advancements. However this increases
the risk element. Given the same, the risk
rating remains a High.
Global Competition
2016/17 2015/16 2014/15
Risk rating Low Low Low
In the face of the numerous foreign
investments taking place in Sri Lanka,
especially by international players, the
Group remains alert with regard to ensuring
its competitiveness. The Group has
sought to match global standards through
benchmarking its businesses to global best
practices and maintaining the highest quality
levels in terms of both products and services.
Further, in an effort to keep abreast of digital
advancements, the Group is proactively
relooking at disruptive and innovative
business models, customer engagement
and business processes and has put in
place a Digitisation Steering Committee
to further study emerging practices. In
addition, 2016/17 saw the introduction of a
Chairman’s Award for Disruptive Innovation,
for which one of the major criteria was the
Refer Note 10 of the
Note to the Financial Statements
for further details and quantification of the
aforementioned risks under Financial Exposure
Given the current outlook for interest rates in relation to the USD 395
million syndicated loan facility, obtained by Waterfront Properties
(Private) Limited for the development of “Cinnamon Life” project,
the Group entered into a partial hedge during the previous year, as a
measure to mitigate the interest rate exposure of the Group.

104 John Keells Holdings PLC | Annual Report 2016/17
RISKS, OPPORTUNITIES AND INTERNAL CONTROLS
Group Consolidated Review
benchmarking of practices against the best
in class, both internationally and locally. The
risk rating remains at a Low.
Human Resources and Talent Management
2016/17 2015/16 2014/15
Risk rating Low Low Low
The Group, over the years, has placed a
strong emphasis on retaining key talent
through performance recognition and reward
schemes, succession planning, leadership
and career development programmes,
ensuring that high quality employees are
retained, despite the highly competitive
labour environment. Additionally, talent
attrition is also tracked as a Key Risk
Indicator on a quarterly basis and reported
to the Group Executive Committee. The
Group conducts many surveys internally to
better understand its employee needs and
aspirations. Whilst the Group has a robust
non-discrimination policy and an effective
grievance handling mechanism, it maintains
a culture of continuous engagement and
dialogue with employees. In addition, the
Group’s engagement with unions is on a
partner basis and this has resulted in better
performance oriented outcomes. The Group
significantly improved its scores on the GPTW
Survey.
Improving competencies and skills is
recognised as a vital factor in maintaining
current standards and matching global best
practice levels. The Group achieves this
through targeted, business focused training
and development programmes available to
all employees across the Group on a needs
basis, allowing the Group to retain its ability
to position itself as a preferred employer. As
a result of these measures, and based on the
empirical evidence of past year, the rating for
this risk remains a Low.
Environment and Health and Safety
2016/17 2015/16 2014/15
Risk rating Low Low Low
The Group has in place a robust
Environmental Management System with
emphasis on socio environmental policies
with respect to energy, emissions, water,
discharge, waste and bio diversity. All
companies are required to ensure zero
violations of the country’s environmental
laws and regulations and are encouraged to
go beyond compliance, where practicable,
in keeping with global best practices such
as ISO 14000 Environmental Management
certification. The Group continuously strives
to reduce its energy consumption, carbon
footprint and water consumption and as
such, Group companies are encouraged to
constantly seek out renewable sources of
energy and install energy and water efficient
equipment. Responsible waste disposal is a
key aspect under management focus, and is
carried out through training and awareness,
converting of waste to energy and the
continuous incremental evolvement of
processes and systems in reducing/reusing/
recycling waste.
The Group makes every effort to ensure a
safe working environment for its employees,
consumers, customers and third parties,
in keeping with its commitment to be a
responsible corporate, contributing to the
improvement of morale, productivity and
efficiency. Whilst the provision of safe and
healthy products/services for its customers
is a top priority for the Group, where relevant,
Group companies have obtained OHSAS 8001
Occupational Health and Safety, HACCAP
certification and ISO 22000 certification on
food safety management systems. Against
this background, the risk of Environment and
Health and Safety remains a Low.
Reputation and Brand Image
2016/17 2015/16 2014/15
Risk rating Low Low Low
The Group’s Code of Conduct is the
foundation of its uncompromising approach
to ethical and transparent business conduct
with a “zero tolerance” attitude to any
Code of Conduct violations. This is further
supplemented and strengthened, through the
presence of an independent Ombudsperson,
Whistleblower mechanisms and Chairman
Direct conduits amongst other measures,
supporting the governance structure of the
Group.
The Group also identifies and mitigates
potential brand reputation risks through
the tracking and monitoring of such under
a sustainability development framework.
The numerous strategic infrastructure and
community development projects carried out
by the John Keells Foundation contributes
to further strengthening its stakeholder
engagement process. In addition, stringent
quality assurance and product standards are
maintained and product quality is continually
monitored and tracked. In the few instances
where public discontent has been identified,
the Group took immediate steps to explain
the circumstances. All marketing, and public
communications, are vetted in ensuring
conformance with the Group Marketing and
Communications Policy, based on the ICC
Code of Advertising and similar. In this light,
the Group is confident that the rating of this
risk remains a Low.
Refer Section 5.5 of the
Corporate Governance Commentary
for further details on Internal Controls
The Group, over the years, has placed a strong emphasis on retaining key
talent through performance recognition and reward schemes, succession
planning, leadership and career development programmes, ensuring
that high quality employees are retained, despite the highly competitive
labour environment.
The Group makes every effort
to ensure a safe working
environment for its employees,
consumers, customers and
third parties, in keeping with its
commitment to be a responsible
corporate, contributing to
the improvement of morale,
productivity and efficiency.

105Group Highlights | Governance | Management Discussion & Analysis | Financial Statements | Supplementary Information
Supply Chain Risk
2016/17 2015/16 2014/15
Risk rating Low Low Low
With a strong focus on integrating best
practices within its value chain, the Group
believes a comprehensive risk management
process must also extend to its value chain
partners, through regularly assessing risks
associated with its supply chain. As such,
supplier performance is reviewed on an
annual basis with regard to compliance
with labour, environmental and other
relevant operating regulations of the country.
Concurrently, the Group also provides
training and knowledge transfer through
supplier fora held annually both in Sri Lanka
and the Maldives, for its significant value
chain partners, assisting to further entrench
sustainability within their own business
operations, resulting in cost benefits as well
as enhancement of their own brand image.
The Group’s Supplier Code of Conduct also
educates suppliers on the expectations of the
Group with regards to sustainable and ethical
business practices. As a result of these
proactive steps taken by the Group, the risk
rating remains at a Low.
Risks - the interlinkages
Given the interrelationships between risk
management and sustainability, the Capital
Management Review of the Consolidated
Review section of this Report details the
Group’s performance with regard to all
pillars of the triple bottom line. This is further
reinforced through the Group’s corporate
governance framework, which in turn
ensures a strong focus on compliance to
regulatory and ethical guidelines, helping the
Group operate in line with the principles of
sustainable development continued to focus
its efforts on supporting local economies
in the geographical areas of its operations.
Its sustainable sourcing initiatives ensure,
whenever possible and practical, that raw
materials for the Group’s Consumer Foods
sector and goods for the Retail sector are
procured locally. This has resulted in the
Group contributing to uplifting livelihoods and
promoting industry in its areas of operation.
Concurrently, the Group also
provides training and knowledge
transfer through supplier fora held
annually both in Sri Lanka and the
Maldives, for its significant value
chain partners, assisting to further
entrench sustainability within
their own business operations,
resulting in cost benefits as well
as enhancement of their own
brand image.

106 John Keells Holdings PLC | Annual Report 2016/17
SHARE AND WARRANT INFORMATION
Group Consolidated Review
The following is an overview of the market
conditions which prevailed during the year
under review, both globally and locally. The
section concludes with a discussion on JKH
share related information.
Global Review The year under review was characterised by
significant market volatility and uncertainty,
mainly ascribed to global political
developments such as Brexit and the US
Presidential election. The first quarter of
the financial year saw a gradual recovery of
global stock markets from a depressed start
in 2016, mainly fuelled by China’s slowing
economic growth and the depreciating
Renminbi. Furthermore, the commodities
market had a challenging start to the year,
as oil prices fell due to worldwide oversupply,
which was subsequently resolved by
the agreement between OPEC nations in
November 2016 to curtail output in 2017.
The UK’s decision to exit the European Union
(EU) in a landmark referendum in June 2016
marked the first of the unexpected political
developments during the year. Global financial
markets reacted to the decision through a
rapid sell down of its GBP holdings, fueled
by concern over the future of British trade,
the City of London’s position as the main
financial services centre in Europe, and the
British economy, as a whole. As a result, the
GBP depreciated by 10 per cent against the
US dollar in a single day’s trading post Brexit,
marking a 31-year low for the currency.
The outcome of the US Presidential election
in November 2016 where President Donald
J. Trump Jr. emerged victorious resulted in
highly volatile markets given the anticipation
of a fundamentally different policy approach
as markets priced in rapid execution of
deregulation, a stronger US dollar, lowering of
corporate taxes and increased infrastructure
spending, among others. This momentum
carried on into 2017 with the Dow Jones
Industrial Average crossing and closing
above 20,000 points for the first time in its
history. However, the strong performance
was not limited to industries, with all major
US equity categories making gains in the
4th quarter, with the S&P 500 and NASDAQ
Composite cruising to records off the back of
upbeat earnings releases from heavyweights.
Heightened volatility and uncertainty in equity
markets influenced IPOs in the year under
review. The calendar year 2016 saw the most
challenging year for global IPOs since 2003,
with new issues marking a decrease of 40
per cent compared to the previous year.
Despite the aforementioned challenges,
regional peer equity markets enjoyed
promising results during the financial year
as valuations tended to be comparatively
attractive. India’s S&P BSE SENSEX Index
(SENSEX) witnessed a strong year posting
a growth of 17.2 per cent over the financial
year. Furthermore, the Jakarta Composite
Index (JKSE) and Singapore’s Strait Times
Index (STI) both had a positive year, enjoying
double digit growth of 15.0 and 12.7 per cent,
respectively. Malaysia’s FTSE Bursa Malaysia
KLCI (KLSE) exhibited slower growth for the
year and expanded by 1.7 per cent.
Local Stock Market ReviewDuring the period under review, the All Share
Price Index (ASPI) of the Colombo Stock
Exchange (CSE) fell marginally by 0.2 per cent
to 6,061.94 points [2015/2016: 6,071.88]. The
Standard and Poor’s Sri Lanka 20 Index (S&P
SL 20), which is the weighted average index of
selected counters of the CSE based on market
capitalisation, liquidity and financial thresholds,
stood at 3,438.88 points as at 31 March 2017,
recording an increase of 7 per cent against the
previous financial year [2015/16: 3,204.44]. The
overall market capitalisation of the CSE was
Rs.2,662.86 billion as at the end of the financial
year compared to Rs.2,586.16 billion in the
previous year, recording an overall increase
of 3 per cent. The subdued performance of
the CSE, in comparison to regional peers, was
a result of dampened investor sentiment due
to domestic economic conditions and tax and
policy uncertainty, which was exacerbated by
global market volatility.
The year under review was characterised
by unfavourable macro-economic variables
for the local equities market. In the first half
of the financial year, the Central Bank of
Sri Lanka raised both the Standing Deposit
Facility Rate (SDFR) and Standing Lending
Facility Rate (SLFR) by 50 basis point each, to
7.00 per cent and 8.50 per cent, respectively,
to curb excessive demand to pre-empt the
escalation of inflationary pressures and
support the balance of payments. This rise in
base interest rates made local equities a less
lucrative proposition. Alongside the balance
of payment pressures, investor concerns
over the outlook of the Sri Lankan Rupee and
diminishing foreign reserves also contributed
to subdued investor participation.
The latter part of the financial year saw yet
another interest rate hike with both base
rates being raised by a further 25 basis
points in March 2017. Government measures
to increase revenue collection, which are
required for the long-term sustenance of
the economy, such as the increase in the
value added tax (VAT) from 11 to 15 per
cent, and further uncertainty on proposed
taxation as part of the Government’s fiscal
consolidation programme impacted market
sentiment. Consequently, the average daily
turnover levels declined by 31 per cent over
the corresponding period last year to Rs.728
million for the financial year under review.
The CSE recorded 12 corporate debenture
issues through which a total of Rs.68.50 billion
rupees was raised compared to Rs.83.41
billion raised in the previous financial year.
Furthermore, primary activities on the CSE
continued to be bleak, with only 1 IPO during
the year, raising Rs.75 million [2015/16:
Rs.329 million].
Total number of shares in issue as at 31/03/2017 1,387,467,137
Global Depositary Receipts (GDR) as at 31/03/2017 1,320,942
Public shareholding as at 31/03/2017 97.53%
Stock symbol JKH.N0000
Newswire codes of the JKH Share
Bloomberg JKH.SL
Dow Jones P.JKH
Reuters JKH.CM
Rs.191.33BnJKH market capitalisation A growth of 9 per cent

107
JKH ShareThe JKH share appreciated by 6 per cent to
Rs.137.90 as at 31 March 2017 from Rs.129.50
on 31 March 2016 (adjusted for the share sub
division in June 2016). Furthermore, JKH
traded with a strong correlation to the ASPI
in the period under review, as illustrated in
the adjacent graph. The beta of the JKH share
as of 31 March 2017, stood at 1.27 (the beta
is calculated on daily JKH share and market
movements measured by the ASPI for the
five-year period commencing 1 April 2012
to 31 March 2017). On an adjusted basis, the
share traded between the range of Rs.128.00
(in April 2016) and Rs.159.00 (in August
2016).
Despite the subdued local market, the JKH
share contributed 16 per cent to total market
turnover [2015/16: 14 per cent], emphasising
its consistency as a preferred instrument
with liquidity and as a proxy to the local
economy.
Foreign ownership of the JKH share remained
relatively constant during the period under
review, as foreign holdings were 52 per cent
as at the end of the financial year as against
51 per cent at the commencement of the
year. The compounded annual growth rate
(CAGR) of the JKH share on a capital basis
over the 5 year period stood at 0.4 per cent,
compared to that of the market which stood
at 2 per cent for the same period.
2016 Warrant The 2016 Warrant (ticker: W0023) ceased
trading on the CSE on 27 September 2016,
and was exercisable till 11 November 2016.
A total of 57,464,155 2016 Warrants were
due to expire in November 2016, of which
21,279,672 Warrants were exercised and
accepted at a purchase price of Rs.149.29
per ordinary share (adjusted for the ordinary
share subdivision of the Company on 24
June 2016). The Company received a sum of
Rs.3.18 billion through the conversion of the
2016 Warrants.
The allotment of the 21,279,672 Ordinary
Shares of the Company, and the uploads to
the CDS, were completed within the time
frames stipulated in the Notice of Exercise
and the Shareholder circular dated 5
September 2013.
Issued Share CapitalThe number of shares in issue by the
Company increased to 1,387,467,137 as at
31 March 2017 from 1,189,403,549 as at 31
March 2016. The increase in the share capital
was an outcome of the share subdivision,
as discussed later in the ensuing section,
the conversion of the 2016 Warrant and the
exercise of employee share options (ESOPs).
ESOPs of 7 million equivalent shares were
exercised during the financial year. Moreover,
out of the 35 million shares equivalent of
unexercised ESOPs as at 31 March 2017,
JKH share performance vs ASPI (indexed)
No. of shares (Mn)Index
Apr
16
May
16
Jun
16
Jul 1
6
Aug
16
Sep
16
Oct
16
Nov
16
Dec
16
Jan
17
Feb
17
Mar
17
JKH Shares Traded ASPI (Indexed) JKH (Indexed)
0
20
40
60
80
100
120
140
0
1
2
3
4
5
6
7
JKH vs key regional indices
Index
Apr
16
May
16
Jun
16
Jul 1
6
Aug
16
Sep
16
Oct
16
Nov
16
Dec
16
Jan
17
Feb
17
Mar
17
KLSE (Index) JKCI index Sensex Index STI Index JKH Index
70
80
90
100
110
120
130
140
JKH high and low share prices per month
Apr
16
May
16
Jun
16
Jul
16
Aug
16
Sep
16
Oct
16
Nov
16
Dec
16
Jan
17
Feb
17
Mar
17
120
125
130
135
140
145
150
155
160
165Rs.
High
0
Low 30 day moving share average
* 30 day moving averages have been calculated using 15 days trailing and forward closing prices from the mid point of each month
Group Highlights | Governance | Management Discussion & Analysis | Financial Statements | Supplementary Information

108 John Keells Holdings PLC | Annual Report 2016/17
SHARE AND WARRANT INFORMATION
Group Consolidated Review
15 million unexercised ESOPs were eligible
for immediate exercise whilst the balance
20 million unexercised ESOPs will be vested
based on performance based conditions
in accordance with the terms of the Award.
The year also marked the conclusion of
ESOP Plan 7 which was initiated in 2011 at
a grant price of Rs.172.10. Further details
of the Company’s ESOP plans are found in
the ensuing section of this discussion. The
Global Depository Receipts (GDRs) balance
in ordinary share equivalents increased to
1,320,942 as at the end of the financial year
[2015/16: 1,282,364].
Subdivision of SharesThe Company received approval to subdivide
7 ordinary shares in existence into 8 ordinary
shares at the Extraordinary General Meeting
held on 24 June 2016. On this basis, the
1,189,403,549 shares in issue as at 24 May 2016
were subdivided into 1,359,318,342 shares.
Consequently, the ESOP awards granted, and
the number of Warrants accruing to the holders
of the 2016 Warrant, and their respective
exercise prices, were adjusted to reflect the
aforementioned subdivision of shares.
DividendThe Company’s dividend policy seeks to
ensure a dividend payout that corresponds
with growth in profits, whilst ensuring that
the Company maintains adequate funds to
support its investment pipeline and optimise
its capital structure, thus ensuring the
creation of sustainable shareholder wealth in
the short, medium and long term.
At this juncture, the Group believes that a
higher dividend per share is warranted given
the current, and anticipated, robust cash
flows of the businesses. It is pertinent to note
that the Group has a sufficient cash balance
available to deploy in the funding of new
projects, combined with its ability to leverage,
if required, even after taking into account the
equity commitments of the "Cinnamon Life"
project and other investments in the pipeline.
Dividend paid Dividend pay-out ratio
Distributions to shareholders
and payout ratio
Pay-out ratio % Rs. Bn
0
1
2
3
4
5
6
7
8
9
2011
/12
2012
/13
2013
/14
2014
/15
2015
/16
2016
/17
0
10
20
30
40
50
60
70
80
4649
41 42
34
47
To this end, the Company increased its
dividend per share, paid out of profits for
the financial year 2016/17, to Rs.6.00 from
Rs.3.50 per share (excluding the special
dividend of Rs.3.50 per share which was paid
on account of the cash inflow of Rs.4.14 billion
to the Company from the share repurchase of
Union Assurance PLC) paid out of profits in the
previous year. Excluding the special dividend
paid in the financial year 2015/16 (Rs.3.50 per
share), from a cash flow perspective, the total
dividend paid in the financial year 2016/17
(Rs.5.50 per share) increased significantly by
88 per cent to Rs.7.28 billion from Rs.3.88
billion in the previous year.
It should be noted that the Company profits
in 2016/17 included a one-off gain of Rs.2.58
billion pertaining to the exercise undertaken
to rationalise the Group’s shareholding
structure, which is discussed in detail in the
Other including Plantation Services Industry
Group Review section of the Report. Excluding
this gain, the dividend payout ratio for 2016/17
stands at 55.8 per cent.
Earnings Per Share The fully diluted earnings per share (EPS)
for the financial year, adjusted for the share
subdivision in June 2016, increased by 13 per
cent to Rs.11.84 per share [2015/16: Rs.10.52
per share] due to an increase in total profit
attributable to equity holders. On a recurring
earnings basis, the diluted EPS after adjusting
for changes in fair value of investment property,
has decreased marginally to Rs.10.31 in the
period under review from Rs.10.94 (after
adjusting for the share subdivision) recorded
in the previous financial year. The items
affecting the rise in profitability are discussed
in depth in the Group Consolidated Review and
Industry Group Review sections of this Report.
Total Shareholder Return As discussed previously, the ASPI fell marginally
by 0.2 per cent and the JKH share increased by
6 per cent. The total shareholder return (TSR)
of the JKH share stood at 10.7 per cent for the
period under review, which outperformed the
market with the total return index of the ASPI
recording a return of 0.1 per cent.
Annual TSR
21.7
19.218.8
6.8
(5.4)(2.5)
(0.4)
(12) (12.2)
10.0
4.6
* Includes the proportionate impact arising from the ownership of Warrants
Cumulative TSR
Total shareholder return (%)20
11/1
2
2012
/13
2013
/14
2014
/15
2015
/16
2016
/17
* * *
TSR for a holder of a single share after
the rights issue in 2013 with proportionate
ownership over the 2015 and 2016 Warrant,
assuming full conversion of the 2015 and 2016
warrants, improved to 10.0 per cent [2015/16:
negative 12.2 per cent]. This was caused by
the aforementioned rise in the JKH share price
on an adjusted basis along with the increase in
the standard dividend per share.
On a cumulative basis, over a five-year holding
period, the share inclusive of dividends and
warrants issued posted an annualised total
return of 1.4 per cent.
Unexpired Employee Share Options
Expiring year Granted Shares
(adjusted)
Outstanding End/current
priceVested To be vested
2018/19 9,959,017 6,948,058 1,818,312 191.65
2019/20 9,573,018 4,967,439 3,662,626 176.04
2020/21 8,819,207 2,747,662 5,474,817 149.84
2021/22 9,948,581 381,833 9,415,197 142.83
Total 38,299,823 15,044,992 20,370,952

109
Market Capitalisation and Enterprise
ValueThe market capitalisation of the Company
increased by 9 per cent to Rs.191.33 billion as
at 31 March 2017 [2015/16: Rs.176.03 billion].
At the financial year end, JKH represented 7.2
per cent of the total market capitalisation of
the CSE [2015/16: 6.8 per cent].
The enterprise value of the Group increased
by 10 per cent to Rs.136.02 billion [2015/16:
Rs.124.18 billion] as at 31 March 2017.
This increase was caused by the previously
discussed increase in market capitalisation
that outweighed the effects of the Company’s
strengthened cash position consequent to the
2016 warrant conversion.
Market Cap Enterprise Value
Market capitalisation
and enterprise value
Rs. Bn
0
50
100
150
200
250
2012
/13
2013
/14
2014
/15
2015
/16
2016
/17
Price to Earnings RatioThe price to earnings ratio (PER) of the
JKH share was 11.6 times as at the end of
the current financial year compared to 12.3
times recorded in the previous financial
year. The decrease in PER was attributable
to the 13 per cent increase in earnings per
share that was only partially offset by the
increase in share price. The JKH share, which
has historically traded at a premium, was
at a discount compared to the market PER
of the CSE of 11.9 times as at the end of the
financial year [2015/16: 15.3 times].
Given the domestic economic conditions that
prevailed during the year, the CSE traded at
a PER that was significantly lower than its
regional peers. At the end of the financial
year, the SENSEX Mumbai traded at 17.9
times, Kuala Lumpur’s FTSE Bursa Malaysia
KLCI was 16.6 times, Jakarta’s Composite
Index was 16.2 times and Singapore’s STI
was 14.8 times.
Price to Book The price to book value of the Group as at the financial year end was 1.0 times [2015/16: 1.1 times].
The ratio decreased on account of the increase in the net asset per share to Rs.140.06
[2015/2016: Rs.130.30], which was only partially offset by the increase in share price.
Liquidity During the financial year, 191 million shares changed hands over 30,106 transactions as against
177 million shares over 37,000 transactions in the previous financial year. The average daily
turnover of the JKH share was Rs.115 million, in comparison to the Rs.132 million recorded in
the previous financial year.
The average daily turnover of the JKH share represented 16 per cent of the average daily
turnover at the CSE during the financial year. The share turnover ratio for the financial year
decreased to 0.14 from 0.16 because of market conditions.
2016/17 2015/16 2014/15
Market cap (Rs. bn) 191.3 176.0 198.9
Enterprise value (Rs. bn) 136.0 124.2 155.7
Market value added (Rs. bn) 12.7 21.1 61.1
EV/EBITDA (times) 5.0 5.0 6.6
Diluted EPS (Rs.) 11.8 10.5 12.4
PER (diluted) 11.6 12.3 12.3
Price to book (times) 1.0 1.1 1.4
Price/cash earnings (times) 9.9 10.6 13.3
Dividend yield (%) 4.0 5.4 2.3
Dividend payout ratio (per cent) 45.9 46.7 33.5
TSR (%) 10.0 (12.2) (12.0)
Distribution and Composition of Shareholders The total number of shareholders of JKH as at 31 March 2017 increased to 11,988 from 11,515
recorded at the end of the previous financial year. Out of the total number of shares, 98 per cent
of the shares were held by the public whilst the remaining 2 per cent were held by Directors,
spouses and other connected parties.
In terms of residency of the shareholders, 46 per cent of the free float was held by 11,574
resident shareholders whilst the remainder was held by 406 non-resident shareholders, of
which most shares were owned by institutional shareholders.
Group Highlights | Governance | Management Discussion & Analysis | Financial Statements | Supplementary Information
Trend in composition of shareholders
%
Institutions:
Non-Resident
Resident
Individuals:
Non-Resident
Resident*
16
56
15
52 52
18 21
50
1 1 1 1
28 32 29 29
19
51
1
29
2012/13
2013/14
2014/15
2015/16
2016/17
* Includes Directors, spouses and connected parties

110 John Keells Holdings PLC | Annual Report 2016/17
Composition of Shareholders
31 March 2017 31 March 2016
Shareholders No. of shares (%) Shareholders No. of shares (%)
Institutions:
Non-Resident 147 714,471,877 51 137 592,427,458 50
Resident 710 265,969,422 19 681 247,554,155 21
Individuals:
Non-Resident 259 9,246,781 1 272 8,551,053 0
Resident* 10,872 397,779,057 29 10,425 340,870,883 29
Total 11,988 1,387,467,137 11,515 1,189,403,549
* Includes Directors, spouses and connected parties
Market Information of the Ordinary Shares of the Company
2016/17 Q4 Q3 Q2 Q1 2015/16
Share information
High 165.00 150.00 158.00 159.00 165.00 170.80*
Low 133.90 133.90 143.00 135.00 135.00 122.50*
Close 137.90 137.90 145.00 154.00 135.00 129.50*
Dividends paid (per share) 5.50 2.00 2.00 0.00 1.50 7.00
Trading statistics of the JKH share
Number of transactions 30,106 8,290 6,896 8,618 6,302 37,287
Number of shares traded ('000) 191,372 86,828 35,606 32,560 36,378 177,182
Value of all shares traded (Rs. mn) 27,955 12,157 5,341 4,804 5,653 31,391
Average daily turnover (Rs. mn) 115 196 88 79 94 132
Total market turnover (%) 15.7 26.7 12.9 10.0 13.3 13.8
Market capitalisation (Rs. mn) 191,332 191,332 200,970 209,155 183,310 176,032
Total market capitalisation (%) 7.2 7.2 7.3 7.5 6.8 6.8
* Adjusted for the 2016 share subdivision
Distribution of Shareholders
31 March 2017 31 March 2016
Number of
Shareholders(%)
Number of
shares held(%)
Number of
Shareholders(%)
Number of
shares held(%)
Less than or equal to 1,000 6,801 57 1,591,711 0 6,692 58 1,635,940 0
1,001 to 10,000 3,373 28 11,918,429 1 3,191 28 11,329,474 1
10,001 to 100,000 1,395 12 41,300,569 3 1,258 11 36,392,126 3
100,001 to 1,000,000 281 2 87,123,469 6 242 2 73,799,873 6
1,000,001 and over 138 1 1,245,532,959 90 132 1 1,066,246,136 90
Total 11,988 100 1,387,467,137 100 11,515 100 1,189,403,549 100
SHARE AND WARRANT INFORMATION
Group Consolidated Review

111
Top Twenty Shareholders of the Company
31 March 2017 31 March 2016
Number of shares (%) Number of shares (%)
Mr. S.E Captain 149,425,524 10.77 119,937,442 10.08
Broga Hill Investments Limited 141,854,717 10.22 124,122,878 10.44
Paints & General Industries Limited 96,064,501 6.92 92,726,824 7.80
Schroder International Selection Fund 53,706,223 3.87 38,491,960 3.24
Melstacorp PLC 52,023,842 3.75 43,616,626 3.67
Lux-Aberdeen Global Asia Pacific Equity Fund 31,257,908 2.25 26,234,282 2.21
Aberdeen Institutional Commingled Funds, LLC 29,706,813 2.14 23,772,318 2.00
HWIC Asia Fund 29,164,753 2.10 25,519,159 2.15
Lux-Aberdeen Global-Asian Smaller Companies Fund 26,913,338 1.94 28,979,913 2.44
Lux-Aberdeen Global-Emerging Markets Smaller Companies Fund 25,263,481 1.82 19,932,286 1.68
Employees Trust Fund Board 23,366,748 1.68 16,438,392 1.38
Mr. K. Balendra 19,606,476 1.41 18,111,218 1.52
London-Edingburgh Dragon Trust PLC 17,947,390 1.29 15,062,970 1.27
Deutsche Bank AG-London 15,837,770 1.14 35,868,199 3.02
London-Aberdeen Asia Pacific Equity Fund 14,891,083 1.07 12,497,857 1.05
Edgbaston Asian Equity Trust 13,971,919 1.01 - -
Norges Bank Account 2 13,746,333 0.99 - -
Mrs. C. S. De Foneseka 12,894,788 0.93 11,282,940 0.95
Mrs. S.A.J. De Fonseka 12,825,666 0.92 11,069,333 0.93
Somerset Small Mid Cap Em All Country Fund LLC 11,591,877 0.84 10,558,280 0.89
Director's Shareholding
31 March 2017 31 March 2016
S. Ratnayake 9,241,144 7,177,893
A. Gunewardene* 10,989,350 8,721,491
R. Peiris 2,966,800 2,074,755
K. Balendra* 10,914,400 8,019,934
G. Cooray 207,105 121,654
H. Wijayasuriya - -
A. Omar - -
N. Fonseka - -
A. Cabraal 137 120
P. Perera - -
* Includes shares owned by related parties
Director's Share Dealings
No. of 2016 Warrants
converted to shares
No. of ESOPs
converted to shares
S. Ratnayake 366,101 671,737
A. Gunewardene* 434,166 587,768
R. Peiris 91,858 503,794
K. Balendra 364,139 377,851
G. Cooray 4,162 63,910
H. Wijayasuriya - -
A. Omar - -
N. Fonseka - -
A. Cabraal - -
P. Perera - -
* Includes Warrants converted by related parties
Group Highlights | Governance | Management Discussion & Analysis | Financial Statements | Supplementary Information
Executive Director's Shareholding in Group Companies
Number of shares as at 31 March 2017
S. Ratnayake A. Gunewardene R. Peiris K. Balendra G. Cooray
Ceylon Cold Stores PLC 3,344 30,800 668 80,232 -
Trans Asia Hotels PLC 400 400 400 - 1,200
John Keells Hotels PLC 142,877 - - - -
Asian Hotels and Properties PLC 20,000 - - - 10,600
Keells Foods Products PLC - - - - -
Union Assurance PLC - 8,562 - - -

112 John Keells Holdings PLC | Annual Report 2016/17
Em
plo
yee
Sh
are
Op
tio
n P
lan
as
at
31
Ma
rch
20
17
Dat
e of
gran
t
Em
ploy
ee
cate
gory
Sh
ares
gran
ted
Exp
iry
date
Opt
ion
gra
nt
pric
e (R
s.)
Sh
ares
adju
sted
2
Vest
edE
xerc
ised
Can
cell
ed
Exp
ired
Out
stan
din
g
En
d/
curr
ent*
*
pric
e (R
s.)
Due
to
resi
gnat
ion
s
Due
to
perf
orm
ance
PL
AN
70
7.1
2.2
01
16
,30
6,1
82
06
.12
.20
16
17
2.1
0 9
,24
6,1
38
-
8,2
54
,79
83
36
,30
8 -
6
55
,03
2-
-
GE
C1
2,6
02
,48
24
,07
5,0
93
-4
,07
5,0
93
--
--
Oth
er
Exe
cuti
ves
3,7
03
,70
05
,17
1,0
45
-4
,17
9,7
05
33
6,3
08
-
65
5,0
32
-
PL
AN
83
01
.07
.20
13
6,4
26
,71
93
0.0
6.2
01
82
65
.18
9,9
59
,01
7
6,9
48
,05
8-
96
9,8
84
22
2,7
63
-
8,7
66
,37
0 1
91
.65
Aw
ard
1
GE
C1
2,7
12
,91
94
,27
6,8
37
3,2
87
,56
5-
- 6
9,5
80
-4
,20
7,2
57
Oth
er
Exe
cuti
ves
3,7
13
,80
05
,68
2,1
80
3,6
60
,49
3-
96
9,8
84
15
3,1
83
-
4,5
59
,11
3
PL
AN
84
01
.07
.20
14
7
,42
8,1
28
30
.06
.20
19
22
9.9
3 9
,57
3,0
18
4
,96
7,4
39
-8
54
,86
8 8
8,0
85
-
8,6
30
,06
5 1
76
.04
Aw
ard
2
GE
C1
2,8
16
,84
5
3
,65
4,3
58
2
,12
7,7
97
--
--
3,6
54
,35
8
Oth
er
Exe
cuti
ves
4,6
11
,28
3
5
,91
8,6
60
2,8
39
,64
2-
85
4,8
68
88
,08
5-
4,9
75
,70
7
PL
AN
85
25
.06
.20
15
6,7
81
,28
22
4.0
6.2
02
0 1
95
.71
8
,81
9,2
07
2
,74
7,6
62
3,2
24
54
2,1
98
51
,30
6-
8,2
22
,47
9
14
9.8
4
Aw
ard
3G
EC
12
,24
4,3
42
2,9
31
,37
8
1,1
09
,73
3-
--
- 2
,93
1,3
78
Oth
er
Exe
cuti
ves
4,5
36
,94
05
,88
7,8
29
1,6
37
,92
93
,22
45
42
,19
8 5
1,3
06
-
5,2
91
,10
1
PL
AN
96
15
.08
.20
16
9,9
48
,58
11
4.0
8.2
02
11
42
.83
9,9
48
,58
13
81
,83
3-
15
1,5
51
--
9,7
97
,03
01
42
.83
Aw
ard
1
GE
C1
2,6
25
,00
02
,62
5,0
00
25
0,0
00
--
--
2,6
25
,00
0
Oth
er
Exe
cuti
ves
7,3
23
,58
17
,32
3,5
81
13
1,8
33
-1
51
,55
1-
-7
,17
2,0
30
Tota
l3
6,8
90
,89
2
47
,54
5,9
61
1
5,0
44
,99
2
8,2
58
,02
2
2,8
54
,80
9
36
2,1
54
6
55
,03
2
35
,41
5,9
44
1
GE
C c
om
pri
se
s o
f th
e E
xecu
tive
Dir
ect
ors
an
d P
resid
en
ts2
A
dju
ste
d f
or
bo
nu
s issu
es/r
igh
t is
su
es/s
ub
div
isio
ns
3
Pla
n 8
(A
wa
rd 1
) -
75
% o
f th
e o
pti
on
s h
ad
ve
ste
d a
s a
t 3
1 M
arc
h 2
01
7 w
ith
th
e e
xce
pti
on
of
reti
ree
s4
P
lan
8 (
Aw
ard
2)
- 5
0%
of
the
op
tio
ns h
ad
ve
ste
d a
s a
t 3
1 M
arc
h 2
01
7 w
ith
th
e e
xce
pti
on
of
reti
ree
s5
P
lan
8 (
Aw
ard
3)
- 2
5%
of
the
op
tio
ns h
ad
ve
ste
d a
s a
t 3
1 M
arc
h 2
01
7 w
ith
th
e e
xce
pti
on
of
reti
ree
s6
P
lan
9 (
Aw
ard
1)
- N
on
e o
f th
e o
pti
on
s h
ad
ve
ste
d a
s a
t 3
1 M
arc
h 2
01
7 w
ith
th
e e
xce
pti
on
of
reti
ree
s
Group Consolidated Review
Op
tio
ns
Ava
ila
ble
to
Exe
cuti
ve D
ire
cto
rs U
nd
er
the
Em
plo
yee
Sh
are
Op
tio
n P
lan
S. R
atn
aya
keA
. Gu
new
ard
ene
R. P
eiri
sK
. Ba
len
dra
G. C
oo
ray
Expi
ring
yea
rG
rant
ed
shar
es1
Imm
edia
tely
vest
ing
To b
e ve
sted
Gra
nted
shar
es1
Imm
edia
tely
vest
ing
To b
e
vest
ed
Gra
nted
shar
es1
Imm
edia
tely
vest
ing
To b
e
vest
ed
Gra
nted
shar
es1
Imm
edia
tely
vest
ing
To b
e
vest
ed
Gra
nted
shar
es1
Imm
edia
tely
vest
ing
To b
e
vest
ed
20
18
/19
68
5,1
67
5
13
,87
5
17
1,2
92
5
99
,52
3
44
9,6
42
1
49
,88
1
51
3,8
75
38
5,4
06
12
8,4
69
3
85
,40
52
89
,05
3 9
6,3
52
1
11
,84
4
83
,88
3
27
,96
1
20
19
/20
60
6,3
77
3
03
,18
8
30
3,1
89
5
30
,58
0
26
5,2
90
2
65
,29
0
45
4,7
84
22
7,3
92
22
7,3
92
3
41
,08
61
70
,54
3 1
70
,54
3
10
5,7
10
5
2,8
55
5
2,8
55
20
20
/21
44
6,6
86
1
11
,67
1
33
5,0
15
3
90
,85
1
97
,71
2
29
3,1
39
3
35
,01
48
3,7
53
25
1,2
61
2
51
,26
16
2,8
15
18
8,4
46
2
51
,26
1
62
,81
5
18
8,4
46
20
21
/22
35
0,0
00
-
3
50
,00
0
32
5,0
00
-
3
25
,00
0
30
0,0
00
-
30
0,0
00
3
00
,00
0 -
3
00
,00
0
30
0,0
00
-
3
00
,00
0
Tota
l 2
,08
8,2
30
9
28
,73
4
1,1
59
,49
6
1,8
45
,95
4
81
2,6
44
1
,03
3,3
10
1
,60
3,6
73
6
96
,55
1
90
7,1
22
1
,27
7,7
52
5
22
,41
1
75
5,3
41
7
68
,81
5
19
9,5
53
5
69
,26
2
1
Ad
juste
d f
or
sh
are
su
bd
ivis
ion
s
SHARE AND WARRANT INFORMATION

113
Share Capital
Year ended 31 March Number of shares in issue
(million)
2005 331.63
2006 400.00
2007 552.94
2008 635.99
2009 611.35
2010 619.47
2011 629.69
2012 844.12
2013 857.24
2014 990.29
2015 997.49
2016 1,189.40
2017 1,387.47
Dividend
Year ended 31 March DPS*
(Rs.)
Dividends
(Rs. ’000)
2005 3.00 1,027,497
2006 3.00 1,199,460
2007 3.00 1,412,306
2008 5.00 3,176,302
2009 3.00 1,883,442
2010 3.00 1,843,642
2011 3.00 1,868,707
2012 3.00 2,313,519
2013 3.50 2,982,421
2014 3.50 3,266,718
2015 3.50 3,475,947
2016 7.00 8,037,790
2017 5.50 7,280,497
* Includes special dividends where applicable
2016/17 Financial Calendar
Date
Interim Financial Statements
Three months ended 30 June 2016 28 July 2016
Six months ended 30 September 2016 4 November 2016
Nine months ended 31 December 2016 26 January 2017
First interim dividend paid on 24 October 2016
Second interim dividend paid on 16 February 2017
Final dividend proposed to be paid on 16 June 2017
Annual Report 2016/17 31 May 2017
38th Annual General Meeting 30 June 2017
2017/18 Financial Calendar
Date
Interim Financial Statements
Three months ended 30 June 2017 On or before 27 July 2017
Six months ended 30 September 2017 On or before 2 November 2017
Nine months ended 31 December 2017 On or before 25 January 2018
Annual Report 2017/18 On or before 1 June 2018
39th Annual General Meeting On or before 29 June 2018
GDR History (in terms of ordinary shares, million)
Year ended
31 March
Opening
balance
Issued* Converted/
repurchased
Closing
balance
2005 0.65 0.06 - 0.71
2006 0.71 0.14 - 0.85
2007 0.85 0.12 - 0.97
2008 0.97 0.14 - 1.11
2009 1.11 - 0.12 0.99
2010 0.99 - 0.01 0.98
2011 0.98 - 0.03 0.95
2012 0.95 0.32 0.08 1.19
2013 1.19 - 0.06 1.13
2014 1.13 - 0.01 1.12
2015 1.12 - - 1.12
2016 1.12 0.16 - 1.28
2017 1.28 0.18 0.14 1.32
1 GDR is equivalent to 2 ordinary shares
* First issued in FY1994 and subsequently increased along with bonus
issues and subdivision of shares
History of Scrip Issues, Rights and Repurchases
Year ended
31 March
Issue Basis Number
of shares
(million)
Ex-date
2005 Bonus 1:10 30 13 May 2004
2006 Bonus 1:5 66 11 May 2005
2007 Bonus 1:7 57 13 June 2006
2007 Rights @ Rs.140* 1:5 92 23 January 2007
2007 Bonus 1:7 79 13 March 2007
2009 Repurchase 1:25 26 11 October 2008
2012 Sub division 4:3 210 30 June 2011
2013 Rights @ Rs.175* 2:13 132 3 October2013
2015 Share subdivision 8:7 143 3 July 2015
2016 Share subdivision 8:7 170 30 June 2016
* Unadjusted prices
Group Highlights | Governance | Management Discussion & Analysis | Financial Statements | Supplementary Information

I N D U S T R Y G R O U P R E V I E W
Designing Strategy
116 Transportation • 124 Leisure • 136 Property • 144 Consumer Foods and Retail
• 154 Financial Services • 160 Information Technology • 166 Other including Plantation Services

115Group Highlights | Governance | Management Discussion & Analysis | Financial Statements | Supplementary Information
INDUSTRY GROUP FINANCIAL AND NON-FINANCIAL HIGHLIGHTS
Industry Group Review
Revenue* (Rs. billion)
TR
P
Leis
ure
Pro
pert
y
CF
&R
Fin
Ser
IT
Oth
er
2014/15 20.11 23.42 5.69 29.76 12.99 7.21 3.47
2015/16 16.83 24.31 4.34 36.46 11.90 8.26 2.66
2016/17 18.44 26.14 1.12 45.81 14.06 11.11 2.95
* Revenue is inclusive of the Group's share of equity accounted investees revenue
EBIT (Rs. billion)
TR
P
Leis
ure
Pro
pert
y
CF
&R
Fin
Ser
IT
Oth
er
2014/15 2.41 5.74 1.64 2.57 3.08 0.38 3.41
2015/16 2.52 5.13 1.68 4.50 2.30 0.16 3.91
2016/17 3.12 5.92 0.69 5.49 2.10 0.62 5.38
Capital Employed (Rs. billion)
TR
P
Le
isu
re
Pro
pe
rty
CF
&R
Fin
Se
r
IT
Oth
er
2014/15 15.49 50.59 31.66 7.54 11.78 2.41 54.54
2015/16 15.91 52.45 38.59 8.62 7.24 2.29 64.14
2016/17 16.59 66.56 42.54 9.54 7.73 2.33 71.81
Total Assets (Rs. billion)
TR
P
Le
isu
re
Pro
pe
rty
CF
&R
Fin
Se
r
IT
Oth
er
2014/15 16.66 55.40 34.89 12.95 37.13 3.75 57.31
2015/16 17.16 57.65 43.93 15.86 35.88 4.12 66.37
2016/17 18.06 72.00 48.33 18.28 41.72 4.78 74.10
Employees (number)
TR
P
Le
isu
re
Pro
pe
rty
CF
&R
Fin
Ser
IT
Oth
er
2014/15 326 5,147 107 3,427 718 1,224 941
2015/16 349 5,073 102 3,692 803 985 882
2016/17 385 5,041 244 4,446 814 1,075 830
Carbon Footprint (MT)
TR
P
Le
isu
re
Pro
pe
rty
CF
&R
Fin
Se
r
IT
Oth
er
2014/15 2,313 39,698 59 26,441 1,550 1,309 3,898
2015/16 2,091 40,767 525 29,060 1,407 1,269 3,543
2016/17 1,690 40,670 924 33,407 1,391 1,076 3,334
2015 / 16
2016 / 17
2014 / 15
0 20 40 60 80 100
20 23 6 29 13 7 2
16 23 4 35 11 8 3
15 22 1 38 12 9 3
%
2015 / 16
2016 / 17
2014 / 15
0 20 40 60 80 100
13 30 9 13 16 2 17
12 25 8 23 11 2 19
13 25 3 24 9 3 23
%
2015 / 16
2016 / 17
2014 / 15
0 20 40 60 80 100
9 29 18 4 7 2 31
8 28 20 5 4 1 34
8 31 20 4 3 1 33
%
2015 / 16
2016 / 17
2014 / 15
0 20 40 60 80 100
8 25 16 6 17 2 26
7 24 18 7 15 2 27
6 26 17 7 15 2 27
%
2015 / 16
2016 / 17
2014 / 15
0 20 40 60 80 100
3 43 1 29 6 10 8
3 43 1 31 7 8 7
3 39 2 35 6 8 7
%
2015 / 16
2016 / 17
2014 / 15
0 20 40 60 80 100
3 53 35 2 2 5
3 52 37 2 2 4
2 49 1 41 21 4
%
TRP Transportation
Leisure Leisure
Property Property
CF&R Consumer Foods and Retail
Fin Ser Financial Services
IT Information TechnologyOther Other including Plantation Services

116 John Keells Holdings PLC | Annual Report 2016/17
15%Revenue
13%EBIT
8%Capital employed
2%Carbon footprint
Our Business ModelVision and Scope
The vision of the Transportation industry
group is to be recognised as a leading
provider of transportation solutions and
related services through a diversified
portfolio of businesses in selected
markets. These operations comprise of a
container terminal in the Port of Colombo,
a marine bunkering business, joint venture/
associations with leading shipping, logistics
and air transportation multinationals, as well
as travel and airline services in Sri Lanka and
the Maldives.
A wide array of transportation solutions
including container handling at SAGT, logistics
by JKLL, and air transportation services. SAGT
was also recognised as the “Best Terminal
in South Asia” by the Global Ports forum in
February 2017.
TRANSPORTATION
Industry Group Review
Contribution to JKH Group
Ports and Shipping
Transportation CO2
0.15 MT perRs.mn revenue

117Group Highlights | Governance | Management Discussion & Analysis | Financial Statements | Supplementary Information
Sectors Ports and Shipping Transportation
The business within
the sector
• Operation of a container terminal in the Port of Colombo
as a public-private partnership on a build, operate
and transfer (BOT) basis through South Asia Gateway
Terminals (SAGT)
• Associate stake in Maersk Lanka, agents in Sri Lanka
and the Maldives for Maersk Line and Safmarine
• Logistics services include the operation of DHL air
express in Sri Lanka, a joint venture with Deutsche
Post, third party logistics (3PL), warehousing, trucking
and freight forwarding solutions under the John Keells
Logistics brand and a joint venture with XPO Logistics
(referred to as NDO), marine bunkering and related
services under Lanka Marine Services (LMS) as well
as airline, aviation, travel and related services through
Saffron Aviation (owners and operators of Cinnamon
Air), Mack Air and Mackinnons American Express
Key external/
internal variables
impacting the
business
• The total volume through the Port of Colombo for
the financial year 2016 grew by 9 per cent, with
transshipment and domestic volumes growing by
9 per cent and 16 per cent respectively, although
the performance of the regional shipping and ports
industry declined
• Possibility of further consolidation of global shipping
lines through mergers, acquisitions and alliances to
benefit from greater operational efficiencies through
cost pooling and strengthened purchasing power
• Improved prospects in the ports and shipping industry
in Colombo and Hambantota for private sector
participation
• Prospects for further private sector participation in
the bunkering industry
• Growth in demand for 3PL offerings on the back of
more local businesses aspiring to global benchmarks
and significant shifts to organised retail
• Increase in capacity in the airline industry through the
entry of new players and intensified competition from
existing players
• Continued strong occupancies on the East coast and
significant hotel developments on the Southern coast
of Sri Lanka increasing the opportunities for domestic
air transport
Key developments
during the financial
year
• SAGT recognised as the "Best Terminal in South Asia",
awarded by the Global Ports Forum in February 2017
• LMS maintained its market leadership position in the
bunkering industry
• JKLL launched “Store4u”, an online storage solution
for individuals and SMEs
Key Indicators
Inputs (Rs.mn) 2016/17 2015/16 (%) 2014/15
Total assets 18,065 17,163 5 16,656
Total equity 14,841 15,028 (1) 14,232
Total debt 1,754 878 100 1,255
Capital employed1 16,595 15,905 4 15,486
Employees (number)2 385 349 10 326
1 For equity accounted investees the capital employed is representative of
the Group’s equity investment in these companies
2 Excludes SAGT, DHL, Maersk Lanka, NDO and Cinnamon Air
3 Turnover is inclusive of the Group’s share of equity accounted investees
4 As per the sustainability reporting boundary
Outputs (Rs.mn) 2016/17 2015/16 (%) 2014/15
Turnover3 18,438 16,829 10 20,114
EBIT 3,124 2,517 24 2,412
PBT 3,098 2,495 24 2,359
PAT 2,979 2,454 21 2,335
EBIT per employee4 8.1 7.2 13 7.4
Carbon footprint (MT)2 1,690 2,091 (19) 2,313

118 John Keells Holdings PLC | Annual Report 2016/17
TRANSPORTATION
Industry Group Review
External Environment and Operational
Review The Port of Colombo recorded a growth in
volumes of 9 per cent during the financial
year under review [2015/16: 6 per cent],
despite the muted performance of the
global ports and shipping industry and other
regional ports such as Singapore, Shanghai
and Hong Kong; underscoring the strategic
location and potential of the Port of Colombo.
The overall growth was mainly driven by the
existence of deep water terminal facilities
which can cater to new generation container
vessels, combined with its strategic link to
key trade routes.
During the financial year, the Group’s Port
business, South Asia Gateway Terminals
(SAGT), recorded encouraging growth of 22
per cent, handling 1.70 million twenty foot
equivalent units (TEUs) with transshipment
volumes accounting for 80 per cent of total
volumes, in comparison to the 1.40 million
TEUs handled during the previous year,
where transshipment volumes contributed to
77 per cent of total volumes. The increased
activity witnessed across the Port of Colombo
enabled SAGT to increase its market share in
2016/17.
During the year under review, SAGT
continued to focus on improving the
productivity of its operations through various
cost management initiatives and productivity
enhancing measures. SAGT’s continued effort
to improve productivity and performance
proved fruitful with it being recognised as the
"Best Terminal in South Asia" by the Global
Ports Forum in February 2017.
The Port of Colombo operated at a capacity
in excess of 70 per cent during the calendar
year, highlighting the need for an increase
in capacity to facilitate growth. Growth in
deep draft handling capacity is a current
and crucial requirement at the Port of
Colombo, especially considering its strategic
location along the East-West sea route,
and the growth opportunities Sri Lanka
can capitalise on in the context of regional
growth led by India and the “Belt and Road”
initiative launched by China. In keeping with
addressing the need for growth, the Sri Lanka
Ports Authority (SLPA) called for Expressions
of Interest (EOI) in developing and operating
the East Container Terminal (ECT) in June
2016. The Group, together with its consortium
partners, APM Terminals and CONCOR
(Container Corporation of India), submitted
an expression of interest in September 2016.
However, a decision on the EOIs and the next
steps regarding the development of ECT is
still being awaited.
Lanka Marine Services (LMS), the Group’s
Bunkering business, maintained its position
as the market leader despite price competition
from bunker suppliers operating in Colombo,
and, to a lesser extent, India. The year under
review witnessed a significant increase in the
base prices of bunker fuels compared to the
previous year, which resulted in an improved
top line of the business. LMS recorded
promising volume growth during the fourth
quarter, aided by the overall growth in the
Port of Colombo.
LMS continued to leverage on its market
leadership position and reputation to improve
its procurement strategy and supplier
relationships. During the year under review,
the company contracted to install flow meters
to its bunker barges to improve service and
quality standards offered to its customers.
The meters are expected to be installed in the
first quarter of 2017/18, which will provide
LMS a first mover advantage for higher
service quality within the Sri Lankan market.
Furthermore, LMS will upgrade its delivery
infrastructure in the ensuing year when “MT
Lanka Marine Mahaweli”, a new 2,200 MT
barge is commissioned in April 2017.
John Keells Logistics Limited (JKLL) recorded
an increase in total throughput managed,
driven by the growth in volumes handled for
its existing customers and the rise in demand
from domestic companies, increasingly
seeking to outsource components of their
supply chain. During the year under review,
JKLL’s focus on improving productivity across
its facilities led to a 42 per cent increase in
total throughput managed. Leveraging on
the cross sectoral opportunities within the
Group, JKLL, together with Jay Kay Marketing
Services - the operators of the Keells Super
chain of supermarkets, developed and
finalised the feasibility for a state-of-the-art
distribution centre for its business. Further
details on the distribution centre can be found
in the Consumer Foods and Retail Industry
Group Review section of this Report.
Rs.3.10Bn
Transportation industry group PBTA 24 per cent growth
DHL Keells witnessed promising growth in the
year under review with inbound and outbound
volumes experiencing a healthy growth of 9
per cent over the previous year. During the
year under review, the company recorded an
increase in market share, stemming from a
number of new marketing initiatives which
were rolled out during the year. As part of its
continuous efforts to maintain its position as
the service provider of choice, and operate at
a higher level of productivity and efficiency,
DHL Keells invested in a fleet of new vehicles.
The Airline SBU witnessed significant growth in
the year, as expected, with double digit growth
in both cargo and passenger segments of the
business. KLM, Gulf Air and Mega Maldives
Airlines, represented by Mack Air (MAL) as
general sales agents, commenced "on-line"
operations with multiple weekly flights, during
the 2016/17 financial year. This translated
into significant volume increases in both the
passenger and cargo segments of the business
with total volumes increasing by 24 per cent
and 36 per cent respectively in the year.
Cinnamon Air witnessed double-digit growth
in passenger volumes from both scheduled
and charter flight operations, primarily on
account of the 14 per cent increase in tourist
arrivals to Sri Lanka during the calendar
year 2016. Despite facing a few challenges
The Port of Colombo recorded a
growth in volumes of 9 per cent
during the financial year under
review [2015/16: 6 per cent],
despite the muted performance
of the global ports and shipping
industry.
During the financial year, the Group’s
Port business, South Asia Gateway
Terminals recorded a throughput
growth of 22 per cent

119
Financial and Manufactured Capital
As at 1 April 2016, the Transportation industry
group had total assets amounting to Rs.17.16
billion, debt amounting to Rs.878 million and
an opening equity capital of Rs.15.03 billion.
Financial Performance
Revenue of the Transportation industry group
increased by 7 per cent to Rs.11.11 billion
compared to the Rs.10.34 billion recorded
in the previous financial year, primarily due
to the Bunkering business, Lanka Marine
Services, arising from a significant increase
in the base price of bunker fuels in addition
to the double digit volume growth. Revenue,
including equity accounted investees,
increased by 10 per cent to Rs.18.44 billion
[2015/16: Rs.16.83 billion], attributable to the
growth in TEUs handled by the Group’s Ports
business and the aforementioned revenue
increase in the Bunkering business.
0% 20% 40% 60% 80% 100%
Turnover
2014/15
2015/16
Ports and ShippingTransportation
2016/17
75
71
71
25
29
29
0% 20% 40% 60% 80% 100%
EBIT
2014/15
2015/16
2016/17
17
27
31
83
73
69
EBIT of the industry group increased by
24 per cent to Rs.3.12 billion compared to
the Rs.2.52 billion recorded in 2015/16.
The growth in volumes in the Bunkering
business, improved performance at DHL
Keells and full utilisation of the warehousing
facility in the Logistics business contributed
towards the improved performance. The PBT
of the Transportation industry group, which
amounted to Rs.3.10 billion [2015/16: Rs.2.50
billion], mirrored the growth of EBIT at 24 per
cent.
Borrowings and Finance Expense
Total debt as at 31 March 2017 stood at
Rs.1.75 billion [2015/16: Rs.878 million)].
The finance expense for the financial year
increased by 17 per cent to Rs.25 million
[2015/16: Rs.22 million]. The marginal
increase in the finance expense was mainly
attributable to the increase in short term
debt facilities obtained by LMS as a result
of increasing working capital finance
requirements. The disproportionate increase
of the finance expense on a large debt base
is also attributable to LMS being able to
negotiate the cost of borrowing on several of
its loans.
Return on Capital Employed
• The ROCE of the industry group increased
to 19.2 per cent from the 16.0 per cent
recorded in the previous financial year,
driven by the aforementioned increase
in EBIT, partially offset by the increase in
the capital base of the industry group as
a result of the aforementioned increase
in the total debt level
• The EBIT margin of the industry group
was 16.9 per cent as at the end of the
financial year [2015/16: 15.0 per cent]
• The asset turnover stood at 1.05 times
in comparison to 1.00 times in the
previous financial year, as a result of the
aforementioned increase in turnover.
It should also be noted that the asset
base of the industry group increased by
5 per cent to Rs.18.06 billion inclusive
of revaluation gains amounting to Rs.62
million
Key indicators under each form of Capital are as follows;
Sectors Ports and Shipping Transportation
Financial and Manufactured Capital -
revenue and growth
Rs.5.42 billion, 10 per cent
increase
Rs.13.01 billion, 9 per cent
increase
Financial and Manufactured Capital -
EBIT and growth
Rs.2.16 billion, 18 per cent
increase
Rs.965 million, 42 per cent
increase
Natural Capital - carbon footprint Not within the boundary of
sustainability reporting 1,690 MT
Human Capital - number of
employees
Not within the boundary of
sustainability reporting 385
as a result of the restriction in operations
due to the resurfacing and expansion of the
runway of the Bandaranaike International
Airport (BIA) from January to April 2017 and
the sporadic unavailability of its amphibious
aircraft during peak season, Cinnamon Air
managed its operations successfully with
minimal schedule disruptions.
The Freight Forwarding business, NDO Lanka
(NDO) continued to grow its project cargo
vertical to target emerging infrastructure and
real estate projects. NDO was successful in
acquiring large scale opportunities in this
vertical, including a project in Northern Sri
Lanka, among others.
The travel business, Mackinnons American
Express (MAET), invested in an online booking
application in the year under review in order
to compete in the online travel market space.
Further investments were undertaken in
order to increase staff productivity and
enable scalability.
Capital Management Review Further to the external environment and
operations review, this section outlines the
forms of Capital available for the execution of
the businesses’ near, medium and long term
strategies in creating value and discusses the
performance of the sectors under each form
of Capital.
Group Highlights | Governance | Management Discussion & Analysis | Financial Statements | Supplementary Information
ROCE2016/17: 19.2%[2015/16: 16.0%]
EBIT margin16.9%
Asset/Debt + Equity1.08
Asset turnover1.05
Return on Capital Employed

120 John Keells Holdings PLC | Annual Report 2016/17
TRANSPORTATION
Industry Group Review
Natural Capital
Transportation infrastructure, connectivity
and adherence to international standards
are prerequisites for economic growth and
value creation in the country, and therefore
it is necessary that the industry ensures it
is environmentally responsible and actively
seeks to minimise any negative impacts on
the country’s Natural Capital. Within this
framework, the Transportation industry group
operates under the Group’s Environment and
Energy Management policy, as a means of
managing its environmental footprint.
The material impacts for the industry group
are classified below:
Energy and
emissions
management
Financial implications
and environmental
responsibility
Waste
management
Regulatory and
environmental
responsibility
Energy and Emissions ManagementTargets:
• Internal fuel efficiency targets for
vehicle and aircraft fleet to reduce fuel
consumption and emissions
Initiatives:
• Daily monitoring of fuel consumption and
ongoing analysis of sales routes for route
optimisation to increase efficiency
Waste ManagementTargets:
• Adherence to Marine Environmental
Pollution Authority (MEPA) and other best
practices
Initiatives:
• JKLL disposes FMCG waste, recycles
stretch film and cardboard waste
generated in its operations through
certified third party contractors ensuring
responsible disposal of waste
• LMS conducts monthly drills on
prevention of oil spillages for its
employees to minimise the resulting
impact in the event of an accidental spill
• Waste on barges resulting from bunkering
operations are disposed through a MEPA
certified third party contractor to ensure
responsible disposal of waste
Health and safety practices at JKLL
Performance
The carbon footprint of the Transportation industry group (excluding SAGT, DHL, Maersk Lanka,
NDO and Cinnamon Air, which are beyond the sustainability reporting boundaries) was 1,690 MT,
a 19 per cent reduction from the previous year. No significant spillages were reported during
the year under review.
2016/17 2015/16 (%)
Carbon footprint (MT) 1,690 2,091 (19)
Waste disposed (kg) 124,371 109,243 14
Carbon footprint scope 1 and 2 per operational intensity factor
2016/17 2015/16
LMS CO2 (kg per MT of bunkers sold) 5.3 5.7
JKLL CO2 (kg per m2 of warehouse area managed) 2.4 4.5
Waste generated per operational intensity factor
2016/17 2015/16
LMS waste generated (kg per MT of bunkers sold) 0.3 0.3
JKLL waste generated (kg per m2 of warehouse area managed) 0.3 0.3
Human Capital
The Transportation industry group places
significant emphasis on health and safety,
given the nature of some of its businesses
which have a greater propensity towards
accidents at warehouses, other facilities and
road accidents among others. The Group’s
health and safety policy strives to create
awareness at an industry group level and
provide training on occupational safety to
ensure a safe and healthy work environment
to its employees.
In keeping with the progressive changes in
demand by key players and customers, the
industry group encourages the growth of
the overall industry by investing in people,
thereby producing qualified professionals in
the logistics and transportation fields. This
continuous investment has led to the industry
group’s higher inclination towards service
quality and dependability from a purely cost-
centric platform. To meet such demands, and
to sustain and capitalise on the envisaged
momentum in growth, investment in Human
Capital is considered vital, alongside the
investment in infrastructure, processes and
systems.

121
The material impacts for the industry group
are classified as follows:
Talent
management
The need to retain and
continuously upgrade skills
of existing staff, while
developing a resource base
of professionals for the
country’s transportation
industry
Health and
safety
Labour and productivity
concerns as the Group
places significant
emphasis on providing a
safe working environment
for its employees and
stakeholders
Talent ManagementTargets:
• Continuous training and skill development
• Build a resource base of qualified
transportation and logistics professionals
Initiatives:
• The Transportation industry group
provided 2,490 hours of training to its
employees, in line with its strategy of
increased focus on staff training and
development, to further the capacity and
efficiency across operationally critical
areas
• The Transportation industry group
continued to sponsor the scholarship
programme for undergraduates reading
for the Bachelor of Science in Transport
and Logistics Management at the
University of Moratuwa
• Internship opportunities were provided
for students in the aforesaid scholarship
programme to provide on-the-job
training and career development
opportunities with the aim of identifying
and absorbing new talent into the Group
upon graduation
Impact through CSR initiatives:
The Moratuwa University Transport and
Logistics degree programme was continued
in the year under review. The programme
aims to address the skills mismatch within
the industry by developing the knowledge
and skills of undergraduates in the fields of
aviation, shipping, logistics and supply chain
management among others. An aggregate
of 23 scholarships were awarded during the
year, on both a need and merit based scheme.
Additionally, the industry group continues to
sponsor and support tailor-made English
language training programmes through the
Gateway Language Centre to first year under-
graduates and a mentoring programme run
by the Transport and Logistics Management
Department for 51 and 57 undergraduates
respectively. Six graduates from the degree
programme were offered employment
opportunities within the Group from the
inception of the programme while 5 students
(currently studying in the programme) were
offered internship opportunities and industry
exposure during the financial year.
Health and SafetyTarget:
• Ensuring no more than one warehouse
injury and less than five major road
accidents with impact to third parties, per
month
Initiatives:
• JKLL and LMS continued to maintain
OHSAS 18001 certification on health
and safety practices and conducts fire
and safety training for employees on a
regular basis resulting in a safe work
environment and maximising productivity
• LMS organised a first aid training
programme conducted by Red Cross
certified trainers, with invitations
extended to businesses from the entire
Transportation industry group. At present,
the industry group has seventeen Red
Cross certified first aiders
Performance
The industry group provided staff with 7
hours of training per employee, while 2
injuries were recorded during the year under
review.
2016/17 2015/16 (%)
Injuries and diseases (number) 2 1 100
Total hours of training 2,490 1,761 41
University of Moratuwa undergraduates participating in an English immersion camp sponsored by the Transportation industry group
Group Highlights | Governance | Management Discussion & Analysis | Financial Statements | Supplementary Information
The Moratuwa University Transport and Logistics degree programme
aims to address the skills mismatch within the industry by developing
the knowledge and skills of undergraduates in the fields of aviation,
shipping, logistics and supply chain management.

122 John Keells Holdings PLC | Annual Report 2016/17
TRANSPORTATION
Industry Group Review
Social and Relationship Capital
The Transportation industry group, through
its numerous business offerings, connects
multiple entities across and within the
borders of the country. The Port of Colombo,
within which the Group’s Port business
SAGT operates, is strategically positioned
on the main global East-West shipping route
enabling better connectivity for the South
and East Asian markets with Africa, Europe,
and the East Coast of the US, providing ideal
connections for trading in the Indian sub-
continent.
Intellectual Capital
Product and service quality standards are of
significant importance to the Transportation
industry group. The following initiatives were
undertaken during the year under review, and
as a result, certain accolades were received.
• The businesses within the Transportation
industry will continue to strive towards
developing a competitive advantage
over traditional logistics companies by
focusing on innovative and technology
led solutions for its customers -
characteristics that would be vital in long
term operations. To this end, digitisation
initiatives were rolled out across the
industry group in an effort to differentiate
and keep pace with the dynamic demands
of the consumers and key stakeholders
• Real time stock turn updates, integrated
SAP and warehouse management
software systems have enhanced the
service offering within the industry group
The Bunkering business has continued to
enhance its mutually beneficial procurement
contract with a leading petroleum company in
India. In order to ensure healthy relationships
with stakeholders and to mitigate any
negative sustainability impacts, companies
assess all significant suppliers, including
suppliers providing janitorial and other
outsourced services.
The following initiatives were taken by
the businesses within the industry group.
- Mackinnons Travels Limited invested
in an online booking application
towards becoming more competitive
in the online travel market space
- NDO developed a mobile application
to provide shipment status updates
for import clearance customers
• JKLL became the first logistics company
in Sri Lanka to be awarded the ISO
9001:2015 certification
• DHL won the Stevie International
Business Award for Customer Service
Strategy and Outlook The Port of Colombo is expected to continue
its growth trajectory, given its positioning
as a leading maritime hub in the region
and the availability of some capacity.
However, the overall capacity utilisation
of the Port of Colombo is now in excess of
70 per cent within a relatively short time
span since the expansion of capacity with
the commissioning of the South Container
Terminal, demonstrating the strong potential
for capacity led growth in the Port of Colombo.
In this context, the development of the deep-
draft East Container Terminal (ECT) is critical
to ensure volume led growth is sustained
at the Port. Subsequent to the Expression
of Interest submitted in September 2016 in
this regard, the Group will look to leverage on
this investment opportunity considering the
overall prospects for the Port of Colombo. The
ability for the ECT to cater to larger vessels
will complement the operations of SAGT
considering its back to back location.
The Bunkering business will continue to invest
in strengthening its delivery infrastructure
and leverage on its strong brand and existing
relationships, with both customers and
suppliers alike, to maintain its position as
the market leader in the face of increasing
competition. The Group will explore avenues
to capitalise on the opportunities within the
Port of Hambantota, which are expected to
materialise in the near term.
The expected growth in regional and
international trade, combined with focused
infrastructure development, is expected to
transform Sri Lanka beyond a container
transshipment hub into a regional logistics
The expected growth in regional and international trade, combined with
focused infrastructure development, is expected to transform Sri Lanka
beyond a container transshipment hub into a regional logistics hub in the
medium term. Sri Lanka is uniquely positioned to capture this growth
given the comparatively lower costs, skilled labour and ease of access to
the ever growing subcontinent markets.
The Port of Colombo is strategically
positioned on the main global East-West
shipping route, linking the Far East with
Africa, Europe, and the East Coast of
the US, providing ideal connections for
trading in the Indian sub-continent
Significant Suppliers
Warehouse operations
Capital equipment
Outsourced vehicle fleet
Maintenance, support services and
outsourced employees

123
hub in the medium term. Sri Lanka is
uniquely positioned to capture this growth
given the comparatively lower costs, skilled
labour and ease of access to the ever growing
subcontinent markets.
The Logistics business will continue to
engage with key clients and evaluate the
potential for purpose built and anchored
facilities. JKLL will focus on expanding its
footprint and customer base to include long
term integrated customer relationships. The
business will also continue to engage with
the Group’s Retail sector with regard to the
development of a state-of-the-art distribution
centre, which can handle a variety of dry,
fresh and chilled supplies to its growing base
of outlets. Additionally, the business will seek
to leverage on opportunities that may arise
from key development projects, such as the
Port City Colombo (PCC) development.
Furthering the digitisation drive within the
industry group, JKLL is in the process of
developing an online interface for small
and medium enterprises (SMEs). The online
interface, “store4u”, which is expected to be
launched in the latter half of the ensuing
financial year, is expected to gain momentum
within the SME sector as a comparatively
cheaper and safe alternative for the storage
and transport components of their supply
chains. The interface will showcase the
availability of world class storage spaces
in the SME owners’ vicinity for rent. The
interface is expected to gain momentum,
since affordable warehousing space is
currently a scarcity within this sector.
Mack Air (MAL) will leverage on the online
airlines represented by the company to
improve overall market share in both
passenger and cargo volumes. MAL will also
focus on strengthening its network of airlines,
to expand selling to long-haul sectors. The
positive outlook in tourist arrivals provides
opportunities for Sri Lanka to become a
network destination for the Airline segment.
Based on the current trend in tourist arrivals,
with greater emphasis on the South and
East Asian markets to Sri Lanka, both MAL
and Cinnamon Air will focus on creating
industry and customer awareness through
multiple channels. The convenience of faster
connectivity between cities, Sri Lanka’s
growing popularity as a destination for
shorter stays and attracting more upscale
leisure and corporate tourists are expected
to contribute towards improved performance
of the Airline segment.
Mackinnons American Express Travels
will focus on growing market share in the
expanding outbound travel sector through
increased on-line offerings while NDO
Lanka will focus on continually developing
its core competencies in customs clearance
and cargo management solutions towards
maintaining its position as one of the top
5 customs brokerage and project cargo
management service providers in the country.
The Logistics business will
continue to engage with
key clients and evaluate the
potential for purpose built and
anchored facilities. JKLL will
focus on expanding its footprint
and customer base to include
long term integrated customer
relationships. The business will
also continue to engage with the
Group’s Retail sector with regard
to the development of a state-of-
the-art distribution centre, which
can handle a variety of dry, fresh
and chilled supplies to its growing
base of outlets.
Group Highlights | Governance | Management Discussion & Analysis | Financial Statements | Supplementary Information

124 John Keells Holdings PLC | Annual Report 2016/17
22%Revenue
25%EBIT
31%Capital employed
49%Carbon footprint
Our Business ModelVision and Scope
Representing JKH’s largest asset exposure,
the Leisure industry group comprises of two
city hotels that offer approximately 39 per
cent of the current 5-star room capacity in
Colombo, a select service hotel, in Colombo,
eight resort hotels spread across prime
tourist locations in Sri Lanka and three resorts
in the Maldives, offering beaches, mountains
and cultural splendour under the brand
“Cinnamon Hotels and Resorts”. The Leisure
industry group also operates a destination
management business in Sri Lanka.
The design and facilities of our hotels cater
to the evolving lifestyles of our guests which
exemplifies the vitality and vibrancy of the
“Cinnamon” brand.Destination
ManagementCO
2
1.47 MT perRs.mn revenue
Resorts
LEISURE
Industry Group Review
Hotel Management
Contribution to JKH Group
City Hotels

125
Hotel Management Sector
In addition to the sectors in the aforementioned table, Cinnamon Hotel Management Limited (CHML) functions as the hotel management arm of
the Leisure industry group.
Sectors City Hotels Resorts Destination Management
Sri Lankan Maldivian
The business within
the sector
• Cinnamon Grand - 501
rooms
• Cinnamon Lakeside - 346
rooms
• Cinnamon red - 240 rooms
• 8 resort hotels in Sri
Lanka - 1,000 rooms
• 3 resort hotels in the
Maldives - 340 rooms
• Walkers Tours and
Whittall Boustead
Destination Management
operations in Sri Lanka
Key external/
internal variables
impacting the
business
• Increased room inventory,
particularly in the 3-4 star
hotel segment in the prior
years
• Encouraging growth in
overall tourist arrivals to
the City Hotel sector
• Increase in room
inventory, particularly in
the west and southern
coastal areas of the island
• Increase in competition
from the informal sector
• Recovery post the political
instability seen last year
• Increased duty on tobacco
and carbonated drinks
and a new expatriate
remittance tax
• Significant influx of
tourists from China, India
and the United Kingdom
• Arrivals from China grew
26 per cent during the
calendar year 2016
Key developments
during the financial
year
• Cinnamon Grand
maintained its position as
the market leader
• Ongoing roll-out of
“Cinnamon” branding
initiatives
• Extension of the head
lease of Cinnamon
Dhonveli Maldives by 15
years
• Witnessed a significant
growth in volumes from
web based sales
• Introduction of new web
based portal
Key Indicators
Inputs (Rs.mn) 2016/17 2015/16 (%) 2014/15
Total assets 71,996 57,653 25 55,403
Total equity 60,690 47,782 27 45,764
Total debt 5,874 4,664 26 4,826
Capital employed1 66,564 52,446 27 50,590
Employees (number)2 5,041 5,073 (1) 5,147
1 For equity accounted investees the capital employed is representative of
the Group’s equity investment in these companies
2 As per the sustainability reporting boundary
3 Turnover is inclusive of the Group’s share of equity accounted investees
Outputs (Rs.mn) 2016/17 2015/16 (%) 2014/15
Turnover3 26,136 24,306 8 23,422
EBIT 5,924 5,134 15 5,737
PBT 5,721 4,968 15 5,505
PAT 5,008 4,367 15 4,855
EBIT per employee 1.2 1.0 16 1.1
Carbon footprint (MT) 40,670 40,767 0 39,698
Group Highlights | Governance | Management Discussion & Analysis | Financial Statements | Supplementary Information

126 John Keells Holdings PLC | Annual Report 2016/17
LEISURE
Industry Group Review
External Environment and Operational
Review Sri Lanka has become one of the more
sought after tourism destinations in the
South East Asian region as evidenced
through the growth in arrivals and the
recognition received through numerous well
reputed travel sites and magazines. The
diverse product offering, which is centered
on its pristine beaches, natural diversity
and cultural heritage, has driven growth in
arrivals over the past few years. The tourism
industry is thereby recognised as one of
the key growth industries of the country
considering its impact on the economy,
employment generation and the multiplier
effect it results in.
Sri Lanka recorded 2,050,832 tourist arrivals
for the calendar year 2016, a growth of 14
per cent against the previous year [CY2015:
1,798,380 tourists]. The tourism industry
recorded receipts of USD 3.52 billion, an
increase of 18 per cent against the last year.
The two largest source markets for tourist
arrivals to Sri Lanka, Western Europe and
South Asia, grew by 17 per cent and 12
per cent to 643,333 and 513,536 arrivals
respectively. India and China were the largest
country-wise contributors to tourist arrivals,
recording a growth of 13 per cent (356,729
arrivals) and 24 per cent (271,577 arrivals)
respectively. The Chinese market continued to
be a key thrust market, with many initiatives
being rolled out at a national policy level.
These efforts, together with the continuing
increase in flight connectivity resulted in the
aforesaid increase in arrivals from China,
which accounted for 13 per cent of total
arrivals to Sri Lanka in 2016. Arrivals for the
year were particularly strengthened by the
growth in arrivals from Eastern and Western
Europe, predominantly from the British and
German markets, which grew by 16 per cent
and 15 per cent respectively.
2.05Mn
Tourist arrivalsA 14 per cent growth
Arrivals in the first quarter of the calendar
year 2017 recorded a growth of only 6 per
cent largely due to the partial closure of the
Bandaranaike International Airport (BIA) from
January till April 2017 to resurface and
expand the runway which resulted in many
flights being cancelled during this period. The
operations of the airport resumed usual
activities from 7 April 2017 onwards and it is
encouraging that arrivals for the month of
April 2017 grew by 18 per cent against the
previous year.
In the year under review, tourist arrivals to
Colombo recorded an encouraging increase,
primarily driven by double digit growth in the
leisure and Meetings, Incentives, Conferences
and Events (MICE) segments, albeit off a
relatively lower base. The noteworthy growth
in the MICE segment demonstrates the
significant potential to position Colombo as a
MICE hub. The corporate segment recorded a
marginal growth but maintained its position
as the largest contributor to overall arrivals
into Colombo.
Cinnamon Grand (CG) maintained its market
leadership position amongst the city hotels
in 2016/17. CG maintained average room
rates in line with the previous year, but
recorded a reduction in occupancy mainly
on account of the increasingly competitive
operating environment, particularly within
the corporate segment. Cinnamon Lakeside
recorded an increase in occupancy on account
of an increase in the leisure segment arrivals
and due to the previous year’s occupancy
being lower as the hotel was partially closed
for refurbishment for six months during
2015/16. Cinnamon red recorded increases
in both occupancy and average room rates,
despite the aforementioned increase in room
inventory and the growth in the informal
sector.
During the year under review, the Sri Lankan
Resorts segment recorded an improvement
in performance driven by an increase
in occupancy. The segment maintained
moderately higher average room rates,
despite the increased supply of rooms in the
informal sector as well as the graded sector,
particularly during the latter half of the
financial year.
Sri Lankan Resorts gave significant
prominence to online led revenue generation
and implemented various social media led
volume strategies, to drive growth through its
online platform, www.cinnamonhotels.com. In
keeping with the trends in tourist arrivals to
Sri Lanka, the segment implemented focused
strategies to develop and retain the Indian
and Chinese markets. Further initiatives
were launched targeting the high arrivals
growth from the Scandinavian markets which
witnessed growth towards the latter part of
the financial year.
The depreciation of the Sri Lankan Rupee
had a positive impact on the foreign
currency denominated revenue streams
emanating within Sri Lanka, which was off-
set to an extent due to the negative impact
on the translation of its foreign currency
denominated debt during the year under
review.
The brand exercises implemented in the
previous financial year had a resonating
effect in enhancing the “Cinnamon” brand
voice, which aided the consolidation of the
brand and its physical infrastructure in all
11 properties across Sri Lanka and the
Maldives. In working towards enhancing the
Cinnamon brand equity, "Bentota Beach by
Cinnamon" will be closed for construction
of a new hotel. Construction will take place
while architecturally conserving the original
structure and heritage elements of the main
building, designed by the legendary architect
Geoffrey Bawa. The construction is expected
to be completed by 2019/20.
In the year under review, tourist
arrivals to Colombo recorded an
encouraging increase, primarily
driven by double digit growth
in the leisure and Meetings,
Incentives, Conferences and
Events (MICE) segments albeit
off a relatively lower base. The
noteworthy growth in the MICE
segment demonstrates the
significant potential to position
Colombo as a MICE hub.
4 month partial closure of BIA till April
2017 for resurfacing of the runway

127
aided by the depreciation of the Rupee since
a majority of contracts are priced in US
Dollars. The revenue of the Maldivian Resorts
segment increased by 5 per cent driven by
higher occupancies which were above the
industry average. However, the revenue of the
Destination Management sector decreased
by 5 per cent as a result of the challenging
market conditions experienced during the
year.
Hotel Management
City Hotels
Sri Lankan Resorts
Maldivian Resorts
Destination Management
0% 20% 40% 60% 80% 100%
Turnover
2014/15
2015/16
2016/17
32
32
341
21
23
20
27
25
25
20
20
20
0% 20% 40% 60% 80% 100%
EBIT
2014/15
2015/16
2016/17
38
36
43
6
10
5
26
22
21
16
18
19
14
14
12
During the calendar year 2016,
1,286,135 tourists visited the
Maldives, a growth of 4 per cent
against the previous year [CY2015:
1,234,248 arrivals].
During the calendar year 2016, 1,286,135
tourists visited the Maldives, a growth of 4
per cent against the previous year [CY2015:
1,234,248 arrivals]. Although China, the
largest source market to the Maldives,
witnessed an overall decline of 10 per cent,
the growth in arrivals from other traditional
markets such as Central and Northern Europe
negated the slowdown in Chinese arrivals.
The Indian and British markets grew 28 per
cent and 10 per cent respectively, albeit off
a lower base showcasing the possibility of
further market development through focused
marketing efforts.
The Maldivian Resorts segment continued to
record encouraging occupancies, well above
the industry average of 76 per cent. The
increasing number of guest houses being
offered for tourist accommodation, intensified
competition from the informal sector and has
exerted pressure on average room rates.
Continued focus on streamlining operational
efficiencies through lean management
strategies and cost management initiatives
such as the reduction of energy costs and
procurement costs, among others, proved
fruitful during the year.
During the year under review, the head lease
of the Dhonveli island was extended for a
further 15 years until 2045.
The performance of the Destination
Management sector was in line with
expectations, despite the significant
competition from the informal sector and tour
operators. However, strategies to differentiate
through product offering and modern digital
channels came to fruition in the year with the
sector achieving recognition as Sri Lanka’s
leading Destination Management Company
at the World Travel Awards held in Vietnam
in October 2016.
Capital Management Review Concluding the external environment and
operational review of the Leisure industry
group, the ensuing sections will discuss
the different forms of Capital available and
elaborates on the manner in which each form
of Capital is managed to create value to all
stakeholders concerned.
Financial and Manufactured Capital
As at 1 April 2016, the Leisure industry group
had total assets of Rs.57.65 billion, debt of
Rs.4.66 billion and an opening equity capital
of Rs.47.78 billion.
Financial performance
Revenue of the Leisure industry group
increased by 8 per cent to Rs.26.14 billion
[2016/17: Rs.24.31 billion]. The City Hotels
sector recorded a 14 per cent growth in
revenue in comparison to the previous
financial year as a result of a full year of
operations at Cinnamon Lakeside, which
was partially closed for refurbishment in
2015/16, and an improvement in average
room rates across all three city hotels. The
revenue of the Sri Lankan Resorts segment
increased by 12 per cent on account of higher
average room rates across a majority of the
resort properties and a modest improvement
in occupancies. Revenue growth was also
Group Highlights | Governance | Management Discussion & Analysis | Financial Statements | Supplementary Information
Key performance indicators for the industry group, under each of the sectors are summarised as follows:
Sectors City Hotels Resorts Destination
ManagementHotel Management
Sri Lankan Maldivian
Financial and Manufactured Capital -
revenue and growth
Rs.8.84 billion, 14
per cent increase
Rs.5.40 billion, 12
per cent increase
Rs.6.49 billion, 5
per cent increase
Rs.5.24 billion, 5
per cent decrease
Rs.157 million, 2701
per cent increase
Financial and Manufactured Capital - EBIT
and growth
Rs.2.55 billion, 36
per cent increase
Rs.1.14 billion, 23
per cent increase
Rs.1.21 billion, 8
per cent increase
Rs.313 million, 37
per cent decrease
Rs.704 million, 0.24
per cent decrease
Natural Capital - carbon footprint 19,235 MT 13,741 MT 6,940 MT 515 MT 239 MT
Human Capital - number of employees 2,175 1,980 495 242 149
Rs.26.14Bn
Leisure industry group revenue A 8 per cent increase

128 John Keells Holdings PLC | Annual Report 2016/17
LEISURE
Industry Group Review
Water and
effluent
management
Financial implications
as well as regulatory
and brand reputation
implications
Waste
management
Regulatory and brand
reputation implications
Bio diversity Regulatory and brand
reputation implications
The ensuing section discusses the key
targets under the identified material aspects
and its corresponding impacts. The section
also includes a summarised discussion on
the various initiatives undertaken with a view
to achieving said targets.
Energy and Emissions Management:Targets:
• Energy conservation and reduction of
carbon footprint through energy efficient
equipment and practices to replace or
upgrade equipment with energy efficient
alternatives where required
• Continuous monitoring of the carbon
footprint and utilisation of renewable
energy sources to reduce the carbon
footprint where feasible
• Alignment with international benchmarks
for all hotel properties with respect
to carbon emissions and energy
consumption
• Ensure that quality of emissions are
within the tolerance levels stipulated by
the Environmental Protection License
(EPL)
Initiatives:
• As part of the continued initiatives
undertaken by all hotels to conserve
energy, the city and resort hotels replaced
existing lighting with LED lighting in guest
and staff areas, resulting in annualised
savings of over 195,000 kWh
• All resort hotels continued the
replacement of less efficient standard
The EBIT of the industry group grew by 15
per cent to Rs.5.92 billion [2015/16: Rs.5.13
billion] primarily as a result of improved
performance in the City Hotel sector and the
Sri Lankan Resort segment. The PBT of the
industry group increased by 15 per cent to
Rs.5.72 billion.
Borrowings and Finance Expense
Total debt as at 31 March 2017, was Rs.5.87
billion. The finance expense of the industry
group increased by 23 per cent to Rs.204
million in comparison to Rs.166 million
recorded in the previous financial year, mainly
attributable to the US Dollar denominated
debt obtained for the head lease extension of
Cinnamon Dhonveli Maldives.
Return on Capital Employed
• ROCE of the industry group held constant
at 10.0 per cent from the previous
financial year. Whilst EBIT recorded an
increase in 2016/17, the capital base of
the industry group increased by Rs.14.12
billion to Rs.66.56 billion. The capital base
of the industry group increased as a result
of a gain of Rs.9.84 billion arising from
the revaluation of land, particularly from
Asian Hotels and Properties PLC (AHPL),
and the extension of the head lease of the
Maldivian island amounting to Rs.2.51
billion. As discussed under the Strategy,
Resource Allocation and Portfolio
Management section of this Report, the
asset base is adjusted for the revaluation
gains arising in the preceding three years
in order to calculate the adjusted ROCE.
On this basis, the adjusted ROCE is 11.4
per cent compared to 11.5 per cent in the
previous year
• The EBIT for the industry group
increased by 15 per cent as a result of
the aforementioned improvement in
performance across all sectors except
for the Destination Management sector
• The asset turnover decreased marginally
to 0.40 times compared to the 0.43 times
recorded in the previous financial year, as
a result of the aforementioned increase
in the asset base due to revaluation gains
and the head lease extension detailed
above
Natural Capital
Sri Lanka’s rich bio diversity and natural
resources, amongst many other aspects, have
fast become the signature brand building
tools for the tourism industry in the country.
As the largest graded hotel operator in the
country, and given its reliance on natural
resources to create value, the industry group
places a strong focus on operational and
environmental efficiencies to operate with
minimal impact to the environment.
The Leisure industry group’s strategy with
regard to management of its Natural Capital
is underscored through both the John
Keells Group’s sustainability policy and the
“Cinnamon” brand’s sustainability strategy.
The industry group is conscious of the fact
that long term value creation can only be
achieved through responsible management of
impacts and outputs, resulting in sustainable
outcomes. Business units operate within this
principle, with conservation and preservation
of the environment as business priorities,
achieved through environmentally friendly
business practices with the intention of
minimising any negative impact on natural
resources. All operational units proactively
monitor and seek to improve outcomes
of key environmental indicators such as
energy consumption, water withdrawal and
discharge, waste generation and responsible
disposal.
The material impacts for the industry group
are classified as follows:
Energy,
emissions,
water and
waste
Financial implications,
stakeholder expectations
of sustainable tourism
practices, regulatory
requirements, brand
image and reputation
of the industry group’s
businesses
ROCE2016/17: 10.0%[2015/16: 10.0%]
EBIT margin22.7%
Asset/Debt + Equity1.09
Asset turnover0.40
Return on Capital Employed

129
strategies including monitoring
classification, segregation, recycling,
composting and initiatives such as bio
gas recovery
Initiatives:
• All city hotels and resorts continued to
segregate waste prior to disposal as a
part of promoting the concept of “reduce,
reuse and recycle”
• Cinnamon Wild Yala, Cinnamon Citadel
Kandy and Habarana Village by Cinnamon
generated biogas using 96,101 kg of food
waste generated during the year, thereby
reducing the usage of non-renewable
energy
• In order to minimise the environmental
impact from the use of plastic, all Sri
Lankan and Maldivian resorts have taken
the initiative to provide plastic straws
with drinks only upon request and not as
a part of the general service standard
• Cinnamon Grand substituted the use of
500ml plastic water bottles with water
filters within staff areas. The initiative
eliminated the disposal of approximately
75 PET bottles per day and 56kg of plastic
disposals per month
air conditioners with energy efficient
inverter type air conditioning units as a
means of conserving energy
• Cinnamon red installed variable
frequency drive (VFD) panels, which
regulate speed and torque of chill water
primary pumps, resulting in annualised
savings of 630,966 kWh, whilst the
installation of a new condenser water line
at Cinnamon Grand resulted in savings of
109,500 kWh during the year
• Optimisation of energy usage through the
continued use of its Building Management
System (BMS) to control and time
outdoor and indoor lighting and setting
of automatic and efficient temperature
and laundry air-conditioning units
running with variable frequency drives at
Cinnamon Lakeside (CL)
• Walkers Tours (WTL) increased the
number of hybrid vehicles in its fleet in
order to reduce fuel consumption. WTL
is certified as carbon neutral by Carbon
Neutral UK as a result of investing in
foreign and local renewable energy
projects to offset its carbon footprint,
keeping in line with their “Carbon
Conscious” awareness campaign
• Maintaining ISO 14001 environmental
management certification across all
hotel properties
• Resort hotels are currently in the process
of installing a utility management
system which will enable real time
central monitoring of utilities such as
electricity and water consumption at all
Resorts. This will facilitate identification
of consumption fluctuations in real time
to generate solutions in order to operate
more efficiently and minimise wastage
Water and Effluent Management Targets:
• Reduce the Leisure industry group’s
withdrawal of water
• Ensure that international benchmarks for
all hotel properties on water consumption
are met
• Ensure all effluents meet the requisite
water quality standards
• Install on-site effluent treatment
plants for all hotels which are unable
to discharge effluent into common
municipal sewerage lines
Initiatives:
• Cinnamon Grand (CG) continued its
rainwater harvesting initiative whilst
shower water was recycled for flushing
purposes in order to reduce the volume
of water withdrawn. CG also continued to
install sensor taps for wash rooms as a
conservation initiative
• Upgrading of steam traps (eliminates
the continuous use of water to generate
steam) at CL and CG and installation of
water flow restrictors in guest rooms at
selected Sri Lanka resorts was carried
out as an effort to reduce the overall
water consumption
• Cinnamon red also conducted
improvements in guest rooms to reduce
wastage of water resulting in savings
of 576 cubic meters of water annually.
The automation of the cooling tower’s
fan motor operation in accordance with
ambient temperature resulted in annual
savings of 1,800 cubic meters of water
Waste Management Targets:
• Strive to achieve zero waste to landfill
status as a long term goal through
comprehensive waste management
Group Highlights | Governance | Management Discussion & Analysis | Financial Statements | Supplementary Information
Variable frequency drive (VFD) panels installed at Cinnamon red
Resort hotels are currently in the process of installing a utility
management system which will enable real time central monitoring of
utilities such as electricity and water consumption at all Resorts. This
will facilitate identification of consumption fluctuations in real time to
generate solutions in order to operate more efficiently and minimise
wastage

130 John Keells Holdings PLC | Annual Report 2016/17
LEISURE
Industry Group Review
Biodiversity Targets
• Minimal impact to important biodiverse
areas to ensure long term value
creation, given the proximity of resorts to
biologically diverse areas
• Impact assessments are regularly
conducted to ascertain any impacts on
biodiversity and the environment resulting
from operations
Impact through CSR initiatives:
• Project Leopard aims to minimise
the human-leopard conflict while
safeguarding and uplifting the livelihoods
of cattle farmers. During the reporting
year, a total of 5 stainless steel pens
were donated to cattle farmers (74 pens
since project inception). Zero calf deaths
and zero retaliatory killings of leopards
have been reported after donation of the
pens, allowing farmers to experience a
significant increase in average monthly
income; an estimated increase of 23.4 per
cent for each year when the pen was in use
• The Cinnamon Elephant data gathering
project at Cinnamon Lodge Habarana
conducted in collaboration with John
Keells Foundation and the Centre for
Conservation and Research, aims to study
elephants for long term conservation
whilst also enhancing tourists’ experience
through greater exposure and access to
information regarding elephant viewing.
72 adult males have been identified and
photo IDs have been created. The Elephant
Research Center at Cinnamon Lodge
Habarana provides visitors with the photo
IDs of the elephants, while a Facebook
group facilitates online tracking
Performance
The Leisure industry group’s carbon footprint during the reporting year was 40,670 MT.
Additionally, 1,126,765 cubic meters of water was withdrawn while 3,952,477 kg of waste was
generated by the industry group.
Indicators
2016/17 2015/16 (%)
Carbon footprint (MT) 40,670 40,767* (0.2)
Water withdrawn (m3) 1,126,765 1,143,664 (1)
Waste disposed (kg) 3,952,477 4,280,841 (8)
Carbon Footprint scope 1 and 2 per operational intensity factor
2016/17 2015/16
Sri Lankan Resorts segment CO2 kg per guest night 22.77 23.07
Maldivian Resorts segment CO2 kg per guest night 31.15 31.22
City Hotels sector CO2 kg per guest night 56.89 55.92
Destination Management sector CO2 kg per client serviced 7.72 7.54
* Restated
Name of resort hotel and
geographic location
Biodiversity value of
protected area in
proximity to site
Distance
from site
Subsurface
land at site
(m2
Extent
of site
(km2)
Protected through legislation/
IUCN/ UNESCO etc
Status of
EPL being
obtained
Bentota Beach by Cinnamon Marine ecosystems Adjacent Nil 0.0446
Flora and Fauna Protection
Ordinance 1937 IUCN Category
II - National Park
Yes
Cinnamon Bey Beruwala Marine ecosystems Adjacent Nil 0.0450 Yes
Trinco Blu by Cinnamon Marine ecosystems Adjacent Nil 0.0500 Yes
Hikka Tranz by Cinnamon Marine ecosystems Adjacent 3,600 0.0176 Yes
Habarana Village by Cinnamon Minneriya tank sanctuary 15 km Nil 0.0340 Yes
Cinnamon Wild Yala Yala national park Adjacent Nil 0.0440 Yes
Cinnamon Lodge Habarana Minneriya tank sanctuary 15 km Nil 0.1031 Yes
Cinnamon Citadel Kandy Mahaweli river and
freshwater ecosystems
Adjacent Nil 0.0234 Flora and Fauna Protection
Ordinance 1937, IUCN
Category IV - Habitat / Species
Management Area
Yes
Cinnamon Dhonveli Maldives Marine ecosystems Adjacent Nil 0.0670The Environmental Protection
and Preservation Act
YesEllaidhoo Maldives by Cinnamon Marine ecosystems Adjacent Nil 0.0556
Cinnamon Hakuraa Huraa Maldives Marine ecosystems Adjacent Nil 0.0543
Installation of a cattle pen in Yala by Cinnamon Nature Trails team

131
for relevant staff and ISO Internal auditor
training was conducted by SGS Lanka for
all City Hotels
• Food hygiene, first aid, fire awareness
and emergency evacuation training was
carried out within the businesses on
a regular basis contributing to higher
service levels
• WTL inducted the second batch of trained
chauffeurs through a comprehensive
training programme with emphasis
on environmentally friendly behaviour
and safe driving habits. 16 selected
individuals underwent the certification
programme conducted by the Destination
Management sector of the Group
• WTL trained 210 chauffeurs on defensive
driving skills. The training was conducted
by a ROSPA certified trainer, whilst first
aid training was conducted for 22 Safari
jeep drivers in Udawalawe
• 450 WTL drivers obtained medical
screening services to ensure the health
and safety standards were met by tour
drivers
Human Capital
Given the importance of service delivery
and quality, the Leisure industry group
leverages on its Human Capital in creating
an unparalleled service offering for its
customers and other key stakeholders.
A motivated and professionally trained
staff cadre is managed through ongoing
investments in its people, through training in
industry specific and general management
skills, thereby improving productivity and
quality. The Group places importance in
providing a safe working environment for its
employees through constant education and
training on safe practices in the workplace.
The material impacts for the industry group
are identified as follows:
Talent
management
Retaining talent and
upgrading skills of
existing staff towards
delivering superior
customer service and
quality levels
Health and
safety
The businesses within
the sector need to ensure
safe working conditions
Talent Management Targets:
• Maintenance of “Cinnamon” brand
standards through provision of a target
number of training hours and on-going
training, resulting in a skilled workforce
• Retention of talent within a highly
competitive labour market
Initiatives:
• 20 per cent of the executive vacancies
in the Sri Lankan Resorts segment
were filled with internal talent through
the Talent Acceleration Programme
(TAP), while 10 per cent of supervisor
level vacancies were filled through the
Management Acceleration Programme
(MAP)
• All resorts continue to offer classroom
and on the job training to all employees
to improve skills, productivity, service
quality and value. Within the Group, the
Leisure industry group offers the highest
number of training hours to its employees
with 48 hours of training provided per
employee
Health and Safety Targets:
• Minimal occupational health and
safety incidents through safe working
conditions and practices
Initiatives:
• All Group hotels continue to maintain
OHSAS 18001 certification in addition to
maintaining ISO 22000 certification for
food safety. Hazard Analysis and Critical
Control Points (HACCP) was carried out
Group Highlights | Governance | Management Discussion & Analysis | Financial Statements | Supplementary Information
Performance
A total of 88 occupational health and safety incidents were recorded this year, while a total of
289,431 hours of training was provided to employees within the industry group.
Indicators
2016/17 2015/16 (%)
Injuries and diseases (number) 88 89 (1)
Total hours of training 289,431 243,514 19
Water withdrawal per operational intensity factor
2016/17 2015/16
Sri Lankan Resorts segment CO2 kg per guest night 937 968
Maldivian Resorts segment CO2 kg per guest night 603 611
City Hotels sector CO2 kg per guest night 1,226 1,217
Waste generated per operational intensity factor
2016/17 2015/16
Sri Lankan Resorts segment CO2 kg per guest night 2.31 2.50
Maldivian Resorts segment CO2 kg per guest night 4.44 5.86
City Hotels sector CO2 kg per guest night 4.57 4.31
All Group hotels continue
to maintain OHSAS 18001
certification in addition to
maintaining ISO 22000 certification
for food safety. Hazard Analysis
and Critical Control Points (HACCP)
was carried out for relevant staff
and ISO Internal auditor training
was conducted by SGS Lanka for
all City Hotels

132 John Keells Holdings PLC | Annual Report 2016/17
LEISURE
Industry Group Review
• WTL also conducted sustainability
awareness programmes among the
supply chain targeting hoteliers and
accommodation providers island-wide
in 5 phases through communication of
sustainable practices throughout the
value chain and addressing key areas of
improvement
Impact through CSR initiatives:
• Cinnamon Colomboscope 2016 - a
contemporary and multidisciplinary arts
festival was conducted by the Leisure
industry group in collaboration with John
Keells Foundation. 10 Sri Lankan artists
were sponsored by John Keells Foundation
as a means of creating a platform for
knowledge exchange between local and
foreign artists. Further details on this
initiative can be found under the ensuing
Intellectual Capital discussion
Intellectual Capital
The “Cinnamon” brand development initiative
of the Leisure industry group continued in
the year under review as an ongoing effort
to create value and brand equity through the
hosting of signature events. Several brand
development initiatives were pioneered in
the operational year to create and enhance
opportunities and offerings to our diverse
stakeholders, in keeping with the changing
dynamics and ever evolving trends of the
travel and leisure industry.
Social and Relationship Capital
The Leisure industry group recognises the
importance of building relationships and
fostering trust and cooperation with key
stakeholders, such as the communities
within which it operates as well as its value
chain partners.
Ongoing corporate social responsibility
projects and activities carried out by the
businesses further assist in improving the
quality of life of local communities and
groups to build a strong foundation for
the continuance of healthy relationships
and business operations. The Social and
Relationship Capital is further enhanced
through mutually beneficial relationships
created through sustainable sourcing,
training and dissemination of knowledge
on sustainability and other best practices.
These practices stimulate local economies,
assist small time entrepreneurs and assist
in creating value and improving the quality of
Sri Lanka’s tourism industry as a whole.
The material impacts for the industry group
are classified as follows:
Supply
chain and
sustainable
sourcing
Assessing and educating
significant suppliers to
ensure the mitigation
of negative impacts in
environmental, labour
and human rights aspects
Community
development
Need to work closely with
surrounding communities
and maintain good
relations
Supply Chain and Community Engagement Targets:
• Engagement with significant supply chain
partners to encourage environmentally
friendly and socially responsible activities
• Community engagement to stimulate
local economies through sourcing of fresh
produce and other outsourced services
Initiatives:
• Regular audits on food safety and supplier
awareness programmes were carried
out on the significant suppliers identified
by the hotels’ central purchasing
office (CPO). This is in addition to the
supplier impact assessments carried
out to ensure suppliers maintain the
sustainable best practices and maintain
overall food safety standards
• Cinnamon Lodge Habarana fulfils 10 per
cent of its monthly vegetable requirement
from the organic farm operated by the
hotel. This farm also provides organic
produce for the production of organic
yogurt and milk which are served to
guests
• WTL conducted bi-annual inspections of all
ancillary suppliers to ensure consistency
in quality and signing of agreements to
ensure adherence of minimum quality
standards and mitigation of risks
The significant suppliers within the industry group are illustrated below:
Cinnamon Lodge Habarana fulfils 10 per cent of its monthly vegetable
requirement from the organic farm operated by the hotel. This farm also
provides organic produce for the production of organic yogurt and milk
which are served to guests
Significant Suppliers - Hotels
Food and beverage suppliers
Casual employeesAmenitiesTravel agents and
travel websites
Significant Suppliers - Destination Management
Contracted retail stores
Jeep and boat suppliers
Outsourced fleetHotel and other accommodation
Freelance national guides
Foreign travel agents and tour operators

133Group Highlights | Governance | Management Discussion & Analysis | Financial Statements | Supplementary Information
A summary of the brand initiatives held, awards and accolades won in assuring service and quality standards in the year under review follows;
Brand awareness initiative Brief description
Cinnamon Colomboscope • The fourth edition of Colomboscope was held in September 2016, hosted by Cinnamon Hotels
and Resorts in collaboration with the European Union National Institute for Culture (EUNIC)
and John Keells Foundation
• Conceptualised as a means of creating a premier platform for young and budding artists, the
event was titled “Testing Grounds”: Art and Digital Cultures in South Asia and Europe, and was
curated by Dr. Susanne Jaschko, a renowned expert in the field of media arts
• Consisted of film screenings, audio-visual performances, the main exhibition and an online
exhibition. This also included a series of workshops, artists’ talks and thematic conversations
• 10 Sri Lankan artists sponsored by John Keells Foundation were commissioned to
conceptualise and produce artwork which included the use of electronic and digital media for
the festival
Miss Intercontinental • Largest beauty and fashion pageant to be held in Sri Lanka with the participation of 72
countries
• Held in collaboration with a local media platform in August 2016
Cinnamon TV Commercial • A lifestyle oriented brand Television commercial was launched in the financial year on all
SriLankan Airlines flights to enhance the “Cinnamon” brand visibility
Travel bloggers Conference and Awards
ceremony
• Conceptualised by “Cinnamon”, the first travel bloggers’ conference was held in June with the
participation of over 60 bloggers from across 14 countries
Awards/Accolades and measures undertaken for quality assurance
Walkers Tours Limited • Adjudged the best performing TourCert check Company due to its commitment to practicing
of responsible tourism
Cinnamon Grand • Awarded the Bronze award at Sri Lanka National Energy Efficiency Awards 2016
• Received an “A *” food grading for Excellence in Food Safety and Hygiene issued by the CMC
Cinnamon Lakeside • Received an “A" food grading for Excellence in Food Safety and Hygiene
Sri Lanka Resorts • Cinnamon Wild Yala awarded the Presidential Bronze Award at the National Occupational
Health and Safety Awards (NIOSH)
• Sector Award - Tourism and Merit Award claimed by Cinnamon Bey and Cinnamon Lodge
respectively
• Cinnamon Hotels and Resorts was awarded the Gold Award at the 2016 Human Capital
Management (HCM) Awards and the category award for Talent Acquisition
Strategy and OutlookTourists arrivals to the country are expected
to continue its current growth trajectory
towards achieving the 4.5 million arrivals
target set by the Sri Lanka Tourism
Development Authority (SLTDA) for 2020.
Although arrivals for the calendar year
2016 fell short of the set target of 2.2 million
arrivals, the influx of room inventory into the
industry during the last few years has been
steadily absorbed considering the robust
year on year growth in arrivals. Sri Lanka is
well positioned to meet its long term growth
targets considering the increasing trend of
outbound travel in the region, in particular
from India and China. The proximity to India,
the increasing flight connectivity from China
and the value proposition offered by Sri Lanka
as a destination, where diverse attractions
catering to a multitude of tourist needs can
be accessed within a short time horizon, will
be key drivers in attracting arrivals.
Inbound arrivals will also be supported by
the addition of necessary infrastructure such
as with the expansion of the Bandaranaike
International Airport with the expected
development of a new terminal. While
existing capacity will be stretched till such
time the new terminal is operational, it is
Tourists arrivals to the country are expected to continue its current
growth trajectory towards achieving the 4.5 million arrivals target set by
the Sri Lanka Tourism Development Authority (SLTDA) for 2020.

134 John Keells Holdings PLC | Annual Report 2016/17
LEISURE
Industry Group Review
growth trajectory, it is imperative that Sri
Lanka remains competitive regionally whilst
also ensuring that investment in expanding
inventory is not discouraged due to higher
taxes. The implementation of an amendment
in the corporate tax rate is yet to be enacted
(however, as at the time of publishing this
Report, indications were that the corporate
tax rate may change to 14 per cent).
Considering the long term growth prospects
for tourism in the country, the Leisure
industry group is currently evaluating several
investments to expand its portfolio of hotels
whilst being conscious of the impact on
the JKH Group portfolio considering the
return profile of hospitality investments. The
model for expansion will primarily be on an
asset light model where the Group will seek
partners for select hotel investments to
manage its effective capital deployed in the
industry group whilst increasing its share
of rooms under management and hotel
management income. In light of the above, the
Group will explore options for the investment
structure of the Nuwara Eliya and Maldivian
hotel projects - subject to feasibilities on
the cost parameters and expected returns.
The Leisure industry group will also look
to improve its process efficiency and
productivity, and more importantly, its ability
to cater to evolving customer preferences and
requirements for convenience by leveraging
on its newly implemented information
technology platforms whilst embarking on
several digitisation initiatives.
The City Hotel sector is expected to witness
continued growth in the corporate and
leisure segments. Business arrivals are
expected to be strengthened further with the
recommencement of the Port City Colombo
(PCC) project which is also expected to
create transformational change within the
heartening to note that the operations of the
airport were well managed by the authorities
during the partial closure of the airport with
measures to improve efficiency.
Notwithstanding the considerable
improvement in the existing infrastructure
in recent years, in keeping with the present
growth opportunities within the sector, the
need for better physical infrastructure such
as enhanced connectivity through road
networks and access to digital infrastructure,
amongst others, is more pronounced.
Through such enhancements, the value
proposition offered can be significantly
improved to position Sri Lanka as a regionally
competitive tourist destination.
The industry recorded a significant supply
of room inventory in the year under review,
both in the city hotels and resort hotels.
Approximately 13,000 rooms in the 3 and
4-5 star categories are expected to enter
the market in the short term. Although a
similar supply expansion of this magnitude
is not expected in the near term, Sri Lanka
will require a further enhancement in room
inventory, in the medium to long term, to
support the targeted number of tourist
arrivals. Although the supply in room
inventory was mainly driven by the graded
category, competition is also increasing
from the informal sector which is priced
attractively considering the lower cost base
and different service offering. Provisions
for a suitable regulatory framework for the
registration and regulation of the informal
sector will be imperative to ensure that
tourism services provided in the country are
of a minimum regulated standard. It will also
ensure that leisure operators are on an equal
platform in terms of regulations and taxes
and other levies, which currently deprive the
Government of much needed tax revenue.
The tax framework in the Budget 2017
proposed an increase in the corporate tax
rates from 12 to 28 per cent on the registered
service providers of the leisure industry,
which will have an impact on the profitability
of the hotels in Sri Lanka. The increases in
the value added tax (VAT) rate to 15 per cent
and the increase in corporate tax rates,
amongst other tax increases, will affect
Sri Lanka’s competitiveness in the region,
where Sri Lanka is already priced on par
with several key tourism destinations. Being
identified as one of the key thrust areas of the
Sri Lankan economy and given the industry’s
Considering the long term growth prospects for tourism in the country,
the Leisure industry group is currently evaluating several investments
to expand its portfolio of hotels whilst being conscious of the impact
on the JKH Group portfolio considering the return profile of hospitality
investments. The model for expansion will primarily be on an asset
light model where the Group will seek partners for select hotel
investments to manage its effective capital deployed in the industry
group whilst increasing its share of rooms under management and hotel
management income.
Source : SLTDA
Tourists (000's)
SLTDA target for 2017
SLTDA target for 2020
19
85
19
87
19
89
19
91
19
93
19
95
19
97
19
99
20
01
20
03
20
05
20
07
20
09
20
11
20
13
20
15
20
17
20
20
0
500
1,000
1,500
2,000
2,500
4,500
Annual tourist arrivals to Sri Lanka

135
Colombo city limits, converting the city into
a modern mini city in the South Asian region
with state-of-the-art facilities, entertainment
and attractions in terms of a marina and
a beach. Additionally, catering to a greater
influx of tourists in the future, the current
strategies of the City Hotel sector focuses on
the need for in-city based entertainment. In
keeping with current consumer trends and
developments, it is vital that the industry
works in collaboration with the regulatory
authorities to create entertainment options
in the city in order for the industry to remain
a key growth area of the economy into the
foreseeable future.
The Sri Lankan Resorts segment will
continue to drive occupancy through volume
driven strategies with added focus on web
sales and local and foreign partnerships.
The impending closure of “Bentota Beach by
Cinnamon”, for the construction of the new
hotel is expected to have a non-cash impact
because of the acceleration of depreciation
on assets of approximately Rs.200 million in
2017/18, subject to final verification by the
Auditors.
The segment will continue to place emphasis
on cost management initiatives, staff
development programmes and productivity
enhancement strategies.
The political stability in the Maldives has
improved, albeit at a slower rate than
expected. The Maldivian Resorts segment
will continue to follow a tactical pricing
strategy whilst driving volume through direct
bookings and online sales. The segment will
also be targeting new source markets to
offset the negative impact of arrivals from
Russia and Ukraine.
Cinnamon Dhonveli Maldives and Ellaidhoo
Maldives by Cinnamon will be partially closed
for a planned refurbishment in FY2017/18 for
a period of approximately six months. A total
of 62 rooms will be refurbished at Ellaidhoo
while the entire room inventory of Dhonveli
will undergo refurbishment in phases in the
ensuing year.
The Destination Management sector will
leverage on its presence in the European
and Middle Eastern markets and continue to
focus on China and India as the main drivers
of growth. As with the other sectors across
the industry group, cost management and
productivity improvements will remain an
important area of focus. The sector will further
consolidate its position in recently established
markets which have demonstrated potential
whilst concentrating on new markets. The
establishment of a digital platform from the
second half of 2017/18 onwards is expected
to improve process efficiency, scalability of
operations and enhance productivity which is
a key medium to long term strategy for the
business in catering to evolving customer
needs.
Group Highlights | Governance | Management Discussion & Analysis | Financial Statements | Supplementary Information
In keeping with current consumer trends and developments, it is vital
that the industry works in collaboration with the regulatory authorities
to create entertainment options in the city in order for the industry to
remain a key growth area of the economy into the foreseeable future.

136 John Keells Holdings PLC | Annual Report 2016/17
1%Revenue
3%EBIT
20%Capital employed
1%Carbon footprint
Our Business ModelVision and Scope
The property arm of the Group consists of
the Property Development and Real Estate
sectors. The Property Development sector
is currently engaged in the development of
the “Cinnamon Life” integrated resort project.
The Real Estate sector includes the property
division of Asian Hotels and Properties PLC -
the developers of “The Crescat Residencies”,
“The Monarch”, “The Emperor”, and the up-
market shopping mall “Crescat Boulevard”.
The sector operations also includes “K-Zone”
malls in Moratuwa and Ja-Ela and the
management of the 18 hole championship
standard golf course in Rajawella along with
its land bank. The sector has also successfully
developed and sold properties such as the
“OnThree20” and the recently completed “7th
Sense” project on Gregory’s Road.
Construction of the “Cinnamon Life” project is
progressing well whilst sales of the residential
apartments and commercial space remain
encouraging. Property has a land bank of over 500
acres in Digana, Kandy, where it operates a scenic
18-hole Donald Steele designed golf course.
PropertyDevelopment
CO2
2.60 MT perRs.mn revenue
PROPERTY
Industry Group Review
Real Estate
Contribution to JKH Group

137
Sectors Property Development Real Estate
The business within
the sector
• Development and sale of residential and commercial
properties
• Renting of commercial office spaces and the
management of the Group’s real estate within the city
• Owning and operating the “Crescat Boulevard” mall
and “K-Zone” malls in Moratuwa and Ja-Ela
• Operating the 18 hole champion standard golf course
and managing the land bank in Rajawella, Kandy
Key external/
internal variables
impacting the
business
• Increasing supply of residential apartment units
• The recommencement of the Port City Colombo
project and the ongoing Western Region Megapolis
Planning project are expected to position the
Western region as an urban economic base, thereby
stimulating demand for residential and commercial
spaces
• Land (Restrictions on Alienation) Act, No. 38 of 2014,
was amended to discontinue the levy of land lease
taxes from foreign individuals or companies with
effect from 8 January 2017
• The increase in the per capita income of households
enhanced consumer discretionary spending, thereby
increasing demand for retail spaces
• Development of new shopping malls within the
city and the suburbs will increase the supply of
commercial space, and thereby, result in a more
competitive market
• The Government proposal to develop the Colombo -
Kandy expressway, thus improving connectivity to the
Rajawella site in Digana, Kandy
• Exchange rate pressures contributed towards an increase in the cost of construction
• Acute shortage of skilled and unskilled manpower
• Increase in value added tax (VAT) rate from 11 per cent to 15 per cent which will impact construction costs
• Exemption of value added taxes on the sale of residential apartments
• Subsequent to the Budget 2017, although yet to be legislated, it was proposed to reintroduce a 10 per cent capital
gains tax on immovable property
Key developments
during the financial
year
• All units were handed over to the buyers and 100 per
cent of revenue of “7th Sense” on Gregory’s Road was
recognised
• Course irrigation system and other machinery were
upgraded at the golf course at Rajawella, Kandy
• “Crescat Boulevard” continued to record near full
occupancy during the year under review, whilst the
occupancies at the two “K-Zone” malls exceeded 80
per cent
Key Indicators
Inputs (Rs.mn) 2016/17 2015/16 (%) 2014/15
Total assets 48,329 43,935 10 34,891
Total equity 29,097 26,947 8 18,539
Total debt 13,439 11,647 15 13,125
Capital employed 42,536 38,594 10 31,664
Employees (number) 244 102 139 107
All numbers above are inclusive of Rajawella Holdings Limited
Outputs (Rs.mn) 2016/17 2015/16 (%) 2014/15
Turnover 1,121 4,342 (74) 5,689
EBIT 690 1,675 (59) 1,638
PBT 665 1,643 (60) 1,516
PAT 623 1,585 (61) 1,427
EBIT per employee 2.8 16.4 (83) 15.3
Carbon footprint 924 525 76 59
Group Highlights | Governance | Management Discussion & Analysis | Financial Statements | Supplementary Information

138 John Keells Holdings PLC | Annual Report 2016/17
PROPERTY
Industry Group Review
External Environment and Operational
ReviewIn the year under review, the overall property
market witnessed strong growth in the
construction of condominiums across all
market segments on the back of continuing
urbanisation in peripheral Colombo and
its suburbs. The lack of development of
public transportation infrastructure and
the increasing traffic congestion into the
city of Colombo has created a need to live
in proximity to the city which has resulted
in a spate of residential condominium
developments, in the upper-to-mid-end of
the market. This has resulted in a sharp
increase in the prices of land in the last year
with prices in prime locations, among others,
increasing by 50 per cent or more.
Despite the policy uncertainty which
prevailed, particularly with regard to taxation
and the weakening of the Sri Lankan Rupee,
demand in the overall property market
remained encouraging in the upper and mid
end of the market. In light of the encouraging
demand, the performance of the Property
industry group which currently targets the
luxury segment of the market, where the
residential apartments of "Cinnamon Life"
are positioned, was in line with expectations.
As a predominantly supply led market, it is
important that the Government of Sri Lanka
incentivise and facilitate investment in real
estate for both local and foreign buyers.
This particular need was addressed by the
Government Budget 2017 in November,
where it was announced that the Government
will relax restrictions on foreign borrowings
for the purpose of purchasing property and
proposed that residential permits be granted
for foreigners investing in the country.
Further, initiatives to ease the process of
inward remittances of foreign currency to
facilitate investments were proposed, which
in turn is expected to create a conducive
environment for the introduction of a
structure to establish real estate investment
trusts (REITs), amongst others. Amendments
were also made to the Land (Restrictions
on Alienation) Act to discontinue land lease
taxes on foreign individuals or companies
with effect from January 2017.
Policy uncertainty in the country, especially
regarding the tax regime, impacted investor
sentiment during the year under review.
Although all residential developments were
declared exempt from VAT, the proposed
implementation of a capital gains tax
(CGT) was announced in the Budget 2017.
Affordability of many developments will
also be affected by the constant pressure
on exchange rates, which affects the pre-
existing issue of high cost of construction,
and the rise in interest rates.
In spite of the policy uncertainties, an
estimated 8,000 semi-luxury and luxury
apartment units are expected to enter the
market by 2019/20 backed by demand
created through the lack of transportation
infrastructure and the growth in migration
to the city as detailed above. Residential
apartments from “Cinnamon Life”, “Altair”,
“Havelock City-Phase 3”, “Shangri-La”, “Twin
Peaks”, “Lunar Tower” and “Prime Grand” will
contribute to the envisaged increase.
The Port City Colombo (PCC) project,
spanning 269 hectares of reclaimed land
from the sea, recommenced during the year
under review with work progressing at a
rapid pace. The PCC will be an extension to
the central business district of Colombo, with
the development expected to comprise of
five different precincts including a financial
district, central park living, island living, a
marina and an international island. Once
completed the PCC will be one of the prime
locations in Colombo due to the facilities and
planned infrastructure.
During the year under review, revenue
recognition of the recently concluded “7th
Sense” on Gregory’s Road was completed in
the second half of the year. Further details
on the particulars of the revenue recognition
cycle can be found in the Financial Capital
discussion of this industry group report.
The Property industry group’s mall operations
witnessed steady growth in the year under
review, where all properties increased
occupancies coupled with increased footfall
during the year. The increase in footfall
during the said period is mainly on account
of various events, promotional happenings
and other complementary activities which
differentiated the product offering and
the overall experience for consumers
within all three properties. The “Crescat
Boulevard” mall in Colombo maintained
its position as a leading retail destination
within Colombo. The 145,000 square foot
mall also maintained occupancy levels near
full capacity throughout the financial year.
“K-Zone” Moratuwa maintained an average
occupancy of 85 per cent (2015/16: 84 per
cent) while “K- Zone” Ja-Ela maintained an
average occupancy of 80 per cent (2015/16:
76 per cent) in the year under review.
Rajawella Holdings Limited, which comprises
of over 500 acres of land in Digana and an
18-hole Donald Steele designed golf course,
refurbished its existing chalets to incorporate
new kitchens, water tanks and facilities
for differently abled persons. The course
irrigation system and other machinery were
also upgraded in the year for the up keep
and maintenance of the course. A total of 10
tournaments were held in the golf course
during the financial year.
The construction of “Cinnamon Life” is
progressing with encouraging momentum.
Much of the complex sub structural work of
the project was completed during the year.
The main structure of the hotel building is
now at level 6 and the construction of the
other buildings too are well underway. The
construction of the six lane bridge, which will
be the main access point to "Cinnamon Life",
was commissioned during the year and work
is progressing well.
The “Crescat Boulevard” mall in
Colombo maintained its position
as a leading retail destination
within Colombo. The 145,000
square foot mall also maintained
occupancy levels near full capacity
throughout the financial year.
The Port City Colombo project
recommenced in the financial year
2016/17

139
Financial and Manufactured Capital
As at 1 April 2016, the Property industry
group had total assets of Rs.43.93 billion,
debt of Rs.11.65 billion and an opening equity
capital of Rs.26.95 billion.
Financial Performance
The Property industry group revenue
declined by 74 per cent to Rs.1.12 billion
[2015/16: Rs.4.34 billion] compared to the
previous year, mainly attributable to the
revenue recognition cycle of its residential
apartments. Whilst the final revenue tranche
from “7th Sense” on Gregory’s Road, was
recognised in the year under review, the
previous year’s revenue included a relatively
high proportion from the project. It should be
noted that the revenue from the “Cinnamon
Life” project will only be recognised post
the commencement of operations, hence
exacerbating the gap in revenue in Property.
Correspondingly, the EBIT of the industry
group decreased by 59 per cent to Rs.690
million [2015/16: Rs.1.68 billion]. The EBIT
under consideration includes investment
property gains from “Crescat Boulevard”
and a few other properties under the
industry group amounting to Rs.290 million.
The recurring EBIT of the industry group,
excluding the impact of the investment
property gain, decreased to Rs.400 million
[2015/16: Rs.1.48 billion], compared to
the previous financial year. The PBT of the
industry group declined by 60 per cent to
Rs.665 million [2015/16: Rs.1.64 billion]
while the recurring PBT declined by 74 per
cent to Rs.374 million.
Property Development
Real Estate
0% 20% 40% 60% 80% 100%
Turnover
2014/15
2015/16
2016/17
96
95
79
4
5
21
0% 20% 40% 60% 80% 100%
EBIT
2014/15
2015/16
2016/17
96
90
64
4
10
36
Borrowings and Finance Expense
Total debt as at 31 March 2017 stood at
Rs.13.44 billion, which primarily comprised
of the borrowings relating to “Cinnamon Life”.
The finance expenses of the industry group
declined by 20 per cent to Rs.26 million
compared to Rs.32 million recorded in the
previous year, due to the repayment of loans
obtained for the construction of “7th Sense” on
Gregory’s Road. It should be noted that interest
during construction on “Cinnamon Life” is
capitalised in to the project cost in accordance
with the accounting standards, and therefore,
is not reflected under finance expenses.
Return on Capital Employed
• The ROCE of the industry group declined to
1.7 per cent from 4.8 per cent recorded in
the previous financial year. The asset base
increased to Rs.48.33 billion on account of
the infusion of cash equity to Waterfront
Properties (Private) Limited, in order
to fund the ongoing project expenses
associated with the construction of
“Cinnamon Life”, and the aforementioned
gain on investment property
• In order to compute an adjusted ROCE
which reflects the return on the current
portfolio of the Property industry group,
the debt and equity infusions to the
“Cinnamon Life" project was eliminated
considering the gestation period of
the project, in addition to adjusting the
investment property and revaluation
gains. The adjusted ROCE on this basis is
2.6 per cent [2015/16: 10.0 per cent]. The
lower adjusted ROCE is a reflection of the
decline in EBIT as discussed previously
• The EBIT margin of the industry group
was 61.6 per cent, in comparison to the
38.6 per cent recorded in the previous
financial year
• The asset turnover decreased to 0.02
times from the previously recorded 0.11
times as a result of the increase in the
asset base. The asset turnover, adjusted
for the impacts from “Cinnamon Life”,
and the aforementioned investment
property and revaluation gains is 0.05
times compared to the 0.23 times
recorded in the previous financial year.
Refer the Strategy, Resource Allocation
and Portfolio Management section of
this Report for details pertaining to
the aforementioned adjustments and
calculations
Key performance indicators for the industry group, under each of the sectors are summarised
below;
Sectors Property
DevelopmentReal Estate
Financial and Manufactured Capital - revenue
and growth
Rs.891 million, 78
per cent decrease
Rs.230 million, 16
per cent increase
Financial and Manufactured Capital - EBIT and
growth
Rs.443 million, 71
per cent decrease
Rs.248 million, 53
per cent increase
Natural Capital - carbon footprint 59 MT 864 MT
The demand for the residential and
commercial buildings of the project remain
encouraging, recording approximately 40
per cent of pre-sales for both segments,
respectively. The second residential
building; “The Suites at Cinnamon Life”,
comprising of 196 units was launched in
September 2016.
Capital Management ReviewFollowing the review of the external
environment and operations, the ensuing
section entails a discussion on the different
forms of Capital available within the industry
group in order to create value for our
stakeholders, and, above all, discusses the
performance of the sectors under each form
of Capital.
Rs.48.33Bn
Property industry group asset base A 10 per cent growth
Group Highlights | Governance | Management Discussion & Analysis | Financial Statements | Supplementary Information

140 John Keells Holdings PLC | Annual Report 2016/17
PROPERTY
Industry Group Review
Natural Capital
In engaging in its core business of the
development and sale of real estate, while
contributing to the national infrastructure and
utilities, the industry group places importance
in minimising the impact on Natural Capital.
This is achieved through the integration of
best practices within its operations to reduce
energy consumption and waste while ensuring
the continuous management and responsible
discharge of effluents.
The material impacts for the industry group
are classified as follows:
Energy and
emissions
management
Financial implications
and environmental
responsibility
Waste
management
and effluent
discharge
• Compliance with
Government
regulations, industry
regulations and
prerequisites of
lending agencies
• Implications on
brand image and the
environment
Energy, Emissions, Waste and Water
ManagementTargets:
• Reduce energy consumption
• Reduce solid waste below Environmental
Protection License (EPL) limits
• Re-use waste water
Initiatives:
• Annual energy savings of 39,900kWh
was achieved throughout the sector by
replacing existing fluorescent lamps
with LED lamps and by isolation of light
circuits to enable individual control of
lamps at identified mall areas
• Installation of a 125kVar power factor
correction capacitor bank at Cinnamon
Lakeside Commercial Complex in order
to reduce energy usage
• An active chiller management process consisting of efficient monitoring of temperature
levels contributing to energy efficiencies
• Responsible waste segregation at source by providing colour coded bins to cafeterias and
garbage collection points in WBL, MKL and the Cinnamon Lakeside Commercial Complex
• Providing training on waste disposal management to “K Zone” Ja-Ela and “Crescat
Boulevard” staff leading to streamlining of waste disposal
• Training and awareness creation on water management has been provided to the caretakers
and residents at RHL taking into consideration its materiality to the operations
The industry group continuously strives to minimise the impact on the environment, as evident
in the following table.
Indicators
2016/17 2015/16 (%)
Carbon footprint (MT) 924 525* 76
Waste disposed (kg) 204,437 141,659 44
* restated
Human Capital
The local construction industry has been
experiencing rapid growth in the recent past
creating a higher demand for outsourced
personnel of both skilled and unskilled
labour categories. The shortage of labour
within the sector is a primary challenge
faced by the industry group. Given the nature
of the industry, the health and safety of
its outsourced contractors’ personnel is a
material aspect, and impacts the well-being
and the productivity of the workforce.
The material aspect and impact relating to
Human Capital is identified in the ensuing
table.
Installation of 125kVar power
factor correction capacitor bank at
Cinnamon Lakeside Commercial
Complex in order to reduce energy
usage
Risk assessment training at "Cinnamon Life" project site
ROCE2016/17: 1.7%[2015/16: 4.8%]
EBIT margin61.6%
Asset/Debt + Equity1.14
Asset turnover0.02
Return on Capital Employed

141
Social and Relationship Capital
Given the rapid expansion of the Sri Lankan
property market, the Property industry group
seeks to differentiate itself through greater
emphasis on its Social and Relationship
Capital. The industry group maintains quality
standards of its products, its reputation as a
responsible corporate citizen and positions
itself as one of the foremost companies in
the property market as a means of achieving
the said objective. The initiatives which
are carried out based on the JKH Group’s
overarching sustainability policies include;
• Environmental and social impact
assessments prior to the commencement
of new projects
• Effluent and waste management
• Requirement to engrain sustainability
in its supply chain through supplier
engagement and assessment, for both its
existing operations and new projects, to
reduce the operational and reputational
risks to the business
Occupational
health and
safety
Business requirement
to monitor occupational
health and safety incidents
and practices in the supply
chain while continuously
assessing risks faced by
the Property industry group
due to its business model
of utilising third party
construction contractors
Targets:
• Uphold health and safety standards
within the value chain
• Maintain OHSAS 18001:2007 certification
at all shopping malls
Initiatives:
• All regulatory requirements were
met ensuring there were minimal
negative impacts on communities and
the environment in the vicinity of the
“Cinnamon Life” construction site
• Supplier health and safety processes and
site safety were monitored through third
party consultants and site safety officers
on a bi-weekly and monthly basis to
ensure a safe working environment for
contractor’s personnel
• Continued the dengue prevention
initiative through the identification of
stagnant water areas and installation
of drain lines uplifting the quality of
construction sites
• All shopping malls obtained OHSAS
18001:2007 certificate and relevant
surveillance audits and internal audits
were carried out for maintenance,
housekeeping and security, in addition to
annual management reviews
• Training programmes on first aid, fire
safety, food hygiene and basic health and
safety were carried out throughout the
industry group in order to uplift service
quality
Indicators
The Property industry group did not have
any occupational health and safety incidents
involving its own employees in 2016/17.
However, there were incidents reported by
its construction contractors and as such the
industry group continues to engage with its
contractors to minimise such instances.
In addition, 1,716 hours of training were
Given the rapid expansion of the Sri Lankan property market, the Property
industry group seeks to differentiate itself through greater emphasis
on its Social and Relationship Capital. The industry group maintains the
quality standards of its products, its reputation as a responsible corporate
citizen and positions itself as one of the foremost companies in the
property market as a means of achieving the said objective.
The Slave Island railway station was renovated and is maintained by the Property industry group
provided to the staff within the industry group during the year, showing an increase due to the
inclusion of Rajawella Holdings Limited within the sustainability scope.
2016/17 2015/16 (%)
Injuries and diseases (number) 1 0 -
Total hours of training 1,716 568 202
Group Highlights | Governance | Management Discussion & Analysis | Financial Statements | Supplementary Information

142 John Keells Holdings PLC | Annual Report 2016/17
PROPERTY
Industry Group Review
The significant suppliers within the industry group are illustrated below:
Significant Suppliers
Architects and interior designers
Construction contractors
Significant Suppliers
Food and beverage suppliers
Casual employeesAmenitiesTravel agents and
travel websites
real estate in terms of affordable housing
facilities and gated communities. The
Property industry group will capitalise on
these opportunities through its unparalleled
service standards where location, price and
product are considered key differentiators.
Given the increased lifestyle preference
towards convenience housing, the Group will
continue to identify properties in suitable
locations to address the growing demand
for residential apartments in the mid to
higher end of the market. In light of this,
the Group has entered into a Memorandum
of Understanding with a partner in relation
to a prospective property development
project in central Colombo. Subject to the
finalisation of the project concept, cost
parameters and other approvals, the project
is expected to be launched in early 2018.
The Group is in discussion for the acquisition
and development of other similar properties
which it expects to launch in the near
future subject to due diligence and meeting
commercial considerations.
The Group is cognizant of the fact that
revenue recognition in the Property industry
group has shown volatility in the past
years. Currently, the institute of Chartered
Accountants of Sri Lanka allows for the
recognition of revenue from apartment sales
on a percentage completion method, until the
new revenue standard, “SLFRS 15 - Revenue
from contracts with customers”, comes into
effect in 2018. The new standard is being
closely studied to explore the possibility
of continuing to recognise revenue on a
percentage completion method, as practiced
in other regional jurisdictions such as
For the calendar year 2016, the
growth in GDP in Sri Lanka was
4.4 per cent while per capita
income growth was 6.9 per cent. In
tandem with this, the growth in the
urban population and the inward
migration to Colombo from other
districts are expected to grow in
the medium term, creating further
demand for real estate in terms of
affordable housing facilities and
gated communities.
Given the increased lifestyle preference towards convenience housing,
the Group will continue to identify properties in suitable locations to
address the growing demand for residential apartments in the mid
to higher end of the market. In light of this, the Group has entered
into a Memorandum of Understanding with a partner in relation to a
prospective property development project in central Colombo.
All significant suppliers have been assessed for
significant negative impacts in environmental,
labour and human rights aspects.
Initiatives
• Regular meetings held on a monthly
basis with representation from
Waterfront Properties (Private) Limited
(WPL), the contractor and the consultant,
to ensure collaboration in ensuring high
quality service
• All companies within the industry group
reviewed and tested their business
continuity plans on a regular basis
throughout the year contributing to risk
management and adaptability
• All suppliers are required to sign off
on a sustainability check-list, where
the industry group maintains stringent
criteria for pre-qualification of suppliers/
contractors
• The Property sector, in collaboration
with John Keells Foundation, continued
refurbishment and daily maintenance of
the Slave Island railway station, enhancing
commuter experience and facilities
Strategy and Outlook Property development and real estate have
fast become the catalysts of economic
development in frontier markets. Growing
urbanisation, lifestyle changes and a
rising middle class and affluent segment
in the country, coupled with significant
infrastructure investment in the Western
Province, provide scope for continued
demand for residential, commercial and
retail spaces in the medium to long term. For
the calendar year 2016, the growth in GDP in
Sri Lanka was 4.4 per cent while per capita
income growth was 6.9 per cent. In tandem
with this, the growth in the urban population
and the inward migration to Colombo from
other districts are expected to grow in the
medium term, creating further demand for
The significant suppliers specific to Rajawella Holdings Limited are depicted below:

143
Malaysia and Singapore. If implemented this
would enable recognition of revenue on future
projects provided they meet the necessary
criteria, and help smoothen revenue of the
Property industry group.
The proposed Western Region Megapolis
Planning project within the Colombo, Kalutara
and Gampaha districts is expected to
contribute towards better standards of living
for the growing middle income population.
The growth in living standards and incomes,
coupled with the anticipated influx of tourists
in the future is expected to drive demand for
real estate.
The PCC project, as discussed in the External
Environment and Operational Review
section above, is expected to be available
for development projects within the next few
years. The Group will explore prospects for
development in the PCC whilst also evaluating
opportunities for residential apartment
developments considering the emerging
landscape of Colombo and the need for
housing in proximity to the city. In addition to
the prospective project referred to above, the
Group will work towards building a stronger
pipeline of projects in the short to medium
term, catering to different customer segments
in the mid to luxury end of the market.
The corporate, leisure and MICE segments
grew at higher rates than expected in the
last few years, which augurs well for the
absorption of the new hotel inventory entering
the market. “Cinnamon Life” is expected
to capitalise on the envisaged tourism
growth trajectory given its unique product
offering. Despite the growth momentum
of the tourism industry witnessed over the
past years, the Group believes that there is
significant room to expand arrivals given
the strong growth in outbound travel within
the region, especially in attracting a higher
spend category of tourists. India and China,
being the fastest growing markets for MICE
presents a significant opportunity to Sri
Lanka given its close proximity and improved
flight connectivity.
The Retail penetration in Sri Lanka still
remains below that of other regional peers
such as Malaysia, Thailand and India and
thus presents a significant opportunity to
capitalise on in the long term, especially
given the forecasted growth in tourism to
the country. The Group is confident that the
unique selling proposition of “Cinnamon Life”
will continue to encourage residential and
commercial space sales. “Cinnamon Life”
is envisaged to be the epi-center of modern
South Asia, taking into account the medium
to long term prospects for tourism in the
country. Against this backdrop “Cinnamon
Life” is uniquely positioned to bridge the
current infrastructure and product offering
gaps and capitalise on the aforementioned
opportunities.
The demand for commercial space is
expected to increase in the near and medium
term following the growing need for efficient
and convenient office space providing further
opportunities for the Group to leverage on
its expertise and synergies in developing
properties at the right price and positioning
products to relevant client segments.
Given the land expanse in Rajawella, a master
plan is currently being finalised to ensure a
unique product proposition for its customers.
The proposal by the Government to
accelerate the construction of the Colombo-
Kandy highway will significantly improve
the utilisation of the golf course, and, more
importantly, enhance the value of the land
bank. The Group will continue to operate the
championship golf course and will focus on
improving the facilities with the goal of hosting
international tournaments. To this end, there
will be a drive for continuous improvement
of the course and the facilities while also
focusing on branding and positioning.
Given the increased lifestyle preference towards convenience housing, the
Group will continue to identify properties in suitable locations to address
the growing demand for residential apartments in the mid to higher end
of the market. In light of this, the Group has entered into a Memorandum
of Understanding with a partner in relation to a prospective property
development project in central Colombo.
Group Highlights | Governance | Management Discussion & Analysis | Financial Statements | Supplementary Information

144 John Keells Holdings PLC | Annual Report 2016/17
38%Revenue
24%EBIT
4%Capital employed
40%Carbon footprint
Our Business ModelVision and Scope
The Consumer Foods sector is home to
a portfolio of leading consumer brands
including “Elephant House” soft drinks and
ice creams, as well as the “Keells-Krest”
range of processed meats; all leaders in their
respective categories and supported by a well-
established island-wide distribution channel.
The Consumer Foods sector competes in
three major categories namely beverages,
frozen confectionery and convenience foods.
The Retail sector focuses on modern
organised retailing through the “Keells Super”
chain of supermarkets and also operates
“Nexus”, the most successful coalition loyalty
programme in the country.
The Consumer Foods sector continued
reinventing its product portfolio with the
relaunch of its premium frozen confectionery
brand “Imorich”. JMSL also continued its
expansion, adding 15 new stores during the
period under review.
CONSUMER FOODS AND RETAIL
Industry Group Review
Contribution to JKH Group
Consumer Foods
Retail CO2
0.73 MT perRs.mn revenue

145Group Highlights | Governance | Management Discussion & Analysis | Financial Statements | Supplementary Information
Sectors Consumer Foods Retail
The business within
the sector
• Ceylon Cold Stores (CCS) produces and markets a
portfolio of soft drinks under the “Elephant House”
brand, an energy drink under the “Wild Elephant” brand,
an isotonic sports drink, “F5”, a fruit based tea drink,
“Twistee”, a fruit flavoured drink “Fit-o” and “Elephant
House” (EH) and “Imorich” ice creams and related
confectionery products
• Keells Food Products (KFP) produces and markets a
range of processed meat products under the “Keells-
Krest” and “Elephant House” brand names
• JayKay Marketing Services (JMSL) operates the
“Keells Super” chain of modern retail outlets and the
“Nexus” loyalty programme
Key external/
internal variables
impacting the
business
• Increase in excise duty and other levies on sugar and
other raw materials
• Continued growth in the modern trade penetration of
the country
• Industry characterised by high employee attrition
• Revision of value added tax (VAT) from 11 per cent to 15 per cent
• Increases in VAT, interest rates and inflation impacted consumer discretionary spending, particularly during the
fourth quarter of the financial year 2016/17
• Sri Lanka affected by the worst drought in 40 years impacting 16 districts in total
Key developments
during the financial
year
• Relaunch of the premium range of ice creams as
“Imorich” and the introduction of “Sword”, an impulse
product to bridge the gap in demand for extruded stick
products
• Introduction of “Lemoki”, a new flavour in the beverage
portfolio and “Fit-o”, a flavoured fruit drink in orange
and mango flavours
• Reduction of the calorific sugar content in Carbonated
Soft Drinks (CSD) through the introduction of stevia
• Capacity expansion through construction of a new ice
cream factory in Seethawaka
• Expansion of the bottling plant in Ranala to cater to
growing demand
• EH Cream Soda won the People’s Beverage Brand of
the year and People’s Youth Choice Beverage Brand of
the year for the 11th consecutive year
• KFP implemented a brand migration exercise in the
year where several “Keells” branded products were re-
branded as “Keells-Krest”
• 15 new stores were opened during the year under
review, increasing the total retail footprint to 64 stores
as at 31 March 2017
• JMSL received a satisfaction rating of 4.2/5.0 in the
“Voice of Supplier Survey” - a survey conducted among
all commercial suppliers of Keells Super
• Launch of “Never Frozen” fresh chicken campaign,
focusing on fresh food offering
• The Nexus Mobile loyalty programme reached a
landmark of over 650,000 members
• Feasibility studies and conceptual designs for the
construction of a new distribution centre were finalised
with JKLL, the Group’s logistics arm
Key Indicators
Inputs (Rs.mn) 2016/17 2015/16 (%) 2014/15
Total assets 18,275 15,862 15 12,945
Total equity 8,414 7,803 8 6,613
Total debt 1,121 812 38 923
Capital employed 9,535 8,616 11 7,536
Employees (number) 4,446 3,692 20 3,427
Outputs (Rs.mn) 2016/17 2015/16 (%) 2014/15
Revenue 45,812 36,458 26 29,757
EBIT 5,486 4,497 22 2,566
PBT 5,466 4,472 22 2,498
PAT 3,896 3,229 21 1,804
EBIT per employee 1.2 1.2 1 0.7
Carbon footprint 33,407 29,060 15 26,441

146 John Keells Holdings PLC | Annual Report 2016/17
CONSUMER FOODS AND RETAIL
Industry Group Review
External Environment and Operational
ReviewThe Consumer Foods sector maintained
its growth momentum in the year under
review, which augured well for the operations
of the industry group as it witnessed a
healthy growth in volumes in its core areas
of operations. The first half of the financial
year saw double digit growth in volumes,
particularly in the Consumer Foods sector
of the business while there was a relative
moderation in growth in the latter half of
the financial year. The overall performance
of the Consumer Foods and Retail sector
demonstrated significant growth over the
previous year driven by the rapid growth in
the outlet footprint and customer footfall
of the Retail business together with robust
volume growth in Beverages and Frozen
Confectionery as a result of strong execution
and leveraging on CCS’s wide distribution
network for both Beverages and Frozen
Confectionery segments of over 90,000
and 70,000 retail outlets respectively (both
general and modern trade outlets).
However, the Consumer Foods sector did
witness some moderation in the growth in
volumes in the second half of the year which
was mainly attributable to a dampening
of consumer sentiment as a result of the
increase in the value added tax (VAT) and
other tax policies; the effects of the drought,
which affected 16 districts of the country; and
rising inflation with the National Consumer
Price Index increasing to 6 per cent on an
annual average basis as at the end of the
financial year 2016/17.
The Frozen Confectionery business witnessed
a double digit volume growth of 11 per cent
[2015/16: 21 per cent] in the year driven
mainly by the growth in bulk confectionery,
whilst the impulse segment maintained the
expected level of growth in the year. The
volume growth witnessed in the year was
primarily driven through the general trade
outlets and small and medium modern trade
(SMMT) outlets across the country. Margins
improved during the first half of the year as
the segment benefitted from higher operating
leverage as well as due to a revision of prices
on account of the impending VAT rate hike in
May 2016, which became fully operational
from November 2016.
In keeping with its growth strategy, and
the need to cater to varying consumption
occasions, the Frozen Confectionery business
expanded its product portfolio during the
year with the introduction of “Sword”; an
impulse product to fill the market demand
gap for extruded sticks and a new coconut
flavoured impulse product. The business also
relaunched the premium range “Imorich” and
the “Elephant House Wonder” range in the
second half of the year. The special limited
edition flavours of “Wattalappan” and “Winter
slice” ice creams were introduced, and well
received, in the year under review.
The Frozen Confectionery business
continued to witness enhanced efficiencies
from the pre-selling model implemented
in the previous financial year, leading to a
50 per cent increase in the daily bill count
which contributed towards its improved
performance and higher penetration,
particularly in the general trade space. The
business continued to maintain its leadership
position in the ice cream market in the
Maldives.
In keeping with the demand growth in both
the export markets and the local market,
CCS commenced the construction of a new
ice cream factory in the Seethawaka Free
Trade Zone. The new factory is expected to be
completed within a year with an investment
of Rs.3.80 billion.
The Beverage business witnessed a volume
growth of 10 per cent compared to the
industry growth recorded at 15 per cent in the
year under review. The segment experienced
strong growth in the first half of the year
which gradually tapered off in the second
half of the year due to the aforementioned
macro-economic conditions. The growth in
the Beverage segment was primarily driven
by the growth in PET bottle volumes. Volume
growth in terms of the can line maintained a
high growth momentum, as expected, while
the glass line witnessed a marginal decline.
In keeping with the new trends in the market,
the company introduced “Fit-o” in December
2016; a fruit drink in mango and orange
flavours which was later introduced in a 1
litre tetra pack. CCS also introduced “Lemoki”;
a lemon and kiwi hybrid carbonated drink in a
350ml PET bottle in addition to “Lime Crush”
which was introduced in two new pack sizes
(400ml and 2 litres).
In a proactive step towards reducing
the calorific sugar content in beverages,
and in keeping with the Governments
initiative to provide better guidelines on
the daily consumable items in the market,
CCS commenced the use of stevia in its
manufacturing process. Currently, stevia
replaces 30 per cent of the total sugar content
of “Orange Crush”, “Cream Soda”, “Necto” and
“Lime Crush”. The initiative will be extended
to include other flavours in the near term.
Currently, a majority of the beverages in the
product portfolio are classified as “Moderate”
(colour code: amber) in the regulated
classification of sugar content issued by the
Health Ministry of Sri Lanka.
CCS continued to place emphasis on the
composition of its portfolio, product mix, the
numerous pack sizes and various other cost
management measures and productivity
enhancing initiatives to drive profitability. In
recognition of the high quality standards and
the unique taste profile, the operational and
brand efforts of CCS were recognised at the
People’s Awards of 2016 where Elephant
House Cream Soda won the People’s
beverage brand of the year and the People’s
youth choice brand of the year for the 11th
consecutive time in March 2017.
The export market for beverages grew 12 per
cent in the year with CCS entering the UK and
the EU markets in October 2016. The formulae
of a selected portfolio of beverages were
CCS continued to place emphasis
on the composition of its portfolio,
product mix, the numerous pack
sizes and various other cost
management measures and
productivity enhancing initiatives
to drive profitability.
The Retail business added 15 new
stores during the financial year
2016/17

147
reformulated to include stevia and approved
ingredients in compliance with the health
standards imposed by the EU. In keeping
with the company’s expansion plans for the
beverage portfolio, an investment of Rs.2.50
billion has been considered for a bottling line
extension within the Ranala manufacturing
plant. The installation of the line is expected
to have an approximate completion period of
12 months.
Keells Food Products (KFP) witnessed a
volume decline of 4 per cent in the year as
a result of continuing negative sentiments
surrounding the processed meat market.
KFP implemented a brand migration exercise
as a means of creating brand presence for
the “Keells-Krest” brand under the “Elephant
House” brand umbrella. KFP also benefitted
from a number of productivity improving
measures implemented in the year under
review, which included the introduction of
pre-selling to a majority of distributors and
dealers which is expected to create further
growth momentum. The export market
performance was in line with expectations,
barring several regulatory challenges in
entering particular markets. The Indian
operations commenced through a licensed
distributor in the first half of the financial
year in Tamil Nadu and Pondicherry.
The strong performance of the Retail sector
was on account of the double digit growth in
customer footfall witnessed during the year
and the notable contribution from the newly
opened outlets which have all exceeded
expectations. The same store sales growth,
which was the primary driver of growth
in the Retail sector, witnessed a slight
moderation in the year under review. The
moderation of growth in same store sales,
which was anticipated, was a result of the
rapid store expansion plans of the sector and
the corresponding “cannibalisation” effect it
entails, particularly in instances where new
stores are opened in proximity to existing
stores. Data insights have proven that this
impact on the existing store is temporary,
and it benefits from the attraction of new
footfall in to the store. During the year under
review, 15 new conforming large format
stores were opened, with a further 3 stores
being opened in April 2017. The new stores
were predominantly centered in the Western
Province. The total store count stood at 64 as
at 31 March 2017.
JayKay Marketing Services Limited (JMSL)
continued its emphasis on ensuring value,
availability and quality of the goods offered,
efficiency of check-out times and providing
the “Keells Super” customer a differentiated
shopping experience. Further to the “Fresh
Campaign” introduced in the previous
financial year, JMSL pioneered the launch of
“Fresh Chicken” (never frozen chicken) in the
year under review. The pioneering initiative
by JMSL, included working closely with
the supplier base to develop the necessary
infrastructure and delivery mechanisms
relating to the “Fresh Chicken” campaign,
and was launched as a means of ensuring
the consumer was offered the best quality
products. The initiative also resulted in
JMSL creating better relationships with its
suppliers and providing them with insights
on consumer preferences and trends. JMSL
also launched a convenience range of “Heat
and Eat” products in selected stores in
anticipation of growing consumer demand
for pre-prepared convenience food items.
Leveraging on the cross functional relations
within the Group, the Retail business together
with the Logistics arm of the Group finalised
the feasibility study and concept designs for a
centralised distribution center (DC) to cater to
the rapidly expanding network of stores. The
state-of-the-art distribution center will cater
to both dry and fresh (for perishable goods)
products in addition to chilled produce.
The Nexus Mobile loyalty programme
continued to be a key tool in retaining and
attracting customers. The membership
reached a landmark of 650,000 customers,
making it one of the most successful loyalty
programmes in the country. As a significant
proportion of the Keells Super customers
are Nexus members, the sector continued
to leverage on its data analytics to better
understand consumption patterns and target
promotions and offers which will specifically
benefit its customer base.
Capital Management Review Concluding the external environment and
the operational review of the Consumer
Foods and Retail industry group, the ensuing
section elaborates on the forms of Capital
deployed to meet the strategic priorities and
the performance of the businesses during
the year under review.
The industry group adheres to the John Keells
Group’s Environmental, Labour and Product
policies and continues to monitor employee,
environmental and social activities within
the Group, whilst marketing its products
responsibly when ensuring that value is
created across all forms of Capital.
Key performance indicators for the industry group, under each of the sectors are summarised
as follows:
Sectors Consumer Foods Retail
Financial and Manufactured Capital - revenue
and growth
Rs.16.00 billion, 12
per cent increase
Rs.29.81 billion, 35
per cent increase
Financial and Manufactured Capital - EBIT and
growth
Rs.3.80 billion, 18
per cent increase
Rs.1.68 billion, 32
per cent increase
Natural Capital - carbon footprint 15,733 MT 17,674 MT
Human Capital - number of employees 1,326 3,120
Rs.5.47Bn
Consumer Foods and Retail industry group PBTA 22 per cent growth
Group Highlights | Governance | Management Discussion & Analysis | Financial Statements | Supplementary Information
Retail footprint in Colombo

148 John Keells Holdings PLC | Annual Report 2016/17
CONSUMER FOODS AND RETAIL
Industry Group Review
Financial and Manufactured Capital
As at 1 April 2016, the Consumer Foods and
Retail industry group had total assets of
Rs.15.86 billion, debt of Rs.812 million and an
opening equity capital of Rs.7.80 billion.
Financial Performance
Revenue increased by 26 per cent to Rs.45.81
billion [2015/16: Rs.36.46 billion] in the financial
year. Revenue of the Consumer Foods sector
grew by 12 per cent driven by double digit
sales volume growth in both the Beverages and
Frozen Confectionery businesses. The revenue
of the Retail sector increased by 35 per cent
as a result of higher footfall and incremental
revenue generated from newly opened outlets,
which have performed beyond expectations, in
the year under review.
Consumer Foods
Retail
0% 20% 40% 60% 80% 100%
Turnover
2014/15
2015/16
2016/17
39
39
35
61
61
65
0% 20% 40% 60% 80% 100%
EBIT
2014/15
2015/16
2016/17
77
72
69
23
28
31
The EBIT of the industry group increased by
22 per cent to Rs.5.49 billion [2015/16: Rs.4.50
billion]. CCS, and JMSL, recorded EBIT growth
of 23 per cent and 32 per cent, respectively, on
account of the aforementioned revenue growth
stemming from higher volumes, efficient
execution and management of distribution
and dealer networks of CCS and higher
foot fall at JMSL. KFP recorded a moderate
revenue growth during the year, attributable to
the decline in volume growth discussed in the
External Environment and Operational Review.
The EBIT of the industry group included fair
value gains on investment property of Rs.92
million [2015/16: Rs.17 million] pertaining
to CCS. The recurring EBIT, excluding the fair
value gain on investment property, increased
by 20 per cent to Rs.5.39 billion. The PBT of
the industry group increased by 22 per cent to
Rs.5.47 billion [2015/16: Rs.4.47 billion] whilst
recurring PBT also increased by 21 per cent to
Rs.5.37 billion [2015/16: Rs.4.46 billion].
Borrowings and Finance Expense
Total debt as at 31 March 2017 increased
by 38 per cent to Rs.1.12 billion attributed
to the construction of the new ice cream
manufacturing plant under Colombo Ice
Company (Pvt.) Limited, a fully owned
subsidiary of CCS. CCS repaid its existing
long term liabilities during the year, while the
increase in total debt occurred towards the end
of the financial year, and as such, the finance
expense for the financial year of the industry
group reduced by 23 per cent to Rs.19 million
[2015/16: Rs.25 million]. JMSL also increased
its short term working capital facilities as a
result of higher operational volumes.
Return on Capital Employed
• The ROCE of the industry group increased
to 60.4 per cent in the year under review,
in comparison to the 55.7 per cent
recorded in the previous financial year.
The capital base of the industry group
was marginally impacted by the afore-
mentioned fair value gains on investment
property and revaluation gains of Rs.199
million [2015/16: Rs.79 million]. As
discussed under the Strategy, Resource
Allocation and Portfolio Management
section of this Report, the capital base
has been adjusted for the fair value and
revaluation gains arising in the preceding
three years in order to calculate the
adjusted capital base. On this basis, the
adjusted ROCE after eliminating the
aforesaid impacts, stands at 61.4 per
cent compared to an adjusted ROCE of
63.1 per cent in the prior year
• The EBIT margin was 12.0 per cent
compared to the 12.3 per cent recorded
in the previous year. The marginal
contraction in EBIT was due to related
increases in administration and sales
costs in the Consumer Foods sector.
The recurring EBIT margin of the
industry group which is the operational
EBIT, adjusted for the fair value gains,
was 11.8 against 12.3 recorded in the
previous year. The recurring EBIT margin
of the Consumer Foods sector was 23
per cent [2015/16: 22 per cent] while the
recurring Retail EBIT held steady within
the two year period
• The decrease in the industry group’s
EBIT margin was expected since the
EBIT contribution of the Retail sector has
increased by 8 per cent during the year
• The industry group recorded an asset
turnover of 2.68 times during the year
compared to the 2.53 times recorded
in the previous financial year. It should
be noted that the expansion of the
Retail sector will impact the ratio, since
the expansion will have a significant
effect on the asset base of the industry
group whilst also having a more than
proportionate effect on turnover
Natural Capital
The Consumer Foods and Retail industry
group carries out its operations within
the Group’s Environmental and Energy
Management policy, whilst adhering to, and
going beyond, all required environmental
laws and regulations through regular
monitoring and testing.
The material impacts for the industry group
are classified as follows:
Energy,
emissions, water
and waste
Financial, regulatory
and brand reputation
implications
Energy and Emissions Management
Targets:
• Reduction of energy consumption
and the resultant reduction in carbon
footprint through initiatives and better
management of infrastructure
ROCE2016/17: 60.4%[2015/16: 55.7%]
EBIT margin12.0%
Asset/Debt + Equity1.88
Asset turnover2.68
Return on Capital Employed
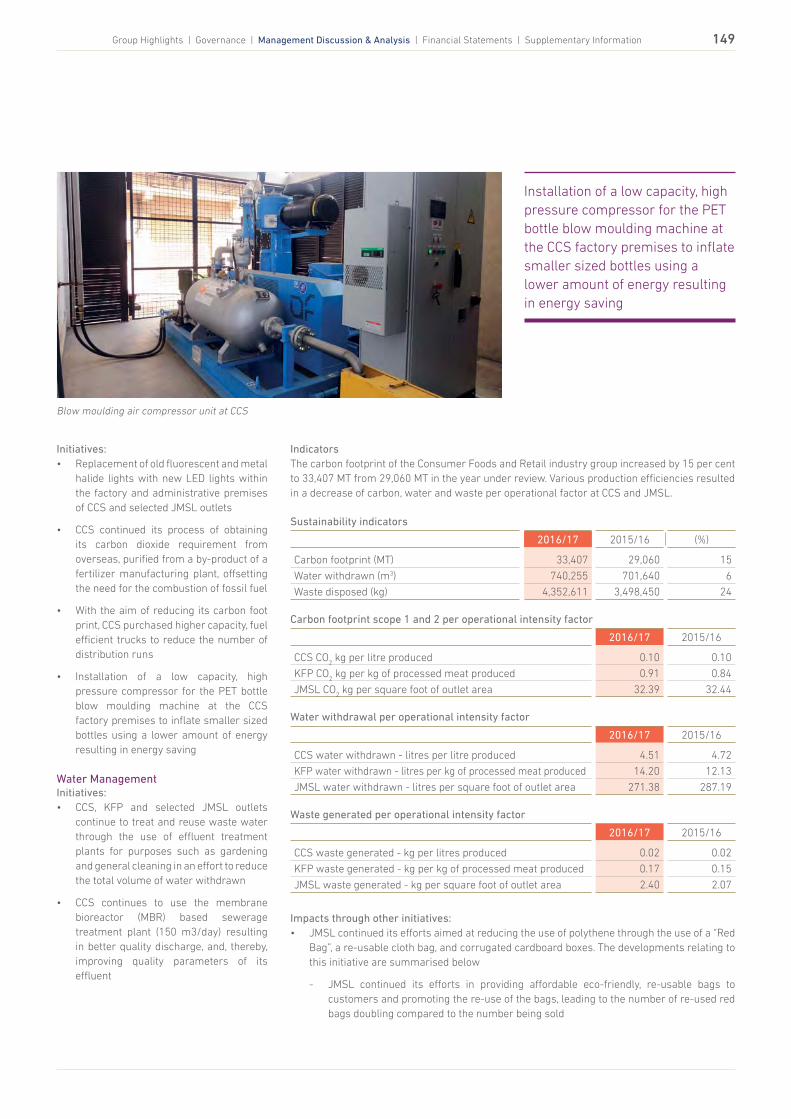
149
Initiatives:
• Replacement of old fluorescent and metal
halide lights with new LED lights within
the factory and administrative premises
of CCS and selected JMSL outlets
• CCS continued its process of obtaining
its carbon dioxide requirement from
overseas, purified from a by-product of a
fertilizer manufacturing plant, offsetting
the need for the combustion of fossil fuel
• With the aim of reducing its carbon foot
print, CCS purchased higher capacity, fuel
efficient trucks to reduce the number of
distribution runs
• Installation of a low capacity, high
pressure compressor for the PET bottle
blow moulding machine at the CCS
factory premises to inflate smaller sized
bottles using a lower amount of energy
resulting in energy saving
Water Management Initiatives:
• CCS, KFP and selected JMSL outlets
continue to treat and reuse waste water
through the use of effluent treatment
plants for purposes such as gardening
and general cleaning in an effort to reduce
the total volume of water withdrawn
• CCS continues to use the membrane
bioreactor (MBR) based sewerage
treatment plant (150 m3/day) resulting
in better quality discharge, and, thereby,
improving quality parameters of its
effluent
Indicators
The carbon footprint of the Consumer Foods and Retail industry group increased by 15 per cent
to 33,407 MT from 29,060 MT in the year under review. Various production efficiencies resulted
in a decrease of carbon, water and waste per operational factor at CCS and JMSL.
Sustainability indicators
2016/17 2015/16 (%)
Carbon footprint (MT) 33,407 29,060 15
Water withdrawn (m3) 740,255 701,640 6
Waste disposed (kg) 4,352,611 3,498,450 24
Carbon footprint scope 1 and 2 per operational intensity factor
2016/17 2015/16
CCS CO2 kg per litre produced 0.10 0.10
KFP CO2 kg per kg of processed meat produced 0.91 0.84
JMSL CO2 kg per square foot of outlet area 32.39 32.44
Water withdrawal per operational intensity factor
2016/17 2015/16
CCS water withdrawn - litres per litre produced 4.51 4.72
KFP water withdrawn - litres per kg of processed meat produced 14.20 12.13
JMSL water withdrawn - litres per square foot of outlet area 271.38 287.19
Waste generated per operational intensity factor
2016/17 2015/16
CCS waste generated - kg per litres produced 0.02 0.02
KFP waste generated - kg per kg of processed meat produced 0.17 0.15
JMSL waste generated - kg per square foot of outlet area 2.40 2.07
Impacts through other initiatives:
• JMSL continued its efforts aimed at reducing the use of polythene through the use of a “Red
Bag”, a re-usable cloth bag, and corrugated cardboard boxes. The developments relating to
this initiative are summarised below
- JMSL continued its efforts in providing affordable eco-friendly, re-usable bags to
customers and promoting the re-use of the bags, leading to the number of re-used red
bags doubling compared to the number being sold
Blow moulding air compressor unit at CCS
Installation of a low capacity, high
pressure compressor for the PET
bottle blow moulding machine at
the CCS factory premises to inflate
smaller sized bottles using a
lower amount of energy resulting
in energy saving
Group Highlights | Governance | Management Discussion & Analysis | Financial Statements | Supplementary Information

150 John Keells Holdings PLC | Annual Report 2016/17
CONSUMER FOODS AND RETAIL
Industry Group Review
- Encouraging customers to bring their
own eco-friendly re-usable bags by
introducing a points system based
on the Nexus loyalty programme.
Currently, this is being piloted at
2 outlets with plans to expand the
initiative, if successful
• Responsible disposal of e-waste
weighing 1,300 kg by JMSL through a
third party supplier
• Recycling of food waste weighing 13,529
kg by KFP from both the Pannala and
Ja-Ela plants
Human Capital
Given its labour intensive nature, the
Consumer Foods and Retail industry group
places significant importance on its Human
Capital. While the industry group focuses on
areas such as health and safety, providing
continuous training to develop skills and
improve productivity of employees, it also
strongly believes in respecting employee rights
and maintaining good working conditions
The material impacts are identified as:
Health and
safety/ training
and talent
retention
The operations within
the industry group are
labour intensive, with
over 4,400 employees
in total
Targets:
• Provide regular feedback to employees
along with performance reviews, and
necessary training and development
throughout the year
• Maintain a healthy working relationship
with employee unions through constant
dialogue and joint consultative
committees
• Minimise occupational health and safety
incidents
• Identify and meet the training needs of
the staff and reduce employee attrition
• Encourage healthy labour relations
within the industry group’s workforce
Initiatives:
• CCS and KFP continued to maintain
OHSAS certification and streamlined
its organisational processes through
continuous monitoring and process
improvements to ensure a safe working
environment
• Videos related to training on health and
safety were provided to more than 2,600
JMSL outlet employees, along with safety
gear. The employees were also provided
with new guidelines on safe use of
machinery
• Health and Safety awareness campaigns
were conducted for outlet employees
through the K-FM radio channel,
printed in-store material, distribution
of employee pocket calendars and in-
store briefing sessions while health and
Social and Relationship Capital
Considering its dependence on sourcing
high quality raw materials, the industry
group places emphasis on its Social and
Relationship Capital. Wherever possible,
businesses purchase raw materials locally.
The Group proactively engages with its
diverse farmer communities, recognising that
increased awareness on weather patterns
and sustainable agricultural practices are
important to ensure sustained yield and
efficient operations. Farmers are required
to adhere to agricultural practices that
are environmentally friendly and produce
high yields. The farmers also benefit from
wellness tips were provided to JMSL
head office employees performing desk-
jobs
• More than 560 training hours on first aid
and fire safety were conducted for 187
JMSL supervisors to ensure a safe work
environment at outlets
• All companies of the industry group
reviewed and tested its business
continuity plans regularly throughout the
year
the guaranteed volume and price scheme
observed by the ice cream and beverage
businesses.
Companies in the industry group assess all
significant suppliers, including suppliers
providing janitorial and outsourced services,
for significant negative sustainability impacts.
Supply chain
and sustainable
sourcing
Ensure a continuous
source of raw materials
which reduces risk,
enhances brand
reputation and benefits
local businesses
"Bring your own bag (BYOB)" initiative carried out by JMSL
Indicators
From a labour perspective, 89 injuries were recorded during the reporting year, while 172,981
hours of training were provided to those employed within the industry group. It is pertinent
to note that a majority of these injuries were minor in nature and no fatalities were recorded
pertaining to the job.
Labour indicators
2016/17 2015/16 (%)
Injuries and diseases (number) 89 91 (2)
Total hours of training 172,981 91,402 89

151
Targets:
• Source all ingredients and produce
required within Sri Lanka, with exceptions
only due to the shortage of raw materials
• Assess all significant suppliers for
environmental, social and labour risks
• Adhere to the Group’s policies on Labour,
Child and Forced Labour with the aim of
ensuring there are no such instances
Initiatives:
• CCS continued its ginger and vanilla
"outgrower" programmes through the
provision of financial assistance and
technical advice to farmers via local
authorities. Substantial quantities of
ginger were purchased from its out
grower programme for its flagship
product “Elephant House Ginger Beer”
while also extending technical support
by introducing compost filled poly-
sack bags for ginger farming to enable
better utilisation of land. CCS together
with the Export Agriculture Department
and Kandy Vanilla Growers Association
(KVGA) also initiated a project to cultivate
100,000 vanilla plants in identified
villages in the Central province. The
company also continues its purchase
of treacle and jaggery at a guaranteed
quantity at a rate above the market, as a
means of enhancing farmer livelihood.
• KFP continued its assistance in the
expansion of local, mechanised and
de-boned meat suppliers while also
providing local farmers with a guarantee
for the purchase of pork and chicken.
• JMSL facilitated good manufacturing
practices (GMP) workshops for small
and medium scale suppliers and good
agriculture practice programmes (GAP)
for farmers in collaboration with the
Department of Agriculture for farmers
in Thambuttegama, Sooriyawewa
and Nuwara Eliya, optimising the
production and post-harvest process of
fresh produce. JMSL also improved its
sustainable sourcing targets within the
“fresh” produce supply chain to ensure
higher quality produce for its customers
• Hundreds of farmer families benefit
from the Retail sector sourcing scheme
which provides an assured market for
quality produce, technical assistance
and exposure to practices adopted in
more developed markets. This has also
facilitated the business in ensuring
a sustainable business model while
creating value for the community. Key
impacts from these initiatives are
summarised below;
Newly introduced community bay at a Keells Super outlet
CompanyNumber of
farmers
Total annual
supply (Kg)
Total annual
payment (Rs.)
KFP 5,060 3,284,502 980,561,242
CCS 2,957 156,310 157,581,211
JMSL 1,978 8,876,040 747,396,576
The significant suppliers within the industry group are illustrated below:
Group Highlights | Governance | Management Discussion & Analysis | Financial Statements | Supplementary Information
Significant Suppliers - Consumer Foods
Glass bottlesPoultry and meat
suppliersSugar
suppliersPlastic packaging
containersDairy suppliers
Significant Suppliers - Retail
Frozen and chilled products
Vegetable and fruit farmers
JanitorsHousehold items SecurityDry food product
suppliersFresh meat suppliers
Third party tenants (within
premises)

152 John Keells Holdings PLC | Annual Report 2016/17
CONSUMER FOODS AND RETAIL
Industry Group Review
ProductNumber of
farmers
Spices 2,500
Pork 30
Chicken 2,500
Vanilla 1,200
Cashew Nuts 1,300
Ginger 382
Vegetables 30
Kithul Jaggery 60
Treacle 15
Community Engagement:
In addition to the sustainable sourcing
initiatives carried out by the industry group,
various other community engagement
projects were initiated to build ongoing and
permanent relationships in order to promote
social responsibility and integration within the
community. To this end, the following were
carried out during the year under review;
• JMSL reiterated its commitment to
minimise fresh produce wastage by
being the first supermarket in Sri Lanka
to donate unused vegetables and fruits
to charities, alleviating hunger among
the disadvantaged and minimising the
amount of food that gets discarded at
landfills. The initiative titled “We Donate”
is currently being piloted in 13 stores,
where approximately 1,847 kg of produce
has been donated. Plans are currently
underway to expand the initiative to all
Keells Super outlets
• JMSL offers ‘Community bays’ for local
and medium scale suppliers to display
and market their products. This initiative
has benefitted organisations such as the
Chitra Lane School for Special Children and
Mother Sri Lanka, giving disadvantaged
and marginalised communities the
opportunity to be productive members of
society and be economically independent
• As a means of promoting healthy living,
Nutri-tips and a wider range of healthy
consumption options including organic
fresh produce are available for customers
Intellectual Capital
The Consumer Foods and Retail industry group
continuously strives to ensure high product
and service quality. While the Consumer
Foods businesses focus on ensuring safe
and high quality products, the objective of the
Retail sector is to offer a superior customer
experience. The industry group’s businesses
have obtained international quality standards
with assurance obtained annually through
third party verifications. Both CCS and KFP
adhere to the standards stipulated by the
Sri Lanka Standards Institute and are on par
with international standards with respect to
process excellence.
As testimony to its product excellence, CCS
won many awards and accolades during
the year such as the National Chamber of
Exports awards, PEOPLES Awards 2016, Sri
Lanka China Business Cooperation Council
Awards 2016, National Business Excellence
Awards, Institute of CA Sri Lanka - Annual
Report Awards, amongst many others.
The material impacts relating to this Capital
are identified as:
Product and
service quality
Financial, regulatory,
brand reputation and
business continuity
implications
Responsible
labelling and
marketing
communication
Financial, regulatory
and brand reputation
implications
Targets:
• CCS and KFP look to ensure the quality of
raw materials through quality assurance
processes and continuous monitoring of
its suppliers
• Continuously ensure that all local
packaging and labelling requirements
are met and that marketing
communications are in line with the
Marketing Communication Guidelines of
the John Keells Group, which is based on
the Code of Advertising and Marketing
Communications by the International
Chamber of Commerce
• CCS and JMSL to assess its sustainability
performance against international
benchmarks and carry out initiatives to
address any gaps that are identified
• Internal short term goals, aligned towards
meeting international benchmarks, have
also been established by the industry
group while JMSL continues a strategy
to entrench sustainable practices both at
store level and in the value chain
• CCS and KFP will strive to meet
internationally recognised quality
standards, with both companies obtaining
ISO 9001 and ISO 22000 certifications as
well as SLS 183 and SLS 223
Initiatives:
• The calorific sugar content in beverages
was reduced through the use of stevia; a
natural sweetener with zero calories. The
initiative led to a 30 per cent reduction
in the total sugar content in selected
beverages
• Providing healthy product options to
customers at all Keells Super stores
and also launching a special organic dry
range at selected stores
• Providing organic fresh produce to
customers. Rolled out in 36 Keells Super
stores to date
• Providing Nutri-tips from a senior
dietician to customers via digital media
handles such as Facebook and in-store
marketing material at JMSL. The tips
focused on how different foods provide
different health benefits, meal planning
for best nutrition and other freshness/
nutrition related tips
• JMSL obtained SLS certification for over
40 Keells Super stores and in-store
bakeries
• KFP removed total added MSG and nitrite
from frozen categories such as sausages,
meat balls, formed meat, chinese rolls,
ham and bacon. The removal of nitrite
resulted in the products carrying the line
"No added preservatives" in its packaging
• Of the 519 stock keeping units which are
either manufactured by the Consumer
Foods sector or obtained via private
labelling arrangements at the Retail
sector, 81 per cent carried information
on the ingredients used, 1 per cent
carried information on raw material
sourcing, whilst 31 per cent and 93 per
cent carried information on the safe use,
and responsible disposal of products,
respectively

153
Strategy and OutlookThe penetration of consumer food products
continues to be comparatively low with
per capita consumption of carbonated soft
drinks and ice creams in Sri Lanka currently
standing at 10 liters and 2 litres respectively,
significantly below the regional average,
highlighting the potential for continued long
term growth in these categories. Whilst the
tapering of demand witnessed in the fourth
quarter of 2016/17 is likely to continue
in the short term given the Government’s
fiscal consolidation efforts and prevailing
inflationary pressures, the changes in
consumer lifestyles, consumption habits and
improving prosperity are expected to provide
opportunities for volume growth in the
medium to long term. Although off a relatively
lower base, the growth from the outskirts of
the country is expected to be significantly
higher than the growth stemming from the
urban markets.
With the ongoing investment in the
new manufacturing facility, the Frozen
Confectionery businesses will place a greater
emphasis on the impulse range to capture
an emerging consumer base to ensure a
holistic portfolio that can cater to evolving
consumers and varying consumption
occasions. The company will also continue
investments to facilitate growth in the bulk
and impulse ranges and to extend in to other
verticals such as dairy based products. The
business will continue to invest in optimising
its processes and procedures relating to
its distribution network, expanding freezer
penetration and strengthening the mobile
distribution channel.
Given the aforementioned low penetration
of carbonated soft drinks in Sri Lanka, and
as witnessed over the prior years, growth
in volumes in the rural areas is expected
to exceed that of densely populated areas
such as Colombo, Kandy and key suburban
cities. As stated in the previous year’s Annual
Report, the long term growth potential for
the carbonated soft drinks industry may
moderate, to an extent, due to the emergence
of a health conscious consumer. The
prospects for the beverage industry continue
to be encouraging nevertheless since these
health conscious consumers seek alternate
beverage options. CCS will continue to explore
different possibilities in terms of flavours and
other product extensions to create a product
offering which has greater variety and
convenience to the consumer. CCS will look
to cater to this segment of the market with
its evolving product portfolio. In doing so, the
company will leverage on its brand recognition
and trusted reputation. CCS will continue to
invest in research and development initiatives
to facilitate the use of natural ingredients
when re-inventing existing products
and developing new products. Given the
increasing role of digitisation and its impacts
on businesses, CCS will place emphasis on
the introduction of digital initiatives aimed at
improving efficiencies and managing costs
within the company, particularly in relation to
the supply chain and in enhancing customer
satisfaction.
The expansion of the portfolio in the
Convenience Foods business remains
a near term priority, with plans to add
products mainly in the vegetarian, fish
and pork ranges. In the medium to long
term, KFP will look to diversify its portfolio
through a greater emphasis on the “health
conscious” consumer and capitalising on the
growing need for “convenient” main meal
opportunities. Added focus will also be placed
in the ensuing year on KFP’s export strategy
which is aimed at increasing volumes from
markets such as India and the Maldives.
The modern trade share of Sri Lanka’s
retail industry is approximately 16 per cent,
well below that of countries in the region
(Singapore: 71 per cent; Malaysia: 43 per
cent and Thailand: 45 per cent), indicating the
growth potential of Sri Lanka’s modern retail
sector. The population per store in Sri Lanka
is also significantly higher than that of other
comparable countries, although this statistic
should also be looked at in the context of
store format, population density and other
country specific factors. The Retail sector
will look to capitalise on this opportunity by
strategically expanding its retail footprint
in the near and medium term, subject to
macro-economic conditions and feasibility.
The business continues to seek properties
in strategically placed locations in line with
its expansion plans with a view to rolling out
conforming outlets primarily in the larger
format. While a majority of outlets will be
concentrated within, and in close proximity
to, the Western Province, other locations will
also be considered based on certain criteria.
Securing land for new conforming stores,
particularly in the urban areas, remains the
primary challenge. Considering the rapid
growth of the store network, recruitment and
retention of staff is a key challenge affecting
JMSL as well as the retail industry in general.
JMSL has implemented various initiatives
to enhance the retention of staff in order to
ensure it maintains efficiency of operations
and delivery of services standards to the
expectations of its customers.
In order to complement the growth plans
of the business, and to further improve the
productivity and efficiency of the company,
JMSL will place added focus on constructing
and commencing operations of the new
distribution centre towards the first half of
calendar year 2019, in collaboration with
John Keells Logistics, the Group’s logistics
business. The Retail business will continue
to focus on differentiating the shopping
experience to the customers through the
quality of its produce, particularly in the fresh
products ranges whilst also driving service
standards and customer care. Nexus Mobile,
the loyalty programme of the Retail business,
will continue to add value, enabling the
business to identify key trends in customers
and shopping lifestyles using data analytics.
Philippines28%
45%
16%
43%16%
Indonesia
Malaysia
Thailand
Sri Lanka
71%Singapore
Group Highlights | Governance | Management Discussion & Analysis | Financial Statements | Supplementary Information
The modern trade penetration in the region

154 John Keells Holdings PLC | Annual Report 2016/17
12%Revenue
9%EBIT
4%Capital employed
2%Carbon footprint
Our Business ModelVision and Scope
The segment is engaged in a broad range
of financial services across insurance,
commercial banking, debt trading, fund
management, leasing and stock broking, with
a vision of becoming leaders in the respective
segments through proactive customer
centricity and digital adoption.
The Financial Services industry group
continued its commitment towards digitisation
through the launch of “GOYO”, whilst
continuing to develop a comprehensive range
of financial solutions through state-of-the-art
digital platforms.
FINANCIAL SERVICES
Industry Group Review
Contribution to JKH Group
Banking and Leasing
Insurance Stock Broking CO2
0.17 MT perRs.mn revenue

155
Sectors Insurance Banking Stock Broking
The business
within the sector
• Union Assurance (UA) offers
comprehensive insurance
solutions in the Life Insurance
segment while General
Insurance solutions are offered
through its equity accounted
investee recently renamed
Fairfirst Insurance Limited
• Nations Trust Bank (NTB) offers
complete banking solutions
through its network of branches
for corporate, retail and SME
clients, and is the sole acquirer
and the exclusive issuer of the
flagship centurion product range
of American Express cards in Sri
Lanka
• John Keells Stock Brokers
(JKSB) is one of the leading
stock broking companies in Sri
Lanka and has a number of trade
execution relationships with
leading foreign securities houses
Key external/
internal variables
impacting the
business
• The insurance industry continued
its strong growth, recording a
growth of 18 per cent during the
financial year
• The banking industry enjoyed
strong credit growth amid a
rising interest rate environment
• Increasing interest rates
including policy rates, narrowing
margins, declining CASA ratios,
increased VAT rates on financial
services and Intense competition
were key challenges during the
period
• Implementation of mandatory
Capital Adequacy Ratios
replacing net capital
requirements for stock brokers
took effect on 1 March 2017
• The All Share Price Index (ASPI)
declined by 0.2 per cent, while
average daily turnover levels at
the CSE declined by 23 per cent
in the year under review
Key developments
during the
financial year
• Introduction of “GOYO”, a
personalised wellness solution
that utilises a smart phone
application, a wearable device
and a network of partners.
“GOYO” includes an insurance
offering to reward users for
engaging in an active lifestyle
while acting as a “personal
health advisor”
• Introduction of a cash
management platform for mid-
level corporates that provides
supplier payment services,
electronic banking and payroll
services among others
• Implementation of cost
management initiatives and a
new trade execution and back
office IT platform
Key Indicators
Inputs (Rs.mn) 2016/17 2015/16 (%) 2014/15
Total assets 41,725 35,878 16 37,128
Total equity 7,592 7,135 6 11,698
Total debt 138 106 30 80
Capital employed1 7,730 7,240 7 11,778
Employees (number)2 814 803 1 718
1 For equity accounted investees the capital employed is representative of
the Group’s equity investment in these companies
2 As per the sustainability reporting boundary
3 Revenue is inclusive of the Group’s share of equity accounted investees
Outputs (Rs.mn) 2016/17 2015/16 (%) 2014/15
Turnover3 14,056 11,896 18 12,989
EBIT 2,097 2,301 (9) 3,076
PBT 2,097 1,699 23 3,076
PAT 2,042 1,718 19 3,019
EBIT per employee 2.6 2.9 (10) 4.3
Carbon footprint (MT) 1,391 1,407 (1) 1,550
Group Highlights | Governance | Management Discussion & Analysis | Financial Statements | Supplementary Information

156 John Keells Holdings PLC | Annual Report 2016/17
FINANCIAL SERVICES
Industry Group Review
External Environment and Operational
ReviewThe financial year 2016/17 marked a
successful year of operations for the Group’s
Financial Services industry group, with both
the Insurance and Banking sectors recording
encouraging growth.
The year under review marked the first year
of operations for the Life Insurance business
post its adoption of the Risk Based Capital
framework, as directed by the Insurance
Board of Sri Lanka (IBSL).
The life insurance industry continued to
demonstrate encouraging growth in the year
under review. The gross written premiums
(GWP) of the Life Insurance business for the
calendar year 2016 stood at Rs.8.27 billion,
an increase of 19 per cent over the Rs.6.96
billion recorded in the corresponding period
in 2015. The growth was predominantly
driven by a 23 per cent increase in traditional
policies whilst renewal premiums from unit
linked products were in line with expectations.
Rs.8.27Bn
Life insurance GWP growthA 19 per cent growth
As per the actuarial valuation carried out
during the year, the life insurance business
generated a surplus of Rs.1.10 billion, a
marked increase of 38 per cent against the
prior calendar year [CY2015: Rs.800 million].
With its focus on providing continuously
evolving and novel products, UA launched
“GOYO”, a trendy fitness mobile app and
wearable fitness tracker, representing
wellness and well-being. GOYO includes an
eco-system of partners revolving around
keeping fit, living healthy, cultivating healthy
habits and looking good. Launched in early
2017, GOYO acts as a “Personal Health
Advisor” motivating its users towards
achieving targeted goals and rewarding
each milestone with exclusive offers from
its partner base. The app was launched in
collaboration with the Group as well, including
cross functional tie ups with Cinnamon Hotels
and Resorts, Elephant House and Nations
Trust Bank.
The General Insurance business, which was
renamed “Fairfirst Insurance Limited” with
effect from 28th February 2017, recorded an
increase in gross written premiums of 29 per
cent in the calendar year ending 2016.
The banking industry recorded healthy
growth during the financial year against the
backdrop of strong credit demand stemming
from the private and public sectors. However,
performance was dampened to an extent due
to increased pressure on net interest margins
(NIMs) arising from rising cost of funds.
Despite a challenging operating environment,
Nations Trust Bank (NTB) recorded strong
growth in loans, advances and deposits. The
growth in loans and advances and deposits
during the calendar year was 24 per cent and
17 per cent, above the industry averages of
18 per cent and 17 per cent, respectively. The
growth in loans and advances was mainly
attributable to growth from the small and
medium sized enterprise (SME) segment
and corporate book, which also stems from
a conscious rebalancing of the loan portfolio.
Deposits recorded a growth of 17 per cent
[CY2015: 16 per cent], mainly driven through
the mobilisation of term deposits on account
of the expectant rise in interest rates
during the first half of the year. The current
and savings account (CASA) mix however,
decreased to 28 per cent of total deposits
from 32 per cent recorded against the prior
year due to the increase in interest rates,
which resulted in a shift to term deposits.
In line with NTB’s focus towards the corporate
and SME segments, the Bank launched
a cash management system for mid-tier
corporates in June 2016. The system offers
payroll services, supplier payment facilities
amongst others for corporates.
NTB continued its focus on lean management
initiatives together with increased automation
and greater reliance on digital channels.
The lean initiative at NTB has gathered
momentum with significant improvements in
key areas such as customer lean application
and turnaround time among others. The Bank
pursued opportunities in extracting value from
already existent soft and hard infrastructure,
focused on delivering customer centric
products and encouraged cross selling to
enhance NTB’s value proposition during the
period under review.
The uncertain external economic
environment including expectations of
interest rate hikes by the US Federal Reserve
resulted in an outflow of capital from many
emerging and frontier markets, including
Sri Lanka. Policy uncertainty locally, as well
as pressure on interest rates and exchange
rates exacerbated the negative performance
of the Colombo Stock Exchange affecting
the Stock Broking business during the year
under review. Further details on the overall
stock market and its performance can be
found in the Share and Warrant Information
section of this Report.
Operating within this environment, JKSB
focused on aligning its processes and
systems with client needs and introduced
efficiency enhancing and cost management
initiatives, which included a trading platform
and an order management system to improve
and increase efficiency in front office and
back office operations.
The Risk Based Capital Adequacy
requirements were approved by the
Securities and Exchange Commission of Sri
Lanka (SEC) with effect from 1 March 2017.
To this end, JK PLC and JKH infused equity in
to JKSB to meet this requirement.
The life insurance industry
continued to demonstrate
encouraging growth in the year
under review. The gross written
premiums of the Life Insurance
business for the calendar year
2016 stood at Rs.8.27 billion, an
increase of 19 per cent over the
Rs.6.96 billion recorded in the
corresponding period in 2015.
The bank launched a cash
management system for mid-tier
corporates in June 2016.

157
Borrowings and Finance Expense
Total debt pertaining to the Group’s
subsidiaries in the financial services cluster
(UA and JKSB) as at 31 March 2017 stood at
Rs.138 million.
Return on Capital Employed
• The industry group ROCE increased
to 28.0 per cent against 24.2 per cent
recorded in the previous year. The
increase in ROCE is partly stemming
from the decline in the average capital
base of the industry group on account
of the UA share repurchase which took
place in September 2015
• Total assets at the Financial Services
industry group increased by 16 per cent
to Rs.41.72 billion
• Asset turnover increased marginally
to 0.36 times compared to 0.33 times
witnessed in the prior financial year
Natural Capital
The Financial Services industry group
aimed to reduce its environmental impact
by aligning itself with global best practices.
The key initiatives that were successfully
continued into the current financial year of
operations are outlined as follows:
• Recycling of toner cartridges in
partnership with a third party supplier
• Installation of master key switches in all
branches, which enables the automatic
shutting down of power once the
users leave the premises leaving their
computers powered on
• Recycling of used paper during the year,
effectively saving 300 fully grown trees
• Replacement of traditional fluorescent
lights with LED lighting at branches
• Installation of timer switches in all split
and package air conditioners at branch
offices to enable automatic shutting
down after office hours
Capital Management ReviewFurther to the review of the external environment and operations, this section reviews the forms
of Capital available for the successful execution of the businesses strategies, the initiatives
undertaken during the year to create value, and also discusses the performance of the sectors
within the industry group under each form of Capital.
Key performance indicators for the industry group, under each of the sectors are summarised
below.
Sectors Insurance Banking and Leasing Stock Broking
Financial and
Manufactured Capital -
revenue and growth
Rs.9.66 billion,
increase of 22 per
cent
Rs.4.28 billion, increase
of 14 per cent
Rs.115 million,
decrease of 40 per
cent
Financial and
Manufactured Capital -
EBIT and growth
Rs.1.23 billion,
decrease of 16 per
cent
Rs.894 million,
increase of 9 per cent
(Rs.25 million),
decrease of 263
per cent
Natural Capital - carbon
footprint
1,367 MT Not within the
boundary of
sustainability reporting
24 MT
Human Capital - number
of employees
785 Not within the
boundary of
sustainability reporting
29
Financial and Manufactured Capital
As at 1 April 2016, the Financial Services
industry group had total assets of Rs.35.88
billion, debt of Rs.106 million and opening
equity capital of Rs.7.13 billion.
Financial Performance
Since the key businesses within the industry
group comprise of the Banking and Insurance
arms of the Group, the ensuing discussion
will be predominantly based on PAT, in order
to capture the net earnings of the businesses.
The performance of NTB, which is an equity
accounted investee, is reflected in the Group
financial statements on an attributable PAT
basis as required under the accounting
standards.
The PAT of the industry group increased
by 19 per cent to Rs.2.04 billion in the year
under review, primarily driven by the growth
witnessed in UAL. The PAT of the life insurance
business grew by 36 per cent during the
year as a result of the life insurance surplus
transferred to the shareholders amounting to
Rs.1.10 billion [CY2015: Rs.800 million] and
an increase in the earnings contribution from
its general insurance associate company
Fairfirst Insurance Ltd. The PAT of NTB grew
by 5 per cent during the year under review,
stemming from healthy growth in loans
and advances. The adverse equity market
conditions witnessed throughout the year
under review had a significant impact on
JKSB, resulting in a loss of Rs.20 million.
Group Highlights | Governance | Management Discussion & Analysis | Financial Statements | Supplementary Information
Insurance
Banking and Leasing
Stockbroking
0% 20% 40% 60% 80% 100%
Turnover
2014/15
2015/16
2016/17
69
66
69
28
32
30
3
2
1
0% 20% 40% 60% 80% 100%
EBIT
2014/15
2015/16
2016/17
73
64
59(1)
24 3
35 1
42
ROCE2016/17: 28.0%[2015/16: 24.2%]
EBIT margin14.9%
Asset/Debt + Equity5.18
Asset turnover0.36
Return on Capital Employed

158 John Keells Holdings PLC | Annual Report 2016/17
FINANCIAL SERVICES
Industry Group Review
The continued effort of the industry group to minimise the impact on the environment proved
fruitful as evident in the table below.
Indicators
2016/17 2015/16 (%)
Carbon footprint (MT) 1,391 1,407 (1)
Indicators
The industry group provided an average of
17 hours of training per person during the
reporting period, whilst the total number of
injuries increased by 3 per cent.
Social and Relationship Capital
With the regulatory frameworks governing
the financial services industry necessitating
that business is carried out in accordance
with the highest ethical standards, customer
confidentiality and satisfaction is a key factor
for the Financial Services industry group.
The focus on its Social and Relationship
Capital through its sustainability strategy
is based upon these material impacts. As
such, the Group focuses on strengthening its
brand presence among customers through
a commitment to high quality products
and services, community engagement and
employee development with minimal impact
on the environment while ensuring that its
operations are undertaken in a responsible
manner.
The material impacts for the industry group
are:
Customer
satisfaction
Negative impacts on
key customer accounts,
investor and client
confidence
Community
engagement
Proactive community
engagement contributes
to building trust and
promotes brand image
Ethics,
fraud and
corruption
Fraud and corruption loss
of brand reputation and
possible regulatory non-
compliance
The significant suppliers within the industry
group are:
Significant Suppliers
SecurityJanitors
Human Capital
The Financial Services industry group
continued its initiatives to enhance its Human
Capital productivity through training and
development, especially the sales agents of
UA.
The material impacts identified for the
industry group are as follows:
Occupational
health and
safety
Union Assurance sales
agents, who account for
over 75 per cent of the
John Keells Group’s total
contractor's personnel,
are at risk of road side
accidents
Talent
Management
The need to retain and
continuously upgrade
the skills of existing
staff, while developing
a resource base of
professionals.
Talent Management
During the year under review, UA was
recognised as one of the 20 great places to
work in Sri Lanka for the fourth consecutive
year by the Great Place to Work Institute
and was also recognised at the Insurance
Industry Awards for Best People Management
Practices.
Building a high performing team through
training, developing and educating the
employee cadre and the agency force is a
focal point of UA’s current business strategy.
Some key initiatives in this regard are
summarised below;
• Conducting a bottom-up strategic planning
process including representatives from
all functions to enhance employee
engagement and ensure their buy in
and commitment to deliver corporate
objectives
• Enhancing of leadership and team
building through various training
programmes
• Talent development and top management
engagement with identified talent pools
through projects such as “The Odessey”
and “The Ladder project”
• Conducting “Executive Development
Programmes” to prepare young
executives for the work environment and
to facilitate career building
• Personality development through “Union
Transformers” and “Project Emerge”
for staff below 30 years of age, and
school leavers respectively. (Apprentices
of “Project Emerge” were offered
permanent employment positions at UA
upon completion of the project)
Amidst these personal development
initiatives, more focused initiatives such
as a comprehensive re-structuring of the
bancassurance unit was initiated with the
intention of retaining and enhancing the
productivity of staff, which is a key contributor
towards the overall revenue generation of the
business.
Health and SafetyInitiatives
• Road Safety Awareness Programmes for
469 sales staff were conducted in 5 zones
• The annual fire evacuation drill was
carried out at the UA Head office in
association with the Colombo Fire Brigade
• UA implemented assessment centre
based recruitment processes for all
regions, including the bancassurance
channel, to enable recruitment of more
suitable employees
• Outstanding performers of UA sales staff
were rewarded for their performance
achieved via digital submission of
policies, through the “Digital Quarter
2016” competition
• A Career Progression System (CPS)
was introduced to track sales training
provided to sales staff
2016/17 2015/16 (%)
Injuries and diseases (number) 30 29 3
Total hours of training 13,553 11,389 19

159
Initiatives
Anti-Corruption
Corruption and unethical behaviour are
covered under the overall risk management
process of the Group, particularly considering
the relevance to the Financial Services
industry group. All employees are expected
to abide by the John Keells Group’s Code
of Conduct and new employees are trained
on the expectations of ethical behaviour at
induction. The Group has a zero tolerance
policy with regards to breaches of its Code
of Conduct while Internal reviews and audits
are also carried out on a continuous basis as
part of the management approach.
Other initiatives include a strategic CSR
programme carried out at UA focusing
on addressing national concerns with the
support of the Ministry of Health. The CSR
brand, titled “Union Manushyathwaya”,
was launched with the aim of creating
healthy and happy communities around the
country through the dissemination of vital
information to the public regarding how to
protect themselves from diseases such as
thalassemia, dengue and diabetes.
Health Awareness
• Awareness programmes for the prevention
of epidemic diseases (e.g. dengue) were
conducted island-wide. An initiative in
collaboration with the Divisional Ministry
of Health (DMOH) and the Public Health
Department (PHD) of the Colombo Municipal
Council was undertaken providing
personnel and awareness material during
house to house visits. UA also organised
two island-wide dengue awareness days
with the involvement of the PHD and DMOH
offices, distributing 162,250 leaflets
• A total of 59 programmes on awareness
and prevention of thalassaemia were
conducted for teachers, parents and
students in partnership with the National
Thalassaemia Center impacting 12,611
persons. The awareness programmes
also addressed issues such as
developing mental concepts of children,
child management skills and life skills
depending on the target audience
• UA developed diabetes pre-screening
programme models with the PHD and the
DMOH offices aimed at identifying persons
who are potential diabetic patients and
channelling them to preventive medical
attention. 13 programmes have been
carried out throughout the year, reaching
1,058 persons
Number of people screened Number of potential diabetes
patients
Number of diabetes patients
1,058 109 173
will focus on developing its agency force
to deliver and retain value in a dynamic
technologically advanced financial services
sphere. UA will leverage on its strong brand
presence, differentiated product portfolio and
offerings, experienced staff and IT enabled
cost effective processes to grow the Life
Insurance business.
The dynamics of the banking industry are
expected to continuously evolve, driven by
disruptive business models and technology
with customers increasingly adopting such
new platforms and channels, both globally and
locally. To this end, NTB will continue to focus
on delivering smart banking solutions and
creating innovative products for its customers.
Big data and analytics will also become focal
points for the Bank going forward, with roll
out of modern and customised products. This
phase of innovation and digital disruption
is also expected to create a platform on
which the Bank can develop better solutions
and product offerings for its consumers,
especially for Corporate and SME clients.
The ambiguity in tax policy and lack of
policy direction remains a challenge to the
banking industry. The policies proposed to
be implemented in the forthcoming financial
year will likely create operating challenges
for the industry at large, despite the industry
being identified as one of the thrust areas of
the economy. A clearly articulated tax policy,
developed in consultation with all stakeholders
will augur well for the success of the industry.
The stock broking arm of the Group will continue
to pursue foreign tie-ups in order to strengthen
its presence in the international markets whilst
simultaneously working towards expanding
its local client base through continued
engagement via customer forums and one-
on-one meetings aimed at local corporates,
fund managers and high net worth individuals
(HNWI). JKSB will also continue to liaise with
the CSE and SEC to improve and upgrade the
current infrastructure to help better manage
risk and enhance trading and settlement
efficiencies. To this end, the implementation of
the CAR ratio by the regulatory authorities is a
positive move which will enhance the industry’s
stability and risk mitigation strategies.
Group Highlights | Governance | Management Discussion & Analysis | Financial Statements | Supplementary Information
Intellectual Capital
The following initiatives were undertaken
during the year under review to strengthen
processes and product offerings.
• Launching of “Union Smart Health” an
innovative health rider which provides
coverage for the policyholder as well as
the policyholder’s dependents
• UA designed “Union 60 Plus,” a policy
aimed at providing comfort and ease
during the sunset years of a policyholder’s
life
• Introduction of "GOYO”, a wellness
proposition which offers benefits beyond
conventional protection for which UA
partnered with several entities to create
an ecosystem in offering benefits with the
aim of harnessing the digital revolution
• Enhancement of an automated
underwriting rules engine to facilitate
speedy acceptance of new proposals
digitally which has resulted in a
considerable reduction of paper usage
• UA commenced a brand revamping
process to include “trust” in re-defining
its brand promise
Strategy and OutlookThe future prospects for the life insurance
industry in Sri Lanka continue to be
promising. Despite the improving per
capita economic indicators and the ageing
population, domestic life insurance
penetration is significantly lower compared
to other regional markets. Life premiums
as a percentage of GDP in Sri Lanka are still
below 1 per cent, whilst the corresponding
figure in India is approximately 6 per cent.
Capitalisation on key customer segments
and channels, such as bancassurance, which
has demonstrated significant potential, will
continue to be a key focus area of the Life
Insurance business through the development
of innovative products and policies. The
requirement for training and development
of its agency force continues to be identified
by the management as an imperative
investment for the long term sustainability
and growth of the business. To this end, UA

160 John Keells Holdings PLC | Annual Report 2016/17
9%Revenue
3%EBIT
1%Capital employed
1%Carbon footprint
Our Business ModelVision and Scope
The Information Technology industry group
has a vision of providing best in class quality
end to end information communication
technology (ICT) services ranging from
business process outsourcing (BPO), software
services and information integration, to office
automation. Having established a strong
customer base in Sri Lanka, South Asia, as
well as the United Kingdom, Middle East, North
America, Scandinavia and the Far East, the IT
industry group is at the forefront of making Sri
Lanka an ICT hub in South Asia.
JKOA is the authorised distributor of many
leading communication and automation
products including the recently launched
“Samsung Galaxy S8 and S8+”.
INFORMATION TECHNOLOGY
Industry Group Review
Contribution to JKH Group
Office Automation
IT Services IT Enabled Services
CO2
0.10 MT perRs.mn revenue

161
Sectors IT Services Office Automation IT Enabled Services
The business within
the sector
• John Keells Computer
Services (JKCS) offer software
products and services to a
wide range of clients in Sri
Lanka and overseas
• Core focus areas are in
software engineering services
and products targeted at the
aviation and leisure industries
• John Keells Office Automation (JKOA) is
the authorised distributor for some of
the leading office automation brands in
the world
• Sole distributor for Toshiba B&W
and colour digital multi-function
printers (MFPs), offering managed
print solutions and print now pay later
(PNPL) digital copier rental solutions.
National distributor for Samsung Smart
phones. Authorised distributor for Asus
commercial series notebook’s, and
other office automation products such
as Samsung Laser printers, hotel TV’s,
large format displays (LFD), RISO digital
duplicators, RISO Comcolour printers,
the world’s fastest full colour inkjet
printer Posiflex and FEC POS systems,
Bixolon receipt and label printers, tabs,
accessories, Lava mobiles and Hitachi
projectors
• BPO operations voice vertical
through JK BPO, which operates
approximately 750 seats in India
• Provider of shared service
solutions in the finance,
accounting, payroll verticals
and data entry services to the
JKH Group and external clients
under InfoMate (operates with
approximately 150 seats)
Key external/
internal variables
impacting the
business
• Increase in wages for skilled
engineers due to the dearth of
skilled resources
• Mandatory requirements
of Advanced Passenger
Processing (APP) features
and Advanced Passenger
Information messages for
departure control systems in
certain international borders
• Depreciation of the Rupee contributed
towards increased procurement costs
and pressure on margins
• The shift of voice processing
services from India to on-shore
and near-shore regions
• Increased demand for back office,
including finance, accounting and
knowledge processes in India
• Automation and the use
of robotics are significant
developments in the industry and
the move towards higher end
knowledge intensive services
Key developments
during the financial
year
• Work commenced on Zhara
Neo which is intended for very
small hotels (5-15 rooms)
• The Software Engineering and
Products verticals secured 4
and 5 new clients, respectively
• JKOA made a conscious effort to focus
on the upper end of the market, which
encompasses higher margin products
• JKOA launched SAP HYBRIS, the new
ERP for technical operations. The
project will introduce a state-of-the-
art customer support module which is
expected to deliver globally renowned
service levels to customers
• InfoMate increased its footprint in
Australia and the Nordic region
• Implementation of
“SupplierMate”; an online
supplier portal
Key Indicators
Inputs (Rs.mn) 2016/17 2015/16 (%) 2014/15
Total assets 4,777 4,116 16 3,750
Total equity 1,983 1,951 2 2,322
Total debt 348 339 3 92
Capital employed1 2,331 2,289 2 2,414
Employees (number)2 1,075 985 9 1,224
1 For equity accounted investees the capital employed is representative of
the Group’s equity investment in these companies
2 As per the sustainability reporting boundary
Outputs (Rs.mn) 2016/17 2015/16 (%) 2014/15
Turnover 11,107 8,262 34 7,212
EBIT 621 161 286 382
PBT 612 148 312 370
PAT 468 96 389 280
EBIT per employee 0.6 0.2 254 0.3
Carbon footprint (MT) 1,076 1,269 (15) 1,309
Group Highlights | Governance | Management Discussion & Analysis | Financial Statements | Supplementary Information

162 John Keells Holdings PLC | Annual Report 2016/17
INFORMATION TECHNOLOGY
Industry Group Review
External Environment and Operational
Review Digital disruption and technological
dynamism have emerged as central themes
within a majority of global industries.
Innovation and technological know-how
has enabled companies to differentiate
products and offerings, creating unforeseen
opportunities within markets. Over the
recent years, Sri Lanka has also witnessed
significant growth in connectivity and much
needed digital infrastructure. A Nielsens
report published in February 2017 reveals
a 92 per cent mobile penetration, 32 per
cent internet penetration, and, given the
growing inclination towards technology and
consumer preferences to improve lifestyle
and convenience, a 28 per cent smart phone
penetration within Sri Lanka.
In light of these developments, during the year
under review, John Keells Office Automation
(JKOA) recorded encouraging volume growth
across all three product categories; mobile
phones, notebooks and photo copiers. The
mobile phone segment recorded double
digit growth in volumes, primarily driven
by continued growth in demand for smart
phones. During the year, Samsung launched
two mobile phone models, “On-5” and “On-7”,
which were exclusively marketed through on-
line channels for the first time in Sri Lanka.
JKOA also launched five new e-STUDIO™
series printers to its multifunction printer
(MFPs) range. The MFPs are designed to help
organisations operate more efficiently and
cost effectively, while improving workflow
through cloud and mobile printing.
John Keells Computer Services (JKCS), the
software engineering and product vertical
of the IT Services sector, strengthened its
product portfolio through new additions while
successfully expanding into new markets
during the financial year 2016/17. The
segment expanded its reach to 4 new clients
through the operation of several Offshore
Dedicated Centers. The Software Engineering
product vertical added 3 new clients and
expanded its services through the Evinta
Departure Control System (DCS) to Moldova,
Maldives and the Middle East. During the
year, JKCS introduced “Zhara Neo”, a single-
screen hotel system targeted at the small
and informal hotels, which encompasses
approximately 40 per cent of the local room
Financial and Manufactured Capital
As at 1 April 2016, the Information Technology
industry group had total assets of Rs.4.12
billion, debt of Rs.339 million and an opening
equity capital of Rs.1.95 billion.
Financial Performance
Revenue of the industry group increased by
34 per cent to Rs.11.11 billion against Rs.8.26
billion recorded in the previous financial
year. The revenue of JKOA increased by 45
per cent in the year under review, mainly
on account of the higher volumes recorded
across all three of its product categories, in
particular the mobile phone segment. JK BPO
India recorded a decline in revenue of 13 per
cent while JKCS recorded a revenue growth
of 12 per cent as a result of higher volumes.
supply. JKCS witnessed growth through
“Zhara HS” and “Zhara E-commerce” which
was deployed to six hotel properties during
the year. In addition to the above, JKCS
instilled higher prominence in expanding
its software solutions across overseas
markets in partnership with Strategic Group
Information Technology (SGIT) of the Group.
The Group’s BPO operations in Sri Lanka,
InfoMate, successfully increased its external
client portfolio through an increase of its
domestic and foreign payroll customers.
During the year, the company rolled out
“SupplierMate”, an online supplier portal
to facilitate supplier payments. Although
the Group’s BPO operations in India did
not secure new customers, the business
continued to service its prominent North
America based client at a level above
expectations as evidenced by the customer
satisfaction scores. During the year, JK BPO
reviewed and right sized its operation in line
with the current operating seats.
A Nielsens report published in
February 2017, reveals a 92 per
cent mobile penetration, 32 per
cent internet penetration, and,
given the growing inclination
towards technology and consumer
preferences to improve lifestyle
and convenience, a 28 per cent
smart phone penetration within
Sri Lanka
32 per cent internet penetration,
given the growing inclination towards
technology and consumer preferences
Capital Management Review Subsequent to the external environment and the operational review of the Information
Technology industry group, the ensuing section elaborates on the forms of Capital deployed to
meet the strategic priorities and the performance of the businesses during the period under
discussion.
Key performance indicators for the industry group, under each of the sectors, are summarised
as follows:
Sectors IT Services Office Automation IT Enabled
Services
Financial and Manufactured
Capital - revenue and
growth
Rs.459 million, 12
per cent increase
Rs.9.52 billion, 45
per cent increase
Rs.1.13 billion, 11
per cent decrease
Financial and Manufactured
Capital - EBIT and growth
Rs.19 million, 279
per cent decrease
Rs.471 million, 185
per cent increase
Rs.132 million,
2028 per cent
increase
Natural Capital - carbon
footprint
159 MT 255 MT 662 MT
Human Capital - number of
employees
222 220 633

163
Energy and Emissions ManagementTargets:
• Minimising electricity use by adhering
to energy targets, efficient practices and
awareness campaigns
Initiatives:
• InfoMate and JKOA continued its initiative
to replace all personal computer
workstations with laptops, resulting in
the reduction of energy consumption
• JKCS continued to record savings
over the recent years through space
rationalisation on particular working
days to conserve electricity. A heat
insulation initiative was also carried out
to improve air conditioning efficiency and
thereby reduce energy consumption
• JK BPO implemented a system to
automatically shut down personal
computers in work stations when not in
use
Waste ManagementTargets:
• Responsible disposal and reduction in
generation of e-waste and paper waste
Initiatives:
• As per the Group’s electronic waste
policy, businesses responsibly dispose of
its electronic waste through the Group’s
contracted e-waste disposal partner
• All businesses consciously seek to
minimise paper usage. Furthermore,
paper waste is recycled through a
certified partner
The EBIT of the industry group recorded a
significant increase of 286 per cent to Rs.621
million during the year. The growth in EBIT
was mainly driven by JKOA and JKCS, on
account of the significant growth in sales
volumes and expansion in to new foreign
markets achieved through software products.
IT Services
Office Automation
IT Enabled Services
0% 20% 40% 60% 80% 100%
Turnover
2014/15
2015/16
2016/17
5
5
4
75
80
86
20
15
10
0% 20% 40% 60% 80% 100%
EBIT
2014/15
2015/16
2016/17
8012
102(6)
763
8
4
21
Borrowings and Finance Expense
The total debt of the industry group as
at 31 March 2017 was Rs.348 million.
The moderate increase in debt resulted
from JKOA’s increased working capital
requirements. The finance expense of the
industry group declined by 23 per cent to
Rs.10 million during the year on account of
the growth in sales volumes for the office
automation business, thereby reducing the
requirement for short term debt financing.
Return on Capital Employed
• The ROCE of the industry group increased
to 26.9 per cent from the 6.8 per cent
recorded in the previous financial year
due to the significant improvement in
performance which translated to high
EBIT growth compared to the growth in
the asset base
• The EBIT margin of the industry group
increased to 5.6 per cent from 1.9 per
cent recorded in the previous year of
operations as a result of the high EBIT
growth witnessed during the year
• The asset turnover of the industry group
increased to 2.50 times from the 2.10
times reported in the previous financial
year, despite a 16 per cent increase in the
asset base to Rs.4.78 billion on account of
higher inventory at JKOA . The increase in
the ratio is stemming from the significant
increase in revenue as discussed above
Natural Capital
Adhering to the John Keells Group’s
environmental policy, the Information
Technology industry group proactively
manages its carbon footprint and energy
usage by monitoring usage and seeking low
energy and energy efficient solutions through
new technologies and innovative thinking.
Companies are aware of the potential impact
from the generation of electronic waste,
and are conscientious in ensuring that such
waste is disposed of in a responsible manner
by working with third parties who reuse and
recycle electronic waste.
The material impacts for the industry group
are classified as follows:
Energy and
emissions
management
Financial implications
and environmental
responsibility
Waste
management
Environmental and
social responsibility,
especially in terms of
disposing e-waste and
paper
Group Highlights | Governance | Management Discussion & Analysis | Financial Statements | Supplementary Information
Performance
The IT industry group recorded a carbon footprint of 1,076 MT this year, a 15 per cent reduction
compared to the previous year.
Sustainability indicators
2016/17 2015/16 (%)
Carbon footprint (MT) 1,076 1,269 (15)
* Water usage is not shown as it is not material for the industry group
ROCE2016/17: 26.9%[2015/16: 6.8%}
EBIT margin5.6%
Asset/Debt + Equity1.92
Asset turnover2.50
Return on Capital Employed

164 John Keells Holdings PLC | Annual Report 2016/17
INFORMATION TECHNOLOGY
Industry Group Review
Human Capital
Given the competitive nature of the Information
Technology industry, sound management
of Human Capital is a vital component of
the industry group’s strategy. Addressing
the training and development needs of
the current staff are priorities to ensure
career development and skill enhancement.
Emphasis is also placed on developing a
fresh pool of talent from universities by
creating relationships with such institutions
via the provision of learning and internship
opportunities to young people who have the
potential to be successfully absorbed into the
staff cadre, creating a sustainable solution to
the challenges in recruitment.
With the nature of the work in the Information
Technology industry group being largely
office based, businesses make it a priority
to ensure such working conditions are of an
acceptable standard for employees. Aspects
such as ergonomic concerns, lighting and
air quality are all considered with respect
to the working environment. Given the 24
hour operations of some of the companies
in the industry group, provisions are made to
ensure the safe commute of employees.
The material impacts for the industry group
are classified as follows:
Talent
management
The need to retain and
continuously upgrade
the skills of existing
staff and ensure a pool
of quality potential staff
given the nature of the
industry
Health and
safety
Providing a safe and
conducive environment
given that long hours
are spent at work
stations
Talent ManagementTargets:
• Continuous improvement of training
focused on improving skills and
knowledge
• Engagement with local universities to
build a pool of potential employees with
requisite soft skills
Initiatives:
• The current staff cadre of the industry
group were provided with 41 hours of
training per employee
• As part of its recruitment strategy,
JKCS continued to engage with local
universities and higher education
institutes, building its brand presence by
providing career guidance and soft skills
training
• A number of graduates from the
aforementioned initiative were provided
with internship opportunities and on-the-
job training by JKCS. These graduates
will be absorbed into the employee cadre
based on capability and performance
Health and SafetyTargets:
• Strive to ensure a safe and healthy
working environment in line with the
Group’s Health and Safety Policy
Initiatives:
• Group companies continuously reviewed
their business continuity plans (BCPs)
• Fire training and fire teams were
appointed for all companies
• Transport was provided to all staff in
JKBPO India, given the 24 hour nature of
operations, to ensure safety of employees
during their commute to and from work
Indicators
The IT industry group provided a total of
43,556 hours of training to its employees, with
41 hours of training provided per employee.
Social and Relationship Capital
The benefits and necessity of an IT literate
populace are widely accepted in a constantly
changing and globalised international
economy. Against this backdrop, the IT
industry group recognises the benefits that
can be reaped from a strategy that strengthens
its Social and Relationship Capital with rural
communities whilst providing a platform for
cost optimisation and a new pool of talent
for recruitment. As the need for IT literacy
becomes increasingly more significant, the
IT industry group strategy looks to create
shared value, grooming youth towards
the industry requirements and providing
them with employment opportunities and
marketable skills.
In line with Group practices, all significant
suppliers have been identified as given in the
diagram below and have been assessed for
any negative impacts on the environment,
labour and human rights aspects.
Impact through CSR initiatives:
InfoMate, in collaboration with John Keells
Foundation (JKF) and the Foundation for
Advancing Rural Opportunity (FARO), created
satellite centers in rural areas for accounting
functions, thereby creating sustainable
employment opportunities for rural youth.
Currently, three BPO centres run by InfoMate
are in operation employing a total of 48
associates. During the year under review,
the total earnings of these BPOs recorded
an increase of 12 per cent while average
associate earnings increased by 13.5 per
cent compared to the previous financial year.
The BPOs were offered support in terms
of training and work volumes, covering of
expenses relating to connectivity, generators
and health insurance. JKF continued to
provide infrastructure support to the BPOs
through the donation of computers and
office equipment while facilitating general
training and sensitisation for the associates.
JKF also extended support in terms of
other key initiatives such as weekly English
language classes to upgrade proficiency and
competency of associates to enable access
Labour indicators
2016/17 2015/16 (%)
Injuries and diseases (number) 0 0 0
Total hours of training 43,556 57,348 (24)
Significant Suppliers
Outsourced support staff seasonally
SecurityTransportation
providers
Outsourced operational functions
Janitors

165
to more lucrative jobs and opportunities
towards uplifting their livelihoods.
Associates also benefitted from a one month
voluntary consulting initiative by 3 European
SAP consultants. The initiative included
the study of the current BPO model and a
final report. The initiative entailed valuable
recommendations and insights from the
associates and consultants.
Other key initiatives carried out in within the
industry group were as follows;
• JKCS conducted training for 300
undergraduates towards enhancing the
quality and employability of graduates
and creating awareness on the
Information Technology industry group of
the John Keells Group
• JKCS also developed a continuous soft
skills development programme with
Mercury Institute on behalf of InfoMate.
The first batch of students underwent a
certificate programme on "Unleashing
Your Potential" which included soft skills
development, career planning, CV writing
and interview facing techniques
• During the year under review, 20 CPUs
were donated by JKCS to schools and
organisations. JKOA donated 5 laptops
to the Wildlife and Protection Society
Sri Lanka and 6 CPUs to Sondura Kotte
Foundation
• JKOA donated water purifiers to a school
in Habarana, enabling access to clean
drinking water, benefiting approximately
158 students and staff of the school
Strategy and Outlook As indicated in the External Environment
and Operational Review, the IT industry
group is cognizant of the technological
developments that are taking place, both
regionally and globally. The Group believes
that the core operations within the sector
have immense market opportunities. In light
of these developments, the industry group is
formulating strategies to create integrated
solutions and expand the services’ portfolio
to include mobility, big data, predictive
analytics, artificial intelligence, Internet of
Things, smart buildings and cloud services,
amongst others.
The demand for smart phones is expected to
maintain its current growth trajectory driven
by increasing disposable incomes, improved
network coverage and data connectivity.
The profitability of the mobile phone
portfolio of the Office Automation business
is likely to improve with the changing
trends in consumer preferences towards
smartphones. JKOA will continue to capitalise
on the more tech-savvy modern customer;
capturing market share through lifestyle
products which offer greater connectivity
and convenience. The business will also
invest in internal service delivery channels
to provide unparalleled service quality to
its customers. Focus will also be placed on
driving the sales for both notebooks and
tabs in order to achieve market leadership
in these product segments. A number of
training initiatives and performance based
reward programmes are also expected to be
introduced in an effort to attract and retain
talent. The concept of “Gamification” is also
expected to be introduced as a platform to
facilitate an environment of “gaming” related
to sales targets and incentives.
The software engineering and product
vertical, JKCS will work towards enhancing
its portfolio through focused attention
on mobility, big data, predictive analytics,
artificial intelligence and internet of things.
JKCS in partnership with the Strategic Group
Information Technology (SGIT) function
will explore opportunities in establishing a
presence in Middle Eastern and North African
markets (MENA) in order to accelerate growth
of the business in international markets.
InfoMate, the Sri Lanka based BPO operation,
will continue its current momentum,
achieving market share through its high
end data entry services. The business will
evaluate the possibility of automation of
several processes as an efficiency measure.
The digitisation initiative rolled out across the
Group in the previous financial year presents
a significant opportunity for the businesses
within this industry group, particularly with
focused attention on IT and digitisation
solutions sought within the Group. In order to
capitalise on this opportunity, the Group will
continue to evaluate cross sale opportunities
in order to create synergies across industry
groups. This will connect the skills, expertise
and infrastructure required to roll out such
initiatives which are already resident within
the various verticals of the Group. Holistic
products and services with end-to-end
solutions, as envisioned, are expected to
augur well for the Information Technology
industry group in the medium to long term.
Group Highlights | Governance | Management Discussion & Analysis | Financial Statements | Supplementary Information
The benefits and necessity of an IT literate populace is widely accepted
in a constantly changing and globalised international economy. Against
this backdrop, the IT industry group recognises the benefits that can
be reaped from a strategy that strengthens its Social and Relationship
Capital with rural communities whilst providing a platform for cost
optimisation and a new pool of talent for recruitment.

166 John Keells Holdings PLC | Annual Report 2016/17
2%Revenue
23%EBIT
33%Capital employed
4%Carbon footprint
Our Business ModelVision and Scope
The Plantation Services sector includes the
operations of tea factories, tea and rubber
broking and pre-auction produce warehousing.
Tea Smallholder Factories PLC (TSF PLC) is
among the top manufacturers of orthodox low
grown teas and is also recognised as a top
quality producer of CTC teas in Sri Lanka. John
Keells PLC is one of the leading tea brokers in
the country and its warehousing facility is the
largest for pre-auction produce in the country.
The “Other” sector consists of John Keells
Holdings PLC including its divisions/Centre
Functions such as John Keells Capital,
John Keells Research and Strategic Group
Information Technology (SGIT), as well as
several auxiliary companies. John Keells Capital
is the private equity arm of the Group. SGIT
supports the Group’s information technology
requirements, consulting services and SAP
implementation services to external clients.
The Plantations cluster continued to upgrade
its infrastructure with investments in new
colour sorter machines. John Keells Research
established a new state-of-the-art laboratory
during the year.
OTHER INCLUDING PLANTATION SERVICES
Industry Group Review
Contribution to JKH Group
Plantation Services
Other CO2
1.02 MT perRs.mn revenue

167
Sectors Plantation Services Other
The business within
the sector
• John Keells PLC - leading tea and rubber broker.
• John Keells Warehousing - operates a state-of-the-art
warehouse for pre-auction produce
• Tea Smallholder Factories PLC - operates 8 tea factories
and is a leading manufacturer of low grown teas in the
country, including the CTC variety
• JKH and Other businesses (Centre Functions/
divisions)
• John Keells Capital, a division of JKH, is the private
equity arm of the Group
• Strategic Group Information Technology (SGIT)
supports the Group’s IT requirements, provides
consultancy services and SAP implementation
services to external companies
Key external/
internal variables
impacting the
business
• Recovery of tea prices due to the slowdown in
production stemming from adverse weather
conditions
• Depreciation of currencies of major tea consuming
nations
• Depreciation of the rupee had a positive impact on the
valuation of net US Dollar holdings of JKH
• Relative inactivity in private equity markets owing to
the availability of credit, particularly in the first half of
the year
• Shortage of SAP resource personnel in the market
limiting SGIT’s expansion capabilities
Key developments
during the financial
year
• JK PLC automated the client advance system which
assists in inventory management and supplier cost
optimisation
• JKR made significant headway during the year under
review through the initiation of several research
projects
• JKR filed for its first patent in December 2016
• JKH launched “John Keells X - Open Innovation
Challenge 2016”, as a part of its digitisation initiative
• SGIT, in partnership with Microsoft and Cisco,
established a full-fledged practice in IT/digital
consultancy services, predictive analytics and digital
services centred around social, mobile, analytics,
cloud and “smart buildings”
Key Indicators
Inputs (Rs.mn) 2016/17 2015/16 (%) 2014/15
Total assets 74,105 66,370 12 57,313
Total equity 71,715 61,835 16 50,910
Total debt 91 2,304 (96) 3,633
Capital employed1 71,805 64,140 12 54,543
Employees (number) 830 882 (6) 941
1 For equity accounted investees the capital employed is representative of
the Group’s equity investment in these companies
2 Revenue is inclusive of the Group’s share of equity accounted investees
Outputs (Rs.mn) 2016/17 2015/16 (%) 2014/15
Turnover2 2,953 2,663 11 3,468
EBIT 5,381 3,907 38 3,415
PBT 5,229 3,772 39 3,233
PAT 3,101 2,343 32 2,025
EBIT per employee 6.5 4.4 46 3.6
Carbon footprint 3,334 3,543 (6) 3,898
Group Highlights | Governance | Management Discussion & Analysis | Financial Statements | Supplementary Information

168 John Keells Holdings PLC | Annual Report 2016/17
OTHER INCLUDING PLANTATION SERVICES
Industry Group Review
External Environment and Operational
Review Global tea production grew by a modest rate
of 5 per cent during the year due to adverse
weather conditions across key tea producing
countries. Sri Lanka, the third largest exporter
of tea in the global tea industry, produced 292
million kilograms of tea in 2016, a decline of
11 per cent from the 329 million kilograms
produced in 2015. A total of 288 million
kilograms of tea were exported during the
2016 calendar year, a 4 per cent decline
against the previous year, while also recording
a total revenue of Rs.184.77 billion, which is
a decline of 4 per cent against the previous
calendar year. The reduction in supply was
mainly attributable to the reduction of green
leaf harvest as a result of the drought which
affected the country in the second half of the
year. On the back of limited supply, average
price at the Colombo Auction increased by 16
per cent to Rs.470 per kilogram and led to the
moderate increase in export revenues. The
existing market demand for Ceylon tea from
traditional export markets and the significant
drop in production were the primary drivers
of the rise in the average price.
The performance of Tea Smallholder
Factories PLC (TSF) improved as a result
of the aforementioned increase in the price
of tea. The supply of green leaf from the
smallholder crops moderated as a result of the
extreme weather conditions which affected
the country. However, TSF streamlined its
cost structures through various efficiency
enhancements and monitoring such as the
upgrading and replacement of processing
equipment to ensure minimum breakdown
time. TSF faced heavy competition for green
leaf as the market faced a scarcity of supply
due to lower production. Focused supplier
relation extensions were actively pursued to
combat these developments. The business
also embarked on a quality drive to improve
the standard of the end product, which
proved fruitful, with the business being able
to command a premium of approximately
1.3 per cent over the low grown elevational
average.
During the year under review, the
performance of John Keells PLC (JK PLC) was
in line with expectations, mainly attributable
to the increase in tea prices as discussed
above, coupled with the improvement in
demand for Sri Lanka’s exclusive range of
orthodox black teas in the first half of the
year. JK PLC launched an advance policy
manual, achieving a significant reduction
in over exposure to its lending portfolio and
awareness sessions on good manufacturing
practices to enhance quality.
The year under review marked a significant
development for John Keells Research (JKR),
the research and development arm of the
Group. JKR filed for its first patent for a novel
energy source material that was developed
through a research project undertaken in
collaboration with the National Metallurgical
Lab of the Council for Scientific and Industrial
Research (CSIR-NML) in India based on an
idea generated by John Keells Research.
The patent application which was filed at the
Indian patent office in December 2016 relates
to a composite nanomaterial which could
be used in energy storage. This composite
nanomaterial can be synthesised with raw
materials found in Sri Lanka. The composite
material has the unique advantage of
biocompatibility and a lower cost per unit of
power stored. JKR is in the process of building
a prototype energy storage device that
utilises the patented technology to enhance
the Technology Readiness Level (TRL) of
the intellectual property and to examine the
commercial viability of a prototype product.
During the year under review, JKR relocated
to the Technology Incubation Centre at the
Nanotechnology and Science Park of the Sri
Lanka Institute of Nano Technology (SLINTEC)
in Pitipana, Homagama, a space which
offers greater opportunities for technical
collaboration, while contributing towards
creating and nurturing an ecosystem of
innovation. The new location gives rise
to better opportunities as JKR will have
access to sophisticated equipment and
analytical services of SLINTEC. In its quest
towards enhancing its research capability
and developing intellectual property, JKR
achieved another milestone by establishing
its own laboratory, enabling it to conduct
certain research projects in-house, thereby
facilitating retention of a higher proportion of
intellectual property for JKH.
John Keells Holdings PLC carried out an
exercise to restructure the shareholding
of the Group’s investments in a few of its
unlisted subsidiaries to reduce the complexity
of the shareholding structure by limiting
the ownership to two tiers, where possible.
Accordingly, select Group companies holding
investments in other subsidiaries transferred
its respective investments to JKH, at
valuations independently verified by the
Group’s Auditors. The exercise was completed
via a combination of share buybacks between
the unquoted entities within the Group and its
subsidiaries for a consideration of either cash
or owners’ shares. The total transaction value
of this exercise was Rs.3.71 billion, in cash
and non-cash terms.
In furthering the digitisation initiative rolled
out within the Group, JKH launched “John
Keells X - Open Innovation Challenge 2016”.
John Keells X (JKX) was created to form a
unique platform for disruptive and innovative
solutions also designed to provide the
initial investments required for start-up
businesses and technologies. The inaugural
JKX challenge was well received where a
total of 148 applications were received with
ten of these applicants being shortlisted for
the final pitch. The mentoring and access
to JKH Group resources prior to the final
pitch presentations were valued by the
participating teams. Considering the success
of the inaugural challenge, the second open
innovation challenge was launched in May
2017.
Strategic Group Information Technology
(SGIT) continued to grow and consolidate
its presence during the year under review,
mainly through the acquisition of two
strategic MNC accounts for SAP while
expanding its services portfolio, leveraging
on its partnership with Microsoft and Cisco
to address the emerging needs in the digital
Sri Lanka, the third largest
exporter of tea in the global tea
industry, produced 292 million
kilograms of tea in 2016, a decline
of 11 per cent from the 329 million
kilograms produced in 2015.
John Keells X - Open Innovation
Challenge was launched in June 2016

169
The EBIT of JKH PLC at company level, includes
a capital gain of Rs.2.58 billion pertaining to
the exercise undertaken to rationalise the
Group’s shareholding structure. The exercise,
as discussed in the External Environment
and Operational Review section, was carried
out to restructure the shareholding of the
Group companies which had multiple layers
of ownership. The exercise was executed
via a hybrid model which consisted of both
share and cash transfers within JKH PLC and
its unquoted subsidiaries. It should also be
noted that the capital gain was eliminated at a
Group consolidated level. The Company also,
included an impairment provision of Rs.900
million at EBIT level against the investment
in the BPO cluster. However it is pertinent
to note that the adjustment is eliminated at
a Group consolidation level. The EBIT of the
industry group included investment property
gains of Rs.101 million emanating from
property held by Keells Realtors Limited, JK
PLC and Facets (Pvt.) Limited. The recurring
EBIT adjusted for the above is 5.28 billion.
Borrowings and Finance Expense
Total debt as at 31 March 2017 was Rs.91
million [2015/16: Rs.2.30 billion]. The USD
10 million loan balance of the IFC loan facility
was repaid during the year. It should also be
noted that the Company does not have any
long term borrowings subsequent to the
repayment of the IFC facility. The finance
expense of the industry group increased
by 1 per cent during the year on account of
the higher working capital expenses of the
Plantations sector.
Key indicators under selected forms of Capital are as follows:
Sectors Plantation Services Others
Financial and Manufactured Capital - revenue
and growth
Rs.2.80 billion, 16
per cent increase
Rs.154 million, 38
per cent decrease
Financial and Manufactured Capital - EBIT and
growth
Rs.388 million, 642
per cent increase
Rs.4.99 billion, 30
per cent increase
Natural Capital - carbon footprint 2,777 MT 557 MT
Human Capital - number of employees 655 175
space of organisations. SGIT’s fully-fledged
practice in IT/digital consultancy services
covers a broad spectrum of competencies
such as mobility, big data, predictive analytics,
artificial intelligence, smart buildings and
cloud services. SGIT actively promoted its
products and services in keeping with its
expansion plans, participating in conferences,
both locally and regionally.
Financial and Manufactured Capital
As at 1 April 2016, the Other including
Plantations Services industry group had total
assets of Rs.66.37 billion, debt of Rs.2.30
billion and an opening equity capital of
Rs.61.84 billion.
Financial Performance
Total revenue of the industry group primarily
consisted of the revenue generated from the
Plantations Services sector since there were
no other significant operating businesses in
this cluster. The Other including Plantations
Services sector recorded revenues of Rs.2.95
billion, an increase of 11 per cent against last
year [2015/16:Rs.2.66 billion]. The increase
in revenue was primarily driven by TSF PLC,
which grew 21 per cent to Rs.2.31 billion due
to the increase in average prices of tea during
the year as discussed under the External
Environment and Operational Review section.
The total EBIT inclusive of the Holding
Company increased by 38 per cent to Rs.5.38
billion [2015/16: Rs.3.91 billion]. The growth
is mainly attributable to the interest income
generated on the Group’s Rupee and US
Dollar portfolios and exchange gains recorded
at the Company on its foreign currency
denominated cash holdings. Interest income
increased due to higher interest rates and an
increase in the average capital base which
included the 2016 Warrant conversion in
November 2016 amounting to Rs.3.18 billion.
Capital Management Review Subsequent to an operational review of the
sectors, the ensuing section summarises the
forms of Capital available for the execution of
the near, medium and long term strategies
of the business in creating value and also
deliberates on the Capital-wise performance
of the sectors.
Plantation Services
Other
0% 20% 40% 60% 80% 100%
Turnover
2014/15
2015/16
2016/17
91
91
95
9
9
5
0% 20% 40% 60% 80% 100%
EBIT
2014/15
2015/16
2016/17
10
1
7
90
99
93
Rs.5.23Bn
Other including Plantation Services industry group PBTA 39 per cent growth
Group Highlights | Governance | Management Discussion & Analysis | Financial Statements | Supplementary Information
ROCE2016/17: 7.9%[2015/16: 6.6%]
EBIT margin182.3%
Asset/Debt + Equity1.03
Asset turnover0.04
Return on Capital Employed

170 John Keells Holdings PLC | Annual Report 2016/17
OTHER INCLUDING PLANTATION SERVICES
Industry Group Review
Natural Capital
Given the importance of the effective
management of Natural Capital and the
vital inputs from natural resources for Sri
Lanka’s plantations sector, sustainability
has become increasingly entrenched within
the industry in recent years. Thus, focus
has been placed on sustainable practices
throughout the supply chain from cultivation
to distribution. Ongoing collaboration and
partnerships with international conservation
bodies help to disseminate international best
practices and standards, while recognising
that international buyers are increasingly
concerned with seeking eco-friendly and
sustainable products.
The industry group seeks to reduce its
usage of energy within the Centre Functions
of the Group, through process efficiencies
and monitoring, in meeting the Group’s
Environmental and Energy Management
Policy.
The material impacts for the industry group
are classified as follows:
Energy and
emissions
management
Financial and
regulatory implications,
environmental and
social responsibility
Waste and
effluent
management
Regulatory implications
and environmental
responsibility
Energy and Emissions Management:Targets:
• Continuously assess existing facilities,
machinery and processes for energy
efficiency and carry out improvements
as required
• Continue to seek process improvements
through innovation and strive to reduce
emissions whilst maintaining productivity
Initiatives:
• Utilisation of renewable energy sources
amounting to 65 per cent of the total
energy requirement through usage of
biomass, contributing to a reduction in
carbon footprint
• Increased combustion efficiency of
biomass on account of construction of
fast drying UV covered firewood sheds
and use of dry, split firewood, with
damper control, for excess air and flue
gas during the drier operations resulting
in energy savings
• Usage of energy efficient compressed
air by replacing reciprocating air
compressors with the installation
of screw compressors, resulting in
estimated annual savings of 21,000 kWh
• Continued usage of natural lighting
through the introduction of transparent
roofing sheets resulting in an annual
energy saving as well as increased
efficiency of lighting systems by replacing
fluorescent tube lights with LED lights
Impact through CSR initiatives
TSF PLC, in collaboration with John Keells
Foundation (JKF) and Carbon Consulting
Company (Private) Limited, organised a tree
planting initiative to increase the coverage
of vegetation in Neluwa in the Galle district.
JKF coordinated the participation of 17 staff
volunteers from the John Keells Group. Forest
saplings and fruit saplings were planted for
the long term benefit of the environment as
well as the surrounding community.
Human Capital
Investment in Human Capital is carried out
through training and development activities
conducted on a needs-basis, whilst ensuring
that workplace health and safety remains a
priority.
Health and
safety
The respective
businesses need to
ensure safe working
conditions, mainly
focusing on occupational
health and safety
Waste ManagementTargets:
• Continuously ensure all waste water from
factory cleaning and waste generated
from biomass generators are disposed
responsibly in line with requirements of
the Environmental Protection License
(EPL)
Initiatives:
• Responsible disposal of wood ash and
e-waste through certified third-party
Training and
Development
Ensuring functionally
skilled and motivated
staff at the Centre
Functions is considered
important in facilitating
Group-wide synergies
Training and DevelopmentTargets:
• Ensure group-wide synergies are created
through continuous enhancement of
knowledge and skills
Initiatives:
• Provided 5,742 hours of training to
employees in the industry group, with 6.9
hours of training per employee, resulting
in increased productivity
Performance
The carbon footprint for the Other including Plantation Services industry group improved to
3,334 MT for the year under review from the 3,543 MT recorded in the previous year, while waste
generated reduced to 191,986 kg from 210,923 kg.
2016/17 2015/16 (%)
Carbon footprint (MT) 3,334 3,543 (6)
Waste generated (kg) 191,986 210,923 (9)
Carbon footprint scope 1 and 2 per operational intensity factor
2016/17 2015/16
TSF PLC CO2 (kg per kg of tea produced) 0.6 0.6
JK PLC and JKW CO2 (kg per square foot of floor area) 0.8 1.2

171
Health and SafetyTargets:
• Minimising health and safety incidents
and provide a safe and healthy working
environment for staff
Initiatives:
• OHSAS ISO 18001 Certification obtained
for 7 out of the 8 smallholder factories
• Training and awareness on worker
health and safety was conducted in line
with OHSAS 18001 standard resulting in
reduced number of injuries and lost days
Social and Relationship Capital
Social and Relationship Capital is of
significant importance to the Plantations
Services sector, particularly TSF PLC, given
that the surrounding community is an
integral part of the company’s supply chain.
Building trust through ongoing initiatives,
such as replanting on unproductive tea lands,
community projects which assist in livelihood
development and the dissemination of
knowledge and best practices through
extension services assist the sector in
solidifying these mutually beneficial
relationships and producing socially desirable
outcomes. Such activities are carried out
both at a company level and through John
Keells Foundation, particularly with regards
The material impacts for the industry group
are classified as follows:
Supplier
development
and social
responsibility
Sharing of knowledge
and best practices
on cultivation with
tea smallholders to
ensure higher yields
and quality green leaf
which benefits both the
tea factories and the
smallholder community
Supplier Development and Social
Responsibility:Targets:
• Seek to assist with livelihood development
of smallholders through improving yields
and providing alternative sources of
income while simultaneously improving
agricultural practices and environmental
conservation
• Ensuring business sustainability through
building and maintaining relationships
with smallholder communities to ensure
a steady supply of green leaf
Initiatives:
• TSF PLC, in collaboration with JKF and
Carbon Consulting Company (CCC),
continued its tree planting projects in
multiple locations in the Galle District;
Hingalgoda, Neluwa, Kurupanawa and
Halvitigala. The project is aimed at
establishing plant cover on underutilised
farming lands. During the year in review,
3 plant monitoring visits were completed
assessing the 3,000 plants that had been
previously distributed among 31 pieces
of farmland, covering over 15 acres. The
project which promotes environmental
sustainability has also improved
relations among community members
and enhanced farmers' livelihoods via
the sale of non-timber forest products
while empowering and enabling women
in the region to become active members
of society
• TSF PLC continued its tea replanting
project to replant unproductive tea lands,
with 5 projects conducted to date, out
of which 2 have been completed. A new
project was undertaken in 2016/17 where
approximately 120,000 plants were
planted in a land extent of over 23 acres.
The total extent of tea lands replanted,
since its inception in 2010 to date, is
170 acres, where 245 smallholders have
Energy saving screw compressor installed at Neluwa Medagama tea factory
• Training and awareness programmes
on food safety conducted in line with ISO
22000 standard under which 5 factories
have been re-certified contributing to
higher standards of product quality
Performance
The industry group provided 5,742 hours of
training to employees in the industry group,
compared to 12,744 hours in the previous
year. Injuries amounted to 3 incidents, all in
the Plantation Services sector.
to ongoing training and awareness sessions
on HIV and AIDS and WAVE programmes.
All significant suppliers are identified and
assessed for any negative impacts on
environmental, labour and human rights
aspects and companies within the sector
work closely with their supply chain
to improve the sustainability practices
throughout the value chain.
Significant Suppliers
Tea plantationsTea smallholder
farmers
Labour indicators
2016/17 2015/16 (%)
Injuries and diseases (number) 3 8 (63)
Total hours of training 5,742 12,744 (55)
Group Highlights | Governance | Management Discussion & Analysis | Financial Statements | Supplementary Information

172 John Keells Holdings PLC | Annual Report 2016/17
OTHER INCLUDING PLANTATION SERVICES
Industry Group Review
participated. The project aims to improve
supplier livelihood whilst simultaneously
retaining the company’s supplier bases
and developing its brand image
• Introduction of organic compost fertilizer
for smallholder tea lands to supplement
the inorganic fertilizer to ensure
sustainable agricultural practices
• Extension services to disseminate
knowledge on good agricultural practices
(GAP) were provided to suppliers through
seminars/workshops and field advisory
visits enhancing their technical skills in
terms of best practices
• The sector continues to carry out eye
camps, health clinics, and awareness
programmes on gender-based violence
and serious diseases such as AIDS to its
smallholders and residents in the vicinity
of their operations, improving their
quality of life
Intellectual Capital
John Keells Research (JKR), the research and
development arm of the Group continuously
strives to create sustainable value through
research and development, and innovation,
to develop the Intellectual Capital of the
respective industry groups and sectors. During
the year, JKR continued to show progress by
reaching significant milestones in its evolution
with some key developments, along with an
initiative of SGIT, as discussed below.
• JKR successfully filed its first patent for a
novel energy storage material
• JKR increased the number of PhDs in its
cadre through Post-Doctoral research
positions and will continue to invest on
Human Capital to enhance scientific
innovation capabilities
• JKR signed an agreement with the
University of Moratuwa to begin new
collaborative projects in digital health
• JKR is in the process of starting a
collaborative research project with a
second university in the USA to develop
novel technologies for the conversion of
waste to energy
• JKR’s collaborative research project with
the Human Genetics Unit, University of
Colombo, is in its final phase
• The research project undertaken in
collaboration with the Sri Lanka Institute
of Nanotechnology to develop novel
composite materials has concluded
and the parties are in the process of
submitting an article titled “Oxidation
protection of carbon fiber by sol-gel
derived Boron doped Yittria-stabilised
Zirconia coatings” for publication
• SGIT was bestowed with the SAP -
Partner of the Year - India Sub Continent/
New Markets and an ACE award for the
first ever SP S4HANA implementation in
the subcontinent
Strategy and OutlookThe global demand for tea is expected to
continue its current growth momentum in
the near term with a relatively stable outlook
for oil and other commodities. China, India
and Kenya are expected to gain share in
the export market following the shortfall in
supply witnessed from Sri Lanka in the past
year.
The Sri Lankan tea industry is expected to
improve in the medium term with buoyant tea
prices and relative stability in the commodity
markets. However, supply is expected to be
impacted to an extent by the withdrawal of
fertilizer subsidies from regional plantation
companies (RPCs) and the ban on weedicide.
Additionally, the political and economic
uncertainties in key export markets such
as the Russian and the Middle Eastern
markets continue to remain a challenge.
The impending promotional activities by the
Sri Lanka Tea Board to reposition Ceylon
Tea, while retaining market share within
traditional export markets, will augur well for
the industry. The Group also expects a shift in
focus towards China, as a key growth market
in black orthodox tea with the potential to
double export volumes and earnings.
TSF PLC will continue to work alongside
smallholders and RPCs while building brand
loyalty and guarantee of continuous supply
to the company. The company will focus
on the production of high quality green leaf
and place significance on processing high
quality tea which has the ability to command
premium prices at the auctions. In keeping
with the digitisation initiatives rolled out
within the Group, JK PLC is in the process
of developing a system to capture factory
dispatches online to improve efficiencies and
avoid duplication of work at the warehouses.
JKR will continue to focus on its core areas
of research and identified projects. As
previously discussed, the research arm of the
Group will continue to test the commercial
viability and marketability of the energy
storage prototype developed. Alongside
these developments, JKR will also extend
the ongoing collaboration with a leading
university in the USA to develop reinforcing
material using Sri Lankan agricultural waste.
In an effort to address the increasing
emphasis on plastic waste management
within the country, the John Keells Group,
will spearhead a project to drive change by
encouraging reduction and rationalisation
of use of single use plastics, supporting
responsible disposal and promoting recycling
initiatives. The first phase of the project, led
by the Consumer Foods and Retail industry
group, will be piloted within a identified
locality in the city of Colombo in the first half
of the ensuing financial year.
SGIT will continue to expand its regional
presence through partnerships in Asia and
the Middle Eastern and North African (MENA)
markets. Towards this end, SGIT is in the
process of establishing direct presence in
MENA markets together with John Keells
Computer Services under the brand “John
Keells IT”.
John Keells Research (JKR),
the research and development
arm of the Group continuously
strives to create sustainable
value through research and
development, and innovation, to
develop the Intellectual Capital of
the respective industry groups and
sectors.
JKR successfully filed its first patent
for a novel energy storage material

The Financial Statements provide the reader
with a detailed analysis of performance,
results and financial strength.
175 Annual Report of the Board of Directors • 180 The Statement of Directors’ Responsibility • 181 Independent Auditors’ Report
• 182 Income Statement • 183 Statement of Comprehensive Income • 184 Statement of Financial Position
• 185 Statement of Cash Flows • 186 Statement of Changes in Equity • 191 Notes to the Financial Statements
F I N A N C I A L S T A T E M E N T S
Building Value


Group Highlights | Governance | Management Discussion & Analysis | Financial Statements | Supplementary Information 175
Annual Report of the Board of Directors
The Directors have pleasure in presenting the
38th Annual Report of your Company which
covers the audited Financial Statements,
Chairman’s message, Corporate Governance
Commentary, Capital Management Review,
Industry Group Review and all the other
relevant information for the year ended 31
March 2017. Disclosures which appear in
Share and Warrant Information section form
a part of the Annual Report of the Board
of Directors as it is a requirement of the
Companies Act No. 07 of 2007.
Principal Activities
John Keells Holdings PLC (the Company),
the Group’s holding Company, manages a
portfolio of holdings consisting of a range of
diverse business operations, which together
constitute the John Keells Group (the Group),
and provides function based services to its
subsidiaries and equity accounted investees.
The companies within the Group and its
business activities are described in the
Group Directory under the Supplementary
Information section of the Annual Report.
There were no significant changes to the
principal activities of the Company or its
subsidiaries during the year.
Corporate Vision and Values
A culture of innovation, integrity, excellence,
caring and trust has been developed within
the Group and by being aligned with them,
the Directors and employees conduct their
activities to achieve the vision,” Building
businesses that are leaders in the region”.
Review of Business Segments
A review of the financial and operational
performance and future business
developments of the Group, sectors, and
its business units are described in the
Management Discussion and Analysis
section of the Annual Report. Significant
changes to business combinations and
acquisition of non-controlling interests
are provided in note 9 to the financial
statements. These reports, together with
the audited financial statements, reflect
the state of affairs of the Company and
the Group. Segment wise contribution to
Group revenue, results, assets and liabilities
are provided in note 7 to the financial
statements.
Financial Statements
Financial Statements of the Group and
Company for the year ended 31 March 2017,
have been prepared in accordance with
Sri Lanka Accounting Standards (SLFRS/
LKAS) with the inclusion of signatures of the
Chairman, Group Finance Director and Group
Financial Controller, are given from page 182
to 258 which form a part of the Integrated
Annual Report.
Financial Results and Appropriations
Revenue
Revenue generated by the Company
amounted to LKR. 1,126 million (2016 –
LKR 1,108 million), whilst Group revenue
amounted to LKR 106,273 million (2016
– LKR 93,710 million). Contribution to
Group revenue, from the different business
segments is provided in note 7 to the financial
statements.
Profit and Appropriations
The profit after tax of the Company was LKR
16,152 million (2016 – LKR 17,070 million)
whilst the Group profit attributable to equity
holders of the parent for the year was LKR
16,275 million (2016 - LKR 14,070 million).
The Company’s total comprehensive income
net of tax was LKR 16,123 million (2016
-LKR 17,029 million), and the Group total
comprehensive income attributable to parent
was LKR 25,694 million (2016 -LKR 17,848
million).
Dividend and Reserves
As required by Section 56(2) of the
Companies Act No 7 of 2007, the Board of
Directors has confirmed that the Company
satisfies the solvency test in accordance
with Section 57 of the Companies Act No 7
of 2007, and has obtained a certificate from
the auditors, prior to declaring all dividends.
A final dividend will be paid on 16 June 2017
to those shareholders on the register as of 6
June 2017.
Information on dividends and reserves of the Company are given below.
John Keells Holdings PLC
For the year ended 31 March
In LKR ‘000s
2017 2016
Profit after tax 16,152,442 17,070,114
Other adjustments (5,309) (283,784)
Balance brought forward from the previous year 39,337,754 30,877,090
Amount available for appropriation 55,484,887 47,663,420
1st interim dividend of LKR 2.00 per share (2016-LKR 4.50)
paid out of dividend received. (2,721,458) (5,352,156)
2nd interim dividend of LKR 2.00 per share (2016-LKR 1.00)
paid out of dividend received. (2,774,933) (1,189,404)
Final dividend Declared of LKR 2.00 per share (2016-LKR
1.50) to be paid out of the dividend received.* (2,774,933) (1,784,106)
Balance to be carried forward to the next year 47,213,563 39,337,754
*In accordance with LKAS 10, Events After the Reporting Period, the final dividend has not
been recognised as a liability in the financial statements.
Accounting Policies
All the significant accounting policies adopted
by the Company and the Group are mentioned
in note 4 to the financial statements. There
have been no changes in the accounting
policies adopted by the Group during the
year under review. For all periods up to and
including the year ended 31 March 2017,
the Group prepared its financial statements
in accordance with Sri Lanka Accounting
Standards (SLFRS/LKAS) which have
materially converged with the International
Financial Reporting Standards (IFRS) as
issued by the International Accounting
Standards Board (IASB).

176 John Keells Holdings PLC | Annual Report 2016/17
Annual Report of the Board of Directors
Donations
Total donations made by the Company and
the Group during the year amounted to LKR
14 million (2016 - LKR 24 million) and LKR 34
million (2016 - LKR 24 million), respectively.
These amounts do not include contributions
on account of corporate social responsibility
(CSR) initiatives.
Related Party Transactions
The Company’s transactions with Related
Parties, given in note 43 to the financial
statements, have complied with Colombo
Stock Exchange Listing Rule 9.3.2 and Code of
Best Practices on Related Party Transactions
under the Securities Exchange Commission
Directive issued under Section 13(c) of the
Securities Exchange Commission Act.
Corporate Social Responsibility
The John Keells Foundation, which is funded
by the Company and its subsidiaries, handles
most of the Group’s CSR initiatives and
activities. The Foundation manages a range of
programmes that underpin its key principle of
acting responsibly towards its stakeholders.
The CSR initiatives, including completed and
on-going projects, are detailed in the Capital
Management Review section in the Annual
Report.
In quantifying the Group’s contribution to
charities, no account has been taken of in-
house costs or management time.
Capital Expenditure
The Company’s and Group’s capital
expenditure on property, plant and equipment
amounted to LKR 11 million (2016 - LKR 30
million) and LKR 4,332 million (2016 -LKR
4,582 million) respectively and all other
related information and movements have
been disclosed in the note 21 to the financial
statements.
Additions to intangible assets of the Company
and Group during the year amounted to LKR
7 million (2016 LKR 4 million) and LKR 114
million (2016 LKR 163 million) respectively
and all other related movements are
disclosed in the note 24 to the financial
statements.
Valuation of Property, Plant & Equipment
and Investment Property
All land and buildings owned by Group
companies were revalued during the year. All
information relating to revaluation is given in
note 21.3 to the financial statements.
Investment properties of business units,
when significantly occupied by Group
companies, are classified as property, plant
and equipment in the consolidated financial
statements in compliance with LKAS 40.
All investment properties of the Group
were revalued as at 31 March 2017, and
the carrying value amounted to LKR
5,366 million (2016 -LKR 4,878 million). All
information related to revaluation of the
investment properties are provided in note
23 to the financial statements.
Details of Group properties as at 31 March
2017 are disclosed in real estate portfolio
under the supplementary information section
of the Annual Report.
Investments
Detailed description of the long term
investments held as at the reporting date, is
given in note 25, 26 and 27 to the financial
statements.
Stated Capital
Information on the stated capital of John Keells Holdings PLC is given below;
2017 2016
For the year ended 31 March Number of
shares
In ’000
Value of
shares
LKR’000
Number of
shares
In ’000
Value of
shares
LKR’000
Fully paid ordinary shares
At the beginning of the year 1,189,404 58,701,977 997,486 50,702,701
Share options exercised 6,869 911,261 165 26,516
Subdivision of shares 169,915 - 142,498 -
Exercise of share warrants 21,280 3,176,842 49,255 7,972,760
At the end of the year 1,387,468 62,790,080 1,189,404 58,701,977
Share Information
The distribution and composition of
shareholders and the information relating to
earnings, dividends, net assets, market value
per share and share trading are given in
the Share Information section of the Annual
Report. As an additional disclosure, the the
Company’s Board of Directors’ (including their
close family members) shareholdings and
options available under the employee share
option (ESOP) plans as at 31 March 2017,
are given in Share and Warrant Information
section of the Annual Report.
Major Shareholders
Details of the twenty largest shareholders of
the Company and the percentages held by
each of them are disclosed in the Share and
Warrant Information section of the Annual
Report.
Equitable Treatment of Shareholders
The Company has at all times ensured that all
shareholders are treated equitably.
Revenue Reserves
Revenue reserves as at 31 March 2017 for
the Company and Group amounted to LKR
49,998 million (2016 - LKR 41,122 million)
and LKR 77,193 million (2016 - LKR 67,565
million), respectively. The movement and
composition of the reserves are disclosed in
the Statement of Changes in Equity.
The Board of Directors
The Board of Directors of the Company as at
31 March 2017 and their brief profiles are
given in the Board of Directors section of the
Annual Report.
Retirement And Re-Election of Directors
In accordance with Article 84 of the Articles
of Association of the Company, D A Cabraal
and A N Fonseka retire by rotation and being
eligible, offer themselves for re-election.
S H H Wijayasuriya was appointed
to the Board as an independent, Non
Executive Director on 4 October 2016, and

Group Highlights | Governance | Management Discussion & Analysis | Financial Statements | Supplementary Information 177
K N J Balendra and J G A Cooray were
appointed to the Board as Executive Directors
on 5 November 2016. In accordance with
Article 91 of the Articles of Association
of the Company, S H H Wijayasuriya, K N J
Balendra and J G A Cooray are eligible for re-
election. Brief profiles of S H H Wijayasuriya,
K N J Balendra and J G A Cooray are given in
the Board of Directors section of the Annual
Report.
Review of Performance of the Board
The performance of the Board is evaluated
through a formalised process, where each
individual Director anonymously comments
on the dynamics of the Board. The process is
described in page 30.
Board Committees
Information relating to members of the
Audit Committee, Human Resources &
Compensation Committee, Nominations
Committee and the Related Party Transactions
Review Committee including reports of
each of the committees and attendance of
Directors for each of the committee meetings
are disclosed under Corporate Governance
section of the Annual Report.
Interests Register and Interests in
Contracts
The Company has maintained an Interests
Register as contemplated by the Companies
Act No 7 of 2007.
This Annual Report also contains particulars
of entries made in the Interests Registers of
subsidiaries which are public companies and
private companies which have not dispensed
with the requirement to maintain an Interests
Register as permitted by Section 30 of the
Companies Act No 7 of 2007.
All the Directors have made a general
disclosure relating to share dealings and
indemnities and remuneration to the Board
of Directors as required by Section 192 (2)
of the Companies Act No 7 of 2007 and no
additional interests have been disclosed
by any Director. The Interest Register is
available at the registered head office of the
Company, in keeping with the requirements
of the section 119(1) (d) of the Companies Act
No 7 of 2007.
Share Dealings
Particulars of the Company Interest Register
are disclosed in the Share and Warrant
Information section of the Annual Report.
Given below are, the particulars of
subsidiaries’ interest register;
Trans Asia Hotels PLC;
• N L Gooneratne - Sale of 110 shares
Ceylon Cold Stores PLC;
• M Hamza - Purchase of 500 shares
Tea Smallholder Factories PLC;
• R E Rambukwella - Sale of 4,600 shares
Indemnities and Remuneration
The Board approved the payment of
remuneration of the following Executive
Directors for the period of 1 April 2016 to 31
March 2017 comprising of;
An increment from 1 July 2016 based on the
individual performance rating obtained by the
Executive Directors in line with performance
management system of the John Keells
Group;
A short term variable incentive based on
the individual performance, organization
performance and role responsibility based on
the results of the financial year 2015/2016,
and Long Term Incentive Plan in the form of
an Employee Share Options in John Keells
Holdings PLC.
John Keells Holdings PLC;
• S C Ratnayake
• A D Gunewardene
• J R F Peiris
• K N J Balendra (appointed w.e.f 5 November
2016)
• J G A Cooray (appointed w.e.f 5 November
2016)
Asian Hotels and Properties PLC;
• R J Karunarajah
• S Rajendra
Ceylon Cold Stores PLC;
• J R Gunaratne
John Keells PLC;
• R S Fernando (resigned w.e.f 9 September
2016)
Union Assurance PLC;
• A D Pereira
Cinnamon Hotel Management Ltd;
• B J S M Senanayake
Walkers Tours Ltd;
• V Leelananda
All indemnities and remuneration have been
approved by the Boards of the respective
companies as recommended by the Human
Resources and Compensation Committee.
These indeminities and remuneration
are structured after considering market
comparators, experts views and specific
management complexities associated with
the John Keells Group.
The contracts and the Directors’ fees of the
following Non-Executive Directors have been
approved/renewed by the Board. The fees are
commensurate with the market complexities
associated with the John Keells Group.
John Keells Holdings PLC;
• S S H Wijayasuriya (appointed w.e.f 4
October 2016)
Asian Hotels and Properties PLC;
• K N J Balendra (appointed w.e.f 1 April
2016)
Ceylon Cold Stores PLC;
• S Ratwatte (appointed w.e.f 17 June 2016)
• R S Wilson Wijeratnam (appointed w.e.f 17
June 2016)
John Keells PLC
• R B A I Rajakarier (appointed w.e.f 29 June
2016)
• A K Gunawardhana (appointed w.e.f 29
June 2016)
• C N Wijewardene (appointed w.e.f 29 June
2016)
John Keells Hotels PLC
• N B Weerasekara
• T L F W Jayasekera
• K N J Balendra (appointed w.e.f 1 April 2016)
• A K Moonesinghe (appointed w.e.f 1 July
2016)
Keells Food Products PLC;
• S De Silva (appointed w.e.f 10 June 2016)
• A E H Sanderatne (appointed w.e.f 10 June
2016)
• I Samarajiva (appointed w.e.f 10 June
2016)
• P D Samarasinghe (appointed w.e.f 10
June 2016)
Tea Smallholders Factories PLC
• M H De Silva (appointed w.e.f 6 February
2017)
Trans Asia Hotels PLC;
• J C Ponniah
• K N J Balendra (appointed w.e.f 1 April 2016)

178 John Keells Holdings PLC | Annual Report 2016/17
Fees payable to Non-executive Nominee
Directors of John Keells Holdings PLC was
paid to John Keells Holdings PLC and not to
individual Directors.
Directors’ Remuneration
Details of the remuneration and other
benefits received by the Directors are set out
in note 43.7 of the financial statements.
Employee Share Option Plan (ESOP)
At the beginning of the year, the employee
share option plan consisted of the seventh,
eighth and ninth plans approved by the
shareholders on, 7 December 2011, 28 June
2014 and 24 June 2016 respectively.
The Directors confirm that the Company has
not granted any funding to employees to
exercise options.
Details of the options granted, options
exercised, the grant price and the options
cancelled or lapsed and outstanding as at
the date of the Directors’ report as required
by the Listing Rules of The Colombo Stock
Exchange are given in the Shares and
Warrants Information section of the Annual
Report.
The highest, lowest and the closing prices of
the Company shares during the year were
LKR 165.00, LKR 133.90 and LKR 137.90
respectively.
Corporate Governance
The Board of Directors is committed
towards maintaining an effective Corporate
Governance Framework and implementing
systems and structures required to ensure
best practices in Corporate Governance and
their effective implementation. The table on
page 46 and 47 shows the manner in which
the Company has complied with the Section
7.10 of the Rules of the Colombo Stock
Exchange (CSE) on Corporate Governance.
The Risk Management report is given
from page 101 to 105 and the Corporate
Governance Commentary is given from page
26 to 56.
Sustainability
The Group pursues its business goals based on
a model of stakeholder governance. Findings
of the continuous internal stakeholder
engagements have enabled the Group to focus
on material issues such as the conservation
of natural resources and the environment
as well as material issues impacting other
stakeholders such as employees, customers,
suppliers and the community. These
measures are encapsulated in a Group-wide
sustainable development strategy which is
continuously evolving. This year, the Group
published it’s second integrated Annual
Report, which presents a comprehensive
capital’s discussion on its financial and non-
financial performance, in a bid to provide
its stakeholders with holistic information
relating to its value creation proposition.
The Group has sought independent third-
party assurance from DNV GL represented
in Sri Lanka by DNV Business Assurance
Lanka (Private) Limited in relation to the non-
financial information contained in this Report.
The Report has also successfully completed
the GRI Materiality Disclosures Service.
Employment
The Group has an equal opportunity policy
and these principles are enshrined in
specific selection, training, development and
promotion policies, ensuring that all decisions
are based on merit. The Group practices
equality of opportunity for all employees
irrespective of ethnicity, religion, political
opinion, gender, marital status or different
physical attributes. Employee ownership
in the Company is facilitated through the
employee share option plan.
Details of the Group’s human resource
initiatives are detailed in the Human Capital
section under Capital Management Review of
the Annual Report.
The number of persons employed by the
Company and Group as at 31 March 2017
was 162 (2016 - 156) and 13,211 (2016 –
12,035), respectively.
There have been no material issues pertaining
to employees and industrial relations of the
Company and the Group.
Supplier Policy
The Group adopts a clear policy of terms
and condition including payment as part
of the commercial agreements negotiated
with suppliers, and endeavours to pay for all
items properly charged in accordance with
these agreed terms. As at 31 March 2017 the
trade and other payables of the Company and
Group amounted to LKR 330 million (2016
- LKR 333 million) and LKR 14,136 million
(2016 - LKR 12,755 million), respectively.
The Group strives to integrate principles
of sustainable practices and policies in its
value chain through extensive stakeholder
consultations, the findings of which are
integrated into work-plans. During the year,
a supplier management framework and a
supplier code of conduct were implemented.
Supplier engagement including various fora
and assessments of sites, suppliers were
closely engaged with, particularly where the
supply is of great importance to the Group.
Environmental Protection
The Group complies with the relevant
environmental laws, regulations and
endeavours to comply with best practices
applicable in the country of operation. A
summary of selected Group activities in the
above area is contained in the Sustainability
Report.
Research and Development
The Group has an active approach to research
and development and recognizes the
contribution that it can make to intellectual
property and the Group’s operations.
Significant investment has been made over
the years and substantial efforts will continue
to be made to introduce intellectual property
rights, new products and processes, enhance
the existing products and service offering
including improve operational efficiency.
Statutory Payments
The Directors confirm that to the best of
their knowledge, all taxes, duties and levies
payable by the Company and its subsidiaries,
all contributions, levies and taxes payable on
behalf of, and in respect of the employees
of the Company and its subsidiaries, and all
other known statutory dues as were due and
payable by the Company and its subsidiaries
as at the statement of financial position date
have been paid or, where relevant provided
for, except as specified in note 44 to the
financial statements, covering contingent
liabilities.
Enterprise Risk Management
The Board confirms that there is an ongoing
process of identifying, evaluating and
managing any significant risks faced by the
Group, where annual risk reviews are carried
out by the Sustainability, Enterprise Risk
Management and Group Initiatives Division
and the risks are further reviewed each
quarter by each business unit. The headline
risks of each listed Company is presented
Annual Report of the Board of Directors

Group Highlights | Governance | Management Discussion & Analysis | Financial Statements | Supplementary Information 179
to its respective Board Audit Committee
for review by the business unit and in the
case of John Keells Holdings PLC, by the
Sustainability, Enterprise Risk Management
and Group Initiatives Division to the John
Keells Board Audit Committee.
Internal Controls and Assurance
The Board, through the involvement of the
Group Business Process Review Division,
takes steps to gain assurance on the
effectiveness over the financial, operational
and risk management control systems in
place. The Audit Committee receives regular
reports on the adequacy and effectiveness of
internal control in the Group, compliance with
laws and regulations and established policies
and procedures of the Group. The head of the
Group Business Process Review Division
has direct access to the chairman of the
Audit Committee. Reports of the outsourced
internal auditors are also reviewed by the
Committee on matters pertaining to the
Company.
Events after the Reporting Period
There have been no events subsequent to
the reporting period, which would have any
material effect on the Company or on the
Group other than those disclosed in note 48
to the financial statements.
Going Concern
The Directors are satisfied that the Company,
its subsidiaries and equity accounted
investees, have adequate resources to
continue in operational existence for the
foreseeable future, to justify adopting the
going concern basis in preparing these
financial statements.
Appointment and Remuneration of
Independent Auditors
Messrs Ernst & Young, Chartered Accountants,
are willing to continue as Auditors of the
Company, and a resolution proposing their
reappointment will be tabled at the annual
general meeting.
The Auditors Report is found in the Financial
Information section of the Annual Report.
The Audit Committee reviews the
appointment of the Auditor, its effectiveness,
its independence and its relationship with the
Group, including the level of audit and non-
audit fees paid to the Auditor.
The Group works with 3 firms of Chartered
Accountants across the Group, namely, Ernst
& Young, KPMG and PricewaterhouseCoopers.
Details of audit fees are set out in note 17 of
the financial statements. The Auditors do
not have any relationship (other than that of
an Auditor) with the Company or any of its
subsidiaries.
Further details on the work of the Auditor and
the Audit Committee are set out in the Audit
Committee Report.
Compliance with Laws and Regulations
To the best of knowledge and belief of the
Directors, the Group/Company has not
engaged in any activity, which contravenes
laws and regulations of the country.
Annual Report
The Board of Directors approved the
consolidated financial statements on 26
May 2017. The appropriate number of
copies of this report will be submitted to
the Colombo Stock Exchange and to the
Sri Lanka Accounting and Auditing Standards
Monitoring Board on 31 May 2017.
Annual General Meeting
The annual general meeting will be held
at the Institute of Chartered Accountants
of Sri Lanka, 30A, Malalasekera Mawatha,
Colombo 7, on Friday, 30 June 2017 at 10.00
a.m. The notice of meeting appears in the
Supplementary Information section of the
integrated Annual Report.
This Annual Report is signed for and on
behalf of the Board of Directors
By Order of the Board
Director
Director
Keells Consultants (Pvt) Ltd.
Secretaries
26 May 2017

180 John Keells Holdings PLC | Annual Report 2016/17
The Statement of Directors’ Responsibility
The responsibility of the Directors in relation
to the financial statements is set out in the
following statement. The responsibility
of the auditors, in relation to the financial
statements prepared in accordance with the
provision of the Companies Act No. 7 of 2007,
is set out in the Report of the Auditors.
The financial statements comprise of:
• Income statement and statement of
comprehensive income of the Company
and its subsidiaries, which present a true
and fair view of the profit and loss of the
Company and its subsidiaries for the
financial year.
• A statement of financial position, which
presents a true and fair view of the state of
affairs of the Company and its subsidiaries
as at the end of the financial year: and
The Directors are required to confirm that the
financial statements have been prepared:
• Using appropriate accounting policies
which have been selected and applied
in a consistent manner, and material
departures, if any, have been disclosed and
explained; and
• Presented in accordance with the Sri Lanka
Accounting Standards (SLFRS/LKAS); and
that reasonable and prudent judgments
and estimates have been made so that the
form and substance of transactions are
properly reflected; and
• Provides the information required by and
otherwise comply with the Companies Act
and the Listing Rules of the Colombo Stock
Exchange.
The Directors are also required to ensure
that the Company has adequate resources
to continue in operation to justify applying
the going concern basis in preparing these
financial statements.
Further, the Directors have a responsibility
to ensure that the Company maintains
sufficient accounting records to disclose, with
reasonable accuracy the financial position of
the Company and of the Group.
The Directors are also responsible for taking
reasonable steps to safeguard the assets of
the Company and of the Group and in this
regard to give proper consideration to the
establishment of appropriate internal control
systems with a view to preventing and
detecting fraud and other irregularities.
The Directors are required to prepare the
financial statements and to provide the
auditors with every opportunity to take
whatever steps and undertake whatever
inspections that may be considered being
appropriate to enable them to give their audit
opinion.
Further, as required by Section 56 (2) of the
Companies Act No. 7 of 2007, the Board of
Directors have confirmed that the Company,
based on the information available, satisfies
the solvency test immediately after the
distribution, in accordance with Section 57 of
the Companies Act No. 7 of 2007, and have
obtained a certificate from the auditors, prior
to declaring a final dividend of LKR 2.00 per
share for this year, to be paid on 16 June
2017.
The Directors are of the view that they have
discharged their responsibilities as set out in
this statement.
Compliance Report
The Directors confirm that to the best of
their knowledge, all taxes, duties and levies
payable by the Company and its subsidiaries,
all contributions, levies and taxes payable
on behalf of and in respect of the employees
of the Company and its subsidiaries, and all
other known statutory dues as were due and
payable by the Company and its subsidiaries
as at the balance sheet date have been
paid, or where relevant provided for, except
as specified in note 44 to the financial
statements covering contingent liabilities.
By order of the Board
Keells Consultants (Pvt) Ltd.
Secretaries
26 May 2017

Group Highlights | Governance | Management Discussion & Analysis | Financial Statements | Supplementary Information 181
Report on Other Legal and Regulatory
Requirements
As required by section 163 (2) of the
Companies Act No. 07 of 2007, we state the
following:
a) The basis of opinion, scope and limitations
of the audit are as stated above.
b) In our opinion:
• we have obtained all the information and
explanations that were required for the
audit and, as far as appears from our
examination, proper accounting records
have been kept by the Company,
• the financial statements of the Company
give a true and fair view of its financial
position as at 31 March 2017, and of its
financial performance and cash flows for
the year then ended in accordance with Sri
Lanka Accounting Standards, and
• the financial statements of the Company,
and the Group comply with the
requirements of sections 151 and 153 of
the Companies Act No. 07 of 2007.
26 May 2017
Colombo
Independent Auditors’ Report
INDEPENDENT AUDITORS’ REPORT
TO THE SHAREHOLDERS OF JOHN KEELLS
HOLDINGS PLC
Report on the Financial Statements
We have audited the accompanying financial
statements of John Keells Holdings PLC,
(“the Company”), and the consolidated
financial statements of the Company and
its subsidiaries (“Group”), which comprise
the statement of financial position as at
31 March 2017, and the income statement
and statement of comprehensive income,
statement of changes in equity and, cash
flow statement for the year then ended, and
a summary of significant accounting policies
and other explanatory information.
Board’s Responsibility for the Financial
Statements
The Board of Directors (“Board”) is
responsible for the preparation of these
financial statements that give a true and fair
view in accordance with Sri Lanka Accounting
Standards and for such internal control as
Board determines is necessary to enable the
preparation of financial statements that are
free from material misstatement, whether
due to fraud or error.
Auditor’s Responsibility
Our responsibility is to express an opinion
on these financial statements based on our
audit. We conducted our audit in accordance
with Sri Lanka Auditing Standards. Those
standards require that we comply with
ethical requirements and plan and perform
the audit to obtain reasonable assurance
about whether the financial statements are
free from material misstatement.
An audit involves performing procedures to
obtain audit evidence about the amounts and
disclosures in the financial statements. The
procedures selected depend on the auditor’s
judgment, including the assessment of
the risks of material misstatement of the
financial statements, whether due to fraud or
error. In making those risk assessments, the
auditor considers internal controls relevant
to the entity’s preparation of the financial
statements that give a true and fair view in
order to design audit procedures that are
appropriate in the circumstances, but not
for the purpose of expressing an opinion
on the effectiveness of the entity’s internal
control. An audit also includes evaluating
the appropriateness of accounting policies
used and the reasonableness of accounting
estimates made by the Board, as well as
evaluating the overall presentation of the
financial statements.
We believe that the audit evidence we have
obtained is sufficient and appropriate to
provide a basis for our audit opinion.
Opinion
In our opinion, the consolidated financial
statements give a true and fair view of
the financial position of the Group as at 31
March 2017, and of its financial performance
and cash flows for the year then ended
in accordance with Sri Lanka Accounting
Standards.

182 John Keells Holdings PLC | Annual Report 2016/17
Income Statement
Group Company
For the year ended 31 March Note 2017 2016 2017 2016
In LKR '000s
Continuing operations
Sale of goods 68,238,202 58,608,224 - -
Rendering of services 38,034,899 35,101,730 1,126,353 1,108,095
Revenue 13 106,273,101 93,709,954 1,126,353 1,108,095
Cost of sales (75,158,110) (65,057,256) (564,049) (541,812)
Gross profit 31,114,991 28,652,698 562,304 566,283
Dividend income 14 - - 10,469,023 10,260,828
Other operating income 15.1 1,765,187 1,704,123 2,607,861 3,821,890
Selling and distribution expenses (3,900,667) (3,615,527) - -
Administrative expenses (11,435,797) (10,744,227) (903,969) (947,588)
Other operating expenses 15.2 (3,170,105) (3,429,561) (941,172) (566,680)
Results from operating activities 14,373,609 12,567,506 11,794,047 13,134,733
Finance cost 16 (436,278) (993,802) (89,397) (81,579)
Finance income 16 10,033,281 8,010,952 5,540,768 4,640,404
Change in insurance contract liabilities 35.2 (4,869,288) (3,430,533) - -
Change in fair value of investment property 23 483,554 262,875 - -
Share of results of equity accounted investees 26 3,302,955 2,781,233 - -
Profit before tax 17 22,887,833 19,198,231 17,245,418 17,693,558
Tax expense 20.1 (4,771,068) (3,406,366) (1,092,976) (623,444)
Profit for the year 18,116,765 15,791,865 16,152,442 17,070,114
Attributable to:
Equity holders of the parent 16,275,158 14,070,009
Non-controlling interests 1,841,607 1,721,856
18,116,765 15,791,865
LKR. LKR.
Earnings per share
Basic 18.1 11.85 10.54
Diluted 18.2 11.84 10.52
Dividend per share 19 5.50 7.00
Figures in brackets indicate deductions.
The accounting policies and notes as set out in pages 191 to 258 form an integral part of these financial statements.

Group Highlights | Governance | Management Discussion & Analysis | Financial Statements | Supplementary Information 183
Statement of Comprehensive Income
Group Company
For the year ended 31 March Note 2017 2016 2017 2016
In LKR '000s
Profit for the year 18,116,765 15,791,865 16,152,442 17,070,114
Other comprehensive income
Other comprehensive income to be reclassified to income statement
in subsequent periods
Currency translation of foreign operations 1,089,650 3,009,187 - -
Net (loss)/gain on cash flow hedges 12.3 331,679 - - -
Share of other comprehensive income of equity accounted investees 272,648 576,177 - -
Net gain / (loss) on available-for-sale financial assets (302,773) (521,015) (24,087) (38,373)
Net other comprehensive income to be reclassified to income
statement in subsequent periods
1,391,204 3,064,349 (24,087) (38,373)
Other comprehensive income not to be reclassified to income
statement in subsequent periods
Revaluation of land and buildings 10,361,135 1,282,978 - -
Share of other comprehensive income of equity accounted investees 3,830 40,947 - -
Re-measurement gain / (loss) on defined benefit plans 37 (110,758) (44,627) (5,310) (2,478)
Net other comprehensive income not to be reclassified to income
statement in subsequent periods
10,254,207 1,279,298 (5,310) (2,478)
Tax on other comprehensive income 20.2 49,444 (52,348) - -
Other comprehensive income for the period, net of tax 11,694,855 4,291,299 (29,397) (40,851)
Total comprehensive income for the period, net of tax 29,811,620 20,083,164 16,123,045 17,029,263
Attributable to :
Equity holders of the parent 25,694,454 17,848,337
Non-controlling interests 4,117,166 2,234,827
29,811,620 20,083,164
Figures in brackets indicate deductions.
The accounting policies and notes as set out in pages 191 to 258 form an integral part of these financial statements.

184 John Keells Holdings PLC | Annual Report 2016/17
Statement of Financial Position
Group Company
As at 31 March Note 2017 2016 2017 2016
In LKR '000s
ASSETSNon-current assetsProperty, plant and equipment 21 64,396,373 52,736,375 93,913 116,039 Lease rentals paid in advance 22 13,206,058 10,888,158 - - Investment property 23 5,366,180 4,878,406 - - Intangible assets 24 2,118,160 2,337,860 30,801 43,820 Investments in subsidiaries 25 - - 42,987,395 36,384,646 Investments in equity accounted investees 26 17,718,887 16,949,464 8,910,800 8,867,622 Non-current financial assets 27 27,666,621 22,635,444 2,789,980 507,405 Deferred tax assets 20.4 143,548 129,837 - - Other non-current assets 28 41,692,316 35,557,148 16,254 12,414
172,308,143 146,112,692 54,829,143 45,931,946
Current assetsInventories 29 5,605,712 4,664,833 - - Trade and other receivables 30 11,687,429 9,998,949 118,076 169,144 Amounts due from related parties 43.1 111,639 133,031 286,735 595,182 Other current assets 31 3,265,327 2,303,431 99,442 128,353 Short term investments 32 79,174,327 72,635,070 60,243,280 56,862,236 Cash in hand and at bank 5,119,185 5,127,463 304,265 178,193
104,963,619 94,862,777 61,051,798 57,933,108 Total assets 277,271,762 240,975,469 115,880,941 103,865,054
EQUITY AND LIABILITIESEquity attributable to equity holders of the parentStated capital 33 62,790,080 58,701,977 62,790,080 58,701,977 Revenue reserves 77,193,184 67,564,513 49,988,495 41,121,860 Other components of equity 33.2 38,651,568 28,715,262 1,504,876 1,084,617
178,634,832 154,981,752 114,283,451 100,908,454 Non-controlling interest 15,695,543 13,498,570 - -
Total equity 194,330,375 168,480,322 114,283,451 100,908,454
Non-current liabilitiesInsurance contract liabilities 35 31,700,278 27,205,282 - - Interest-bearing loans and borrowings 36 14,202,636 13,706,848 - - Deferred tax liabilities 20.4 2,336,241 2,029,371 - - Employee benefit liabilities 37 1,880,287 1,660,880 217,910 189,181 Other deferred liabilities 38 838,891 861,802 103,218 371,014 Other non-current liabilities 39 3,933,882 3,095,181 - -
54,892,215 48,559,364 321,128 560,195
Current liabilitiesTrade and other payables 40 14,136,040 12,755,466 330,078 332,506 Amounts due to related parties 43.2 10,434 28,982 210,029 102,135 Income tax liabilities 20.3 2,395,379 1,873,472 635,532 345,555 Short term borrowings 41 1,380,238 821,243 - - Interest-bearing loans and borrowings 36 2,918,854 2,991,582 - 1,482,508 Other current liabilities 42 2,944,118 2,234,856 16,441 16,289 Bank overdrafts 4,264,109 3,230,182 84,282 117,412
28,049,172 23,935,783 1,276,362 2,396,405 Total equity and liabilities 277,271,762 240,975,469 115,880,941 103,865,054
I certify that the financial statements comply with the requirements of the Companies Act No. 7 of 2007.
M J S Rajakariar
Group Financial Controller
The Board of Directors is responsible for the preparation and presentation of these financial statements.
S C Ratnayake J R F Peiris
Chairman Group Finance Director
26 May 2017
ColomboThe accounting policies and notes as set out in pages 191 to 258 form an integral part of these financial statements.

Group Highlights | Governance | Management Discussion & Analysis | Financial Statements | Supplementary Information 185
Statement of Cash Flows
Group CompanyFor the year ended 31 March Note 2017 2016 2017 2016
In LKR '000s
CASH FLOWS FROM OPERATING ACTIVITIESProfit before working capital changes A 14,249,210 14,577,471 (143,117) (183,324)
(Increase) / Decrease in inventories (940,879) 934,769 - - (Increase) / Decrease in trade and other receivables (1,712,513) 69,939 38,775 (62,627)(Increase) / Decrease in other current assets (320,693) (176,563) 37,903 10,017 (Increase) / Decrease in other non-current assets (5,008,630) (6,646,918) (3,840) 1,393 Increase / (Decrease) in trade, other payables and other non-current liabilities 2,200,730 3,551,730 (3,617) (99,067)Increase / (Decrease) in other current liabilities 820,376 (1,033,059) 153 1,406 Increase / (Decrease) in insurance contract liabilities 4,494,996 3,273,316 - - Cash generated from operations 13,782,597 14,550,685 (73,743) (332,202)
Finance income received 9,536,363 8,117,933 4,221,631 4,162,732 Finance cost paid (302,583) (955,839) (63,216) (78,912)Dividend received 2,854,182 2,588,485 10,789,765 9,902,966 Tax paid (4,630,808) (2,519,947) (803,000) (541,130)Super Gain Tax paid - (1,096,780) - (235,746)Gratuity paid (219,443) (171,100) (9,412) (386)Net cash flow from operating activities 21,020,308 20,513,437 14,062,025 12,877,322
CASH FLOWS FROM/(USED IN) INVESTING ACTIVITIESPurchase and construction of property, plant and equipment (4,331,582) (4,582,064) (11,110) (30,002)Purchase of intangible assets (114,398) (162,608) (6,746) (4,196)Addition to investment property (4,220) (6,590) - - Purchase of lease rights (2,657,012) (607,155) - - Acquisition of business, net of cash acquired 9.2 - (12,914) - - Acquisition of associates - - - (115,407)Increase in interest in subsidiaries - - (4,840,893) (5,100,725)Increase in interest in associates (44,172) (40,200) (43,178) (40,200)Proceeds from sale of property, plant and equipment and intangible assets 157,919 592,421 211 8,260 Proceeds from sale of non-current investments - - 36,357 5,739,902 Proceeds from sale of financial instruments - fair valued through profit or loss 1,242,075 236,082 - - Purchase of financial instruments - fair valued through profit or loss (1,285,594) (448,206) - - (Purchase) / disposal of short term investments (net) (5,443,340) (39,731) (1,681,845) (2,591,480)(Purchase) / disposal of non current financial assets (net) (5,270,637) (4,506,403) 1,311 106,491 Grants received for investing activities 80,800 10,714 - -Net cash flow from/(used in) investing activities (17,670,161) (9,566,654) (6,545,893) (2,027,357)
CASH FLOWS FROM/(USED IN) FINANCING ACTIVITIESProceeds from issue of shares 4,088,103 7,999,276 4,088,103 7,999,276 Direct cost on issue of shares - (71,189) - (45,560)Changes in non controlling interest 65,660 (23,079) - -
Payment of other deferred liabilities (115,406) - - - Dividend paid to equity holders of parent (7,280,497) (8,037,790) (7,280,497) (8,037,790)Dividend paid to shareholders with non-controlling interest (1,279,179) (1,595,872) - - Proceeds from long term borrowings 3,300,907 409,372 - - Repayment of long term borrowings (3,443,821) (4,623,992) (1,469,884) (1,388,100)Proceeds from (repayment of) other financial liabilities (net) 558,995 (1,773,958) - - Net cash flow from/(used in) financing activities (4,105,238) (7,717,232) (4,662,278) (1,472,174)
NET INCREASE / (DECREASE) IN CASH AND CASH EQUIVALENTS (755,091) 3,229,551 2,853,854 9,377,791
CASH AND CASH EQUIVALENTS AT THE BEGINNING 48,398,696 45,169,145 37,135,335 27,757,544
CASH AND CASH EQUIVALENTS AT THE END 47,643,605 48,398,696 39,989,189 37,135,335
ANALYSIS OF CASH AND CASH EQUIVALENTSFavorable balancesShort term investments 32 46,788,529 46,501,415 39,769,206 37,074,554 Cash in hand and at bank 5,119,185 5,127,463 304,265 178,193 Unfavourable balancesBank overdrafts (4,264,109) (3,230,182) (84,282) (117,412)Total cash and cash equivalents 47,643,605 48,398,696 39,989,189 37,135,335
Cash and cash equivalents in the statement of financial position comprise cash at banks and in hand and short-term deposits with a maturity of three months or less. For
the purpose of the cash flow statement, cash and cash equivalents consist of cash and short-term deposits as defined above, net of outstanding bank overdrafts.
Figures in brackets indicate deductions.
The accounting policies and notes as set out in pages 191 to 258 form an integral part of these financial statements.

186 John Keells Holdings PLC | Annual Report 2016/17
Statement of Changes in Equity
Statement of Cash Flows
Group Company
For the year ended 31 March Note 2017 2016 2017 2016
In LKR '000s
A. Profit before working capital changes
Profit before tax 22,887,833 19,198,231 17,245,418 17,693,558
Adjustments for:
Finance income (10,033,281) (8,010,952) (5,540,768) (4,640,404)
Dividend income - - (10,469,023) (10,260,828)
Finance costs 436,278 993,802 89,397 81,579
Share based payment expense 444,346 395,592 119,822 128,541
Change in fair value of investment property (483,554) (262,875) - -
Share of results of equity accounted investees (3,302,955) (2,781,233) - -
(Profit) / loss on sale of non-current investments - - (2,574,003) (3,792,821)
Depreciation of property, plant and equipment 2,874,071 2,782,315 33,042 33,415
Provision for impairment losses 34,332 215,764 900,419 525,000
(Profit) / loss on sale of property, plant and equipment and intangible assets 41,183 34,050 (17) (1,656)
Gain on bargain purchase of a subsidiary 9.2 - (4,088) - -
Amortisation of lease rental paid in advance 592,983 738,407 - -
Amortisation of intangible assets 333,046 320,564 19,765 23,659
Amortisation of other deferred liabilities (19,669) (14,984) - -
Gratuity provision and related costs 327,633 283,900 32,831 26,633
Unrealised (gain) / loss on foreign exchange (net) 116,964 688,978 - -
14,249,210 14,577,471 (143,117) (183,324)
COMPANY
In LKR '000s
Stated
capital
Other
capital
reserve
Available
for sale
reserve
Revenue
reserve
Total
equity
As at 1 April 2015 50,702,701 562,718 164,680 32,373,320 83,803,419
Charge relating to Super Gain Tax - - - (235,746) (235,746)
Profit for the year - - - 17,070,114 17,070,114
Other comprehensive income - - (38,373) (2,478) (40,851)
Total comprehensive income - - (38,373) 17,067,636 17,029,263
Exercise of share warrants 7,972,760 - - - 7,972,760
Exercise of share options 26,516 - - 26,516
Direct cost of issue of shares - - - (45,560) (45,560)
Share based payments - 395,592 - - 395,592
Final dividend paid - 2014/15 - - - (1,496,230) (1,496,230)
Interim dividends paid - 2015/16 - - - (6,541,560) (6,541,560)
As at 31 March 2016 58,701,977 958,310 126,307 41,121,860 100,908,454
Profit for the year - - - 16,152,442 16,152,442
Other comprehensive income - - (24,087) (5,310) (29,397)
Total comprehensive income - - (24,087) 16,147,132 16,123,045
Exercise of share warrants 3,176,842 - - - 3,176,842
Exercise of share options 911,261 - - - 911,261
Share based payments - 444,346 - - 444,346
Final dividend paid - 2015/16 - - - (1,784,105) (1,784,105)
Interim dividends paid - 2016/17 - - - (5,496,392) (5,496,392)
As at 31 March 2017 62,790,080 1,402,656 102,220 49,988,495 114,283,451
Figures in brackets indicate deductions.
The accounting policies and notes as set out in pages 191 to 258 form an integral part of these financial statements.

Group Highlights | Governance | Management Discussion & Analysis | Financial Statements | Supplementary Information 187
Statement of Changes in Equity
Att
rib
uta
ble
to
eq
uit
y h
old
ers
of
the
pa
ren
t
GR
OU
P
In L
KR
'00
0s
Sta
ted
cap
ita
l
Re
valu
ati
on
rese
rve
Fo
reig
n
curr
en
cy
tra
nsl
ati
on
rese
rve
Ca
sh fl
ow
he
dg
e
re
serv
e
Oth
er
cap
ita
l
rese
rve
Ava
ila
ble
for
sale
rese
rve
Re
ven
ue
rese
rve
Tota
lN
on
con
tro
llin
g
inte
rest
s
Tota
l
eq
uit
y
As
at
1 A
pri
l 20
15
5
0,7
02
,70
1
19
,75
2,4
11
3
,77
0,4
96
-
5
62
,71
8
41
5,6
53
6
2,5
93
,94
8
13
7,7
97
,92
7
12
,27
8,8
83
1
50
,07
6,8
10
Ch
arg
e re
lati
ng
to
Su
per
Gai
n T
ax -
-
-
-
-
-
(1
,23
7,5
46
) (1
,23
7,5
46
) (1
04
,56
7)
(1,3
42
,11
3)
Pro
fit
for
the
year
-
-
-
-
-
-
1
4,0
70
,00
9
14
,07
0,0
09
1
,72
1,8
56
1
5,7
91
,86
5
Oth
er c
omp
reh
ensi
ve in
com
e -
1
,09
3,7
79
3
,31
0,4
83
-
-
(5
85
,87
0)
(40
,06
4)
3,7
78
,32
8
51
2,9
71
4
,29
1,2
99
Tota
l com
pre
hen
sive
inco
me
-
1,0
93
,77
9
3,3
10
,48
3
-
-
(58
5,8
70
) 1
4,0
29
,94
5
17
,84
8,3
37
2
,23
4,8
27
2
0,0
83
,16
4
Exe
rcis
e of
sh
are
war
ran
ts 7
,97
2,7
60
-
-
-
-
-
-
7
,97
2,7
60
-
7
,97
2,7
60
Exe
rcis
e of
sh
are
opti
ons
26
,51
6
-
-
-
-
-
-
26
,51
6
-
26
,51
6
Dir
ect
cost
of
issu
e of
sh
ares
-
-
-
-
-
-
(68
,25
5)
(68
,25
5)
(2,9
34
) (7
1,1
89
)
Re-
pu
rch
ase
of s
ub
sid
iary
sh
ares
hel
d b
y N
CI
-
-
-
-
-
-
-
-
(23
,07
9)
(23
,07
9)
Sh
are
bas
ed p
aym
ents
-
-
-
-
39
5,5
92
-
-
3
95
,59
2
-
39
5,5
92
Res
tate
men
t of
fu
lly d
epre
ciat
ed a
sset
s -
-
-
-
-
-
2
0,4
82
2
0,4
82
3
,90
0
24
,38
2
Fin
al d
ivid
end
pai
d -
20
14
/15
-
-
-
-
-
-
(1,4
96
,23
0)
(1,4
96
,23
0)
-
(1,4
96
,23
0)
Inte
rim
div
iden
ds
pai
d -
20
15
/16
-
-
-
-
-
-
(6,5
41
,56
0)
(6,5
41
,56
0)
-
(6,5
41
,56
0)
Su
bsi
dia
ry d
ivid
end
to
non
-con
trol
ling
inte
rest
-
-
-
-
-
-
3
07
,92
8
30
7,9
28
(1
,90
3,8
00
) (1
,59
5,8
72
)
Acq
uis
itio
n, d
isp
osal
an
d c
han
ges
in n
on-c
ontr
ollin
g in
tere
st -
-
-
-
-
-
(4
4,1
99
) (4
4,1
99
) 1
,01
5,3
40
9
71
,14
1
As
at
31
Ma
rch
20
16
58
,70
1,9
77
2
0,8
46
,19
0
7,0
80
,97
9
-
95
8,3
10
(
17
0,2
17
) 6
7,5
64
,51
3
15
4,9
81
,75
2
13
,49
8,5
70
1
68
,48
0,3
22
Pro
fit
for
the y
ea
r -
-
-
-
-
-
1
6,2
75
,15
8
16
,27
5,1
58
1
,84
1,6
07
1
8,1
16
,76
5
Oth
er
com
pre
hen
sive
inco
me
-
8,1
48
,60
2
1,2
22
,91
6
31
2,5
29
-
(1
92
,08
7)
(7
2,6
64
) 9
,41
9,2
96
2
,27
5,5
59
1
1,6
94
,85
5
Tota
l co
mp
reh
en
sive
inco
me
-
8,1
48
,60
2
1,2
22
,91
6
31
2,5
29
-
(1
92
,08
7)
16
,20
2,4
94
2
5,6
94
,45
4
4,1
17
,16
6
29
,81
1,6
20
Exe
rcis
e of
sh
are
war
ran
ts 3
,17
6,8
42
-
-
-
-
-
-
3
,17
6,8
42
-
3
,17
6,8
42
Exe
rcis
e o
f sh
are
op
tio
ns
91
1,2
61
-
-
-
-
-
-
9
11
,26
1
-
91
1,2
61
Sh
are
ba
sed
pa
ymen
ts -
-
-
-
4
44
,34
6
-
-
44
4,3
46
-
4
44
,34
6
Fin
al d
ivid
en
d p
aid
- 2
01
5/1
6 -
-
-
-
-
-
(
1,7
84
,10
5)
(1
,78
4,1
05
) -
(
1,7
84
,10
5)
Inte
rim
div
iden
ds
pa
id -
20
16
/17
-
-
-
-
-
-
(5
,49
6,3
92
) (
5,4
96
,39
2)
-
(5
,49
6,3
92
)
Su
bsi
dia
ry d
ivid
en
d t
o n
on
-co
ntr
oll
ing
inte
rest
-
-
-
-
-
-
65
9,9
92
6
59
,99
2
(1
,93
9,1
71
) (
1,2
79
,17
9)
Acq
uis
itio
n, d
isp
osal
an
d c
han
ges
in n
on-c
ontr
ollin
g in
tere
st -
-
-
-
-
-
4
6,6
82
4
6,6
82
1
8,9
78
6
5,6
60
As
at
31
Ma
rch
20
17
62
,79
0,0
80
2
8,9
94
,79
2
8,3
03
,89
5
31
2,5
29
1
,40
2,6
56
(
36
2,3
04
) 7
7,1
93
,18
4
17
8,6
34
,83
2
15
,69
5,5
43
1
94
,33
0,3
75
Fig
ure
s in
bra
ckets
ind
ica
te d
ed
uct
ion
s.
Th
e a
cco
un
tin
g p
olici
es
an
d n
ote
s a
s se
t o
ut
in p
ag
es
19
1 t
o 2
58
fo
rm a
n in
teg
ral p
art
of
the
se fi
na
nci
al st
ate
me
nts
.

188 John Keells Holdings PLC | Annual Report 2016/17
Performance Highlights
LKR106.27bn
Group Revenue
A growth of 13 per cent
LKR22.89bn
Group Profit before Tax
A growth of 19 per cent
Sri Lanka*
SriLanka*
Sri Lanka*
Sri Lanka*
SriLanka*
Asia*
Europe*
Asia*
Leisure
IT
FinancialServices
Asia*
CF&R
SriLanka* 2017
LKR 106.27 bnTRP
Property
Sri Lanka*
Asia*
Sri Lanka*
Property
Sri
Lanka*
SriLanka*
Asia*
Europe*
Leisure
IT
TRP
FinancialServices
Sri Lanka*
CF&R
SriLanka* 2016
LKR 93.71 bn
Asia*
Other
TRP
FinancialServices
Group*
Group*
Group*
Group*
Group*
Group*
Property
CF&R
Leisure
2017LKR 22.89 bn
Other
TRPFinancialServices
Group*
Group*
Group*
Group*
Group*
Group*
Property
CF&R
Leisure
2016LKR 19.20 bn
Group RevenueLKR bn
106.279
3.7
19
1.8
5 86
.71
85.4
1
2017 2016 2015 2014 2013
Group PBTLKR bn
22.8
91
9.2
01
8.5
6
15.32
15.67
2017 2016 2015 2014 2013
* Geographical segment analysis by location of customers
* Attributable to equity holders of the parent

Group Highlights | Governance | Management Discussion & Analysis | Financial Statements | Supplementary Information 189
LKR277.27bn
Group Assets
A growth of 15 per cent
LKR82.94bn
Group Liabilities
A growth of 14 per cent
CF&RProperty
Property
Others
CF&R
Leisure
Leisure
Leisure
PP&E
FinancialServices
Financial
Services
LRPA
Financial
Services
OtherEquity
accountedinvestees
Transportation
2017LKR 277.27 bn
Leisure
Oth
er a
sse
ts
Short term investm
ents
Non
-Cur
rent
finan
cial
ass
ets
Other non-current
assets
CF&RPro
perty
Property
Other
CF&RLeisure
Leisure
Leisure
PP&E
FinancialServices
Financial
Services
OtherEquity
accountedinvestees
Transportation
Fin
ancia
l
Serv
ices
LRPA
Leisure
2016LKR 240.98 bn
Short term investm
ents
Non
-Cur
rent
finan
cial a
ssets
Oth
er a
ssets
Other non-current
assets
CF&R
CF&R
Leisure
TRP
Property
Prop
erty
Leisure
Leisure
CF&R
Leisure
FinancialServices
Bankoverdrafts
Othernon-currentliabilities
2017LKR 82.94 bn
Insurance p
rovisio
ns
Insurance p
rovisio
ns
Trade and
oth
er p
ayab
les
Oth
er li
abili
ties
Financial Service
s
CF&R
Othernon-currentliabilities
Leisure
PropertyLeisure
Leisure
Other
CF&R
Leisure
IT
Bank
overdraftsP
roperty
2016LKR 72.50 bn
CF&
R
Financial Service
s
Insurance p
rovisio
ns
Insurance p
rovisio
ns
Trad
e an
d ot
her
paya
ble
sO
ther
liab
ilitie
s
Group AssetsLKR bn
277.2
7 2
40
.98 218.09
202.47 159.12
2017 2016 2015 2014 2013
Group LiabilitiesLKR bn
82.94 7
2.5
0 6
8.0
1
67
.26
57.93
2017 2016 2015 2014 2013

190 John Keells Holdings PLC | Annual Report 2016/17
Index to the Notes
Corporate and Group information
1 Corporate information 191
2 Group information 191
Basis of preparation and other significant
accounting policies
3 Basis of preparation 191
4 Summary of significant accounting
policies 192
5 Significant accounting judgements,
estimates and assumptions 192
6 Standards issued but not yet
effective 193
Group business, operations & management
7 Operating segment information 194
8 Basis of consolidation and material
partly owned subsidiaries 199
9 Business combinations and
acquisitions of non-controlling
interests 200
10 Financial risk management
objectives and policies 202
11 Fair value measurement and
related fair value disclosures 209
12 Financial instruments and related
policies 211
Notes to the income statement, statement
of comprehensive income and statement of
financial position
13 Revenue 216
14 Dividend income 216
15 Other operating income and other
operating expenses 216
16 Net finance income 217
17 Profit before tax 218
18 Earnings per share 218
19 Dividend per share 219
20 Taxes 219
21 Property , plant and equipment 225
22 Leases 230
23 Investment property 230
24 Intangible assets 232
25 Investment in subsidiaries 234
26 Investment in equity accounted
investees 237
27 Non current financial assets 240
28 Other non current assets 241
29 Inventories 241
30 Trade and other receivables 242
31 Other current assets 242
32 Short term investments 242
33 Stated capital and other
components of equity 244
34 Share-based payment plans 245
35 Insurance contract liabilities 246
36 Interest-bearing loans and
borrowings 248
37 Employee benefit liabilities 251
38 Other deferred liabilities 252
39 Other non current liabilities 253
40 Trade and other payables 253
41 Short term borrowings 253
42 Other current liabilities 253
43 Related party transactions 253
Other disclosures
44 Contingent liabilities 256
45 Capital and other commitments 258
46 Lease commitments 258
47 Assets pledged 258
48 Events after the reporting period 258
Financial Calendar
Date
Interim Financial Statements
Three months ended 30 June 2016 28 July 2016
Six months ended 30 September 2016 4 November 2016
Nine months ended 31 December 2016 26 January 2017
First interim dividend paid on 24 October 2016
Second interim dividend paid on 16 February 2017
Final dividend proposed to be paid on 16 June 2017
Annual Report 2016/17 31 May 2017
38th Annual General Meeting 30 June 2017
Date
Interim Financial Statements
Three months ended 30 June 2017 On or before 27 July 2017
Six months ended 30 September 2017 On or before 2 November 2017
Nine months ended 31 December 2017 On or before 25 January 2018
Annual Report 2017/18 On or before 1 June 2018
39th Annual General Meeting On or before 29 June 2018
www.keells.com

Group Highlights | Governance | Management Discussion & Analysis | Financial Statements | Supplementary Information 191
Notes to the Financial Statements
CORPORATE AND GROUP INFORMATION
1. Corporate information
Reporting entity
John Keells Holdings PLC is a public limited
liability Company incorporated and domiciled
in Sri Lanka. The registered office and
principal place of business of the Company is
located at 117, Sir Chittampalam A Gardiner
Mawatha, Colombo 2.
Ordinary shares of the Company are listed
on the Colombo Stock Exchange. Global
depository receipts (GDRs) of John Keells
Holdings PLC are listed on the Luxembourg
Stock Exchange. John Keells Holdings PLC
became the holding Company of the Group
during the financial year ended 31 March
1986.
Consolidated financial statements
The financial statements for the year ended
31 March 2017, comprise “the Company”
referring to John Keells Holdings PLC as the
holding Company and “the Group” referring to
the companies that have been consolidated
therein.
Approval of financial statements
The financial statements for the year ended
31 March 2017 were authorised for issue by
the Board of Directors on 26 May 2017.
Principal activities and nature of
operations of the holding Company
John Keells Holdings PLC, the Group’s
holding Company, manages a portfolio
of investments consisting of a range
of diverse business operations, which
together constitute the John Keells Group,
and provides function based services to its
subsidiaries, equity accounted investees.
Responsibility for financial statements
The responsibility of the Board of Directors in
relation to the financial statements is set out
in the Statement of Directors’ Responsibility
report in the Annual report.
Statements of compliance
The financial statements which comprise
the income statement, statement of
comprehensive income, statement of
financial position, statement of changes
in equity and the statement of cash flows,
together with the accounting policies and
notes (the “financial statements”) have
been prepared in accordance with Sri
Lanka Accounting Standards (SLFRS/LKAS)
as issued by the Institute of Chartered
Accountants of Sri Lanka (CA Sri Lanka) and
in compliance with the Companies Act No. 7
of 2007.
2. Group information
Subsidiaries , associates and joint ventures
The companies within the Group and its
business activities are described in the
Group Directory under the Supplementary
Information section of the Annual Report.
There were no significant changes in the
nature of the principal activities of the
Company and the Group during the financial
year under review.
BASIS OF PREPARATION AND OTHER
SIGNIFICANT ACCOUNTING POLICIES
3. Basis of preparation
The consolidated financial statements have
been prepared on an accrual basis and under
the historical cost convention except for
investment properties, land and buildings,
derivative financial instruments, fair value
through profit or loss financial assets and
available-for-sale financial assets that have
been measured at fair value.
Presentation of functional currency
The consolidated financial statements are
presented in Sri Lankan Rupees (LKR), which
is the primary economic environment in
which the holding Company operates. Each
entity in the Group uses the currency of the
primary economic environment in which they
operate as their functional currency.
The following subsidiaries are using different functional currencies other than Sri Lankan Rupees (LKR):
Country of incorporation Functional Currency Name of the Subsidiary
Canada Canadian Dollar (CAD) John Keells BPO Solutions Canada Inc.
India Indian Rupee (INR) John Keells BPO Solutions India (Pvt) Ltd.
Serene Holidays (Pvt) Ltd.
Singapore Singapore Dollar (SGD) John Keells Singapore (Pte) Ltd.
USA United States Dollar (USD) John Keells BPO Solutions US Inc.
Republic of Maldives United States Dollar (USD) Fantasea World Investments (Pte) Ltd.
John Keells Maldivian Resort (Pte) Ltd.
Mack Air Services Maldives (Pte) Ltd.
Tranquility (Pte) Ltd.
Travel Club (Pte) Ltd.
Mauritius United States Dollar (USD) John Keells BPO Holdings (Pvt) Ltd.
John Keells BPO International (Pvt) Ltd.
Sri Lanka United States Dollar (USD) Waterfront Properties (Pvt) Ltd.

192 John Keells Holdings PLC | Annual Report 2016/17
Each material class of similar items are
presented cumulatively in the Financial
Statements. Items of dissimilar nature or
function are presented separately unless
they are immaterial as permitted by the
Sri Lanka Accounting Standard-LKAS 1 on
‘Presentation of Financial Statements’.
All values are rounded to the nearest rupees
thousand (LKR ’000) except when otherwise
indicated.
The significant accounting policies are
discussed with relevant individual notes.
The indicative US Dollar financial statements
under Supplementary Information section of
the Annual Report do not form a part of the
financial statements prepared in accordance
with SLFRS/LKAS.
Comparative information
The presentation and classification of the
financial statements of the previous years
have been amended, where relevant including
the following, for better presentation and to
be comparable with those of the current year.
The share of results of equity accounted
investees in the income statement and other
comprehensive income statement are shown
net of all related taxes.
4. Summary of significant accounting
policies
Summary of significant accounting policies
have been disclosed along with the relevant
individual notes in the subsequent pages.
Those accounting policies presented with
each note, have been applied consistently by
the Group.
Other significant accounting policies not
covered with individual notes.
Following accounting policies, which have
been applied consistently by the Group, are
considered to be significant but not covered
in any other sections.
Current versus non-current classification
The Group presents assets and liabilities
in the statement of financial position
based on current/non-current classification.
An asset is current when it is:
• Expected to be realised or intended to be
sold or consumed in normal operating
cycle
• Held primarily for the purpose of trading
Notes to the Financial Statements
• Expected to be realised within twelve
months after the reporting period, or
• Cash or cash equivalent unless restricted
from being exchanged or used to settle a
liability for at least twelve months after the
reporting period.
All other assets are classified as non-current.
A liability is current when:
• It is expected to be settled in normal
operating cycle
• It is held primarily for the purpose of
trading
• It is due to be settled within twelve months
after the reporting period, or
• There is no unconditional right to defer the
settlement of the liability for at least twelve
months after the reporting period.
The Group classifies all other liabilities as
non-current.
Deferred tax assets and liabilities are
classified as non-current assets and
liabilities.
Foreign currency translation, foreign
currency transactions and balances
The consolidated financial statements are
presented in Sri Lankan Rupees (LKR),
which is the Company’s functional and
presentation currency. The functional
currency is the currency of the primary
economic environment in which the entities
of the Group operate. All foreign exchange
transactions are converted to functional
currency, at the rates of exchange prevailing
at the time the transactions are effected.
Monetary assets and liabilities denominated
in foreign currency are retranslated to
functional currency equivalents at the spot
exchange rate prevailing at the reporting
date.
Non-monetary items that are measured in
terms of historical cost in a foreign currency
are translated using the exchange rates as
at the dates of the initial transactions. Non
monetary assets and liabilities are translated
using exchange rates that existed when the
values were determined. The gain or loss
arising on translation of non-monetary items
is treated in line with the recognition of gain
or loss on changing fair value of the item.
Foreign operations
The statement of financial position and
income statement of overseas subsidiaries
and joint ventures which are deemed to be
foreign operations are translated to Sri Lanka
rupees at the rate of exchange prevailing as at
the reporting date and at the average annual
rate of exchange for the period respectively.
The exchange differences arising on the
translation are taken directly to other
comprehensive income. On disposal of
a foreign entity, the deferred cumulative
amount recognised in other comprehensive
income relating to that particular foreign
operation is recognised in the income
statement.
The Group treated goodwill and any fair
value adjustments to the carrying amounts
of assets and liabilities arising on the
acquisition as assets and liabilities of the
parent. Therefore, those assets and liabilities
are non-monetary items already expressed
in the functional currency of the parent and
no further translation differences occur.
5. Significant accounting judgements,
estimates and assumptions
The preparation of the financial statements of
the Group require the management to make
judgments, estimates and assumptions,
which may affect the amounts of income,
expenditure, assets, liabilities and the
disclosure of contingent liabilities, at the end
of the reporting period.
Uncertainty about these assumptions and
estimates could result in outcomes that
require a material adjustment to the carrying
amount of assets or liabilities affected in
future periods. In the process of applying the
Group’s accounting policies, management
has made various judgements. Those which
management has assessed to have the most
significant effect on the amounts recognised
in the consolidated financial statements have
been discussed in the individual notes of the
related financial statement line items.
The key assumptions concerning the future
and other key sources of estimation of
uncertainty at the reporting date, that have
a significant risk of causing a material
adjustment to the carrying amounts of assets
and liabilities within the next financial year,
are also described in the individual notes to
the financial statements. The Group based its
assumptions and estimates on parameters
available when the financial statements
were prepared. Existing circumstances and
assumptions about future developments,

Group Highlights | Governance | Management Discussion & Analysis | Financial Statements | Supplementary Information 193
however, may change due to market changes
or circumstances arising that are beyond
the control of the Group. Such changes are
reflected in the assumptions when they occur.
The line items which have the most significant
effect on accounting, judgements, estimates
and assumptions are as follows;
a) Valuation of property, plant and equipment
and investment property.
b) Impairment of non-financial assets
c) Share based payments
d) Taxes
e) Employee benefit liability
f) Valuation of insurance contract liabilities
6 Standards issued but not yet effective
The following SLFRS have been issued
by the Institute of Chartered Accountants
of Sri Lanka that have an effective date
in the future and have not been applied
in preparing these financial statements.
Those SLFRS’s will have an effect on the
accounting policies currently adopted by the
Group and may have an impact on the future
financial statements.
The Group intends to adopt these standards,
if applicable, when they become effective.
Accounting
Standard
Summary of the Requirements Effective
Date
Possible Impact on Consolidated Financial
Statements
SLFRS 9 - Financial
Instruments
SLFRS 9 replaces the existing standard LKAS
39 Financial Instruments: Recognition and
Measurement. SLFRS 9 includes revised
guidance on the classification and measurement
of financial instruments, a new expected
credit loss model for calculating impairment
on financial assets and new general hedge
accounting requirements. It also carries forward
the guidance on recognition and derecognition of
financial instruments from LKAS 39.
On or after
1 January
2018 (early
adoption
permitted)
The Group has performed a high-level impact
assessment of all aspects of SLFRS 9. This
preliminary assessment is based on currently
available information and may be subjected to
changes arising from further detailed analysis
or additional reasonable and supportable
information being made available to the Group
in the future. Overall, the Group expects no
significant impact on its financial position and
equity.
SLFRS 15 - Revenue
from Contracts with
Customers
SLFRS 15 establishes a comprehensive
framework for determining whether, how much
and when revenue is recognised. It replaces
existing revenue recognition standard and
guidance, including LKAS 18 Revenue, LKAS 11
Construction Contracts and IFRIC 13 Customer
Loyalty Programmes
On or after
1 January
2018 (early
adoption
permitted)
The Group completed a diagnostic phase of
SLFRS 15 adaptation in 2016/17 financial year,
with the assistance of external consultants.
The Group's current study has not revealed a
significant change to the revenue recognition
patterns. However, the gaps identified will be
addressed during 2017/18 financial year, and any
impact to the current systems and processes will
be modified where necessary.
SLFRS 16 - Leases SLFRS 16 sets out the principles for the
recognition, measurement, presentation and
disclosure of leases and requires lessees to
account for all leases under a single on-balance
sheet model similar to the accounting for
finance leases under LKAS 17. The objective is to
ensure that lessees and lessors provide relevant
information in a manner that faithfully represents
those transactions. This information gives a basis
for the users of financial statements to assess the
effect that leases have on the financial position.
On or after
1 January
2019 (early
adoption
permitted)
The Group plans to assess the potential effect
of SLFRS 16 on its consolidated financial
statements in the financial year 2017/18.
IFRIC 15 -
Agreements for the
construction of real
estate (Deferring
Application)
This interpretation clarifies whether LKAS 18,
‘Revenue’ or LKAS 11 ‘Construction contracts’
should be applied to particular transactions. It
also explains the point at which revenue and
related expenses from a sale of real estate unit
should be recognised, if an agreement between
a developer and a buyer is reached before the
construction of the real estate unit is completed.
Deferred
application
until SLFRS
15 Revenue
from
Contracts
with
Customers
comes into
effect
Considering the latest developments in revenue
recognition (the "five-step model"), the Institute of
Chartered Accountants of Sri Lanka has decided
to grant an option for entities to defer application
of IFRIC 15 until SLFRS 15 Revenue from
Contracts with Customers comes into effect. The
Group has not adopted IFRIC 15 which is related
to recognition of revenue of construction of real
estate. The Group has deferred application of this
IFRIC based on the ruling issued by CA Sri Lanka.
The following amendments and improvements are not expected to have a significant impact on the Group's financial statements
• Accounting for Acquisitions of Interests in Joint Operations (Amendments to SLFRS11)
• Clarification of Acceptable Methods of Depreciation and Amortisation (Amendments to LKAS 16 and LKAS 38)
• Equity Method in Separate Financial Statements (Amendments to LKAS 27)
• Sale or Contribution of Assets between an Investor and its Associate or Joint Venture (Amendments to SLFRS 10 and LKAS 28)
• Annual Improvements to SLFRSs 2012–2014 Cycle – various standards
• Investment Entities: Applying the Consolidation Exception (Amendments to SLFRS 10, SLFRS 12 and LKAS 28)
• Disclosure Initiative (Amendments to LKAS 1)

194 John Keells Holdings PLC | Annual Report 2016/17
7.1. Business segments
Transportation Leisure Property
For the year ended 31 March 2017 2016 2017 2016 2017 2016
In LKR '000s
External revenue 11,109,677 10,342,226 25,873,790 24,072,746 1,121,204 4,341,714
Inter segment revenue 365,421 278,657 27,325 34,540 206,678 197,500
Total segment revenue 11,475,098 10,620,883 25,901,115 24,107,286 1,327,882 4,539,214
Elimination of inter segment revenue
Net revenue
Segment results 2,652,278 560,242 5,713,936 5,028,273 540,625 1,620,032
Finance cost (25,488) (21,813) (203,544) (165,587) (25,858) (32,162)
Finance income 117,449 90,903 458,531 309,305 93,077 172,055
Change in fair value of investment property - - - - 290,341 148,250
Share of results of equity accounted investees 2,274,792 1,868,769 53,473 52,110 - -
Eliminations / adjustments (1,920,821) (2,940) (301,526) (255,771) (233,629) (265,213)
Profit / (loss) before tax 3,098,210 2,495,161 5,720,870 4,968,330 664,556 1,642,962
Tax expense (119,057) (40,738) (713,304) (601,123) (41,058) (57,793)
Profit/ (loss) for the year 2,979,153 2,454,423 5,007,566 4,367,207 623,498 1,585,169
Purchase and construction of PPE* 95,716 95,190 1,275,820 2,757,569 36,369 43,055
Addition to IA* 9,176 2,398 - 103,373 2,240 1,386
Depreciation of PPE* 101,630 87,953 1,588,847 1,546,807 18,589 14,395
Amortisation of IA* 1,975 1,278 67,092 54,764 661 1,211
Amortisation of LRPA* - - 569,140 712,950 20,307 24,282
Gratuity provision and related costs 13,946 12,020 114,363 102,066 3,273 2,939
In addition to segment results, information such as finance costs / income, tax expenses have been allocated to segments for better presentation.
* PPE - Property, plant and equipment, IA - Intangible assets, LRPA - Lease rentals paid in advance
GROUP BUSINESS, OPERATIONS &
MANAGEMENT
7. Operating segment information
Accounting policy
The Group’s internal organisation and
management is structured based on
individual products and services which are
similar in nature and process and where the
risks and returns are similar. The operating
segments represent this business structure.
In addition, segments are determined
based on the Group’s geographical spread
of operations as well. The geographical
analysis of turnover and profits are based
on location of customers and assets
respectively.
Notes to the Financial Statements
The activities of each of the operating
business segments of the Group are detailed
in the Group directory in the Supplementary
section of the Annual report.
As such for management purposes, the
Group is organised into business units based
on their products and services and has seven
operating business segments as follows:
Transportation
Business of the transportation operating
segment offers an array of transportation
related services in Sri Lanka and the region
and these operations comprise of South Asia
Gateway Terminals (Pvt) Ltd in the port of
Colombo, a marine bunkering business, joint
ventures/associations with leading shipping
and air transportation multinationals and
logistics, travel and airline services in
Sri Lanka, India and the Maldives.
Leisure
The leisure operating segment encompasses
two five star city hotels and a three star city
hotel in Colombo and eight resort hotels
spread in prime tourist locations across Sri
Lanka and three resorts in Maldives offering
beaches, mountains, wildlife and cultural
splendour under the ‘Cinnamon Hotels
and Resorts’ brand. The leisure operating
segment also has destination management
businesses in Sri Lanka and India.

Group Highlights | Governance | Management Discussion & Analysis | Financial Statements | Supplementary Information 195
Property
The property operating segment
concentrates primarily on development and
sale of residential apartments.
Consumer Foods and Retail
The consumer foods and retail operating
segment competes in the two major
categories namely manufacturing and
retailing.
Financial Services
The financial services operating segment
offers a complete range of financial
solutions including commercial banking,
insurance, stock broking, debt trading, fund
management and leasing.
Information Technology
The information technology operating
segment comprises from BPO, software
services and information integration to
office automation which offers end-to-end
ICT services and solutions.
Others
This operating segment includes plantation
services sector which operates tea
factories, tea and rubber broking and pre-
auction produce warehousing. This segment
also consists of John Keells Holdings PLC
including its divisions / centre functions
such as John Keells Capital and Strategic
Group IT (SGIT), as well as other companies
providing ancillary services.
Segment information has been prepared
in conformity with the accounting policies
adopted for preparing and presenting the
consolidated financial statements of the
Group.
No operating segments have been
aggregated to form the reportable operating
segments. An individual segment manager
is determined for each operating segment
and the results are regularly reviewed
by the Board of Directors. The Board of
Directors monitors the operating results
of its business units separately for the
purpose of making decisions about resource
allocation and performance assessment.
Segment performance is evaluated based
on operating profit or loss which in certain
respects, as explained in the operating
segments’ information, is measured
differently from operating profit or loss in the
consolidated financial statements. However,
except the Financial Services segment, other
segments’ financing activities are managed
on a Group basis and are not allocated
to operating segments. Transfer prices
between operating segments are carried out
in the ordinary course of business on arm’s
length basis.
Consumer Foods & Retail Financial Services Information Technology Others Group Total
2017 2016 2017 2016 2017 2016 2017 2016 2017 2016
45,812,242 36,886,260 8,296,409 7,142,880 11,107,277 8,261,542 2,952,502 2,662,586 106,273,101 93,709,954
363,698 290,419 110 1 221,044 193,315 767,899 700,966 1,952,175 1,695,398
46,175,940 37,176,679 8,296,519 7,142,881 11,328,321 8,454,857 3,720,401 3,363,552 108,225,276 95,405,352
(1,952,175) (1,695,398)
106,273,101 93,709,954
5,146,899 4,322,498 935,269 717,323 (571,917) (334,221) (2,078,119) (1,681,060) 12,338,971 10,233,087
(19,318) (25,026) (194) (193) (9,770) (12,657) (135,060) (134,283) (419,232) (391,721)
251,544 159,956 187,201 121,088 49,434 43,588 5,559,911 4,652,409 6,717,147 5,549,304
92,005 16,947 - - - - 101,208 97,678 483,554 262,875
- 974,690 860,354 - - - - 3,302,955 2,781,233
(4,720) (1,925) - - 1,143,772 451,588 1,781,362 837,714 464,438 763,453
5,466,410 4,472,450 2,096,966 1,698,572 611,519 148,298 5,229,302 3,772,458 22,887,833 19,198,231
(1,570,344) (1,243,488) (55,140) 19,264 (143,373) (52,572) (2,128,792) (1,429,916) (4,771,068) (3,406,366)
3,896,066 3,228,962 2,041,826 1,717,836 468,146 95,726 3,100,510 2,342,542 18,116,765 15,791,865
2,682,990 1,454,411 67,965 25,470 139,532 113,369 33,190 93,000 4,331,582 4,582,064
18,471 1,929 62,807 29,239 14,957 20,088 6,747 4,195 114,398 162,608
830,197 736,013 80,210 89,363 122,090 179,518 132,508 128,266 2,874,071 2,782,315
11,789 11,892 220,609 217,437 11,153 10,323 19,767 23,659 333,046 320,564
2,361 - - - - - 1,175 1,175 592,983 738,407
91,621 73,365 24,678 24,110 20,138 18,594 59,614 50,806 327,633 283,900

196 John Keells Holdings PLC | Annual Report 2016/17
7. Operating segment information (Contd.)
7.2. Business segments
Transportation Leisure Property
As at 31 March 2017 2016 2017 2016 2017 2016
In LKR '000s
Property, plant and equipment 500,463 477,027 43,251,774 34,059,483 2,318,107 2,308,494
Lease rentals paid in advance - - 11,495,184 9,330,503 245,301 248,040
Investment property 487,000 425,000 2,148,400 1,905,000 5,230,949 4,853,668
Intangible assets 14,072 6,871 374,191 441,284 2,963 363
Non-current financial assets 74,073 48,539 5,710,380 5,507,782 432,679 224,930
Other non-current assets 11,163 5,892 25,343 14,673 41,379,103 35,451,293
Segment non-current assets 1,086,771 963,329 63,005,272 51,258,725 49,609,102 43,086,788
Investments in equity accounted investees 11,118,544 11,263,337 512,143 474,364 - -
Deferred tax assets
Goodwill
Eliminations / adjustments
Total non-current assets
Inventories 522,461 161,484 337,494 307,040 15,255 294,659
Trade and other receivables 1,685,506 1,028,910 3,474,959 3,144,535 941,864 1,435,139
Short term investments 2,053,279 1,943,880 8,188,744 5,734,333 987,176 339,545
Cash in hand and at bank 290,699 741,739 2,198,542 2,310,577 973,122 1,046,241
Segment current assets 4,551,945 3,876,013 14,199,739 11,496,485 2,917,417 3,115,584
Other current assets
Eliminations / adjustments
Total current assets
Total assets
Insurance contract liabilities - - - - - -
Interest-bearing loans and borrowings - - 6,650,926 7,376,034 12,548,001 11,360,684
Employee benefit liabilities 84,859 73,018 638,131 562,241 29,435 44,788
Other deferred liabilities 1,640 - 120,007 84,401 558,435 560,220
Other non-current liabilities 10,267 - - 78,418 3,730,151 2,884,834
Segment non-current liabilities 96,766 73,018 7,409,064 8,101,094 16,866,022 14,850,526
Deferred tax liabilities
Eliminations / adjustments
Total non-current liabilities
Trade and other payables 847,988 1,198,528 2,074,128 3,341,897 1,382,676 1,604,938
Short term borrowings 1,389,643 830,648 3,487,404 2,051,370 - -
Interest-bearing loans and borrowings - - 2,662,075 1,208,978 181,645 145,778
Bank overdrafts 374,011 56,533 1,847,574 1,217,688 709,561 843,340
Segment current liabilities 2,611,642 2,085,709 10,071,181 7,819,933 2,273,882 2,594,056
Income tax liabilities
Other current liabilities
Eliminations / adjustments
Total current liabilities
Total liabilities
Total segment assets 5,638,716 4,839,342 77,205,011 62,755,210 52,526,519 46,202,372
Total segment liabilities 2,708,408 2,158,727 17,480,245 15,921,027 19,139,904 17,444,582
Notes to the Financial Statements

Group Highlights | Governance | Management Discussion & Analysis | Financial Statements | Supplementary Information 197
Consumer Foods & Retail Financial Services Information Technology Others Group Total
2017 2016 2017 2016 2017 2016 2017 2016 2017 2016
9,290,844 7,283,463 1,498,964 1,514,336 260,153 246,979 1,287,795 1,317,211 58,408,100 47,206,993
174,701 - - - - - 40,679 41,854 11,955,865 9,620,397
207,042 111,404 - - - - 3,434,063 3,215,185 11,507,454 10,510,257
37,685 80,504 891,546 999,848 28,305 25,553 30,802 44,841 1,379,564 1,599,264
226,097 165,973 23,645,619 21,441,579 57,131 30,666 2,827,038 546,718 32,973,017 27,966,187
553,357 376,324 51,378 51,369 15,994 5,496 21,603 17,727 42,057,941 35,922,774
10,489,726 8,017,668 26,087,507 24,007,132 361,583 308,694 7,641,980 5,183,536 158,281,941 132,825,872
- - 6,088,200 5,211,763 - - - - 17,718,887 16,949,464
143,548 129,837
738,596 738,596
(4,574,829) (4,531,077)
172,308,143 146,112,692
3,840,380 2,996,410 14,966 8,672 676,063 701,831 217,483 208,408 5,624,102 4,678,504
2,720,088 2,268,819 1,415,290 731,550 1,938,636 2,044,672 1,084,448 1,012,242 13,260,791 11,665,867
553,219 2,350,084 9,318,833 6,496,141 994,577 726,511 60,565,974 57,095,945 82,661,802 74,686,439
232,360 241,991 336,648 272,029 580,119 235,716 456,679 276,798 5,068,169 5,125,091
7,346,047 7,857,304 11,085,737 7,508,392 4,189,395 3,708,730 62,324,584 58,593,393 106,614,864 96,155,901
3,265,327 2,303,431
(4,916,572) (3,596,555)
104,963,619 94,862,777
277,271,762 240,975,469
- - 31,700,278 27,205,282 - - - - 31,700,278 27,205,282
289,896 98,793 - - - 9,621 12,000 192,458 19,500,823 19,037,590
549,079 463,598 138,656 129,058 106,889 91,931 333,238 296,246 1,880,287 1,660,880
55,490 26,336 - - - - 103,991 191,516 839,563 862,473
193,464 131,929 - - - - - - 3,933,882 3,095,181
1,087,929 720,656 31,838,934 27,334,340 106,889 101,552 449,229 680,220 57,854,833 51,861,406
2,336,241 2,029,371
(5,298,859) (5,331,413)
54,892,215 48,559,364
5,293,347 4,503,394 1,955,235 1,254,729 1,994,141 1,694,604 768,391 734,477 14,315,906 14,332,567
- - - - - - 12,074 12,074 4,889,121 2,894,092
65,000 119,073 - - 10,134 35,244 - 1,482,508 2,918,854 2,991,581
766,477 594,225 137,849 105,834 338,122 293,649 90,515 118,912 4,264,109 3,230,181
6,124,824 5,216,692 2,093,084 1,360,563 2,342,397 2,023,497 870,980 2,347,971 26,387,990 23,448,421
2,395,379 1,873,472
2,944,118 2,234,856
(3,678,315) (3,620,966)
28,049,172 23,935,783
82,941,387 72,495,147
17,835,773 15,874,972 37,173,244 31,515,524 4,550,978 4,017,424 69,966,564 63,776,929 264,896,805 228,981,773
7,212,753 5,937,348 33,932,018 28,694,903 2,449,286 2,125,049 1,320,209 3,028,191 84,242,823 75,309,827
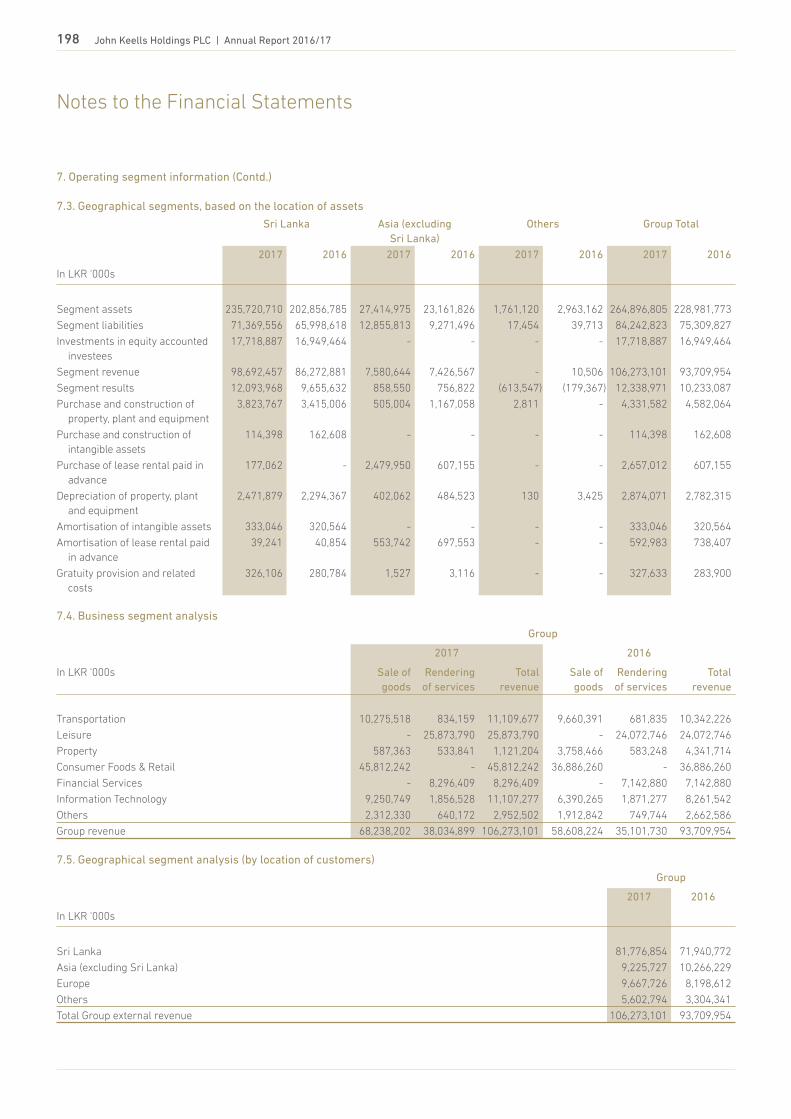
198 John Keells Holdings PLC | Annual Report 2016/17
Notes to the Financial Statements
7. Operating segment information (Contd.)
7.3. Geographical segments, based on the location of assets
Sri Lanka Asia (excluding
Sri Lanka)
Others Group Total
2017 2016 2017 2016 2017 2016 2017 2016
In LKR '000s
Segment assets 235,720,710 202,856,785 27,414,975 23,161,826 1,761,120 2,963,162 264,896,805 228,981,773
Segment liabilities 71,369,556 65,998,618 12,855,813 9,271,496 17,454 39,713 84,242,823 75,309,827
Investments in equity accounted
investees
17,718,887 16,949,464 - - - - 17,718,887 16,949,464
Segment revenue 98,692,457 86,272,881 7,580,644 7,426,567 - 10,506 106,273,101 93,709,954
Segment results 12,093,968 9,655,632 858,550 756,822 (613,547) (179,367) 12,338,971 10,233,087
Purchase and construction of
property, plant and equipment
3,823,767 3,415,006 505,004 1,167,058 2,811 - 4,331,582 4,582,064
Purchase and construction of
intangible assets
114,398 162,608 - - - - 114,398 162,608
Purchase of lease rental paid in
advance
177,062 - 2,479,950 607,155 - - 2,657,012 607,155
Depreciation of property, plant
and equipment
2,471,879 2,294,367 402,062 484,523 130 3,425 2,874,071 2,782,315
Amortisation of intangible assets 333,046 320,564 - - - - 333,046 320,564
Amortisation of lease rental paid
in advance
39,241 40,854 553,742 697,553 - - 592,983 738,407
Gratuity provision and related
costs
326,106 280,784 1,527 3,116 - - 327,633 283,900
7.4. Business segment analysis
Group
2017 2016
In LKR '000s Sale of
goods
Rendering
of services
Total
revenue
Sale of
goods
Rendering
of services
Total
revenue
Transportation 10,275,518 834,159 11,109,677 9,660,391 681,835 10,342,226
Leisure - 25,873,790 25,873,790 - 24,072,746 24,072,746
Property 587,363 533,841 1,121,204 3,758,466 583,248 4,341,714
Consumer Foods & Retail 45,812,242 - 45,812,242 36,886,260 - 36,886,260
Financial Services - 8,296,409 8,296,409 - 7,142,880 7,142,880
Information Technology 9,250,749 1,856,528 11,107,277 6,390,265 1,871,277 8,261,542
Others 2,312,330 640,172 2,952,502 1,912,842 749,744 2,662,586
Group revenue 68,238,202 38,034,899 106,273,101 58,608,224 35,101,730 93,709,954
7.5. Geographical segment analysis (by location of customers)
Group
2017 2016
In LKR '000s
Sri Lanka 81,776,854 71,940,772
Asia (excluding Sri Lanka) 9,225,727 10,266,229
Europe 9,667,726 8,198,612
Others 5,602,794 3,304,341
Total Group external revenue 106,273,101 93,709,954

Group Highlights | Governance | Management Discussion & Analysis | Financial Statements | Supplementary Information 199
8. Basis of consolidation and material
partly owned subsidiaries
Accounting policy
Basis of consolidation
The consolidated financial statements are
comprised of the financial statements of the
Company and its subsidiaries as at the end
of reporting period. Control over an investee
is achieved when the Group is exposed,
or has rights, to variable returns from its
involvement with the investee and has the
ability to affect those returns through its
power over the investee.
Control over an investee
Specifically, the Group controls an investee if,
and only if, the Group has:
• Power over the investee (i.e., existing rights
that give it the current ability to direct the
relevant activities of the investee)
• Exposure, or rights, to variable returns
from its involvement with the investee
• The ability to use its power over the
investee to affect its returns
Consolidation of entities in which the Group
holds less than a majority of voting rights
When the Group has less than a majority of
the voting or similar rights of an investee,
the Group considers all relevant facts and
circumstances in assessing whether it has
power over an investee, including:
• The contractual arrangement with the
other vote holders of the investee;
• Rights arising from other contractual
arrangements and;
• The Group’s voting rights and potential
voting rights
Subsidiaries that are consolidated have
been listed in the Group directory under
Supplementary section of the annual report.
The following companies, with equity
control equal to or less than 50%, have been
consolidated as subsidiaries based on above
criteria.
%
Holding
Rajawella Holdings Ltd. 49.85
Trans-ware Logistics (Pvt) Ltd. 50.00
Mack Air Services Maldives (Pte)
Ltd.
49.00
Tea Smallholder Factories PLC. 37.62
The Group re-assesses whether or
not it controls an investee, if facts and
circumstances indicate that there are
changes to one or more of the three
elements of control. Consolidation of a
subsidiary begins when the Group obtains
control over the subsidiary and ceases when
the Group loses control of the subsidiary.
Assets, liabilities, income and expenses of
a subsidiary acquired or disposed of during
the year are included in the consolidated
financial statements from the date the Group
gains control until the date the Group ceases
to control the subsidiary.
Profit or loss and each component of other
comprehensive income (OCI) are attributed
to the equity holders of the parent of the
Group and to the non-controlling interests,
even if this results in the non-controlling
interests having a deficit balance. The
financial statements of the subsidiaries
are prepared for the same reporting
period as the parent Company, which is
12 months ending 31 March, using consistent
accounting policies.
Transactions eliminated on consolidation
All intra-group assets, liabilities, equity,
income, expenses and cash flows relating
to transactions between members of the
Group are eliminated in full on consolidation.
A change in the ownership interest of a
subsidiary, without a loss of control, is
accounted for as an equity transaction.
Loss of control
If the Group loses control over a subsidiary,
it derecognises the related assets (including
goodwill), liabilities, non-controlling interest
and other components of equity while any
resultant gain or loss is recognised in the
income statement. Any investment retained
is recognised at fair value.
The total profits and losses for the year of the
Company and of its subsidiaries included in
consolidation are shown in the consolidated
income statement and consolidated
statement of comprehensive income and all
assets and liabilities of the Company and
of its subsidiaries included in consolidation
are shown in the consolidated statement of
financial position.
Non-controlling interest (NCI)
Non-controlling interest which represents the
portion of profit or loss and net assets not held
by the Group, are shown as a component of
profit for the year in the consolidated income
statement and statement of comprehensive
income and as a component of equity in the
consolidated statement of financial position,
separately from equity attributable to the
shareholders of the parent.
8.1. Material partly-owned subsidiaries
Financial information of subsidiaries that have material non-controlling interests (NCI) are provided below.
Leisure Consumer Foods & Retail
For the year ended 31 March 2017 2016 2017 2016
In LKR '000s
Summarised Income Statement for the period ending 31 March
Revenue 28,134,885 26,829,126 46,834,239 37,366,674
Operating cost (20,438,667) (20,789,711) (40,941,279) (33,046,101)
Finance cost (367,870) (307,424) (19,318) (25,026)
Finance income 622,856 451,141 251,544 159,956
Change in fair value of investment property 243,400 126,100 92,005 16,947
Profit before tax 8,194,604 6,309,232 6,217,191 4,472,450
Tax expense (715,716) (603,455) (1,570,344) (1,243,488)
Profit for the year 7,478,888 5,705,777 4,646,847 3,228,962
Other comprehensive income 9,968,550 690,444 209,357 70,066
Total comprehensive income 17,447,438 6,396,221 4,856,204 3,299,028
Profit/(loss) allocated to material NCI 842,273 682,783 730,983 574,321
Dividend paid to NCI 1,016,875 906,513 717,319 400,602
The above information is based on amounts before inter-company eliminations

200 John Keells Holdings PLC | Annual Report 2016/17
Notes to the Financial Statements
8. Basis of consolidation and material partly owned subsidiaries (Contd.)
8.1. Material partly-owned subsidiaries (Contd.)
Leisure Consumer foods & retail
For the year ended 31 March 2017 2016 2017 2016
In LKR '000s
Summarised statement of Financial Position as at 31 March
Current assets 15,147,953 11,368,244 8,033,574 8,098,607
Non-current assets 79,431 66,812,284 17,620,783 14,829,369
Total assets 15,227,384 78,180,528 25,654,357 22,927,976
Current liabilities 11,472,392 8,360,308 7,822,565 6,570,597
Non-current liabilities 8,055,181 8,586,091 2,275,496 1,656,754
Total liabilities 19,527,573 16,946,399 10,098,061 8,227,351
Accumulated balances of material NCI 12,680,462 11,022,992 2,351,519 2,287,966
Summarised cash flow information for year ended 31 March
Cash flows from operating activities 12,072,010 5,750,329 4,977,847 5,175,631
Cash flows from/(used in) investing activities (2,900,274) (2,154,749) (3,066,146) (1,415,285)
Cash flows from/(used in) financing activities (5,534,896) (4,067,811) (3,891,090) (2,465,962)
Net increase / (decrease) in cash and cash equivalents 3,636,840 (472,231) (1,979,389) 1,294,384
The above information is based on amounts before inter-company eliminations
Names of material partly-owned
subsidiaries and effective holding
percentage owned by non-controling
interest:
Leisure
Ahungalle Holiday Resorts (Pvt) Ltd. -
19.68% (2016 - 19.68%)
Asian Hotels & Properties PLC. - 21.44%
(2016 - 21.44%)
Beruwala Holiday Resorts (Pvt) Ltd. - 20.22%
(2016 - 20.22%)
Ceylon Holiday Resorts Ltd. - 20.76%
(2016 - 20.76%)
Cinnamon Holidays (Pvt) Ltd. - 19.68%
(2016 - 19.68%)
Fantasea World Investments (Pte) Ltd. -
19.68% (2016 - 19.68%)
Habarana Lodge Ltd. - 21.01%
(2016 - 21.01%)
Habarana Walk Inn Ltd. - 20.66%
(2016 - 20.66%)
Hikkaduwa Holiday Resorts (Pvt) Ltd. -
20.76% (2016 - 20.76%)
International Tourists and Hoteliers Ltd. -
20.22% (2016-20.22%)
John Keells Hotels PLC. - 19.68%
(2016 - 19.68%)
John Keells Maldivian Resorts (Pte) Ltd. -
19.68% (2016 - 19.68%)
Kandy Walk Inn Ltd. - 20.97%
(2016 - 20.97%)
Nuwara Eliya Holiday Resorts (Pvt) Ltd. -
19.68% (2016 - 19.68%)
Rajawella Hotels Company Ltd. - 19.68%
(2016 - 19.68%)
Resort Hotels Ltd. - 20.76% (2016 - 20.75%)
Serene Holidays (Pvt) Ltd. - 1.26%
(2016 - 1.26%)
Tranquility (Pte) Ltd. - 19.68% (2016 - 19.68%)
Trinco Walk Inn Ltd. - 19.68%c (2016 - 19.68%)
Trans Asia Hotels PLC. - 17.26% (2016 - 17.26%)
Travel Club (Pte) Ltd. - 19.68% (2016 - 19.68%)
Trinco Holiday Resorts (Pvt) Ltd. - 19.68%
(2016 - 19.68%)
Walkers Tours Ltd. - 1.49% (2016 - 1.49%)
Wirawila Walk Inn Ltd. - 19.68% (2016 - 19.68%)
Yala Village (Pvt) Ltd. - 24.67% (2016 - 24.67%)
Consumer Foods & Retail
Ceylon Cold Stores PLC. - 18.64%
(2016 - 18.64%)
JayKay Marketing Services (Pvt) Ltd. - 18.64%
(2016 - 18.64%)
Keells Food Products PLC. - 11.47%
(2016 - 10.35%)
The Colombo Ice Company (Pvt) Ltd. - 18.64%
(2016 - N/A)
Accounting judgements,estimates and
assumptions
Consolidation of entities in which the Group
holds less than a majority of voting right
(de facto control)
The Group considers that it controls some
subsidiaries even though it owns less than
50% of the voting rights. This is because the
Group is the single largest shareholder of
those subsidiaries with equity interest. The
remaining equity shares in those subsidiaries
are widely held by many other shareholders,
and there is no history of the other
shareholders collaborating to exercise their
votes collectively or to outvote the Group.
Considering the Group balances, none of the
individual partly-owned subsidiaries have
material non-controlling interest. However,
the above information has been presented
on the aggregated interests in similar entities
namely, the Leisure and Consumer Foods and
Retail (CF&R) segment, based on the nature
and risks of the products and services.
9. Business combinations and
acquisitions of non-controlling interests
Accounting policy
Business combinations & goodwill
Business combinations are accounted for
using the acquisition method of accounting.
The Group measures goodwill at the
acquisition date as the fair value of the
consideration transferred including the
recognised amount of any non-controlling
interests in the acquiree, less the net
recognised amount (generally fair value)
of the identifiable assets acquired and
liabilities assumed, all measured as of the
acquisition date.

Group Highlights | Governance | Management Discussion & Analysis | Financial Statements | Supplementary Information 201
When the fair value of the consideration
transferred including the recognised amount
of any non-controlling interests in the acquiree
is lower than the fair value of net assets
acquired, a gain is recognised immediately
in the income statement. The Group elects on
a transaction-by-transaction basis whether
to measure non-controlling interests at fair
value, or at their proportionate share of the
recognised amount of the identifiable net
assets, at the acquisition date. Transaction
costs, other than those associated with the
issue of debt or equity securities, that the
Group incurs in connection with a business
combination are expensed as incurred. When
the Group acquires a business, it assesses
the financial assets and liabilities assumed
for appropriate classification and designation
in accordance with the contractual terms,
economic circumstances and pertinent
conditions as at the acquisition date. If
the business combination is achieved in
stages, the acquisition date fair value of the
acquirer’s previously held equity interest in
the acquiree is remeasured to fair value at
the acquisition date through profit or loss. Any
contingent consideration to be transferred by
the acquirer will be recognised at fair value at
the acquisition date. Contingent consideration
which is deemed to be an asset or liability,
which is a financial instrument and within
the scope of LKAS 39, is measured at fair
value with changes in fair value either in the
income statement or as a change to other
comprehensive income. If the contingent
consideration is classified as equity, it will not
be remeasured. Subsequent settlement is
accounted within equity. In instances where
the contingent consideration does not fall
within the scope of LKAS 39, it is measured
in accordance with the appropriate SLFRS/
LKAS.
After initial recognition, goodwill is
measured at cost less any accumulated
impairment losses. Goodwill is reviewed for
impairment, annually or more frequently if
events or changes in circumstances indicate
that the carrying value may be impaired.
For the purpose of impairment testing,
goodwill acquired in a business combination
is, from the acquisition date, allocated
to each of the Group’s cash generating
units that are expected to benefit from the
combination, irrespective of whether other
assets or liabilities of the acquiree are
assigned to those units.
Impairment is determined by assessing the
recoverable amount of the cash-generating
unit to which the goodwill relates. Where the
recoverable amount of the cash generating
unit is less than the carrying amount, an
impairment loss is recognised. The impairment
loss is allocated first to reduce the carrying
amount of any goodwill allocated to the unit
and then to the other assets pro-rata to the
carrying amount of each asset in the unit.
Goodwill and fair value adjustments arising
on the acquisition of a foreign operation are
treated as assets and liabilities of the foreign
operation and translated at the closing rate.
Where goodwill forms part of a cash-
generating unit and part of the operation
within that unit is disposed of, the goodwill
associated with the operation disposed of
is included in the carrying amount of the
operation when determining the gain or
loss on disposal of the operation, goodwill
disposed in this circumstance is measured
based on the relative values of the operation
disposed of and the portion of the cash-
generating unit retained.
Impairment of goodwill
Goodwill is tested for impairment annually
(as at 31 March) and when circumstances
indicate that the carrying value may be
impaired. Impairment is determined for
goodwill by assessing the recoverable
amount of each cash-generating unit (or
group of cash-generating units) to which
the goodwill relates. Where the recoverable
amount of the cash generating unit is less
than their carrying amount, an impairment
loss is recognised. Impairment losses
relating to goodwill cannot be reversed in
future periods.
9.1. Investment in 2016/17
Waterfront Properties (Pvt) Ltd.
John Keells Holdings PLC. (JKH) further
invested LKR 4,341 mn in Waterfront
Properties (Pvt) Ltd. a subsidiary of JKH
involving the developing, owning, managing,
operating, selling, leasing and renting of a
luxury multi/mixed use Integrated Resort.
The Colombo Ice Company (Pvt) Ltd.
Ceylon Cold Stores PLC, invested LKR 270
million in The Colombo Ice Company (Pvt)
Ltd a subsidiary of the Group, entered in to
an agreement with the Board of Investment
of Sri Lanka (BOI) for the establishment of an
Ice Cream factory.
9.2. Acquisitions in 2015/16
Rajewella Holdings Ltd.
In September 2015, the Group has increased
its shareholdings in Rajawella Holdings Ltd.
(RHL) from 16.9% to 49.85% with a total
investment of LKR 1,044 mn over a three
year period. Total investment comprises a
partial buyout from existing shareholders, an
infusion into RHL and release of an existing
sublease of land held by the Group.
The fair value of net assets acquired of
Rajewella Holdings Ltd. were as follows;
In LKR '000s
Fair value recognised
on acquisition
ASSETS
Cash 145,588
Inventories 10,675
Trade and other receivables 38,767
Other current assets 3,498
Intangible assets 484
Lease rentals paid in advance* 1,507,818
Property, plant and equipment 460,706
LIABILITIES
Bank overdrafts (43,501)
Deferred tax liabilities (954)
Other deferred liabilities (564,181)
Employee benefit liabilities (8,435)
Other current liabilities (14,125)
Trade and other payables (145,045)
Total identifiable net assets at fair value 1,391,295
Non-controlling interest measured at fair value (971,141)
Gain on bargain purchase of a subsidiary (4,088)
Total purchase consideration 416,066
Deferred purchase consideration (301,065)
Bank overdrafts acquired (102,087)
Net cash outflow on acquisition of the subsidiary 12,914
* This represents the fair value on the date of acquisition of the leasehold land right held by
Rajawella Holdings Ltd. The fair value has been determined by an external independent
chartered valuer.

202 John Keells Holdings PLC | Annual Report 2016/17
2017
As at 31 March
In LKR '000s
Notes Non
current
financial
assets
Cash in
hand and
at bank
Trade and
other
receivables
Short term
invest-
ments
Amounts
due from
related
parties
Total % of
allocation
Group
Government securities 10.1.2 17,750,289 - - 24,450,907 - 42,201,196 35%
Corporate debt securities 10.1.3 4,244,764 - - 1,436,526 - 5,681,290 5%
Deposits with bank 10.1.4 3,276,582 - - 49,853,042 - 53,129,624 44%
Loans to executives 10.1.5 733,037 - 184,626 - - 917,663 1%
Loans to life policyholders 10.1.6 902,300 - - - - 902,300 1%
Preference shares 10.1.7 267,275 - - - - 267,275 0%
Interest rate swap 10.1.8 331,679 - - - - 331,679 1%
Trade and other receivables 10.1.9 - - 11,034,918 - - 11,034,918 9%
Reinsurance receivables 10.1.10 - - 214,342 - - 214,342 0%
Premium receivable 10.1.11 - - 253,543 - - 253,543 0%
Amounts due from related parties 10.1.12 - - - - 111,639 111,639 0%
Cash in hand and at bank 10.1.13 - 5,119,185 - - - 5,119,185 4%
Total credit risk exposure 27,505,926 5,119,185 11,687,429 75,740,475 111,639 120,164,654 100%
Financial assets at fair value through P&L 10.3.3.1 - - - 3,433,852 -
Available-for-sale investments 10.3.3.2 160,695 - - - -
Total equity risk exposure 160,695 - - 3,433,852 -
Total 27,666,621 5,119,185 11,687,429 79,174,327 111,639
Notes to the Financial Statements
9. Business combinations and acquisitions
of non-controlling interests (Contd.)
9.3. Investment in 2015/16
Waterfront Properties (Pvt) Ltd.
John Keells Holdings PLC. (JKH) further
invested in LKR 4,732 mn in Waterfront
Properties (Pvt) Ltd. a subsidiary of JKH
involving the developing, owning, managing,
operating, selling, leasing and renting of a
luxury multi/mixed use Integrated Resort.
10. Financial risk management
objectives and policies
The Group has loans and other receivables,
trade and other receivables and cash and
short-term deposits that arise directly from
its operations. The Group also holds other
financial instruments such as available for
sale and fair value through profit or loss
financial instruments and may enter into
derivative transactions. The Group’s principal
financial liabilities, comprise of loans and
borrowings, trade and other payables and
financial guarantee contracts. The main
purpose of these financial liabilities is
to finance the Group’s operations and to
provide guarantees to support its operations.
The financial risk governance framework
provides assurance to the Group’s senior
management that the Group’s financial
risk activities are governed by appropriate
policies and procedures and that financial
risks are identified, measured and managed
in accordance with the Group’s policies and
risk objectives. The Group is exposed to
market risk, credit risk and liquidity risk.
10.1. Credit risk
Credit risk is the risk that a counterparty will
not meet its obligations under a financial
instrument or customer contract, leading to a
financial loss. The Group is exposed to credit
risk from its operating activities (primarily
trade receivables) and from its financing
activities, including deposits with banks
and financial institutions, foreign exchange
transactions and other financial instruments.
The Group trades only with recognised,
creditworthy third parties. It is the Group’s
policy that all clients who wish to trade on
credit terms are subject to credit verification
procedures. In addition, receivable balances
are monitored on an ongoing basis with the
result that the Group’s exposure to bad debts
is not significant.
With respect to credit risk arising from the
other financial assets of the Group, such as
cash and cash equivalents, available-for-
sale financial investments, investments, and
certain derivative instruments, the Group’s
exposure to credit risk arises from default
of the counterparty. The Group manages
its operations to avoid any excessive
concentration of counterparty risk and the
Group takes all reasonable steps to ensure
the counterparties fulfill their obligations.
10.1.1. Risk exposure
The maximum risk positions of financial
assets which are generally subject to credit
risk are equal to their carrying amounts
(without consideration of collateral, if
available). Following table shows the
maximum risk positions.

Group Highlights | Governance | Management Discussion & Analysis | Financial Statements | Supplementary Information 203
2017
As at 31 March
In LKR '000s
Notes Non
current
financial
assets
Cash in
hand and
at bank
Trade and
other
receivables
Short term
invest-
ments
Amounts
due from
related
parties
Total % of
allocation
Company
Government securities 10.1.2 - - - 16,690,302 - 16,690,302 26%
Corporate debt securities 10.1.3 - - - 268,306 - 268,306 0%
Deposits with bank 10.1.4 2,576,339 - - 43,284,672 - 45,861,011 72%
Loans to executives 10.1.5 71,669 - 18,652 - - 90,321 0%
Trade and other receivables 10.1.9 - - 99,424 - - 99,424 0%
Amounts due from related parties 10.1.12 - - - - 286,735 286,735 1%
Cash in hand and at bank 10.1.13 - 304,265 - - - 304,265 1%
Total credit risk exposure 2,648,008 304,265 118,076 60,243,280 286,735 63,600,364 100%
Available-for-sale investments 10.3.3.2 141,972 - - - -
Total equity risk exposure 141,972 - - - -
Total 2,789,980 304,265 118,076 60,243,280 286,735
2016
As at 31 March
In LKR '000s
Notes Non
current
financial
assets
Cash in
hand and
at bank
Trade and
other
receivables
Short term
invest-
ments
Amounts
due from
related
parties
Total % of
allocation
Group
Government securities 10.1.2 15,287,098 - - 26,149,799 - 41,436,897 39%
Corporate debt securities 10.1.3 4,939,118 - - 856,498 - 5,795,616 5%
Deposits with bank 10.1.4 568,198 - - 42,621,898 - 43,190,096 40%
Loans to executives 10.1.5 618,850 - 167,940 - - 786,790 1%
Loans to life policyholders 10.1.6 783,373 - - - - 783,373 1%
Preference shares 10.1.7 254,024 - - - - 254,024 0%
Trade and other receivables 10.1.9 - - 9,482,865 - - 9,482,865 9%
Reinsurance receivables 10.1.10 - - 132,298 - - 132,298 0%
Premium receivable 10.1.11 - - 215,846 - - 215,846 0%
Amounts due from related parties 10.1.12 - - - - 133,031 133,031 0%
Cash in hand and at bank 10.1.13 - 5,127,463 - - - 5,127,463 5%
Total credit risk exposure 22,450,661 5,127,463 9,998,949 69,628,195 133,031 107,338,299 100%
Financial assets at fair value through P&L 10.3.3.1 - - - 3,006,875 -
Available-for-sale investments 10.3.3.2 184,783 - - - -
Total equity risk exposure 184,783 - - 3,006,875 -
Total 22,635,444 5,127,463 9,998,949 72,635,070 133,031

204 John Keells Holdings PLC | Annual Report 2016/17
10.1.2. Government securities
As at 31 March 2017 government securities comprise 35% (2016-39%) and 26% (2016-31%) for the Group and Company respectively, which
consist of treasury bonds, bills and reverse repo investments. Government securities are usually referred to as risk free due to the sovereign
nature of the instrument.
10.1.3. Corporate debt securities
As at 31 March 2017, corporate debt securities comprise 5% (2016-5%) of the total investments in debt securities, out of which 92% (2016 – 94%)
were rated “A” or better, or guaranteed by a banking institution with a rating of “A” or better.
Group
As at 31 March 2017 2016
Fitch ratings
In
LKR ’000s
Rating
% of total
In
LKR ’000s
Rating
% of total
AA+ 812,063 14% 615,672 11%
AA 25,572 0% 77,505 1%
AA- 1,887,448 35% 2,988,097 52%
A+ 1,699,653 30% 1,132,347 20%
A 751,104 13% 562,794 10%
A- 422,857 7% 398,424 6%
BBB+ 82,593 1% 20,777 0%
Total 5,681,290 100% 5,795,616 100%
Notes to the Financial Statements
10 Financial risk management objectives and policies (Contd.)
10.1.1. Risk exposure (Contd.)
2016
As at 31 March
In LKR '000s
Notes Non
current
financial
assets
Cash in
hand and
at bank
Trade and
other
receivables
Short term
invest-
ments
Amounts
due from
related
parties
Total % of
allocation
Company
Government securities 10.1.2 - - - 18,066,890 - 18,066,890 31%
Corporate debt securities 10.1.3 268,366 - - - - 268,366 1%
Deposits with bank 10.1.4 - - - 38,795,346 - 38,795,346 67%
Loans to executives 10.1.5 72,980 - 19,823 - - 92,803 0%
Trade and other receivables 10.1.9 - - 149,321 - - 149,321 0%
Amounts due from related parties 10.1.12 - - - - 595,182 595,182 1%
Cash in hand and at bank 10.1.13 - 178,193 - - - 178,193 0%
Total credit risk exposure 341,346 178,193 169,144 56,862,236 595,182 58,146,101 100%
Available-for-sale investments 10.3.3.2 166,059 - - - -
Total equity risk exposure 166,059 - - - -
Total 507,405 178,193 169,144 56,862,236 595,182

Group Highlights | Governance | Management Discussion & Analysis | Financial Statements | Supplementary Information 205
10.1.4 Deposits with bank
Deposits with bank mainly consist of fixed and call deposits.
As at 31 March 2017, fixed and call deposits comprise 92% (2016- 93%) and 95% (2016- 93%) for the Group and Company respectively were
rated “A+” or better.
Group Company
As at 31 March 2017 2016 2017 2016
Fitch ratings*
In
LKR ’000s
Rating %
of total
In
LKR ’000s
Rating %
of total
In
LKR ’000s
Rating %
of total
In
LKR ’000s
Rating %
of total
AAA 98,936 0% 1,003,763 2% 889,560 2% 870,038 2%
AA+ 17,584,755 33% 10,200,822 24% 16,964,101 37% 9,382,100 24%
AA 5,204,255 10% 5,110,419 12% 4,833,086 11% 5,097,422 13%
AA- 23,048,321 43% 20,978,876 48% 19,819,906 43% 18,737,328 48%
A+ 2,967,207 6% 2,966,941 7% 1,135,939 2% 2,140,013 6%
A 2,612,559 5% 2,929,275 7% 604,828 2% 2,568,445 7%
A- 1,613,591 3% - - 1,613,591 3% - -
Total 53,129,624 100% 43,190,096 100% 45,861,011 100% 38,795,346 100%
* rating agencies
10.1.5. Loans to executives
Loans to executive portfolio is largely made
up of vehicle loans which are given to staff
at assistant manager level and above. The
respective business units have obtained the
necessary promissory notes as collateral for
the loans granted.
10.1.6. Loans to life policyholders
The surrender value of insurance policies
considered as the collateral for the loans
given to life policy holders by Union
Assurance PLC. System controls are in place
to automatically convert a policy to lapse
stage when the policy loan amount together
with the interest is reaching the surrender
value of the policy.
10.1.7. Preference Shares
Cumulative preference share investment
which has lien over an assets, redeemable at
the option of share holder.
10.1.8. Interest rate swap
The Group has entered into interest rate
swap that is a cash flow hedge. The
changes in counterparty credit risk had no
material effect on the hedge effectiveness
assessment for derivatives designated in
hedge relationships. Refer note 12.3.
10.1.9. Trade and other receivables
Group Company
As at 31 March 2017 2016 2017 2016
Neither past due nor impaired 3,357,908 4,974,544 79,574 96,094
Past due but not impaired
0-30 days 4,411,225 2,083,677 9,738 10,089
31–60 days 1,199,016 958,904 8,914 16,506
61–90 days 263,358 299,605 - -
> 91 days 1,803,411 1,166,135 1,198 26,632
Impaired 1,050,357 1,035,892 - -
Gross carrying value 12,085,275 10,518,757 99,424 149,321
Less: impairment provision
Individually assessed impairment provision (418,296) (564,864) - -
Collectively assessed impairment provision (632,061) (471,028) - -
Total 11,034,918 9,482,865 99,424 149,321
The Group has obtained customer deposit from major customers by reviewing their past performance and credit worthiness, as collateral.
The requirement for an impairment is
analysed at each reporting date on an
individual basis for major customers.
Additionally, a large number of minor
receivables are grouped into homogeneous
groups and assessed for impairment
collectively. The calculation is based on actual
incurred historical data.
10.1.10. Reinsurance receivables
The Union Assurance PLC operates a policy
to manage its reinsurance counterparty
exposures by limiting the reinsurers that
may be used and applying strict limits each
reinsurer.
10.1.11. Premium receivable
Only designated institutions are employed
as intermediary parties by Union Assurance
PLC.
Agreements have been signed with the
intermediaries committing them to settle
dues within a specified time period.

206 John Keells Holdings PLC | Annual Report 2016/17
10.2.1. Net debt/(cash)
As at 31 March Group Company
In LKR '000s 2017 2016 2017 2016
Short term investments 79,174,327 72,635,070 60,243,280 56,862,236
Cash in hand and at bank 5,119,185 5,127,463 304,265 178,193
Adjustments to liquid assets (6,218,187) (5,163,192) - -
Total liquid assets 78,075,325 72,599,341 60,547,545 57,040,429
Interest-bearing loans and borrowings (Non-current) 14,202,636 13,706,848 - -
Short term borrowings 1,380,238 821,243 - -
Interest-bearing loans and borrowings (Current) 2,918,854 2,991,582 - 1,482,508
Bank overdrafts 4,264,109 3,230,182 84,282 117,412
Total liabilities 22,765,837 20,749,855 84,282 1,599,920
Net debt / (cash) (55,309,488) (51,849,486) (60,463,263) (55,440,509)
10.2.2. Liquidity risk management
The mixed approach combines elements of the cash flow matching approach and the liquid assets approach. The business units attempt to match
cash outflows in each time bucket against a combination of contractual cash inflows plus other inflows that can be generated through the sale of
assets, repurchase agreement or other secured borrowing.
Maturity analysis
The table below summarises the maturity profile of the Group’s financial liabilities at 31 March 2017 based on contractual undiscounted (principal
plus interest) payments.
Group
In LKR '000s
Within
1 year
Between
1-2 years
Between
2-3 years
Between
3-4 years
Between
4-5 years
More than
5 years
Total
Interest-bearing loans and
borrowings
2,969,995 1,040,496 1,149,113 1,141,074 501,146 10,355,654 17,157,478
Trade and other payables 14,136,040 - - - - - 14,136,040
Amounts due to related parties 10,434 - - - - - 10,434
Short term borrowings 1,380,238 - - - - - 1,380,238
Bank overdrafts 4,264,109 - - - - - 4,264,109
22,760,816 1,040,496 1,149,113 1,141,074 501,146 10,355,654 36,948,299
Notes to the Financial Statements
10. Financial risk management
objectives and policies (Contd.)
10.1.12. Amounts due from related parties
The Group's amounts due from related
parties mainly consists of associates and
other venture partners' balances.
The Company balance consists of the
balances from affiliate companies.
10.1.13. Credit risk relating to cash and
cash equivalents
In order to mitigate the concentration,
settlement and operational risks related
to cash and cash equivalents, the Group
consciously manages the exposure
to a single counterparty taking into
consideration, where relevant, the rating
or financial standing of the counterparty,
where the position is reviewed as and when
required, the duration of the exposure in
managing such exposures and the nature
of the transaction and agreement governing
the exposure.
10.2 Liquidity risk
The Group’s policy is to hold cash and
undrawn committed facilities at a level
sufficient to ensure that the Group has
available funds to meet its short and medium
term capital and funding obligations,
including organic growth and acquisition
activities, and to meet any unforeseen
obligations and opportunities. The Group
holds cash and undrawn committed
facilities to enable the Group to manage its
liquidity risk.
The Group monitors its risk to a shortage
of funds using a daily cash management
process. This process considers the maturity
of both the Group’s financial investments and
financial assets (e.g. accounts receivable,
other financial assets) and projected cash
flows from operations.
The Group’s objective is to maintain a
balance between continuity of funding and
flexibility through the use of multiple sources
of funding including debentures, bank loans,
loan notes, overdrafts and finance leases
over a broad spread of maturities.

Group Highlights | Governance | Management Discussion & Analysis | Financial Statements | Supplementary Information 207
The table below summarises the maturity profile of the Group’s financial liabilities at 31 March 2016 based on contractual undiscounted
(principal plus interest) payments.
Group
In LKR '000s
Within
1 year
Between
1-2 years
Between
2-3 years
Between
3-4 years
Between
4-5 years
More than
5 years
Total
Interest-bearing loans and
borrowings
3,687,083 1,985,299 1,475,617 827,071 720,891 11,773,215 20,469,176
Trade and other payables 12,755,466 - - - - - 12,755,466
Amounts due to related parties 28,982 - - - - - 28,982
Short term borrowings 821,243 - - - - - 821,243
Bank overdrafts 3,230,182 - - - - - 3,230,182
20,522,956 1,985,299 1,475,617 827,071 720,891 11,773,215 37,305,049
Maturity analysis
The table below summarises the maturity profile of the Company's financial liabilities on contractual undiscounted (principal plus interest)
payments.
Company 2017 2016
In LKR '000s Within 1 year
Interest-bearing loans and borrowings - 1,482,508
Trade and other payables 330,078 332,506
Amounts due to related parties 210,029 102,135
Bank overdrafts 84,282 117,412
624,389 2,034,561
10.3 . Market risk
Market risk is the risk that the fair value of
future cash flows of a financial instrument
will fluctuate because of changes in market
prices.
Market risk comprises of the following types
of risks:
• Interest rate risk
• Currency risk
• Equity price risk
• Commodity price risk
The objective of market risk management is
to manage and control market risk exposures
within acceptable parameters, while
optimising the return.
The sensitivity analyses in the following
sections relate to the position as at 31 March
in 2017 and 2016.
The analysis excludes the impact of
movements in market variables on the
carrying values of other post-retirement
obligations, provisions and the non-financial
assets and liabilities.
The following assumptions have been made
in performing the sensitivity analyses:
• The Statement of Financial Position
sensitivity relates to derivatives and
available-for-sale debt instruments.
• The sensitivity of the relevant Income
Statement item is the effect of the assumed
changes in respective market risks.
• This is based on the financial assets and
financial liabilities held at 31 March 2017
and 2016.
10.3.1. Interest rate risk
Interest rate risk is the risk that the fair value
or future cash flows of a financial instrument
will fluctuate because of changes in market
interest rates. The Group’s exposure to the
risk of changes in market interest rates
relates primarily to the Group’s long-term
debt obligations with floating interest rates.
Most lenders grant loans under floating
interest rates. To manage this, the Group
enters into interest rate swaps, in which it
agrees to exchange, at specified intervals, the
difference between fixed and variable rate
interest amounts calculated by reference to
an agreed-upon notional principal amount.
The following table demonstrates the
sensitivity to a reasonably possible change
in interest rates, with all other variables held
constant, of the Group’s and Company's profit
before tax (through the impact on floating
rate borrowings).
For the year ended 31 March Increase/ (decrease) in basis points Effect on profit before tax LKR '000s
Rupee
borrowings
Other currency
borrowings
Group Company
2017 +188 +53 115,552 -
-188 -53 (115,552) -
2016 +189 +52 (119,511) (7,709)
-189 -52 119,679 7,709
The assumed spread of basis points for the interest rate sensitivity analysis is based on the currently observable market environment changes to
base floating interest rates.

208 John Keells Holdings PLC | Annual Report 2016/17
10.3.2.2. Effects of currency translation
For purposes of JKH's consolidated financial statements, the income and expenses and the assets and liabilities of subsidiaries located outside
Sri Lanka are converted into Sri Lankan Rupees (LKR). Therefore, period-to-period changes in average exchange rates may cause currency
translation effects that have a significant impact on, for example, revenue, segment results (Earnings Before Interest and Taxes –EBIT) and assets
and liabilities of the Group. Unlike exchange rate transaction risk, exchange rate translation risk does not necessarily affect future cash flows. The
Group’s equity position reflects changes in book values caused by exchange rates.
The Group’s exposure to foreign currency changes for all other currencies is not material.
For the year ended 31 March Group Company
Increase/(decrease)
in exchange rate USD
Effect on profit
before tax LKR '000s
Effect on equity
LKR '000s
Effect on profit
before tax LKR '000s
2017 +4% 1,169,224 1,490,189 841,661
-4% ( 1,169,224 ) (1,490,189) (841,661)
2016 +10% 3,242,566 3,329,445 1,817,315
-10% (3,242,566) (3,329,445) (1,817,315)
Assumptions
The assumed spread of the exchange rate is based on the current observable market environment.
10.3.3. Equity price risk
The Group’s listed and unlisted equity securities are susceptible to market price risk arising from uncertainties about future values of the
investment securities.
10.3.3.1. Financial assets at fair value through Profit and loss
The Group manages the equity price risk through diversification and by placing limits on individual and total equity instruments. Reports on the
equity portfolio are submitted to the Group’s senior management on a regular basis. The Board of Directors reviews and approves all equity
investment decisions.
Notes to the Financial Statements
10. Financial risk management
objectives and policies (Contd.)
10.3.2. Foreign currency risk
Foreign currency risk is the risk that the
fair value or future cash flows of a financial
instrument will fluctuate because of changes
in foreign exchange rates. The Group has
exposure to foreign currency risk where it
has cash flows in overseas operations and
foreign currency transactions which are
affected by foreign exchange movements.
Group treasury analyses the market condition
of foreign exchange and provides market
updates to the Group Executive Committee
(GEC), with the use of external consultants'
advice. Based on the suggestions made by
Group treasury the GEC takes decisions
on whether to hold, sell, or make forward
bookings of foreign currency as per decision
rights given by Board of Directors.
For the year ended 31 March
Increase/(decrease)
in basis points USD
Effect on profit
before tax
LKR '000s
Group
2017 +4% (44,617)
-4% 44,617
2016 +10% (42,282)
-10% 42,282
The assumed spread of the exchange rate is based on the current observable market
environment.
10.3.2.1. Effects of currency transaction on
forward contract
The following table demonstrates the
sensitivity to a reasonably possible change
in the USD/LKR exchange rate, with all other
variables held constant, of the Group’s profit
before tax due to changes in the fair value
of the Group’s forward exchange contracts.
Currently these financial instruments
are categorised under trade and other
receivables.

Group Highlights | Governance | Management Discussion & Analysis | Financial Statements | Supplementary Information 209
Group
As at 31 March 2017 2016
LKR ’000s % LKR ’000s %
Banks finance and insurance 1,678,946 49% 1,849,371 62%
Beverage food and tobacco 12,353 0% 364,221 12%
Construction & engineering 116,745 3% 53,844 2%
Diversified holdings 591,424 18% 360,216 12%
Manufacturing 856,378 25% 273,713 9%
Motors - - 12,128 0%
Power and energy - - 16,058 1%
Other services - - 6,651 0%
Telecommunications 178,006 5% 64,641 2%
Healthcare - - 6,032 0%
3,433,852 100% 3,006,875 100%
10.3.3.2 Available-for-sale investments
All unquoted equity investments are made after obtaining Board approval.
10.3.3.3 Sensitivity analysis
The following table demonstrates the sensitivity to a reasonably possible change in the market index, with all other variables held constant, of the
Group & Company's profit before tax & equity due to changes in the fair value of the listed equity securities.
For the year ended 31 March Group
Change in year-end
market price index
Effect on profit
before tax LKR '000s
Effect on equity
LKR '000s
2017 0% - -
0% - -
2016 +10% 300,688 32
-10% (300,688) (32)
10.4 Capital management
The primary objective of the Group’s capital management is to ensure that it maintains a strong financial position and healthy capital ratios in
order to support its business and maximise shareholder value.
The Group manages its capital structure, and makes adjustments to it, in the light of changes in economic conditions. To maintain or adjust the
capital structure, the Group may issue new shares, have a rights issue or buy back of shares.
As at 31 March Group Company
2017 2016 2017 2016
Debt/Equity 11.7% 12.3% 0.1% 1.6%
11. Fair value measurement and related
fair value disclosures
Fair value measurement
Fair value related disclosures for financial
instruments and non-financial assets that
are measured at fair value or where fair
values are only, disclosed are reflected in
this note. Apart from this note, additional
fair value related disclosures, including the
valuation methods, significant estimates and
assumptions are also provided in:
• Investment in unquoted equity
sharesNote 27.1
• Property, plant and equipment
under revaluation model
Note 21.3
• Investment properties Note 23
• Financial Instruments
(including those carried at
amortised cost)
Note 12
Accounting policy
Fair value is the price that would be received
to sell an asset or paid to transfer a liability
in an orderly transaction between market
participants at the measurement date. The
fair value measurement is based on the
presumption that the transaction to sell the
asset or transfer the liability takes place
either:
• In the principal market for the asset or
liability, or
• In the absence of a principal market, in the
most advantageous market for the asset
or liability

210 John Keells Holdings PLC | Annual Report 2016/17
Notes to the Financial Statements
11. Fair value measurement and related
fair value disclosures (Contd.)
The principal or the most advantageous
market must be accessible by the Group.
The fair value of an asset or a liability is
measured using the assumptions that market
participants would use when pricing the asset
or liability, assuming that market participants
act in their economic best interest.
A fair value measurement of a non-
financial asset takes into account a market
participant's ability to generate economic
benefits by using the asset in its highest and
best use or by selling it to another market
participant that would use the asset in its
highest and best use.
The Group uses valuation techniques that
are appropriate for the circumstances and
for which sufficient data are available to
measure fair value, maximising the use of
relevant observable inputs and minimising
the use of unobservable inputs.
All assets and liabilities for which fair value
is measured or disclosed in the financial
statements are categorised within the fair
value hierarchy, described as follows, based
on the lowest level input that is significant to
the fair value measurement as a whole:
• Level 1 — Quoted (unadjusted) market
prices in active markets for identical
assets or liabilities
• Level 2 — Valuation techniques for which
the lowest level input that is significant to
the fair value measurement is directly or
indirectly observable.
• Level 3 — Valuation techniques for which
the lowest level input that is significant
to the fair value measurement is
unobservable.
For assets and liabilities that are recognised
in the financial statements on a recurring
basis, the Group determines whether
transfers have occurred between levels in
the hierarchy by re-assessing categorisation
(based on the lowest level input that is
significant to the fair value measurement as
a whole) at the end of each reporting period.
The Group determines the policies and
procedures for both recurring fair value
measurement, such as investment properties
and unquoted AFS financial assets, and for
nonrecurring measurement, such as assets
held for sale in discontinued operations.
External valuers are involved in the valuation
of significant assets, such as land and building
and investment properties, and significant
liabilities, such as insurance contracts.
Selection criteria for external valuers include
market knowledge, reputation, independence
and whether professional standards are
maintained. The Group decides, after
discussions with the external valuers, which
valuation techniques and inputs to use for
individual assets and liabilities.
For the purpose of fair value disclosures,
the Group has determined classes of assets
and liabilities on the basis of the nature,
characteristics and risks of the asset
or liability and the level of the fair value
hierarchy as explained above.
Fair value hierarchy
11.1 Financial assets and liabilities by
fair value hierarchy - Group
The Group held the following financial
instruments carried at fair value in the
Statement of Financial Position:
FINANCIAL ASSETS Level 1 Level 2 Level 3
As at 31 March
In LKR '000s
2017 2016 2017 2016 2017 2016
Financial assets held for trading 1,678,122 1,395,201 - - - -
Designated at fair value through profit or loss 2,187,708 2,253,716 132,683 21,160 - -
Foreign exchange forward contracts - - - 26,732 - -
Interest rate swap - - 331,679 - - -
Available for sale 6,478,510 7,018,665 180,722 301,134 160,369 184,456
Total 10,344,340 10,667,582 645,084 349,026 160,369 184,456
NON FINANCIAL ASSETS Note
Assets measured at fair value
Land and buildings 21.1 40,092,971 29,953,873
Buildings on leasehold land 21.1 12,522,459 11,541,882
Investment property 23 5,366,180 4,878,406
Total 57,981,610 46,374,161
In determining the fair value, highest and best use of the property has been considered including the current condition of the properties, future
usability and associated redevelopment requirements. Also, the valuers have made reference to market evidence of transaction prices for similar
properties, with appropriate adjustments for size and location. The appraised fair values are rounded within the range of values.

Group Highlights | Governance | Management Discussion & Analysis | Financial Statements | Supplementary Information 211
11.2. Financial assets and liabilities by fair value hierarchy - Company
FINANCIAL ASSETS Level 3
As at 31 March
In LKR '000s
2017 2016
Available for sale 141,972 166,059
11.3. Reconciliation of fair value measurements of level 3 financial instruments
The Group and Company carries unquoted equity shares as available-for-sale financial
instruments classified as Level 3 within the fair value hierarchy. A reconciliation of the beginning
and closing balances including movements is summarised below:
Available-for-sale financial assets
In LKR '000s Group Company
As at 1 April 2016 184,456 166,059
Total gains and losses recognised in OCI (24,087) (24,087)
As at 31 March 2017 160,369 141,972
Fair valuation carried at 31 March 2017 for all unquoted equity shares are classified as Level 3
within the fair value hierarchy using discounted cash flow valuation method. Fair value would
not significantly vary if one or more of the inputs were changed.
12. Financial instruments and related
policies
Accounting policy
Financial instruments — Initial recognition
and subsequent measurement
Financial assets - Initial recognition and
measurement
Financial assets within the scope of LKAS 39
are classified as financial assets at fair value
through profit or loss, loans and receivables,
held-to-maturity investments, available-
for-sale financial assets, or as derivatives
designated as hedging instruments in an
effective hedge, as appropriate. The Group
determines the classification of its financial
assets at initial recognition.
All financial assets are recognised initially
at fair value plus, in the case of assets not
at fair value through profit or loss, directly
attributable transaction costs. Purchases or
sales of financial assets that require delivery
of assets within a time frame established
by regulation or convention in the market
place (regular way trades) are recognised
on the trade date, i.e., the date that the Group
commits to purchase or sell the asset.
The Group’s financial assets include cash
and short-term deposits, trade and other
receivables, loans and other receivables,
quoted and unquoted financial instruments
and derivative financial instruments.
Financial assets - Subsequent
measurement
The subsequent measurement of financial
assets depends on their classification. For
purposes of subsequent measurement
financial assets are classified in four
categories:
• Financial assets at fair value through profit
or loss
• Loans and receivables
• Held-to-maturity investments
• Available for sale financial assets
Financial assets at fair value through profit
or loss
Financial assets at fair value through profit or
loss include financial assets held for trading
and financial assets designated upon initial
recognition at fair value through profit or loss.
Financial assets are classified as held for
trading if they are acquired for the purpose
of selling or repurchasing in the near term.
Financial assets at fair value through profit
or loss are carried in the Statement of
Financial Position at fair value with changes
in fair value recognised in finance income or
finance costs in the Income Statement.
The Group evaluates its financial assets
held for trading, other than derivatives, to
determine whether the intention to sell
them in the near term is still appropriate.
When the Group is unable to trade these
financial assets due to inactive markets and
management’s intention to sell them in the
foreseeable future significantly changes,
the Group may elect to reclassify these
financial assets in rare circumstances. The
reclassification to loans and receivables,
available-for-sale or held to maturity
depends on the nature of the asset. This
evaluation does not affect any financial
assets designated at fair value through
profit or loss using the fair value option at
designation.
Loans and receivables
Loans and receivables are non-derivative
financial assets with fixed or determinable
payments that are not quoted in an active
market. After initial measurement, such
financial assets are subsequently measured
at amortised cost using the effective interest
rate method (EIR), less impairment. Amortised
cost is calculated by taking into account any
discount or premium on acquisition and fees
or costs that are an integral part of the EIR.
The EIR amortisation is included in finance
income in the income statement. The losses
arising from impairment are recognised in
the income statement in finance costs.
Held-to-maturity investments
Held-to-maturity investments are non-
derivative financial assets with fixed or
determinable payments and fixed maturities
are classified as held-to-maturity when
the Group has the positive intention and
ability to hold them to maturity. After
initial measurement, held-to-maturity
investments are measured at amortised
cost using the effective interest method, less
impairment. Amortised cost is calculated by
taking into account any discount or premium
on acquisition and fees or costs that are an
integral part of the EIR. The EIR amortization
is included in finance income in the
Income Statement. The losses arising from
impairment are recognised in the Income
Statement in finance costs.
Available-for-sale financial investments
Available-for-sale financial investments
include equity and debt securities. Equity
investments classified as available-for-sale
are those, which are neither classified as
held for trading nor designated at fair value
through profit or loss. Debt securities in this
category are those which are intended to
be held for an indefinite period of time and
which may be sold in response to needs for
liquidity or in response to changes in the
market conditions.
After initial measurement, available-for-
sale financial investments are subsequently
measured at fair value with unrealised gains
or losses recognised in other comprehensive
income under the available-for-sale reserve
until the investment is derecognised, at
which time the cumulative gain or loss is
recognised in other operating income, or
determined to be impaired, at which time the

212 John Keells Holdings PLC | Annual Report 2016/17
cumulative loss is reclassified to the Income
Statement in finance costs and removed
from the available-for-sale reserve. Interest
income on available-for-sale debt securities
is calculated using the effective interest
method and is recognised in the Income
Statement.
The Group evaluates its available-for-sale
financial assets to determine whether the
ability and intention to sell them in the near
term is still appropriate. When the Group is
unable to trade these financial assets due
to inactive markets and management’s
intention to do so significantly changes in
the foreseeable future, the Group may elect
to reclassify these financial assets in rare
circumstances. Reclassification to loans and
receivables is permitted when the financial
assets meet the definition of loans and
receivables and the Group has the intent and
ability to hold these assets for the foreseeable
future or until maturity. Reclassification to the
held-to-maturity category is permitted only
when the entity has the ability and intention
to hold the financial asset accordingly.
For a financial asset reclassified out of the
available-for-sale category, any previous
gain or loss on that asset that has been
recognized in equity is amortised to the
Income Statement over the remaining life of
the investment using the EIR. Any difference
between the new amortised cost and the
expected cash flows is also amortised over
the remaining life of the asset using the EIR. If
the asset is subsequently determined to be
impaired, then the amount recorded in equity
is reclassified to the Income Statement.
Financial assets - derecognition
A financial asset (or, where applicable a
part of a financial asset or part of a group
of similar financial assets) is derecognised
when:
• The rights to receive cash flows from the
asset have expired
• The Group has transferred its right to
receive cash flows from the asset or has
assumed an obligation to pay the received
cash flows in full without material delay
to a third party under a ‘pass-through’
arrangement; and either (a) the Group
has transferred substantially all the risks
and rewards of the asset, or (b) the Group
has neither transferred nor retained
Notes to the Financial Statements
substantially all the risks and rewards of
the asset, but has transferred control of
the asset.
When the Group has transferred its rights
to receive cash flows from an asset or has
entered into a pass-through arrangement,
and has neither transferred nor retained
substantially all of the risks and rewards
of the asset nor transferred control of it,
the asset is recognised to the extent of the
Group’s continuing involvement in it.
In that case, the Group also recognises an
associated liability. The transferred asset
and the associated liability are measured
on a basis that reflects the rights and
obligations that the Group has retained.
Continuing involvement that takes the form
of a guarantee over the transferred asset
is measured at the lower of the original
carrying amount of the asset and the
maximum amount of consideration that the
Group could be required to repay.
Impairment of financial assets
The Group assesses at each reporting date
whether there is any objective evidence
that a financial asset or a group of financial
assets is impaired. A financial asset or a
group of financial assets is deemed to be
impaired if, and only if, there is objective
evidence of impairment as a result of one
or more events that has occurred after the
initial recognition of the asset (an incurred
‘loss event’) and that loss event has an
impact on the estimated future cash flows of
the financial asset or the group of financial
assets that can be reliably estimated.
Evidence of impairment may include
indications that the debtors or a group of
debtors is experiencing significant financial
difficulty, default or delinquency in interest
or principal payments, the probability that
they will enter bankruptcy or other financial
reorganisation and where observable data
indicate that there is a measurable decrease
in the estimated future cash flows, such as
changes in arrears or economic conditions
that correlate with defaults.
Financial assets carried at amortised cost
For financial assets carried at amortised cost,
the Group first assesses whether objective
evidence of impairment exists individually
for financial assets that are individually
significant, or collectively for financial assets
that are not individually significant. If the
Group determines that no objective evidence
of impairment exists for an individually
assessed financial asset, whether significant
or not, it includes the asset in a Group of
financial assets with similar credit risk
characteristics and collectively assesses
them for impairment. Assets that are
individually assessed for impairment and for
which an impairment loss is, or continues to
be, recognised are not included in a collective
assessment of impairment.
If there is objective evidence that an
impairment loss has been incurred, the
amount of the loss is measured as the
difference between the assets carrying
amount and the present value of estimated
future cash flows (excluding future expected
credit losses that have not yet been incurred).
The present value of the estimated future
cash flows is discounted at the financial
asset’s original effective interest rate. If a
loan has a variable interest rate, the discount
rate for measuring any impairment loss is
the current effective interest rate.
The carrying amount of the asset is reduced
through the use of an allowance account
and the amount of the loss is recognised
in the Income Statement. Interest income
continues to be accrued on the reduced
carrying amount and is accrued using the
rate of interest used to discount the future
cash flows for the purpose of measuring
the impairment loss. The interest income
is recorded as part of finance income in
the Income Statement. Loans together with
the associated allowance are written off
when there is no realistic prospect of future
recovery and all collateral has been realised
or has been transferred to the Group. If, in a
subsequent year, the amount of the estimated
impairment loss increases or decreases
because of an event occurring after the
impairment was recognised, the previously
recognised impairment loss is increased or
reduced by adjusting the allowance account.
If a future write-off is later recovered, the
recovery is credited to finance costs in the
Income Statement.
AFS financial assets
For available-for-sale financial investments,
the group assesses at each reporting date
whether there is objective evidence that
an investment or a Group of investments is
impaired.
12. Financial instruments and related
policies (Contd.)

Group Highlights | Governance | Management Discussion & Analysis | Financial Statements | Supplementary Information 213
In the case of equity investments classified as
available-for-sale, objective evidence would
include a significant or prolonged decline
in the fair value of the investment below its
cost. ‘Significant’ is evaluated against the
original cost of the investment and ‘prolonged’
against the period in which the fair value has
been below its original cost. Where there is
evidence of impairment, the cumulative loss
measured as the difference between the
acquisition cost and the current fair value (less
any impairment loss) is removed from other
comprehensive income. Impairment losses on
equity investments are not reversed through
the Income Statement; increases in their fair
value after impairment are recognised directly
in other comprehensive income.
In the case of debt instruments classified as
available-for-sale, impairment is assessed
based on the same criteria as financial
assets carried at amortised cost. However,
the amount recorded for impairment is the
cumulative loss measured as the difference
between the amortised cost and the current
fair value, less any impairment loss on that
investment previously recognised in the
Income Statement.
Future interest income continues to be
accrued based on the reduced carrying
amount of the asset, using the rate of interest
used to discount the future cash flows for the
purpose of measuring the impairment loss.
The interest income is recorded as part of
finance income. If, in a subsequent year, the
fair value of a debt instrument increases and
the increase can be objectively related to an
event occurring after the impairment loss
was recognised in the Income Statement,
the impairment loss is reversed through the
Income Statement.
Financial liabilities – Initial recognition and
measurement
Financial liabilities within the scope of LKAS
39 are classified as financial liabilities at
fair value through profit or loss, loans and
borrowings or as derivatives designated as
hedging instruments in an effective hedge,
as appropriate. The Group determines the
classification of its financial liabilities at initial
recognition.
All financial liabilities are recognised initially
at fair value and in the case of loans and
borrowings, carried at amortised cost. This
includes directly attributable transaction
costs.
The Group’s financial liabilities include trade
and other payables, bank overdrafts, loans
and borrowings, financial guarantee contracts
and derivative financial instruments.
Financial liabilities - Subsequent
measurement
The subsequent measurement of financial
liabilities depends on their classification.
For purposes of subsequent measurement
financial liabilities are classified in to two
categories:
• Loans and borrowings
• Financial guarantee contracts
After initial recognition, interest bearing loans
and borrowings are subsequently measured
at amortised cost using the effective
interest rate method. Gains and losses are
recognised in the Income Statement when
the liabilities are derecognised as well as
through the effective interest rate method
(EIR) amortization process.
Amortised cost is calculated by taking
into account any discount or premium on
acquisition and fees or costs that are an
integral part of the EIR. The EIR amortization
is included in finance costs in the Income
Statement.
Financial guarantee contracts issued by
the Group are those contracts that require a
payment to be made to reimburse the holder
for a loss it incurs in case the specified
debtor fails to make a payment when due
in accordance with the terms of a debt
instrument. Financial guarantee contracts are
recognised initially as a liability at fair value,
adjusted for transaction costs that are directly
attributable to the issuance of the guarantee.
Subsequently, the liability is measured at the
higher of the best estimate of the expenditure
required to settle the present obligation at the
reporting date and the amount recognised
less cumulative amortisation.
Financial liabilities - Derecognition
A financial liability is derecognised when the
obligation under the liability is discharged or
cancelled or expired.
When an existing financial liability is
replaced by another from the same lender on
substantially different terms, or the terms of
an existing liability are substantially modified,
such an exchange or modification is treated
as a derecognition of the original liability
and the recognition of a new liability, and the
difference in the respective carrying amounts
are recognised in the Income Statement
Offsetting of financial instruments
Financial assets and financial liabilities are
offset and the net amount reported in the
Consolidated Statement of Financial Position
if, and only if, there is a currently enforceable
legal right to offset the recognised amounts
and there is an intention to settle on a net
basis, or to realise the assets and settle the
liabilities simultaneously.
Derivative financial instruments - Initial
recognition and subsequent measurement
The Group uses derivative financial
instruments such as forward currency
contracts, interest rate swaps and forward
commodity contracts to hedge its foreign
currency risks, interest rate risks and
commodity price risks respectively. Such
derivative financial instruments are initially
recognised at fair value on the date on
which a derivative contract is entered into
and subsequently remeasured at fair value.
Derivatives are carried as financial assets
when the fair value is positive and as financial
liabilities when the fair value is negative.
The fair value of commodity contracts that
meet the definition of a derivative as defined
by LKAS 39 are recognised in the Income
Statement in cost of sales.
Any gains or losses arising from changes in
the fair value of derivatives are taken directly
to the Income Statement.
Foreign exchange forward contracts
Foreign exchange forward contracts are fair
valued at each reporting date. Gains and
losses arising from changes in fair value
are included in the Income Statement in the
period in which they arise.
Cash Flow Hedges
Interest rate swaps
The Group has entered into interest rate
swap that is a cash flow hedge for the
Group’s exposure to interest rate risk on its
borrowings
These contracts entitle the Group to receive
interest at floating rates on notional principal
amounts and oblige the Group to pay interest
at fixed rates on the same notional principal
amounts, thus allowing the Group to raise
borrowings at floating rates and swap them
with fixed rates.
The fair value changes on the effective
portion of interest rate swaps designated
as cash flow hedges are recognised in other
comprehensive income, accumulated in the
fair value reserve and reclassified to profit
or loss when the hedged interest expense
on the borrowings is recognised in profit or
loss. The fair value changes on the ineffective
portion of interest rate swaps are recognised
immediately in profit or loss.

214 John Keells Holdings PLC | Annual Report 2016/17
Notes to the Financial Statements
12.1. Financial assets and liabilities by categories in accordance with LKAS 39
Group Loans and receivables Financial assets at fair value
through profit or loss
As at 31 March
LKR '000s
2017 2016 2017 2016
Financial instruments in non-current assets/non-current liabilities
Non-current financial assets 9,474,414 2,492,810 96,016 50,452
Interest-bearing loans and borrowings - - - -
Financial instruments in current assets/current liabilities
Trade and other receivables/ Payables 11,687,429 9,998,949 - -
Amounts due from/due to related parties 111,639 133,031 - -
Short term investments 70,970,351 67,404,837 3,902,497 3,619,625
Cash in hand and at bank 5,119,185 5,127,463 - -
Short term borrowings - - - -
Interest-bearing loans and borrowings - - - -
Bank overdrafts - - - -
Total 97,363,018 85,157,090 3,998,513 3,670,077
12.2. Financial assets and liabilities by categories in accordance with LKAS 39
Financial assets by
categories
Financial liabilities by
categories
Company Loans and receivables Available-for-sale financial
assets
Total Financial liabilities
measured at amortised cost
As at 31 March
LKR '000s
2017 2016 2017 2016 2017 2016 2017 2016
Financial instruments in
non-current assets/
non-current liabilities
Non-current financial
assets
2,648,008 341,346 141,972 166,059 2,789,980 507,405 - -
Financial instruments in
current assets/current
liabilities
Trade and other
receivables/ Payables
118,076 169,144 - - 118,076 169,144 330,078 332,506
Amounts due from/due to
related parties
286,735 595,182 - - 286,735 595,182 210,029 102,135
Short term investments 60,243,280 56,862,236 - - 60,243,280 56,862,236 - -
Cash in hand and at bank 304,265 178,193 - - 304,265 178,193 - -
Interest-bearing loans and
borrowings
- - - - - - - 1,482,508
Bank overdrafts - - - - - - 84,282 117,412
Total 63,600,364 58,146,101 141,972 166,059 63,742,336 58,312,160 624,389 2,034,561

Group Highlights | Governance | Management Discussion & Analysis | Financial Statements | Supplementary Information 215
For financial assets both at fair value
through profit and loss and available-for-sale
financial assets the carrying amount and fair
value are equal.
The fair value of loans and receivables is not
significantly different from the value based
on amortised cost methodology. Fair value
of held to maturity investments amounts to
LKR 14,725 mn (2016 - LKR 15,160 mn) for
the Group.
The Group has designated financial assets
amounting to LKR 3,999 mn (2016 - LKR
4,010 mn) upon initial recognition, as fair
value through profit or loss.
The management assessed that, cash and
short-term deposits, trade receivables, trade
payables, bank overdrafts and other current
financial liabilities approximate their carrying
amounts largely due to the short-term
maturities of these instruments.
Fair value is the price that would be received
to sell an asset or paid to transfer a liability
in an orderly transaction between market
participants at the measurement date.
The following methods and assumptions
were used to estimate the fair values:
Fair value of quoted equities, debentures
and bonds is based on price quotations in an
active market at the reporting date.
Financial assets by categories Financial liabilities by
categories
Available-for-sale financial
assets
Held-to-maturity investments Total Financial liabilities measured
at amortised cost
2017 2016 2017 2016 2017 2016 2017 2016
6,639,029 6,987,250 11,457,162 13,104,932 27,666,621 22,635,444 - -
- - - - - - 14,202,636 13,706,848
- - - - 11,687,429 9,998,949 14,136,040 12,755,466
- - - - 111,639 133,031 10,434 28,982
180,572 517,005 4,120,907 1,093,603 79,174,327 72,635,070 - -
- - - - 5,119,185 5,127,463 - -
- - - - - - 1,380,238 821,243
- - - - - - 2,918,854 2,991,582
- - - - - - 4,264,109 3,230,182
6,819,601 7,504,255 15,578,069 14,198,535 123,759,201 110,529,957 36,912,311 33,534,303
The fair value of unquoted instruments, loans
from banks and other financial liabilities,
obligations under finance leases, as well
as other non-current financial liabilities is
estimated by discounting future cash flows
using rates currently available for debt on
similar terms, credit risk and remaining
maturities.
Fair value of the unquoted ordinary shares
has been estimated using a Discounted Cash
Flow (DCF) model. The valuation requires
management to make certain assumptions
about the model inputs, including forecast
cash flows, the discount rate, credit risk and
volatility. The probabilities of the various
estimates within the range can be reasonably
assessed and are used in management’s
estimate of fair value for these unquoted
equity investments.
12.3. Derivative financial instruments
Group 2017
Cash-flow hedges Contract notional
amount USD ('000)
Fair value (In LKR '000)
Asset Liability
Interest rate swaps 75,000 331,679 -
Accounting judgements,estimates and assumptions
Fair value of financial instruments
Where the fair value of financial assets and financial liabilities recorded in the statement of
financial position cannot be derived from active markets, their fair value is determined using
valuation techniques including the discounted cash flow model. The inputs to these models are
taken from observable markets where possible.
Where this is not feasible, a degree of judgment is required in establishing fair values. The
judgments include considerations of inputs such as liquidity risk, credit risk and volatility.

216 John Keells Holdings PLC | Annual Report 2016/17
Notes to the Financial Statements
13. Revenue
Accounting policy
Revenue recognition
Revenue is recognised to the extent that it is
probable that the economic benefits will flow
to the Group, and the revenue and associated
costs incurred or to be incurred can be
reliably measured. Revenue is measured at
the fair value of the consideration received or
receivable, net of trade discounts and value
added taxes, after eliminating sales within
the Group.
The following specific criteria are also must
be met for recognition of revenue:
Sale of goods
Revenue from the sale of goods is recognized
when the significant risk and rewards of
ownership of the goods have passed to the
buyer with the Group retaining neither a
continuing managerial involvement to the
degree usually associated with ownership,
nor an effective control over the goods sold.
14. Dividend income
Accounting policy
Dividend
Dividend income is recognised when the Company’s right to receive the payment is established.
Company
For the year ended 31 March
In LKR '000s
2017 2016
Dividend income from investments in subsidiaries and equity accounted investees 10,469,023 10,260,828
15. Other operating income and other operating expenses
Accounting policy
Gains and losses
Net gains and losses of a revenue nature
arising from the disposal of property, plant
and equipment and other noncurrent assets,
including investments in subsidiaries, joint
ventures and associates, are accounted in
the income statement, after deducting the
13.1. Revenue
Group Company
For the year ended 31 March
In LKR '000s
2017 2016 2017 2016
Gross revenue 106,483,869 93,815,682 1,126,353 1,108,095
Turnover tax (210,768) (105,728) - -
Net revenue 106,273,101 93,709,954 1,126,353 1,108,095
Rendering of services
Revenue from rendering of services is
recognised by reference to the stage of
completion. Where the contract outcome
cannot be measured reliably, revenue
is recognized only to the extent that the
expenses incurred are eligible to be
recovered.
Rental income
Rental income arising from operating leases
on investment properties is accounted for on
a straight-line basis over the lease terms.
Life insurance business - gross written
premium
Gross written premiums on life and
investment contracts with discretionary
participating features (DPF) are recognised
as revenue when receivable from the
policyholder (policies within the 30 day grace
period are considered as due). For single
premium business, revenue is recognised on
the date on which the policy is effective.
Turnover based taxes
Companies in the Group pay turnover based
taxes including value added tax in accordance
with the respective statutes.
carrying amount from proceeds on disposal of
such assets and the related selling expenses.
Gains and losses arising from activities
incidental to the main revenue generating
activities and those arising from a group of
similar transactions, which are not material
are aggregated, reported and presented on a
net basis.
Any losses arising from guaranteed rentals
are accounted for, in the year of incurring
the same. A provision is recognised if the
projection indicates a loss.
Other income and expenses
Other income and expenses are recognised
on an accrual basis.
15.1. Other operating income
Group Company
For the year ended 31 March
In LKR '000s
2017 2016 2017 2016
Exchange gains 282,572 236,421 - -
Profit on sale of property, plant and equipment - - 17 1,656
Profit on sale of non current investments - - 2,574,003 3,792,821
Promotional income and commission fee 1,062,548 859,218 - -
Write back of dealer deposits 8,789 12,410 - -
Sundry income 411,278 596,074 33,841 27,413
1,765,187 1,704,123 2,607,861 3,821,890

Group Highlights | Governance | Management Discussion & Analysis | Financial Statements | Supplementary Information 217
At the Company level, other operating income includes a capital gain of LKR 2,574 mn pertaining to the exercise undertaken to simplify the Group’s
shareholding structure. This exercise, as discussed in note 43.8, was carried out to restructure the shareholding of the Group companies which had
multiple layers of ownership. The exercise was executed via a model which consisted of both share and cash transfers within the Company and its
unquoted subsidiaries. It should also be noted that this capital gain was eliminated at the Group consolidation level.
The Company exercised its buy back option of Union Assurance PLC, resultant gain of LKR 3.10 bn has been reported under other operation income
in 2015/16 income statement.
15.2. Other operating expenses
Group Company
For the year ended 31 March
In LKR '000s
2017 2016 2017 2016
Nation building tax 1,105,567 1,029,657 22,909 22,533
Loss on sale of property, plant and equipment 41,183 34,050 - -
Impairment losses of non financial assets 34,332 215,764 900,419 525,000
Other overheads 1,989,023 2,150,090 17,844 19,147
3,170,105 3,429,561 941,172 566,680
The recoverable amount of the investments in the BPO business as at 31 March 2017, has been determined using the “fair value less cost to
sell” basis. Accordingly, an impairment loss of LKR 900 mn (2016 - LKR 525 mn) has been recognized in the Company financial statements
under other operating expenses. The said loss has been eliminated in the consolidated financial statements.
16. Net finance income
Accounting policy
Finance income
Finance income comprises interest income
on funds invested (including available-for-
sale financial assets), dividend income and
gains on the disposal of available-for-sale
financial assets, fair value gains on financial
assets at fair value through profit or loss,
gains on the remeasurement to fair value of
any pre-existing interest in an acquiree that
are recognised in the income statement.
Interest income is recorded as it accrues using
the effective interest rate (EIR), which is the
rate that exactly discounts the estimated future
cash receipts through the expected life of the
financial instrument or a shorter period, where
appropriate, to the net carrying amount of the
financial asset. Interest income is included in
finance income in the income statement.
Finance costs
Finance costs comprise interest expense on
borrowings, unwinding of the discount on
provisions, losses on disposal of available-
for-sale financial assets, fair value losses on
financial assets at fair value through profit
or loss, impairment losses recognised on
financial assets (other than trade receivables)
that are recognised in the income statement.
Interest expense is recorded as it accrues
using the effective interest rate (EIR), which is
the rate that exactly discounts the estimated
future cash payments through the expected
life of the financial instrument or a shorter
period, where appropriate, to the net carrying
amount of the financial liability.
Borrowing costs directly attributable to the
acquisition, construction or production of an
asset that necessarily takes a substantial
period of time to get ready for its intended
use or sale are capitalised as part of the cost
of the respective assets. All other borrowing
costs are expensed in the period they occur.
Borrowing costs consist of interest and other
costs that the Group incurs in connection
with the borrowing of funds.
Group Company
For the year ended 31 March
In LKR '000s
2017 2016 2017 2016
Net finance income
Finance income
Interest income 9,016,816 6,226,155 4,908,325 2,935,026
Dividend income on
Financial assets at fair value through profit or loss 164,269 102,328 - -
Available-for-sale financial assets 49,289 8,724 49,289 8,724
Investment related expenses (47,432) (22,909) - -
Net gain on
Financial assets at fair value through profit or loss 267,176 - - -
Available-for-sale financial assets 9 82,406 - 82,406
Exchange gains 583,154 1,614,248 583,154 1,614,248
Total finance income 10,033,281 8,010,952 5,540,768 4,640,404
Finance cost
Interest expense on borrowings (436,278) (391,721) (89,397) (81,579)
Net loss on
Financial assets at fair value through profit or loss - (602,081) - -
Total finance cost (436,278) (993,802) (89,397) (81,579)
Net finance income 9,597,003 7,017,150 5,451,371 4,558,825

218 John Keells Holdings PLC | Annual Report 2016/17
17. Profit before tax
Accounting policy
Expenditure recognition
Expenses are recognised in the income statement on the basis of a direct association between the cost incurred and the earning of specific items
of income. All expenditure incurred in the running of the business and in maintaining the property, plant and equipment in a state of efficiency has
been charged to the income statement.
For the purpose of presentation of the income statement, the “function of expenses” method has been adopted, on the basis that it presents fairly
the elements of the Company’s and Group’s performance.
Group Company
For the year ended 31 March
In LKR '000s
2017 2016 2017 2016
Profit before tax
Profit before tax is stated after charging all expenses including the following;
Remuneration to executive directors 363,411 375,934 154,024 163,099
Remuneration to non executive directors 47,470 51,698 16,920 22,320
Costs of defined employee benefits
Defined benefit plan cost 327,633 283,900 32,831 26,633
Defined contribution plan cost - EPF and ETF 841,237 775,679 31,571 29,316
Staff expenses 11,166,845 10,135,789 567,671 561,849
Auditors’ remuneration
Audit 44,992 41,014 7,273 6,943
Non-audit 6,654 7,588 3,183 2,753
Depreciation of property, plant and equipment 2,874,071 2,782,315 33,042 33,415
Amortisation of intangible assets 333,046 320,564 19,765 23,660
Amortisation of lease rentals paid in advance 592,983 738,407 - -
Impairment losses of non financial assets 34,332 215,764 900,419 525,000
Operating lease payments 913,962 1,068,459 - -
(Profit)/loss on sale of property, plant and equipment and intangible assets 41,183 34,050 (17) (1,656)
Donations 34,135 24,361 13,505 23,510
18. Earnings per share
Accounting policy
Basic EPS is calculated by dividing the profit for the year attributable to ordinary equity holders of the parent by the weighted average number of
ordinary shares outstanding during the year. Diluted EPS is calculated by dividing the profit attributable to ordinary equity holders of the parent
(after adjusting outstanding share option scheme and warrants) by the weighted average number of ordinary shares outstanding during the year
plus the weighted average number of ordinary shares that would be issued on conversion of all the dilutive potential ordinary shares into ordinary
shares.
Group
For the year ended 31 March Note 2017 2016
18.1. Basic earnings per share
Profit attributable to equity holders of the parent (In LKR '000s) 16,275,158 14,070,009
Weighted average number of ordinary shares (In ’000s) 18.3 1,373,936 1,335,196
Basic earnings per share (LKR) 11.85 10.54
18.2. Diluted earnings per share
Profit attributable to equity holders of the parent (In LKR '000s) 16,275,158 14,070,009
Adjusted weighted average number of ordinary shares (In ’000s) 18.3 1,374,525 1,337,984
Diluted earnings per share (LKR) 11.84 10.52
Notes to the Financial Statements

Group Highlights | Governance | Management Discussion & Analysis | Financial Statements | Supplementary Information 219
20. Taxes
Accounting policy
Current tax
Current tax assets and liabilities for the
current and prior periods are measured at
the amount expected to be recovered from or
paid to the taxation authorities. The tax rates
and tax laws used to compute the amount
are those that are enacted or substantively
enacted, at the reporting date in the countries
where the Group operates and generates
taxable income.
Current income tax relating to items
recognised directly in equity is recognised
in equity and for items recognised in other
comprehensive income shall be recognised
in other comprehensive income and not
in the income statement. Management
periodically evaluates positions taken in
the tax returns with respect to situations in
which applicable tax regulations are subject
to interpretation and establishes provisions
where appropriate.
Management has used its judgment on the
application of tax laws including transfer
pricing regulations involving identification of
associated undertakings, estimation of the
respective arm’s length prices and selection
of appropriate pricing mechanism.
The Group has complied with the arm’s
length principles relating to transfer pricing
as prescribed in the Inland Revenue Act,
and has complied with the related Gazette
notification issued by Ministry of Finance.
Deferred tax
Deferred tax is provided using the liability
method on temporary differences at the
reporting date between the tax bases of
assets and liabilities and their carrying
amounts for financial reporting purposes.
Deferred tax liabilities are recognised for all
taxable temporary differences, except:
• Where the deferred tax liability arising from
the initial recognition of goodwill or of an
asset or liability in a transaction that is not a
business combination and, at the time of the
transaction, affects neither the accounting
profit nor taxable profit or loss; and
• In respect of taxable temporary
differences associated with investments
in subsidiaries, associates and interests
in joint ventures, where the timing of the
reversal of the temporary differences can
be controlled and it is probable that the
temporary differences will not reverse in
the foreseeable future.
Deferred tax assets are recognised for
all deductible temporary differences, and
unused tax credits and tax losses carried
forward, to the extent that it is probable that
taxable profit will be available against which
the deductible temporary differences and
the unused tax credits and tax losses carried
forward can be utilised except:
• Where the deferred income tax assets
relating to the deductible temporary
difference arises from the initial recognition
of an asset or liability in a transaction that
is not a business combination and, at the
time of the transaction, affects neither the
accounting profit nor taxable profit or loss;
and
• In respect of deducible temporary
differences associated with investments
in subsidiaries, associates and interests
in joint ventures, deferred tax assets are
recognised only to the extent that it is
probable that the temporary differences
will reverse in the foreseeable future and
taxable profit will be available against which
the temporary differences can be utilised.
The carrying amount of deferred tax assets is
reviewed at each reporting date and reduced
to the extent that it is no longer probable that
sufficient taxable profit will be available to
allow all or part of the deferred tax asset to
be utilised. Unrecognised deferred tax assets
are reassessed at each reporting date and are
recognised to the extent that it has become
probable that future taxable profit will allow
the deferred tax asset to be recovered.
Deferred tax assets and liabilities are
measured at tax rates that are expected to
apply to the year when the asset realises
or liability is settled, based on the tax rates
and tax laws that have been enacted or
substantively enacted as at the reporting date.
Deferred tax relating to items recognised
outside the income statement is recognised
outside the income statement. Deferred
tax items are recognised in correlation to
the underlying transaction either in other
comprehensive income or directly in equity.
18.3. Amount used as denominator
In '000s 2017 2016
Ordinary shares at the beginning of the year 1,189,404 997,486
Bonus element on share split 2015/16 - 142,498
Bonus element on share split 2016/17 169,915 169,915
Effect of share options exercised / warrants exercised 14,617 25,297
Weighted average number of ordinary shares in issue before dilution 1,373,936 1,335,196
Effects of dilution from:
Employee share option scheme 589 929
Share warrants - 2015/16 - 1,859
Adjusted weighted average number of ordinary shares 1,374,525 1,337,984
19. Dividend per share
Company
For the year ended 31 March
LKR
2017
In LKR’000s LKR
2016
In LKR’000s
Equity dividend on ordinary shares declared and paid during the year
Final dividend (Previous years' final dividend paid in the current year) 1.50 1,784,105 1.50 1,496,230
Interim dividend 4.00 5,496,392 5.50 6,541,560
Total dividend 5.50 7,280,497 7.00 8,037,790

220 John Keells Holdings PLC | Annual Report 2016/17
20.1. Tax expense
Group Company
For the year ended 31 March
In LKR '000s
2017 2016 2017 2016
Current income tax
Current tax charge 20.5 3,461,444 2,294,854 1,092,976 578,959
Under/(over) provision of current tax of previous years 21,503 23,357 - 44,485
Irrecoverable economic service charge 20.7 199 445 - -
10% Withholding tax on inter company dividends 943,718 754,194 - -
Deferred tax charge/(reversal)
Relating to origination and reversal of temporary differences 20.2 344,204 333,516 - -
20.6 4,771,068 3,406,366 1,092,976 623,444
20.2. Deferred tax expense
Group
For the year ended 31 March
In LKR '000s
2017 2016
Income statement
Deferred tax expense arising from;
Accelerated depreciation for tax purposes 149,894 102,019
Revaluation of investment property to fair value 26 6,134
Retirement benefit obligations (38,970) (1,030)
Reversal/(benefit) arising from tax losses 222,940 156,990
Others 10,314 69,403
Deferred tax charged directly to income statement 344,204 333,516
Other comprehensive income
Deferred tax expense arising from;
Actuarial losses on defined benefit obligations (19,880) 9,710
Revaluation of land and building to fair value 28,237 20,796
Net gain/(loss) on available for sale financial assets (57,801) 21,842
Total deferred tax charged/(credited) directly to OCI (49,444) 52,348
Deferred tax has been computed at 28% for all standard rate companies (including listed companies), and at 12% for leisure Group companies and
at rates as disclosed in notes 20.10 and 20.11.
Temporary differences associated with the undistributed reserves in subsidiaries for which a deferred tax liability has not been recognised,
amounts to LKR 2,117 mn (2016 LKR 3,104 mn). The deferred tax effect on undistributed reserves of subsidiaries has not been recognised since
the parent can control the timing of the reversal of these temporary differences.
Deferred tax assets and deferred tax liabilities
are offset, if a legally enforceable right exists
to set off current tax assets against current
tax liabilities and when the deferred taxes
relate to the same taxable entity and the same
taxation authority.
No deferred tax asset or liability has been
recognised in the companies which are
enjoying the Board of Investment (BOI) Tax
Holiday period, if there are no qualifying assets
or liabilities beyond the BOI period.
Sales tax
Revenues, expenses and assets are recognised
net of the amount of sales tax except:
• Where the sales tax incurred on the purchase
of an asset or service is not recoverable
from the taxation authority, in which case
the sales tax is recognised as part of the cost
of acquisition of the asset or as part of the
expense item as applicable; and
• Where receivables and payables are stated
with the amount of sales tax included.
The net amount of sales tax recoverable from,
or payable to, the taxation authority is included
as part of receivables or payables in the
statement of financial position.
Notes to the Financial Statements
20. Taxes (Contd.)

Group Highlights | Governance | Management Discussion & Analysis | Financial Statements | Supplementary Information 221
20.3. Income tax liabilities
Group Company
As at 31 March
In LKR '000s
Note 2017 2016 2017 2016
At the beginning of the year 1,873,472 1,592,079 345,555 263,240
Charge for the year 20.1 3,482,947 2,318,211 1,092,976 623,444
Payments and set off against refunds (2,961,040) (2,036,818) (802,999) (541,129)
At the end of the year 2,395,379 1,873,472 635,532 345,555
20.4. Deferred tax
Group
ASSETS LIABILITIES
As at 31 March
In LKR '000s
2017 2016 2017 2016
At the beginning of the year 129,837 108,585 2,029,371 1,625,394
Charge and release 11,591 26,598 306,351 412,462
Acquisition/(disposal) of subsidiary - - - 955
Transfers/exchange translation difference 2,120 (5,346) 519 (9,440)
At the end of the year 143,548 129,837 2,336,241 2,029,371
The closing deferred tax asset and liability balances relate to the following;
Revaluation of land and building to fair value - (642) 229,549 397,497
Revaluation of investment property to fair value - (13,670) 51,252 31,188
Accelerated depreciation for tax purposes 59,399 (15,028) 2,155,280 1,755,586
Employee benefit liability 62,620 72,680 (240,655) (182,131)
Losses available for offset against future taxable income 18,557 83,596 (51,920) (215,730)
Net gain/loss on available for sale financial assets - - (35,959) 21,842
Others 2,972 2,901 228,694 221,119
143,548 129,837 2,336,241 2,029,371
The Group has tax losses amounting to LKR
7,045 mn (2016 - LKR 7,287 mn) that are
available indefinitely to offset against future
taxable profits of the companies in which the
tax losses arose.
Deferred tax liability amounting to LKR
230 mn (2016 – LKR 220 mn) for the Group
recognised on the impact pertaining to
the current year on declared dividends of
subsidiaries and the Group's portion of
distributable reserves of equity accounted
investees.
Accounting judgements, estimates and
assumptions
The Group is subject to income tax and other
taxes including VAT. Significant judgment
was required to determine the total provision
for current, deferred and other taxes due
to uncertainties that exist with respect to
the interpretation of the applicability of tax
laws, at the time of the preparation of these
financial statements.
Uncertainties also exist with respect to the
interpretation of complex tax regulations
and the amount and timing of future taxable
income. Given the wide range of business
relationships and the long-term nature
and complexity of existing contractual
agreements, differences arising between the
actual results and the assumptions made,
or future changes to such assumptions,
could necessitate future adjustments to
tax income and expense already recorded.
Where the final tax outcome of such matters
is different from the amounts that were
initially recorded, such differences will
impact the income and deferred tax amounts
in the period in which the determination is
made.
The Group has tax losses relating to
subsidiaries that have a history of losses that
do not expire and may not be used to offset
other tax liabilities and where the subsidiaries
have no taxable temporary differences nor
any tax planning opportunities available that
could partly support the recognition of these
losses as deferred tax assets.
The Group has contingent liabilities
amounting to LKR 1,168 mn (2016 – LKR
1,168 mn). These have been arrived at after
discussing with independent and legal tax
experts and based on information available.
All assumptions are revisited at the reporting
date. Further details on contingent liabilities
are disclosed in note 44 in the financial
statement.

222 John Keells Holdings PLC | Annual Report 2016/17
20. Taxes (Contd.)
20.5. Reconciliation between current tax charge and the accounting profit
Group Company
For the year ended 31 March
In LKR '000s
2017 2016 2017 2016
Profit before tax 22,887,833 19,198,231 17,245,418 17,693,558
Dividend income from Group companies 14,165,500 12,252,499 - -
Share of results of equity accounted investees (3,302,955) (2,781,233) - -
Other consolidation adjustments 3,908,163 3,357,687 - -
Profit after adjustment 37,658,541 32,027,184 17,245,418 17,693,558
Exempt profits (1,554,480) (2,555,264) (889,488) (639,902)
Income not liable for income tax (6,131,108) (4,545,016) (2,585,646) (3,875,227)
Resident dividend (14,194,939) (12,285,025) (10,518,312) (10,269,552)
Adjusted accounting profit chargeable to income taxes 15,778,014 12,641,879 3,251,972 2,908,877
Disallowable expenses 9,571,337 9,206,717 1,338,095 875,071
Allowable expenses (4,949,360) (6,024,919) (666,521) (1,694,336)
Utilization of tax losses (421,603) (366,929) - -
Qualifying payment deductions (54,692) (227,614) (20,059) (21,900)
Taxable income 19,923,696 15,229,134 3,903,487 2,067,712
Income tax charged at
Standard rate of 28% 2,885,195 1,842,728 1,092,976 578,959
Other concessionary rates 576,249 452,126 - -
Current tax charge 3,461,444 2,294,854 1,092,976 578,959
20.6. Reconciliation between tax expense and the product of accounting profit
Adjusted accounting profit chargeable to income taxes 15,778,014 12,641,879 3,251,972 2,908,877
Tax effect on chargeable profits 3,445,175 2,803,964 910,552 814,486
Tax effect on non deductible expenses 493,075 425,968 337,310 221,625
Tax effect on deductions claimed (156,497) (645,311) (172,889) (467,508)
Net tax effect of unrecognised deferred tax assets for the year 12,426 19,774 18,003 10,356
Net tax effect of unrecognised deferred tax assets for prior years 1,469 (46,025) - -
Under/(over) provision for previous years 21,503 23,357 - 44,485
Other income based taxes
Irrecoverable economic service charge 199 445 - -
10% Withholding tax on inter company dividends 943,718 754,194 - -
Deferred tax on withholding tax of inter company dividends 10,000 70,000 - -
Tax expense 4,771,068 3,406,366 1,092,976 623,444
Group tax expense is based on the taxable profit of individual companies within the Group. At present the tax laws of Sri Lanka do not provide for
Group taxation.
20.7. Economic service charge (ESC)
Group
For the year ended 31 March
In LKR '000s
2017 2016
Irrecoverable economic service charge 199 445
199 445
Notes to the Financial Statements

Group Highlights | Governance | Management Discussion & Analysis | Financial Statements | Supplementary Information 223
20.8. Tax losses carried forward
Group Company
For the year ended 31 March
In LKR '000s
2017 2016 2017 2016
Tax losses brought forward 7,287,486 7,572,469 1,230,471 1,230,471
Adjustments on finalisation of liability 178,959 81,946 - -
Tax losses arising during the year 228,324 319,789 - -
Utilisation of tax losses (649,927) (686,718) - -
7,044,842 7,287,486 1,230,471 1,230,471
20.9. Details of investment relief
Year of
investment
Cost of approved
investment
In LKR '000s
Relief
claimed/forgone
on investments
In LKR '000s
Liability to
additional tax on
disposal of
investment
Ceylon Cold Stores PLC. (CCS) 2011/2012 256,702 256,702 -
2012/2013 167,091 167,091 -
2013/2014 72,801 72,801 -
Keells Food Products PLC. (KFP) 2012/2013 457,732 457,732 -
Trans Asia Hotels PLC. (TAH) 2011/2012 81,522 81,522 -
CCS, KFP and TAH are eligible for qualifying payment relief granted under Section 34(2)(s) of the Inland Revenue Act No. 10 of 2006 and amendments
thereto. CCS, KFP and TAH have now fully claimed the relief.
20.10 Applicable rates of income tax
The tax liability of resident companies are computed at the standard rate of 28% except for the following companies which enjoy full or partial
exemptions and concessions.
Company/Sector Basis Exemptions or
concessions
Period
Exemptions/concessions granted under the Inland Revenue Act
Ceylon Cold Stores PLC. Off-shore activities for payment in foreign
currency
Exempt Open-ended
John Keells Computer Services (Pvt) Ltd. - do - - do - - do -
John Keels Office Automation (Pvt) Ltd. - do - - do - - do -
Cinnamon Hotel Management Ltd. - do - - do - - do -
John Keells International (Pvt) Ltd. - do - - do - - do -
InfoMate (Pvt) Ltd. - do - - do - - do -
John Keells Computer Services (Pvt) Ltd. On-shore activities for payment in foreign
currency
- do - - do -
John Keells Holdings PLC. - do - - do - - do -
Lanka Marine Services (Pvt) Ltd. Export consignment sales of Petroleum
Products
- do - - do -
John Keells Properties Ja-Ela (Pvt) Ltd. New Undertaking engaged in construction
of commercial buildings
- do - 9 years from 1 April 2015
South Asia Gateway Terminals (Pvt) Ltd. Operation of any port terminal in Sri Lanka - do - Exemption will continue even
after the expiry of the BOI
exemption
Sancity Hotels & Properties Ltd. Construction and operation of a tourist hotel - do - 12 years from 1st year of profit
or 2 years from operations
John Keells Warehousing (Pvt) Ltd. Operation and maintenance of facilities for
storage
10% Open-ended

224 John Keells Holdings PLC | Annual Report 2016/17
Notes to the Financial Statements
20. Taxes (Contd.)
20.10. Applicable rates of income tax (Contd.)
Company/Sector Basis Exemptions or
concessions
Period
John Keells Logistics (Pvt) Ltd. (sites which are
not covered by the BOI agreement)
Operation and maintenance of facilities for
storage
10% Open-ended
Leisure sector Promotion of tourism 12% - do -
Mackinnons Travels (Pvt) Ltd. - do - - do - - do -
Consumer Foods and Retail sector Qualified export profits - do - - do -
Lanka Marine Services (Pvt) Ltd. - do - - do - - do -
Mackinnons Mackenzie Shipping (Pvt) Ltd. Provision of services to foreign ships - do - - do -
Exemptions / concessions granted under the Board of Investment Law
Beruwala Holiday Resorts (Pvt) Ltd. Construction and operation of a tourist hotel Exempt 8 years from 1st year of profit
or 2 years from operations
Saffron Aviation (Pvt) Ltd. Domestic Airline - do - 8 years from 1st year of profit
or 2 years from operations
John Keells Residential Properties (Pvt) Ltd. Real estate developer - do - 8 years from April 2011
Trinco Holiday Resorts (Pvt) Ltd. For upgrading and refurbishment of a hotel
in the Eastern Province
- do - 10 years from 1st year of profit
or 2 years from operations
South Asia Gateway Terminals (Pvt) Ltd. Port Services at Queen Elizabeth Quay - do - 20 years from September 1999
British Overseas (Pvt) Ltd. Infrastructure Development - do - 9 years from 1st April 2013
Waterfront Properties (Pvt) Ltd. Integrated super luxury tourist resort - do - 10 years from 1st year of profit
or 3 years from operations
Asian Hotels and Properties PLC. Construction and operation of office,
apartment complex and a hotel
2% of turnover 15 years from 1st April 2014
Other miscellaneous concessions
Exemption on interest income earned from foreign currency denominated accounts. Capital gains from sale of shares are excluded from
chargeability to income tax. Income/profits from offshore dividends and interest are exempt from income tax.
20.11. Income tax rates of off-shore subsidiaries
Country of incorporation Company Rate
India John Keells BPO Solutions India (Pvt) Ltd. 33% (Max)
John Keells Foods India (Pvt)Ltd. 30.9%
Serene Holidays (Pvt) Ltd. 30.9%
Mauritius John Keells BPO Holdings (Pvt) Ltd. 3%(Effective)
John Keells BPO International (Pvt) Ltd. 3%(Effective)
Republic of Maldives Fantasea World Investments (Pte) Ltd. 15%
Tranquility (Pte) Ltd. 15%
Travel Club (Pte) Ltd. 15%
John Keells Maldivian Resorts (Pte) Ltd. 15%
Mack Air Services Maldives (Pte) Ltd. 15%
Singapore John Keells Singapore (Pte) Ltd. 17% (Max)
USA John Keells BPO Solutions US (Pvt) Inc. 35%(Max)
Canada John Keells BPO Solutions Canada (Pvt) Inc 26.5%
20.12. Income tax exemptions / concessions of off-shore subsidiaries
Company / Sector Basis Exemptions or concessions Exemptions or concessions
John Keells BPO Solutions India (Pvt) Ltd. Eligible export turnover Only 50% of relevant profit is taxable 5 years starting Y/A
2015/2016

Group Highlights | Governance | Management Discussion & Analysis | Financial Statements | Supplementary Information 225
21. Property, plant and equipment
Accounting policy
Basis of recognition
Property, plant and equipment are recognized
if it is probable that future economic benefits
associated with the asset will flow to the
Group and the cost of the asset can be
reliably measured.
Basis of measurement
Plant and equipment are stated at cost
less accumulated depreciation and any
accumulated impairment loss. Such cost
includes the cost of replacing component
parts of the plant and equipment and
borrowing costs for long-term construction
projects if the recognition criteria are
met. When significant parts of plant and
equipment are required to be replaced
at intervals, the Group derecognises the
replaced part, and recognises the new part
with its own associated useful life. Likewise,
when a major inspection is performed, its
cost is recognised in the carrying amount of
the plant and equipment as a replacement
if the recognition criteria are satisfied. All
other repair and maintenance costs are
recognised in the income statement as
incurred.
Land and buildings are measured at fair
value less accumulated depreciation
on buildings and impairment charged
subsequent to the date of the revaluation.
The carrying values of property, plant and
equipment are reviewed for impairment
when events or changes in circumstances
indicate that the carrying value may not be
recoverable.
Any revaluation surplus is recognised in other
comprehensive income and accumulated in
equity in the asset revaluation reserve, except
to the extent that it reverses a revaluation
decrease of the same asset previously
recognised in the income statement, in which
case the increase is recognised in the income
statement. A revaluation deficit is recognised
in the income statement, except to the extent
that it offsets an existing surplus on the same
asset recognised in the asset revaluation
reserve.
Accumulated depreciation as at the
revaluation date is eliminated against the
gross carrying amount of the asset and
the net amount is restated to the revalued
amount of the asset. Upon disposal, any
revaluation reserve relating to the particular
asset being sold is transferred to retained
earnings. Where land and buildings are
subsequently revalued, the entire class of
such assets is revalued at fair value on the
date of revaluation. The Group has adopted
a policy of revaluing assets by professional
valuers at least every 5 years, except for
properties held for rental and occupied
mainly by group companies, which are
revalued by professional valuers at least
every 3 years.
Derecognition
An item of property, plant and equipment is
derecognized upon replacement, disposal
or when no future economic benefits are
expected from its use. Any gain or loss arising
on derecognition of the asset is included in
the income statement in the year the asset is
derecognised.
Depreciation
Depreciation is calculated by using a straight-
line method on the cost or valuation of all
property, plant and equipment, other than
freehold land, in order to write off such
amounts over the estimated useful economic
life of such assets.
The estimated useful life of assets are as
follows:
Assets Years
Buildings (other than hotels) 50
Hotel buildings upto 60
Plant and machinery 10 – 20
Equipment 3– 15
Furniture and fittings 2– 15
Motor vehicles 4 – 10
Returnable Containers 10
Vessels 10-25
Borrowing costs
Borrowing costs directly attributable to the
acquisition, construction or production of an
asset that necessarily takes a substantial
period of time to get ready for its intended
use or sale are capitalised as part of the cost
of the asset. All other borrowing costs are
expensed in the period in which they occur.
Borrowing costs consist of interest and other
costs that an entity incurs in connection with
the borrowing of funds.
Group as a lessee
Finance leases which transfer to the Group
substantially all the risks and benefits
incidental to ownership of the leased item,
are capitalised at the commencement of the
lease at the fair value of the leased property
or, if lower, at the present value of the
minimum lease payments. Lease payments
are apportioned between finance charges
and reduction of the lease liability so as to
achieve a constant rate of interest on the
remaining balance of the liability. Finance
charges are recognised in finance costs in
the income statement.
A leased asset is depreciated over the
useful life of the asset. However, if there is
no reasonable certainty that the Group will
obtain ownership by the end of the lease term,
the asset is depreciated over the shorter of
the estimated useful life of the asset and the
lease term. Operating lease payments are
recognised as an operating expense in the
income statement on a straight-line basis
over the lease term.
Impairment of property plant and equipment
The Group assesses at each reporting date
whether there is an indication that an asset
may be impaired. If any such indication exists,
the Group makes an estimate of the asset’s
recoverable amount. An asset’s recoverable
amount is the higher of an asset’s or cash
generating unit’s fair value less costs to sell
and its value in use and is determined for
an individual asset, unless the asset does
not generate cash inflows that are largely
independent of those from other assets or
groups of assets. Where the carrying amount
of an asset exceeds its recoverable amount,
the asset is considered impaired and is
written down to its recoverable amount. In
assessing value in use, the estimated future
cash flows are discounted to their present
value using a pre-tax discount rate that
reflects current market assessments of the
time value of money and the risks specific to
the asset. Impairment losses are recognised
in the income statement, except that,
impairment losses in respect of property,
plant and equipment previously revalued
are recognized against the revaluation
reserve through the statement of other
comprehensive income to the extent that it
reverses a previous revaluation surplus.
An assessment is made at each reporting
date as to whether there is any indication that
previously recognised impairment losses
may no longer exist or may have decreased.
If such indication exists, the recoverable
amount is estimated. A previously recognised
impairment loss is reversed only if there
has been a change in the estimates used
to determine the asset’s recoverable
amount since the last impairment loss
was recognised. If that is the case, the
carrying amount of the asset is increased
to its recoverable amount. That increased
amount cannot exceed the carrying amount
that would have been determined, net of
depreciation, had no impairment loss been
recognised for the asset in prior years.
Such reversal is recognised in the income
statement unless the asset is carried at
revalued amount, in which case the reversal
is treated as a revaluation increase. After
such a reversal, the depreciation charge is
adjusted in future periods to allocate the
asset’s revised carrying amount, less any
residual value, on a systematic basis over its
remaining useful life.

226 John Keells Holdings PLC | Annual Report 2016/17
21. Property, plant and equipment (Contd.)
21.1. Property, plant and equipment - Group
As at 31 March
LKR '000s
Land and
buildings
Buildings on
leasehold
land
Plant and
machinery
Equipment,
furniture
and fittings
Cost or valuation
At the beginning of the year 30,644,715 13,627,625 8,263,213 9,130,300
Additions 217,927 976,691 750,293 973,455
Acquisition/(disposal) of subsidiary - - - -
Disposals (63,438) (14,564) (60,600) (536,257)
Revaluations 10,206,472 154,663 - -
Transfers (from revaluation adjustment) (256,508) (55,392) - -
Impairment/derecognition - (4,133) (72,250) (85,033)
Transfers 106,359 138,994 133,791 8,650
Exchange translation difference 22,573 66,401 17,881 30,375
At the end of the year 40,878,100 14,890,285 9,032,328 9,521,490
Accumulated depreciation and impairment
At the beginning of the year (690,842) (2,085,743) (3,577,489) (5,465,486)
Charge for the year (353,762) (347,129) (633,647) (938,299)
(Acquisition)/disposal of subsidiary - - - -
Disposals 7,669 5,656 49,105 504,378
Revaluations - - - -
Transfers (from revaluation adjustment) 256,508 55,392 - -
Impairment / derecognition - 2,659 60,857 68,801
Transfers 2,079 34,300 653 3,981
Exchange translation difference (6,781) (32,961) (8,488) (19,717)
At the end of the year (785,129) (2,367,826) (4,109,009) (5,846,342)
Carrying value
As at 31 March 2017 40,092,971 12,522,459 4,923,319 3,675,148
As at 31 March 2016 29,953,873 11,541,882 4,685,724 3,664,814
Notes to the Financial Statements
21.2. Property, plant and equipment - Company
In LKR '000s Plant and
machinery
Equipment,
furniture
Motor
vehicles
Total
2017
Total
2016
Cost
At the beginning of the year 3,704 332,600 77,512 413,816 415,265
Additions - 11,110 - 11,110 30,002
Disposals - (92,374) - (92,374) (31,451)
At the end of the year 3,704 251,336 77,512 332,552 413,816
Accumulated depreciation and impairment
At the beginning of the year (3,322) (270,128) (24,327) (297,777) (289,214)
Charge for the year (123) (21,041) (11,878) (33,042) (33,415)
Disposals - 92,180 - 92,180 24,852
At the end of the year (3,445) (198,989) (36,205) (238,639) (297,777)
Carrying value
As at 31 March 2017 259 52,347 41,307 93,913
As at 31 March 2016 382 62,472 53,185 116,039

Group Highlights | Governance | Management Discussion & Analysis | Financial Statements | Supplementary Information 227
Motor vehicles
Freehold Leasehold Returnable
containers
Others Vessels Capital
work in
progress
Total
2017
Total
2016
609,764 13,292 848,129 3,940,867 504,487 511,402 68,093,794 63,142,568
53,629 - 169,276 612,877 - 577,434 4,331,582 4,582,064
- - - - - - - 547,955
(20,471) - (12,373) (210,466) - (59,454) (977,623) (1,507,360)
- - - - - - 10,361,135 1,262,114
- - - - - - (311,900) (294,393)
- - - (22,108) - - (183,524) -
319 - - 9,899 - (434,390) (36,378) (62,802)
1,481 - - 1,631 - 2,999 143,341 423,648
644,722 13,292 1,005,032 4,332,700 504,487 597,991 81,420,427 68,093,794
(354,924) (6,857) (494,688) (2,534,152) (147,238) - (15,357,419) (13,579,973)
(67,581) - (65,371) (468,282) - - (2,874,071) (2,782,315)
- - - - - - - (87,249)
18,763 - 11,533 181,417 - - 778,521 889,949
- - - - - - - 315,257
- - - - - - 311,900 -
- - - 17,926 - - 150,243 -
- - - (4,635) - - 36,378 86,189
(1,000) - - (659) - - (69,606) (199,277)
(404,742) (6,857) (548,526) (2,808,385) (147,238) - (17,024,054) (15,357,419)
239,980 6,435 456,506 1,524,315 357,249 597,991 64,396,373
254,840 6,435 353,441 1,406,715 357,249 511,402 52,736,375
21.3. Revaluation of land and buildings
Accounting judgements, estimates and
assumptions
The Group uses the revaluation model
of measurement of land and buildings.
The Group engaged independent expert
valuers, to determine the fair value of its
land and buildings. Fair value is determined
by reference to market-based evidence of
transaction prices for similar properties.
Valuations are based on open market
prices, adjusted for any difference in the
nature, location or condition of the specific
property. These valuation techniques that
are appropriate in the circumstances and for
which sufficient data is available to measure
fair value, maximising the use of relevant
observable inputs and minimizing the use
of unobservable inputs. The date of the most
recent revaluation was on 31 March 2017.
The changes in fair value recognised in
other comprehensive income and in the
statement of equity. The valuer has used
valuation techniques such as market
values and discounted cash flow methods
where there was lack of comparable
market data available based on the nature
of the property.

228 John Keells Holdings PLC | Annual Report 2016/17
21. Property, plant and equipment (Contd.)
21.3. Revaluation of land and buildings
Details of Group's land, building and other properties stated at valuation are indicated below;
Significant unobservable inputs
Property Name of the
chartered
valuation
surveyor
Method of
valuation*
Estimated price
per perch
Estimated price per
square foot
Estimated
discount
rate
Correlation
to fair value
Land
Ahungalla Holiday
Resorts (Pvt) Ltd.
S Fernando DCC LKR275,000 - - Positive
Resort Hotels Ltd. P B Kalugalagedara OMV LKR125,000 - - Positive
Nuwara Eliya Holiday
Resorts (Pvt) Ltd.
S Fernando IM - - 10% Negative
Trinco Walk Inn Ltd. P B Kalugalagedara OMV LKR125,000 - - Positive
Wirawila Walk Inn Ltd. S Fernando IM - - 8% Negative
Land & Building
Asian Hotels &
Properties PLC.
P B Kalugalagedara OMV / DCC LKR10,000,000-
LKR15,000,000
LKR2,000-LKR15,000 - Positive
Beruwala Holiday
Resorts (Pvt ) Ltd.
-do- DCC LKR550,000-LKR700,000 LKR3,000-LKR10,500 - Positive
Ceylon Cold Stores PLC. -do- DCC LKR125,000-LKR150,000 LKR500-LKR4,500 - Positive
Kandy Walk Inn Ltd. S Fernando OMV LKR400,000-LKR1,000,000 LKR850-LKR8,000 - Positive
Keells Food Products
PLC.
P B Kalugalagedara OMV LKR 350,000 LKR400-LKR1,600 - Positive
Keells Realtors Ltd.
(Ferguson
Road,Colombo 15. Lot A
IN,SP 2016)"
-do- OMV LKR1,700,000 LKR500-LKR1,000 - Positive
Mackinnons Keells Ltd. -do- OMV LKR6,500,000 LKR1,500 - Positive
Tea Smallholder
Factories PLC.
K T D Tissera CM LKR3,000-LKR7,800 LKR500-LKR2,000 - Positive
Transware Logistics
(Pvt) Ltd.
-do- DCC LKR175,000-LKR250,000 LKR500-LKR2,250 - Positive
Trinco Holiday Resorts
(Pvt) Ltd.
P B Kalugalagedara DCC LKR200,000 LKR1,000-LKR7,000 - Positive
Union Assurance PLC. -do- OMV LKR10,000,000 LKR500-LKR4,000 - Positive
Whittal Boustead
(Pvt) Ltd. 199,Union
Place,Colombo 2
-do- OMV LKR5,250,000 LKR1,000-LKR2,000 - Positive
Whittal Boustead
(Pvt) Ltd. 148,Vauxhall
Street,Colombo 2
-do- OMV LKR4,500,000 LKR1,000-LKR4,000 - Positive
Notes to the Financial Statements

Group Highlights | Governance | Management Discussion & Analysis | Financial Statements | Supplementary Information 229
Significant unobservable inputs
Property Name of the
chartered
valuation
surveyor
Method of
valuation*
Estimated price
per perch
Estimated price per
square foot
Estimated
discount
rate
Correlation
to fair value
Whittal Boustead (Pvt)
Ltd. "Ulex Villa",Badulla
Road,Nuwara Eliya
P B Kalugalagedara DCC LKR1,250,000 LKR500-LKR1,400 - Positive
Building on leasehold land
Ceylon Holiday Resorts
Ltd.
P B Kalugalagedara OMV - LKR1,000-LKR3,500 - Positive
Keells Food Products
PLC.
- do - OMV - LKR5,000-LKR7,000 - Positive
Habarana Lodge Ltd. S Fernando DCC - LKR500-LKR10,250 - Positive
Habarana Walk Inn Ltd. -do- DCC - LKR2,500-LKR7,500 - Positive
Hikkaduwa Holiday
Resorts (Pvt) Ltd.
P B Kalugalagedara DCC - LKR1,000-LKR5,250 - Positive
Jaykay Marketing
Services (Pvt) Ltd.
-do- IM - - 6% Negative
John Keells
Warehousing (Pvt) Ltd.
K T D Tissera CM - LKR1,500-LKR2,500 - Positive
Rajawella Holdings Ltd. P B Kalugalagedara DCC LKR6,250-LKR43,750 - - Positive
Trans Asia Hotels PLC. -do- DCC - LKR350-LKR8,000 - Positive
Yala Village (Pvt ) Ltd. S Fernando OMV - LKR1,000-LKR8,000 - Positive
Effective date of valuation were as at 31 March 2017 except for Union Assurance PLC which was valued as at 31 December 2015.
*Summary description of valuation
methodologies;
Open market value method (OMV)
Open market value method uses prices and
other relevant information generated by
market transactions involving identical or
comparable assets, liabilities or a group of
assets and liabilities, such as a business.
Direct capital comparison method (DCC)
This method may be adopted when the
rental value is not available for the property
concerned, but there are evidences of sale
price of properties as a whole. In such cases,
the capitalized value of the property is fixed
by direct comparison with capitalized value
of similar property in the locality.
Contractors method (CM)
The replacement cost (contractor's) method
is used to value properties which do not
generally exchange on the open market and
for which comparable evidence therefore
does not exist. The valuations are based on
two components: the depreciated cost of the
building element and the market value of the
land. Current build costs and often the land
price will be established by comparison.
Investment method (IM)
The investment method is used to value
properties which are let to produce an income
for the investor. Conventionally, investment
value is a product of rent and yield. Each of
these elements is derived using comparison
techniques.
21.4. The carrying amount of revalued land and buildings if they were carried at cost less depreciation and impairment, would be as
follows;
Group
As at 31 March
In LKR '000s
2017 2016
Cost 18,226,653 15,028,727
Accumulated depreciation and impairment (2,796,120) (2,099,601)
Carrying value 15,430,533 12,929,126
Group land and buildings with a carrying value of LKR 7,331 mn (2016 - LKR 6,925 mn) have been pledged as security for term loans obtained,
details of which are disclosed in note 36.3.
Group property, plant and equipment with a cost of LKR 5,983 mn (2016 - LKR 6,517 mn) have been fully depreciated and continue to be in use by
the Group. The cost of fully depreciated assets of the Company amounts to LKR 148 mn (2016 – LKR 268 mn).

230 John Keells Holdings PLC | Annual Report 2016/17
Notes to the Financial Statements
22. Leases
Accounting Policy
Leases
The determination of whether an arrangement
contains a lease is based on the substance
of the arrangement at the inception date,
whether fulfillment of the arrangement is
dependent on the use of a specific asset or
23. Investment property
Accounting policy
Investment properties are measured initially
at cost, including transaction costs. The
carrying value of an investment property
includes the cost of replacing part of an
existing investment property, at the time
assets or the arrangement conveys a right to
use the asset, even if that right is not explicitly
specified in an arrangement.
For arrangements entered prior to 1 April
2011, the date of inception is deemed to be 1
April 2011 in accordance with the SLFRS 1.
Lease rentals paid in advance
Prepaid lease rentals paid to acquire land
use rights, are amortised over the lease term
and assessed for impairment whenever
there is an indication that the asset may be
impaired.
22.1. Lease rentals paid in advance
Group
As at 31 March
In LKR '000s
Note 2017 2016
At the beginning of the year 10,888,158 8,709,033
Addition for the year 2,657,012 607,155
Acquisition of subsidiary (lease hold right) 9.2 - 1,507,818
Amortisation for the year (592,983) (738,407)
Exchange gain/(loss) 253,871 802,559
At the end of the year 13,206,058 10,888,158
Prepaid lease rentals paid in advance to acquire land use rights have been classified as lease rentals paid in advance and are amortised over the
lease term in accordance with the pattern of benefits provided.
22.2. Details of lease rentals paid in advance
Amount
Property Land extent
(in acres)
Lease period 2017
In LKR '000s
2016
In LKR '000s
Fantasea World Investment (Pte) Ltd.
Chaaya Lagoon Hakuraa Huraa, Republic of Maldives
13.42 33 years from 27-08-2014 326,141 327,438
John Keells Warehousing (Pvt) Ltd.
Muthurajawela
6.00 50 years from 19-09-2001 36,935 38,024
Rajawella Holdings Ltd.
Digana
517.09 99 years from 02-12-1996 1,496,584 1,516,890
Tea Smallholder Factories PLC.
Karawita Tea Factory
4.98 50 years from 15-08-1997 2,655 2,741
The Colombo Ice Company (Pvt) Ltd.
Avissawella
9.30 50 Years from 18-07-2016 174,701 -
Tranquility (Pte) Ltd.
Chaaya Island Dhonveli, Republic of Maldives
18.62 35 Years from 26-08-2010 9,121,221 6,917,044
Trans Asia Hotels PLC.
Colombo
7.65 99 years from 07-08-1981 781,452 793,856
Travel Club (Pte) Ltd.
Chaaya Reef Ellaidhoo, Republic of Maldives
13.75 14 years from 04-08-2006 1,207,738 1,230,540
Yala Village (Pvt) Ltd.
Kirinda
11.25 30 years from 27-11-1997 58,631 61,625
13,206,058 10,888,158
that cost is incurred if the recognition
criteria are met, and excludes the costs
of day to- day servicing of the investment
property. Subsequent to initial recognition,
the investment properties are stated at fair
values, which reflect market conditions at the
reporting date.
Gains or losses arising from changes in fair
value are included in the income statement
in the year in which they arise. Fair values
are evaluated at least every 3 years by an
accredited external, independent valuer.

Group Highlights | Governance | Management Discussion & Analysis | Financial Statements | Supplementary Information 231
Group
As at 31 March
In LKR '000s
2017 2016
Carrying value
At the beginning of the year 4,878,406 4,608,941
Additions 4,220 6,590
Change in fair value during the year 483,554 262,875
At the end of the year 5,366,180 4,878,406
Freehold property 5,189,917 4,752,406
Leasehold property 176,263 126,000
5,366,180 4,878,406
Rental income earned 562,215 517,821
Direct operating expenses incurred 187,545 172,132
Accounting judgements, estimates and
assumptions
Fair value of the investment property is
ascertained by independent valuations carried
out by Chartered valuation surveyors, who
have recent experience in valuing properties
of akin location and category. Investment
property is appraised in accordance with
LKAS 40, SLFRS 13 and the 8th edition of
International Valuation Standards published
by the International Valuation Standards
Committee (IVSC) by the independent
valuers. In determining the fair value, the
current condition of the properties, future
usability and associated re-development
requirements have been considered. Also,
the valuers have made reference to market
evidence of transaction prices for similar
properties, with appropriate adjustments for
size and location. The appraised fair values
are rounded within the range of values.
The changes in fair value recognised in the
income statement. The determined fair values
of investment properties, using investment
method, are most sensitive to the estimated
yield as well as the long term occupancy rate.
Investment properties are derecognised when
disposed, or permanently withdrawn from
use because no future economic benefits are
expected. Any gains or losses on retirement
or disposal are recognised in the income
statement in the year of retirement or disposal.
Transfers are made to or from investment
property only when there is a change in use
for a transfer from investment property to
owner occupied property or inventory (WIP).
The deemed cost for subsequent accounting
is the fair value at the date of change in
use. If owner occupied property becomes
an investment property or inventory (WIP),
the Group accounts for such property in
accordance with the policy stated under
property, plant and equipment up to the date
of change in use. Where Group companies
occupy a significant portion of the investment
property of a subsidiary, such investment
properties are treated as property, plant
and equipment in the consolidated financial
statements, and accounted using Group
accounting policy for property, plant and
equipment.
Description of valuation techniques used and key inputs to valuation on investment properties:
Significant unobservable inputs
Property Name of the
Chartered Valuation
Surveyor
* Method of valuation Estimated price
per perch
Estimated
price per
square foot
Estimated
discount
rate
Correlation
to Fair Value
Freehold property
Asian Hotels and Properties PLC.
Crescat Boulevard, Colombo 3
P B Kalugalagedara IM - - 6.25% Negative
Ceylon Cold Stores PLC. Inner
Harbour Road, Trincomalee
- do - OMV/DCC LKR 1,000,000 LKR 1,000 -
LKR 2,000
- Positive
John Keells Properties Ja-Ela
(Pvt) Ltd. Kapuwatte
- do - DCC LKR 800,000 LKR 5,500 - Positive
Keells Realtors Ltd. Ferguson
Road, Colombo 15.
- do - OMV/DCC LKR 1,700,000 LKR 1,000 - Positive
John Keells PLC. 17/1, Temple
Road, Ekala, Ja-Ela.
- do - Market comparable
method
LKR 350,000 -
LKR 450,000
- - Positive
Facets (Pvt) Ltd. Ahungalla. S Fernando IM - - 9.00% Negative
Leasehold property
Tea Smallholder Factories PLC.
Stores Complex, Peliyagoda
P B Kalugalagedara OMV/DCC LKR 900,000 LKR 1,100 - Positive
* Summary description of valuation methodologies can be found in property plant and equipment note no 21.3.

232 John Keells Holdings PLC | Annual Report 2016/17
Notes to the Financial Statements
24. Intangible assets
Accounting policy
Basis of recognition
An Intangible asset is recognised if it is
probable that future economic benefits
associated with the asset will flow to the
Group and the cost of the asset can be
reliably measured.
Basis of measurement
Intangible assets acquired separately are
measured on initial recognition at cost.
The cost of intangible assets acquired in a
business combination is the fair value as at
the date of acquisition.
Following initial recognition, intangible assets
are carried at cost less any accumulated
amortisation and any accumulated
impairment losses.
Internally generated intangible assets,
excluding capitalized development costs, are
not capitalised, and expenditure is charged
to income statement in the year in which the
expenditure is incurred.
Useful economic lives, amortisation and
impairment
The useful lives of intangible assets are
assessed as either finite or indefinite lives.
Intangible assets with finite lives are amortised
over the useful economic life and assessed for
impairment whenever there is an indication
that the intangible asset may be impaired.
The amortisation period and the amortization
method for an intangible asset with a finite
useful life is reviewed at least at each
financial year-end and treated as accounting
estimates. The amortization expense
on intangible assets with finite lives is
recognised in the income statement.
Intangible assets with indefinite useful lives
and Goodwill are not amortised but tested
for impairment annually, or more frequently
when an indication of impairment exists
either individually or at the cash-generating
unit level. The useful life of an intangible asset
with an indefinite life is reviewed annually to
determine whether indefinite life assessment
continues to be supportable. If not, the change
in the useful life assessment from indefinite
to finite is made on a prospective basis.
Present value of acquired in-force business
(PVIB)
The present value of future profits on a
portfolio of long term life insurance contracts
as at the acquisition date is recognised as an
intangible asset based on a valuation carried
out by an independent actuary. Subsequent
to initial recognition, the intangible asset is
carried at cost less accumulated amortization
and accumulated impairment losses.
The PVIB is amortised over the average
useful life of the related contracts in the
portfolio. The amortisation charge and any
impairment losses would be recognised in
the consolidated income statement as an
expense.
Purchased software
Purchased software is recognised as an
intangible asset and is amortised on a
straight line basis over its useful life.
Software license
Software license costs are recognised as
an intangible asset and amortised over the
period of the related license.
Research and development costs
Research costs are expensed as incurred. An
intangible asset arising from development
expenditure on an individual project is
recognised as an intangible asset, when the
Group can demonstrate:
• the technical feasibility of completing the
intangible asset so that it will be available
for use or sale,
• its intention to complete and its ability to
use or sell the assets,
• how the assets will generate future
economic benefits,
• the availability of resources to complete
the assets and
• the ability to measure reliably the
expenditure during development.
Following initial recognition of the
development expenditure of an asset, the
cost model is applied requiring the asset
to be carried at cost less any accumulated
amortisation and accumulated impairment
losses.
Amortisation of the asset begins when
development is complete and the asset is
available for use. It is amortised over the
period of expected future benefit from the
use or expected future sales from the related
project. During the period of development, the
asset is tested for impairment annually.
A summary of the policies applied to the Group’s intangible assets is as follows.
Intangible assets Useful life Type Impairment testing
PVIB 12
AcquiredWhen indicators of impairment exists. The amortization method is reviewed at
each financial year endPurchased software 5
Software license 5
Developed software 5 Internally
generated
Annually for assets not yet in use and more frequently when indicators of
impairment arise. Assets in use, when indicators of impairment arise. The
amortization method is reviewed at each financial year end.
Gains or losses arising from derecognition of an intangible asset are measured as the difference between the net disposal proceeds and the
carrying amount of the asset and are recognised in the income statement when the asset is derecognised.

Group Highlights | Governance | Management Discussion & Analysis | Financial Statements | Supplementary Information 233In
tan
gib
le a
ss
ets
As
at
31
Ma
rch
Gro
up
Co
mp
an
y
LK
R '0
00
s 2
01
7
20
16
20
17
20
16
So
ftw
are
No
teD
eve
lop
ed
P
urc
ha
se
dL
ice
ns
es
WIP
PV
IB
Go
od
wil
lO
the
rS
oft
wa
re l
ice
ns
es
Co
st/
carr
yin
g v
alu
e
At
the b
eg
inn
ing
of
the
ye
ar
55
2,1
53
1
81
,24
7
59
9,3
37
6
,58
9
2,2
49
,00
0
73
8,5
96
4
9,5
00
4
,37
6,4
22
4
,42
8,0
71
4
91
,08
1
48
6,8
85
Ad
dit
ion
s 2
,85
4
74
,39
8
27
,28
6
9,8
60
-
-
-
1
14
,39
8
16
2,6
08
6
,74
6
4,1
96
Tra
nsf
ers
9,9
78
-
-
(
9,9
78
) -
-
-
-
7
,38
4
-
Dis
po
sal
-
-
-
-
-
-
-
-
(1
0,4
00
) -
-
Acq
uis
itio
n/(
dis
po
sal)
of
sub
sid
iary
9.2
-
-
-
-
-
-
-
-
4,5
23
-
-
Imp
air
men
t (
1,0
29
) -
-
(
23
) -
-
-
(
1,0
52
) (
21
5,7
64
) -
-
At
the e
nd
of
the
ye
ar
56
3,9
56
2
55
,64
5
62
6,6
23
6
,44
8
2,2
49
,00
0
73
8,5
96
4
9,5
00
4
,48
9,7
68
4
,37
6,4
22
4
97
,82
7
49
1,0
81
Acc
um
ula
ted
am
ort
isa
tio
n a
nd
imp
air
me
nt
At
the b
eg
inn
ing
of
the
ye
ar
(9
2,4
19
) (
11
5,0
33
) (
51
9,1
97
) -
(
1,3
11
,91
3)
-
-
(2
,03
8,5
62
) (
1,7
08
,61
4)
(4
47
,26
1)
(4
23
,60
2)
Am
ort
isa
tio
n
(7
7,5
56
) (
31
,92
3)
(3
6,1
51
) -
(
18
7,4
16
) -
-
(
33
3,0
46
) (
32
0,5
64
) (
19
,76
5)
(2
3,6
59
)
Tra
nsf
ers
-
-
-
-
-
-
-
-
(6
,38
5)
-
-
Dis
po
sal
-
-
-
-
-
-
-
-
1,0
40
-
-
(Acq
uis
itio
n)/
dis
po
sal o
f su
bsi
dia
ry9
.2 -
-
-
-
-
-
-
-
(
4,0
39
) -
-
At
the e
nd
of
the
ye
ar
(1
69
,97
5)
(1
46
,95
6)
(5
55
,34
8)
-
(1
,49
9,3
29
) -
-
(
2,3
71
,60
8)
(2
,03
8,5
62
) (
46
7,0
26
) (
44
7,2
61
)
Ca
rryi
ng
va
lue
As
at
31
Ma
rch
20
17
39
3,9
81
1
08
,68
9
71
,27
5
6,4
48
7
49
,67
1
73
8,5
96
4
9,5
00
2
,11
8,1
60
3
0,8
01
As
at
31
Ma
rch
20
16
45
9,7
34
6
6,2
14
8
0,1
40
6
,58
9
93
7,0
87
7
38
,59
6
49
,50
0
2,3
37
,86
0
43
,82
0

234 John Keells Holdings PLC | Annual Report 2016/17
Notes to the Financial Statements
24. Intangible assets (Contd.)
Present value of acquired in-force business (PVIB)
Upon acquiring a controlling stake in Union Assurance PLC . (UA), the Group has recognised in the consolidated financial statements an intangible
asset representing the present value of future profits on UA’s portfolio of long term life insurance contracts, known as the present value of acquired
in-force business (PVIB) at the acquisition date. Further, PVIB recognised at the acquisition date will be amortised over the estimated life of the
business acquired and reviewed annually for any impairment in value.
Net carrying value of goodwill
As at 31 March
In LKR '000s
2017
Goodwill acquired through business combinations have been allocated to 5 cash generating units (CGU's) for impairment
testing as follows;
Airline Services 5,054
Cinnamon Hotels and Resorts 166,248
Consumer Foods and Retail 299,293
Financial Services 265,360
Logistics, Ports and Shipping 2,641
738,596
The recoverable amounts of all CGUs have been determined based on the fair value, less cost to sell or the value in use (VIU) calculation.
Accounting judgements, estimates and
assumptions
Impairment of goodwill
Impairment exists when the carrying value
of an asset or cash generating unit exceeds
its recoverable amount, which is the higher
of its fair value less costs to sell and its value
in use (VIU). The fair value less costs to sell
calculation is based on available data from an
active market, in an arm’s length transaction,
of similar assets or observable market prices
less incremental costs for disposing of the
asset. The value in use calculation is based
on a discounted cash flow model. The cash
flows are derived from the budget for the next
five years and do not include restructuring
activities that the Group is not yet committed
to or significant future investments that
will enhance the asset’s performance of
the cash generating unit being tested. The
recoverable amount is most sensitive to the
discount rate used for the discounted cash
flow model as well as the expected future
cash inflows and the growth rate used for
extrapolation purposes. The key assumptions
used to determine the recoverable amount
for the different cash generating units, are as
follows;
Gross margins
The basis used to determine the value
assigned to the budgeted gross margins
is the gross margins achieved in the year
preceding the budgeted year adjusted for
projected market conditions.
Discount rates
The discount rate used is the risk free rate,
adjusted by the addition of an appropriate
risk premium.
Inflation
The basis used to determine the value
assigned to the budgeted cost inflation is the
inflation rate based on projected economic
conditions.
Volume growth
Volume growth has been budgeted on a
reasonable and realistic basis by taking into
account the growth rates of one to four years,
immediately subsequent to the budgeted year
based on Industry growth rates. Cash flows
beyond the five year period are extrapolated
using 0% growth rate.
The recoverable amounts of all CGUs have
been determined based on the fair value,
less cost to sell or the value in use (VIU)
calculation.
25.1. Carrying value
Company
As at 31 March
In LKR '000s
Note 2017 2016
Investment in subsidiaries
Carrying value
Investments in subsidiaries
Quoted 25.2 19,216,229 19,101,303
Unquoted 25.3 23,771,166 17,283,343
42,987,395 36,384,646
25. Investment in subsidiaries
Accounting policy
Investment In subsidiaries are initially recognised at cost in the financial statements of the Company.
Any transaction cost relating to acquisition of investment in subsidiaries is immediately recognised
in the income statement. Following initial recognition, Investments in subsidiaries are carried at cost
less any accumulated impairment losses.

Group Highlights | Governance | Management Discussion & Analysis | Financial Statements | Supplementary Information 235
25.2. Cost
Group Company
As at 31 March 2017 2017 2016
Number of
shares
Effective
holding %
Number of
shares
Effective
holding %
Cost
LKR ’000s
Cost
LKR ’000s
Group quoted investments
Asian Hotels and Properties PLC. 347,824,190 78.56 347,824,190 78.56 5,301,660 5,278,888
Ceylon Cold Stores PLC. 77,321,208 81.36 67,109,128 70.61 1,450,473 1,396,691
John Keells Hotels PLC. 1,169,598,478 80.32 1,169,598,478 80.32 7,102,140 7,102,140
John Keells PLC. 52,834,784 86.90 52,834,784 86.90 458,036 444,745
Keells Food Products PLC. 23,350,658 88.53 19,110,399 74.94 1,052,311 1,040,298
Tea Smallholder Factories PLC. 11,286,000 37.62 11,286,000 37.62 63,466 63,466
Trans Asia Hotels PLC. 184,107,284 82.74 97,284,256 48.64 1,604,606 1,601,482
Union Assurance PLC. 55,344,310 93.92 50,981,538 86.51 2,183,537 2,173,593
19,216,229 19,101,303
Group Company
As at 31 March
In LKR '000s
2017 2016 2017 2016
Market Value
Group quoted investments
Asian Hotels and Properties PLC. 19,304,243 16,625,996 19,304,243 16,625,996
Ceylon Cold Stores PLC. 62,707,500 33,248,119 54,425,503 28,856,925
John Keells Hotels PLC. 11,695,985 14,035,182 11,695,985 14,035,182
John Keells PLC. 2,699,857 3,698,435 2,699,857 3,698,435
Keells Food Products PLC. 3,385,845 3,969,612 2,771,008 3,248,768
Tea Smallholder Factories PLC. 270,864 220,077 270,864 220,077
Trans Asia Hotels PLC. 13,826,457 14,710,172 7,306,048 7,773,012
Union Assurance PLC. 7,858,892 8,849,555 7,239,378 8,151,948
121,749,643 95,357,148 105,712,886 82,610,343
25.3. Group unquoted investments
Group Company
As at 31 March 2017 2017 2016
Number of
shares
Effective
holding %
Number of
shares
Effective
holding %
Cost
LKR ’000s
Cost
LKR ’000s
Ahungalla Holiday Resort (Pvt) Ltd. 13,275,000 80.32 - - - -
Beruwala Holiday Resorts (Pvt ) Ltd. 219,725,653 79.78 - - 1,352 1,192
British Overseas (Pvt) Ltd 61 61.00 61 61.00 - 57,001
Ceylon Holiday Resorts Ltd. 12,119,739 79.24 - - 2,742 1,707
Cinnamon Hotels Management Services Ltd. 1,000,000 100.00 1,000,000 100.00 161,507 101,313
Cinnamon Holidays (Pvt) Ltd. 20,000 80.32 - - - -
Facets (Pvt) Ltd. 15,000 100.00 15,000 100.00 - -
Fantasea World Investments (Pte) Ltd. 7,299 80.32 - - 1,736 1,196
Habarana Lodge Ltd. 12,981,548 78.99 - - 3,369 2,705
Habarana Walk Inn Ltd. 4,321,381 79.34 - - 1,643 1,135
Hikkaduwa Holiday Resorts (Pvt) Ltd. 107,596,700 79.24 - - 1,138 974
InfoMate (Pvt) Ltd. 2,000,000 100.00 2,000,000 100.00 29,488 26,568
International Tourists and Hoteliers Ltd. 38,490,901 79.78 - - - -
J K Packaging (Pvt) Ltd. 1,450,000 100.00 1,450,000 100.00 - -
JKOA Mobiles (Pvt) Ltd. 800,000 100.00 800,000 100.00 - -
JayKay Marketing Services (Pvt) Ltd. 282,239,025 81.36 - - 111,355 73,648
John Keells BPO Holdings (Pvt) Ltd. 19,000,000 100.00 - - - -
John Keells BPO International (Pvt) Ltd. 1,500,000,000 100.00 - - - -
John Keells BPO Investments (Pvt) Ltd. 14,700 100.00 - - - -
John Keells BPO Investments (Pvt) Ltd. - Preference A 57,200,000 - - - - -

236 John Keells Holdings PLC | Annual Report 2016/17
Notes to the Financial Statements
Group Company
As at 31 March 2017 2017 2016
Number of
shares
Effective
holding %
Number of
shares
Effective
holding %
Cost
LKR ’000s
Cost
LKR ’000s
John Keells BPO Solutions Canada (Pvt) Ltd. 5,000 100.00 - - - -
John Keells BPO Solutions India (Pvt) Ltd. 34,131,306 100.00 - - - -
John Keells BPO Solutions Lanka (Pvt) Ltd. 32,843,578 100.00 - - - -
John Keells BPO Solutions US (Pvt) Ltd. 5,000 100.00 - - - -
John Keells Computer Services (Pvt) Ltd. 9,650,000 100.00 9,650,000 100.00 115,738 111,664
John Keells Computer Services (UK) Ltd. 100 100.00 100 100.00 9 9
John Keells Foods India (Pvt) Ltd. 8,999,990 89.65 - - - -
John Keells Holdings Mauritius (Pvt) Ltd. 2,303,225 100.00 2,303,225 100.00 - 38,007
John Keells International (Pvt) Ltd. 199,160,000 100.00 199,160,000 100.00 659,292 1,473,635
John Keells Logistics (Pvt) Ltd. 19,999,998 100.00 19,999,998 100.00 209,049 205,652
John Keells Maldivian Resorts (Pte) Ltd. 49,044,238 80.32 - - 9,934 6,666
John Keells Office Automation (Pvt) Ltd. 500,000 100.00 500,000 100.00 40,291 30,928
John Keells Properties (Pvt) Ltd. 24,000,000 100.00 24,000,000 100.00 192,169 192,169
John Keells Properties Ja-ela (Pvt) Ltd. 95,436,000 100.00 95,436,000 100.00 954,360 954,360
John Keells Residential Properties (Pvt) Ltd. 2,081,698 100.00 2,081,698 100.00 20,817 20,817
John Keells Singapore (Pte) Ltd. 160,000 80.00 160,000 80.00 4,209 4,209
John Keells Stock Brokers (Pvt) Ltd. 1,500,00 90.04 360,000 24.00 46,772 23,162
John Keells Teas Ltd. 12,000 100.00 12,000 100.00 11,903 7,895
John Keells Warehousing (Pvt) Ltd. 12,000,000 86.90 - - 2,680 1,803
Kandy Walk Inn Ltd. 6,165,484 79.03 - - 2,291 1,637
Keells Consultants (Pvt) Ltd. 4,621 100.00 4,621 100.00 1,094 2,554
Keells Realtors Ltd. 7,500,000 95.81 5,100,000 68.00 119,124 30,000
Keells Shipping (Pvt) Ltd. 50,000 100.00 50,000 100.00 502 502
Lanka Marine Services (Pvt) Ltd. 34,805,470 99.44 34,805,470 99.44 1,352,042 1,338,947
Mack Air (Pvt) Ltd. 90,133 100.00 90,133 100.00 14,629 50,221
Mack Air Services Maldives (Pvt) Ltd. 4,900 49.00 4,700 47.00 2,021 2,021
Mackinnon Keells Ltd. 806,443 100.00 806,443 90.00 364,476 11,912
Mackinnon Mackenzie and Company (Shipping) Ltd. 139,112 100.00 - - - -
Mackinnon Mackenzie and Company of (Ceylon) Ltd. 2,645 100.00 245 9.26 - -
Mackinnons Travels (Pvt) Ltd. 499,996 100.00 499,996 100.00 19,888 16,490
Mortlake (Pvt) Ltd. 43 100.00 43 100.00 20,000 327,240
Nuwara Eliya Holiday Resort (Pvt) Ltd. 31,606,252 80.32 - - - -
Rajawella Holdings Ltd. 25,615,561 49.85 11,573,339 45.18 801,707 801,707
Rajawella Hotels Company Ltd. 3,157,384 80.32 - - - -
Resort Hotels Ltd. 106,107 79.24 - - - -
Serene Holidays (Pvt) Ltd. 800,000 98.74 - - - -
The Colombo Ice Company (Pvt) Ltd. 27,000,000 81.36 - - - -
Tranquility (Pte) Ltd. 637,499 80.32 - - 3,187 2,011
Trans-ware Logistics (Pvt) Ltd. 11,000,007 50.00 11,000,007 50.00 114,577 114,577
Travel Club (Pte) Ltd. 29,059 80.32 - - 1,811 1,593
Trinco Holiday Resort (Pvt) Ltd 8,120,005 80.32 - - 1,684 1,167
Trinco Walk Inn Ltd. 3,000,007 80.32 - - - -
Walkers Tours Ltd. 4,925,577 98.51 4,925,577 98.51 169,351 153,359
25. Investment in subsidiaries (Contd.)
25.3. Group unquoted investments (Contd.)
Notes to the Financial Statements

Group Highlights | Governance | Management Discussion & Analysis | Financial Statements | Supplementary Information 237
Group Company
As at 31 March 2017 2017 2016
Number of
shares
Effective
holding %
Number of
shares
Effective
holding %
Cost
LKR ’000s
Cost
LKR ’000s
Waterfront Properties (Pvt) Ltd. 2,291,082,423 94.52 1,500,266,262 65.48 15,002,663 10,661,871
Whittall Boustead (Pvt) Ltd. 9,917,823 100.00 9,917,823 73.18 2,904,582 137,790
Whittall Boustead (Travel) Ltd. 25,041,000 100.00 25,040,996 99.70 292,230 288,259
Wirawila Walk Inn Ltd. 1,646,750 80.32 - - - -
Yala Village (Pvt) Ltd. 28,268,000 75.33 - - 1,754 1,070
Yala Village (Pvt) Ltd.- Non voting preference shares 10,000,000 80.32 - - - -
23,771,166 17,283,343
26. Investment in equity accounted
investees
Accounting policy
An associate is an entity over which the
Group has significant influence. Significant
influence is the power to participate in the
financial and operating policy decisions
of the investee, but is not control or joint
control over those policies.
Associate companies incorporated in
Sri Lanka of the Group which have been
accounted for under the equity method of
accounting are:
Capitol Hotel Holdings (Pvt) Ltd.
Fairfirst Insurance Ltd. (formally known as
Union Assurance General Ltd.)
Maersk Lanka (Pvt) Ltd.
Nations Trust Bank PLC.
Saffron Aviation (Pvt) Ltd.
South Asia Gateway Terminals (Pvt) Ltd.
A joint venture is a type of joint arrangement
whereby the parties that have joint control
of the arrangement have rights to the net
assets of the joint venture. Joint control is
the contractually agreed sharing of control
of an arrangement, which exists only when
decisions about the relevant activities
require unanimous consent of the parties
sharing control.
Joint ventures incorporated in Sri Lanka
entered into by the Group, which have been
accounted for using the equity method, are:
DHL Keells (Pvt) Ltd.
NDO Lanka (Pvt) Ltd.
Sentinel Reality (Pvt) Ltd.
The considerations made in determining
significant influence or joint control are
similar to those necessary to determine
control over subsidiaries.
The Group’s investments in its associate and
joint venture are accounted for using the
equity method.
Under the equity method, the investment
in an associate or a joint venture is initially
recognised at cost. The carrying amount
of the investment is adjusted to recognise
changes in the Group’s share of net assets
of the associate or joint venture since the
acquisition date. Goodwill relating to the
associate or joint venture is included in the
carrying amount of the investment and is
not tested for impairment individually.
The income statement reflects the Group’s
share of the results of operations of the
associate or joint venture. Any change in
OCI of those investees is presented as part
of the Group’s OCI. In addition, when there
has been a change recognised directly in
the equity of the associate or joint venture,
the Group recognises its share of any
changes, when applicable, in the statement
of changes in equity.
Unrealised gains and losses resulting from
transactions between the Group and the
associate or joint venture are eliminated to
the extent of the interest in the associate or
joint venture.
The aggregate of the Group’s share of profit
or loss of an associate and a joint venture
is shown on the face of the statement of
profit or loss outside operating profit and
represents profit or loss after tax and non-
controlling interests in the subsidiaries of
the associate or joint venture.
After application of the equity method, the
Group determines whether it is necessary
to recognise an impairment loss on its
investment in its associate or joint venture.
At each reporting date, the Group determines
whether there is objective evidence that the
investment in the associate or joint venture
is impaired. If there is such evidence, the
Group calculates the amount of impairment
as the difference between the recoverable
amount of the associate or joint venture and
its carrying value, and then recognises the
loss as ‘Share of results of equity accounted
investees' in the income statement.
Upon loss of significant influence over the
associate or joint control over the joint
venture, the Group measures and recognises
any retained investment at its fair value. Any
difference between the carrying amount of
the associate or joint venture upon loss of
significant influence or joint control and the
fair value of the retained investment and
proceeds from disposal is recognised in
income statement.
The accounting policies of associate
companies and joint ventures conform to
those used for similar transactions of the
Group. Accounting policies that are specific
to the business of associate companies are
discussed below.
Equity method of accounting has been
applied for associate and joint ventures using
their corresponding/matching 12 month
financial period. In the case of associates,
where the reporting dates are different to
Group reporting dates, adjustments are
made for any significant transactions or
events up to 31 March.

238 John Keells Holdings PLC | Annual Report 2016/17
Notes to the Financial Statements
26. Investment in equity accounted (Contd.)
Investment in equity accounted investees
Group Company
As at 31 March Number of
shares
Effective
Holding %
2017
In
LKR’000s
2016
In
LKR’000s
Number of
shares
Effective
Holding %
2017
In
LKR’000s
2016
In
LKR’000s
26.1 . Investments in joint
ventures
NDO Lanka (Pvt) Ltd. 7,800,000 60.00 63,041 63,041 7,800,000 60.00 - -
Sentinel Reality (Pvt) Ltd. 5,931,300 40.16 59,313 58,288
DHL Keells (Pvt) Ltd. 1,000,000 50.00 10,000 10,000 1,000,000 50.00 10,000 10,000
26.2. Investments in associates
Quoted
Nations Trust Bank PLC. 68,951,695 29.90 1,561,355 1,561,355 46,121,532 20.00 1,011,052 1,011,052
Unquoted
Capitol Hotel Holdings (Pvt) Ltd. 3,254,832 19.47 325,483 325,483 3,254,832 19.47 325,483 325,483
Fairfirst Insurance Ltd. (formally
known as Union Assurance
General Ltd.)
68,902,870 20.66 689,718 689,718
Maersk Lanka (Pvt) Ltd. 30,000 30.00 150 150 30,000 30.00 150 150
Saffron Aviation (Pvt) Ltd. 24,887,160 40.00 248,872 248,872 24,887,160 40.00 - -
Saffron Aviation (Pvt) Ltd.
preference shares
21,774,750 217,748 174,570 21,774,750 217,748 174,570
South Asia Gateway Terminals
(Pvt) Ltd.
159,826,750 42.19 7,346,367 7,346,367 159,826,750 42.19 7,346,367 7,346,367
Cumulative profit accruing to the
Group net of dividend
4,335,610 3,886,868
Share of net assets of equity
accounted investees
2,861,230 2,584,752
17,718,887 16,949,464 8,910,800 8,867,622
Group's shareholding in Nations Trust Bank PLC.
The JKH Group currently holds 29.9% in Nations Trust Bank PLC. (NTB). The Monetary Board had previously directed that the Group reduces
its share holdings in NTB to 15% or below by April 2012. The founder shareholders including JKH had written to the Central Bank of Sri Lanka
(CBSL) requesting an extension of the deadline and a response is awaited.
Market Value Group Company
As at 31 March
In LKR '000s
2017 2016 2017 2016
Quoted
Nations Trust Bank PLC. 5,102,425 5,116,216 3,412,993 3,422,218
26.3 Summarised financial information of equity accounted investees
South Asia Gateway
Terminals (Pvt) Ltd.
Other associates Joint ventures Total
As at 31 March
In LKR '000s
2017 2016 2017 2016 2017 2016 2017 2016
Group Share of;
Revenue 4,955,789 4,336,078 6,641,880 5,703,083 1,751,781 1,433,929 13,349,450 11,473,090
Operating expenses including
cost of sales
(2,988,281) (2,680,375) (5,075,534) (4,327,546) (1,543,168) (1,302,963) (9,606,983) (8,310,884)
Net finance income 35,867 23,599 137,738 130,769 11,185 5,402 184,790 159,770
Tax expense (6,746) (3,720) (555,997) (495,148) (61,559) (41,875) (624,302) (540,743)
Share of results of equity
accounted investees
1,996,629 1,675,582 1,148,087 1,011,158 158,239 94,493 3,302,955 2,781,233

Group Highlights | Governance | Management Discussion & Analysis | Financial Statements | Supplementary Information 239
South Asia Gateway
Terminals (Pvt) Ltd.
Other associates Joint ventures Total
As at 31 March
In LKR '000s
2017 2016 2017 2016 2017 2016 2017 2016
Group share of;
Total assets 6,900,020 7,036,483 74,855,266 58,297,556 618,552 491,455 82,373,838 65,825,494
Total liabilities (1,260,608) (1,298,074) (67,857,907) (52,089,069) (266,426) (218,877) (69,384,941) (53,606,020)
Net assets 5,639,412 5,738,409 6,997,359 6,208,487 352,126 272,578 12,988,897 12,219,474
Goodwill 4,674,278 4,674,278 55,712 55,712 - - 4,729,990 4,729,990
10,313,690 10,412,687 7,053,071 6,264,199 352,126 272,578 17,718,887 16,949,464
Contingent liabilities - - - - - - - -
Capital commitments - - 409,975 593,431 - - 409,975 593,431
Other commitments and
Guarantees
- - 42,201,702 32,042,386 - - 42,201,702 32,042,386
Dividend received 2,321,179 2,341,686 383,003 171,799 150,000 75,000 2,854,182 2,588,485
The share of results of equity accounted investees in Income Statement and Other Comprehensive Statement are shown net of all related taxes.
The Group and the Company have neither contingent liabilities nor capital and other commitments towards its associates and joint ventures..
Significant accounting policies that are specific
to the business of equity accounted investees
Nations Trust Bank PLC.
Revenue recognition
Revenue is recognised to the extent that it is
probable that the economic benefits will flow
to the bank and the revenue can be reliably
measured. The following specific recognition
criteria must also be met before revenue is
recognised.
Interest income and expense
For all financial instruments interest income
or expense is recorded using the EIR. EIR is
the rate that exactly discounts estimated
future cash payments or receipts through
the expected life of the financial instrument
or a shorter period, where appropriate, to the
net carrying amount of the financial asset or
financial liability. The calculation takes into
account all contractual terms of the financial
instrument (for example, prepayment
options) and includes any fees or incremental
costs that are directly attributable to the
instrument and are an integral part of the EIR,
but not future Impairment losses.
The carrying amount of the financial asset
or financial liability is adjusted if the Group
revises its estimates of payments or receipts.
The adjusted carrying amount is calculated
based on the original EIR and the change
in carrying amount is recorded as ‘Interest
Income’ for financial assets and ‘Interest
Expense’ for financial liabilities.
Once the recorded value of a financial asset
or a group of similar financial assets has been
reduced due to an impairment loss, interest
income continues to be recognized using the
rate of interest used to discount the future
cash flows for the purpose of measuring the
impairment loss.
Fee and commission income
The Group earns fee and commission income
from a diverse range of services it provides to
its customers. Fee income can be divided into
the following two categories:
Fee income earned from services that are
provided over a certain period of time
Fees earned for the provision of services
over a period of time are accrued over that
period. These fees include commission
income and asset management, custody and
other management and advisory fees. Credit
related fees are deferred and recognised as
an adjustment to the EIR of the loan.
Fee income from providing transaction
services
Fees arising from negotiating or participating
in the negotiation of a transaction for a
third party, such as the arrangement of the
acquisition of shares or other securities
or the purchase or sale of businesses, are
recognised on completion of the underlying
transaction.
Fees or components of fees that are linked
to a certain performance are recognised after
fulfilling the corresponding criteria.
Net trading income
Results arising from trading activities include
all gains and losses from changes in fair
value.
South Asia Gateway Terminals (Pvt) Ltd.
Revenue recognition
Stevedoring revenue is recognised on the
berthing time of the vessel. Storage revenue
is recognised on the issue of delivery advice.
South Asia Gateway Terminals (Pvt) Ltd. uses
United States Dollar (USD) as their functional
currency.
Fairfirst Insurance Ltd. (formally known as
Union Assurance General Ltd.)
Revenue recognition
General insurance business-gross written
premium
Gross written premiums comprise the total
premiums received/ receivable for the whole
period of cover provided by contracts entered
into during the accounting period. GWP is
generally written upon inception of the policy.
Rebates that form part of the premium rate,
such as no-claim rebates, are deducted from
the gross written premium
Insurance contract liabilities - general
Non-life insurance contract liabilities include
the outstanding claims provision (Reserve
for gross outstanding and incurred but
not reported, and incurred and not enough
reported - IBNR/ IBNER) and the provision
for unearned premium and the provision for
premium deficiency.

240 John Keells Holdings PLC | Annual Report 2016/17
Notes to the Financial Statements
27. Non current financial assets
Group Company
As at 31 March
In LKR '000s
Note 2017 2016 2017 2016
Other quoted equity investments 326 327 - -
Other unquoted equity investments 27.1 160,369 184,456 141,972 166,059
Other non equity investments 27.2 27,505,926 22,450,661 2,648,008 341,346
27,666,621 22,635,444 2,789,980 507,405
27.1. Other unquoted equity investments
Group Company
As at 31 March
In LKR '000s
Number of
shares
2017 2016 Number of
shares
2017 2016
Asia Power (Pvt) Ltd. 388,527 141,972 166,059 388,527 141,972 166,059
Other equity instruments - 18,397 18,397 - - -
160,369 184,456 141,972 166,059
27.2. Other non equity investments
Group Company
As at 31 March
In LKR '000s
Note 2017 2016 2017 2016
Bank deposits 3,154,685 515,657 2,576,339 -
Debentures 4,244,764 4,939,118 - 268,366
Preference shares 267,275 254,024 - -
Government securities 17,750,289 15,287,098 - -
Loans to executives 27.3 733,037 618,850 71,669 72,980
Loans to life policyholders 902,300 783,373 - -
Cash flow hedge 331,679 - - -
Deposits 121,897 52,541 - -
27,505,926 22,450,661 2,648,008 341,346
27.3. Loans to executives
Group Company
As at 31 March
In LKR '000s
2017 2016 2017 2016
At the beginning of the year 786,790 699,330 92,803 82,442
Loans granted/transfers 635,300 433,303 66,469 55,949
Recoveries (504,427) (345,843) (68,951) (45,588)
At the end of the year 917,663 786,790 90,321 92,803
Receivable within one year 184,626 167,940 18,652 19,823
Receivable between one and five years 733,037 618,850 71,669 72,980
917,663 786,790 90,321 92,803

Group Highlights | Governance | Management Discussion & Analysis | Financial Statements | Supplementary Information 241
28. Other non current assets
Group Company
As at 31 March
In LKR '000s
Note 2017 2016 2017 2016
Pre paid staff cost 178,726 124,364 16,254 12,414
Work-in-progress - Cinnamon Life project 28.1 41,007,979 35,082,711 - -
Non current advances 505,611 350,073 - -
41,692,316 35,557,148 16,254 12,414
28.1. Work-in-progress - Cinnamon Life project
Freehold property* 9,598,213 9,329,665
Leasehold property* 3,618,350 3,506,883
Other constructions in progress 21,538,694 15,948,350
Contractor advances 6,252,722 6,297,813
41,007,979 35,082,711
*The freehold and leasehold properties are located at Glennie Street and Justice Akbar Mawatha, Colombo 2.
Other non-current assets represents the construction work in progress, which mainly consists of freehold land, advance on leasehold land and
other project cost incurred. Freehold land included under other non-current asset is carried at cost. Lease prepaid in advance consists of the
prepayment made to obtaining the lease land rights for 99 years. Other project cost includes advances paid to contractors, directly attributable
cost incurred on the project and capitalised borrowing costs.
Details of the Cinnamon Life project
The company is engaged in the development and construction of an integrated complex with an approximate area of 4,500,000 square feet,
comprising of offices, residential units, service apartments, a hotel and conference centre, retail and associate facilities and a car park.
Details of Freehold Property
Freehold property: Land Occupied Extent: 7A- 0R -16.63P
Details of Leasehold Property
Leased property: Land Occupied Extent: 3A- 0R -6.35P
Lessor: Board of Investment of Sri Lanka
Period: 99 years from 12/02/2014
Lease commitment: Upfront lease rental of LKR3.03 bn
29. Inventories
Accounting policy
Inventories are valued at the lower of cost
and net realizable value. Net realisable value
is the estimated selling price less estimated
costs of completion and the estimated costs
necessary to make the sale.
The costs incurred in bringing inventories
to its present location and condition, are
accounted for as follows:
• Raw materials - On a weighted average
basis
• Finished goods and work-in-progress - At
the cost of direct materials, direct labour
and an appropriate proportion of fixed
production overheads based on normal
operating capacity but excluding borrowing
costs
• Other inventories – At actual cost
Group
As at 31 March
In LKR '000s
2017 2016
Inventories
Raw materials 527,124 463,186
Finished goods 3,977,944 2,964,930
Produce stocks 216,443 207,349
Other stocks 884,201 1,029,368
Total Inventories at the lower of cost & net realisable value 5,605,712 4,664,833

242 John Keells Holdings PLC | Annual Report 2016/17
Notes to the Financial Statements
30. Trade and other receivables
Group Company
As at 31 March
In LKR '000s
Note 2017 2016 2017 2016
Trade and other receivables 11,034,918 9,482,865 99,424 149,321
Reinsurance receivables 30.1 214,342 132,298 - -
Premiums receivable 30.2 253,543 215,846 - -
Loans to executives 27.3 184,626 167,940 18,652 19,823
11,687,429 9,998,949 118,076 169,144
30.1. Reinsurance receivables
Group
As at 31 March
In LKR '000s
2017 2016
Reinsurance receivables on outstanding claims 90,342 83,873
Reinsurance receivables on settled claims net of dues 124,000 48,425
Total assets arising from reinsurance contracts 214,342 132,298
30.2. Premiums receivable
Premium receivable 253,543 215,846
253,543 215,846
31. Other current assets
Group Company
As at 31 March
In LKR '000s
2017 2016 2017 2016
Prepayments and non cash receivables 1,803,924 962,316 60,301 89,212
Tax refunds 1,461,403 1,341,115 39,141 39,141
3,265,327 2,303,431 99,442 128,353
32. Short term investments
Group Company
As at 31 March
In LKR '000s
Note 2017 2016 2017 2016
Quoted equities at market value 32.1 3,433,852 3,006,875 - -
Debentures 1,381,855 631,846 268,306 -
Bank deposits (more than 3 months and less than 1 year) 23,335,897 17,338,169 20,205,768 15,312,664
Government securities (more than 3 months and less than 1 year) 4,234,194 5,156,765 - 4,475,018
32,385,798 26,133,655 20,474,074 19,787,682
Debentures (less than 3 months) 54,671 224,652 - -
Bank deposits (less than 3 months) 26,517,145 25,283,729 23,078,904 23,482,684
Government securities (less than 3 months) 20,216,713 20,993,034 16,690,302 13,591,870
Reported in statement of cash flow 46,788,529 46,501,415 39,769,206 37,074,554
79,174,327 72,635,070 60,243,280 56,862,236

Group Highlights | Governance | Management Discussion & Analysis | Financial Statements | Supplementary Information 243
32.1. Quoted equities at market value
Number of shares Cost Market value
As at 31 March 2017 2016 2017
In LKR’000s
2016
In LKR’000s
2017
In LKR’000s
2016
In LKR’000s
Access Engineering PLC. 4,005,642 1,124,524 105,508 33,898 95,334 23,390
Aitken Spence Hotel Holdings PLC. 364,900 490,393 25,931 34,934 12,844 25,991
Aitken Spence PLC. 125,493 650,890 9,004 76,951 4,418 47,840
Alumex PLC. 3,044,222 - 60,761 - 57,840 -
Asiri Hospital Holdings PLC. - 251,297 - 5,805 - 6,032
Cargills (Ceylon) PLC. - 180,968 - 27,335 - 27,145
Central Finance Company PLC. 590,800 285,871 54,445 54,445 50,927 60,033
Ceylinco Insurance PLC. - 5,530 - 7,669 - 8284
Ceylon Cold Stores PLC. - 8,133 - 3,278 - 3497
Ceylon Tobacco Company PLC. - 68,889 - 69,125 - 69,709
Chevron Lubricants Lanka PLC. 942,314 367,677 113,683 80,777 160,193 112,141
Colombo Dockyard PLC. 281,715 281,715 60,500 60,500 21,410 30,454
Commercial Bank of Ceylon PLC. (Non voting) 664,896 654,287 47,645 47,645 68,551 73,935
Commercial Bank of Ceylon PLC. 402,280 2,233,929 41,100 238,932 52,457 280,358
DFCC Bank PLC. 482,072 973,984 81,550 143,891 54,956 133,436
Dialog Axiata PLC. 15,752,754 6,337,348 167,142 59,806 178,006 64,641
Diesel and Motor Engineering PLC. 22,062 22,062 - 33,340 - 12,128
Distilleries Company of Sri Lanka PLC. - 1,090,930 33,340 233,803 12,353 224,949
Hatton National Bank PLC. 3,306,868 2,896,275 525,175 409,681 662,197 544,433
Hemas Holdings PLC. 1,479,150 839,729 94,808 37,446 160,784 67,682
HNB Assurance PLC. 336,266 336,266 23,645 23,645 19,537 18,158
John Keells Holdings PLC. 1,230,182 1,522,660 188,208 271,431 169,642 225,354
Lanka ORIX Finance Company PLC. - 275,713 - 20,852 - 19,851
Melstacorp Limited. 4,117,164 - 222,061 - 243,736 -
National Development Bank PLC. 1,087,945 1,544,335 198,072 281,314 151,877 260,683
Nestle Lanka PLC. - 19,188 - 34,282 - 38,921
People's Insurance Limited. 1,453,951 482,500 25,320 7,238 26,607 8155
Peoples Leasing and Finance PLC. 4,516,116 5,866,532 79,105 112,788 70,451 93,865
Piramal Glass PLC. 14,118,350 2,680,100 84,110 21,502 79,063 13,669
Sampath Bank PLC. 2,013,070 1,540,618 413,261 330,543 521,385 348,180
Textured Jersey Lanka PLC. 6,176,049 1,941,200 203,891 31,534 228,514 61,536
The Bukit Darah PLC. - 45,881 - 32,017 - 16,058
Tokyo Cement Company (Lanka) PLC. 2,175,777 640,777 99,377 7,817 132,722 23,709
Tokyo Cement Company (Lanka) PLC. (Non
voting)
3,736,714 1,939,895 137,786 48,859 198,048 62,658
3,095,428 2,883,083 3,433,852 3,006,875
Above list mainly comprises of the investments made by Union Assurance PLC. (UA) under the unit linked equity tracker fund, which invests in the
companies that comprise the S&P Price Index.

244 John Keells Holdings PLC | Annual Report 2016/17
Notes to the Financial Statements
33. Stated capital and other components of equity
Accounting policy
The ordinary shares of John Keells Holdings PLC are quoted in the Colombo Stock Exchange and the Global Depository Receipts are listed on the
Luxembourg Stock Exchange. The holders of ordinary shares are entitled to receive dividends as declared from time to time, and are eligible for
one vote per share at General Meetings of the Company. The Group has in place an Employee Share Option Plan. Please refer note 34 for further
details.
33.1. Stated capital
As at 31 March 2017 2016
Number of shares
In ’000s
Value of shares
In LKR '000s
Number of shares
In ’000s
Value of shares
In LKR '000s
Fully paid ordinary shares
At the beginning of the year 1,189,404 58,701,977 997,486 50,702,701
Share options exercised 6,869 911,261 165 26,516
Subdivision of shares 169,915 - 142,498 -
Exercise of share warrants 21,280 3,176,842 49,255 7,972,760
At the end of the year 1,387,468 62,790,080 1,189,404 58,701,977
The number of shares in issue as at 31 March 2017, include global depository receipts (GDRs) of 1,320,942 (2016 - 1,282,364). Further information
on the composition of shares in issue is given under the Share Information section of the Annual Report.
35,415,944 shares (2016 - 29,959,331) have been reserved to be issued under the employee share option plan as at 31 March 2017.
33.2. Other components of equity
Group Company
As at 31 March
In LKR '000s
2017 2016 2017 2016
Revaluation reserve 28,994,792 20,846,190 - -
Foreign currency translation reserve 8,303,895 7,080,979 - -
Other capital reserve 1,402,656 958,310 1,402,656 958,310
Cash flow hedge reserve 312,529 - - -
Available for sale reserve (362,304) (170,217) 102,220 126,307
38,651,568 28,715,262 1,504,876 1,084,617
Revaluation reserve consists of the net surplus on the revaluation of property, plant and equipment and present value of acquired in-force business
(PVIB).
Foreign currency translation reserve comprises the net exchange movement arising on the currency translation of foreign operations and equity
accounted investees into Sri Lankan rupees.
The other capital reserve is used to recognise the value of equity-settled share-based payments provided to employees, including key management
personnel, as part of their remuneration.
Available for sale reserve includes changes of fair value of financial instruments designated as available for sale financial assets.

Group Highlights | Governance | Management Discussion & Analysis | Financial Statements | Supplementary Information 245
34. Share-based payment plans
Accounting Policy
Employee share option plan - Equity-
settled transactions
Employees of the Group receive
remuneration in the form of share-based
payment transactions, whereby employees
render services as consideration for equity
instruments (equity-settled transactions).
The Group applies SLFRS 2 Share Based
Payments in accounting for employee
remuneration in the form of shares from 1
April 2013 onwards.
The cost of equity-settled transactions are
recognised, together with a corresponding
increase in other capital reserves in equity,
over the period in which the performance
and service conditions are fulfilled. The
cumulative expense recognised for equity-
settled transactions at each reporting date
until the vesting date reflects the extent to
which the vesting period has expired and
the Group’s best estimate of the number of
equity instruments that will ultimately vest.
The income statement expense or credit
for a period represents the movement in
cumulative expense recognized as at the
beginning and end of that period and is
recognized in employee benefits expense.
No expense is recognised for awards that do
not ultimately vest, except for equity-settled
transactions where vesting is conditional
upon a market or non-vesting condition,
which are treated as vesting irrespective of
whether or not the market or non-vesting
condition is satisfied, provided that all other
performance and service conditions are
satisfied.
Where the terms of an equity-settled
transaction award are modified, the minimum
expense recognised is the expense had the
terms not been modified, if the original terms
of the award are met. An additional expense
is recognized for any modification that
increases the total fair value of the share-
based payment transaction, or is otherwise
beneficial to the employee as measured at
the date of modification.
The dilutive effect of outstanding options is
reflected as additional share dilution in the
computation of diluted earnings per share
(further details are given in note 18.2).
Employee Share Option Scheme
Under the John Keells Group’s Employees
share option scheme (ESOP), share options
of the parent are granted to executives of the
Group generally with more than 12 months
of service. The exercise price of the share
options is equal to the 30 day volume weighted
average market price of the underlying
shares on the date of grant. The share
options vest over a period of four years and
is dependent on a performance criteria and
a service criteria, performance criteria being
the minimum performance achievement of
"Met Expectations" and service criteria being
the employee still being in employment at the
time of vesting. The fair value of the share
options is estimated at the grant date using
a binomial option pricing model, taking into
account the terms and conditions upon which
the share options were granted.
The contractual term for each option granted
is five years. There are no cash settlement
alternatives. The Group does not have a past
practice of cash settlement for these share
options.
Share-based payment plans
Group Company
As at 31 March
In LKR '000s
2017 2016 2017 2016
Total expense arising from share-based payment transactions 444,346 395,592 119,822 128,541
Movements in the year
The following table illustrates the number (No.) and weighted average exercise prices (WAEP) of, and movements in, share options during the year;
Group Company
As at 31 March 2017 2016 2017 2016
No. WAEP No. WAEP No. WAEP No. WAEP
Outstanding at the beginning of the year 23,372,526 197.46 14,015,893 241.42 7,501,984 198.60 4,508,542 241.42
Granted during the year 9,998,000 142.83 6,781,282 171.25 2,692,274 142.83 1,957,332 171.25
Transfers - - - - 1,256,175 167.37 206,837 207.75
Adjustment due to sub division of shares 3,301,351 172.59 2,963,779 198.05 1,062,440 173.68 953,197 199.40
Adjustment due to share warrants 136,944 190.96 324,455 219.03 43,309 190.96 110,200 219.03
Exercised during the year (3,224) 149.84 - - - - - -
Expired during the year (1,340,234) 167.31 (712,883) 202.02 (176,726) 164.93 (234,124) 206.87
Outstanding at the end of the year 35,465,363 164.43 23,372,526 197.46 12,379,456 166.43 7,501,984 198.60
Exercisable at the end of the year 15,044,992 177.30 6,119,220 211.98 5,583,774 178.46 1,910,954 212.82
Accounting judgements, estimates and
assumptions
The Group measures the cost of equity-settled
transactions with employees by reference to
the fair value of the equity instruments at the
date at which they are granted. Estimating
fair value for share-based payment
transactions require determination of the
most appropriate valuation model, which
is dependent on the terms and conditions
of the grant. This estimate also requires
determination of the most appropriate inputs
to the valuation model including the expected
life of the share option, volatility and dividend
yield and making assumptions about them.
The expected life of the share options is based
on historical data and current expectations
and is not necessarily indicative of exercise
patterns that may occur. The expected
volatility reflects the assumption that the
historical volatility over a period similar to
the life of the options is indicative of future
trends, which may not necessarily be the
actual outcome either.

246 John Keells Holdings PLC | Annual Report 2016/17
Notes to the Financial Statements
34. Share-based payment plans (Contd.)
The following information were used and results were generated using binomial model for ESOP.
As at 31 March 2017
Plan no 9
award 1
2016
Plan no 8
award 3
2015
Plan no 8
award 2
2014
Plan no 8
award 1
Dividend yield (%) 2.18 1.44 1.42 2.07
Expected volatility (%) 21.05 19.19 19.34 27.50
Risk free interest rate (%) 11.91 8.13 8.70 11.26
Expected life of share options (Years) 5.00 5.00 5.00 5.00
Weighted average share price at the grant date (LKR) 142.83 171.25 229.93 253.16
Weighted average remaining contractual life for the share options outstanding
(Years)
3.00 3.00 3.00 3.00
Weighted average fair value of options (LKR) 56.29 64.62 61.93 81.54
Exercise price for options outstanding at the end of the year (LKR) 142.83 171.25 229.93 253.16
Exercise price for options outstanding at the end of the year (LKR)
(adjusted as at 31-03-2017)
142.83 149.84 176.04 191.65
35. Insurance contract liabilities
Accounting policy
Insurance contract liabilities - life
The Directors agree to the long term and unit link insurance business provisions on the recommendation of the actuary following annual valuation
of the life insurance business. The actuarial valuation takes into account all liabilities including contingent liabilities and is based on assumptions
recommended by the independent external actuary.
35.1. Insurance contract liabilities
Group
As at 31 March
In LKR '000s
2017 2016
Insurance contract liabilities 31,161,611 26,704,512
Unclaimed benefits 538,667 500,770
31,700,278 27,205,282
Long duration contract liabilities included
in the life insurance fund, result primarily
from traditional participating and non
participating life insurance products. Short
duration contract liabilities are primarily
group term, accident and health insurance
products.
The actuarial reserves have been established
based on the following;
• Non participating liabilities are discounted
using risk free yield curve provided by
the Insurance Board of Sri Lanka and the
participating liabilities are based on the
fund yield of the life fund.
• Mortality rates based on published
mortality tables adjusted for actual
experience as required by regulations
issued by the IBSL.
• Surrender rates based on the actual
experience.
The amount of policy holder dividend to be
paid is determined annually by the UA. The
dividend includes life policy holders’ share of
net income that is required to be allocated by
the insurance contract.
The valuation of the conventional life
insurance fund as at The valuation of the
conventional life insurance fund as at 31
December 2016 was carried out by Mr. Vivek
Jalan FIA, FIAI of Willis Towers Watson and
a sum of LKR 1,100 mn was transferred
from the conventional life insurance fund
to the shareholders fund for the year 2016.
Subsequent to the transfer the conventional
life fund stood at LKR 27,703 mn.
Similarly the non unit fund of linked long
term business valuation was carried out by
Mr. Vivek Jalan FIA, FIAI of Willis Towers
Watson and the Non Unit fund as at 31
December 2016 stood at LKR 186 mn. In
the opinion of the consultant actuary, the
admissible assets of the conventional life
insurance fund and the non unit fund of
linked long term business as at 31 December
2016 is adequate to cover the liabilities of the
funds.

Group Highlights | Governance | Management Discussion & Analysis | Financial Statements | Supplementary Information 247
Group
As at 31 December
In LKR '000s
2016 2015
Conventional life insurance
Balance as at 1 January 23,581,967 20,308,965
Increase in life insurance fund before surplus transfer to share holders 5,123,562 3,927,534
Transfer to shareholders (1,100,000) (760,000)
Net change in unclaimed benefits 97,881 105,468
Balance as at 31 December - Conventional life insurance 27,703,410 23,581,967
Non unit fund of linked life insurance contracts
Balance as at 1 January 149,271 126,911
Increase in non unit fund of linked life insurance before surplus transfer to share holders 35,396 60,986
Transfer to shareholders - (40,000)
Net change in unclaimed benefits 1,605 1,374
Balance as at 31 December - Non unit fund of linked life insurance 186,272 149,271
27,889,682 23,731,238
35.2. Change in life insurance contract liabilities
The results of Union Assurance PLC’s (UA) is consolidated into the Group's consolidated income statement. The change in life insurance contract
liabilities represents the transfer to the Life Fund, the difference between all income and expenditure attributable to life policy holders during the
year.
Group
For the year ended 31 March
In LKR '000s
2017 2016
Revenue 8,181,868 6,952,717
Cost of sales (3,262,922) (2,740,644)
Gross profit 4,918,946 4,212,073
Operating expenses including distribution and administration expenses (2,331,918) (2,021,615)
Net finance income 3,556,360 2,044,301
Profit attributable to shareholders of UA (1,274,100) (804,226)
Change in insurance contract liabilities 4,869,288 3,430,533
Accounting judgements , estimates and
assumptions
Valuation of insurance contract liabilities
and investment contract liabilities – Union
Assurance PLC (UA) Insurance operations -
Product classification
SLFRS 4 requires contracts written by
insurers to be classified as either “insurance
contracts” or “investment contracts”
depending on the level of insurance risk
transferred.
Insurance contracts are contracts under
which one party (the Insurer) accepts
significant insurance risk from another party
(the policyholder) by agreeing to compensate
the policyholder if a specified uncertain
future event (the insured event) adversely
affects the policyholder.
Significant insurance risk exists if an
insured event could cause an insurer to pay
significant additional benefits in any scenario,
excluding scenarios that lack commercial
substance (i.e. have no discernible effect
on the economics of the transaction). The
classification of contracts identifies both
the insurance contracts UA issues and
reinsurance contracts holds by UA.
Contracts where UA does not assume a
significant insurance risk is classified as
investment contracts.
Investment contracts are those contracts
that transfer significant financial risk and
no significant insurance risk. Financial risk
is the risk of a possible future change in one
or more of a specified interest rate financial
instrument price, commodity price, foreign
exchange rate, index of price or rates, credit
rating or credit index or other variable,
provided in the case of a non financial
variable that the variable is not specific to a
party to the contract.
Once a contract has been classified as an
insurance contract, it remains an insurance
contract for the remainder of its lifetime, even if
the insurance risk reduces significantly during
this period, unless all rights and obligations are
extinguished or expire. Investment contracts
can, however, be reclassified as insurance
contracts after inception if insurance risk
becomes significant.
Insurance and investment contracts are
further classified as being either with or
without discretionary participating features
(“DPF”).
Life insurance contract liabilities
These liabilities are measured by using
the net premium method. The liability is
determined as the sum of the discounted
value of the expected future benefits, claims
handling and policy administration expenses,
policyholder options and guarantees and
investment income from assets backing
such liabilities, which are directly related to
the contract, less the discounted value of the
expected premiums that would be required
to meet the future cash outflows based on
the valuation assumptions used. The liability
is either based on current assumptions or

248 John Keells Holdings PLC | Annual Report 2016/17
Notes to the Financial Statements
calculated using the assumptions established
at the time the contract was issued, in which
case, a margin for risk and adverse deviation
is generally included. Adjustments to the
liabilities at each reporting date are recorded
in the income statement in ‘Increase in life
insurance contract liabilities’.
The liability is de-recognised when the
contract expires, is discharged or is
cancelled.
At each reporting date, an assessment
is made of whether the recognised life
insurance liabilities are adequate, by using an
existing liability adequacy test in accordance
with SLFRS 4.
For products containing discretionary
participating features (DPF) the amount
of the DPF is deemed to be the investment
return on all related assets where the
apportionment between the shareholder and
the policyholder has not yet been determined.
The liability includes certain elements of
net unrealized gains/(losses) and retained
earnings attributable to the DPF, based on the
mandated rates applied to these gains and
earnings on the assumption that they had
been realised as of the statement of financial
position date.
The minimum mandated amounts, which are
to be paid to policyholders plus any declared/
undeclared additional benefits, are recorded
in liabilities.
Liability adequacy test (LAT) - Life
insurance
At each reporting date, an assessment
is made of whether the recognised life
insurance liabilities are adequate by using
an existing liability adequacy test as laid
out under SLFRS 4. The liability value is
adjusted to the extent that it is insufficient
to meet future benefits and expenses. In
performing the adequacy test, current best
estimates of future contractual cash flows,
including related cash flows such as claims
handling and policy administration expenses,
policyholder options and guarantees, as
well as investment income from assets
backing such liabilities, are used. A number
of valuation methods are applied, including
discounted cash flows to the extent that the
test involves discounting of cash flows, the
interest rate applied based on management’s
prudent expectation of current market
interest rates.
Any deficiencies shall be recognized in the
income statement by setting up a provision
for liability adequacy.
36. Interest-bearing loans and borrowings
36.1 Movement
Group Company
As at 31 March
In LKR '000s
2017 2016 2017 2016
At the beginning of the year 16,698,430 9,358,789 1,482,508 2,670,784
Loans obtained 3,300,907 409,372 - -
Loans transferred - 10,027,539 - -
Repayments (3,443,821) (4,623,992) (1,469,884) (1,388,100)
Amortization of transaction cost 8,992 37,962 8,992 13,629
Exchange difference and interest accrued 556,982 1,488,760 (21,616) 186,195
At the end of the year 17,121,490 16,698,430 - 1,482,508
Repayable within one year 2,918,854 2,991,582 - 1,482,508
Repayable between one and five years 14,202,636 13,706,848 - -
17,121,490 16,698,430 - 1,482,508
Group interest bearing borrowings include finance lease obligations amounting to LKR 10 mn (2016 - LKR 45 mn), details of which are disclosed
in following note.
35. Insurance contract liabilities (Contd.)
35.2. Change in life insurance contract liabilities (Contd.)

Group Highlights | Governance | Management Discussion & Analysis | Financial Statements | Supplementary Information 249
36.2. Finance leases
Group
As at 31 March
In LKR '000s
2017 2016
At the beginning of the year 44,865 75,674
Repayments (38,556) (32,397)
Adjustments/transfers 3,825 1,588
At the end of the year 10,134 44,865
Finance lease obligations repayable within one year
Minimum lease payments 10,254 37,740
Finance charges (120) (3,691)
Present value of minimum lease payments 10,134 34,049
Finance lease obligations repayable between one and five years
Minimum lease payments - 10,928
Finance charges - (112)
Present value of minimum lease payments - 10,816
36.3. Security and repayment terms
In LKR '000s Lending
Institution
Nominal
Interest rate
Repayment
terms
Details of
collaterals
2017 2016
John Keells Holdings
PLC.
IFC 6 month LIBOR based
plus margin
Bi-annual repayments
commencing from
December 2009
- - 1,482,508
Group companies
Beruwala Holiday
Resorts (Pvt) Ltd.
HNB 1 month SLIBOR
based plus margin
74 quarterly
installments
commencing from
April 2013
LKR 3,395mn Primary
floating mortgage bond
over hotel property
439,683 559,683
Sampath
Bank
6 month LIBOR based
plus margin
20 quarterly
installments
commencing from
July 2013
Corporate guarantee from
John Keells Hotels PLC,
amount of USD 4 mn
75,950 132,885
SCB 1 month LIBOR based
plus margin
16 quarterly
installments
commencing from
February 2014
Corporate guarantee from
John Keells Hotels PLC
for LKR equivalent of USD
2 mn
243,040 442,950
Ceylon Cold Stores
PLC.
DFCC
DFCC
3 month AWDR based
plus margin
3 month AWDR based
plus margin
60 equal installments
commencing from
January 2012
60 monthly
installments
commencing from
October 2012
LKR 2,769 mn Kaduwela
land, building and
machinery of soft drink
plant
- do -
-
15,000
39,073
45,000
Habarana Lodge Ltd. Sampath
Bank
6 month LIBOR based
plus margin
20 quarterly
installments
commencing from
July 2013
Corporate guarantee of
John Keells Hotels PLC of
USD 2 mn
75,950 132,885
Habib Bank
Limited
1 month LIBOR based
plus margin
48 monthly
installments
commencing from
July 2013
Corporate guarantee of
John Keells Hotels PLC of
USD 0.9 mn
6,076 32,483

250 John Keells Holdings PLC | Annual Report 2016/17
Notes to the Financial Statements
36. Interest-bearing loans and borrowings (Contd.)
36.3. Security and repayment terms (Contd.)
In LKR '000s Lending
Institution
Nominal
Interest rate
Repayment
terms
Details of
collaterals
2017 2016
Hikkaduwa Holiday
Resorts (Pvt) Ltd.
DFCC 1 month AWPLR based
plus margin
66 monthly installments
commencing from
November 2013
Primary mortgage over
lease rights of LKR 940
mn and LKR 60 mn over
movable plant, machinery
and equipment
403,495 568,495
Sampath
Bank
6 month LIBOR based
plus margin
20 quarterly installments
commencing from October
2013
Corporate guarantee of
John Keells Hotels PLC for
the LKR equivalent of USD
4 mn
167,280 295,300
John Keells
Maldivian Resorts
(Pte) Ltd.
Sampath
Bank
6 month LIBOR based
plus margin
The loan is payable within
90 days
Fixed deposit of
USD 4.4 mn
1,477,455 -
John Keells
Properties Ja-Ela
(Pvt) Ltd.
Commercial
Bank
1 month AWPLR based
plus margin
60 monthly installments
commencing from April
2014 with 1 year grace
period
General terms and
conditions for LKR 150 mn
signed in relation to the
term loan
- 125,000
Commercial
Bank
1 month AWPLR based
plus margin
60 monthly installments
commencing from April
2014
- - 253,393
HSBC 1 month COF based
plus margin
60 monthly installments
commencing from
December 2016.
General terms and
conditions for LKR 450 mn
signed relating to the term
loan
394,907 -
Keells Food
Products PLC.
DFCC 3 month AWDR plus
margin
60 monthly installments
commencing from
December 2013 with 1
year grace period
Primary mortgage bond on
the building and assets at
Pannala
83,704 133,793
Kandy Walk Inn Ltd. HSBC 1 month LIBOR based
plus margin
60 monthly installments
commencing from October
2013 with 1 year grace
period
Land and building value of
LKR1,438 mn
91,840 252,933
The Colombo Ice
Company (Pvt) Ltd.
HSBC COF based plus margin 60 monthly installments
commencing from
February 2016 with 1 year
grace period
Corporate guarantee of
Ceylon Cold Stores PLC for
LKR3.8 bn
256,192 -
Trans Asia Hotels
PLC.
HNB Fixed rate (annually
reviewed)
16 quarterly installments
commencing from
September 2016
- 370,256 442,951
Travel Club (Pte) Ltd. HSBC 3 month LIBOR based
plus margin
8 quarterly installments
commencing from
December 2014
- - 99,663
HSBC 1 month LIBOR based
plus margin
12 quarterly installments
commencing from
September 2017
- 303,800 -
Trinco Holiday
Resorts (Pvt) Ltd.
Sampath
Bank
6 month LIBOR based
plus margin
20 quarterly installments
commencing from April
2014
Corporate guarantee of
John Keells Hotels PLC for
the LKR equivalent of USD
1.158 mn
70,360 102,588
Sampath
Bank
3 month AWPLR based
plus margin
83 monthly installments
commencing July 2014
Letter of comfort from
John Keells Hotels PLC
205,000 216,500

Group Highlights | Governance | Management Discussion & Analysis | Financial Statements | Supplementary Information 251
In LKR '000s Lending
Institution
Nominal
Interest rate
Repayment
terms
Details of
collaterals
2017 2016
Waterfront
Properties (Pvt)
Ltd.
Syndicated
loan through
SCB
1 month LIBOR based
plus margin
13 quarterly installments
commencing from
September 2019
Freehold and leasehold
land of LKR 11.4 bn.
Additionally, as a part
of the sponsor support,
John Keells Holdings PLC
has pledged 1.5 bn of
its shares in Waterfront
Properties (Pvt) Ltd.
12,334,739 11,128,070
Yala Village (Pvt)
Ltd.
Habib Bank 1 month AWPLR based
minus margin
30 monthly installments
commencing from
July 2014
- 39,666 67,748
Sampath
Bank
6 month LIBOR based
plus margin
20 quarterly installments
commencing from July
2013
Corporate guarantee of
John Keells Hotels PLC of
USD 1.5 mn
56,963 99,664
17,111,356 16,653,565
JK BPO Solution
India (Pvt) Ltd.
DLF Assets
(Pvt) Ltd.
Finance lease 10,134 44,865
17,121,490 16,698,430
37. Employee benefit liabilities
Accounting Policy
Employee contribution plans - EPF/ETF
Employees are eligible for Employees’
Provident Fund contributions and Employees’
Trust Fund contributions in line with respective
statutes and regulations. The companies
contribute the defined percentages of gross
emoluments of employees to an approved
Employees’ Provident Fund and to the
Employees’ Trust Fund respectively, which
are externally funded.
Employee defined benefit plan - gratuity
The liability recognised in the statement
of financial position is the present value
of the defined benefit obligation at the
reporting date using the projected unit
credit method. Any actuarial gains or losses
arising are recognized immediately in other
comprehensive income this was previously
recognized in income statement.
Group Company
As at 31 March
In LKR '000s
2017 2016 2017 2016
Employee benefit liabilities
At the beginning of the year 1,660,880 1,494,711 189,181 160,456
Current service cost 144,936 133,665 12,967 10,587
Acquisitions - 8,435 - -
Transfers - - 10,528 5,695
Interest cost on benefit obligation 182,697 150,235 19,864 16,046
Payments (219,443) (171,100) (19,940) (6,081)
(Gain)/Loss arising from changes in assumptions 110,758 44,627 5,310 2,478
Exchange translation difference 459 307 - -
At the end of the year 1,880,287 1,660,880 217,910 189,181
The expenses are recognised in the income statement in the following line
items;
Cost of sales 149,829 140,319 11,387 10,890
Selling and distribution expenses 30,862 18,484 - -
Administrative expenses 146,942 125,097 21,444 15,743
327,633 283,900 32,831 26,633
Accounting judgements , estimates and
assumptions
Employee benefit liability
The employee benefit liability of the Group
is based on the actuarial valuation carried
out by Independent actuarial specialists.
The actuarial valuations involve making
assumptions about discount rates and
future salary increases. The complexity of
the valuation, the underlying assumptions
and its long term nature, the defined benefit
obligation is highly sensitive to changes in
these assumptions.
All assumptions are reviewed at each
reporting date.
The principal assumptions used in
determining the cost of employee benefits
were:

252 John Keells Holdings PLC | Annual Report 2016/17
38. Other deferred liabilities
Accounting policy
Government grants
Government grants are recognised where
there is reasonable assurance that the grant
will be received and all attached conditions
will be complied with. When the grant relates
to an expense item, it is recognised as
income over the period necessary to match
to the costs, that it is intended to compensate.
Where the grant relates to an asset, the fair
Notes to the Financial Statements
37. Employee benefit liabilities (Contd.)
As at 31 March 2017 2016
Discount rate 9.50% - 11.00% 10.50%
Future salary increases 6.00% - 10.00% 6.00% - 9.00%
37.1. Sensitivity of assumptions used
A one percentage change in the assumptions would have the following effects:
Group Company
As at 31 March
In LKR '000s
2017 2016 2017 2016
Discount rate:
1% Increase (85,863) (76,569) (6,691) (6,040)
1% Decrease 64,966 68,440 7,363 6,538
Salary Increment rate:
1% Increase 65,922 72,446 7,863 7,235
1% Decrease (96,150) (81,420) (7,331) (6,797)
37.2. Maturity analysis of the payments
The following payments are expected on employee benefit liabilities in future years
Group Company
As at 31 March
In LKR '000s
2017 2016 2017 2016
Within the next 12 months 286,965 236,306 60,239 23,236
Between 1 and 2 years 363,244 418,173 65,281 111,308
Between 2 and 5 years 522,475 466,695 21,792 16,948
Between 5 and 10 years 618,230 386,856 58,446 24,863
Beyond 10 years 89,373 152,850 12,152 12,826
Total expected payments 1,880,287 1,660,880 217,910 189,181
Weighted average duration (years) of define benefit obligation 5.41 4.91 10.20 8.67
value is credited to a deferred income account
and is released to the income statement over
the expected useful life of the relevant asset
by equal annual installments.
Where the Group receives non-monetary
grants, the asset and the grant are recorded
gross at nominal amounts and released to
the income statement over the expected
useful life and pattern of consumption of
the benefit of the underlying asset by equal
annual installments.
Deferred revenue
Deferred revenue is the money received
for goods or services which have not yet
been delivered. According to the revenue
recognition principle, it is recorded as a
liability until delivery is made , at which time
it is converted to revenue.
Group Company
As at 31 March
In LKR '000s
Note 2017 2016 2017 2016
Government grants 772 960 - -
Deferred revenue 838,119 670,286 - -
Deferred purchase consideration - 190,556 103,218 190,556
Amounts due to related parties 43.5 - - - 180,458
838,891 861,802 103,218 371,014

Group Highlights | Governance | Management Discussion & Analysis | Financial Statements | Supplementary Information 253
39. Other non current liabilities
Accounting policy
Group classifies all non financial non current liabilities under other current liabilities which include non refundable advances and deposits.
Group
As at 31 March
In LKR '000s
2017 2016
Advances received 3,740,418 2,963,252
Deposits 193,464 131,929
3,933,882 3,095,181
40. Trade and other payables
Accounting policy
Trade payables are the aggregate amount of obligations to pay for goods or services, that have been acquired in the ordinary course of business.
Trade payable are classified as current liabilities if payment is due within one year.
Group Company
As at 31 March
In LKR '000s
2017 2016 2017 2016
Trade and other payables
Trade and other payables 13,665,569 12,392,889 330,078 332,506
Reinsurance payables 277,284 140,358 - -
Advances and deposits 193,187 222,219 - -
14,136,040 12,755,466 330,078 332,506
Trade and other payables are normally non-interesting bearing and settled within one year. Reinsurance payables normally settled within one year.
For further explanation on the Group's liquidity risk management process refer note 10.2.2.
41. Short term borrowings
Group
As at 31 March
In LKR '000s
2017 2016
Bank loans 1,380,238 821,243
1,380,238 821,243
42. Other current liabilities
Accounting policy
Group classifies all non financial current liabilities under other current liabilities.
These include non refundable deposits and other tax payables. These liabilities are recorded at amounts expected to be set-off at the reporting
date.
Group Company
As at 31 March
In LKR '000s
2017 2016 2017 2016
Other current liabilities
Non refundable deposits 1,481,641 1,706,292 2,566 2,566
Other tax payables 1,462,477 528,564 13,875 13,723
2,944,118 2,234,856 16,441 16,289
43. Related party transactions
Terms and conditions of transactions with
related parties
The Group and Company carried out
transactions in the ordinary course of
business with the following related entities.
The list of Directors at each of the subsidiary,
joint venture and associate companies have
been disclosed in the Group directory under
the Supplementary Information section of the
Annual Report.
Transactions with related parties are carried
out in the ordinary course of the business.
Outstanding current account balances at
year end are unsecured, interest free and
settlement occurs in cash.
Non-recurrent related party transactions
There were no any non-recurrent related party
transactions which aggregate value exceeds
10% of the equity or 5% of the total assets
whichever is lower of the Company as per
31 March 2016 audited financial statements,
which required additional disclosures in the
2016/17 Annual Report under Colombo Stock
Exchange listing Rule 9.3.2 and Code of Best
Practices on Related Party Transactions under
the Security Exchange Commission Directive
issued under Section 13(c) of the Security
Exchange Commission Act.
Recurrent related party transactions,
There were no any recurrent related party
transactions which in aggregate value
exceeds 10% of the consolidated revenue
of the Group as per 31 March 2016 audited
financial Statements, which required
additional disclosures in the 2016/17 Annual
Report under Colombo Stock Exchange listing
Rule 9.3.2 and Code of Best Practices on
Related Party Transactions under the Security
Exchange Commission Directive issued
under Section 13(c) of the Security Exchange
Commission Act.

254 John Keells Holdings PLC | Annual Report 2016/17
43.1. Amounts due from related parties
Group Company
As at 31 March
In LKR '000s
Note 2017 2016 2017 2016
Subsidiaries 43.5 215,115 412,187
Equity accounted investees 43.5 111,639 133,031 71,620 182,995
Key management personnel - - - -
111,639 133,031 286,735 595,182
43.2. Amounts due to related parties
Subsidiaries 43.6 209,182 102,135
Equity accounted investees 10,434 28,982 847 -
Key management personnel - - - -
10,434 28,982 210,029 102,135
43.3. Transactions with related parties
Group Company
As at 31 March
In LKR '000s
Note 2017 2016 2017 2016
Subsidiaries
Purchases of goods - - 5,004 3,631
Rendering of services 43.5 - - 701,748 638,140
Receiving of services 43.6 - - 48,918 51,957
Rent paid - - 38,729 34,292
Equity accounted investees
Sales of goods 12,460 27,229 - -
Rendering of services 43.5 468,353 412,627 281,929 225,464
Receiving of services 330,436 192,155 193 393
Interest received 43.4 200,565 35,065 87,567 29,589
Interest paid 43.4 7,844 1,794 - -
Key management personnel (KMP)
Sales of goods - - - -
Close family members of KMP
Sales of goods - - - -
Companies controlled / jointly controlled / significantly
Influenced by KMP and their close family members
Sales of goods - - - -
Post employment benefit plan
Contributions to the provident fund 262,326 232,437 58,907 54,999
43.4. Transactions with related parties - Associates
Nations Trust Bank PLC.
Interest received 200,565 35,065 87,567 29,589
Interest paid 7,844 1,794 - -
The Group and Company held interest bearing deposits of LKR 2,491mn (2016 - 2,929 mn) and LKR 604 mn (2016 - 2,568 mn) respectively, at
Nations Trust Bank PLC as at 31 March 2017.
Notes to the Financial Statements

Group Highlights | Governance | Management Discussion & Analysis | Financial Statements | Supplementary Information 255
43.5. Transactions and amounts due from related parties
Company
Rendering of services Amounts due from
As at 31 March
In LKR '000s
2017 2016 2017 2016
Subsidiaries
Asian Hotels and Properties PLC. 34,493 32,028 3,109 3,338
Ceylon Cold Stores PLC. 54,234 45,867 58 4,030
Cinnamon Hotel Management Services Ltd. 92,943 94,328 16,170 5,154
InfoMate (Pvt) Ltd. 23,010 19,608 1,789 576
JayKay Marketing Services (Pvt) Ltd. 79,814 66,395 9,268 3,997
John Keells Logistics (Pvt) Ltd. 17,715 15,281 1,208 2,314
John Keells Office Automation (Pvt) Ltd. 28,291 35,084 1,517 4,577
John Keells PLC. 16,323 16,350 - 1,472
Keells Food Products PLC. 22,790 20,938 2,199 2,339
Lanka Marine Services Ltd. 10,129 8,462 1,040 362,781
Mack Air (Pvt) Ltd. 11,422 11,069 879 1,248
Mackinnons Keells Ltd. 2,476 2,476 124,589 -
Mackinnons Travels (Pvt) Ltd. 12,133 10,390 - -
Trans Asia Hotels PLC. 24,298 22,207 - -
Union Assurance PLC. 51,396 31,376 32,929 3,164
Walkers Tours Ltd. 34,610 31,597 3,696 615
Waterfront properties (Pvt) Ltd. 37,831 34,596 3,606 4,638
Whittall Boustead (Pvt) Ltd. 16,456 14,791 - -
Other subsidiaries 131,384 125,297 13,058 11,944
701,748 638,140 215,115 412,187
Joint ventures 270,305 220,011 70,923 94,431
Associates 11,624 5,453 697 88,564
281,929 225,464 71,620 182,995
43.6. Transactions and amounts due to related parties
Company
Receiving of services Amounts due to
As at 31 March
In LKR '000s
2017 2016 2017 2016
Subsidiaries
Current
Asian Hotels and Properties PLC. 5,334 4,481 - -
InfoMate (Pvt) Ltd. 8,157 6,041 - -
John Keells BPO Solutions India (Pvt) Ltd. - - - 6,724
Mack Air (Pvt) Ltd. 1,809 - - -
Mackinnons Travels (Pvt) Ltd. 18,046 23,276 2,221 1,574
Rajawella Holdings Ltd - - 203,104 90,300
Trans Asia Hotels PLC. 4,552 6,957 2,176 2,205
Whittall Boustead (Pvt) Ltd. 8,744 7,901 905 678
Other subsidiaries 2,276 3,301 776 654
48,918 51,957 209,182 102,135
Non-current
Rajawella Holdings Ltd. - - - 180,458

256 John Keells Holdings PLC | Annual Report 2016/17
43. Related party transactions (Contd.)
43.7. Compensation of key management personnel
Key management personnel include members of the Board of Directors of John Keells Holdings PLC and its subsidiary companies.
Group Company
For the year ended 31st March
In LKR '000s
2017 2016 2017 2016
Short-term employee benefits 410,881 427,632 170,944 185,419
Post employment benefits - - - -
Other long-term benefits - - - -
Termination benefits - - - -
Share based payments 133,911 145,481 55,747 65,688
544,792 573,113 226,691 251,107
Directors' interest in the employee share option plan of the Company
As at 31 March 2017, the executive members of the Board of Directors held options to purchase ordinary shares under the employee share option
plan as follows;
2017 2016
Expiry date Adjusted exercise
price
LKR
Outstanding at
the end of period
Exercisable at
the end of period
Outstanding at
the end of period
Exercisable at
the end of period
06.12.2016 151.39 - - 1,517,847 1,517,847
30.06.2018 191.65 2,295,814 1,721,859 1,548,202 769,187
30.06.2019 176.04 2,038,537 1,019,268 1,392,774 348,193
24.06.2020 149.84 1,675,073 418,766 1,025,984 -
14.08.2021 142.83 1,575,000 - - -
No share options have been granted to the non-executive members of the Board of Directors under the employee share option plan.
43.8. Gain on share restructure/repurchase transaction - John Keells Holdings PLC
In the current year, the Company carried out an exercise to restructure the shareholding of the Company’s investments in a few of its unlisted
subsidiaries to reduce the complexity of the shareholding structure. Accordingly, selected companies holding investments in other subsidiaries,
transferred its respective investments to the Company, at valuations independently verified with the assistance of external consultants. The exercise
was completed via a combination of share buybacks between the unquoted entities within the Group, and its subsidiaries for a consideration of
either cash or owners’ shares.
In LKR 000's Transaction
value
Gain
Shares bought back from
Keells Consultants Ltd 380,145 378,140
Mack Air Ltd. 1,007,985 960,978
Mackinnon Keells Ltd. 900,664 897,647
Mackinnon Mackenzie and Company of (Ceylon) Ltd. 239,745 239,745
Mortlake Ltd 378,410 98,074
Whittall Boustead (Pvt) Ltd 1,093 1,071
2,908,042 2,575,655
Notes to the Financial Statements
44. Contingent liabilities
Accounting policy
Provisions, contingent assets and
contingent liabilities
Provisions are recognised when the
Group has a present obligation (legal or
constructive) as a result of a past event,
it is probable that an outflow of resources
embodying economic benefits will be
required to settle the obligation and a
reliable estimate can be made of the amount
of the obligation. Where the Group expects
some or all of a provision to be reimbursed,
for example under an insurance contract, the
reimbursement is recognised as a separate
asset but only when the reimbursement is
virtually certain.
The expense relating to any provision is
presented in the income statement net of
any reimbursement.

Group Highlights | Governance | Management Discussion & Analysis | Financial Statements | Supplementary Information 257
If the effect of the time value of money is
material, provisions are discounted using
a current pre-tax rate that reflects, where
appropriate, the risks specific to the liability.
Where discounting is used, the increase in
the provision due to the passage of time is
recognised as a finance cost.
All contingent liabilities are disclosed as a
note to the financial statements unless the
outflow of resources is remote. A contingent
liability recognised in a business combination
is initially measured at its fair value.
Subsequently, it is measured at the higher
of: The amount that would be recognised in
accordance with the general guidance for
provisions above (LKAS 37) or The amount
initially recognised less, when appropriate,
cumulative amortisation recognised in
accordance with the guidance for revenue
recognition (LKAS 18). Contingent assets are
disclosed, where inflow of economic benefit
is probable.
The contingent liability of the Group and the
Company as at 31 March 2017, relates to the
following;
John Keells Holdings PLC (JKH)
The contingent liability of the Company as at
31 March 2017, relates to the following;
GST & VAT Assessments for the year of
assessment 2002/03
The company has filed appeals against
these assessments and these are currently
pending at the Court of Appeal.
Income tax assessment relating to year of
assessment 2006/07
The company has filed an appeal against this
assessment and it is currently pending at the
Court of Appeal.
Having discussed with independent legal
and tax experts and based on information
available, the contingent liability as at 31
March 2017 is estimated at LKR 123 mn.
Lanka Marine Services (Pvt) Ltd. (LMS)
The contingent liability of LMS as at 31 March
2017, relates to the following:
Post privatisation turnover tax levied by
the Western Provincial Council
The Company has disputed this on the basis
that its business activity is that of an export.
An appeal has been made by the Company to
the Western Provincial Council.
Income tax assessment relating to year of
assessment 2001/02
Assessment was received by the Company
based on normal tax rates. The company has
appealed against this assessment on the
grounds that the sale of bunker to foreign ships
is an export, which is liable to concessionary
rates of taxes, but this has been disputed by
the Department of Inland Revenue. The appeal
made by the company is currently with the
Court of Appeal of Sri Lanka.
Income tax assessments relating to years
of assessments 2002/03, 2003/04 and
2004/05
Assessments were received in January
2009, once again based on normal tax
rates. It is the view of the Company, based
on opinions from independent legal counsel
and tax consultants, that the subject years
were statutorily time barred as provided
in the Inland Revenue Act. The appeals
made by the Company to the Board of
Review were transferred to the Tax Appeals
Commission (TAC). The TAC determined that
the assessments raised were time barred. A
case stated has been filed with the Court of
Appeal by an application made by the CGIR.
Income tax assessments relating to
years of assessments 2005/06, 2006/07,
2007/08 and 2008/09
Assessments were received in August 2008,
October 2009 and March 2011, consequent to
the Supreme Court judgement, whereby the
original BOI concessions granted were annulled.
Although the assessments were based on
normal tax rates the company computed and
paid income taxes at concessionary rates of
taxes, based on opinions from independent
legal counsel and tax consultants, that the
supply of bunkers to foreign vessels is an
export and therefore eligible to concessionary
rates of taxes as provided in the Inland Revenue
Act. Appeals were lodged against the balance
taxes assessed and penalties charged by the
Inland Revenue and the status of each of the
appeals are as follows:
2005/06 and 2006/07 The Tax Appeals
Commission determined that it has no
jurisdiction in respect of appeals relating
to these two years and a case stated has
been filed with the Court of Appeal by an
application made by the CGIR.
2007/08 – The appeal was determined
in favour of the CGIR by the Tax Appeals
Commission, and a case stated has been filed
with the Court of Appeal by an application
made by the company.
2008/09 – The appeal was determined
in favour of the CGIR by the Tax Appeals
Commission. The company intends to file the
case stated with the Court of Appeal.
Income tax Assessments relating to years
of assessments 2009/2010, 2010/2011
and 2011/2012
Assessments were received based on normal
tax rates. Appeals have been lodged with
the Department of Inland Revenue within
the stipulated time period for assessments
raised for these years of assessment. All the
above three assessments were confirmed by
the Commissioner General of Inland Revenue
and the company being aggrieved by the
decision has appealed to the Tax Appeals
Commission.
Income Tax Assessments relating to years
of assessments 2012/2013 and 2013/2014
Assessments were received based on normal
tax rates. Appeals have been lodged with the
Department of Inland Revenue within the
stipulated time period.
Having discussed with independent legal
and tax experts and based on information
available, the contingent liability as at 31
March 2017 is estimated at LKR 1,019 mn.
Mackinnons Travels (Pvt) Ltd (MTL)
The contingent liability of MTL as at 31 March
2017, relates to the following;
VAT Assessments received for years of
assessments 2009/10 and 2010/2011
The company has filed appeals against
these assessments with the Inland Revenue
Department. The Tax Appeals Commission
determined the appeal in favour of the
company and upheld the position that the
company is entitled to claim zero rated status
on its taxable supplies The Department of
Inland Revenue is currently awaiting the case
stated from the Tax Appeals Commission to
make an application to the Court of Appeal.
Having discussed with independent legal
and tax experts and based on information
available, the contingent liability as a 31
March 2017 is estimated at LKR 26mn.
Union Assurance PLC (UA)
The contingent liability of UA PLC as at 31
March 2017, relates to the following;
Income Tax Assessments received for
years of assessments 2010/11, 2011/2012,
2012/13 and 2013/14
The Department of Inland Revenue has
raised assessments on Union Assurance
PLC for the above years of assessment,
assessing the Life insurance business to
pay income taxes of LKR 13mn, LKR 132mn,
LKR 466mn and LKR 175mn respectively.
The company has filed valid appeals against
these assessments.
Having discussed with independent legal
and tax experts and based on information
available, the Directors are of the view that
the Company has followed due process
and acted in accordance with the prevailing
laws in its tax submissions for years of
assessment 2010 /11, 2011/12, 2012/13 and
2013/14, and accordingly have concluded
that the above assessments have no rationale
or basis in law.

258 John Keells Holdings PLC | Annual Report 2016/17
46. Lease commitments
Group
As at 31 March
In LKR '000s
2017 2016
Lease rentals due on non-cancellable operating leases;
Within one year 562,965 492,294
Between one and five years 1,084,140 1,017,705
After five years 5,391,496 3,739,095
7,038,601 5,249,094
Company Lessor Leased properties
Ceylon Cold Stores PLC. CISCO Speciality Packaging (Pvt) Ltd. Pet bottle plant
Ceylon Holiday Resorts Ltd. Sri Lanka Tourist board Land occupied
Hikkaduwa Holiday Resort (Pvt) Ltd. Sri Lanka Tourist board Land occupied
Fantasea World Investment (Pte) Ltd. Government of Maldives Land occupied
Habarana Lodge Ltd. Kekirawa Divisional Secretariat Land occupied
Habarana Walk Inn Ltd. Kekirawa Divisional Secretariat Land occupied
Jaykay Marketing Services (Pvt) Ltd. Land owners Land occupied
Keells Food Products PLC. Pannala Divisional Secretariat Land occupied
The Colombo Ice Company (Pvt) Ltd. Board of Investment of Sri Lanka Land occupied
Travel Club (Pte) Ltd. Government of Maldives and a sub lease with Ellaidhoo
Investments (Pte) Ltd.
Land occupied
Tranquility (Pte) Ltd. Government of Maldives Land occupied
Yala Village (Pvt) Ltd. Sri Lanka Tourist board Land occupied
Waterfront properties (Pvt) Ltd. Board of Investment of Sri Lanka Land occupied
Extent of lease hold land is given in the Group real estate portfolio in the Supplementary section of the Annual Report.
Notes to the Financial Statements
47. Assets pledged
Assets pledged for facilities obtained is given in note 36.3 to the financial statements.
48. Events after the reporting period
Final dividend
The Board of Directors of the Company has declared a final dividend of LKR 2.00 per share for the financial year ended 31 March 2017. As required
by section 56 (2) of the Companies Act No. 07 of 2007, the Board of Directors has confirmed that the Company satisfies the solvency test in
accordance with section 57 of the Companies Act No.07 of 2007, and has obtained a certificate from auditors, prior to declaring a final dividend
which is to be paid on the 16 June 2017.
In accordance with LKAS 10, Events after the reporting period, the final dividend has not been recognised as a liability in the financial statements
as at 31 March 2017.
45. Capital and other commitments
Group Company
As at 31 March
In LKR '000s
2017 2016 2017 2016
Capital commitments approved but not provided for 66,186,343 64,837,411 - -
Guarantees 180,913 117,000 180,913 167,145
66,367,256 64,954,411 180,913 167,145

This section entails additional
Group related information.
261 History of the John Keells Group . 262 Economic Value Statement . 264 Decade at a Glance
266 Indicative US Dollar Financial Statements . 268 Sri Lankan Economy . 270 Group Real Estate Portfolio
272 Memberships Maintained by the Industry Groups . 273 Independent Assurance Statement on Non-Financial Reporting
276 Group Directory . 283 GRI G4 Content Index . 288 Glossary of Financial Terms . 289 Notice of Meeting
290 Corporate Information . 291 Proxy Form
S U P P L E M E N T A R Y I N F O R M A T I O N
BuildingPartnerships


261Group Highlights | Governance | Management Discussion & Analysis | Financial Statements | Supplementary Information
History of the John Keells Group
1870-1970
• 1870: Two English brothers, George and
Edwin John set up E. John & Co, a firm of
produce and exchange brokers.
• 1948: The firm merged with two other
London based tea brokers, and thereby
evolved into a private liability company by
the name of E. John, Thompson, White &
Company Ltd.
• 1960: Amalgamated with Keell and
Waldock Ltd., another long established
produce, share and freight broking
company. The company changed its name
to John Keell Thompson White Ltd.
1971-1990
• 1973: Walkers Tours and Travels (Ceylon)
Ltd, a leading inbound tour operator, is
acquired.
• 1974: The firm became a Rupee quoted
public company. Changed its name to John
Keells Ltd.
• 1986: A newly incorporated John Keells
Holdings (JKH) acquired a controlling stake
in John Keells Limited, and obtained a
quotation on the Colombo Stock Exchange
(CSE) amidst a heavily over-subscribed
public share issue.
1991-2000
• 1991: Acquired the Whittalls Group of
Companies, and thus gained control of
Ceylon Cold Stores, Ceylon Holiday Resorts,
and Union Assurance. The acquisition was
one of the largest deals carried out at the
time.
• 1994: JKH became the first Sri Lankan
company to obtain a listing abroad,
by way of issuing Global Depository
Receipts (GDRs) on the Luxembourg Stock
Exchange.
• 1996: Velidhu Resort Hotel, an 80 roomed
island resort in the Maldives, was acquired.
This marked the Group’s first major
overseas investment.
• 1999: Nations Trust Bank (NTB) was
established, in a joint venture with the
International Finance Corporation (IFC) and
Central Finance Co. Ltd. The South Asia
Gateway Terminal (SAGT) commenced
operations to own, operate, and develop
the Queen Elizabeth Quay at the Port of
Colombo.
• 2000: JKH became the first Sri Lankan
company to obtain the SL-AAA credit rating
from Fitch Ratings. The firm was also
admitted as a full member of the World
Economic Forum, and was also rated
among the best 300 small companies in
the world by the Forbes Global magazine.
2011-2014
• 2011: “The Emperor” apartment project at
Crescat City, Colombo reached completion.
Chaaya Tranz Hikkaduwa and Chaaya Wild
Yala were re-opened after refurbishment.
• 2012: Cinnamon Bey, a 200 room five star
resort was launched. “K-Zone”, a 140,000
sq. ft. mall was opened in Ja-Ela, Colombo.
Keells Food Products PLC and Union
Assurance PLC successfully raised LKR 1.2
billion and LKR 720 million respectively, via
rights issues.
• 2013: The market capitalisation of JKH
exceeded USD 2 billion for the first time
in the Group’s history. The “Waterfront”
integrated resort project was announced to
the public. JKH was recognised as one of
the top 15 great places to work in Sri Lanka
through a survey conducted by the Great
Place to Work Institute.
• 2014: “Cinnamon red”, the first lean luxury
hotel in Sri Lanka, was launched. The
“OnThree20” residential development
project was successfully completed.
Union Assurance was segregated as per
a regulatory directive, and the General
Insurance segment was divested. JayKay
Marketing Services (Private) Limited
merged with Nexus Networks (Private)
Limited, with JMSL being the surviving
entity. Divested stakes in Expo Lanka
Holdings PLC and Access Engineering PLC.
2015 – To Present
• 2015: Waterfront Properties (Private)
Limited raised the necessary debt funding
for the “Cinnamon Life” project, by way of
the largest syndicated debt facility obtained
by a local firm. A controlling stake in
Rajawella Holdings Ltd (RHL) was acquired
for LKR 1.04 billion. SAGT was ranked
number one in South Asia and number
four in the world for terminal productivity
by the Journal of Commerce, USA. The
refurbishment of Cinnamon Lakeside was
completed. The Group raised LKR 8 billion
by converting 50 million warrants.
• “7th Sense”, a high-end, niche, residential
development was completed JKH is
ranked first in the LMD Magazine’s “Most
Respected Entities in Sri Lanka” survey for
the tenth consecutive time, and also tops
the Business Today magazine’s list of Sri
Lanka’s Top 25 companies for the second
time. The 50th Keells Super outlet was
opened.
• 2016: Please refer the “Year at a Glance”
section of the JKH Annual Report.
2001-2007
• 2003: JKH acquired Asian Hotels and
Properties, thereby gaining control of 40
per cent of the five star room capacity in
Colombo.
• 2004: John Keells Hotels Limited (KHL) was
created as a holding company for all Group
resorts. The Group’s CSR arm, The John
Keells Social Responsibility Foundation
was established as a non-profit.
• 2005: The Group launched its new hotel
brands “Cinnamon Hotels & Resorts” and
“Chaaya Hotels & Resorts”. JKH entered
into a MoU to develop a third resort in the
Maldives and also acquired 80 per cent of
the Yala Village Hotel. Keells Plantations
was sold off, thus marking the Group’s exit
from the ownership of plantations. A joint
venture with Raman Roy Associates was
embarked upon, to enter the BPO space.
• 2006: A lease was acquired on the
Dhonveli Beach and Spa and the Ellaidhoo
Tourist Resort in the Maldives. The Group
increased its stake in SAGT by 8 per cent to
34 per cent. John Keells Holdings Ltd was
renamed as John Keells Holdings PLC.
• 2007: Cinnamon Island Alidhoo
commenced operations. The Group
signed a long term funding arrangement
amounting to USD 75 million with the
International Finance Corporation (IFC).
2008-2010
• 2008: JKH acquired a further 8.4 per cent
in SAGT and also increased stakes in UA,
CCS, JKL and KFPL. The stake in AMW was
divested.
• 2009: JKH’s market capitalization
surpassed USD 1 billion. The Trans Asia
Hotel was re-branded, and re-launched as
Cinnamon Lakeside. The Group released
its first standalone Sustainability Report, in
full compliance with the Global Reporting
Initiative (GRI-G3) framework.
• 2010: The head lease of Alidhoo Island
was divested while the head lease of
Dhonveli Island was acquired for a period
of 18 years. Construction of “OnThree20”,
a 475 unit apartment complex in the
heart of Colombo commenced. Walkers
Tours and Whittall Boustead became the
only destination management companies
to obtain both ISO 9001 and ISO 14001
certifications. Ceylon Cold Stores added
“KIK” as its cola brand in its portfolio of
soft drinks. JKH also acquired 5.6 million
shares of Union Assurance PLC, and
increased its stake to 95.6 per cent.

262 John Keells Holdings PLC | Annual Report 2016/17
Economic Value Statement
Transportation Leisure Property Consumer Foods and
Retail
Financial Services
For the year ended 31 March
LKR millions
2017 2016 2017 2016 2017 2016 2017 2016 2017 2016
Direct economic value
generated
Revenue 11,517 10,725 28,135 26,829 1,459 4,677 46,834 37,795 8,298 7,146
Finance income 242 188 2,849 1,588 591 476 998 451 3,512 2,665
Share of results of associates 2,275 1,869 53 52 - - - - 975 860
Profit on sale of assets & other
income 2,009 138 281 93 1,032 380 1,296 1,543 62 55
Valuation gain on IP - - - - 290 148 92 17 - -
16,043 12,920 31,318 28,562 3,372 5,681 49,220 39,806 12,847 10,726
Economic value distributed
Operating costs 11,210 9,030 12,208 10,654 1,540 1,742 33,428 27,462 9,135 6,621
Employee wages & benefits 451 409 4,569 4,069 390 251 4,078 3,531 851 822
Payments to providers of
funds 1,139 863 6,744 6,588 824 2,337 4,507 2,914 514 1,256
Payments to government 168 57 1,352 1,199 69 132 3,155 2,467 63 41
Community investments 3 24 55 54 1 - 43 29 5 14
12,971 10,383 24,928 22,564 2,824 4,462 45,211 36,403 10,568 8,754
Economic value retained
Depreciation 102 88 1,589 1,547 19 14 830 736 80 89
Amortisation 2 1 636 768 21 25 14 12 221 217
Profit after dividends 2,968 2,448 4,165 3,684 508 1,179 3,165 2,655 1,978 1,665
Retained for reinvestment /
growth 3,072 2,537 6,390 5,999 548 1,218 4,009 3,403 2,279 1,971
Above data has been derived from the audited Financial Statements that were prepared based on Sri Lanka Accounting Standards (SLFRS/LKAS).

263Group Highlights | Governance | Management Discussion & Analysis | Financial Statements | Supplementary Information
Information
Technology
Others Total Eliminations/
Adjustments
Group Total
2017 2016 2017 2016 2017 2016 2017 2016 2017 % 2016 %
11,337 8,463 3,757 3,397 111,337 99,032 (5,064) (5,322) 106,273 87.21 93,710 87.66
52 45 16,152 15,014 24,396 20,427 (14,363) (12,416) 10,033 8.23 8,011 7.49
- - - - 3,303 2,781 - - 3,303 2.71 2,781 2.60
71 113 4,060 3,931 8,812 6,253 (7,047) (4,121) 1,765 1.45 2,132 1.99
- - 101 98 484 263 - - 484 0.40 263 0.25
11,460 8,621 24,070 22,440 148,332 128,755 (26,474) (21,859) 121,858 100.00 106,896 100.00
8,710 6,303 10,622 9,665 86,853 71,477 (5,305) (1,657) 81,548 66.92 69,820 65.32
1,362 1,461 1,045 1,080 12,746 11,623 - - 12,746 10.46 11,623 10.87
513 439 7,987 8,530 22,228 22,927 (13,889) (12,164) 8,339 6.84 10,763 10.07
271 129 1,207 669 6,285 4,694 - - 6,285 5.16 4,694 4.39
3 4 34 - 144 125 - - 144 0.12 125 0.12
10,859 8,336 20,895 19,944 128,256 110,846 (19,194) (13,821) 109,062 89.50 97,025 90.77
122 180 133 128 2,875 2,782 - - 2,875 2.36 2,782 2.60
11 10 21 25 926 1,058 - - 926 0.76 1,059 0.99
468 96 3,023 2,343 16,275 14,070 (7,280) (8,038) 8,995 7.38 6,032 5.64
601 286 3,177 2,496 20,076 17,910 (7,280) (8,038) 12,796 10.50 9,873 9.23

264 John Keells Holdings PLC | Annual Report 2016/17
Decade at a Glance
31 March
LKR Millions
2017* 2016* 2015* 2014* 2013*
OPERATING RESULTS
Group revenue 106,273 93,710 91,852 86,706 85,408
EBIT 23,324 20,192 19,226 16,537 16,677
Finance cost (436) (994) (668) (1,217) (1,081)
Share of results of equity accounted investees 3,303 2,781 2,778 3,089 3,440
Profit before tax 22,888 19,198 18,557 15,320 15,595
Tax expense (4,771) (3,406) (2,812) (2,362) (2,162)
Profit after tax 1 8,117 15,792 15,745 12,958 13,433
Attributable to:
Equity holders of the parent
Equity holders of the parent 16,275 14,070 14,348 11,721 12,113
Non-controlling interests 1,842 1,722 1,397 1,237 1,320
18,117 15,792 15,745 12,958 13,433
CAPITAL EMPLOYED
Stated capital 62,790 58,702 50,703 49,749 26,480
Capital reserves and other components of equity 38,652 28,715 24,501 21,845 20,635
Revenue reserves 77,193 67,565 62,594 51,304 42,704
178,635 154,982 137,798 122,898 89,819
Non-controlling interest 15,696 13,499 12,279 11,421 11,152
Total equity 194,331 168,481 150,077 134,319 100,971
Total debt 22,766 20,750 23,934 26,139 20,107
217,097 189,231 174,011 160,458 121,078
ASSETS EMPLOYED
Property, plant and equipment (PPE) 64,396 52,737 49,563 47,406 49,200
Non-current assets other than PPE 107,912 93,376 78,030 71,969 59,787
Current assets 104,964 94,863 90,493 82,206 49,934
Liabilities net of debt (60,175) (51,745) (44,075) (41,123) (37,843)
217,097 189,231 174,011 160,458 121,078
CASH FLOW
Net cash flows from operating activities 21,020 20,513 20,855 8,041 14,568
Net cash flows from / (used in) investing activities (17,670) (9,567) (1,255) (19,710) (16,199)
Net cash flows from / (used in) financing activities (4,105) (7,717) (4,838) 25,446 (1,320)
Net increase / (decrease) in cash and cash equivalents (755) (3,229) 14,762 13,777 (2,951)
KEY INDICATORS
Basic earnings per share (LKR) 11.9 10.5 12.6 10.5 10.7
Interest cover (no. of times) 52.8 51.5 27.7 13.6 15.4
Net assets per share** (LKR) 128.7 111.7 99.3 88.6 64.7
Enterprise value (EV) 136,022 124,182 155,675 155,675 203,615
EV / EBITDA 5.0 5.0 6.6 10.0 10.0
ROE (%) 9.8 9.6 11.0 11.0 15.0
Debt / equity ratio (%) 11.7 12.3 15.9 19.5 19.9
TSR (%) (10.0)*** (12.2)*** (12.0)*** (0.4)*** 21.7
Dividend payout (Rs 'millions) 7,280 8,038 3,476 3,267 2,982
Current ratio (no. of times) 3.7 4.0 2.6 2.4 2.0
Market price per share unadjusted (LKR) 137.9 148.0 199.4 227.0 247.0
Market price per share diluted (LKR) 137.9 129.5 152.7 173.8 238.2
Revenue growth rate (%) 13.4 1.6 5.9 4.1 9.7
USD closing rate 151.9 147.7 133.5 130.7 126.8
USD average rate 148.0 139.2 131.2 130.1 129.9
* The figures are derived from financial statements prepared in accordance with SLFRS/LKAS. Figures for the remaining periods are derived from
financial statements prepared in accordance with previous SLASs.
** Net assets per share has been calculated, for all periods, based on the net assets of the Group and number of shares in issue as at 31 March 2017.
*** Includes the proportionate impact arising from the ownership of warrants.

265Group Highlights | Governance | Management Discussion & Analysis | Financial Statements | Supplementary Information
2012 2011 2010 2009 2008
75,924 60,500 47,980 41,023 41,805
14,192 11,425 7,908 7,986 8,197
(1,416) (796) (1,370) (1,695) (1,618)
2,809 2,641 2,556 2,340 2,243
12,778 10,629 6,538 6,291 6,579
(1,827) (1,566) (986) (1,326) (1,054)
10,951 9,063 5,552 4,965 5,525
9,689 8,245 5,201 4,733 5,119
1,262 818 351 232 406
10,951 9,063 5,552 4,965 5,525
25,111 24,612 23,322 22,525 22,464
13,226 9,560 7,574 7,437 6,019
33,001 25,415 18,936 15,545 14,914
71,338 59,587 49,832 45,507 43,397
8,624 7,608 6,430 4,960 4,770
79,962 67,195 56,262 50,467 48,167
20,054 14,641 17,453 21,596 12,667
100,016 81,836 73,715 72,063 60,834
34,246 28,628 29,989 29,965 28,381
52,397 47,436 34,104 33,456 19,128
47,412 34,228 34,566 28,718 23,440
(34,039) (28,456) (24,944) (20,076) (10,115)
100,016 81,836 73,715 72,063 60,834
16,476 8,501 9,485 4,146 6,914
(9,003) (4,469) (5,823) (3,972) (4,359)
496 (6,791) (636) 2,332 (6,262)
7,969 (2,759) 3,026 2,506 (3,707)
9.5 8.2 5.2 4.7 5.1
10.0 14.4 5.8 4.7 5.1
51.4 43.0 35.9 32.8 31.3
166,143 175,672 109,548 42,815 76,713
13.1 13.1 10.9 4.3 7.8
14.7 15.1 10.9 10.6 12.3
25.0 21.8 31.0 42.8 26.3
58.2 204.3 (43.1) 15.7 24.6
2,314 1,844 1,883 3,176 1,412
2.0 1.8 2.1 1.8 1.9
206.0 285.6 184.0 62.8 119.8
152.6 34.6 66.0 62.0 52.6
25.5 26.1 17.0 -1.9 27.2
128.1 110.4 114.0 115.5 107.8
112.6 112.1 115.0 109.8 110.3

266 John Keells Holdings PLC | Annual Report 2016/17
Indicative US Dollar Financial Statements
Income Statement for Information Purposes Only
Group Company
For the year ended 31 March
In USD'000s
2017 2016 2017 2016
Continuing operations
Sale of goods 449,231 396,940 - -
Rendering of services 250,394 237,736 7,415 7,505
Revenue 699,625 634,676 7,415 7,505
Cost of sales (494,787) (440,618) (3,713) (3,670)
Gross profit 204,838 194,058 3,702 3,835
Dividend income - - 68,920 69,494
Other operating income 11,621 11,542 17,168 25,885
Selling and distribution expenses (25,679) (24,487) - -
Administrative expenses (75,285) (72,768) (5,951) (6,418)
Other operating expenses (20,870) (23,228) (6,196) (3,838)
Results from operating activities 94,625 85,117 77,643 88,958
Finance cost (2,872) (6,731) (589) (553)
Finance income 66,052 54,256 36,476 31,428
Change in insurance contract liabilities (32,056) (23,234) - -
Change in fair value of investment property 3,183 1,780 - -
Share of results of equity accounted investees 21,744 18,837 - -
Profit before tax 150,676 130,025 113,530 119,833
Tax expense (31,409) (23,071) (7,195) (4,222)
Profit for the year 119,267 106,954 106,335 115,611
Attributable to:
Equity holders of the parent 107,143 95,292
Non-controlling interests 12,124 11,662
119,267 106,954
Basic earnings per share 0.08 0.07
Diluted earnings per share 0.08 0.07
This information does not constitute a full set of financial statements in compliance with SLFRS/LKAS. The above should be read together with
the Auditors' opinion and the notes to the financial statements. Exchange rates prevailing at year end USD/LKR 151.90 (2016 - 147.65) have been
used to convert the income statement and statement of financial position.

267Group Highlights | Governance | Management Discussion & Analysis | Financial Statements | Supplementary Information
Statement of Financial Position for Information Purposes Only
Group Company
For the year ended 31 March
In USD'000s
2017 2016 2017 2016
ASSETS
Non-current assets
Property, plant and equipment 423,939 357,172 618 786
Lease rentals paid in advance 86,939 73,743 - -
Investment property 35,327 33,040 - -
Intangible assets 13,944 15,834 203 297
Investments in subsidiaries - - 282,998 246,425
Investments in equity accounted investees 116,648 114,795 58,662 60,058
Non-current financial assets 182,137 153,305 18,367 3,437
Deferred tax assets 945 879 - -
Other non-current assets 274,472 240,821 107 84
1,134,351 989,589 360,955 311,087
Current assets
Inventories 36,904 31,594 - -
Trade and other receivables 76,942 67,721 777 1,146
Amounts due from related parties 735 901 1,888 4,031
Other current assets 21,497 15,601 655 869
Short term investments 521,227 491,941 396,598 385,115
Cash in hand and at bank 33,701 34,727 2,003 1,207
691,006 642,485 401,921 392,368
Total assets 1,825,357 1,632,074 762,876 703,455
EQUITY AND LIABILITIES
Equity attributable to equity holders of the parent
Stated capital 413,365 397,575 413,365 397,575
Revenue reserves 508,184 457,599 329,088 278,509
Other components of equity 254,454 194,485 9,905 7,349
1,176,003 1,049,659 752,358 683,433
Non-controlling interest 103,328 91,423 - -
Total equity 1,279,331 1,141,082 752,358 683,433
Non-current liabilities
Insurance contract liabilities 208,692 184,255 - -
Interest-bearing loans and borrowings 93,500 92,833 - -
Deferred tax liabilities 15,380 13,744 - -
Employee benefit liabilities 12,378 11,249 1,435 1,281
Other deferred liabilities 5,523 5,837 680 2,513
Other non-current liabilities 25,898 20,963 - -
361,371 328,881 2,115 3,794
Current liabilities
Trade and other payables 93,061 86,390 2,173 2,252
Amounts due to related parties 69 196 1,383 692
Income tax liabilities 15,769 12,689 4,184 2,340
Short term borrowings 9,086 5,562 - -
Interest-bearing loans and borrowings 19,216 20,261 - 10,041
Other current liabilities 19,382 15,136 108 110
Bank overdrafts 28,072 21,877 555 793
184,655 162,111 8,403 16,228
Total equity and liabilities 1,825,357 1,632,074 762,876 703,455
This information does not constitute a full set of financial statements in compliance with SLFRS/LKAS. The above should be read together
with the Auditors' opinion and the notes to the financial statements. Exchange rates prevailing at year end USD/LKR 151.90
(2016 : 147.65) have been used to convert the income statement and statement of financial position.

268 John Keells Holdings PLC | Annual Report 2016/17
Sri Lankan Economy
Summary indicator Units 2009 2010 2011 2012 2013 2014 2015 2016
GDP growth (2010 base) Per cent - - 8.4 9.1 3.4 5.0 4.8 4.4
GDP growth (2002 base) Per cent 3.5 8.0 8.2 6.3 7.2 7.4 5.7 -
GDP(current prices: 2010 base) Rs. Billion - 6,414 7,219 8,732 9,592 10,361 10,952 11,839
GDP(current prices: 2002 base) Rs. Billion 4,835 5,604 6,543 7,579 8,674 9,785 10,660 -
GDP(current prices: 2010 base) USD Billion - 56.7 65.3 68.4 74.3 79.4 80.6 81.3
GDP(current prices: 2002 base) USD Billion 42.1 49.6 59.2 59.4 67.2 74.9 78.4 -
GDP per capita (USD) Growth : 2010 base Per cent - - 14.0 7.1 7.7 5.9 0.6 (0.2)
GDP per capita (USD) Growth : 2002 base Per cent 2.1 16.7 18.3 3 12 11 8 -
GDP per capita (market prices: 2010 base) Rs 000 - 310 346 428 466 499 522 558
GDP per capita (market prices: 2002 base) Rs 000 236 271 314 371 422 471 508 -
GDP per capita (market prices: 2010 base) USD - 2,744 3,129 3,351 3,609 3,821 3,843 3,835
GDP per capita (market prices: 2002 base) USD 2,057 2,400 2,836 2,908 3,265 3,608 3,894 -
Inflation (CCPI 2013=100) annual average Per cent - - - - - - 2.2 4
Inflation (CCPI 2006/07=100) annual average Per cent 3.5 6.2 6.7 7.6 6.9 3.3 0.9 3.7
Inflation (NCPI 2013=100) annual average Per cent - - - - - - 3.8 4
Current account balance USD Billion (0.2) (1.1) (4.6) (4.0) (2.5) (2.0) (1.9) (1.9)
Current account % of GDP* Per cent (0.5) (1.9) 7.1 (5.8) (3.4) (2.5) (2.3) (2.4)
Population Million 20.5 20.7 20.9 20.4 20.6 20.8 21.0 21.2
Exchange rate (Annual Average) Rs/USD 114.9 113.1 110.6 127.6 129.1 130.6 135.9 145.6
Exchange rate change (Annual Average) Per cent 6.1 (1.6) (2.2) 15.4 1.2 1.1 4.1 7.1
12m T-Bill yield (yr-end) Per cent 9.3 7.6 9.3 11.7 8.3 6.0 7.3 10.2
Prime lending rate (yr-end) Per cent 10.9 9.3 10.8 14.4 10.1 6.3 7.5 11.5
M2b money supply growth Per cent 18.6 15.8 19.1 17.6 16.7 13.4 17.8 18.4
Exports USD Billion 7.1 8.6 10.6 9.8 10.4 11.1 10.5 10.3
Imports USD Billion 10.2 13.5 20.3 19.2 18.0 19.4 18.9 19.4
Balance of payments* Per cent of GDP 6.5 1.6 (1.6) 0.2 1.3 1.7 (1.8) (0.6)
Budget deficit* Per cent of GDP (9.9) (7.0) (6.2) (5.6) (5.4) (5.7) (7.6) (5.4)
Unemployment rate Per cent 5.8 4.9 4.2 4.0 4.4 4.3 4.7 4.4
All Share Index (yr-end) Points 3,386 6,636 6,074 5,643 5,913 7,299 6,895 6,228
Tourist arrivals No.' 000 447.9 654.5 856.0 1,006 1,275 1,527 1,798 2,051
* Uses rebased GDP (2010 base) from 2010 onwards
Sri Lanka's economic growth continued to
moderate in 2016, slowing to 4.4 per cent
from 4.8 per cent growth in the previous
year. Strong growth in the construction sub-
segment led a notable rise in the Industrial
sector, while the services sector continued
to grow at healthy levels, despite recording
a slight moderation from the previous year.
Nevertheless, overall growth was weighed
down by poor performance in the agrarian
sector as a result of adverse weather
conditions throughout of most of the year.
Poor weather conditions also contributed to
several food supply disruptions throughout
the year which resulted in inflation edging
up in 2016, averaging higher at 4.0 per cent
(CCPI - 2013 base) compared to the 2.2
per cent average in 2015. In addition to the
unfavourable supply side factors, revisions
to taxation policies and rates implemented
by the Government during the year, such as
the VAT revision, also contributed to the rise
in inflation.
Given the accelerating pace of growth in
private sector credit, coupled with increased
import demand and concerns of demand
driven inflation pressures, the CBSL
maintained a contractionary monetary policy
stance throughout 2016. Following the hike
in the Statutory Reserve Ratio in December
2015, the Bank raised key policy rates by 50
basis points each in February and July 2016.
Despite these moves, credit demand was
slow to respond as it ended the year above
the 20 per cent YOY (Year-on-Year) growth
target set by the CBSL. This prompted the
Bank to raise rates once again in March 2017
by 25 basis points. The tightening stance
was further advocated by the International
Monetary Fund (IMF) under its Extended
Fund Facility (EFF) which was put in place in
mid-2016 to support the country’s economic
reform agenda amid worsening debt levels
and external financing conditions. Under
the recommendation of the IMF, the CBSL is
also expected to move towards an inflation
targeting monetary framework from the
previous monetary targeting framework.
In line with the tightening monetary stance, key
market rates rose significantly during the year
with the Average Weighted Prime Lending Rate
(AWPLR) rising by 402 basis points to 11.52
per cent by end-2016 from 7.50 per cent at the
end of 2015. Similarly, the Average Weighted
Deposit Rate (AWDR) rose by 197 basis points
to 8.17 per cent by the end of 2016.
Broad money supply continued to accelerate
in 2016, rising by 18.4 per cent compared to
the 17.8 per cent growth in 2015. This was led
primarily by a sizable increase in credit to the
private sector which recorded an absolute
growth of Rs. 754.8 billion compared to the
Rs. 691.4 billion increase in the previous year.
Net credit to the Government also contributed
to the rise, increasing by 12.1 per cent
over the year. Credit to public corporations
however recorded a decline of 5.3 per cent
during the year.
Sri Lanka’s Balance of Payments (BOP)
deficit improved in 2016, contracting to US$
500 million from the US$ 1.5 billion deficit
seen in the previous year. This was due to
an improvement in the Financial Account,
despite a marginal expansion in the deficit in
the Current Account to 2.4 per cent of GDP.
Increased import demand and weak export
performance contributed to a widening of the
trade deficit to US$9.1billion in 2016 from a
deficit of US$ 8.4billion seen in the previous
year. Despite the curtailment of vehicle
imports through several administrative
measures taken by the Government, a sharp
increase in investment goods imports,
particularly machinery and equipment saw

269Group Highlights | Governance | Management Discussion & Analysis | Financial Statements | Supplementary Information
overall import expenditure accelerate during
the year. Meanwhile, poor global demand
conditions and low commodity prices
contributed to the decline in export earnings.
Nevertheless, increased tourism earnings
and moderately higher workers’ remittances
resulted in an improvement in the Services
account, cushioning the overall fall in the
Current Account. Tourist arrivals grew 14 per
cent during the year, crossing the 2 million
mark, while Tourism earnings increased by 18
per cent to US$3.5billion. Workers’ Remittance
inflows also improved by 3.7 per cent to
US$7.2billion in 2016, reversing from the 0.5
per cent decline seen in the previous year.
On the external front, Sri Lanka remained
largely vulnerable to global volatilities,
particularly amid political uncertainties
such as Brexit and the U.S presidential
election, as well as a heightened global rates
environment. With increased outflows being
seen from emerging markets in the last
quarter of 2016, foreign holdings in the Sri
Lankan government securities market were
severely impacted, reducing by Rs. 43.6 billion
during the year. This added depreciatory
pressure on the currency, which weakened
by 4.0 per cent against the USD in 2016. In
contrast, however, the LKR strengthened by a
sizable 13.8 per cent against the GBP during
the year, as the GBP weakened following UK’s
referendum to leave the EU. Foreign Direct
Investments also remained subdued in 2016,
dropping marginally to US$ 1.0 billion from
US$ 1.1 billion seen in the previous year.
Sri Lanka’s gross official reserves continued
to deplete in 2016, falling to US$ 6.0 billion
from US$ 7.3 billion in the previous year. This
was due to several foreign currency debt
repayments and defence of the LKR in the
first half of 2016. Under the guidance of the
IMF, the Central Bank aims to improve the
reserve position to US$7.5 billion by the end
of 2017.
According to the Central Bank Annual Report,
Sri Lanka achieved its fiscal targets for 2016,
reducing the budget deficit to 5.4 per cent of
GDP from 7.6 per cent in the previous year.
During the year, the Government undertook
several measures to improve the country’s
fiscal status following a revenue-based fiscal
consolidation programme. This included
several revisions to tax rates, a widening of
the tax net and efforts to improve revenue
collection. This saw total revenue increase
to 14.2 per cent of GDP from 13.3 per cent
in 2015, with a commendable growth in
non-tax revenue. Supported by reductions in
both recurrent and capital expenditure, Total
expenditure also declined to 19.7 per cent of
GDP in 2016, below the 20.9 per cent seen in
the prior year.
The Year That Was
The GDP growth for the full year of 2016 was
recorded at 4.4 per cent. Out of the three
major sub sectors of GDP; Industry and
Services recorded growth rates of 6.7 per
cent and 4.2 per cent respectively, while the
Agricultural sector recorded a sizable decline
of 4.2 per cent.
Growth in the Agricultural sector in 2016
was significantly disturbed by intemperate
weather conditions experienced throughout
the year, leading to a significant contraction
of 4.2 per cent YOY in 2016 – down from the
positive growth of 4.8 per cent YOY recorded
in the previous year. This was mainly led
by rice and tea sub-categories which saw
significant declines of 31.0 per cent and 11.2
per cent YOY, respectively. The continued
weak performance of the Tea industry was
owing to poor demand conditions and lower
tea production. Additionally, Rubber also
contributed significantly to this decline, falling
by 10.7 per cent YOY.
However, vegetables and oleaginous
fruits (coconut, king coconut, oil palm)
subcategories were less affected by the
detrimental weather conditions, recording
marginal declines of 2.1 per cent and 0.6 per
cent YOY, correspondingly.
The Industrial sector grew at 6.7 per cent
in 2016, improving substantially from the
previous year’s growth of 2.1 per cent
YOY. This growth was mainly driven by the
construction sub-sector which witnessed
a significant upturn of 14.9 per cent YOY,
followed by the mining and quarrying sub-
category which showed 14.4 per cent growth.
Meanwhile, the food, beverages and tobacco
sub-sector recorded a marginal decline of 2.5
per cent during the year.
The services sector, the most significant
component of GDP registered a growth of
4.2 per cent YOY in 2016, below the 5.7 per
cent growth recorded in 2015, reflecting
a slowdown in a majority of the service
activities. Financial service activities led
the service sector growth, rising at 12.4
per cent YOY, followed by transportation
and whole and retail trade. Transportation
category recorded a YOY growth of 4.2 per
cent, while growth in wholesale and retail
trade moderated to 2.5 per centYOY in 2016,
from a 5.1 per cent increase recorded in the
previous year.
Together with the moderation in overall
economic growth, domestic consumption
demand in real terms plummeted to 0.9 per
cent in 2016 from 8.8 per cent in the previous
year (2010 base). This is likely attributable to
the tightened monetary environment as well
as significant weather disruptions during the
year. Total domestic demand in real terms
also saw a slight decline to 6.2 per cent from
6.3 per cent a year ago. However, real growth
in investment expenditure climbed to 18.1
per cent in 2016, from the 1.2 per cent rise
recorded in 2015.
The Department of Census and Statistics
(DCS) revised the base year of the CCPI to
2013 from the previous base of 2006/07.
According to the new base (2013=100),
headline inflation reached an annual average
of 4.0 per cent in 2016 – higher than 2.2 per
cent average recorded in 2015. Headline
inflation picked up significantly during the
first half of 2016, peaking at 5.8 per cent YOY
in July. Thereafter, it slowed down to around
4.0 per cent levels toward the latter half of
the year with a slight uptick in recorded
in December. The price movements were
largely owing to shortage in food supplies
during the year due to severe weather
conditions. Several tariff revisions which took
place throughout the year also contributed to
the upward movement in headline inflation.
On the external front, Sri Lanka’s trade
account widened considerably during 2016
on account of increasing import expenditure
and weak export performance, despite
the significant decline in vehicle and fuel
imports during the year. Export earnings saw
a contraction of 2.2 per cent YOY in 2016,
with a slight improvement seen toward the
latter part of the year. The decline primarily
reflects reduced domestic output and lower
commodity prices, particularly in agricultural
exports. Exports of transport equipment (due
to base effect of higher earnings in 2015),
petroleum products, tea and spices were the
main contributors to the downturn, recording
declines of 46.0 per cent, 23.3 per cent, 5.3
per cent and 16.0 per cent YOY, respectively.
However, earnings from textiles and garment
exports, a significant component of industrial
exports, saw a marginal rise of 1.3 per cent
YOY in 2016. Overall import expenditure
expanded by 2.5 per cent in 2016, reversing
from the 2.5 per cent decline recorded in
the previous year. A 13.8 per cent growth
in expenditure on Investment goods led the
overall increase in imports, mainly due to
a notable rise in machinery & equipment
and building material imports. Increased
expenditure on Intermediate goods also
contributed to the expansion in imports,
mainly owing to a 17.8 per cent YOY growth in
textiles and textile articles imports. However,
expenditure on fuel imports continued to
decline, contracting by 8.1 per cent YOY due
to the reduction in world crude oil prices,
despite the increase in import volume toward
the latter part of the year. Expenditure on
consumer goods recorded a contraction of
8.4 per cent in 2016, caused by a 41.5 per
cent YOY decline in personal motor vehicles
imports as a result of increased tariffs to
curtail vehicle imports.
Net foreign inflows to the Colombo Stock
Exchange (CSE) remained moderate during
2016, amounting to US$ 19.0 million, slightly
above the US$ 4.0 million inflows seen in the
previous year. Outflows from the Government
securities market reduced during the year,
recording a net outflow of US$ 325 million,
compared to the US$ 1,093.4 million during
2015.

270 John Keells Holdings PLC | Annual Report 2016/17
Group Real Estate Portfolio
Net book value
Buildings Land in acres 2017 2016
Owning company and location in (Sq. Ft) Freehold Leasehold LKR '000s LKR '000s
PROPERTIES IN COLOMBO
John Keells Office Automation (Pvt) Ltd.
No.90 ,Union Place, Colombo 2. 9,100 - - - 76
John Keells PLC.
56/1, 58, 58 1/1 Kirulapone Avenue, Colombo 5. - 0.08 - 1,249 1,249
Keells Realtors Ltd.
427 & 429, Ferguson Road, Colombo 15. 27,750 1.22 - 311,599 298,192
Mackinnon Keells Ltd.
Leyden Bastian Road, York Street, Colombo 1. 31,656 0.45 - 506,083 475,258
Union Assurance PLC.
No 20, St. Michaels' Road, Colombo 3. 57,916 0.58 - 1,121,751 1,128,379
Whittall Boustead (Pvt) Ltd.
No.199 ,Union Place, Colombo 2. 14,014 0.50 - 446,800 406,800
148, Vauxhall Street, Colombo 2. 97,128 3.06 - 2,397,687 2,281,523
237,564 5.89 - 4,785,169 4,591,477
PROPERTIES OUTSIDE COLOMBO
Ceylon Cold Stores PLC.
Kaduwela. 312,042 27.35 - 1,264,323 1,118,853
Trincomalee. 23,840 1.14 - 207,042 111,404
Facets (Pvt) Ltd.
Ahungalla. - 6.31 - 400,000 367,385
John Keells BPO Solutions India (Pvt) Ltd.
Floor 8, Tower B &C, Building No.6, DLF SEZ Cyber
City, Phase III, Gurgaon, Haryana. 48,659 - - 39,822 50,217
John Keells PLC.
17/1, Temple Road, Ekala, Ja-Ela. - 3.77 - 226,500 181,170
John Keells Properties Ja-Ela (Pvt) Ltd
No 525, Colombo Road, Kapuwatta, Ja-Ela. 144,631 6.60 - 1,758,000 1,633,000
John Keells Warehousing (Pvt) Ltd.
Muthurajawela. 146,743 - 6.00 315,057 323,024
Keells Food Products PLC.
41, Temple Road, Ekala, Ja-Ela. 52,569 3.00 1.00 240,411 202,730
Gonawila, Pannala 28,700 - 4.08 222,651 198,820
Rajawella Holdings Ltd.
Mahaberiatenna, Kandy. 3,700 - 517.09 1,915,363 1,925,345
Tea Smallholder Factories PLC.
Broadlands. 56,478 4.14 - 54,000 63,000
Halwitigala. 48,747 9.61 - 61,000 52,500
Hingalgoda. 63,676 17.00 - 83,000 84,000
Karawita. 80,364 - 4.98 97,655 83,741
Kurupanawa. 51,410 11.80 - 59,000 57,000
Neluwa. 48,888 5.27 - 67,000 60,000
New Panawenna. 44,568 10.59 - 48,000 42,000
Pasgoda. 40,091 7.24 - 48,000 33,000
Peliyagoda. 31,629 - 0.98 176,263 153,000

271Group Highlights | Governance | Management Discussion & Analysis | Financial Statements | Supplementary Information
Net book value
Buildings Land in acres 2017 2016
Owning company and location in (Sq. Ft) Freehold Leasehold LKR '000s LKR '000s
PROPERTIES OUTSIDE COLOMBO (Contd.)
The Colombo Ice Company (Pvt) Ltd.
Avissawella - - 9.30 174,701 -
Transware-Logistics (Pvt) Ltd.
Tudella, Ja-Ela. 64,670 17.77 - 476,256 417,292
Union Assurance PLC.
No 06,Rajapihilla Road, Kurunegala. 27,904 0.20 - 218,834 221,767
Whittall Boustead Ltd.
150, Badulla Road, Nuwara Eliya. 4,343 0.46 - 96,811 97,368
1,323,652 132.25 543.43 8,249,689 7,476,616
HOTEL PROPERTIES
Asian Hotels and Properties PLC.
Cinnamon Grand Premises, Colombo 3. 648,793 8.03 - 25,159,212 15,910,277
Crescat Boulevard, Colombo 3. 145,196 - - 2,416,250 2,260,000
Ahungalla Holiday Resorts (Pvt) Ltd.
Ahungalla. - 4.63 - 152,790 148,000
Beruwala Holiday Resorts (Pvt) Ltd.
Cinnamon Bey, Beruwala. 425,684 11.39 - 3,406,000 3,229,000
Ceylon Holiday Resorts Ltd.
Bentota Beach by Cinnamon, Bentota. 236,524 2.32 11.02 291,173 642,042
Fantasea World Investments (Pte) Ltd.
Cinnamon Hakuraa Huraa Maldives. 150,412 - 13.42 1,183,395 1,155,217
Habarana Lodge Ltd.
Cinnamon Lodge, Habarana. 202,999 - 25.48 715,100 669,900
Habarana Walk Inn Ltd.
Habarana Village by Cinnamon, Habarana 121,767 - 9.34 308,100 291,755
Hikkaduwa Holiday Resorts (Pvt) Ltd.
Hikka Tranz by Cinnamon, Hikkaduwa. 233,965 0.29 4.36 1,175,799 1,194,996
Kandy Walk Inn Ltd.
Cinnamon Citadel, Kandy. 173,900 6.39 - 1,438,299 1,293,567
Nuwara Eliya Holiday Resorts (Pvt) Ltd.
Nuwara Eliya. - 3.35 - 290,911 259,396
Resort Hotels Ltd.
Medway Estate, Nilaveli. 4,485 41.73 - 834,500 767,740
Trans Asia Hotels PLC.
Cinnamon Lakeside, Colombo 2. 448,791 - 7.65 5,688,301 5,519,905
Tranquility (Pte) Ltd.
Cinnamon Dhonveli Maldives. 246,358 - 18.62 9,690,056 7,414,527
Travel Club (Pte) Ltd.
Ellaidhoo Maldives by Cinnamon 170,877 - 13.75 1,529,257 1,564,499
Trinco Holiday Resorts (Pvt) Ltd.
Trinco Blu by Cinnamon, Trincomalee. 120,910 13.24 - 1,015,396 980,796
Trinco Walk Inn Ltd.
Trincomalee. - 14.64 - 208,967 197,605
Wirawila Walk Inn Ltd.
Randunukelle Estate, Wirawila. - 25.15 - 86,883 86,886
Yala Village (Pvt) Ltd.
Cinnamon Wild, Yala. 111,529 - 11.25 474,431 485,569
3,442,190 131.16 114.89 56,064,820 44,071,677
Improvements to Keells Super outlets on leased hold
properties
- - - 2,087,993 1,122,549
5,003,406 269.30 658.32 71,187,671 57,262,319

John Keells Holdings PLC | Annual Report 2016/17272
Memberships Maintained by the Group
Senior management personnel of the
Group hold positions in an array of industry,
professional and governance bodies and
participate to the fullest in realising the
objectives of these bodies. The Group
views these memberships as a vital part of
sustaining its businesses for the long term,
especially given the ability of such bodies
to recommend policy changes needed to
create a better environment for businesses
and thereby ensure that stakeholders
flourish which no doubt would result in
the country benefiting. During the year, the
Group’s senior management contributed to
ongoing dialogue with government bodies
by participating in industry led committees
in areas such as constitutional reform,
legislation relating to taxation, Right to
Information, Sustainable Development,
Securities & Exchange Commission and also
recommending the way forward relating
to macroeconomic matters. In addition,
industry specific developments in areas
such as transport & logistics and trade, as
well as in areas such as food safety towards
developing standards and regulations in line
with international standards are some of
the areas in which the senior management
have participated in. This engagement has
strengthened the partnerships with such
bodies, the government as well as industry
peers.
The members of Group Executive Committee hold the following positions:
• Members of Committees of the Ceylon Chamber of Commerce such as Main Committee,
Co-Chair of the National Agenda Committee on Logistics & Transport, Chairperson of the
Legislation Sub Committee, Sub Committee on Economic, Fiscal and Policy Planning
• Council Member of the Sri Lanka Institute of Directors
• Member of the National Labour Advisory Committee
• Member of the Tourism Advisory Committee
• Member of the Advisory Committee for Investment Promotion
• Member of the Board of SLINTEC (Sri Lanka Institute of Nano Technology)
• Member of the Steering Committee for establishment of the National Science Centre in Sri
Lanka
• Council Member, Member of the International Management Council and International Vice
President of the Chartered Institute of Logistics & Transport
• Member of the Advisory Council of the Sri Lanka Logistics & Freight Forwarders Association
• Vice President of the Indo-Lanka Chamber of Commerce
• President of the Beverage Association of Sri Lanka
• Member of the Food Advisory Committee of the Ministry of Health
During the year, all business units and sectors maintained their numerous memberships in the
respective industry, professional and governance bodies, and contributed their valuable input to
these bodies and committees as relevant.

273Group Highlights | Governance | Management Discussion & Analysis | Financial Statements | Supplementary Information
Independent Assurance Statement on Non-Financial Reporting
Scope and Approach
DNV GL represented by DNV GL Business
Assurance Lanka (Private) Limited has
been commissioned by the management
of John Keells Holdings PLC (‘JKH’ or ‘the
Company’) to carry out an independent
assurance engagement (Type 2, Moderate
level) for the non-financial - qualitative
and quantitative information (sustainability
performance) reported in JKH’s Annual
Report 2016/17 (‘the Report’) in its printed
format for the financial year ending 31st
March 2017. The sustainability disclosures
in this Report is prepared by JKH, based on
the ‘in accordance’ -core option of the Global
Reporting Initiative (GRI) Sustainability
Reporting Guidelines GRI G4.
We performed our work using Account
Ability’s AA1000 Assurance Standard
2008 (AA1000 AS) and DNV GL’s assurance
methodology VeriSustainTM , which is based
on our professional experience, international
assurance best practice including
International Standard on Assurance
Engagements 3000 (ISAE 3000) Revised*
and GRI G4. Our assurance engagement was
planned and carried out in February 2017 –
May 2017.
The intended user of this assurance
statement is the Management of JKH (‘the
Management’). We disclaim any liability or
responsibility to a third party for decisions,
whether investment or otherwise, based on
this assurance statement.
The reporting aspect boundary of
sustainability performance is based
on internal and external materiality
assessment carried out by the Company
and covers JKH’s operations in Sri Lanka,
Maldives and India. The Report does not
include performance data and information
related to the activities of non-operational
entities, investment entities and companies
holding only land, over which JKH does not
exercise significant management control.
This is as set out in the Report in the section
‘Scope and Boundary’.
We planned and performed our work to
obtain the evidence we considered necessary
to provide a basis for our assurance opinion
and the process did not involve engagement
with external stakeholders.
Responsibilities of the Management of
JKH and of the Assurance Providers
The Management of JKH have the sole
responsibility for the preparation of the
Report as well as the processes for collecting,
analysing and reporting the information
presented in the Report. In performing our
assurance work, our responsibility is to
the Management; however, our statement
represents our independent opinion and
is intended to inform the outcome of our
assurance to the stakeholders of the Company.
DNV GL was not involved in the preparation of
any statements or data included in the Report
except for this Assurance Statement.
DNV GL’s assurance engagements are
based on the assumption that the data and
information provided by the client to us as
part of our review have been provided in good
faith. We were not involved in the preparation
of any statements or data included in the
Report except for this Assurance Statement.
DNV GL expressly disclaims any liability or
co-responsibility for any decision a person or
an entity may make based on this Assurance
Statement.
Basis of our Opinion
A multi-disciplinary team of sustainability
and assurance specialists performed work
at JKH’s Corporate Office, and as part of
assurance we visited sample operations
in Sri Lanka. We undertook the following
activities:
• Review of JKH’s approach to stakeholder
engagement and materiality determination
process and the outcome as reported in
this Report. We did not have any direct
engagement with external stakeholders;
• Interviews with selected senior managers
responsible for management of
sustainability issues and review of selected
evidence to support issues discussed.
We were free to choose interviewees
and interviewed those with overall
responsibility to deliver the Company’s
sustainability objectives;
• Site visits to sample branch operations -
(i) Cinnamon Wild Yala (Cinnamon Hotels
and Resorts), (ii) Warehouse at Seeduwa
(John Keells Logistics Pvt. Limited), and
(iii) Keells Super at Thimbirigasyaya
(JayKay Marketing Services) - to
review processes and systems for
preparing site level sustainability data
and implementation of sustainability
strategy. We were free to choose sites we
visited;
• Review of supporting evidence for key
claims and data in the Report;
• Review of the processes for gathering and
consolidating the specified performance
data and, for a sample, checking the
data consolidation. The reported data
on economic performance, expenditure
towards Corporate Social Responsibility
(CSR) and other financial data are based
on audited financial statements issued by
the Company’s statutory auditors;
• An independent assessment of JKH’s
reporting against the Global Reporting
Initiative (GRI) G4 Guidelines and the
reporting requirements for its ‘in
accordance’ – Core option.
During the assurance process, we did not
come across limitations to the scope of the
agreed assurance engagement.
Opinion
On the basis of the verification undertaken,
nothing came to our attention to suggest
that the Report does not properly describe
JKH’s adherence to the GRI G4 reporting
requirements including the Principles for
Defining Report Content, identified material
Aspects, related strategies and Disclosures
on Management Approach and Performance
Indicators as below:
274 John Keells Holdings PLC | Annual Report 2016/17
• General Standard Disclosures: The
reported information on General Standard
Disclosure generally meets the disclosure
requirements for the ‘in accordance’ – Core
option of reporting.
• Specific Standard Disclosures: The
Report describes the generic Disclosures
on Management Approach (DMA) and
Performance Indicators for identified
material Aspects presented within the
Report as below:
Economic
− Economic Performance - G4-EC1, G4-EC3;
− Indirect Economic Impacts - G4-EC7;
− Procurement Practices – G4-EC9
Environmental
− Energy - G4-EN3, G4-EN6;
− Water – G4-EN8;
− Biodiversity – G4-EN11;
− Emissions – G4-EN15, G4-EN16;
− Effluents and Waste - G4-EN22, G4-EN23,
G4-EN24;
− Compliance - G4-EN29;
− Supplier Environmental Assessment - G4-
EN32;
Social
Labour Practices and Decent Work
− Employment - G4-LA1;
− Occupational Health and Safety - G4-LA6;
− Training and Education - G4-LA9, G4-LA11;
− Diversity and Equal Opportunity - G4-LA12;
− Supplier Assessment for Labour Practices
- G4-LA14;
Human Rights
− Freedom of Association and Collections
Bargaining – G4-HR4;
− Child Labour - G4-HR5;
− Forced or Compulsory Labour - G4-HR6;
Society
− Local Communities - G4-SO1;
− Anti-Corruption - G4-SO3;
− Compliance - G4-SO8;
Product Responsibility
− Product and Service Labeling - G4-PR3;
− Marketing Communication - G4-PR7;
− Compliance - G4-PR9.
Observations
Without affecting our assurance opinion, we
also provide the following observations. We
have evaluated the Report’s adherence to
the following principles on a scale of ‘Good’,
‘Acceptable’ and ‘Needs Improvement’:
Materiality
The process of determining the issues that
is most relevant to an organization and its
stakeholders.
JKH has emphasized 26 material aspects on
which an internal and external materiality
determination exercise was carried out to
prioritise Aspects applicable for the Company
as a whole. The materiality of Aspects is
fairly explained in the Report along with the
management and monitoring systems, and
is fairly integrated into JKH’s management
system, decision making process and
strategy. In our opinion, the level at which the
Report adheres to this principle is ‘Good’.
Inclusivity
The participation of stakeholders in developing
and achieving an accountable and strategic
response to Sustainability.
JKH has established a documented process
to identify and adequately monitor feedback
on material issues from diverse stakeholder
groups across its industry sectors. The
Company is in the process of integrating
sustainability within its value chain and has
put in place processes to identify key risks
associated with its value chain. In our opinion,
the level at which the Report adheres to this
principle is ‘Good’.
Responsiveness
The extent to which an organization responds
to stakeholder issues.
JKH has an effective system in place to
adequately monitor and respond to feedback
from stakeholders on material issues and
concerns, through its policies, strategies,
management systems and governance
mechanisms, and this is reflected within the
Report. The Company has set and deployed
targets, objectives and action plans for its
key material issues especially environmental
aspects such as energy, water, compliance
etc. In our opinion, the level at which the
Report adheres to this principle is ‘Good’.
Reliability
The accuracy and comparability of information
presented in the report, as well as the quality
of underlying data management systems.
The majority of data and information verified
at Corporate Office and at sampled operational
sites were found to be fairly accurate. Some
of the data inaccuracies identified during
the verification process were found to be
attributable to transcription, interpretation
and aggregation errors and the errors
have been corrected. JKH has established
a systematic process for capturing data
related to sustainability performance. Hence
in accordance with the AA1000AS (2008)
requirements for a Type 2, moderate level
assurance engagement, we conclude that
sustainability data and information presented
in the Report is reliable and acceptable. In our
opinion, the level at which the Report adheres
to this principle is ‘Good’.
Specific Evaluation of the Information on
Sustainability Performance
We consider the methodology and process
for gathering information developed by JKH
for its sustainability performance reporting
to be appropriate, and the qualitative and
quantitative data included in the Report
was found to be identifiable and traceable;
the personnel responsible were able to
demonstrate the origin and interpretation of
the data and its reliability. We observed that
the Report presents a faithful description of
the reported sustainability activities for the
reporting period.
Additional principles as per DNV GL
VeriSustain
Completeness
How much of all the information that has been
identified as material to the organisation and
its stakeholders is reported.
The Report has fairly attempted to disclose
General and Specific Standard Disclosures
including the disclosure on management
approach covering the strategy, management
approach, monitoring systems and
sustainability performances indicators
against GRI G4’s – ‘in accordance’ – Core
option, and considers Aspects which are
material across JKH’s boundary and its
Independent Assurance Statement on Non-Financial Reporting

275
For DNV GL,
Rathika de Silva
Country Head and Lead Verifier
DNV GL Business Assurance Lanka (Private)
Limited, Colombo, Sri Lanka
Group Highlights | Governance | Management Discussion & Analysis | Financial Statements | Supplementary Information
supply chain. In our opinion, the level at which
the Report adheres to this principle is ‘Good’.
Neutrality
The extent to which a report provides a
balanced account of an organization’s
performance, delivered in a neutral tone.
The disclosures related to sustainability
issues and performances are presented
in a neutral tone, in terms of content and
presentation; however, the Report may further
bring out reasons for underperformance and
challenges during the period with respect to
achieving its short, medium and long term
targets. In our opinion, the level at which the
Report adheres to the principle of Neutrality
is ‘Acceptable’.
Opportunities for Improvement
The following is an excerpt from the
observations and further opportunities for
improvement reported to the management of
JKH and are not considered for drawing our
conclusion on the Report; however, they are
generally consistent with the Management’s
objectives:
• JKH may disclose the outcomes of supply
chain risk assessment across geolocations
and its businesses to further strengthen
the disclosures related to supply chain,
specially with regard to human rights and
labour practices.
• In line with the requirements of GRI G4,
JKH may further define all assumptions,
calculations and sources of data at each
business level.
25 May 2017 , Colombo, Sri Lanka
Prasun Kundu
Assurance Reviewer
Global Service Responsible - Social
Accountability
DNV GL Business Assurance India
Private Limited, India.
Kiran Radhakrishnan
Assessor - Sustainability Services
DNV GL Business Assurance India Private Limited,
India.
DNV GL Business Assurance Lanka (Private) Limited is part of DNV GL – Business Assurance, a global provider of certification, verification, assessment and
training services, helping customers to build sustainable business performance. www.dnvgl.com

276 John Keells Holdings PLC | Annual Report 2016/17
Group Directory 2016/17
John Keells Holdings PLC has business interests across six industry groups, namely,
Transportation, Leisure, Property, Consumer Foods & Retail, Financial Services, Information
Technology and Other including Plantation Services. The Group consists of subsidiaries
and associates companies with significant business operations in Sri Lanka, India and the
Maldives. The holding company is located at No. 117, Sir Chittampalam A. Gardiner Mawatha,
Colombo 2. The Group has considered all its subsidiary and associate companies in capturing
its financial performance. For the purpose of reporting on its sustainability performance, the
Group has considered the companies which are the legal entities and for which the Group is
accountable and has direct control. The companies not included for reporting on Sustainability
Performance are companies in which the Group does not exercise significant management
control, and companies which are non-operational, are investment entities, land only holding
companies, investment holding companies, managing companies and rental of office spaces,
which do not carry out any operations. Such companies have been clearly identified below.
While all core business activities are carried out in-house, the use of outsourced products and
services by Group companies are limited to activities where in it as industry practice to do
so, it has been proven to be an efficient and effective business model or a non-core business
activity.
The customer base serviced by the John Keells Group of companies can be classified primarily
into three sections as illustrated below.
Individuals Businesses & Corporates Government
Consumer Foods & Retail,
Property, Leisure, Financial
Services
IT, Transportation, Leisure,
Other (Plantation Services),
Financial Services
IT
* The company is a non-operational company/ investment company/ holding company or
owner of real estate
** The company has not been considered for sustainability reporting as the Group does not
exercise management control over the entity
TRANSPORTATION
Ports and Shipping
Keells Shipping (Pvt) Ltd. (PV 1272) (100%)
Shipping agency representation & logistics
services
Incorporated in 1996
No. 11, York Street, Colombo 1
Tel:2475509
Directors: S C Ratnayake- Chairman,
R M David, A Z Hashim
Stated capital: LKR500,000
Mackinnon Mackenzie & Co (Shipping) Ltd.
(PB 359) (100%)
Shipping agency representation & logistics
services
Incorporated in 1973
No. 4, Leyden Bastian Road, Colombo 1
Tel:2475423
Directors: S C Ratnayake- Chairman,
R M David, A Z Hashim
Stated capital: LKR5,000,000
Maersk Lanka (Pvt) Ltd. (PV 2550 ) (30%)**
Shipping agency representation & freight
forwarding services
Incorporated in 1992
Level 16,"Park Land",33,Park Street,
Colombo 2.
Tel:0114794800
Directors: W T Ellawala, Dinesh Lal
(Resigned w.e.f (30/03/2014), R M David,
Marc Eugene C Gijsbrechts (Resigned w.e.f
(08/09/2016)
Franck Dedenis, Arjun Arun Maharaj
(Resigned w.e.f (25/03/2016), Sandun
Bandara (Appointed w.e.f (08/09/2016)
Zeeshan Mukhi (Appointed w.e.f
(25/03/2016)
Stated capital: LKR10,000,000
South Asia Gateway Terminals (Pvt) Ltd.
(PV 326) (42.19%)**
Ports & shipping services
Incorporated in 1998
Port of Colombo, P.O. Box 141, Colombo 1.
Tel:24575509
Directors: S C Ratnayake- Chairman,
A D Gunewardene, J R F Peiris, R M David,
C K Cheng, A Hassan (Appointed w.e.f
22/09/2016), J M Bevis (Appointed w.e.f
22/09/2016), K N J Balendra, P Sondergaard,
P M English (Resigned w.e.f 22/09/2016),
S S Jakobsen, R M W B C Rajapaksa
A Z Hashim, D C Smith (Resigned w.e.f
22/09/2016)
W L P Perera, D Ranatunga,R S A Soomar
Stated capital: LKR3,788,485,900
Ports and Shipping
DHL Keells (Pvt) Ltd. (PV 1307) (50%)**
International express courier services
Incorporated in 1986
No. 148, Vauxhall Street, Colombo 2.
Tel:2304304 / 4798600
Directors: S C Ratnayake- Chairman,
R M David alt. A Z Hashim, Y B A Khan,
S P Wall
Stated capital: LKR20,000,020
John Keells Logistics (Pvt) Ltd. (PV 318)
(100%)
Integrated supply chain management
Incorporated in 2006
No. 117, Sir Chittampalam A. Gardiner
Mawatha, Colombo 2.
Tel:2475574
Directors: S C Ratnayake-Chairman,
A D Gunewardene, R M David, A Z Hashim
Stated capital: LKR200,000,000
N D O Lanka (Pvt) Ltd. (PV 831) (60%)**
International freight forwarding and clearing &
forwarding
Incorporated in 1980
No. 11, York Street, Colombo 1
Tel: 7671671
Directors: R M David, H C K Hewamallika
(Resigned w.e.f. 01/02/2017), A Z Hashim,
C Besset
Stated capital: LKR130,000,000
Saffron Aviation (Pvt) Ltd. (PV 84728) (40%)**
Domestic air line operations
Incorporated in 2012
No.11,York Street, Colombo 1.
Tel:2475502
Directors: A D Gunewardene, R M David,
B A B Goonetilleke, K Balasundaram, F Omar,
R T Abeyasinghe, A Z Hashim
Stated capital: LKR622,179,000
G4 - 17

277Group Highlights | Governance | Management Discussion & Analysis | Financial Statements | Supplementary Information
Lanka Marine Services (Pvt) Ltd. (PV 475)
(99.44%)
Importer & supplier of heavy marine fuel oils
Incorporated in 1993
No. 4, Leyden Bastian Road, Colombo 1
Tel:2475410-421
Directors: S C Ratnayake- Chairman,
A D Gunewardene, R M David, A Z Hashim
Stated capital: LKR350,000,000
Mackinnon Mackenzie & Co of Ceylon Ltd.
(PB 348) (100%)*
Foreign recruitment agents & consultants
Incorporated in 1975
No. 11, York Street, Colombo 1
Tel:2475509
Directors: S C Ratnayake- Chairman,
R M David
Stated capital: LKR90,000
Trans-ware Logistics (Pvt) Ltd. (PV 3134) (50%)*
Renting of storage space
Incorporated in 1994
No. 117, Sir Chittampalam A. Gardiner
Mawatha, Colombo 2.
Tel:2475537-9
Directors: S C Ratnayake- Chairman,
A Z Hashim K M D Gay (Appointed w.e.f
27/04/2016), M R B Shafie (Appointed w.e.f
23/03/2017), R M David, A A Miskon
(Alt.N A Latif) (Resigned w.e.f 30/09/2016),
Y K Boo, T H Pang (Resigned w.e.f
27/04/2016)
Stated capital: LKR220,000,080
Air Lines
Mack Air (Pvt) Ltd. (PV 868) (100%)
General sales agents for airlines in Sri Lanka
Incorporated in 1980
No. 11, York Street, Colombo 1.
Tel:2475375/2475335
Directors: S C Ratnayake- Chairman,
R M David, C N Lawrence (Resigned w.e.f.,
01/02/2017), A Z Hashim
Stated capital: LKR12,500,000
Mackinnons Travels (Pvt) Ltd. (PV 1261)
(100%)
IATA accredited travel agent and travel related
services
Incorporated in 1971
No. 186, Vaxhuall Street, Colombo 2.
Tel:2318600
Directors: S C Ratnayake - Chairman,
A D Gunawardene, R S Fernando (Resigned
w.e.f 09/09/2016), R M David (Appointed
w.e.f 02/05/2016),
A Z Hashim (Appointed w.e.f 02/05/2016)
Stated capital: LKR5,000,000
Mack Air Services Maldives (Pvt) Ltd. (C/I
35-2000) (49%)*
General sales agents for airlines in the Maldives
Incorporated in 2000
4th Floor, STO Aifaanu Building,
Boduthakurufaanu Magu, Male 20-05
Republic of Maldives
Tel:+9603334708 - 09
Directors: S C Ratnayake- Chairman,
R M David, S Hameed, A Shihab, A Z Hashim,
Stated capital: USD8,532 (LKR677,892)
LEISURE
Hotel Management
Cinnamon Hotel Management Services Ltd.
(PB 7) (100%)
Operator & marketer of resort hotels
Incorporated in 1974
No.117 Chittampalam A Gardiner Mawatha,
Colombo 2
Tel:2306600, 2421101-8
Directors: S C Ratnayake – Chairman,
A D Gunewardene, J E P Kehelpannala,
B J S M Senanayake,
R J Karunarajah, K N J Balendra (Appointed
w.e.f 02/05/2016 & Resigned w.e.f
28/12/2016)
Stated capital: LKR19,520,000
John Keells Hotels PLC. (PQ 8) (80.32%)*
Holding company of group resort hotel
companies in Sri Lanka & Maldives
Incorporated in 1979
No.117,Chittampalam A Gardiner
Mawatha,Colombo 2
Tel:2306600
Directors: S C Ratnayake – Chairman,
A D. Gunewardene, J R F Peiris,
J E P Kehelpannala, R T Wijesinha (Resigned
w.e.f 30/06/2016), B J S M Senanyake
N B Weerasekera,T L F W Jayasekara,
K N J Balendra (Appointed w.e.f 01/04/2016),
A.K. Moonasinghe (Appointed w.e.f
01/07/2016)
Stated capital: LKR9,500,246,939
Sentinel Realty (Pvt) Ltd. (PV 80706) (41.91%)**
Investment company for hotel development land
Incorporated in 2011
No.117, Chittampalam A Gardiner
Mawatha,Colombo 2.
Tel:2306000
Directors : A D Gunewardene (Resigned w.e.f
12/08/2016), S Rajendra, K N J Balendra
(Appointed w.e.f 12/08/2016)
B A B Goonettileke, K Balasundaram
Stated capital: LKR127,013,480
City Hotels
Asian Hotels and Properties PLC
-Cinnamon Grand. (PQ 2) (78.56%)
Owner & operator of the five star city hotel
"Cinnamon Grand"
Incorporated in 1993
77, Galle Road, Colombo 3.
Tel:2437437 /2497442
Directors: S C Ratnayake- Chairman,
A D Gunewardene - Managing Director,
J R F Peiris, R J Karunarajah,
S Rajendra, S K G Senanayake,
S A Jayasekara, K N J Balendra (Appointed
w.e.f 01/04/2016), C J L Pinto
Stated capital: LKR3,345,118,012
Trans Asia Hotels PLC. (PQ 5) (82.74%)
Owner & operator of the five star city hotel
"Cinnamon Lakeside".
Incorporated in 1981
No. 115, Sir Chittampalam A Gardiner
Mawatha, Colombo 2.
Tel:2491000
Directors: S C Ratnayake - Chairman,
A D Gunewardene, J R F Peiris,
N L Gooneratne, C J L Pinto, J C Ponniah
E H Wijenaike, R J Karunaraj, K N J Balendra
(Appointed w.e.f 01/04/2016)
Stated capital: LKR1,112,879,750
Capitol Hotel Holdings Ltd. (PB 5013)
(19.47%)**
Developer of city business hotels
Incorporated in 2012
No.117, Chittampalam A Gardiner Mawatha,
Colombo 2.
Tel:2306000
Directors: A D Gunewardene, S Rajendra
(Resigned w.e.f 01/06/2016),
M S Weerasekera - Chairman
W R K Wannigama, D A Kannangara,
M D R Gunatilleke, L C H Leow,
A J Pathmarajah, K N J Balendra (Appointed
w.e.f 01/06/2016)
Stated capital: LKR1,168,800,100
Resort Hotels - Sri Lanka
Beruwala Holiday Resorts (Pvt) Ltd. (PV
69678) (79.78%)
Owner & operator of "Cinnamon Bey Beruwala”
Incorporated in 2009
Moragolla Beruwala.
Tel:2306600, 034-2297000
Directors: S C Ratnayake- Chairman,
A D Gunewardene, B J S M Senanayake
Stated Capital: LKR2,338,150,000
G4 - 17

278 John Keells Holdings PLC | Annual Report 2016/17
Ceylon Holiday Resorts Ltd*- Bentota
Beach Hotel. (PB 40) (79.24%)
Owner & operator of "Bentota Beach by
Cinnamon"
Incorporated in 1966
Galle Road, Bentota.
Tel:034-2275176 / 034-2275266
Directors: S C Ratnayake - Chairman,
A D Gunewardene, B J S M Senanayake
Stated capital: LKR744,517,303
Nuwara Eliya Holiday Resorts (Pvt) Ltd*
(PV98357) (80.32%)
Owner of real estate
Incorporated in 2014
No.117, Chittampalam A Gardiner
Mawatha,Colombo 2
Tel:2306000
Directors: S C Ratnayake – Chairman,
A D Gunewardene, B J S M Senanayake
Stated Capital: LKR316,062,520
Hikkaduwa Holiday Resorts (Pvt) Limited.
(PV 71747) (79.24%)
Owner & operator of "Hikka Tranz by
Cinnamon"
Incorporated in 2010
P.O Box 1, Galle Road, Hikkaduwa
Tel:091 2298000
Directors: S C Ratnayake - Chairman
A D Gunewardene,
B J S M Senanayake
Stated capital: LKR1,062,635,460
Habarana Lodge Ltd. (PB 38) (78.99%)
Owner & operator of "Cinnamon Lodge
Habarana”
Incorporated in 1978
P.O Box 2, Habarana.
Tel:066-2270011-2/ 066-2270072
Directors: S C Ratnayake - Chairman,
A D Gunewardene, B J S M Senanayake
Stated capital: LKR341,555,262
Habarana Walk Inn Ltd. (PB 33) (79.34%)
Owner & operator of "Habarana Village by
Cinnamon Habarana”
Incorporated in 1973
P.O Box 1, Habarana.
Tel:066-2270046-7/ 066-2270077
Directors: S C Ratnayake - Chairman,
A D Gunewardene, B J S M Senanayake
Stated capital: LKR126,350,000
Group Directory 2016/17
International Tourists and Hoteliers Ltd.
(PB 17) (79.78%)*
Owner of real estate
Incorporated in 1973
No.117,Chittampalam A,Gardiner
Mawatha,Colombo 2
Tel:2306600, 2421101-8
Directors: S C Ratnayake – Chairman,
A D Gunewardene, B J S M Senanayake
Stated capital: LKR1,939,760,925
Kandy Walk Inn Ltd. (PB 395) (79.03%)
Owner & operator of "Cinnamon Citadel Kandy”
Incorporated in 1979
No.124, Srimath Kuda Ratwatte Mawatha,
Kandy.
Tel:081 2234365-6/ 081 2237273-4
Directors: S C Ratnayake - Chairman,
A D Gunewardene, B J S M Senanayake
Stated capital: LKR115,182,009
Rajawella Hotels Company Ltd. (PB 92)
(80.32%)*
Owner of real estate
Incorporated in 1992
No.117, Chittampalam A Gardiner Mawatha,
Colombo 2
Tel: 2306000
Directors: S C Ratnayake – Chairman,
A D Gunewardene, J R Gunaratne
Stated capital: LKR34,861,762
Resort Hotels Ltd. (PB 193) (79.24%)*
Owner of real estate
Incorporated in 1978
No.117,Chittampalam A Gardiner Mawatha,
Colombo 2
Tel:2306780, 2421101-8
Directors: S C Ratnayake – Chairman,
A D Gunewardene
Stated capital: LKR7,439,150
Trinco Holiday Resorts (Pte) Ltd.(PV 69908)
(80.32%)
Owner & operator of "Trinco Blu by Cinnamon"
Incorporated in 2009
Alles Garden, Uppuvelli, Sampathiv Post,
Trincomalee.
Tel: 026 2222307 / 026 2221611
Directors: S C Ratnayake - Chairman
A D Gunewardene, B J S M Senanayake
Stated Capital: LKR357,000,000
Trinco Walk Inn Ltd. (PB 168) (80.32%)*
Owner of real estate
Incorporated in 1984
Alles Garden, Uppuveli, Sampathiv Post,
Trincomalee.
Tel: 026-2222307 / 011-2306600
Directors: S C Ratnayake – Chairman,
A D Gunewardene, B J S M Senanayake
Stated capital: LKR119,850,070
Wirawila Walk Inn Ltd. (PB 89) (80.32%)*
Owner of real estate
Incorporated in 1994
No.117,Chittampalam A Gardiner Mawatha,
Colombo 2.
Tel:2306780, 2421101-8
Directors: S C Ratnayake – Chairman,
A D Gunewardene, B J S M Senanayake
Stated capital: LKR18,674,150
Ahungalle Holiday Resorts (Pvt) Ltd. (PV
85046) (80.32%)*
Owner of real estate
Incorporated in 2012
No.117, Chittampalam A Gardiner
Mawatha,Colombo 2
Tel:2306000
Directors: S C Ratnayake – Chairman,
A D Gunewardene, B J S M Senanayake
Stated capital: LKR132,400,000
Yala Village (Pvt) Ltd. (PV 2868) (75.33%)
Owner & operator of "Cinnamon Wild Yala”
Incorporated in 1999
P.O Box 1,Kirinda, Tissamaharama.
Tel:047-2239449-52
Directors: M A Perera - Chairman,
S C Ratnayake - Deputy Chairman,
A D Gunewardene, J A Davis,
B J S M Senanayake, K N J Balendra
(Appointed w.e.f 02/05/2016)
Stated capital: LKR419,427,600
Resort Hotels - Maldives
Fantasea World Investments (Pte) Ltd. (C
143/97) (80.32%)
Owner & operator of “Cinnamon Hakura Huraa
Maldives”
Incorporated in 1997
2nd Floor, H.Maizan Building,
Sosun Magu, Male, Republic of Maldives.
Tel:00960-6720014 / 00960-6720064 /
00960 6720065
Directors: S C Ratnayake - Chairman,
A D Gunewardene, B J S M Senanayake,
S A S Perera (Resigned w.e.f. 31/10/2016),
J E P Kehelpannala, K N J Balendra
(Appointed w.e.f. 15/07/2016 & Resigned
w.e.f. 28/12/2016)
Stated capital: LKR341,573,190
(USD5,000,000)
G4 - 17

279Group Highlights | Governance | Management Discussion & Analysis | Financial Statements | Supplementary Information
John Keells Maldivian Resorts (Pte) Ltd. (C
208/96) (80.32%)
Hotel holding company in the Maldives
Incorporated in 1996
2nd Floor, H.Maizan Building,
Sosun Magu, Male, Republic of Maldives.
Tel:00960-3329083 / 00960-3304601 /
00960-3313738
Directors: S C Ratnayake - Chairman,
A D Gunewardene, B J S M Senanayake,
S A S Perera (Resigned w.e.f. 31/10/2016)
J E P Kehelpannala, K N J Balendra
(Appointed w.e.f. 15/07/2016)
Stated capital: LKR3,978,671,681
(USD38,904,010)
Tranquility (Pte) Ltd. (C 344/2004) (80.32%)
Owner and operator of Cinnamon Dhonveli
Maldives”
Incorporated in 2004
2nd Floor, H.Maizan Building,
Sosun Magu, Male, Republic of Maldives.
Tel: 00960-6640055 / 00960-6640012
Directors: S C Ratnayake – Chairman,
A D Gunewardene, B J S M Senanayake,
S A S Perera (Resigned w.e.f. 31/10/2016),
J E P Kehelpannala, K N J Balendra
(Appointed w.e.f. 15/07/2016 & Resigned
w.e.f. 28/12/2016)
Stated capital: LKR552,519,608
(USD5,000,000)
Travel Club (Pte) Ltd. (C 121/92) (80.32%)
Operator of “Ellaidhoo Maldives by Cinnamon”
Incorporated in 1992
2nd Floor, H.Maizan Building,
Sosun Magu, Male, Republic of Maldives
Tel:00960-6660839 / 00960-6660663 /
00960-6660664
Directors: S C Ratnayake - Chairman
A D Gunewardene, B J S M Senanayake,
S A S Perera (Resigned w.e.f. 31/10/2016)
J E P Kehelpannala, K N J Balendra
(Appointed w.e.f. 15/07/2016 & Resigned
w.e.f. 28/12/2016)
Stated capital: LKR143,172,000 (USD2,460,000)
Destination Management
Cinnamon Holidays (Pvt) Ltd. (PV 107427)
(80.32%)
Provides inbound and outbound services
Incorporated in 2015
No.117,Chittampalam A Gardiner Mawatha,
Colombo 2
Tel:2306000
Directors: S C Ratnayake - Chairman,
A D Gunewardene
Stated capital: LKR200,000
Serene Holidays (Pvt) Ltd.
(U63040MH2006PTC164985) (98.74%)
Tour operators
Incorporated in 2006
110, Bldg 2, Rolex Shopping Centre Premises
CHS Ltd, STN Road, NR Prashant Hotel,
Goregoan (W), Mumbai, Mumbai City,
Maharashtra, 400062.
Tel:091-22 42105210 99
Directors: A D Gunewardene - Chairman,
V Leelananda, C.Somasunderam,
K N J Balendra (Appointed w.e.f. 01/07/2016)
Stated capital: LKR6,492,000 (INR2,000,000)
Walkers Tours Ltd. (PB 249) (98.51%)
Inbound tour operators
Incorporated in 1969
No.117,Chittampalam A Gardiner
Mawatha,Colombo 2
Tel:2306306
Directors: S C Ratnayake – Chairman,
A D Gunewardene,V Leelananda,
K N J Balendra (Appointed w.e.f 02/05/2016)
Stated capital: LKR51,374,200
Whittall Boustead (Travel) Ltd. (PB 112) (100%)
Inbound tour operators
Incorporated in 1977
No.117, Chittampalam A Gardiner
Mawatha,Colombo 2
Tel:2306384
Directors: S C Ratnayake – Chairman
A D Gunewardene, V Leelananda
Stated capital: LKR250,410,000
PROPERTY
Property Development
Asian Hotels and Properties PLC - Crescat.
Boulevard, The Monarch, The Emperor.
(PQ 2) (78.56%)
Developer and manager of integrated properties
Incorporated in 1993
No.77, Galle Road, Colombo 3.
Tel:5540404
Directors: S C Ratnayake - Chairman,
A D Gunewardene - Managing Director,
J R F Peiris, R J Karunarajah, S Rajendra
S K G Senanayake, S A Jayasekara,
C J L Pinto, K N J Balendra (Appointed w.e.f
1/4/2016)
Stated capital: LKR3,345,118,012
British Overseas (Pvt) Ltd. (PV 80203) (61%)
Developer of "7th Sense" project
Incorporated in 2011
No.117, Chittampalam A Gardiner Mawatha,
Colombo 2
Tel:2306000
Directors : A D Gunewardene,
K N J Balendra (Resigned w.e.f 28/12/2016),
D C Alagaratnam, S Rajendra, S P G N
Rajapakse, J G A Cooray (Appointed w.e.f.
28/12/2016)
Stated capital: LKR1,000
Rajawella Holdings Limited (49.85%)
(PB 27)
Operates an 18 hole, Donald Streel designed
Golf course in Digana
Incorporated in 1991
P.O. Box 7 Rajawella, Kandy.
Tel: 2306000
Directors: S C Rathnayake - Chairman
A D Gunewardene, J R F Peiris (Resigned
w.e.f 21/11/2016), S Rajendra,C B Thornton
(Alt. C J Holloway)(Appointed w.e.f.
24/10/2016), G R Bostock Kirk (Alt. E C
Oxlade)(Appointed w.e.f. 24/10/2016),
S E Captain (Alt. R S Captain)(Appointed w.e.f
09/09/2015), K N J Balendra (Appointed w.e.f
21/11/2016)
Stated Capital: 784,690,140
John Keells Residential Properties (Pvt)
Limited. (PV 75050) (100%)
Developer of "On320" project
Incorporated in 2010
No.117, Chittampalam A Gardiner
Mawatha,Colombo 2
Tel:2300065
Directors: S C Ratnayake – Chairman,
A D Gunewardene, S Rajendra, J R F Peiris
Stated capital: LKR925,200,000
John Keells Properties Ja-Ela (Pvt) Ltd.
(PV 76068) (100%)
Developer & manager of mall operations
Incorporated in 2010
No.117, Chittampalam A Gardiner
Mawatha,Colombo 2
Tel:2306000
Directors: S C Ratnayake - Chairman
A D Gunawardene, S Rajendra
Stated capital: LKR954,360,000
Real estate
John Keells Properties (Pvt) Ltd. (PV 1034)
(100%)*
Renting of office space
Incorporated in 2006
No.117,Chittampalam A Gardiner Mawatha,
Colombo 2.
Tel:2306000 /2397263
Directors: S C Ratnayake – Chairman,
A D Gunewardene, S Rajendra
Stated capital: LKR240,000,030
Keells Realtors Ltd. (PB 90) (95.81%)*
Owner of real estate
Incorporated in 1977
No.117, Chittampalam A Gardiner Mawatha,
Colombo 2.
Tel:2306000 /2397263
Directors: S C Ratnayake – Chairman,
A D Gunewardene, S Rajendra
Stated capital: LKR75,000,000
G4 - 17

280 John Keells Holdings PLC | Annual Report 2016/17
Group Directory 2016/17
Whittall Boustead (Pvt) Ltd - Real Estate
Division. (PV 31) (100%)*
Renting of office space
Incorporated in1958
No. 148, Vauxhall Street, Colombo 2.
Tel:2397263 /2327805
Directors: S C Ratnayake – Chairman,
A D Gunewardene, S Rajendra
Stated capital: LKR99,188,800
Waterfront Properties (Pvt) Ltd. (PV 82153)
(94.37%)
Developer of hotels, apartments & shopping
malls
Incorporated in 2011
No.117, Chittampalam A Gardiner Mawatha,
Colombo 2
Tel:2306000
Directors : S C Ratnayake - Chairman,
A D Gunewardene, S Rajendra, J R F Peiris,
D C Alagaratnam
Stated capital: LKR22,910,824,230
(USD169,382,764)
CONSUMER FOODS AND RETAIL
Consumer Foods
Ceylon Cold Stores PLC. (PQ 4) (81.36%)
Manufacture & marketing of beverages and
frozen confectionery and the holding company
of JayKay Marketing Services (Pvt) Ltd.
Incorporated in 1926
No.117, Chittampalam A Gardiner Mawatha,
Colombo 2
Tel:2318798
Directors: S C Ratnayake - Chairman,
A D Gunewardene, J R F Peiris,
J R Gunaratne, P S Jayawardena (Resigned
w.e.f 16/06/2016), A R Rasiah, M Hamza,
R S W Wijeratnam (Appointed w.e.f
17/06/2016), S T Ratwatte (Appointed w.e.f
17/06/2016)
Stated capital: LKR918,200,000
Colombo Ice Company (Pvt) Ltd. (PV 113758)
(81.36%)*
Manufacturing and marketing of frozen
confectionery
Incorporated in 2016
No.117, Sir Chittampalam A Gardiner
Mawatha, Colombo 2.
Tel:2306000
Directors: S C Ratnayake - Chairman,
A D Gunewardene, J R F Peiris,
J R Gunaratne
Stated capital: LKR270,000,000
Keells Food Products PLC. (PQ 3) (88.53%)
Manufacturer and distributor of processed
meat, breaded meat and convenience food
products.
Incorporated in 1982
P.O Box 10, No.16, Minuwangoda Road,
Ekala, Ja-Ela.
Tel:2236317 / 2236364
Directors: S C Ratnayake - Chairman,
A D Gunewardene, J R F Peiris,
J R Gunaratne, R Pieris (Resigned w.e.f
09/06/2016), S H Amarasekera (Resigned
w.e.f 09/06/2016), A D E I Perera (Resigned
w.e.f 09/06/2016), M P Jayawardena
(Resigned w.e.f 09/06/2016),S. De Silva
(Appointed w.e.f 10/06/2016),
A E H Sanderatne (Appointed w.e.f
10/06/2016), I. Samarajiva (Appointed w.e.f
10/06/2016), P D Samarasinghe (Appointed
w.e.f 10/06/2016)
Stated capital: LKR1,294,815,000
John Keells Foods India (Pvt) Ltd.
(U15122MH2008FTC180902) (88.53%)*
Marketing of branded meat and convenience
food products
Incorporated in 2008
Luthra and Luthra Chartered Accountants
A 16 / 9, Vasant Vihar,
New Delhi -110057, India.
Tel:0091-1142591823, 0091-1126148048,
26151853, 26147365
Fax: +91-11-2614 5222
Directors: S C Ratnayake - Chairman,
J R Gunaratne, R S Fernando (Resigned w.e.f.
09/09/2016)
Stated capital:LKR220,294,544
(INR 90,000,000)
Retail
JayKay Marketing Services (Pvt) Ltd.
(PV 33) (81.36%)
Owns and operates the "Keells Super" chain of
supermarkets and "Nexus Mobile" loyalty card
programme.
Incorporated in 1980
No.117,Chittampalam A Gardiner
Mawatha,Colombo 2
Tel:2316800
Directors: S C Ratnayake - Chairman,
A D Gunewardene, K N J Balendra
J G A Cooray, K C Subasinghe
Stated capital: LKR1,198,000,000
FINANCIAL SERVICES GROUP
John Keells Stock Brokers (Pvt) Ltd. (PV 89)
(90.04%)
Share broking services
Incorporated in 1979
No. 186,Vauxhall Street, Colombo 2
Tel:+94(0) 11 230 6250, +94(0) 11 234 2066-7
Directors: A D Gunewardene - Chairman,
S C Ratnayake, K N J Balendra
Stated capital: LKR57,750,000
Nations Trust Bank PLC. (PQ 118) (29.9%)**
Commercial banking and leasing operations
Incorporated in 1999
No. 242, Union Place, Colombo 2.
Tel:4313131
Directors: K N J Balendra - Chairman,
M Jafferjee, Dr.K De Soysa
D P De Silva, N S Panditharatne,
K O V S M S Wijesinghe,
R N K Fernando, J G A Cooray,
C L K P Jayasuriya, H Raghavan, C D'Souza,
R D Rajapaksa (Appointed w.e.f 29/04/2016),
N I R De Mel (Appointed w.e.f. 06/06/2016)
Stated capital: LKR5,101,368,736
Union Assurance PLC. (PQ 12) (93.92%)
Life insurance underwriters
Incorporated in 1987
No.20, St. Michaels' Road, Colombo 3.
Tel:2990990
Directors: A D Gunewardene - Chairman,
D C Alagaratnam, S Rajendra, A S De Zoysa,
G F C De Saram, H A J De Silva Wijeyeratne
A D Pereira
Stated capital: LKR1,000,000,000
Fairfirst Insurance Limited (PV 99666)
(20.66%)**
General insurance underwriters
Incorporated in 2014
No.33, St. Michaels' Road, Colombo 3.
Tel:2428428
Directors: R Athappan- Chairman
A D Pereira, C Ratnaswami, A S Wijesinha
C D Wijegunawardene, S Malhotra, S Jha
(Appointed w.e.f. 9/12/2016)
Stated Capital: LKR3,131,949,000
G4 - 17

281Group Highlights | Governance | Management Discussion & Analysis | Financial Statements | Supplementary Information
INFORMATION TECHNOLOGY
IT Services
John Keells Computer Services (Pvt) Ltd.
(PV 652) (100%)
Software services
Incorporated in 1998
No. 148, Vauxhall Street, Colombo 2.
Tel:2300770-77
Directors: A D Gunewardene - Chairman,
S C Ratnayake, R S Fernando (Resigned w.e.f
09/09/2016), J R F Peiris (Appointed w.e.f
09/09/2016)
Stated capital: LKR96,500,000
J K O A Mobiles (Pvt) Ltd. (PV 136) (100%)
Marketer of software packages
Incorporated in 1992
No. 148, Vauxhall Street, Colombo 2.
Tel:2300770-77
Directors: A D Gunewardene - Chairman,
R S Fernando (Resigned w.e.f 09/09/2016),
D C Alagaratnam, J R F Peiris (Appointed
w.e.f 09/09/2016)
Stated capital: LKR8,000,000
Office Automation
John Keells Office Automation (Pvt) Ltd. (PV
127) (100%)
Distributor/Reseller and services provider in
office automation(OA), retail automation (RA)
and mobile devices
Incorporated in 1992
Corporate Office: No. 90 Union Place,
Colombo 2.
Technical Services: No. 148 Vauxhall Street,
Colombo 2.
Tel: 2313000, 2431576, 2445760
Directors:A D Gunewardene - Chairman,
R S Fernando (Resigned w.e.f 09/09/2016),
J R F Peiris (Appointed w.e.f 09/09/2016)
D C Alagaratnam
Stated capital: LKR5,000,000
IT Enabled Services
InfoMate (Pvt) Ltd. (PV 921) (100%)
IT enabled services
Incorporated in 2005
No.4, Leyden Bastian Road, Colombo 1.
Tel: (94) 112149700
Directors: S C Ratnayake, M J S Rajakariar,
R S Fernando (Resigned w.e.f 09/09/2016),
J R F Peiris (Appointed w.e.f 09/09/2016)
Stated capital: LKR20,000,000
John Keells BPO Holdings (Pvt) Ltd.
(C 60882) (100%)*
Holding company of BPO companies
Incorporated in 2006
IFS Court, 28, Cybercity, Ebene, Mauritius
Tel:(230) 467 3000
Directors: S C Ratnayake, A D Gunewardene,
R S Fernando (Resigned w.e.f. 09.09.2016),
K N J Balendra (Resigned w.e.f. 28.12.2016),
P Bissoonauth, Z H Niamut
Stated capital: LKR1,988,300,000 (USD
19,000,000)
John Keells BPO International (Pvt) Ltd.
(C 070137) (100%)*
Investment holding company
Incorporated in 2007
IFS Court, 28, Cybercity, Ebene, Mauritius
Tel:(230) 467 3000
Directors: S C Ratnayake - Chairman,
A D Gunewardene, R S Fernando (Resigned
w.e.f. 09.09.2016), K N J Balendra (Resigned
w.e.f. 28.12.2016), P Bissoonauth, Z H Niamut
Stated capital: LKR1,616,700,008
(USD 15,000,000)
John Keells BPO Solutions Lanka (Pvt) Ltd
(PV 3458) (100%)*
BPO operations in Sri Lanka
Incorporated in 2006
No.4, Leyden Bastian Road, Colombo 1.
Tel: (94) 2300770-77
Directors: S C Ratnayake, A D Gunewardene,
R S Fernando (Resigned w.e.f 09/09/2016),
Stated capital: LKR335,797,260
John Keells BPO Solutions US Inc. (PO
8000022353) (100%)*
Provides sales & marketing support for BPO
operations in North America
Incorporated in 2008
9225, Ulmerton Road, Suite H, Largo, Florida
33771, USA.
Tel: +1 727 518 0000
Director: M P Gunaratna , R S Fernando
(Resigned w.e.f. 09.09.2016), J R F Peiris
(Appointed w.e.f. 08.10.2016)
Stated capital: LKR5,277,799
(USD40,000)
John Keells BPO solutions Canada Inc.
(761124-2) (100%)*
BPO operation in Canada
Incorporated in 2010
1900, 736-6th Avenue S.W., Calgary, Alberta
T2P 3T7, Canada.
Directors: A D Gunewardene, K N J Balendra
(Resigned w.e.f. 28.12.2016), R S Fernando
(Resigned w.e.f. 09.09.2016)
R M David, J R Gunaratne, D C Alagaratnam,
T E Scott, A S Perera
Stated capital: LKR88,484,008
(USD 1,177,800)
John Keells BPO Solutions India Private
Limited. (U72300DL2006PTC153130) (100%)
BPO operations in India (Formally known as
Quatrro Business Support Services (Pvt) Ltd)
Incorporated in 2006
Basement-24, C Block, Community Centre,
Janakpuri, New Delhi.
Tel:+91 124 4561000
Directors: J R F Peiris, R S Fernando
(Resigned w.e.f 09.09.2016), K N J Balendra,
C. Somasundaram
Stated capital: LKR138,050,960
(INR350,248,060)
OTHERS
Plantation Services
John Keells PLC. (PQ 11) (86.90 %)
Produce broking and real estate ownership
Incorporated in 1960
No 186, Vauxhall street, Colombo 2.
Tel:2306000
Directors: S C Ratnayake - Chairman,
A D Gunewardene, J R F Peiris,
R S Fernando (Resigned w.e.f 09/09/2016), T
de Zoysa (Resigned w.e.f 28/06/2016),
Y A Hansen (Resigned w.e.f 28/06/2016),
S T Ratwatte (Resigned w.e.f 28/06/2016),
V A A Perera, A K Gunawardhana (Appointed
w.e.f 29/06/2016), C N Wijewardene
(Appointed w.e.f 29/06/2016),
B A I Rajakarier (Appointed w.e.f 29/06/2016)
Stated capital: LKR152,000,000
John Keells (Teas) Ltd. (PV 522) (100%)
Manager of eight bought leaf tea factories
Incorporated in 1979
No.117,Chittampalam A Gardiner Mawatha,
Colombo 2.
Tel:2306518
Directors: S C Ratnayake- Chairman,
A D Gunewardene, R S Fernando (Resigned
w.e.f 09/09/2016), J R F Peiris (Appointed
w.e.f 09/09/2016)
Stated capital: LKR120,000
John Keells Warehousing (Pvt) Ltd. (PV
638) (86.90%)
Warehousing of tea and rubber
Incorporated in 2001
No.93,1st Avenue, Muturajawela, Hendala,
Wattala, Muturajawala
Tel:4819560
Directors: S C Ratnayake- Chairman
A D Gunewardene, R S Fernando (Resigned
w.e.f 09/09/2016), J R F Peiris (Appointed
w.e.f 09/09/2016)
Stated capital: LKR120,000,000
G4 - 17

282 John Keells Holdings PLC | Annual Report 2016/17
Group Directory 2016/17
Tea Smallholder Factories PLC. (PQ 32)
(37.62%)
Owner and operator of bought leaf factories
Incorporated in 1991
No.4, Leyden Bastian Road, Colombo 1.
Tel:2 335 880 / 2149994
Directors: S C Ratnayake – Chairman,
(Alt.Mr J R Gunaratne) A D Gunewardene,
J R F Peiris, E H Wijenaike, R Seevaratnam,
R E Rambukwella, A S Jayatilleke,
J S Ratwatte, R S Fernando (Resigned w.e.f
09/09/2016), M de Silva (Appointed w.e.f.
6/2/2017
Stated capital: LKR150,000,000
Centre & Others
Facets (Pvt) Ltd. (PV1048) (100%)*
Owner of real estate
Incorporated in 1974
No.117, Chittampalam A Gardiner Mawatha,
Colombo 2
Tel:2306000
Directors: S C Ratnayake - Chairman
D C Alagaratnam
Stated capital: LKR150,000
John Keells Holdings PLC. (PQ 14)
Group holding company & function based
services
Incorporated in 1979
No.117,Sir Chittampalam A Gardiner
Mawatha, Colombo 2
Tel:2306000 /2421101-9
Directors: S C Ratnayake - Chairman
A D Gunewardene - Deputy Chairman,
J R F Peiris, E F G Amerasinghe (Resigned
w.e.f 24/06/2016), T Das (Resigned w.e.f
24/06/2016), Dr I Coomaraswamy (Resigned
w.e.f 03/07/2016), M A Omar,
D A Cabraal, A N Fonseka, P Perera,
K N J Balendra (Appointed w.e.f 05/11/2016),
J G A Cooray (Appointed w.e.f 05/11/2016),
S S H Wijesuriya (Appointed w.e.f
04/10/2016)
Stated capital: LKR62,790,080,573
John Keells International (Pvt) Ltd. (PV 46)
(100%)*
Regional holding company providing
administrative & function based services
Incorporated in 2006
No.117, Chittampalam A Gardiner Mawatha,
Colombo 2
Tel:2306000 /2421101-9
Directors: S C Ratnayake - Chairman
A D Gunewardene
Stated capital: LKR1,991,600,000
J K Packaging (Pvt) Ltd. (PV 1265) (100%)*
Printing and packaging services provider
for the export market
Incorporated in 1979
No 148, Vauxhall street, Colombo 2
Tel:2475308
Directors: S C Ratnayake- Chairman
R M David, R S Fernando (Resigned w.e.f
09/09/2016), J R F Peiris (Appointed w.e.f
09/09/2016)
Stated capital: LKR14,500,000
John Keells Singapore (Pte) Ltd.
(199200499C) (80%)*
International trading services
Incorporated in 1992
No.16, Collyer Quay, Level 21,
Office Suite 21-38
Singapore-049318
Tel:65 63296409
Directors: S C Ratnayake - Chairman,
Alt. A D Gunewardene, R M David,
R Ponnampalam, D C Alagaratnam
Stated capital: LKR9,638,000
G4 - 17
Keells Consultants (Pvt) Ltd. (PB 3) (100%)
Company secretarial services to the group
Incorporated in 1974
No.117,Chittampalam A Gardiner Mawatha,
Colombo 2
Tel:2421101-9
Directors: S C Ratnayake - Chairman,
A D Gunewardene, D C Alagaratnam
N W Tambiah
Stated capital: LKR160,000
Mackinnons Keells Ltd. (PB 8) (100%)*
Rental of office space
Incorporated in 1952
No. 4, Layden Bastian Road, Colombo 1
Tel:2475102-3
Directors: S C Ratnayake- Chairman,
A D Gunewardene, S Rajendra
Stated capital: LKR10,800,000
Mortlake Ltd. (PV 756) (100%)*
Investment company
Incorporated in 1962
No. 148, Vauxhall Street, Colombo 2.
Tel:2475308
Directors: S C Ratnayake- Chairman
A D Gunewardene, R M David
D C Alagaratnam
Stated capital: LKR3,000

283Group Highlights | Governance | Management Discussion & Analysis | Financial Statements | Supplementary Information
GRI G4 Content Index
This Report is prepared ‘in accordance’ -core option of the Global Reporting Initiative (GRI) G4 Sustainability Reporting Guidelines.
GENERAL STANDARD DISCLOSURES
General Standard
Disclosures
Page Number (or Link)
Information related to Standard Disclosures required by the ‘in
accordance’ options may already be included in other reports prepared
by the organisation. In these circumstances, the organisation may elect
to add a specific reference to where the relevant information can be
found.
External Assurance
Indicate if the Standard
Disclosure has been
externally assured.
If yes, include the page
reference for the External
Assurance Statement in
the report.
UNGC
Principles
IFC
Sustainability
Framework
Performance
Standard
Code of Best
Practice on
Corporate
Governance
2013
STRATEGY AND ANALYSIS
G4-1 Page 12-18 Yes, 273 - 275 1 7
ORGANISATIONAL PROFILE
G4-3 Page 3 Yes, 273 - 275 22
G4-4 Page 8 Yes, 273 - 275 22
G4-5 Page 3 Yes, 273 - 275 22
G4-6 Page 3 Yes, 273 - 275 22
G4-7 Page 3 Yes, 273 - 275 22
G4-8 Pages 3, 8 Yes, 273 - 275 22
G4-9 Pages 3, 10-11, 70 Yes, 273 - 275 22
G4-10 Page 74 Yes, 273 - 275 11, 12 3
G4-11 Page 76 Yes, 273 - 275 11, 12 3
G4-12 Pages 77, 122, 132, 142, 151, 158, 164, 171
Pages 8-9 of www.keells.com/sustainability - and - csr - Disclosure of
Management Approach
Yes, 273 - 275 21
G4-13 Page 9 Yes, 273 - 275 22
G4-14 Page 102 Yes, 273 - 275 13 2
G4-15 Page 93 Yes, 273 - 275 4 7
G4-16 Pages 272 Yes, 273 - 275
IDENTIFIED MATERIAL ASPECTS AND BOUNDARIES
G4-17 Pages 4, 276-282 Yes, 273 - 275
G4-18 Pages 4-5, 93 Yes, 273 - 275 22, 23 6, 7
G4-19 Page 98 Yes, 273 - 275 3 6
G4-20 Page 96-97 Yes, 273 - 275 22, 23 6
G4-21 Page 96-97 Yes, 273 - 275 22, 23 6
G4-22 Page 93 Yes, 273 - 275 22, 23
G4-23 Pages 4, 94, 98 Yes, 273 - 275 22, 23
STAKEHOLDER ENGAGEMENT
G4-24 Pages 94-95 Yes, 273 - 275 3 6
G4-25 Page 94 Yes, 273 - 275 3 6
G4-26 Pages 94-95 Yes, 273 - 275 3 6
G4-27 Page 96 Yes, 273 - 275 6
REPORT PROFILE
G4-28 Page 4 Yes, 273 - 275 22, 23
G4-29 Page 93 Yes, 273 - 275 22, 23
G4-30 Page 93 Yes, 273 - 275 22, 23 7
G4-31 Page 98 Yes, 273 - 275 22, 23
G4-32 Pages 4, 16, 93, 273-275 Yes, 273 - 275 22, 23 7
G4-33 Pages 93, 16, 273-275 Yes, 273 - 275 24 7
GOVERNANCE
G4-34 Page 27 Yes, 273 - 275 2 7
ETHICS AND INTEGRITY
G4-56 Page 42 Yes, 273 - 275 2

284 John Keells Holdings PLC | Annual Report 2016/17
SPECIFIC STANDARD DISCLOSURES
DMA and
Indicators
Page Number (or Link)
Information related to
Standard Disclosures
required by the ‘in
accordance’ options
may already be
included in other
reports prepared by
the organisation. In
these circumstances,
the organisation
may elect to add a
specific reference to
where the relevant
information can be
found.
Identified
Omission(s)
In exceptional
cases, if it is
not possible
to disclose
certain
required
information,
identify the
information
that has been
omitted.
Reason(s) for
Omission(s)
In exceptional
cases, if it is
not possible
to disclose
certain
required
information,
provide the
reason for
omission.
Explanation for
Omission(s)
In exceptional
cases, if it is
not possible
to disclose
certain
required
information,
explain the
reasons
why the
information
has been
omitted.
External Assurance
Indicate if the Standard
Disclosure has been
externally assured.
If yes, include the page
reference for the External
Assurance Statement in
the report.
CATEGORY: ECONOMIC
MATERIAL ASPECT: ECONOMIC PERFORMANCE
G4-DMA 99, www.keells.com/
sustainability - and
- csr - Disclosure
of Management
Approach Pages 2, 6
Yes, 273 - 275 1
G4-EC1 Pages 262-263 Yes, 273 - 275 1
G4-EC3 Page 76 Yes, 273 - 275 1
MATERIAL ASPECT: INDIRECT ECONOMIC IMPACTS
G4-DMA 99, www.keells.com/
sustainability - and
- csr - Disclosure
of Management
Approach Pages 9-10
Yes, 273 - 275 4
G4-EC7 Page 77 Yes, 273 - 275 4
MATERIAL ASPECT: PROCUREMENT PRACTICES
G4-DMA 100, www.keells.
com/sustainability -
and - csr - Disclosure
of Management
Approach Pages 8-9
Yes, 273 - 275 1
G4-EC9 Page 77 Yes, 273 - 275 1
CATEGORY: ENVIRONMENTAL
MATERIAL ASPECT: ENERGY
G4-DMA 99, www.keells.com/
sustainability - and
- csr - Disclosure
of Management
Approach Page 3
Yes, 273 - 275 13, 14 3 2
G4-EN3 Page 70-71 Yes, 273 - 275 15, 16 3 2
G4-EN6 Page 71 Yes, 273 - 275 15, 16 3 2
GRI G4 Content Index

285Group Highlights | Governance | Management Discussion & Analysis | Financial Statements | Supplementary Information
MATERIAL ASPECT: WATER
G4-DMA 99, www.keells.com/
sustainability - and
- csr - Disclosure
of Management
Approach Page 3-4
Yes, 273 - 275 13, 14 4 2
G4-EN8 Page 71-72 Yes, 273 - 275 15, 16 4 2
MATERIAL ASPECT: BIODIVERSITY
G4-DMA 99, www.keells.com/
sustainability - and
- csr - Disclosure
of Management
Approach Page 4
Yes, 273 - 275 13, 14 6 2
G4-EN11 Page 130 Yes, 273 - 275 15, 16 6 2
CATEGORY: ENVIRONMENTAL
MATERIAL ASPECT: EMISSIONS
G4-DMA 99, www.keells.com/
sustainability - and
- csr - Disclosure
of Management
Approach Page 3
Yes, 273 - 275 13, 14 3 2
G4-EN15 Page 70-71 Yes, 273 - 275 15, 16 3 2
G4-EN16 Page 70-71 Yes, 273 - 275 15, 16 3 2
MATERIAL ASPECT: EFFLUENTS AND WASTE
G4-DMA 99, www.keells.com/
sustainability - and
- csr - Disclosure
of Management
Approach Pages 4
Yes, 273 - 275 13, 14 3 2
G4-EN22 Page 72 Yes, 273 - 275 15, 16 3 2
G4-EN23 Page 72-73 Yes, 273 - 275 15, 16 3 2
G4-EN24 Page 120 Yes, 273 - 275 15, 16 3 2
MATERIAL ASPECT: COMPLIANCE
G4-DMA 99, www.keells.com/
sustainability - and
- csr - Disclosure
of Management
Approach Page 4
Yes, 273 - 275 13, 14 2
G4-EN29 Page 11, 77 Yes, 273 - 275 15, 16 2
MATERIAL ASPECT: SUPPLIER ENVIRONMENTAL ASSESSMENT
G4-DMA 100, www.keells.
com/sustainability -
and - csr - Disclosure
of Management
Approach Page 4
Yes, 273 - 275 15
G4-EN32 Page 77 Yes, 273 - 275 15
CATEGORY: SOCIAL
SUB-CATEGORY: LABOUR PRACTICES AND DECENT WORK
MATERIAL ASPECT: EMPLOYMENT
G4-DMA 99, www.keells.com/
sustainability - and
- csr - Disclosure
of Management
Approach Pages 4-7
Yes, 273 - 275 9, 10 3
G4-LA1 Pages 11, 74-75 Yes, 273 - 275 11, 12 3
MATERIAL ASPECT: OCCUPATIONAL HEALTH AND SAFETY
G4-DMA 99, www.keells.com/
sustainability - and
- csr - Disclosure
of Management
Approach Page 6
Yes, 273 - 275 9, 10 3, 7
G4-LA6 Page 11, 76 Yes, 273 - 275 11, 12 3, 7

286 John Keells Holdings PLC | Annual Report 2016/17
MATERIAL ASPECT: TRAINING AND EDUCATION
G4-DMA 99, www.keells.com/
sustainability - and
- csr - Disclosure
of Management
Approach Pages 5-7
Yes, 273 - 275 9, 10 3
G4-LA9 Page 11, 76 Yes, 273 - 275 11, 12 3
G4-LA11 Page 11, 75 Yes, 273 - 275 11, 12 3
MATERIAL ASPECT: DIVERSITY AND EQUAL OPPORTUNITY
G4-DMA 99, www.keells.com/
sustainability - and
- csr - Disclosure
of Management
Approach Pages 5
Yes, 273 - 275 9, 10 2 3
G4-LA12 Page 74 Yes, 273 - 275 11, 12 2 3
MATERIAL ASPECT: SUPPLIER ASSESSMENT FOR LABOUR PRACTICES
G4-DMA 100, www.keells.
com/sustainability -
and - csr - Disclosure
of Management
Approach Pages 6
Yes, 273 - 275 11
G4-LA14 Page 11, 77 Yes, 273 - 275 11
SUB-CATEGORY: HUMAN RIGHTS
MATERIAL ASPECT: FREEDOM OF ASSOCIATION AND COLLECTIVE BARGAINING
G4-DMA 99, www.keells.com/
sustainability - and
- csr - Disclosure
of Management
Approach Page 6
Yes, 273 - 275 9, 10 2 3
G4-HR4 Page 76-77 Yes, 273 - 275 11, 12 2 3
MATERIAL ASPECT: CHILD LABOUR
G4-DMA 99, www.keells.com/
sustainability - and
- csr - Disclosure
of Management
Approach Pages 7
Yes, 273 - 275 5, 6 2 3
G4-HR5 Page 11 Yes, 273 - 275 7, 8 2 3
MATERIAL ASPECT: FORCED OR COMPULSORY LABOUR
G4-DMA 99, www.keells.com/
sustainability - and
- csr - Disclosure
of Management
Approach Pages 7-8
Yes, 273 - 275 5, 6 2 3
G4-HR6 Page 11, 77 Yes, 273 - 275 7, 8 2 3
MATERIAL ASPECT: SUPPLIER HUMAN RIGHTS ASSESSMENT
G4-DMA 100, www.keells.
com/sustainability -
and - csr - Disclosure
of Management
Approach Pages 9
Yes, 273 - 275 7
G4-HR10 Page 11, 77 Yes, 273 - 275 7
GRI G4 Content Index

287Group Highlights | Governance | Management Discussion & Analysis | Financial Statements | Supplementary Information
SUB-CATEGORY: SOCIETY
MATERIAL ASPECT: LOCAL COMMUNITIES
G4-DMA 100, www.keells.
com/sustainability -
and - csr - Disclosure
of Management
Approach Pages 9-10
Yes, 273 - 275 4
G4-SO1 Pages 73, 76, 78 - 81 Yes, 273 - 275 4
MATERIAL ASPECT: ANTI-CORRUPTION
G4-DMA 99, www.keells.com/
sustainability - and
- csr - Disclosure
of Management
Approach Page 7-8
Yes, 273 - 275 17, 18
G4-SO3 11, 101 Yes, 273 - 275 19, 20
SUB-CATEGORY: SOCIETY
MATERIAL ASPECT: COMPLIANCE
G4-DMA 99, www.keells.com/
sustainability - and
- csr - Disclosure
of Management
Approach Page 8
Yes, 273 - 275 17, 18
G4-SO8 Page 77 Yes, 273 - 275 19, 20
SUB-CATEGORY: PRODUCT RESPONSIBILITY
TOPIC: CUSTOMER HEALTH AND SAFETY
G4-DMA 99, www.keells.com/
sustainability - and
- csr - Disclosure
of Management
Approach Page 11
Yes, 273 - 275 5
MATERIAL ASPECT: PRODUCT AND SERVICE LABELLING
G4-DMA 99, www.keells.com/
sustainability - and
- csr - Disclosure
of Management
Approach Page 11
Yes, 273 - 275 5
G4-PR3 Page 11, 152 Yes, 273 - 275 5
MATERIAL ASPECT: MARKETING COMMUNICATIONS
G4-DMA 99, www.keells.com/
sustainability - and
- csr - Disclosure
of Management
Approach Page 11
Yes, 273 - 275 5
G4-PR7 Page 77 Yes, 273 - 275 5
MATERIAL ASPECT: COMPLIANCE
G4-DMA 99, www.keells.com/
sustainability - and
- csr - Disclosure
of Management
Approach Page 11
Yes, 273 - 275 5
G4-PR9 Page 11, 77 Yes, 273 - 275 5

288 John Keells Holdings PLC | Annual Report 2016/17
Glossary of Financial Terms
ACCRUAL BASIS
Recording revenues and expenses in the period
in which they are earned or incurred regardless
of whether cash is received or disbursed in that
period.
ADJUSTED ROCE AND ROE
Adjusted for 2013 Rights Issue, 2015 Warrant
Issue, “Cinnamon Life” debt, revaluation of
property, plant and equipment and fair value
changes on investment property for 2014/15,
2015/16 and 2016/17.
ASSET TURNOVER
Revenue including associate company revenue
divided by average total assets.
BETA
Covariance between daily JKH share return
and market return divided by variance of daily
market return, over a 5 year period.
CAPITAL EMPLOYED
Shareholders’ funds plus non-controlling
interests and debt.
CAPITAL STRUCTURE LEVERAGE (CSL)
Average total assets divided by average
shareholders’ equity.
CASH EARNINGS PER SHARE
Profit attributable to equity holders of the parent
adjusted for non cash items minus share of
associate company profits plus dividends from
associate companies divided by the weighted
average number of ordinary shares in issue
during the period.
COMMON EARNINGS LEVERAGE (CEL)
Profit attributable to equity holders of the parent
divided by profit after tax.
CONTINGENT LIABILITIES
A condition or situation existing as at the date
of the Report due to past events, where the
financial effect is not recognised because:
1. The obligation is crystallised by the
occurrence or non occurrence of one or
more future events or,
2. A probable outflow of economic resources is
not expected or,
3. It is unable to be measured with sufficient
reliability
CURRENT RATIO
Current assets divided by current liabilities.
DEBT/EQUITY RATIO
Debt as a percentage of shareholders’ funds and
non-controlling interests.
DILUTED EARNINGS PER SHARE (EPS)
Profit attributable to equity holders of the
parent divided by the weighted average number
of ordinary shares in issue during the period
adjusted for options granted but not exercised
and outstanding unexpired warrants.
DIVIDEND PAYABLE
Final dividend per share multiplied by the latest
available total number of shares as at the date
of the report.
DIVIDEND PAYOUT RATIO
Dividend paid as a percentage of Company
profits adjusted for non-cash gains items.
DIVIDEND YIELD
Dividends adjusted for changes in number of
shares in issue as a percentage of the share
price (diluted) at the end of the period.
EARNINGS PER SHARE (BASIC)
Profit attributable to equity holders of the parent
divided by the weighted average number of
ordinary shares in issue during the period.
EBIT
Earnings before interest and tax (includes other
operating income).
EBIT MARGIN
EBIT divided by turnover inclusive of share of
associate company turnover.
EBITDA
Earnings before interest, tax, depreciation and
amortisation.
EFFECTIVE RATE OF TAXATION
Tax expense divided by profit before tax.
ENTERPRISE VALUE (EV)
Market capitalisation plus net debt/(net cash).
INTEREST COVERConsolidated profit before interest and tax over
interest costs
LIABILITIES TO TANGIBLE NET WORTH
Total non current and current liabilities including
contingent liabilities divided by tangible net
worth.
LONG TERM DEBT TO TOTAL DEBT
Long term loans as a percentage of total debt.
MARKET CAPITALISATION
Number of shares in issue at the end of the
period multiplied by the market price at the end
of the period.
MARKET VALUE ADDED
Market capitalisation minus shareholders’
funds.
NET ASSETS
Total assets minus current liabilities, long term
liabilities, and non-controlling interests.
NET ASSETS PER SHARE
Net assets as at a particular financial year end
divided by the number of shares in issue as at
the current financial year end.
NET DEBT (CASH)
Total debt minus (cash plus short term deposits).
NET PROFIT MARGIN
Profit after tax attributable to equity holders of
the parent divided by total revenue including
share of associates.
NET WORKING CAPITAL
Current assets minus current liabilities.
PRICE EARNINGS RATIO
Market price per share (diluted) over diluted
earnings per share.
PRICE TO BOOK RATIO
Market price per share (diluted) over net asset
value per share.
PRICE TO CASH EARNINGS
Diluted market price per share divided by diluted
cash earnings per share.
PUBLIC HOLDING
Percentage of shares held by the public
calculated as per the Colombo Stock Exchange
Listing Rules as at the date of the Report.
QUICK RATIO
Cash plus short term investments plus
receivables, divided by current liabilities.
RECURRING EBIT/RECURRING PROFIT AFTER
TAX/RECURRING PROFIT ATTRIBUTABLE TO
EQUITY HOLDERS OF THE PARENT
Profit, as applicable, adjusted for changes in
fair value of investment property and one-off
disposal gains or losses accruing through the
sale of investments not held under the private
equity portfolio of JK Capital.
RETURN ON ASSETS
Profit after tax divided by the average total
assets.
RETURN ON CAPITAL EMPLOYED (ROCE)
Consolidated profit before interest and tax as a
percentage of average capital employed.
RETURN ON EQUITY (ROE)
Profit attributable to shareholders as a
percentage of average shareholders’ funds.
SHARE TURN RATIO
Total volume of shares traded during the year
divided by average number of shares in issue.
SHAREHOLDERS’ FUNDS
Total of stated capital, other components of
equity and revenue reserves.
TANGIBLE NET WORTH
Total equity less intangible assets and deferred
tax assets.
TOTAL DEBT
Long term loans plus short term loans and
overdrafts.
TOTAL EQUITY
Shareholders’ funds plus non-controlling
interest.

289Group Highlights | Governance | Management Discussion & Analysis | Financial Statements | Supplementary Information
Notice of Meeting
Notice is hereby given that the Thirty Eighth Annual General Meeting of John Keells Holdings
PLC will be held on 30th June 2017 at 10:00 a.m. at The Forum Area (Sixth Floor), The Institute
of Chartered Accountants of Sri Lanka, 30A, Malalasekera Mawatha (Longden Place), Colombo 7.
The business to be brought before the meeting will be:
1. to read the notice convening the meeting.
2. to receive and consider the Annual Report and Financial Statements for the Financial Year
ended 31st March 2017 with the Report of the Auditors thereon.
3. to re-elect as Director, Mr. D A Cabraal, who retires in terms of Article 84 of the Articles of
Association of the Company. A brief profile of Mr. D A Cabraal is contained in the Board of
Directors section of the Annual Report.
4. to re-elect as Director, Mr. A N Fonseka, who retires in terms of Article 84 of the Articles of
Association of the Company. A brief profile of Mr. A N Fonseka is contained in the Board of
Directors section of the Annual Report.
5. to re-elect as Director, Dr. S S H Wijayasuriya, who retires in terms of Article 91 of the Articles
of Association of the Company. A brief profile of Dr. S S H Wijayasuriya is contained in the
Board of Directors section of the Annual Report.
6. to re-elect as Director, Mr. K N J Balendra, who retires in terms of Article 91 of the Articles of
Association of the Company. A brief profile of Mr. K N J Balendra is contained in the Board of
Directors section of the Annual Report.
7. to re-elect as Director, Mr. J G A Cooray, who retires in terms of Article 91 of the Articles of
Association of the Company. A brief profile of Mr. J G A Cooray is contained in the Board of
Directors section of the Annual Report.
8. to re-appoint Auditors and to authorise the Directors to determine their remuneration.
9. to consider any other business of which due notice has been given in terms of the relevant
laws and regulations.
By Order of the Board
JOHN KEELLS HOLDINGS PLC
Keells Consultants (Private) Limited
Secretaries
31 May 2017
Notes:
i. A member unable to attend is entitled to
appoint a Proxy to attend and vote in his/
her place.
ii. A Proxy need not be a member of the
Company.
iii. A member wishing to vote by Proxy at the
Meeting may use the Proxy Form enclosed
on page 291 of this Report.
iv. In order to be valid, the completed Proxy
Form must be lodged at the Registered
Office of the Company not less than 48
hours before the meeting.
v. If a poll is demanded, a vote can be taken
on a show of hands or by a poll. Each
share is entitled to one vote. Votes can
be cast in person, by proxy or corporate
representatives. In the event an individual
member and his/her proxy holder are both
present at the meeting, only the member’s
vote is counted. If the proxy holder’s
appointor has indicated the manner of
voting, only the appointor’s indication of
the manner to vote will be used.

290 John Keells Holdings PLC | Annual Report 2016/17
Corporate Information
Name of Company
John Keells Holdings PLC
Legal Form
Public Limited Liability Company
Incorporated in Sri Lanka in 1979
Ordinary Shares listed on the Colombo Stock
Exchange
GDRs listed on the Luxembourg Stock
Exchange
Company Registration No.
PQ 14
Directors
S C Ratnayake - Chairman
A D Gunewardene - Deputy Chairman
J R F Peiris - Group Finance Director
K N J Balendra
J G A Cooray
D A Cabraal
A N Fonseka
M A Omar
M P Perera
S S H Wijayasuriya
Senior Independent Director
A N Fonseka
Audit Committee
A N Fonseka - Chairman
D A Cabraal
M P Perera
Human Resources and Compensation
Committee
D A Cabraal - Chairman
M A Omar
S S H Wijayasuriya
Nominations Committee
M A Omar - Chairman
M P Perera
S S H Wijayasuriya
S C Ratnayake
Related Party Transaction Review
Committee
M P Perera - Chairperson
D A Cabraal
A N Fonseka
S C Ratnayake
Registered Office of the Company
117 Sir Chittampalam A. Gardiner Mawatha,
Colombo 2, Sri Lanka
Telephone : +94 11 230 6000
Internet : www.keells.com
Email : [email protected]
Secretaries
Keells Consultants (Private) Limited
117 Sir Chittampalam A. Gardiner Mawatha,
Colombo 2, Sri Lanka
Telephone : +94 11 230 6245
Facsimile : +94 11 243 9037
Investor Relations
John Keells Holdings PLC
117 Sir Chittampalam A. Gardiner Mawatha,
Colombo 2, Sri Lanka
Telephone : +94 11 230 6161
Facsimile : +94 11 230 6160
Email : [email protected]
Sustainability, Enterprise Risk Management
and Group Initiatives
186 Vauxhall Street,
Colombo 2, Sri Lanka
Telephone : +94 11 230 6182
Facsimile : +94 11 230 6249
Email : [email protected]
Contact for Media
Corporate Communications Division
John Keells Holdings PLC
117 Sir Chittampalam A. Gardiner Mawatha,
Colombo 2, Sri Lanka
Telephone : +94 11 230 6191
Email : [email protected]
Auditors
Ernst & Young
Chartered Accountants
P.O. Box 101
Colombo, Sri Lanka
Bankers for the Group
Bank of Ceylon
Citibank N.A.
Commercial Bank of Ceylon
Deutsche Bank A.G.
DFCC Bank
Habib Bank
Hatton National Bank
Hongkong and Shanghai Banking Corporation
MCB Bank
National Savings Bank
Nations Trust Bank
NDB Bank
Pan Asia Banking Corporation
People’s Bank
Sampath Bank
Seylan Bank
Standard Chartered Bank
Depository for GDRs
Citibank N.A. New York

291Group Highlights | Governance | Management Discussion & Analysis | Financial Statements | Supplementary Information
I/We ..............................................................................................................................................................................................................................................................................of
.............................................................................................................................................................................................................................................................................................
being a member/s of John Keells Holdings PLC hereby appoint ............................................................................................................................................................of
......................................................................................................................................................................................................................................................... or failing him/her
MR. SUSANTHA CHAMINDA RATNAYAKE or failing him
MR. AJIT DAMON GUNEWARDENE or failing him
MR. JAMES RONNIE FELITUS PEIRIS or failing him
MR. KRISHAN NIRAJ JAYASEKARA BALENDRA or failing him
MR. JOSEPH GIHAN ADISHA COORAY or failing him
MR. MOHAMED ASHROFF OMAR or failing him
MR. DAMIEN AMAL CABRAAL or failing him
MR. ANTHONY NIHAL FONSEKA or failing him
MS. MARIE PREMILA PERERA or failing her
DR. SHRIDHIR SARIPUTTA HANSA WIJAYASURIYA
as my/our proxy to represent me/us and vote on my/our behalf at the Thirty Eighth Annual General Meeting of the Company to be held on 30 June
2017 at 10:00 a.m. and at any adjournment thereof, and at every poll which may be taken in consequence thereof.
I/We, the undersigned, hereby direct my/our proxy to vote for me/us and on my/our behalf on the specified Resolution as indicated by the letter
“X” in the appropriate cage:
FOR AGAINST
To re-elect as Director, Mr. D A Cabraal, who retires in terms of Article 84 of the Articles of Association of the Company.
To re-elect as Director, Mr. A N Fonseka, who retires in terms of Article 84 of the Articles of Association of the Company.
To re-elect as Director, Dr. S S H Wijayasuriya, who retires in terms of Article 91 of the Articles of Association of the Company.
To re-elect as Director, Mr. K N J Balendra, who retires in terms of Article 91 of the Articles of Association of the Company.
To re-elect as Director, Mr. J G A Cooray, who retires in terms of Article 91 of the Articles of Association of the Company.
To re-appoint Auditors and to authorise the Directors to determine their remuneration.
Signed on this ………………… day of …………………… Two Thousand and Seventeen
………………………………………………….
Signature/s of Shareholder/s
NOTE:
INSTRUCTIONS AS TO COMPLETION OF PROXY FORM ARE NOTED ON THE REVERSE.
Proxy Form

292 John Keells Holdings PLC | Annual Report 2016/17
INSTRUCTIONS AS TO COMPLETION OF PROXY
1. Please perfect the Form of Proxy by filling in legibly your full name and address, signing in the space provided
and filling in the date of signature.
2. The completed Form of Proxy should be deposited at the Registered Office of the Company at No. 117,
Sir Chittampalam A Gardiner Mawatha, Colombo 2, not later than 48 hours before the time appointed for the
holding of the Meeting.
3. If the Form of Proxy is signed by an Attorney, the relevant Power of Attorney should accompany the completed
Form of Proxy for registration, if such Power of Attorney has not already been registered with the Company.
4. If the appointer is a company or Corporation, the Form of Proxy should be executed under its Common Seal
or by a duly authorised officer of the company or Corporation in accordance with its Articles of Association or
Constitution.
5. If this Form of Proxy is returned without any indication of how the person appointed as Proxy shall vote, then
the Proxy shall exercise his/her discretion as to how he/she votes or, whether or not he/she abstains from
voting.
Please fill in the following details:
Name : ....................................................................................................................................................................................
Address : ....................................................................................................................................................................................
.....................................................................................................................................................................................
.....................................................................................................................................................................................
Jointly with : ....................................................................................................................................................................................
Share Folio No. : ....................................................................................................................................................................................

Designed & produced by
Digital Plates & Printing by Softwave Printing and Publishing (Pvt) LtdPhotography by Danush De Costa

www.keells.com