Embed Size (px)
Citation preview
The Financial Statements provide the reader
with a detailed analysis of performance,
results and financial strength.
175 Annual Report of the Board of Directors • 180 The Statement of Directors’ Responsibility • 181 Independent Auditors’ Report
• 182 Income Statement • 183 Statement of Comprehensive Income • 184 Statement of Financial Position
• 185 Statement of Cash Flows • 186 Statement of Changes in Equity • 191 Notes to the Financial Statements
F I N A N C I A L S T A T E M E N T S
Building Value

Group Highlights | Governance | Management Discussion & Analysis | Financial Statements | Supplementary Information 175
Annual Report of the Board of Directors
The Directors have pleasure in presenting the 38th Annual Report of your Company which covers the audited Financial Statements, Chairman’s message, Corporate Governance Commentary, Capital Management Review, Industry Group Review and all the other relevant information for the year ended 31 March 2017. Disclosures which appear in Share and Warrant Information section form a part of the Annual Report of the Board of Directors as it is a requirement of the Companies Act No. 07 of 2007.
Principal ActivitiesJohn Keells Holdings PLC (the Company), the Group’s holding Company, manages a portfolio of holdings consisting of a range of diverse business operations, which together constitute the John Keells Group (the Group), and provides function based services to its subsidiaries and equity accounted investees.
The companies within the Group and its business activities are described in the Group Directory under the Supplementary Information section of the Annual Report. There were no significant changes to the principal activities of the Company or its subsidiaries during the year.
Corporate Vision and ValuesA culture of innovation, integrity, excellence, caring and trust has been developed within the Group and by being aligned with them, the Directors and employees conduct their activities to achieve the vision,” Building businesses that are leaders in the region”.
Review of Business SegmentsA review of the financial and operational performance and future business developments of the Group, sectors, and its business units are described in the Management Discussion and Analysis section of the Annual Report. Significant changes to business combinations and acquisition of non-controlling interests are provided in note 9 to the financial statements. These reports, together with the audited financial statements, reflect the state of affairs of the Company and the Group. Segment wise contribution to Group revenue, results, assets and liabilities are provided in note 7 to the financial statements.
Financial StatementsFinancial Statements of the Group and Company for the year ended 31 March 2017,
have been prepared in accordance with Sri Lanka Accounting Standards (SLFRS/LKAS) with the inclusion of signatures of the Chairman, Group Finance Director and Group Financial Controller, are given from page 182 to 258 which form a part of the Integrated Annual Report.
Financial Results and AppropriationsRevenueRevenue generated by the Company amounted to LKR. 1,126 million (2016 – LKR 1,108 million), whilst Group revenue amounted to LKR 106,273 million (2016 – LKR 93,710 million). Contribution to Group revenue, from the different business segments is provided in note 7 to the financial statements.
Profit and AppropriationsThe profit after tax of the Company was LKR 16,152 million (2016 – LKR 17,070 million)
whilst the Group profit attributable to equity holders of the parent for the year was LKR 16,275 million (2016 - LKR 14,070 million).
The Company’s total comprehensive income net of tax was LKR 16,123 million (2016 -LKR 17,029 million), and the Group total comprehensive income attributable to parent was LKR 25,694 million (2016 -LKR 17,848 million).
Dividend and ReservesAs required by Section 56(2) of the Companies Act No 7 of 2007, the Board of Directors has confirmed that the Company satisfies the solvency test in accordance with Section 57 of the Companies Act No 7 of 2007, and has obtained a certificate from the auditors, prior to declaring all dividends. A final dividend will be paid on 16 June 2017 to those shareholders on the register as of 6 June 2017.
Information on dividends and reserves of the Company are given below.
John Keells Holdings PLC
For the year ended 31 MarchIn LKR ‘000s
2017 2016
Profit after tax 16,152,442 17,070,114
Other adjustments (5,309) (283,784)
Balance brought forward from the previous year 39,337,754 30,877,090
Amount available for appropriation 55,484,887 47,663,420
1st interim dividend of LKR 2.00 per share (2016-LKR 4.50) paid out of dividend received. (2,721,458) (5,352,156)
2nd interim dividend of LKR 2.00 per share (2016-LKR 1.00) paid out of dividend received. (2,774,933) (1,189,404)
Final dividend Declared of LKR 2.00 per share (2016-LKR 1.50) to be paid out of the dividend received.* (2,774,933) (1,784,106)
Balance to be carried forward to the next year 47,213,563 39,337,754
*In accordance with LKAS 10, Events After the Reporting Period, the final dividend has not been recognised as a liability in the financial statements.
Accounting PoliciesAll the significant accounting policies adopted by the Company and the Group are mentioned in note 4 to the financial statements. There have been no changes in the accounting policies adopted by the Group during the year under review. For all periods up to and including the year ended 31 March 2017,
the Group prepared its financial statements in accordance with Sri Lanka Accounting Standards (SLFRS/LKAS) which have materially converged with the International Financial Reporting Standards (IFRS) as issued by the International Accounting Standards Board (IASB).

176 John Keells Holdings PLC | Annual Report 2016/17
Annual Report of the Board of Directors
DonationsTotal donations made by the Company and the Group during the year amounted to LKR 14 million (2016 - LKR 24 million) and LKR 34 million (2016 - LKR 24 million), respectively. These amounts do not include contributions on account of corporate social responsibility (CSR) initiatives.
Related Party TransactionsThe Company’s transactions with Related Parties, given in note 43 to the financial statements, have complied with Colombo Stock Exchange Listing Rule 9.3.2 and Code of Best Practices on Related Party Transactions under the Securities Exchange Commission Directive issued under Section 13(c) of the Securities Exchange Commission Act.
Corporate Social ResponsibilityThe John Keells Foundation, which is funded by the Company and its subsidiaries, handles most of the Group’s CSR initiatives and activities. The Foundation manages a range of programmes that underpin its key principle of acting responsibly towards its stakeholders. The CSR initiatives, including completed and on-going projects, are detailed in the Capital Management Review section in the Annual Report.
In quantifying the Group’s contribution to charities, no account has been taken of in-house costs or management time.
Capital ExpenditureThe Company’s and Group’s capital expenditure on property, plant and equipment amounted to LKR 11 million (2016 - LKR 30 million) and LKR 4,332 million (2016 -LKR 4,582 million) respectively and all other related information and movements have been disclosed in the note 21 to the financial statements.
Additions to intangible assets of the Company and Group during the year amounted to LKR 7 million (2016 LKR 4 million) and LKR 114 million (2016 LKR 163 million) respectively and all other related movements are disclosed in the note 24 to the financial statements.
Valuation of Property, Plant & Equipment and Investment PropertyAll land and buildings owned by Group companies were revalued during the year. All information relating to revaluation is given in note 21.3 to the financial statements.
Investment properties of business units, when significantly occupied by Group companies, are classified as property, plant and equipment in the consolidated financial statements in compliance with LKAS 40.
All investment properties of the Group were revalued as at 31 March 2017, and the carrying value amounted to LKR 5,366 million (2016 -LKR 4,878 million). All information related to revaluation of the investment properties are provided in note 23 to the financial statements.
Details of Group properties as at 31 March 2017 are disclosed in real estate portfolio under the supplementary information section of the Annual Report.
InvestmentsDetailed description of the long term investments held as at the reporting date, is given in note 25, 26 and 27 to the financial statements.
Stated CapitalInformation on the stated capital of John Keells Holdings PLC is given below;
2017 2016
For the year ended 31 March Number ofsharesIn ’000
Value ofshares
LKR’000
Number ofsharesIn ’000
Value ofshares
LKR’000
Fully paid ordinary shares
At the beginning of the year 1,189,404 58,701,977 997,486 50,702,701
Share options exercised 6,869 911,261 165 26,516
Subdivision of shares 169,915 - 142,498 -
Exercise of share warrants 21,280 3,176,842 49,255 7,972,760
At the end of the year 1,387,468 62,790,080 1,189,404 58,701,977
Share InformationThe distribution and composition of shareholders and the information relating to earnings, dividends, net assets, market value per share and share trading are given in the Share Information section of the Annual Report. As an additional disclosure, the the Company’s Board of Directors’ (including their close family members) shareholdings and options available under the employee share option (ESOP) plans as at 31 March 2017, are given in Share and Warrant Information section of the Annual Report.
Major ShareholdersDetails of the twenty largest shareholders of the Company and the percentages held by each of them are disclosed in the Share and Warrant Information section of the Annual Report.
Equitable Treatment of ShareholdersThe Company has at all times ensured that all shareholders are treated equitably.
Revenue ReservesRevenue reserves as at 31 March 2017 for the Company and Group amounted to LKR 49,998 million (2016 - LKR 41,122 million) and LKR 77,193 million (2016 - LKR 67,565 million), respectively. The movement and composition of the reserves are disclosed in the Statement of Changes in Equity.
The Board of DirectorsThe Board of Directors of the Company as at 31 March 2017 and their brief profiles are given in the Board of Directors section of the Annual Report.
Retirement And Re-Election of DirectorsIn accordance with Article 84 of the Articles of Association of the Company, D A Cabraal and A N Fonseka retire by rotation and being eligible, offer themselves for re-election.
S H H Wijayasuriya was appointed to the Board as an independent, Non Executive Director on 4 October 2016, and

Group Highlights | Governance | Management Discussion & Analysis | Financial Statements | Supplementary Information 177
K N J Balendra and J G A Cooray were appointed to the Board as Executive Directors on 5 November 2016. In accordance with Article 91 of the Articles of Association of the Company, S H H Wijayasuriya, K N J Balendra and J G A Cooray are eligible for re-election. Brief profiles of S H H Wijayasuriya, K N J Balendra and J G A Cooray are given in the Board of Directors section of the Annual Report.
Review of Performance of the BoardThe performance of the Board is evaluated through a formalised process, where each individual Director anonymously comments on the dynamics of the Board. The process is described in page 30.
Board CommitteesInformation relating to members of the Audit Committee, Human Resources & Compensation Committee, Nominations Committee and the Related Party Transactions Review Committee including reports of each of the committees and attendance of Directors for each of the committee meetings are disclosed under Corporate Governance section of the Annual Report.
Interests Register and Interests in ContractsThe Company has maintained an Interests Register as contemplated by the Companies Act No 7 of 2007.
This Annual Report also contains particulars of entries made in the Interests Registers of subsidiaries which are public companies and private companies which have not dispensed with the requirement to maintain an Interests Register as permitted by Section 30 of the Companies Act No 7 of 2007.
All the Directors have made a general disclosure relating to share dealings and indemnities and remuneration to the Board of Directors as required by Section 192 (2) of the Companies Act No 7 of 2007 and no additional interests have been disclosed by any Director. The Interest Register is available at the registered head office of the Company, in keeping with the requirements of the section 119(1) (d) of the Companies Act No 7 of 2007.
Share DealingsParticulars of the Company Interest Register are disclosed in the Share and Warrant Information section of the Annual Report.
Given below are, the particulars of subsidiaries’ interest register;
Trans Asia Hotels PLC;• N L Gooneratne - Sale of 110 shares
Ceylon Cold Stores PLC;• M Hamza - Purchase of 500 shares
Tea Smallholder Factories PLC;• R E Rambukwella - Sale of 4,600 shares
Indemnities and RemunerationThe Board approved the payment of remuneration of the following Executive Directors for the period of 1 April 2016 to 31 March 2017 comprising of;
An increment from 1 July 2016 based on the individual performance rating obtained by the Executive Directors in line with performance management system of the John Keells Group;
A short term variable incentive based on the individual performance, organization performance and role responsibility based on the results of the financial year 2015/2016, and Long Term Incentive Plan in the form of an Employee Share Options in John Keells Holdings PLC.
John Keells Holdings PLC;• S C Ratnayake• A D Gunewardene• J R F Peiris• K N J Balendra (appointed w.e.f 5 November
2016)• J G A Cooray (appointed w.e.f 5 November
2016)
Asian Hotels and Properties PLC;• R J Karunarajah• S Rajendra
Ceylon Cold Stores PLC;• J R Gunaratne
John Keells PLC;• R S Fernando (resigned w.e.f 9 September
2016)
Union Assurance PLC;• A D Pereira
Cinnamon Hotel Management Ltd;• B J S M Senanayake
Walkers Tours Ltd;• V Leelananda
All indemnities and remuneration have been approved by the Boards of the respective companies as recommended by the Human Resources and Compensation Committee. These indeminities and remuneration are structured after considering market comparators, experts views and specific management complexities associated with the John Keells Group.
The contracts and the Directors’ fees of the following Non-Executive Directors have been approved/renewed by the Board. The fees are commensurate with the market complexities associated with the John Keells Group.
John Keells Holdings PLC;• S S H Wijayasuriya (appointed w.e.f 4
October 2016)
Asian Hotels and Properties PLC;• K N J Balendra (appointed w.e.f 1 April
2016)
Ceylon Cold Stores PLC;• S Ratwatte (appointed w.e.f 17 June 2016)• R S Wilson Wijeratnam (appointed w.e.f 17
June 2016)
John Keells PLC• R B A I Rajakarier (appointed w.e.f 29 June
2016)• A K Gunawardhana (appointed w.e.f 29
June 2016)• C N Wijewardene (appointed w.e.f 29 June
2016)
John Keells Hotels PLC• N B Weerasekara • T L F W Jayasekera• K N J Balendra (appointed w.e.f 1 April 2016)• A K Moonesinghe (appointed w.e.f 1 July
2016)
Keells Food Products PLC;• S De Silva (appointed w.e.f 10 June 2016)• A E H Sanderatne (appointed w.e.f 10 June
2016)• I Samarajiva (appointed w.e.f 10 June
2016)• P D Samarasinghe (appointed w.e.f 10
June 2016)
Tea Smallholders Factories PLC• M H De Silva (appointed w.e.f 6 February
2017)
Trans Asia Hotels PLC;• J C Ponniah• K N J Balendra (appointed w.e.f 1 April 2016)
178 John Keells Holdings PLC | Annual Report 2016/17
Fees payable to Non-executive Nominee Directors of John Keells Holdings PLC was paid to John Keells Holdings PLC and not to individual Directors.
Directors’ RemunerationDetails of the remuneration and other benefits received by the Directors are set out in note 43.7 of the financial statements.
Employee Share Option Plan (ESOP)At the beginning of the year, the employee share option plan consisted of the seventh, eighth and ninth plans approved by the shareholders on, 7 December 2011, 28 June 2014 and 24 June 2016 respectively.
The Directors confirm that the Company has not granted any funding to employees to exercise options.
Details of the options granted, options exercised, the grant price and the options cancelled or lapsed and outstanding as at the date of the Directors’ report as required by the Listing Rules of The Colombo Stock Exchange are given in the Shares and Warrants Information section of the Annual Report.
The highest, lowest and the closing prices of the Company shares during the year were LKR 165.00, LKR 133.90 and LKR 137.90 respectively.
Corporate GovernanceThe Board of Directors is committed towards maintaining an effective Corporate Governance Framework and implementing systems and structures required to ensure best practices in Corporate Governance and their effective implementation. The table on page 46 and 47 shows the manner in which the Company has complied with the Section 7.10 of the Rules of the Colombo Stock Exchange (CSE) on Corporate Governance. The Risk Management report is given from page 101 to 105 and the Corporate Governance Commentary is given from page 26 to 56.
Sustainability The Group pursues its business goals based on a model of stakeholder governance. Findings of the continuous internal stakeholder engagements have enabled the Group to focus on material issues such as the conservation of natural resources and the environment as well as material issues impacting other
stakeholders such as employees, customers, suppliers and the community. These measures are encapsulated in a Group-wide sustainable development strategy which is continuously evolving. This year, the Group published it’s second integrated Annual Report, which presents a comprehensive capital’s discussion on its financial and non-financial performance, in a bid to provide its stakeholders with holistic information relating to its value creation proposition. The Group has sought independent third-party assurance from DNV GL represented in Sri Lanka by DNV Business Assurance Lanka (Private) Limited in relation to the non-financial information contained in this Report.
The Report has also successfully completed the GRI Materiality Disclosures Service.
EmploymentThe Group has an equal opportunity policy and these principles are enshrined in specific selection, training, development and promotion policies, ensuring that all decisions are based on merit. The Group practices equality of opportunity for all employees irrespective of ethnicity, religion, political opinion, gender, marital status or different physical attributes. Employee ownership in the Company is facilitated through the employee share option plan.
Details of the Group’s human resource initiatives are detailed in the Human Capital section under Capital Management Review of the Annual Report.
The number of persons employed by the Company and Group as at 31 March 2017 was 162 (2016 - 156) and 13,211 (2016 – 12,035), respectively.
There have been no material issues pertaining to employees and industrial relations of the Company and the Group.
Supplier PolicyThe Group adopts a clear policy of terms and condition including payment as part of the commercial agreements negotiated with suppliers, and endeavours to pay for all items properly charged in accordance with these agreed terms. As at 31 March 2017 the trade and other payables of the Company and Group amounted to LKR 330 million (2016 - LKR 333 million) and LKR 14,136 million (2016 - LKR 12,755 million), respectively.
The Group strives to integrate principles of sustainable practices and policies in its value chain through extensive stakeholder consultations, the findings of which are integrated into work-plans. During the year, a supplier management framework and a supplier code of conduct were implemented. Supplier engagement including various fora and assessments of sites, suppliers were closely engaged with, particularly where the supply is of great importance to the Group.
Environmental ProtectionThe Group complies with the relevant environmental laws, regulations and endeavours to comply with best practices applicable in the country of operation. A summary of selected Group activities in the above area is contained in the Sustainability Report.
Research and DevelopmentThe Group has an active approach to research and development and recognizes the contribution that it can make to intellectual property and the Group’s operations. Significant investment has been made over the years and substantial efforts will continue to be made to introduce intellectual property rights, new products and processes, enhance the existing products and service offering including improve operational efficiency.
Statutory Payments The Directors confirm that to the best of their knowledge, all taxes, duties and levies payable by the Company and its subsidiaries, all contributions, levies and taxes payable on behalf of, and in respect of the employees of the Company and its subsidiaries, and all other known statutory dues as were due and payable by the Company and its subsidiaries as at the statement of financial position date have been paid or, where relevant provided for, except as specified in note 44 to the financial statements, covering contingent liabilities.
Enterprise Risk ManagementThe Board confirms that there is an ongoing process of identifying, evaluating and managing any significant risks faced by the Group, where annual risk reviews are carried out by the Sustainability, Enterprise Risk Management and Group Initiatives Division and the risks are further reviewed each quarter by each business unit. The headline risks of each listed Company is presented
Annual Report of the Board of Directors

Group Highlights | Governance | Management Discussion & Analysis | Financial Statements | Supplementary Information 179
to its respective Board Audit Committee for review by the business unit and in the case of John Keells Holdings PLC, by the Sustainability, Enterprise Risk Management and Group Initiatives Division to the John Keells Board Audit Committee.
Internal Controls and AssuranceThe Board, through the involvement of the Group Business Process Review Division, takes steps to gain assurance on the effectiveness over the financial, operational and risk management control systems in place. The Audit Committee receives regular reports on the adequacy and effectiveness of internal control in the Group, compliance with laws and regulations and established policies and procedures of the Group. The head of the Group Business Process Review Division has direct access to the chairman of the Audit Committee. Reports of the outsourced internal auditors are also reviewed by the Committee on matters pertaining to the Company.
Events after the Reporting PeriodThere have been no events subsequent to the reporting period, which would have any material effect on the Company or on the Group other than those disclosed in note 48 to the financial statements.
Going ConcernThe Directors are satisfied that the Company, its subsidiaries and equity accounted investees, have adequate resources to continue in operational existence for the foreseeable future, to justify adopting the going concern basis in preparing these financial statements.
Appointment and Remuneration of Independent AuditorsMessrs Ernst & Young, Chartered Accountants, are willing to continue as Auditors of the Company, and a resolution proposing their reappointment will be tabled at the annual general meeting.
The Auditors Report is found in the Financial Information section of the Annual Report.
The Audit Committee reviews the appointment of the Auditor, its effectiveness, its independence and its relationship with the Group, including the level of audit and non-audit fees paid to the Auditor.
The Group works with 3 firms of Chartered Accountants across the Group, namely, Ernst
& Young, KPMG and PricewaterhouseCoopers. Details of audit fees are set out in note 17 of the financial statements. The Auditors do not have any relationship (other than that of an Auditor) with the Company or any of its subsidiaries.
Further details on the work of the Auditor and the Audit Committee are set out in the Audit Committee Report.
Compliance with Laws and RegulationsTo the best of knowledge and belief of the Directors, the Group/Company has not engaged in any activity, which contravenes laws and regulations of the country.
Annual ReportThe Board of Directors approved the consolidated financial statements on 26 May 2017. The appropriate number of copies of this report will be submitted to the Colombo Stock Exchange and to the Sri Lanka Accounting and Auditing Standards Monitoring Board on 31 May 2017.
Annual General MeetingThe annual general meeting will be held at the Institute of Chartered Accountants of Sri Lanka, 30A, Malalasekera Mawatha, Colombo 7, on Friday, 30 June 2017 at 10.00 a.m. The notice of meeting appears in the Supplementary Information section of the integrated Annual Report.
This Annual Report is signed for and on behalf of the Board of DirectorsBy Order of the Board
Director
Director
Keells Consultants (Pvt) Ltd.Secretaries26 May 2017

180 John Keells Holdings PLC | Annual Report 2016/17
The Statement of Directors’ Responsibility
The responsibility of the Directors in relation to the financial statements is set out in the following statement. The responsibility of the auditors, in relation to the financial statements prepared in accordance with the provision of the Companies Act No. 7 of 2007, is set out in the Report of the Auditors.
The financial statements comprise of:
• Income statement and statement of comprehensive income of the Company and its subsidiaries, which present a true and fair view of the profit and loss of the Company and its subsidiaries for the financial year.
• A statement of financial position, which presents a true and fair view of the state of affairs of the Company and its subsidiaries as at the end of the financial year: and
The Directors are required to confirm that the financial statements have been prepared:
• Using appropriate accounting policies which have been selected and applied in a consistent manner, and material departures, if any, have been disclosed and explained; and
• Presented in accordance with the Sri Lanka Accounting Standards (SLFRS/LKAS); and that reasonable and prudent judgments and estimates have been made so that the form and substance of transactions are properly reflected; and
• Provides the information required by and otherwise comply with the Companies Act and the Listing Rules of the Colombo Stock Exchange.
The Directors are also required to ensure that the Company has adequate resources to continue in operation to justify applying the going concern basis in preparing these financial statements.
Further, the Directors have a responsibility to ensure that the Company maintains sufficient accounting records to disclose, with reasonable accuracy the financial position of the Company and of the Group.
The Directors are also responsible for taking reasonable steps to safeguard the assets of the Company and of the Group and in this regard to give proper consideration to the establishment of appropriate internal control systems with a view to preventing and detecting fraud and other irregularities.
The Directors are required to prepare the financial statements and to provide the auditors with every opportunity to take whatever steps and undertake whatever inspections that may be considered being appropriate to enable them to give their audit opinion.
Further, as required by Section 56 (2) of the Companies Act No. 7 of 2007, the Board of Directors have confirmed that the Company, based on the information available, satisfies the solvency test immediately after the distribution, in accordance with Section 57 of the Companies Act No. 7 of 2007, and have obtained a certificate from the auditors, prior to declaring a final dividend of LKR 2.00 per share for this year, to be paid on 16 June 2017.
The Directors are of the view that they have discharged their responsibilities as set out in this statement.
Compliance ReportThe Directors confirm that to the best of their knowledge, all taxes, duties and levies payable by the Company and its subsidiaries, all contributions, levies and taxes payable on behalf of and in respect of the employees of the Company and its subsidiaries, and all other known statutory dues as were due and payable by the Company and its subsidiaries as at the balance sheet date have been paid, or where relevant provided for, except as specified in note 44 to the financial statements covering contingent liabilities.
By order of the Board
Keells Consultants (Pvt) Ltd.Secretaries26 May 2017

Group Highlights | Governance | Management Discussion & Analysis | Financial Statements | Supplementary Information 181
Report on Other Legal and Regulatory RequirementsAs required by section 163 (2) of the Companies Act No. 07 of 2007, we state the following:
a) The basis of opinion, scope and limitations of the audit are as stated above.
b) In our opinion:
• we have obtained all the information and explanations that were required for the audit and, as far as appears from our examination, proper accounting records have been kept by the Company,
• the financial statements of the Company give a true and fair view of its financial position as at 31 March 2017, and of its financial performance and cash flows for the year then ended in accordance with Sri Lanka Accounting Standards, and
• the financial statements of the Company, and the Group comply with the requirements of sections 151 and 153 of the Companies Act No. 07 of 2007.
26 May 2017Colombo
Independent Auditors’ Report
INDEPENDENT AUDITORS’ REPORT TO THE SHAREHOLDERS OF JOHN KEELLS HOLDINGS PLCReport on the Financial StatementsWe have audited the accompanying financial statements of John Keells Holdings PLC, (“the Company”), and the consolidated financial statements of the Company and its subsidiaries (“Group”), which comprise the statement of financial position as at 31 March 2017, and the income statement and statement of comprehensive income, statement of changes in equity and, cash flow statement for the year then ended, and a summary of significant accounting policies and other explanatory information.
Board’s Responsibility for the Financial StatementsThe Board of Directors (“Board”) is responsible for the preparation of these financial statements that give a true and fair view in accordance with Sri Lanka Accounting Standards and for such internal control as Board determines is necessary to enable the preparation of financial statements that are free from material misstatement, whether due to fraud or error.
Auditor’s ResponsibilityOur responsibility is to express an opinion on these financial statements based on our audit. We conducted our audit in accordance with Sri Lanka Auditing Standards. Those standards require that we comply with ethical requirements and plan and perform the audit to obtain reasonable assurance
about whether the financial statements are free from material misstatement.
An audit involves performing procedures to obtain audit evidence about the amounts and disclosures in the financial statements. The procedures selected depend on the auditor’s judgment, including the assessment of the risks of material misstatement of the financial statements, whether due to fraud or error. In making those risk assessments, the auditor considers internal controls relevant to the entity’s preparation of the financial statements that give a true and fair view in order to design audit procedures that are appropriate in the circumstances, but not for the purpose of expressing an opinion on the effectiveness of the entity’s internal control. An audit also includes evaluating the appropriateness of accounting policies used and the reasonableness of accounting estimates made by the Board, as well as evaluating the overall presentation of the financial statements.
We believe that the audit evidence we have obtained is sufficient and appropriate to provide a basis for our audit opinion.
OpinionIn our opinion, the consolidated financial statements give a true and fair view of the financial position of the Group as at 31 March 2017, and of its financial performance and cash flows for the year then ended in accordance with Sri Lanka Accounting Standards.
182 John Keells Holdings PLC | Annual Report 2016/17
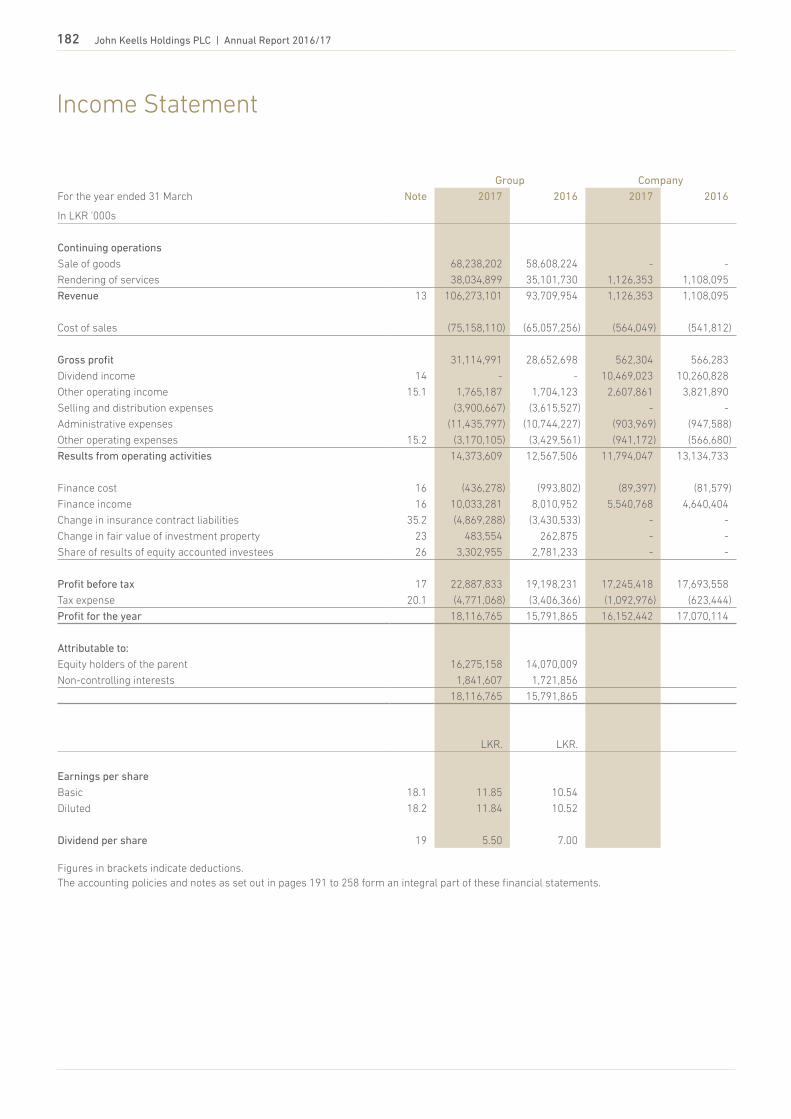
Income Statement
Group Company
For the year ended 31 March Note 2017 2016 2017 2016
In LKR '000s
Continuing operations
Sale of goods 68,238,202 58,608,224 - -
Rendering of services 38,034,899 35,101,730 1,126,353 1,108,095
Revenue 13 106,273,101 93,709,954 1,126,353 1,108,095
Cost of sales (75,158,110) (65,057,256) (564,049) (541,812)
Gross profit 31,114,991 28,652,698 562,304 566,283
Dividend income 14 - - 10,469,023 10,260,828
Other operating income 15.1 1,765,187 1,704,123 2,607,861 3,821,890
Selling and distribution expenses (3,900,667) (3,615,527) - -
Administrative expenses (11,435,797) (10,744,227) (903,969) (947,588)
Other operating expenses 15.2 (3,170,105) (3,429,561) (941,172) (566,680)
Results from operating activities 14,373,609 12,567,506 11,794,047 13,134,733
Finance cost 16 (436,278) (993,802) (89,397) (81,579)
Finance income 16 10,033,281 8,010,952 5,540,768 4,640,404
Change in insurance contract liabilities 35.2 (4,869,288) (3,430,533) - -
Change in fair value of investment property 23 483,554 262,875 - -
Share of results of equity accounted investees 26 3,302,955 2,781,233 - -
Profit before tax 17 22,887,833 19,198,231 17,245,418 17,693,558
Tax expense 20.1 (4,771,068) (3,406,366) (1,092,976) (623,444)
Profit for the year 18,116,765 15,791,865 16,152,442 17,070,114
Attributable to:
Equity holders of the parent 16,275,158 14,070,009
Non-controlling interests 1,841,607 1,721,856
18,116,765 15,791,865
LKR. LKR.
Earnings per share
Basic 18.1 11.85 10.54
Diluted 18.2 11.84 10.52
Dividend per share 19 5.50 7.00
Figures in brackets indicate deductions. The accounting policies and notes as set out in pages 191 to 258 form an integral part of these financial statements.

Group Highlights | Governance | Management Discussion & Analysis | Financial Statements | Supplementary Information 183
Statement of Comprehensive Income
Group Company
For the year ended 31 March Note 2017 2016 2017 2016
In LKR '000s
Profit for the year 18,116,765 15,791,865 16,152,442 17,070,114
Other comprehensive income
Other comprehensive income to be reclassified to income statement in subsequent periods
Currency translation of foreign operations 1,089,650 3,009,187 - -
Net (loss)/gain on cash flow hedges 12.3 331,679 - - -
Share of other comprehensive income of equity accounted investees 272,648 576,177 - -
Net gain / (loss) on available-for-sale financial assets (302,773) (521,015) (24,087) (38,373)
Net other comprehensive income to be reclassified to income statement in subsequent periods
1,391,204 3,064,349 (24,087) (38,373)
Other comprehensive income not to be reclassified to income statement in subsequent periods
Revaluation of land and buildings 10,361,135 1,282,978 - -
Share of other comprehensive income of equity accounted investees 3,830 40,947 - -
Re-measurement gain / (loss) on defined benefit plans 37 (110,758) (44,627) (5,310) (2,478)
Net other comprehensive income not to be reclassified to income statement in subsequent periods
10,254,207 1,279,298 (5,310) (2,478)
Tax on other comprehensive income 20.2 49,444 (52,348) - -
Other comprehensive income for the period, net of tax 11,694,855 4,291,299 (29,397) (40,851)
Total comprehensive income for the period, net of tax 29,811,620 20,083,164 16,123,045 17,029,263
Attributable to :
Equity holders of the parent 25,694,454 17,848,337
Non-controlling interests 4,117,166 2,234,827
29,811,620 20,083,164
Figures in brackets indicate deductions. The accounting policies and notes as set out in pages 191 to 258 form an integral part of these financial statements.

184 John Keells Holdings PLC | Annual Report 2016/17
Statement of Financial Position Group Company
As at 31 March Note 2017 2016 2017 2016
In LKR '000s
ASSETSNon-current assetsProperty, plant and equipment 21 64,396,373 52,736,375 93,913 116,039 Lease rentals paid in advance 22 13,206,058 10,888,158 - - Investment property 23 5,366,180 4,878,406 - - Intangible assets 24 2,118,160 2,337,860 30,801 43,820 Investments in subsidiaries 25 - - 42,987,395 36,384,646 Investments in equity accounted investees 26 17,718,887 16,949,464 8,910,800 8,867,622 Non-current financial assets 27 27,666,621 22,635,444 2,789,980 507,405 Deferred tax assets 20.4 143,548 129,837 - - Other non-current assets 28 41,692,316 35,557,148 16,254 12,414
172,308,143 146,112,692 54,829,143 45,931,946
Current assetsInventories 29 5,605,712 4,664,833 - - Trade and other receivables 30 11,687,429 9,998,949 118,076 169,144 Amounts due from related parties 43.1 111,639 133,031 286,735 595,182 Other current assets 31 3,265,327 2,303,431 99,442 128,353 Short term investments 32 79,174,327 72,635,070 60,243,280 56,862,236 Cash in hand and at bank 5,119,185 5,127,463 304,265 178,193
104,963,619 94,862,777 61,051,798 57,933,108 Total assets 277,271,762 240,975,469 115,880,941 103,865,054
EQUITY AND LIABILITIESEquity attributable to equity holders of the parentStated capital 33 62,790,080 58,701,977 62,790,080 58,701,977 Revenue reserves 77,193,184 67,564,513 49,988,495 41,121,860 Other components of equity 33.2 38,651,568 28,715,262 1,504,876 1,084,617
178,634,832 154,981,752 114,283,451 100,908,454 Non-controlling interest 15,695,543 13,498,570 - -
Total equity 194,330,375 168,480,322 114,283,451 100,908,454
Non-current liabilitiesInsurance contract liabilities 35 31,700,278 27,205,282 - - Interest-bearing loans and borrowings 36 14,202,636 13,706,848 - - Deferred tax liabilities 20.4 2,336,241 2,029,371 - - Employee benefit liabilities 37 1,880,287 1,660,880 217,910 189,181 Other deferred liabilities 38 838,891 861,802 103,218 371,014 Other non-current liabilities 39 3,933,882 3,095,181 - -
54,892,215 48,559,364 321,128 560,195
Current liabilitiesTrade and other payables 40 14,136,040 12,755,466 330,078 332,506 Amounts due to related parties 43.2 10,434 28,982 210,029 102,135 Income tax liabilities 20.3 2,395,379 1,873,472 635,532 345,555 Short term borrowings 41 1,380,238 821,243 - - Interest-bearing loans and borrowings 36 2,918,854 2,991,582 - 1,482,508 Other current liabilities 42 2,944,118 2,234,856 16,441 16,289 Bank overdrafts 4,264,109 3,230,182 84,282 117,412
28,049,172 23,935,783 1,276,362 2,396,405 Total equity and liabilities 277,271,762 240,975,469 115,880,941 103,865,054
I certify that the financial statements comply with the requirements of the Companies Act No. 7 of 2007.
M J S RajakariarGroup Financial Controller
The Board of Directors is responsible for the preparation and presentation of these financial statements.
S C Ratnayake J R F Peiris Chairman Group Finance Director
26 May 2017ColomboThe accounting policies and notes as set out in pages 191 to 258 form an integral part of these financial statements.

Group Highlights | Governance | Management Discussion & Analysis | Financial Statements | Supplementary Information 185
Statement of Cash Flows
Group CompanyFor the year ended 31 March Note 2017 2016 2017 2016
In LKR '000s
CASH FLOWS FROM OPERATING ACTIVITIESProfit before working capital changes A 14,249,210 14,577,471 (143,117) (183,324)
(Increase) / Decrease in inventories (940,879) 934,769 - - (Increase) / Decrease in trade and other receivables (1,712,513) 69,939 38,775 (62,627)(Increase) / Decrease in other current assets (320,693) (176,563) 37,903 10,017 (Increase) / Decrease in other non-current assets (5,008,630) (6,646,918) (3,840) 1,393 Increase / (Decrease) in trade, other payables and other non-current liabilities 2,200,730 3,551,730 (3,617) (99,067)Increase / (Decrease) in other current liabilities 820,376 (1,033,059) 153 1,406 Increase / (Decrease) in insurance contract liabilities 4,494,996 3,273,316 - - Cash generated from operations 13,782,597 14,550,685 (73,743) (332,202)
Finance income received 9,536,363 8,117,933 4,221,631 4,162,732 Finance cost paid (302,583) (955,839) (63,216) (78,912)Dividend received 2,854,182 2,588,485 10,789,765 9,902,966 Tax paid (4,630,808) (2,519,947) (803,000) (541,130)Super Gain Tax paid - (1,096,780) - (235,746)Gratuity paid (219,443) (171,100) (9,412) (386)Net cash flow from operating activities 21,020,308 20,513,437 14,062,025 12,877,322
CASH FLOWS FROM/(USED IN) INVESTING ACTIVITIESPurchase and construction of property, plant and equipment (4,331,582) (4,582,064) (11,110) (30,002)Purchase of intangible assets (114,398) (162,608) (6,746) (4,196)Addition to investment property (4,220) (6,590) - - Purchase of lease rights (2,657,012) (607,155) - - Acquisition of business, net of cash acquired 9.2 - (12,914) - - Acquisition of associates - - - (115,407)Increase in interest in subsidiaries - - (4,840,893) (5,100,725)Increase in interest in associates (44,172) (40,200) (43,178) (40,200)Proceeds from sale of property, plant and equipment and intangible assets 157,919 592,421 211 8,260 Proceeds from sale of non-current investments - - 36,357 5,739,902 Proceeds from sale of financial instruments - fair valued through profit or loss 1,242,075 236,082 - - Purchase of financial instruments - fair valued through profit or loss (1,285,594) (448,206) - - (Purchase) / disposal of short term investments (net) (5,443,340) (39,731) (1,681,845) (2,591,480)(Purchase) / disposal of non current financial assets (net) (5,270,637) (4,506,403) 1,311 106,491 Grants received for investing activities 80,800 10,714 - -Net cash flow from/(used in) investing activities (17,670,161) (9,566,654) (6,545,893) (2,027,357)
CASH FLOWS FROM/(USED IN) FINANCING ACTIVITIESProceeds from issue of shares 4,088,103 7,999,276 4,088,103 7,999,276 Direct cost on issue of shares - (71,189) - (45,560)Changes in non controlling interest 65,660 (23,079) - -Payment of other deferred liabilities (115,406) - - - Dividend paid to equity holders of parent (7,280,497) (8,037,790) (7,280,497) (8,037,790)Dividend paid to shareholders with non-controlling interest (1,279,179) (1,595,872) - - Proceeds from long term borrowings 3,300,907 409,372 - - Repayment of long term borrowings (3,443,821) (4,623,992) (1,469,884) (1,388,100)Proceeds from (repayment of) other financial liabilities (net) 558,995 (1,773,958) - - Net cash flow from/(used in) financing activities (4,105,238) (7,717,232) (4,662,278) (1,472,174)
NET INCREASE / (DECREASE) IN CASH AND CASH EQUIVALENTS (755,091) 3,229,551 2,853,854 9,377,791
CASH AND CASH EQUIVALENTS AT THE BEGINNING 48,398,696 45,169,145 37,135,335 27,757,544
CASH AND CASH EQUIVALENTS AT THE END 47,643,605 48,398,696 39,989,189 37,135,335
ANALYSIS OF CASH AND CASH EQUIVALENTSFavorable balancesShort term investments 32 46,788,529 46,501,415 39,769,206 37,074,554 Cash in hand and at bank 5,119,185 5,127,463 304,265 178,193 Unfavourable balancesBank overdrafts (4,264,109) (3,230,182) (84,282) (117,412)Total cash and cash equivalents 47,643,605 48,398,696 39,989,189 37,135,335 Cash and cash equivalents in the statement of financial position comprise cash at banks and in hand and short-term deposits with a maturity of three months or less. For the purpose of the cash flow statement, cash and cash equivalents consist of cash and short-term deposits as defined above, net of outstanding bank overdrafts. Figures in brackets indicate deductions.The accounting policies and notes as set out in pages 191 to 258 form an integral part of these financial statements.

186 John Keells Holdings PLC | Annual Report 2016/17
Statement of Changes in Equity
Statement of Cash Flows
Group Company
For the year ended 31 March Note 2017 2016 2017 2016
In LKR '000s
A. Profit before working capital changes
Profit before tax 22,887,833 19,198,231 17,245,418 17,693,558
Adjustments for:
Finance income (10,033,281) (8,010,952) (5,540,768) (4,640,404)
Dividend income - - (10,469,023) (10,260,828)
Finance costs 436,278 993,802 89,397 81,579
Share based payment expense 444,346 395,592 119,822 128,541
Change in fair value of investment property (483,554) (262,875) - -
Share of results of equity accounted investees (3,302,955) (2,781,233) - -
(Profit) / loss on sale of non-current investments - - (2,574,003) (3,792,821)
Depreciation of property, plant and equipment 2,874,071 2,782,315 33,042 33,415
Provision for impairment losses 34,332 215,764 900,419 525,000
(Profit) / loss on sale of property, plant and equipment and intangible assets 41,183 34,050 (17) (1,656)
Gain on bargain purchase of a subsidiary 9.2 - (4,088) - -
Amortisation of lease rental paid in advance 592,983 738,407 - -
Amortisation of intangible assets 333,046 320,564 19,765 23,659
Amortisation of other deferred liabilities (19,669) (14,984) - -
Gratuity provision and related costs 327,633 283,900 32,831 26,633
Unrealised (gain) / loss on foreign exchange (net) 116,964 688,978 - -
14,249,210 14,577,471 (143,117) (183,324)
COMPANYIn LKR '000s
Statedcapital
Othercapital
reserve
Availablefor salereserve
Revenuereserve
Totalequity
As at 1 April 2015 50,702,701 562,718 164,680 32,373,320 83,803,419 Charge relating to Super Gain Tax - - - (235,746) (235,746)
Profit for the year - - - 17,070,114 17,070,114 Other comprehensive income - - (38,373) (2,478) (40,851)Total comprehensive income - - (38,373) 17,067,636 17,029,263 Exercise of share warrants 7,972,760 - - - 7,972,760 Exercise of share options 26,516 - - 26,516 Direct cost of issue of shares - - - (45,560) (45,560)Share based payments - 395,592 - - 395,592 Final dividend paid - 2014/15 - - - (1,496,230) (1,496,230)Interim dividends paid - 2015/16 - - - (6,541,560) (6,541,560)As at 31 March 2016 58,701,977 958,310 126,307 41,121,860 100,908,454
Profit for the year - - - 16,152,442 16,152,442 Other comprehensive income - - (24,087) (5,310) (29,397)Total comprehensive income - - (24,087) 16,147,132 16,123,045 Exercise of share warrants 3,176,842 - - - 3,176,842 Exercise of share options 911,261 - - - 911,261 Share based payments - 444,346 - - 444,346 Final dividend paid - 2015/16 - - - (1,784,105) (1,784,105)Interim dividends paid - 2016/17 - - - (5,496,392) (5,496,392)As at 31 March 2017 62,790,080 1,402,656 102,220 49,988,495 114,283,451
Figures in brackets indicate deductions. The accounting policies and notes as set out in pages 191 to 258 form an integral part of these financial statements.

Group Highlights | Governance | Management Discussion & Analysis | Financial Statements | Supplementary Information 187
Statement of Changes in Equity
Att
ribu
tabl
e to
equ
ity h
olde
rs o
f the
par
ent
GR
OU
PIn
LKR
'000
sSt
ated
capi
tal
Rev
alua
tion
rese
rve
Fore
ign
curr
ency
tran
slat
ion
rese
rve
Cas
h fl
ow
hed
ge
res
erve
Oth
erca
pita
lre
serv
e
Avai
labl
efo
r sa
lere
serv
e
Rev
enue
rese
rve
Tota
lN
onco
ntro
lling
inte
rest
s
Tota
leq
uity
As
at 1
Apr
il 20
15
50,
702,
701
19,
752,
411
3,7
70,4
96
-
562
,718
4
15,6
53
62,
593,
948
137
,797
,927
1
2,27
8,88
3 1
50,0
76,8
10
Char
ge r
elat
ing
to S
uper
Gai
n Ta
x -
-
-
-
-
-
(1
,237
,546
) (1
,237
,546
) (1
04,5
67)
(1,3
42,1
13)
Profi
t for
the
year
-
-
-
-
-
-
1
4,07
0,00
9 1
4,07
0,00
9 1
,721
,856
1
5,79
1,86
5
Oth
er c
ompr
ehen
sive
inco
me
-
1,0
93,7
79
3,3
10,4
83
-
-
(585
,870
) (4
0,06
4) 3
,778
,328
5
12,9
71
4,2
91,2
99
Tota
l com
preh
ensi
ve in
com
e -
1
,093
,779
3
,310
,483
-
-
(5
85,8
70)
14,
029,
945
17,
848,
337
2,2
34,8
27
20,
083,
164
Exer
cise
of s
hare
war
rant
s 7
,972
,760
-
-
-
-
-
-
7
,972
,760
-
7
,972
,760
Exer
cise
of s
hare
opt
ions
26,
516
-
-
-
-
-
-
26,
516
-
26,
516
Dir
ect c
ost o
f iss
ue o
f sha
res
-
-
-
-
-
-
(68,
255)
(68,
255)
(2,9
34)
(71,
189)
Re-
purc
hase
of s
ubsi
diar
y sh
ares
hel
d by
NCI
-
-
-
-
-
-
-
-
(23,
079)
(23,
079)
Shar
e ba
sed
paym
ents
-
-
-
-
395
,592
-
-
3
95,5
92
-
395
,592
Res
tate
men
t of f
ully
dep
reci
ated
ass
ets
-
-
-
-
-
-
20,
482
20,
482
3,9
00
24,
382
Fina
l div
iden
d pa
id -
201
4/15
-
-
-
-
-
-
(1,4
96,2
30)
(1,4
96,2
30)
-
(1,4
96,2
30)
Inte
rim
div
iden
ds p
aid
- 20
15/1
6 -
-
-
-
-
-
(6
,541
,560
) (6
,541
,560
) -
(6
,541
,560
)
Subs
idia
ry d
ivid
end
to n
on-c
ontr
ollin
g in
tere
st
-
-
-
-
-
-
307
,928
3
07,9
28
(1,9
03,8
00)
(1,5
95,8
72)
Acqu
isiti
on, d
ispo
sal a
nd c
hang
es in
non
-con
trol
ling
inte
rest
-
-
-
-
-
-
(44,
199)
(44,
199)
1,0
15,3
40
971
,141
As
at 3
1 M
arch
201
6 5
8,70
1,97
7 2
0,84
6,19
0 7
,080
,979
-
9
58,3
10
(170
,217
) 6
7,56
4,51
3 1
54,9
81,7
52
13,
498,
570
168
,480
,322
Pro
fit fo
r th
e ye
ar -
-
-
-
-
-
1
6,27
5,15
8 1
6,27
5,15
8 1
,841
,607
1
8,11
6,76
5
Oth
er c
ompr
ehen
sive
inco
me
-
8,1
48,6
02
1,2
22,9
16
312
,529
-
(1
92,0
87)
(72,
664)
9,4
19,2
96
2,2
75,5
59
11,
694,
855
Tota
l com
preh
ensi
ve in
com
e -
8
,148
,602
1
,222
,916
3
12,5
29
-
(192
,087
) 1
6,20
2,49
4 2
5,69
4,45
4 4
,117
,166
2
9,81
1,62
0
Exer
cise
of s
hare
war
rant
s 3
,176
,842
-
-
-
-
-
-
3
,176
,842
-
3
,176
,842
Exer
cise
of s
hare
opt
ions
911
,261
-
-
-
-
-
-
9
11,2
61
-
911
,261
Sha
re b
ased
pay
men
ts -
-
-
-
4
44,3
46
-
-
444
,346
-
4
44,3
46
Fina
l div
iden
d pa
id -
201
5/16
-
-
-
-
-
-
(1,7
84,1
05)
(1,7
84,1
05)
-
(1,7
84,1
05)
Inte
rim
div
iden
ds p
aid
- 20
16/1
7 -
-
-
-
-
-
(5
,496
,392
) (5
,496
,392
) -
(5
,496
,392
)
Sub
sidi
ary
divi
dend
to n
on-c
ontr
ollin
g in
tere
st -
-
-
-
-
-
6
59,9
92
659
,992
(1
,939
,171
) (1
,279
,179
)
Acqu
isiti
on, d
ispo
sal a
nd c
hang
es in
non
-con
trol
ling
inte
rest
-
-
-
-
-
-
46,
682
46,
682
18,
978
65,
660
As
at 3
1 M
arch
201
7 6
2,79
0,08
0 2
8,99
4,79
2 8
,303
,895
3
12,5
29
1,4
02,6
56
(362
,304
) 7
7,19
3,18
4 17
8,63
4,83
2 1
5,69
5,54
3 19
4,33
0,37
5
Figu
res
in b
rack
ets
indi
cate
ded
uctio
ns.
The
acco
untin
g po
licie
s an
d no
tes
as s
et o
ut in
pag
es 1
91 to
258
form
an
inte
gral
par
t of t
hese
fina
ncia
l sta
tem
ents
.

188 John Keells Holdings PLC | Annual Report 2016/17
Performance Highlights
LKR106.27bnGroup Revenue
A growth of 13 per cent
LKR22.89bnGroup Profit before TaxA growth of 19 per cent
Sri Lanka*
SriLanka*
Sri Lanka*
Sri Lanka*
SriLanka*
Asia*
Europe*
Asia*
Leisure
IT
FinancialServicesAsia*
CF&R
SriLanka* 2017
LKR 106.27 bnTRP
Property
Sri Lanka*
Asia*
Sri Lanka*
Property
SriLanka*
SriLanka*
Asia*
Europe*
Leisure
IT
TRP
FinancialServices
Sri Lanka*
CF&R
SriLanka* 2016
LKR 93.71 bn
Asia*
Other
TRP
FinancialServices
Group*
Group*
Group*
Group*
Group*
Group*
Property
CF&R
Leisure
2017LKR 22.89 bn
Other
TRPFinancialServices
Group*
Group*
Group*
Group*
Group*Group*
Property
CF&R
Leisure
2016LKR 19.20 bn
Group RevenueLKR bn
106.2793.7191.85 86.71
85.41
2017 2016 2015 2014 2013
Group PBTLKR bn
22.8919.20
18.56
15.32
15.67
2017 2016 2015 2014 2013
* Geographical segment analysis by location of customers
* Attributable to equity holders of the parent

Group Highlights | Governance | Management Discussion & Analysis | Financial Statements | Supplementary Information 189
LKR277.27bnGroup Assets
A growth of 15 per cent
LKR82.94bnGroup Liabilities
A growth of 14 per cent
CF&RProperty
Property
Others
CF&R
Leisure
Leisure
Leisure
PP&E
FinancialServices
Financial
Services
LRPA
Financial
Services
OtherEquity
accountedinvestees
Transportation
2017LKR 277.27 bn
Leisure
Othe
r as
sets
Short term investm
entsNon-
Curre
ntfin
ancia
l ass
ets
Other non-current assets
CF&RPro
perty
Property
Other
CF&RLeisure
Leisure
Leisure
PP&E
FinancialServices
Financial
Services
OtherEquity
accountedinvestees
Transportation
Fin
ancia
l
Service
s
LRPA
Leisure
2016LKR 240.98 bn
Short term investm
ents
Non-
Curre
ntfin
ancia
l ass
ets
Othe
r as
sets
Other non-current assets
CF&R
CF&RLeisure
TRP
Property
Property
Leisure
Leisure
CF&R
Leisure
FinancialServices
Bankoverdrafts
Othernon-currentliabilities
2017LKR 82.94 bn
Insurance provisions
Insurance provisions
Trade and
othe
r pay
able
sO
ther
liab
ilitie
s
Financial Services
CF&R
Othernon-currentliabilities
Leisure
PropertyLeisure
Leisure
Other
CF&R
Leisure
IT
Bank
overdraftsProperty
2016LKR 72.50 bn
CF&R
Financial Services
Insurance provisions
Insurance provisions
Tra
de an
d ot
her p
ayab
les
Oth
er li
abilit
ies
Group AssetsLKR bn
277.27 240.98 218.09
202.47 159.12
2017 2016 2015 2014 2013
Group LiabilitiesLKR bn
82.94 72.50 68.01
67.26
57.93
2017 2016 2015 2014 2013

190 John Keells Holdings PLC | Annual Report 2016/17
Index to the Notes
Corporate and Group information
1 Corporate information 191
2 Group information 191
Basis of preparation and other significant accounting policies
3 Basis of preparation 191
4 Summary of significant accounting policies 192
5 Significant accounting judgements, estimates and assumptions 192
6 Standards issued but not yet effective 193
Group business, operations & management
7 Operating segment information 194
8 Basis of consolidation and material partly owned subsidiaries 199
9 Business combinations and acquisitions of non-controlling interests 200
10 Financial risk management objectives and policies 202
11 Fair value measurement and related fair value disclosures 209
12 Financial instruments and related policies 211
Notes to the income statement, statement of comprehensive income and statement of financial position
13 Revenue 216
14 Dividend income 216
15 Other operating income and other operating expenses 216
16 Net finance income 217
17 Profit before tax 218
18 Earnings per share 218
19 Dividend per share 219
20 Taxes 219
21 Property , plant and equipment 225
22 Leases 230
23 Investment property 230
24 Intangible assets 232
25 Investment in subsidiaries 234
26 Investment in equity accounted investees 237
27 Non current financial assets 240
28 Other non current assets 241
29 Inventories 241
30 Trade and other receivables 242
31 Other current assets 242
32 Short term investments 242
33 Stated capital and other components of equity 244
34 Share-based payment plans 245
35 Insurance contract liabilities 246
36 Interest-bearing loans and borrowings 248
37 Employee benefit liabilities 251
38 Other deferred liabilities 252
39 Other non current liabilities 253
40 Trade and other payables 253
41 Short term borrowings 253
42 Other current liabilities 253
43 Related party transactions 253
Other disclosures
44 Contingent liabilities 256
45 Capital and other commitments 258
46 Lease commitments 258
47 Assets pledged 258
48 Events after the reporting period 258
Financial Calendar
Date
Interim Financial Statements
Three months ended 30 June 2016 28 July 2016
Six months ended 30 September 2016 4 November 2016
Nine months ended 31 December 2016 26 January 2017
First interim dividend paid on 24 October 2016
Second interim dividend paid on 16 February 2017
Final dividend proposed to be paid on 16 June 2017
Annual Report 2016/17 31 May 2017
38th Annual General Meeting 30 June 2017
Date
Interim Financial Statements
Three months ended 30 June 2017 On or before 27 July 2017
Six months ended 30 September 2017 On or before 2 November 2017
Nine months ended 31 December 2017 On or before 25 January 2018
Annual Report 2017/18 On or before 1 June 2018
39th Annual General Meeting On or before 29 June 2018
www.keells.com

Group Highlights | Governance | Management Discussion & Analysis | Financial Statements | Supplementary Information 191
Notes to the Financial Statements
CORPORATE AND GROUP INFORMATION 1. Corporate information Reporting entityJohn Keells Holdings PLC is a public limited liability Company incorporated and domiciled in Sri Lanka. The registered office and principal place of business of the Company is located at 117, Sir Chittampalam A Gardiner Mawatha, Colombo 2.
Ordinary shares of the Company are listed on the Colombo Stock Exchange. Global depository receipts (GDRs) of John Keells Holdings PLC are listed on the Luxembourg Stock Exchange. John Keells Holdings PLC became the holding Company of the Group during the financial year ended 31 March 1986.
Consolidated financial statementsThe financial statements for the year ended 31 March 2017, comprise “the Company” referring to John Keells Holdings PLC as the holding Company and “the Group” referring to the companies that have been consolidated therein.
Approval of financial statementsThe financial statements for the year ended 31 March 2017 were authorised for issue by the Board of Directors on 26 May 2017.
Principal activities and nature of operations of the holding CompanyJohn Keells Holdings PLC, the Group’s holding Company, manages a portfolio of investments consisting of a range of diverse business operations, which together constitute the John Keells Group, and provides function based services to its subsidiaries, equity accounted investees.
Responsibility for financial statementsThe responsibility of the Board of Directors in relation to the financial statements is set out in the Statement of Directors’ Responsibility report in the Annual report.
Statements of complianceThe financial statements which comprise the income statement, statement of comprehensive income, statement of financial position, statement of changes in equity and the statement of cash flows, together with the accounting policies and notes (the “financial statements”) have been prepared in accordance with Sri Lanka Accounting Standards (SLFRS/LKAS) as issued by the Institute of Chartered Accountants of Sri Lanka (CA Sri Lanka) and in compliance with the Companies Act No. 7 of 2007.
2. Group information Subsidiaries , associates and joint venturesThe companies within the Group and its business activities are described in the Group Directory under the Supplementary Information section of the Annual Report.
There were no significant changes in the nature of the principal activities of the Company and the Group during the financial year under review.
BASIS OF PREPARATION AND OTHER SIGNIFICANT ACCOUNTING POLICIES 3. Basis of preparationThe consolidated financial statements have been prepared on an accrual basis and under the historical cost convention except for investment properties, land and buildings, derivative financial instruments, fair value through profit or loss financial assets and available-for-sale financial assets that have been measured at fair value.
Presentation of functional currencyThe consolidated financial statements are presented in Sri Lankan Rupees (LKR), which is the primary economic environment in which the holding Company operates. Each entity in the Group uses the currency of the primary economic environment in which they operate as their functional currency.
The following subsidiaries are using different functional currencies other than Sri Lankan Rupees (LKR):
Country of incorporation Functional Currency Name of the Subsidiary
Canada Canadian Dollar (CAD) John Keells BPO Solutions Canada Inc.
India Indian Rupee (INR) John Keells BPO Solutions India (Pvt) Ltd.
Serene Holidays (Pvt) Ltd.
Singapore Singapore Dollar (SGD) John Keells Singapore (Pte) Ltd.
USA United States Dollar (USD) John Keells BPO Solutions US Inc.
Republic of Maldives United States Dollar (USD) Fantasea World Investments (Pte) Ltd.
John Keells Maldivian Resort (Pte) Ltd.
Mack Air Services Maldives (Pte) Ltd.
Tranquility (Pte) Ltd.
Travel Club (Pte) Ltd.
Mauritius United States Dollar (USD) John Keells BPO Holdings (Pvt) Ltd.
John Keells BPO International (Pvt) Ltd.
Sri Lanka United States Dollar (USD) Waterfront Properties (Pvt) Ltd.

192 John Keells Holdings PLC | Annual Report 2016/17
Each material class of similar items are presented cumulatively in the Financial Statements. Items of dissimilar nature or function are presented separately unless they are immaterial as permitted by the Sri Lanka Accounting Standard-LKAS 1 on ‘Presentation of Financial Statements’.
All values are rounded to the nearest rupees thousand (LKR ’000) except when otherwise indicated.
The significant accounting policies are discussed with relevant individual notes.
The indicative US Dollar financial statements under Supplementary Information section of the Annual Report do not form a part of the financial statements prepared in accordance with SLFRS/LKAS.
Comparative informationThe presentation and classification of the financial statements of the previous years have been amended, where relevant including the following, for better presentation and to be comparable with those of the current year.
The share of results of equity accounted investees in the income statement and other comprehensive income statement are shown net of all related taxes.
4. Summary of significant accounting policiesSummary of significant accounting policies have been disclosed along with the relevant individual notes in the subsequent pages.
Those accounting policies presented with each note, have been applied consistently by the Group.
Other significant accounting policies not covered with individual notes.Following accounting policies, which have been applied consistently by the Group, are considered to be significant but not covered in any other sections.
Current versus non-current classification The Group presents assets and liabilities in the statement of financial position based on current/non-current classification. An asset is current when it is:• Expected to be realised or intended to be
sold or consumed in normal operating cycle
• Held primarily for the purpose of trading
Notes to the Financial Statements
• Expected to be realised within twelve months after the reporting period, or
• Cash or cash equivalent unless restricted from being exchanged or used to settle a liability for at least twelve months after the reporting period.
All other assets are classified as non-current.
A liability is current when:• It is expected to be settled in normal
operating cycle• It is held primarily for the purpose of
trading • It is due to be settled within twelve months
after the reporting period, or• There is no unconditional right to defer the
settlement of the liability for at least twelve months after the reporting period.
The Group classifies all other liabilities as non-current.
Deferred tax assets and liabilities are classified as non-current assets and liabilities.
Foreign currency translation, foreign currency transactions and balancesThe consolidated financial statements are presented in Sri Lankan Rupees (LKR), which is the Company’s functional and presentation currency. The functional currency is the currency of the primary economic environment in which the entities of the Group operate. All foreign exchange transactions are converted to functional currency, at the rates of exchange prevailing at the time the transactions are effected. Monetary assets and liabilities denominated in foreign currency are retranslated to functional currency equivalents at the spot exchange rate prevailing at the reporting date.
Non-monetary items that are measured in terms of historical cost in a foreign currency are translated using the exchange rates as at the dates of the initial transactions. Non monetary assets and liabilities are translated using exchange rates that existed when the values were determined. The gain or loss arising on translation of non-monetary items is treated in line with the recognition of gain or loss on changing fair value of the item.
Foreign operationsThe statement of financial position and income statement of overseas subsidiaries
and joint ventures which are deemed to be foreign operations are translated to Sri Lanka rupees at the rate of exchange prevailing as at the reporting date and at the average annual rate of exchange for the period respectively.
The exchange differences arising on the translation are taken directly to other comprehensive income. On disposal of a foreign entity, the deferred cumulative amount recognised in other comprehensive income relating to that particular foreign operation is recognised in the income statement.
The Group treated goodwill and any fair value adjustments to the carrying amounts of assets and liabilities arising on the acquisition as assets and liabilities of the parent. Therefore, those assets and liabilities are non-monetary items already expressed in the functional currency of the parent and no further translation differences occur.
5. Significant accounting judgements, estimates and assumptions The preparation of the financial statements of the Group require the management to make judgments, estimates and assumptions, which may affect the amounts of income, expenditure, assets, liabilities and the disclosure of contingent liabilities, at the end of the reporting period.
Uncertainty about these assumptions and estimates could result in outcomes that require a material adjustment to the carrying amount of assets or liabilities affected in future periods. In the process of applying the Group’s accounting policies, management has made various judgements. Those which management has assessed to have the most significant effect on the amounts recognised in the consolidated financial statements have been discussed in the individual notes of the related financial statement line items.
The key assumptions concerning the future and other key sources of estimation of uncertainty at the reporting date, that have a significant risk of causing a material adjustment to the carrying amounts of assets and liabilities within the next financial year, are also described in the individual notes to the financial statements. The Group based its assumptions and estimates on parameters available when the financial statements were prepared. Existing circumstances and assumptions about future developments,

Group Highlights | Governance | Management Discussion & Analysis | Financial Statements | Supplementary Information 193
however, may change due to market changes or circumstances arising that are beyond the control of the Group. Such changes are reflected in the assumptions when they occur.
The line items which have the most significant effect on accounting, judgements, estimates and assumptions are as follows;a) Valuation of property, plant and equipment
and investment property.
b) Impairment of non-financial assetsc) Share based paymentsd) Taxese) Employee benefit liabilityf) Valuation of insurance contract liabilities
6 Standards issued but not yet effectiveThe following SLFRS have been issued by the Institute of Chartered Accountants of Sri Lanka that have an effective date
in the future and have not been applied in preparing these financial statements. Those SLFRS’s will have an effect on the accounting policies currently adopted by the Group and may have an impact on the future financial statements.
The Group intends to adopt these standards, if applicable, when they become effective.
Accounting Standard
Summary of the Requirements Effective Date
Possible Impact on Consolidated Financial Statements
SLFRS 9 - Financial Instruments
SLFRS 9 replaces the existing standard LKAS 39 Financial Instruments: Recognition and Measurement. SLFRS 9 includes revised guidance on the classification and measurement of financial instruments, a new expected credit loss model for calculating impairment on financial assets and new general hedge accounting requirements. It also carries forward the guidance on recognition and derecognition of financial instruments from LKAS 39.
On or after 1 January 2018 (early adoption permitted)
The Group has performed a high-level impact assessment of all aspects of SLFRS 9. This preliminary assessment is based on currently available information and may be subjected to changes arising from further detailed analysis or additional reasonable and supportable information being made available to the Group in the future. Overall, the Group expects no significant impact on its financial position and equity.
SLFRS 15 - Revenue from Contracts with Customers
SLFRS 15 establishes a comprehensive framework for determining whether, how much and when revenue is recognised. It replaces existing revenue recognition standard and guidance, including LKAS 18 Revenue, LKAS 11 Construction Contracts and IFRIC 13 Customer Loyalty Programmes
On or after 1 January 2018 (early adoption permitted)
The Group completed a diagnostic phase of SLFRS 15 adaptation in 2016/17 financial year, with the assistance of external consultants. The Group's current study has not revealed a significant change to the revenue recognition patterns. However, the gaps identified will be addressed during 2017/18 financial year, and any impact to the current systems and processes will be modified where necessary.
SLFRS 16 - Leases SLFRS 16 sets out the principles for the recognition, measurement, presentation and disclosure of leases and requires lessees to account for all leases under a single on-balance sheet model similar to the accounting for finance leases under LKAS 17. The objective is to ensure that lessees and lessors provide relevant information in a manner that faithfully represents those transactions. This information gives a basis for the users of financial statements to assess the effect that leases have on the financial position.
On or after 1 January 2019 (early adoption permitted)
The Group plans to assess the potential effect of SLFRS 16 on its consolidated financial statements in the financial year 2017/18.
IFRIC 15 - Agreements for the construction of real estate (Deferring Application)
This interpretation clarifies whether LKAS 18, ‘Revenue’ or LKAS 11 ‘Construction contracts’ should be applied to particular transactions. It also explains the point at which revenue and related expenses from a sale of real estate unit should be recognised, if an agreement between a developer and a buyer is reached before the construction of the real estate unit is completed.
Deferred application until SLFRS 15 Revenue from Contracts with Customers comes into effect
Considering the latest developments in revenue recognition (the "five-step model"), the Institute of Chartered Accountants of Sri Lanka has decided to grant an option for entities to defer application of IFRIC 15 until SLFRS 15 Revenue from Contracts with Customers comes into effect. The Group has not adopted IFRIC 15 which is related to recognition of revenue of construction of real estate. The Group has deferred application of this IFRIC based on the ruling issued by CA Sri Lanka.
The following amendments and improvements are not expected to have a significant impact on the Group's financial statements• Accounting for Acquisitions of Interests in Joint Operations (Amendments to SLFRS11)• Clarification of Acceptable Methods of Depreciation and Amortisation (Amendments to LKAS 16 and LKAS 38)• Equity Method in Separate Financial Statements (Amendments to LKAS 27)• Sale or Contribution of Assets between an Investor and its Associate or Joint Venture (Amendments to SLFRS 10 and LKAS 28)• Annual Improvements to SLFRSs 2012–2014 Cycle – various standards• Investment Entities: Applying the Consolidation Exception (Amendments to SLFRS 10, SLFRS 12 and LKAS 28)• Disclosure Initiative (Amendments to LKAS 1)

194 John Keells Holdings PLC | Annual Report 2016/17
7.1. Business segments
Transportation Leisure Property Consumer Foods & Retail Financial Services Information Technology Others Group Total
For the year ended 31 March 2017 2016 2017 2016 2017 2016 2017 2016 2017 2016 2017 2016 2017 2016 2017 2016
In LKR '000s
External revenue 11,109,677 10,342,226 25,873,790 24,072,746 1,121,204 4,341,714 45,812,242 36,886,260 8,296,409 7,142,880 11,107,277 8,261,542 2,952,502 2,662,586 106,273,101 93,709,954
Inter segment revenue 365,421 278,657 27,325 34,540 206,678 197,500 363,698 290,419 110 1 221,044 193,315 767,899 700,966 1,952,175 1,695,398
Total segment revenue 11,475,098 10,620,883 25,901,115 24,107,286 1,327,882 4,539,214 46,175,940 37,176,679 8,296,519 7,142,881 11,328,321 8,454,857 3,720,401 3,363,552 108,225,276 95,405,352
Elimination of inter segment revenue (1,952,175) (1,695,398)
Net revenue 106,273,101 93,709,954
Segment results 2,652,278 560,242 5,713,936 5,028,273 540,625 1,620,032 5,146,899 4,322,498 935,269 717,323 (571,917) (334,221) (2,078,119) (1,681,060) 12,338,971 10,233,087
Finance cost (25,488) (21,813) (203,544) (165,587) (25,858) (32,162) (19,318) (25,026) (194) (193) (9,770) (12,657) (135,060) (134,283) (419,232) (391,721)
Finance income 117,449 90,903 458,531 309,305 93,077 172,055 251,544 159,956 187,201 121,088 49,434 43,588 5,559,911 4,652,409 6,717,147 5,549,304
Change in fair value of investment property - - - - 290,341 148,250 92,005 16,947 - - - - 101,208 97,678 483,554 262,875
Share of results of equity accounted investees 2,274,792 1,868,769 53,473 52,110 - - - 974,690 860,354 - - - - 3,302,955 2,781,233
Eliminations / adjustments (1,920,821) (2,940) (301,526) (255,771) (233,629) (265,213) (4,720) (1,925) - - 1,143,772 451,588 1,781,362 837,714 464,438 763,453
Profit / (loss) before tax 3,098,210 2,495,161 5,720,870 4,968,330 664,556 1,642,962 5,466,410 4,472,450 2,096,966 1,698,572 611,519 148,298 5,229,302 3,772,458 22,887,833 19,198,231
Tax expense (119,057) (40,738) (713,304) (601,123) (41,058) (57,793) (1,570,344) (1,243,488) (55,140) 19,264 (143,373) (52,572) (2,128,792) (1,429,916) (4,771,068) (3,406,366)
Profit/ (loss) for the year 2,979,153 2,454,423 5,007,566 4,367,207 623,498 1,585,169 3,896,066 3,228,962 2,041,826 1,717,836 468,146 95,726 3,100,510 2,342,542 18,116,765 15,791,865
Purchase and construction of PPE* 95,716 95,190 1,275,820 2,757,569 36,369 43,055 2,682,990 1,454,411 67,965 25,470 139,532 113,369 33,190 93,000 4,331,582 4,582,064
Addition to IA* 9,176 2,398 - 103,373 2,240 1,386 18,471 1,929 62,807 29,239 14,957 20,088 6,747 4,195 114,398 162,608
Depreciation of PPE* 101,630 87,953 1,588,847 1,546,807 18,589 14,395 830,197 736,013 80,210 89,363 122,090 179,518 132,508 128,266 2,874,071 2,782,315
Amortisation of IA* 1,975 1,278 67,092 54,764 661 1,211 11,789 11,892 220,609 217,437 11,153 10,323 19,767 23,659 333,046 320,564
Amortisation of LRPA* - - 569,140 712,950 20,307 24,282 2,361 - - - - - 1,175 1,175 592,983 738,407
Gratuity provision and related costs 13,946 12,020 114,363 102,066 3,273 2,939 91,621 73,365 24,678 24,110 20,138 18,594 59,614 50,806 327,633 283,900
In addition to segment results, information such as finance costs / income, tax expenses have been allocated to segments for better presentation.* PPE - Property, plant and equipment, IA - Intangible assets, LRPA - Lease rentals paid in advance
GROUP BUSINESS, OPERATIONS & MANAGEMENT
7. Operating segment information Accounting policy The Group’s internal organisation and management is structured based on individual products and services which are similar in nature and process and where the risks and returns are similar. The operating segments represent this business structure.
In addition, segments are determined based on the Group’s geographical spread of operations as well. The geographical analysis of turnover and profits are based on location of customers and assets respectively.
Notes to the Financial Statements
The activities of each of the operating business segments of the Group are detailed in the Group directory in the Supplementary section of the Annual report.
As such for management purposes, the Group is organised into business units based on their products and services and has seven operating business segments as follows:
TransportationBusiness of the transportation operating segment offers an array of transportation related services in Sri Lanka and the region and these operations comprise of South Asia Gateway Terminals (Pvt) Ltd in the port of Colombo, a marine bunkering business, joint
ventures/associations with leading shipping and air transportation multinationals and logistics, travel and airline services in Sri Lanka, India and the Maldives.
LeisureThe leisure operating segment encompasses two five star city hotels and a three star city hotel in Colombo and eight resort hotels spread in prime tourist locations across Sri Lanka and three resorts in Maldives offering beaches, mountains, wildlife and cultural splendour under the ‘Cinnamon Hotels and Resorts’ brand. The leisure operating segment also has destination management businesses in Sri Lanka and India.

Group Highlights | Governance | Management Discussion & Analysis | Financial Statements | Supplementary Information 195
PropertyThe property operating segment concentrates primarily on development and sale of residential apartments.
Consumer Foods and RetailThe consumer foods and retail operating segment competes in the two major categories namely manufacturing and retailing.
Financial ServicesThe financial services operating segment offers a complete range of financial solutions including commercial banking, insurance, stock broking, debt trading, fund management and leasing.
Information TechnologyThe information technology operating segment comprises from BPO, software services and information integration to
office automation which offers end-to-end ICT services and solutions.
OthersThis operating segment includes plantation services sector which operates tea factories, tea and rubber broking and pre-auction produce warehousing. This segment also consists of John Keells Holdings PLC including its divisions / centre functions such as John Keells Capital and Strategic Group IT (SGIT), as well as other companies providing ancillary services.
Segment information has been prepared in conformity with the accounting policies adopted for preparing and presenting the consolidated financial statements of the Group.
No operating segments have been aggregated to form the reportable operating
segments. An individual segment manager is determined for each operating segment and the results are regularly reviewed by the Board of Directors. The Board of Directors monitors the operating results of its business units separately for the purpose of making decisions about resource allocation and performance assessment. Segment performance is evaluated based on operating profit or loss which in certain respects, as explained in the operating segments’ information, is measured differently from operating profit or loss in the consolidated financial statements. However, except the Financial Services segment, other segments’ financing activities are managed on a Group basis and are not allocated to operating segments. Transfer prices between operating segments are carried out in the ordinary course of business on arm’s length basis.
7.1. Business segments
Transportation Leisure Property Consumer Foods & Retail Financial Services Information Technology Others Group Total
For the year ended 31 March 2017 2016 2017 2016 2017 2016 2017 2016 2017 2016 2017 2016 2017 2016 2017 2016
In LKR '000s
External revenue 11,109,677 10,342,226 25,873,790 24,072,746 1,121,204 4,341,714 45,812,242 36,886,260 8,296,409 7,142,880 11,107,277 8,261,542 2,952,502 2,662,586 106,273,101 93,709,954
Inter segment revenue 365,421 278,657 27,325 34,540 206,678 197,500 363,698 290,419 110 1 221,044 193,315 767,899 700,966 1,952,175 1,695,398
Total segment revenue 11,475,098 10,620,883 25,901,115 24,107,286 1,327,882 4,539,214 46,175,940 37,176,679 8,296,519 7,142,881 11,328,321 8,454,857 3,720,401 3,363,552 108,225,276 95,405,352
Elimination of inter segment revenue (1,952,175) (1,695,398)
Net revenue 106,273,101 93,709,954
Segment results 2,652,278 560,242 5,713,936 5,028,273 540,625 1,620,032 5,146,899 4,322,498 935,269 717,323 (571,917) (334,221) (2,078,119) (1,681,060) 12,338,971 10,233,087
Finance cost (25,488) (21,813) (203,544) (165,587) (25,858) (32,162) (19,318) (25,026) (194) (193) (9,770) (12,657) (135,060) (134,283) (419,232) (391,721)
Finance income 117,449 90,903 458,531 309,305 93,077 172,055 251,544 159,956 187,201 121,088 49,434 43,588 5,559,911 4,652,409 6,717,147 5,549,304
Change in fair value of investment property - - - - 290,341 148,250 92,005 16,947 - - - - 101,208 97,678 483,554 262,875
Share of results of equity accounted investees 2,274,792 1,868,769 53,473 52,110 - - - 974,690 860,354 - - - - 3,302,955 2,781,233
Eliminations / adjustments (1,920,821) (2,940) (301,526) (255,771) (233,629) (265,213) (4,720) (1,925) - - 1,143,772 451,588 1,781,362 837,714 464,438 763,453
Profit / (loss) before tax 3,098,210 2,495,161 5,720,870 4,968,330 664,556 1,642,962 5,466,410 4,472,450 2,096,966 1,698,572 611,519 148,298 5,229,302 3,772,458 22,887,833 19,198,231
Tax expense (119,057) (40,738) (713,304) (601,123) (41,058) (57,793) (1,570,344) (1,243,488) (55,140) 19,264 (143,373) (52,572) (2,128,792) (1,429,916) (4,771,068) (3,406,366)
Profit/ (loss) for the year 2,979,153 2,454,423 5,007,566 4,367,207 623,498 1,585,169 3,896,066 3,228,962 2,041,826 1,717,836 468,146 95,726 3,100,510 2,342,542 18,116,765 15,791,865
Purchase and construction of PPE* 95,716 95,190 1,275,820 2,757,569 36,369 43,055 2,682,990 1,454,411 67,965 25,470 139,532 113,369 33,190 93,000 4,331,582 4,582,064
Addition to IA* 9,176 2,398 - 103,373 2,240 1,386 18,471 1,929 62,807 29,239 14,957 20,088 6,747 4,195 114,398 162,608
Depreciation of PPE* 101,630 87,953 1,588,847 1,546,807 18,589 14,395 830,197 736,013 80,210 89,363 122,090 179,518 132,508 128,266 2,874,071 2,782,315
Amortisation of IA* 1,975 1,278 67,092 54,764 661 1,211 11,789 11,892 220,609 217,437 11,153 10,323 19,767 23,659 333,046 320,564
Amortisation of LRPA* - - 569,140 712,950 20,307 24,282 2,361 - - - - - 1,175 1,175 592,983 738,407
Gratuity provision and related costs 13,946 12,020 114,363 102,066 3,273 2,939 91,621 73,365 24,678 24,110 20,138 18,594 59,614 50,806 327,633 283,900
In addition to segment results, information such as finance costs / income, tax expenses have been allocated to segments for better presentation.* PPE - Property, plant and equipment, IA - Intangible assets, LRPA - Lease rentals paid in advance

196 John Keells Holdings PLC | Annual Report 2016/17
7. Operating segment information (Contd.)
7.2. Business segments Transportation Leisure Property Consumer Foods & Retail Financial Services Information Technology Others Group Total
As at 31 March 2017 2016 2017 2016 2017 2016 2017 2016 2017 2016 2017 2016 2017 2016 2017 2016
In LKR '000s
Property, plant and equipment 500,463 477,027 43,251,774 34,059,483 2,318,107 2,308,494 9,290,844 7,283,463 1,498,964 1,514,336 260,153 246,979 1,287,795 1,317,211 58,408,100 47,206,993 Lease rentals paid in advance - - 11,495,184 9,330,503 245,301 248,040 174,701 - - - - - 40,679 41,854 11,955,865 9,620,397 Investment property 487,000 425,000 2,148,400 1,905,000 5,230,949 4,853,668 207,042 111,404 - - - - 3,434,063 3,215,185 11,507,454 10,510,257 Intangible assets 14,072 6,871 374,191 441,284 2,963 363 37,685 80,504 891,546 999,848 28,305 25,553 30,802 44,841 1,379,564 1,599,264 Non-current financial assets 74,073 48,539 5,710,380 5,507,782 432,679 224,930 226,097 165,973 23,645,619 21,441,579 57,131 30,666 2,827,038 546,718 32,973,017 27,966,187 Other non-current assets 11,163 5,892 25,343 14,673 41,379,103 35,451,293 553,357 376,324 51,378 51,369 15,994 5,496 21,603 17,727 42,057,941 35,922,774 Segment non-current assets 1,086,771 963,329 63,005,272 51,258,725 49,609,102 43,086,788 10,489,726 8,017,668 26,087,507 24,007,132 361,583 308,694 7,641,980 5,183,536 158,281,941 132,825,872
Investments in equity accounted investees 11,118,544 11,263,337 512,143 474,364 - - - - 6,088,200 5,211,763 - - - - 17,718,887 16,949,464 Deferred tax assets 143,548 129,837 Goodwill 738,596 738,596 Eliminations / adjustments (4,574,829) (4,531,077) Total non-current assets 172,308,143 146,112,692
Inventories 522,461 161,484 337,494 307,040 15,255 294,659 3,840,380 2,996,410 14,966 8,672 676,063 701,831 217,483 208,408 5,624,102 4,678,504 Trade and other receivables 1,685,506 1,028,910 3,474,959 3,144,535 941,864 1,435,139 2,720,088 2,268,819 1,415,290 731,550 1,938,636 2,044,672 1,084,448 1,012,242 13,260,791 11,665,867 Short term investments 2,053,279 1,943,880 8,188,744 5,734,333 987,176 339,545 553,219 2,350,084 9,318,833 6,496,141 994,577 726,511 60,565,974 57,095,945 82,661,802 74,686,439 Cash in hand and at bank 290,699 741,739 2,198,542 2,310,577 973,122 1,046,241 232,360 241,991 336,648 272,029 580,119 235,716 456,679 276,798 5,068,169 5,125,091 Segment current assets 4,551,945 3,876,013 14,199,739 11,496,485 2,917,417 3,115,584 7,346,047 7,857,304 11,085,737 7,508,392 4,189,395 3,708,730 62,324,584 58,593,393 106,614,864 96,155,901
Other current assets 3,265,327 2,303,431 Eliminations / adjustments (4,916,572) (3,596,555) Total current assets 104,963,619 94,862,777
Total assets 277,271,762 240,975,469
Insurance contract liabilities - - - - - - - - 31,700,278 27,205,282 - - - - 31,700,278 27,205,282 Interest-bearing loans and borrowings - - 6,650,926 7,376,034 12,548,001 11,360,684 289,896 98,793 - - - 9,621 12,000 192,458 19,500,823 19,037,590 Employee benefit liabilities 84,859 73,018 638,131 562,241 29,435 44,788 549,079 463,598 138,656 129,058 106,889 91,931 333,238 296,246 1,880,287 1,660,880 Other deferred liabilities 1,640 - 120,007 84,401 558,435 560,220 55,490 26,336 - - - - 103,991 191,516 839,563 862,473 Other non-current liabilities 10,267 - - 78,418 3,730,151 2,884,834 193,464 131,929 - - - - - - 3,933,882 3,095,181 Segment non-current liabilities 96,766 73,018 7,409,064 8,101,094 16,866,022 14,850,526 1,087,929 720,656 31,838,934 27,334,340 106,889 101,552 449,229 680,220 57,854,833 51,861,406
Deferred tax liabilities 2,336,241 2,029,371 Eliminations / adjustments (5,298,859) (5,331,413) Total non-current liabilities 54,892,215 48,559,364
Trade and other payables 847,988 1,198,528 2,074,128 3,341,897 1,382,676 1,604,938 5,293,347 4,503,394 1,955,235 1,254,729 1,994,141 1,694,604 768,391 734,477 14,315,906 14,332,567 Short term borrowings 1,389,643 830,648 3,487,404 2,051,370 - - - - - - - - 12,074 12,074 4,889,121 2,894,092 Interest-bearing loans and borrowings - - 2,662,075 1,208,978 181,645 145,778 65,000 119,073 - - 10,134 35,244 - 1,482,508 2,918,854 2,991,581 Bank overdrafts 374,011 56,533 1,847,574 1,217,688 709,561 843,340 766,477 594,225 137,849 105,834 338,122 293,649 90,515 118,912 4,264,109 3,230,181 Segment current liabilities 2,611,642 2,085,709 10,071,181 7,819,933 2,273,882 2,594,056 6,124,824 5,216,692 2,093,084 1,360,563 2,342,397 2,023,497 870,980 2,347,971 26,387,990 23,448,421
Income tax liabilities 2,395,379 1,873,472 Other current liabilities 2,944,118 2,234,856 Eliminations / adjustments (3,678,315) (3,620,966) Total current liabilities 28,049,172 23,935,783
Total liabilities 82,941,387 72,495,147
Total segment assets 5,638,716 4,839,342 77,205,011 62,755,210 52,526,519 46,202,372 17,835,773 15,874,972 37,173,244 31,515,524 4,550,978 4,017,424 69,966,564 63,776,929 264,896,805 228,981,773 Total segment liabilities 2,708,408 2,158,727 17,480,245 15,921,027 19,139,904 17,444,582 7,212,753 5,937,348 33,932,018 28,694,903 2,449,286 2,125,049 1,320,209 3,028,191 84,242,823 75,309,827
Notes to the Financial Statements

Group Highlights | Governance | Management Discussion & Analysis | Financial Statements | Supplementary Information 197
7. Operating segment information (Contd.)
7.2. Business segments Transportation Leisure Property Consumer Foods & Retail Financial Services Information Technology Others Group Total
As at 31 March 2017 2016 2017 2016 2017 2016 2017 2016 2017 2016 2017 2016 2017 2016 2017 2016
In LKR '000s
Property, plant and equipment 500,463 477,027 43,251,774 34,059,483 2,318,107 2,308,494 9,290,844 7,283,463 1,498,964 1,514,336 260,153 246,979 1,287,795 1,317,211 58,408,100 47,206,993 Lease rentals paid in advance - - 11,495,184 9,330,503 245,301 248,040 174,701 - - - - - 40,679 41,854 11,955,865 9,620,397 Investment property 487,000 425,000 2,148,400 1,905,000 5,230,949 4,853,668 207,042 111,404 - - - - 3,434,063 3,215,185 11,507,454 10,510,257 Intangible assets 14,072 6,871 374,191 441,284 2,963 363 37,685 80,504 891,546 999,848 28,305 25,553 30,802 44,841 1,379,564 1,599,264 Non-current financial assets 74,073 48,539 5,710,380 5,507,782 432,679 224,930 226,097 165,973 23,645,619 21,441,579 57,131 30,666 2,827,038 546,718 32,973,017 27,966,187 Other non-current assets 11,163 5,892 25,343 14,673 41,379,103 35,451,293 553,357 376,324 51,378 51,369 15,994 5,496 21,603 17,727 42,057,941 35,922,774 Segment non-current assets 1,086,771 963,329 63,005,272 51,258,725 49,609,102 43,086,788 10,489,726 8,017,668 26,087,507 24,007,132 361,583 308,694 7,641,980 5,183,536 158,281,941 132,825,872
Investments in equity accounted investees 11,118,544 11,263,337 512,143 474,364 - - - - 6,088,200 5,211,763 - - - - 17,718,887 16,949,464 Deferred tax assets 143,548 129,837 Goodwill 738,596 738,596 Eliminations / adjustments (4,574,829) (4,531,077) Total non-current assets 172,308,143 146,112,692
Inventories 522,461 161,484 337,494 307,040 15,255 294,659 3,840,380 2,996,410 14,966 8,672 676,063 701,831 217,483 208,408 5,624,102 4,678,504 Trade and other receivables 1,685,506 1,028,910 3,474,959 3,144,535 941,864 1,435,139 2,720,088 2,268,819 1,415,290 731,550 1,938,636 2,044,672 1,084,448 1,012,242 13,260,791 11,665,867 Short term investments 2,053,279 1,943,880 8,188,744 5,734,333 987,176 339,545 553,219 2,350,084 9,318,833 6,496,141 994,577 726,511 60,565,974 57,095,945 82,661,802 74,686,439 Cash in hand and at bank 290,699 741,739 2,198,542 2,310,577 973,122 1,046,241 232,360 241,991 336,648 272,029 580,119 235,716 456,679 276,798 5,068,169 5,125,091 Segment current assets 4,551,945 3,876,013 14,199,739 11,496,485 2,917,417 3,115,584 7,346,047 7,857,304 11,085,737 7,508,392 4,189,395 3,708,730 62,324,584 58,593,393 106,614,864 96,155,901
Other current assets 3,265,327 2,303,431 Eliminations / adjustments (4,916,572) (3,596,555) Total current assets 104,963,619 94,862,777
Total assets 277,271,762 240,975,469
Insurance contract liabilities - - - - - - - - 31,700,278 27,205,282 - - - - 31,700,278 27,205,282 Interest-bearing loans and borrowings - - 6,650,926 7,376,034 12,548,001 11,360,684 289,896 98,793 - - - 9,621 12,000 192,458 19,500,823 19,037,590 Employee benefit liabilities 84,859 73,018 638,131 562,241 29,435 44,788 549,079 463,598 138,656 129,058 106,889 91,931 333,238 296,246 1,880,287 1,660,880 Other deferred liabilities 1,640 - 120,007 84,401 558,435 560,220 55,490 26,336 - - - - 103,991 191,516 839,563 862,473 Other non-current liabilities 10,267 - - 78,418 3,730,151 2,884,834 193,464 131,929 - - - - - - 3,933,882 3,095,181 Segment non-current liabilities 96,766 73,018 7,409,064 8,101,094 16,866,022 14,850,526 1,087,929 720,656 31,838,934 27,334,340 106,889 101,552 449,229 680,220 57,854,833 51,861,406
Deferred tax liabilities 2,336,241 2,029,371 Eliminations / adjustments (5,298,859) (5,331,413) Total non-current liabilities 54,892,215 48,559,364
Trade and other payables 847,988 1,198,528 2,074,128 3,341,897 1,382,676 1,604,938 5,293,347 4,503,394 1,955,235 1,254,729 1,994,141 1,694,604 768,391 734,477 14,315,906 14,332,567 Short term borrowings 1,389,643 830,648 3,487,404 2,051,370 - - - - - - - - 12,074 12,074 4,889,121 2,894,092 Interest-bearing loans and borrowings - - 2,662,075 1,208,978 181,645 145,778 65,000 119,073 - - 10,134 35,244 - 1,482,508 2,918,854 2,991,581 Bank overdrafts 374,011 56,533 1,847,574 1,217,688 709,561 843,340 766,477 594,225 137,849 105,834 338,122 293,649 90,515 118,912 4,264,109 3,230,181 Segment current liabilities 2,611,642 2,085,709 10,071,181 7,819,933 2,273,882 2,594,056 6,124,824 5,216,692 2,093,084 1,360,563 2,342,397 2,023,497 870,980 2,347,971 26,387,990 23,448,421
Income tax liabilities 2,395,379 1,873,472 Other current liabilities 2,944,118 2,234,856 Eliminations / adjustments (3,678,315) (3,620,966) Total current liabilities 28,049,172 23,935,783
Total liabilities 82,941,387 72,495,147
Total segment assets 5,638,716 4,839,342 77,205,011 62,755,210 52,526,519 46,202,372 17,835,773 15,874,972 37,173,244 31,515,524 4,550,978 4,017,424 69,966,564 63,776,929 264,896,805 228,981,773 Total segment liabilities 2,708,408 2,158,727 17,480,245 15,921,027 19,139,904 17,444,582 7,212,753 5,937,348 33,932,018 28,694,903 2,449,286 2,125,049 1,320,209 3,028,191 84,242,823 75,309,827

198 John Keells Holdings PLC | Annual Report 2016/17
Notes to the Financial Statements
7. Operating segment information (Contd.)
7.3. Geographical segments, based on the location of assets
Sri Lanka Asia (excluding Sri Lanka)
Others Group Total
2017 2016 2017 2016 2017 2016 2017 2016
In LKR '000s
Segment assets 235,720,710 202,856,785 27,414,975 23,161,826 1,761,120 2,963,162 264,896,805 228,981,773
Segment liabilities 71,369,556 65,998,618 12,855,813 9,271,496 17,454 39,713 84,242,823 75,309,827
Investments in equity accounted investees
17,718,887 16,949,464 - - - - 17,718,887 16,949,464
Segment revenue 98,692,457 86,272,881 7,580,644 7,426,567 - 10,506 106,273,101 93,709,954
Segment results 12,093,968 9,655,632 858,550 756,822 (613,547) (179,367) 12,338,971 10,233,087
Purchase and construction of property, plant and equipment
3,823,767 3,415,006 505,004 1,167,058 2,811 - 4,331,582 4,582,064
Purchase and construction of intangible assets
114,398 162,608 - - - - 114,398 162,608
Purchase of lease rental paid in advance
177,062 - 2,479,950 607,155 - - 2,657,012 607,155
Depreciation of property, plant and equipment
2,471,879 2,294,367 402,062 484,523 130 3,425 2,874,071 2,782,315
Amortisation of intangible assets 333,046 320,564 - - - - 333,046 320,564
Amortisation of lease rental paid in advance
39,241 40,854 553,742 697,553 - - 592,983 738,407
Gratuity provision and related costs
326,106 280,784 1,527 3,116 - - 327,633 283,900
7.4. Business segment analysis
Group
2017 2016
In LKR '000s Sale ofgoods
Renderingof services
Totalrevenue
Sale ofgoods
Renderingof services
Totalrevenue
Transportation 10,275,518 834,159 11,109,677 9,660,391 681,835 10,342,226
Leisure - 25,873,790 25,873,790 - 24,072,746 24,072,746
Property 587,363 533,841 1,121,204 3,758,466 583,248 4,341,714
Consumer Foods & Retail 45,812,242 - 45,812,242 36,886,260 - 36,886,260
Financial Services - 8,296,409 8,296,409 - 7,142,880 7,142,880
Information Technology 9,250,749 1,856,528 11,107,277 6,390,265 1,871,277 8,261,542
Others 2,312,330 640,172 2,952,502 1,912,842 749,744 2,662,586
Group revenue 68,238,202 38,034,899 106,273,101 58,608,224 35,101,730 93,709,954
7.5. Geographical segment analysis (by location of customers)
Group
2017 2016
In LKR '000s
Sri Lanka 81,776,854 71,940,772
Asia (excluding Sri Lanka) 9,225,727 10,266,229
Europe 9,667,726 8,198,612
Others 5,602,794 3,304,341
Total Group external revenue 106,273,101 93,709,954

Group Highlights | Governance | Management Discussion & Analysis | Financial Statements | Supplementary Information 199
8. Basis of consolidation and material partly owned subsidiaries Accounting policyBasis of consolidationThe consolidated financial statements are comprised of the financial statements of the Company and its subsidiaries as at the end of reporting period. Control over an investee is achieved when the Group is exposed, or has rights, to variable returns from its involvement with the investee and has the ability to affect those returns through its power over the investee.
Control over an investee Specifically, the Group controls an investee if, and only if, the Group has:
• Power over the investee (i.e., existing rights that give it the current ability to direct the relevant activities of the investee)
• Exposure, or rights, to variable returns from its involvement with the investee
• The ability to use its power over the investee to affect its returns
Consolidation of entities in which the Group holds less than a majority of voting rightsWhen the Group has less than a majority of the voting or similar rights of an investee, the Group considers all relevant facts and circumstances in assessing whether it has power over an investee, including:
• The contractual arrangement with the other vote holders of the investee;
• Rights arising from other contractual arrangements and;
• The Group’s voting rights and potential voting rights
Subsidiaries that are consolidated have been listed in the Group directory under Supplementary section of the annual report.
The following companies, with equity control equal to or less than 50%, have been consolidated as subsidiaries based on above criteria.
%Holding
Rajawella Holdings Ltd. 49.85
Trans-ware Logistics (Pvt) Ltd. 50.00
Mack Air Services Maldives (Pte) Ltd.
49.00
Tea Smallholder Factories PLC. 37.62
The Group re-assesses whether or not it controls an investee, if facts and circumstances indicate that there are changes to one or more of the three elements of control. Consolidation of a subsidiary begins when the Group obtains control over the subsidiary and ceases when the Group loses control of the subsidiary. Assets, liabilities, income and expenses of a subsidiary acquired or disposed of during the year are included in the consolidated financial statements from the date the Group gains control until the date the Group ceases to control the subsidiary.
Profit or loss and each component of other comprehensive income (OCI) are attributed to the equity holders of the parent of the Group and to the non-controlling interests, even if this results in the non-controlling interests having a deficit balance. The financial statements of the subsidiaries are prepared for the same reporting period as the parent Company, which is
12 months ending 31 March, using consistent accounting policies.
Transactions eliminated on consolidation All intra-group assets, liabilities, equity, income, expenses and cash flows relating to transactions between members of the Group are eliminated in full on consolidation. A change in the ownership interest of a subsidiary, without a loss of control, is accounted for as an equity transaction.
Loss of controlIf the Group loses control over a subsidiary, it derecognises the related assets (including goodwill), liabilities, non-controlling interest and other components of equity while any resultant gain or loss is recognised in the income statement. Any investment retained is recognised at fair value.
The total profits and losses for the year of the Company and of its subsidiaries included in consolidation are shown in the consolidated income statement and consolidated statement of comprehensive income and all assets and liabilities of the Company and of its subsidiaries included in consolidation are shown in the consolidated statement of financial position.
Non-controlling interest (NCI) Non-controlling interest which represents the portion of profit or loss and net assets not held by the Group, are shown as a component of profit for the year in the consolidated income statement and statement of comprehensive income and as a component of equity in the consolidated statement of financial position, separately from equity attributable to the shareholders of the parent.
8.1. Material partly-owned subsidiaries
Financial information of subsidiaries that have material non-controlling interests (NCI) are provided below.
Leisure Consumer Foods & RetailFor the year ended 31 March 2017 2016 2017 2016
In LKR '000s
Summarised Income Statement for the period ending 31 MarchRevenue 28,134,885 26,829,126 46,834,239 37,366,674 Operating cost (20,438,667) (20,789,711) (40,941,279) (33,046,101)Finance cost (367,870) (307,424) (19,318) (25,026)Finance income 622,856 451,141 251,544 159,956 Change in fair value of investment property 243,400 126,100 92,005 16,947 Profit before tax 8,194,604 6,309,232 6,217,191 4,472,450 Tax expense (715,716) (603,455) (1,570,344) (1,243,488)Profit for the year 7,478,888 5,705,777 4,646,847 3,228,962 Other comprehensive income 9,968,550 690,444 209,357 70,066 Total comprehensive income 17,447,438 6,396,221 4,856,204 3,299,028
Profit/(loss) allocated to material NCI 842,273 682,783 730,983 574,321
Dividend paid to NCI 1,016,875 906,513 717,319 400,602
The above information is based on amounts before inter-company eliminations

200 John Keells Holdings PLC | Annual Report 2016/17
Notes to the Financial Statements
8. Basis of consolidation and material partly owned subsidiaries (Contd.)
8.1. Material partly-owned subsidiaries (Contd.)
Leisure Consumer foods & retail
For the year ended 31 March 2017 2016 2017 2016
In LKR '000s
Summarised statement of Financial Position as at 31 March
Current assets 15,147,953 11,368,244 8,033,574 8,098,607
Non-current assets 79,431 66,812,284 17,620,783 14,829,369
Total assets 15,227,384 78,180,528 25,654,357 22,927,976
Current liabilities 11,472,392 8,360,308 7,822,565 6,570,597
Non-current liabilities 8,055,181 8,586,091 2,275,496 1,656,754
Total liabilities 19,527,573 16,946,399 10,098,061 8,227,351
Accumulated balances of material NCI 12,680,462 11,022,992 2,351,519 2,287,966
Summarised cash flow information for year ended 31 March
Cash flows from operating activities 12,072,010 5,750,329 4,977,847 5,175,631
Cash flows from/(used in) investing activities (2,900,274) (2,154,749) (3,066,146) (1,415,285)
Cash flows from/(used in) financing activities (5,534,896) (4,067,811) (3,891,090) (2,465,962)
Net increase / (decrease) in cash and cash equivalents 3,636,840 (472,231) (1,979,389) 1,294,384
The above information is based on amounts before inter-company eliminations
Names of material partly-owned subsidiaries and effective holding percentage owned by non-controling interest:
LeisureAhungalle Holiday Resorts (Pvt) Ltd. - 19.68% (2016 - 19.68%)Asian Hotels & Properties PLC. - 21.44% (2016 - 21.44%)Beruwala Holiday Resorts (Pvt) Ltd. - 20.22% (2016 - 20.22%)Ceylon Holiday Resorts Ltd. - 20.76% (2016 - 20.76%)Cinnamon Holidays (Pvt) Ltd. - 19.68% (2016 - 19.68%)Fantasea World Investments (Pte) Ltd. - 19.68% (2016 - 19.68%)Habarana Lodge Ltd. - 21.01% (2016 - 21.01%)Habarana Walk Inn Ltd. - 20.66% (2016 - 20.66%)Hikkaduwa Holiday Resorts (Pvt) Ltd. - 20.76% (2016 - 20.76%)International Tourists and Hoteliers Ltd. - 20.22% (2016-20.22%)John Keells Hotels PLC. - 19.68% (2016 - 19.68%)John Keells Maldivian Resorts (Pte) Ltd. - 19.68% (2016 - 19.68%)Kandy Walk Inn Ltd. - 20.97% (2016 - 20.97%)Nuwara Eliya Holiday Resorts (Pvt) Ltd. - 19.68% (2016 - 19.68%)
Rajawella Hotels Company Ltd. - 19.68% (2016 - 19.68%) Resort Hotels Ltd. - 20.76% (2016 - 20.75%) Serene Holidays (Pvt) Ltd. - 1.26% (2016 - 1.26%) Tranquility (Pte) Ltd. - 19.68% (2016 - 19.68%) Trinco Walk Inn Ltd. - 19.68%c (2016 - 19.68%) Trans Asia Hotels PLC. - 17.26% (2016 - 17.26%) Travel Club (Pte) Ltd. - 19.68% (2016 - 19.68%) Trinco Holiday Resorts (Pvt) Ltd. - 19.68% (2016 - 19.68%) Walkers Tours Ltd. - 1.49% (2016 - 1.49%) Wirawila Walk Inn Ltd. - 19.68% (2016 - 19.68%) Yala Village (Pvt) Ltd. - 24.67% (2016 - 24.67%)
Consumer Foods & RetailCeylon Cold Stores PLC. - 18.64% (2016 - 18.64%) JayKay Marketing Services (Pvt) Ltd. - 18.64% (2016 - 18.64%)Keells Food Products PLC. - 11.47% (2016 - 10.35%)The Colombo Ice Company (Pvt) Ltd. - 18.64% (2016 - N/A)
Accounting judgements,estimates and assumptionsConsolidation of entities in which the Group holds less than a majority of voting right (de facto control) The Group considers that it controls some subsidiaries even though it owns less than 50% of the voting rights. This is because the
Group is the single largest shareholder of those subsidiaries with equity interest. The remaining equity shares in those subsidiaries are widely held by many other shareholders, and there is no history of the other shareholders collaborating to exercise their votes collectively or to outvote the Group.
Considering the Group balances, none of the individual partly-owned subsidiaries have material non-controlling interest. However, the above information has been presented on the aggregated interests in similar entities namely, the Leisure and Consumer Foods and Retail (CF&R) segment, based on the nature and risks of the products and services.
9. Business combinations and acquisitions of non-controlling interests Accounting policy Business combinations & goodwillBusiness combinations are accounted for using the acquisition method of accounting. The Group measures goodwill at the acquisition date as the fair value of the consideration transferred including the recognised amount of any non-controlling interests in the acquiree, less the net recognised amount (generally fair value) of the identifiable assets acquired and liabilities assumed, all measured as of the acquisition date.

Group Highlights | Governance | Management Discussion & Analysis | Financial Statements | Supplementary Information 201
When the fair value of the consideration transferred including the recognised amount of any non-controlling interests in the acquiree is lower than the fair value of net assets acquired, a gain is recognised immediately in the income statement. The Group elects on a transaction-by-transaction basis whether to measure non-controlling interests at fair value, or at their proportionate share of the recognised amount of the identifiable net assets, at the acquisition date. Transaction costs, other than those associated with the issue of debt or equity securities, that the Group incurs in connection with a business combination are expensed as incurred. When the Group acquires a business, it assesses the financial assets and liabilities assumed for appropriate classification and designation in accordance with the contractual terms, economic circumstances and pertinent conditions as at the acquisition date. If the business combination is achieved in stages, the acquisition date fair value of the acquirer’s previously held equity interest in the acquiree is remeasured to fair value at the acquisition date through profit or loss. Any contingent consideration to be transferred by the acquirer will be recognised at fair value at the acquisition date. Contingent consideration which is deemed to be an asset or liability, which is a financial instrument and within the scope of LKAS 39, is measured at fair value with changes in fair value either in the income statement or as a change to other comprehensive income. If the contingent consideration is classified as equity, it will not be remeasured. Subsequent settlement is accounted within equity. In instances where the contingent consideration does not fall within the scope of LKAS 39, it is measured in accordance with the appropriate SLFRS/LKAS.
After initial recognition, goodwill is measured at cost less any accumulated impairment losses. Goodwill is reviewed for impairment, annually or more frequently if events or changes in circumstances indicate that the carrying value may be impaired.
For the purpose of impairment testing, goodwill acquired in a business combination is, from the acquisition date, allocated to each of the Group’s cash generating units that are expected to benefit from the combination, irrespective of whether other assets or liabilities of the acquiree are assigned to those units.
Impairment is determined by assessing the recoverable amount of the cash-generating unit to which the goodwill relates. Where the recoverable amount of the cash generating unit is less than the carrying amount, an impairment loss is recognised. The impairment loss is allocated first to reduce the carrying
amount of any goodwill allocated to the unit and then to the other assets pro-rata to the carrying amount of each asset in the unit.
Goodwill and fair value adjustments arising on the acquisition of a foreign operation are treated as assets and liabilities of the foreign operation and translated at the closing rate.
Where goodwill forms part of a cash-generating unit and part of the operation within that unit is disposed of, the goodwill associated with the operation disposed of is included in the carrying amount of the operation when determining the gain or loss on disposal of the operation, goodwill disposed in this circumstance is measured based on the relative values of the operation disposed of and the portion of the cash-generating unit retained.
Impairment of goodwillGoodwill is tested for impairment annually (as at 31 March) and when circumstances indicate that the carrying value may be impaired. Impairment is determined for goodwill by assessing the recoverable amount of each cash-generating unit (or group of cash-generating units) to which the goodwill relates. Where the recoverable amount of the cash generating unit is less than their carrying amount, an impairment loss is recognised. Impairment losses
relating to goodwill cannot be reversed in future periods.
9.1. Investment in 2016/17 Waterfront Properties (Pvt) Ltd. John Keells Holdings PLC. (JKH) further invested LKR 4,341 mn in Waterfront Properties (Pvt) Ltd. a subsidiary of JKH involving the developing, owning, managing, operating, selling, leasing and renting of a luxury multi/mixed use Integrated Resort.
The Colombo Ice Company (Pvt) Ltd. Ceylon Cold Stores PLC, invested LKR 270 million in The Colombo Ice Company (Pvt) Ltd a subsidiary of the Group, entered in to an agreement with the Board of Investment of Sri Lanka (BOI) for the establishment of an Ice Cream factory.
9.2. Acquisitions in 2015/16 Rajewella Holdings Ltd.In September 2015, the Group has increased its shareholdings in Rajawella Holdings Ltd. (RHL) from 16.9% to 49.85% with a total investment of LKR 1,044 mn over a three year period. Total investment comprises a partial buyout from existing shareholders, an infusion into RHL and release of an existing sublease of land held by the Group.
The fair value of net assets acquired of Rajewella Holdings Ltd. were as follows;
In LKR '000s Fair value recognised
on acquisition
ASSETS
Cash 145,588
Inventories 10,675
Trade and other receivables 38,767
Other current assets 3,498
Intangible assets 484
Lease rentals paid in advance* 1,507,818
Property, plant and equipment 460,706
LIABILITIES
Bank overdrafts (43,501)
Deferred tax liabilities (954)
Other deferred liabilities (564,181)
Employee benefit liabilities (8,435)
Other current liabilities (14,125)
Trade and other payables (145,045)
Total identifiable net assets at fair value 1,391,295
Non-controlling interest measured at fair value (971,141)
Gain on bargain purchase of a subsidiary (4,088)
Total purchase consideration 416,066
Deferred purchase consideration (301,065)
Bank overdrafts acquired (102,087)
Net cash outflow on acquisition of the subsidiary 12,914
* This represents the fair value on the date of acquisition of the leasehold land right held by Rajawella Holdings Ltd. The fair value has been determined by an external independent chartered valuer.

202 John Keells Holdings PLC | Annual Report 2016/17
2017
As at 31 MarchIn LKR '000s
Notes Noncurrent
financialassets
Cash inhand and
at bank
Trade andother
receivables
Short terminvest-ments
Amountsdue from
relatedparties
Total % of allocation
Group
Government securities 10.1.2 17,750,289 - - 24,450,907 - 42,201,196 35%
Corporate debt securities 10.1.3 4,244,764 - - 1,436,526 - 5,681,290 5%
Deposits with bank 10.1.4 3,276,582 - - 49,853,042 - 53,129,624 44%
Loans to executives 10.1.5 733,037 - 184,626 - - 917,663 1%
Loans to life policyholders 10.1.6 902,300 - - - - 902,300 1%
Preference shares 10.1.7 267,275 - - - - 267,275 0%
Interest rate swap 10.1.8 331,679 - - - - 331,679 1%
Trade and other receivables 10.1.9 - - 11,034,918 - - 11,034,918 9%
Reinsurance receivables 10.1.10 - - 214,342 - - 214,342 0%
Premium receivable 10.1.11 - - 253,543 - - 253,543 0%
Amounts due from related parties 10.1.12 - - - - 111,639 111,639 0%
Cash in hand and at bank 10.1.13 - 5,119,185 - - - 5,119,185 4%
Total credit risk exposure 27,505,926 5,119,185 11,687,429 75,740,475 111,639 120,164,654 100%
Financial assets at fair value through P&L 10.3.3.1 - - - 3,433,852 -
Available-for-sale investments 10.3.3.2 160,695 - - - -
Total equity risk exposure 160,695 - - 3,433,852 -
Total 27,666,621 5,119,185 11,687,429 79,174,327 111,639
Notes to the Financial Statements
9. Business combinations and acquisitions of non-controlling interests (Contd.)9.3. Investment in 2015/16 Waterfront Properties (Pvt) Ltd. John Keells Holdings PLC. (JKH) further invested in LKR 4,732 mn in Waterfront Properties (Pvt) Ltd. a subsidiary of JKH involving the developing, owning, managing, operating, selling, leasing and renting of a luxury multi/mixed use Integrated Resort.
10. Financial risk management objectives and policies The Group has loans and other receivables, trade and other receivables and cash and short-term deposits that arise directly from its operations. The Group also holds other financial instruments such as available for sale and fair value through profit or loss financial instruments and may enter into derivative transactions. The Group’s principal financial liabilities, comprise of loans and borrowings, trade and other payables and financial guarantee contracts. The main purpose of these financial liabilities is to finance the Group’s operations and to
provide guarantees to support its operations. The financial risk governance framework provides assurance to the Group’s senior management that the Group’s financial risk activities are governed by appropriate policies and procedures and that financial risks are identified, measured and managed in accordance with the Group’s policies and risk objectives. The Group is exposed to market risk, credit risk and liquidity risk.
10.1. Credit riskCredit risk is the risk that a counterparty will not meet its obligations under a financial instrument or customer contract, leading to a financial loss. The Group is exposed to credit risk from its operating activities (primarily trade receivables) and from its financing activities, including deposits with banks and financial institutions, foreign exchange transactions and other financial instruments.
The Group trades only with recognised, creditworthy third parties. It is the Group’s policy that all clients who wish to trade on
credit terms are subject to credit verification procedures. In addition, receivable balances are monitored on an ongoing basis with the result that the Group’s exposure to bad debts is not significant.
With respect to credit risk arising from the other financial assets of the Group, such as cash and cash equivalents, available-for-sale financial investments, investments, and certain derivative instruments, the Group’s exposure to credit risk arises from default of the counterparty. The Group manages its operations to avoid any excessive concentration of counterparty risk and the Group takes all reasonable steps to ensure the counterparties fulfill their obligations.
10.1.1. Risk exposureThe maximum risk positions of financial assets which are generally subject to credit risk are equal to their carrying amounts (without consideration of collateral, if available). Following table shows the maximum risk positions.

Group Highlights | Governance | Management Discussion & Analysis | Financial Statements | Supplementary Information 203
2017
As at 31 MarchIn LKR '000s
Notes Noncurrent
financialassets
Cash inhand and
at bank
Trade andother
receivables
Short terminvest-ments
Amountsdue from
relatedparties
Total % of allocation
Company
Government securities 10.1.2 - - - 16,690,302 - 16,690,302 26%
Corporate debt securities 10.1.3 - - - 268,306 - 268,306 0%
Deposits with bank 10.1.4 2,576,339 - - 43,284,672 - 45,861,011 72%
Loans to executives 10.1.5 71,669 - 18,652 - - 90,321 0%
Trade and other receivables 10.1.9 - - 99,424 - - 99,424 0%
Amounts due from related parties 10.1.12 - - - - 286,735 286,735 1%
Cash in hand and at bank 10.1.13 - 304,265 - - - 304,265 1%
Total credit risk exposure 2,648,008 304,265 118,076 60,243,280 286,735 63,600,364 100%
Available-for-sale investments 10.3.3.2 141,972 - - - -
Total equity risk exposure 141,972 - - - -
Total 2,789,980 304,265 118,076 60,243,280 286,735
2016
As at 31 MarchIn LKR '000s
Notes Noncurrent
financialassets
Cash inhand and
at bank
Trade andother
receivables
Short terminvest-ments
Amountsdue from
relatedparties
Total % of allocation
Group
Government securities 10.1.2 15,287,098 - - 26,149,799 - 41,436,897 39%
Corporate debt securities 10.1.3 4,939,118 - - 856,498 - 5,795,616 5%
Deposits with bank 10.1.4 568,198 - - 42,621,898 - 43,190,096 40%
Loans to executives 10.1.5 618,850 - 167,940 - - 786,790 1%
Loans to life policyholders 10.1.6 783,373 - - - - 783,373 1%
Preference shares 10.1.7 254,024 - - - - 254,024 0%
Trade and other receivables 10.1.9 - - 9,482,865 - - 9,482,865 9%
Reinsurance receivables 10.1.10 - - 132,298 - - 132,298 0%
Premium receivable 10.1.11 - - 215,846 - - 215,846 0%
Amounts due from related parties 10.1.12 - - - - 133,031 133,031 0%
Cash in hand and at bank 10.1.13 - 5,127,463 - - - 5,127,463 5%
Total credit risk exposure 22,450,661 5,127,463 9,998,949 69,628,195 133,031 107,338,299 100%
Financial assets at fair value through P&L 10.3.3.1 - - - 3,006,875 -
Available-for-sale investments 10.3.3.2 184,783 - - - -
Total equity risk exposure 184,783 - - 3,006,875 -
Total 22,635,444 5,127,463 9,998,949 72,635,070 133,031

204 John Keells Holdings PLC | Annual Report 2016/17
10.1.2. Government securities As at 31 March 2017 government securities comprise 35% (2016-39%) and 26% (2016-31%) for the Group and Company respectively, which consist of treasury bonds, bills and reverse repo investments. Government securities are usually referred to as risk free due to the sovereign nature of the instrument.
10.1.3. Corporate debt securities As at 31 March 2017, corporate debt securities comprise 5% (2016-5%) of the total investments in debt securities, out of which 92% (2016 – 94%) were rated “A” or better, or guaranteed by a banking institution with a rating of “A” or better.
Group
As at 31 March 2017 2016
Fitch ratings In
LKR ’000sRating
% of total In
LKR ’000sRating
% of total
AA+ 812,063 14% 615,672 11%
AA 25,572 0% 77,505 1%
AA- 1,887,448 35% 2,988,097 52%
A+ 1,699,653 30% 1,132,347 20%
A 751,104 13% 562,794 10%
A- 422,857 7% 398,424 6%
BBB+ 82,593 1% 20,777 0%
Total 5,681,290 100% 5,795,616 100%
Notes to the Financial Statements
10 Financial risk management objectives and policies (Contd.)
10.1.1. Risk exposure (Contd.)
2016
As at 31 MarchIn LKR '000s
Notes Noncurrent
financialassets
Cash inhand and
at bank
Trade andother
receivables
Short terminvest-ments
Amountsdue from
relatedparties
Total % of allocation
Company
Government securities 10.1.2 - - - 18,066,890 - 18,066,890 31%
Corporate debt securities 10.1.3 268,366 - - - - 268,366 1%
Deposits with bank 10.1.4 - - - 38,795,346 - 38,795,346 67%
Loans to executives 10.1.5 72,980 - 19,823 - - 92,803 0%
Trade and other receivables 10.1.9 - - 149,321 - - 149,321 0%
Amounts due from related parties 10.1.12 - - - - 595,182 595,182 1%
Cash in hand and at bank 10.1.13 - 178,193 - - - 178,193 0%
Total credit risk exposure 341,346 178,193 169,144 56,862,236 595,182 58,146,101 100%
Available-for-sale investments 10.3.3.2 166,059 - - - -
Total equity risk exposure 166,059 - - - -
Total 507,405 178,193 169,144 56,862,236 595,182

Group Highlights | Governance | Management Discussion & Analysis | Financial Statements | Supplementary Information 205
10.1.4 Deposits with bank Deposits with bank mainly consist of fixed and call deposits.
As at 31 March 2017, fixed and call deposits comprise 92% (2016- 93%) and 95% (2016- 93%) for the Group and Company respectively were rated “A+” or better.
Group Company
As at 31 March 2017 2016 2017 2016
Fitch ratings* In
LKR ’000s Rating %
of total In
LKR ’000sRating %
of total In
LKR ’000s Rating %
of total In
LKR ’000sRating %
of total
AAA 98,936 0% 1,003,763 2% 889,560 2% 870,038 2%
AA+ 17,584,755 33% 10,200,822 24% 16,964,101 37% 9,382,100 24%
AA 5,204,255 10% 5,110,419 12% 4,833,086 11% 5,097,422 13%
AA- 23,048,321 43% 20,978,876 48% 19,819,906 43% 18,737,328 48%
A+ 2,967,207 6% 2,966,941 7% 1,135,939 2% 2,140,013 6%
A 2,612,559 5% 2,929,275 7% 604,828 2% 2,568,445 7%
A- 1,613,591 3% - - 1,613,591 3% - -
Total 53,129,624 100% 43,190,096 100% 45,861,011 100% 38,795,346 100%
* rating agencies
10.1.5. Loans to executivesLoans to executive portfolio is largely made up of vehicle loans which are given to staff at assistant manager level and above. The respective business units have obtained the necessary promissory notes as collateral for the loans granted.
10.1.6. Loans to life policyholdersThe surrender value of insurance policies considered as the collateral for the loans
given to life policy holders by Union Assurance PLC. System controls are in place to automatically convert a policy to lapse stage when the policy loan amount together with the interest is reaching the surrender value of the policy.
10.1.7. Preference SharesCumulative preference share investment which has lien over an assets, redeemable at the option of share holder.
10.1.8. Interest rate swapThe Group has entered into interest rate swap that is a cash flow hedge. The changes in counterparty credit risk had no material effect on the hedge effectiveness assessment for derivatives designated in hedge relationships. Refer note 12.3.
10.1.9. Trade and other receivables
Group Company
As at 31 March 2017 2016 2017 2016
Neither past due nor impaired 3,357,908 4,974,544 79,574 96,094
Past due but not impaired
0-30 days 4,411,225 2,083,677 9,738 10,089
31–60 days 1,199,016 958,904 8,914 16,506
61–90 days 263,358 299,605 - -
> 91 days 1,803,411 1,166,135 1,198 26,632
Impaired 1,050,357 1,035,892 - -
Gross carrying value 12,085,275 10,518,757 99,424 149,321
Less: impairment provision
Individually assessed impairment provision (418,296) (564,864) - -
Collectively assessed impairment provision (632,061) (471,028) - -
Total 11,034,918 9,482,865 99,424 149,321
The Group has obtained customer deposit from major customers by reviewing their past performance and credit worthiness, as collateral.
The requirement for an impairment is analysed at each reporting date on an individual basis for major customers. Additionally, a large number of minor receivables are grouped into homogeneous groups and assessed for impairment collectively. The calculation is based on actual incurred historical data.
10.1.10. Reinsurance receivablesThe Union Assurance PLC operates a policy to manage its reinsurance counterparty exposures by limiting the reinsurers that may be used and applying strict limits each reinsurer.
10.1.11. Premium receivable Only designated institutions are employed as intermediary parties by Union Assurance PLC.
Agreements have been signed with the intermediaries committing them to settle dues within a specified time period.

206 John Keells Holdings PLC | Annual Report 2016/17
10.2.1. Net debt/(cash)
As at 31 March Group Company
In LKR '000s 2017 2016 2017 2016
Short term investments 79,174,327 72,635,070 60,243,280 56,862,236
Cash in hand and at bank 5,119,185 5,127,463 304,265 178,193
Adjustments to liquid assets (6,218,187) (5,163,192) - -
Total liquid assets 78,075,325 72,599,341 60,547,545 57,040,429
Interest-bearing loans and borrowings (Non-current) 14,202,636 13,706,848 - -
Short term borrowings 1,380,238 821,243 - -
Interest-bearing loans and borrowings (Current) 2,918,854 2,991,582 - 1,482,508
Bank overdrafts 4,264,109 3,230,182 84,282 117,412
Total liabilities 22,765,837 20,749,855 84,282 1,599,920
Net debt / (cash) (55,309,488) (51,849,486) (60,463,263) (55,440,509)
10.2.2. Liquidity risk managementThe mixed approach combines elements of the cash flow matching approach and the liquid assets approach. The business units attempt to match cash outflows in each time bucket against a combination of contractual cash inflows plus other inflows that can be generated through the sale of assets, repurchase agreement or other secured borrowing.
Maturity analysisThe table below summarises the maturity profile of the Group’s financial liabilities at 31 March 2017 based on contractual undiscounted (principal plus interest) payments.
GroupIn LKR '000s
Within1 year
Between1-2 years
Between2-3 years
Between3-4 years
Between4-5 years
More than5 years
Total
Interest-bearing loans and borrowings
2,969,995 1,040,496 1,149,113 1,141,074 501,146 10,355,654 17,157,478
Trade and other payables 14,136,040 - - - - - 14,136,040
Amounts due to related parties 10,434 - - - - - 10,434
Short term borrowings 1,380,238 - - - - - 1,380,238
Bank overdrafts 4,264,109 - - - - - 4,264,109
22,760,816 1,040,496 1,149,113 1,141,074 501,146 10,355,654 36,948,299
Notes to the Financial Statements
10. Financial risk management objectives and policies (Contd.)10.1.12. Amounts due from related partiesThe Group's amounts due from related parties mainly consists of associates and other venture partners' balances.
The Company balance consists of the balances from affiliate companies.
10.1.13. Credit risk relating to cash and cash equivalents In order to mitigate the concentration, settlement and operational risks related to cash and cash equivalents, the Group consciously manages the exposure to a single counterparty taking into consideration, where relevant, the rating
or financial standing of the counterparty, where the position is reviewed as and when required, the duration of the exposure in managing such exposures and the nature of the transaction and agreement governing the exposure.
10.2 Liquidity risk The Group’s policy is to hold cash and undrawn committed facilities at a level sufficient to ensure that the Group has available funds to meet its short and medium term capital and funding obligations, including organic growth and acquisition activities, and to meet any unforeseen obligations and opportunities. The Group holds cash and undrawn committed
facilities to enable the Group to manage its liquidity risk.
The Group monitors its risk to a shortage of funds using a daily cash management process. This process considers the maturity of both the Group’s financial investments and financial assets (e.g. accounts receivable, other financial assets) and projected cash flows from operations.
The Group’s objective is to maintain a balance between continuity of funding and flexibility through the use of multiple sources of funding including debentures, bank loans, loan notes, overdrafts and finance leases over a broad spread of maturities.

Group Highlights | Governance | Management Discussion & Analysis | Financial Statements | Supplementary Information 207
The table below summarises the maturity profile of the Group’s financial liabilities at 31 March 2016 based on contractual undiscounted (principal plus interest) payments.
GroupIn LKR '000s
Within1 year
Between1-2 years
Between2-3 years
Between3-4 years
Between4-5 years
More than5 years
Total
Interest-bearing loans and borrowings
3,687,083 1,985,299 1,475,617 827,071 720,891 11,773,215 20,469,176
Trade and other payables 12,755,466 - - - - - 12,755,466
Amounts due to related parties 28,982 - - - - - 28,982
Short term borrowings 821,243 - - - - - 821,243
Bank overdrafts 3,230,182 - - - - - 3,230,182
20,522,956 1,985,299 1,475,617 827,071 720,891 11,773,215 37,305,049
Maturity analysisThe table below summarises the maturity profile of the Company's financial liabilities on contractual undiscounted (principal plus interest) payments.
Company 2017 2016
In LKR '000s Within 1 year
Interest-bearing loans and borrowings - 1,482,508
Trade and other payables 330,078 332,506
Amounts due to related parties 210,029 102,135
Bank overdrafts 84,282 117,412
624,389 2,034,561
10.3 . Market risk Market risk is the risk that the fair value of future cash flows of a financial instrument will fluctuate because of changes in market prices.
Market risk comprises of the following types of risks:• Interest rate risk• Currency risk• Equity price risk• Commodity price risk
The objective of market risk management is to manage and control market risk exposures within acceptable parameters, while optimising the return.
The sensitivity analyses in the following sections relate to the position as at 31 March in 2017 and 2016.
The analysis excludes the impact of movements in market variables on the carrying values of other post-retirement obligations, provisions and the non-financial assets and liabilities.
The following assumptions have been made in performing the sensitivity analyses:
• The Statement of Financial Position sensitivity relates to derivatives and available-for-sale debt instruments.
• The sensitivity of the relevant Income Statement item is the effect of the assumed changes in respective market risks.
• This is based on the financial assets and financial liabilities held at 31 March 2017 and 2016.
10.3.1. Interest rate risk Interest rate risk is the risk that the fair value or future cash flows of a financial instrument
will fluctuate because of changes in market interest rates. The Group’s exposure to the risk of changes in market interest rates relates primarily to the Group’s long-term debt obligations with floating interest rates.
Most lenders grant loans under floating interest rates. To manage this, the Group enters into interest rate swaps, in which it agrees to exchange, at specified intervals, the difference between fixed and variable rate interest amounts calculated by reference to an agreed-upon notional principal amount.
The following table demonstrates the sensitivity to a reasonably possible change in interest rates, with all other variables held constant, of the Group’s and Company's profit before tax (through the impact on floating rate borrowings).
For the year ended 31 March Increase/ (decrease) in basis points Effect on profit before tax LKR '000s
Rupeeborrowings
Other currencyborrowings
Group Company
2017 +188 +53 115,552 -
-188 -53 (115,552) -
2016 +189 +52 (119,511) (7,709)
-189 -52 119,679 7,709
The assumed spread of basis points for the interest rate sensitivity analysis is based on the currently observable market environment changes to base floating interest rates.

208 John Keells Holdings PLC | Annual Report 2016/17
10.3.2.2. Effects of currency translationFor purposes of JKH's consolidated financial statements, the income and expenses and the assets and liabilities of subsidiaries located outside Sri Lanka are converted into Sri Lankan Rupees (LKR). Therefore, period-to-period changes in average exchange rates may cause currency translation effects that have a significant impact on, for example, revenue, segment results (Earnings Before Interest and Taxes –EBIT) and assets and liabilities of the Group. Unlike exchange rate transaction risk, exchange rate translation risk does not necessarily affect future cash flows. The Group’s equity position reflects changes in book values caused by exchange rates.
The Group’s exposure to foreign currency changes for all other currencies is not material.
For the year ended 31 March Group Company
Increase/(decrease)in exchange rate USD
Effect on profitbefore tax LKR '000s
Effect on equityLKR '000s
Effect on profitbefore tax LKR '000s
2017 +4% 1,169,224 1,490,189 841,661
-4% ( 1,169,224 ) (1,490,189) (841,661)
2016 +10% 3,242,566 3,329,445 1,817,315
-10% (3,242,566) (3,329,445) (1,817,315)
AssumptionsThe assumed spread of the exchange rate is based on the current observable market environment.
10.3.3. Equity price riskThe Group’s listed and unlisted equity securities are susceptible to market price risk arising from uncertainties about future values of the investment securities.
10.3.3.1. Financial assets at fair value through Profit and loss The Group manages the equity price risk through diversification and by placing limits on individual and total equity instruments. Reports on the equity portfolio are submitted to the Group’s senior management on a regular basis. The Board of Directors reviews and approves all equity investment decisions.
Notes to the Financial Statements
10. Financial risk management objectives and policies (Contd.)10.3.2. Foreign currency riskForeign currency risk is the risk that the fair value or future cash flows of a financial instrument will fluctuate because of changes in foreign exchange rates. The Group has exposure to foreign currency risk where it has cash flows in overseas operations and foreign currency transactions which are affected by foreign exchange movements. Group treasury analyses the market condition of foreign exchange and provides market updates to the Group Executive Committee (GEC), with the use of external consultants' advice. Based on the suggestions made by Group treasury the GEC takes decisions on whether to hold, sell, or make forward bookings of foreign currency as per decision rights given by Board of Directors.
For the year ended 31 March
Increase/(decrease)in basis points USD
Effect on profitbefore taxLKR '000s
Group
2017 +4% (44,617)
-4% 44,617
2016 +10% (42,282)
-10% 42,282
The assumed spread of the exchange rate is based on the current observable market environment.
10.3.2.1. Effects of currency transaction on forward contract The following table demonstrates the sensitivity to a reasonably possible change in the USD/LKR exchange rate, with all other variables held constant, of the Group’s profit
before tax due to changes in the fair value of the Group’s forward exchange contracts. Currently these financial instruments are categorised under trade and other receivables.

Group Highlights | Governance | Management Discussion & Analysis | Financial Statements | Supplementary Information 209
Group
As at 31 March 2017 2016
LKR ’000s % LKR ’000s %
Banks finance and insurance 1,678,946 49% 1,849,371 62%
Beverage food and tobacco 12,353 0% 364,221 12%
Construction & engineering 116,745 3% 53,844 2%
Diversified holdings 591,424 18% 360,216 12%
Manufacturing 856,378 25% 273,713 9%
Motors - - 12,128 0%
Power and energy - - 16,058 1%
Other services - - 6,651 0%
Telecommunications 178,006 5% 64,641 2%
Healthcare - - 6,032 0%
3,433,852 100% 3,006,875 100%
10.3.3.2 Available-for-sale investments
All unquoted equity investments are made after obtaining Board approval.
10.3.3.3 Sensitivity analysisThe following table demonstrates the sensitivity to a reasonably possible change in the market index, with all other variables held constant, of the Group & Company's profit before tax & equity due to changes in the fair value of the listed equity securities.
For the year ended 31 March Group
Change in year-endmarket price index
Effect on profit before tax LKR '000s
Effect on equityLKR '000s
2017 0% - -
0% - -
2016 +10% 300,688 32
-10% (300,688) (32)
10.4 Capital managementThe primary objective of the Group’s capital management is to ensure that it maintains a strong financial position and healthy capital ratios in order to support its business and maximise shareholder value.
The Group manages its capital structure, and makes adjustments to it, in the light of changes in economic conditions. To maintain or adjust the capital structure, the Group may issue new shares, have a rights issue or buy back of shares.
As at 31 March Group Company
2017 2016 2017 2016
Debt/Equity 11.7% 12.3% 0.1% 1.6%
11. Fair value measurement and related fair value disclosuresFair value measurementFair value related disclosures for financial instruments and non-financial assets that are measured at fair value or where fair values are only, disclosed are reflected in this note. Apart from this note, additional fair value related disclosures, including the valuation methods, significant estimates and assumptions are also provided in:
• Investment in unquoted equity shares
Note 27.1 • Property, plant and equipment
under revaluation modelNote 21.3
• Investment properties Note 23
• Financial Instruments (including those carried at amortised cost)
Note 12
Accounting policy Fair value is the price that would be received to sell an asset or paid to transfer a liability
in an orderly transaction between market participants at the measurement date. The fair value measurement is based on the presumption that the transaction to sell the asset or transfer the liability takes place either:
• In the principal market for the asset or liability, or
• In the absence of a principal market, in the most advantageous market for the asset or liability

210 John Keells Holdings PLC | Annual Report 2016/17
Notes to the Financial Statements
11. Fair value measurement and related fair value disclosures (Contd.)The principal or the most advantageous market must be accessible by the Group.
The fair value of an asset or a liability is measured using the assumptions that market participants would use when pricing the asset or liability, assuming that market participants act in their economic best interest.
A fair value measurement of a non-financial asset takes into account a market participant's ability to generate economic benefits by using the asset in its highest and best use or by selling it to another market participant that would use the asset in its highest and best use.
The Group uses valuation techniques that are appropriate for the circumstances and for which sufficient data are available to measure fair value, maximising the use of relevant observable inputs and minimising the use of unobservable inputs.
All assets and liabilities for which fair value is measured or disclosed in the financial statements are categorised within the fair value hierarchy, described as follows, based
on the lowest level input that is significant to the fair value measurement as a whole:
• Level 1 — Quoted (unadjusted) market prices in active markets for identical assets or liabilities
• Level 2 — Valuation techniques for which the lowest level input that is significant to the fair value measurement is directly or indirectly observable.
• Level 3 — Valuation techniques for which the lowest level input that is significant to the fair value measurement is unobservable.
For assets and liabilities that are recognised in the financial statements on a recurring basis, the Group determines whether transfers have occurred between levels in the hierarchy by re-assessing categorisation (based on the lowest level input that is significant to the fair value measurement as a whole) at the end of each reporting period.
The Group determines the policies and procedures for both recurring fair value measurement, such as investment properties and unquoted AFS financial assets, and for
nonrecurring measurement, such as assets held for sale in discontinued operations.
External valuers are involved in the valuation of significant assets, such as land and building and investment properties, and significant liabilities, such as insurance contracts. Selection criteria for external valuers include market knowledge, reputation, independence and whether professional standards are maintained. The Group decides, after discussions with the external valuers, which valuation techniques and inputs to use for individual assets and liabilities.
For the purpose of fair value disclosures, the Group has determined classes of assets and liabilities on the basis of the nature, characteristics and risks of the asset or liability and the level of the fair value hierarchy as explained above.
Fair value hierarchy
11.1 Financial assets and liabilities by fair value hierarchy - Group
The Group held the following financial instruments carried at fair value in the Statement of Financial Position:
FINANCIAL ASSETS Level 1 Level 2 Level 3
As at 31 MarchIn LKR '000s
2017 2016 2017 2016 2017 2016
Financial assets held for trading 1,678,122 1,395,201 - - - -
Designated at fair value through profit or loss 2,187,708 2,253,716 132,683 21,160 - -
Foreign exchange forward contracts - - - 26,732 - -
Interest rate swap - - 331,679 - - -
Available for sale 6,478,510 7,018,665 180,722 301,134 160,369 184,456
Total 10,344,340 10,667,582 645,084 349,026 160,369 184,456
NON FINANCIAL ASSETS Note
Assets measured at fair value
Land and buildings 21.1 40,092,971 29,953,873
Buildings on leasehold land 21.1 12,522,459 11,541,882
Investment property 23 5,366,180 4,878,406
Total 57,981,610 46,374,161
In determining the fair value, highest and best use of the property has been considered including the current condition of the properties, future usability and associated redevelopment requirements. Also, the valuers have made reference to market evidence of transaction prices for similar properties, with appropriate adjustments for size and location. The appraised fair values are rounded within the range of values.

Group Highlights | Governance | Management Discussion & Analysis | Financial Statements | Supplementary Information 211
11.2. Financial assets and liabilities by fair value hierarchy - Company
FINANCIAL ASSETS Level 3
As at 31 MarchIn LKR '000s
2017 2016
Available for sale 141,972 166,059
11.3. Reconciliation of fair value measurements of level 3 financial instrumentsThe Group and Company carries unquoted equity shares as available-for-sale financial instruments classified as Level 3 within the fair value hierarchy. A reconciliation of the beginning and closing balances including movements is summarised below:
Available-for-sale financial assets
In LKR '000s Group Company
As at 1 April 2016 184,456 166,059
Total gains and losses recognised in OCI (24,087) (24,087)
As at 31 March 2017 160,369 141,972
Fair valuation carried at 31 March 2017 for all unquoted equity shares are classified as Level 3 within the fair value hierarchy using discounted cash flow valuation method. Fair value would not significantly vary if one or more of the inputs were changed.
12. Financial instruments and related policiesAccounting policyFinancial instruments — Initial recognition and subsequent measurementFinancial assets - Initial recognition and measurementFinancial assets within the scope of LKAS 39 are classified as financial assets at fair value through profit or loss, loans and receivables, held-to-maturity investments, available-for-sale financial assets, or as derivatives designated as hedging instruments in an effective hedge, as appropriate. The Group determines the classification of its financial assets at initial recognition.
All financial assets are recognised initially at fair value plus, in the case of assets not at fair value through profit or loss, directly attributable transaction costs. Purchases or sales of financial assets that require delivery of assets within a time frame established by regulation or convention in the market place (regular way trades) are recognised on the trade date, i.e., the date that the Group commits to purchase or sell the asset.
The Group’s financial assets include cash and short-term deposits, trade and other receivables, loans and other receivables, quoted and unquoted financial instruments and derivative financial instruments.
Financial assets - Subsequent measurementThe subsequent measurement of financial assets depends on their classification. For
purposes of subsequent measurement financial assets are classified in four categories:
• Financial assets at fair value through profit or loss
• Loans and receivables
• Held-to-maturity investments
• Available for sale financial assets
Financial assets at fair value through profit or lossFinancial assets at fair value through profit or loss include financial assets held for trading and financial assets designated upon initial recognition at fair value through profit or loss. Financial assets are classified as held for trading if they are acquired for the purpose of selling or repurchasing in the near term.
Financial assets at fair value through profit or loss are carried in the Statement of Financial Position at fair value with changes in fair value recognised in finance income or finance costs in the Income Statement.
The Group evaluates its financial assets held for trading, other than derivatives, to determine whether the intention to sell them in the near term is still appropriate. When the Group is unable to trade these financial assets due to inactive markets and management’s intention to sell them in the foreseeable future significantly changes, the Group may elect to reclassify these financial assets in rare circumstances. The reclassification to loans and receivables,
available-for-sale or held to maturity depends on the nature of the asset. This evaluation does not affect any financial assets designated at fair value through profit or loss using the fair value option at designation.
Loans and receivables Loans and receivables are non-derivative financial assets with fixed or determinable payments that are not quoted in an active market. After initial measurement, such financial assets are subsequently measured at amortised cost using the effective interest rate method (EIR), less impairment. Amortised cost is calculated by taking into account any discount or premium on acquisition and fees or costs that are an integral part of the EIR. The EIR amortisation is included in finance income in the income statement. The losses arising from impairment are recognised in the income statement in finance costs.
Held-to-maturity investmentsHeld-to-maturity investments are non-derivative financial assets with fixed or determinable payments and fixed maturities are classified as held-to-maturity when the Group has the positive intention and ability to hold them to maturity. After initial measurement, held-to-maturity investments are measured at amortised cost using the effective interest method, less impairment. Amortised cost is calculated by taking into account any discount or premium on acquisition and fees or costs that are an integral part of the EIR. The EIR amortization is included in finance income in the Income Statement. The losses arising from impairment are recognised in the Income Statement in finance costs.
Available-for-sale financial investmentsAvailable-for-sale financial investments include equity and debt securities. Equity investments classified as available-for-sale are those, which are neither classified as held for trading nor designated at fair value through profit or loss. Debt securities in this category are those which are intended to be held for an indefinite period of time and which may be sold in response to needs for liquidity or in response to changes in the market conditions.
After initial measurement, available-for-sale financial investments are subsequently measured at fair value with unrealised gains or losses recognised in other comprehensive income under the available-for-sale reserve until the investment is derecognised, at which time the cumulative gain or loss is recognised in other operating income, or determined to be impaired, at which time the

212 John Keells Holdings PLC | Annual Report 2016/17
cumulative loss is reclassified to the Income Statement in finance costs and removed from the available-for-sale reserve. Interest income on available-for-sale debt securities is calculated using the effective interest method and is recognised in the Income Statement.
The Group evaluates its available-for-sale financial assets to determine whether the ability and intention to sell them in the near term is still appropriate. When the Group is unable to trade these financial assets due to inactive markets and management’s intention to do so significantly changes in the foreseeable future, the Group may elect to reclassify these financial assets in rare circumstances. Reclassification to loans and receivables is permitted when the financial assets meet the definition of loans and receivables and the Group has the intent and ability to hold these assets for the foreseeable future or until maturity. Reclassification to the held-to-maturity category is permitted only when the entity has the ability and intention to hold the financial asset accordingly.
For a financial asset reclassified out of the available-for-sale category, any previous gain or loss on that asset that has been recognized in equity is amortised to the Income Statement over the remaining life of the investment using the EIR. Any difference between the new amortised cost and the expected cash flows is also amortised over the remaining life of the asset using the EIR. If the asset is subsequently determined to be impaired, then the amount recorded in equity is reclassified to the Income Statement.
Financial assets - derecognitionA financial asset (or, where applicable a part of a financial asset or part of a group of similar financial assets) is derecognised when:
• The rights to receive cash flows from the asset have expired
• The Group has transferred its right to receive cash flows from the asset or has assumed an obligation to pay the received cash flows in full without material delay to a third party under a ‘pass-through’ arrangement; and either (a) the Group has transferred substantially all the risks and rewards of the asset, or (b) the Group has neither transferred nor retained
Notes to the Financial Statements
substantially all the risks and rewards of the asset, but has transferred control of the asset.
When the Group has transferred its rights to receive cash flows from an asset or has entered into a pass-through arrangement, and has neither transferred nor retained substantially all of the risks and rewards of the asset nor transferred control of it, the asset is recognised to the extent of the Group’s continuing involvement in it.
In that case, the Group also recognises an associated liability. The transferred asset and the associated liability are measured on a basis that reflects the rights and obligations that the Group has retained.
Continuing involvement that takes the form of a guarantee over the transferred asset is measured at the lower of the original carrying amount of the asset and the maximum amount of consideration that the Group could be required to repay.
Impairment of financial assetsThe Group assesses at each reporting date whether there is any objective evidence that a financial asset or a group of financial assets is impaired. A financial asset or a group of financial assets is deemed to be impaired if, and only if, there is objective evidence of impairment as a result of one or more events that has occurred after the initial recognition of the asset (an incurred ‘loss event’) and that loss event has an impact on the estimated future cash flows of the financial asset or the group of financial assets that can be reliably estimated.
Evidence of impairment may include indications that the debtors or a group of debtors is experiencing significant financial difficulty, default or delinquency in interest or principal payments, the probability that they will enter bankruptcy or other financial reorganisation and where observable data indicate that there is a measurable decrease in the estimated future cash flows, such as changes in arrears or economic conditions that correlate with defaults.
Financial assets carried at amortised costFor financial assets carried at amortised cost, the Group first assesses whether objective evidence of impairment exists individually for financial assets that are individually significant, or collectively for financial assets
that are not individually significant. If the Group determines that no objective evidence of impairment exists for an individually assessed financial asset, whether significant or not, it includes the asset in a Group of financial assets with similar credit risk characteristics and collectively assesses them for impairment. Assets that are individually assessed for impairment and for which an impairment loss is, or continues to be, recognised are not included in a collective assessment of impairment.
If there is objective evidence that an impairment loss has been incurred, the amount of the loss is measured as the difference between the assets carrying amount and the present value of estimated future cash flows (excluding future expected credit losses that have not yet been incurred). The present value of the estimated future cash flows is discounted at the financial asset’s original effective interest rate. If a loan has a variable interest rate, the discount rate for measuring any impairment loss is the current effective interest rate.
The carrying amount of the asset is reduced through the use of an allowance account and the amount of the loss is recognised in the Income Statement. Interest income continues to be accrued on the reduced carrying amount and is accrued using the rate of interest used to discount the future cash flows for the purpose of measuring the impairment loss. The interest income is recorded as part of finance income in the Income Statement. Loans together with the associated allowance are written off when there is no realistic prospect of future recovery and all collateral has been realised or has been transferred to the Group. If, in a subsequent year, the amount of the estimated impairment loss increases or decreases because of an event occurring after the impairment was recognised, the previously recognised impairment loss is increased or reduced by adjusting the allowance account. If a future write-off is later recovered, the recovery is credited to finance costs in the Income Statement.
AFS financial assetsFor available-for-sale financial investments, the group assesses at each reporting date whether there is objective evidence that an investment or a Group of investments is impaired.
12. Financial instruments and related policies (Contd.)

Group Highlights | Governance | Management Discussion & Analysis | Financial Statements | Supplementary Information 213
In the case of equity investments classified as available-for-sale, objective evidence would include a significant or prolonged decline in the fair value of the investment below its cost. ‘Significant’ is evaluated against the original cost of the investment and ‘prolonged’ against the period in which the fair value has been below its original cost. Where there is evidence of impairment, the cumulative loss measured as the difference between the acquisition cost and the current fair value (less any impairment loss) is removed from other comprehensive income. Impairment losses on equity investments are not reversed through the Income Statement; increases in their fair value after impairment are recognised directly in other comprehensive income.
In the case of debt instruments classified as available-for-sale, impairment is assessed based on the same criteria as financial assets carried at amortised cost. However, the amount recorded for impairment is the cumulative loss measured as the difference between the amortised cost and the current fair value, less any impairment loss on that investment previously recognised in the Income Statement.
Future interest income continues to be accrued based on the reduced carrying amount of the asset, using the rate of interest used to discount the future cash flows for the purpose of measuring the impairment loss. The interest income is recorded as part of finance income. If, in a subsequent year, the fair value of a debt instrument increases and the increase can be objectively related to an event occurring after the impairment loss was recognised in the Income Statement, the impairment loss is reversed through the Income Statement.
Financial liabilities – Initial recognition and measurementFinancial liabilities within the scope of LKAS 39 are classified as financial liabilities at fair value through profit or loss, loans and borrowings or as derivatives designated as hedging instruments in an effective hedge, as appropriate. The Group determines the classification of its financial liabilities at initial recognition.
All financial liabilities are recognised initially at fair value and in the case of loans and borrowings, carried at amortised cost. This includes directly attributable transaction costs.
The Group’s financial liabilities include trade and other payables, bank overdrafts, loans and borrowings, financial guarantee contracts and derivative financial instruments.
Financial liabilities - Subsequent measurementThe subsequent measurement of financial liabilities depends on their classification. For purposes of subsequent measurement financial liabilities are classified in to two categories:
• Loans and borrowings
• Financial guarantee contracts
After initial recognition, interest bearing loans and borrowings are subsequently measured at amortised cost using the effective interest rate method. Gains and losses are recognised in the Income Statement when the liabilities are derecognised as well as through the effective interest rate method (EIR) amortization process.
Amortised cost is calculated by taking into account any discount or premium on acquisition and fees or costs that are an integral part of the EIR. The EIR amortization is included in finance costs in the Income Statement.
Financial guarantee contracts issued by the Group are those contracts that require a payment to be made to reimburse the holder for a loss it incurs in case the specified debtor fails to make a payment when due in accordance with the terms of a debt instrument. Financial guarantee contracts are recognised initially as a liability at fair value, adjusted for transaction costs that are directly attributable to the issuance of the guarantee. Subsequently, the liability is measured at the higher of the best estimate of the expenditure required to settle the present obligation at the reporting date and the amount recognised less cumulative amortisation.
Financial liabilities - DerecognitionA financial liability is derecognised when the obligation under the liability is discharged or cancelled or expired.
When an existing financial liability is replaced by another from the same lender on substantially different terms, or the terms of an existing liability are substantially modified, such an exchange or modification is treated as a derecognition of the original liability and the recognition of a new liability, and the difference in the respective carrying amounts are recognised in the Income Statement
Offsetting of financial instrumentsFinancial assets and financial liabilities are offset and the net amount reported in the Consolidated Statement of Financial Position if, and only if, there is a currently enforceable
legal right to offset the recognised amounts and there is an intention to settle on a net basis, or to realise the assets and settle the liabilities simultaneously.
Derivative financial instruments - Initial recognition and subsequent measurement The Group uses derivative financial instruments such as forward currency contracts, interest rate swaps and forward commodity contracts to hedge its foreign currency risks, interest rate risks and commodity price risks respectively. Such derivative financial instruments are initially recognised at fair value on the date on which a derivative contract is entered into and subsequently remeasured at fair value. Derivatives are carried as financial assets when the fair value is positive and as financial liabilities when the fair value is negative.
The fair value of commodity contracts that meet the definition of a derivative as defined by LKAS 39 are recognised in the Income Statement in cost of sales.
Any gains or losses arising from changes in the fair value of derivatives are taken directly to the Income Statement.
Foreign exchange forward contractsForeign exchange forward contracts are fair valued at each reporting date. Gains and losses arising from changes in fair value are included in the Income Statement in the period in which they arise.
Cash Flow HedgesInterest rate swapsThe Group has entered into interest rate swap that is a cash flow hedge for the Group’s exposure to interest rate risk on its borrowings
These contracts entitle the Group to receive interest at floating rates on notional principal amounts and oblige the Group to pay interest at fixed rates on the same notional principal amounts, thus allowing the Group to raise borrowings at floating rates and swap them with fixed rates.
The fair value changes on the effective portion of interest rate swaps designated as cash flow hedges are recognised in other comprehensive income, accumulated in the fair value reserve and reclassified to profit or loss when the hedged interest expense on the borrowings is recognised in profit or loss. The fair value changes on the ineffective portion of interest rate swaps are recognised immediately in profit or loss.

214 John Keells Holdings PLC | Annual Report 2016/17
Notes to the Financial Statements
12.1. Financial assets and liabilities by categories in accordance with LKAS 39
Financial assets by categories Financial liabilities by categories
Group Loans and receivables Financial assets at fair value through profit or loss
Available-for-sale financial assets
Held-to-maturity investments Total Financial liabilities measured at amortised cost
As at 31 March LKR '000s
2017 2016 2017 2016 2017 2016 2017 2016 2017 2016 2017 2016
Financial instruments in non-current assets/non-current liabilities
Non-current financial assets 9,474,414 2,492,810 96,016 50,452 6,639,029 6,987,250 11,457,162 13,104,932 27,666,621 22,635,444 - -
Interest-bearing loans and borrowings - - - - - - - - - - 14,202,636 13,706,848
Financial instruments in current assets/current liabilities
Trade and other receivables/ Payables 11,687,429 9,998,949 - - - - - - 11,687,429 9,998,949 14,136,040 12,755,466
Amounts due from/due to related parties 111,639 133,031 - - - - - - 111,639 133,031 10,434 28,982
Short term investments 70,970,351 67,404,837 3,902,497 3,619,625 180,572 517,005 4,120,907 1,093,603 79,174,327 72,635,070 - -
Cash in hand and at bank 5,119,185 5,127,463 - - - - - - 5,119,185 5,127,463 - -
Short term borrowings - - - - - - - - - - 1,380,238 821,243
Interest-bearing loans and borrowings - - - - - - - - - - 2,918,854 2,991,582
Bank overdrafts - - - - - - - - - - 4,264,109 3,230,182
Total 97,363,018 85,157,090 3,998,513 3,670,077 6,819,601 7,504,255 15,578,069 14,198,535 123,759,201 110,529,957 36,912,311 33,534,303
12.2. Financial assets and liabilities by categories in accordance with LKAS 39
Financial assets by categories
Financial liabilities by categories
Company Loans and receivables Available-for-sale financial assets
Total Financial liabilities measured at amortised cost
As at 31 March LKR '000s
2017 2016 2017 2016 2017 2016 2017 2016
Financial instruments in non-current assets/non-current liabilities
Non-current financial assets
2,648,008 341,346 141,972 166,059 2,789,980 507,405 - -
Financial instruments in current assets/current liabilities
Trade and other receivables/ Payables
118,076 169,144 - - 118,076 169,144 330,078 332,506
Amounts due from/due to related parties
286,735 595,182 - - 286,735 595,182 210,029 102,135
Short term investments 60,243,280 56,862,236 - - 60,243,280 56,862,236 - -
Cash in hand and at bank 304,265 178,193 - - 304,265 178,193 - -
Interest-bearing loans and borrowings
- - - - - - - 1,482,508
Bank overdrafts - - - - - - 84,282 117,412
Total 63,600,364 58,146,101 141,972 166,059 63,742,336 58,312,160 624,389 2,034,561

Group Highlights | Governance | Management Discussion & Analysis | Financial Statements | Supplementary Information 215
For financial assets both at fair value through profit and loss and available-for-sale financial assets the carrying amount and fair value are equal.
The fair value of loans and receivables is not significantly different from the value based on amortised cost methodology. Fair value of held to maturity investments amounts to LKR 14,725 mn (2016 - LKR 15,160 mn) for the Group.
The Group has designated financial assets amounting to LKR 3,999 mn (2016 - LKR 4,010 mn) upon initial recognition, as fair value through profit or loss.
The management assessed that, cash and short-term deposits, trade receivables, trade payables, bank overdrafts and other current financial liabilities approximate their carrying amounts largely due to the short-term maturities of these instruments.
Fair value is the price that would be received to sell an asset or paid to transfer a liability in an orderly transaction between market participants at the measurement date.
The following methods and assumptions were used to estimate the fair values:Fair value of quoted equities, debentures and bonds is based on price quotations in an active market at the reporting date.
12.1. Financial assets and liabilities by categories in accordance with LKAS 39
Financial assets by categories Financial liabilities by categories
Group Loans and receivables Financial assets at fair value through profit or loss
Available-for-sale financial assets
Held-to-maturity investments Total Financial liabilities measured at amortised cost
As at 31 March LKR '000s
2017 2016 2017 2016 2017 2016 2017 2016 2017 2016 2017 2016
Financial instruments in non-current assets/non-current liabilities
Non-current financial assets 9,474,414 2,492,810 96,016 50,452 6,639,029 6,987,250 11,457,162 13,104,932 27,666,621 22,635,444 - -
Interest-bearing loans and borrowings - - - - - - - - - - 14,202,636 13,706,848
Financial instruments in current assets/current liabilities
Trade and other receivables/ Payables 11,687,429 9,998,949 - - - - - - 11,687,429 9,998,949 14,136,040 12,755,466
Amounts due from/due to related parties 111,639 133,031 - - - - - - 111,639 133,031 10,434 28,982
Short term investments 70,970,351 67,404,837 3,902,497 3,619,625 180,572 517,005 4,120,907 1,093,603 79,174,327 72,635,070 - -
Cash in hand and at bank 5,119,185 5,127,463 - - - - - - 5,119,185 5,127,463 - -
Short term borrowings - - - - - - - - - - 1,380,238 821,243
Interest-bearing loans and borrowings - - - - - - - - - - 2,918,854 2,991,582
Bank overdrafts - - - - - - - - - - 4,264,109 3,230,182
Total 97,363,018 85,157,090 3,998,513 3,670,077 6,819,601 7,504,255 15,578,069 14,198,535 123,759,201 110,529,957 36,912,311 33,534,303
The fair value of unquoted instruments, loans from banks and other financial liabilities, obligations under finance leases, as well as other non-current financial liabilities is estimated by discounting future cash flows using rates currently available for debt on similar terms, credit risk and remaining maturities.
Fair value of the unquoted ordinary shares has been estimated using a Discounted Cash Flow (DCF) model. The valuation requires management to make certain assumptions about the model inputs, including forecast cash flows, the discount rate, credit risk and volatility. The probabilities of the various estimates within the range can be reasonably assessed and are used in management’s estimate of fair value for these unquoted equity investments.
12.3. Derivative financial instruments
Group 2017
Cash-flow hedges Contract notionalamount USD ('000)
Fair value (In LKR '000)
Asset Liability
Interest rate swaps 75,000 331,679 -
Accounting judgements,estimates and assumptionsFair value of financial instrumentsWhere the fair value of financial assets and financial liabilities recorded in the statement of financial position cannot be derived from active markets, their fair value is determined using valuation techniques including the discounted cash flow model. The inputs to these models are taken from observable markets where possible.
Where this is not feasible, a degree of judgment is required in establishing fair values. The judgments include considerations of inputs such as liquidity risk, credit risk and volatility.

216 John Keells Holdings PLC | Annual Report 2016/17
Notes to the Financial Statements
13. Revenue Accounting policy Revenue recognitionRevenue is recognised to the extent that it is probable that the economic benefits will flow to the Group, and the revenue and associated costs incurred or to be incurred can be reliably measured. Revenue is measured at the fair value of the consideration received or receivable, net of trade discounts and value added taxes, after eliminating sales within the Group.
The following specific criteria are also must be met for recognition of revenue:
Sale of goodsRevenue from the sale of goods is recognized when the significant risk and rewards of ownership of the goods have passed to the buyer with the Group retaining neither a continuing managerial involvement to the degree usually associated with ownership, nor an effective control over the goods sold.
14. Dividend income
Accounting policy
DividendDividend income is recognised when the Company’s right to receive the payment is established.
Company
For the year ended 31 March In LKR '000s
2017 2016
Dividend income from investments in subsidiaries and equity accounted investees 10,469,023 10,260,828
15. Other operating income and other operating expenses
Accounting policy Gains and lossesNet gains and losses of a revenue nature arising from the disposal of property, plant and equipment and other noncurrent assets, including investments in subsidiaries, joint ventures and associates, are accounted in the income statement, after deducting the
13.1. Revenue
Group Company
For the year ended 31 March In LKR '000s
2017 2016 2017 2016
Gross revenue 106,483,869 93,815,682 1,126,353 1,108,095
Turnover tax (210,768) (105,728) - -
Net revenue 106,273,101 93,709,954 1,126,353 1,108,095
Rendering of servicesRevenue from rendering of services is recognised by reference to the stage of completion. Where the contract outcome cannot be measured reliably, revenue is recognized only to the extent that the expenses incurred are eligible to be recovered.
Rental incomeRental income arising from operating leases on investment properties is accounted for on a straight-line basis over the lease terms.
Life insurance business - gross written premiumGross written premiums on life and investment contracts with discretionary participating features (DPF) are recognised as revenue when receivable from the policyholder (policies within the 30 day grace period are considered as due). For single premium business, revenue is recognised on the date on which the policy is effective.
Turnover based taxesCompanies in the Group pay turnover based taxes including value added tax in accordance with the respective statutes.
carrying amount from proceeds on disposal of such assets and the related selling expenses.
Gains and losses arising from activities incidental to the main revenue generating activities and those arising from a group of similar transactions, which are not material are aggregated, reported and presented on a net basis.
Any losses arising from guaranteed rentals are accounted for, in the year of incurring the same. A provision is recognised if the projection indicates a loss.
Other income and expensesOther income and expenses are recognised on an accrual basis.
15.1. Other operating income
Group Company
For the year ended 31 March In LKR '000s
2017 2016 2017 2016
Exchange gains 282,572 236,421 - -
Profit on sale of property, plant and equipment - - 17 1,656
Profit on sale of non current investments - - 2,574,003 3,792,821
Promotional income and commission fee 1,062,548 859,218 - -
Write back of dealer deposits 8,789 12,410 - -
Sundry income 411,278 596,074 33,841 27,413
1,765,187 1,704,123 2,607,861 3,821,890

Group Highlights | Governance | Management Discussion & Analysis | Financial Statements | Supplementary Information 217
At the Company level, other operating income includes a capital gain of LKR 2,574 mn pertaining to the exercise undertaken to simplify the Group’s shareholding structure. This exercise, as discussed in note 43.8, was carried out to restructure the shareholding of the Group companies which had multiple layers of ownership. The exercise was executed via a model which consisted of both share and cash transfers within the Company and its unquoted subsidiaries. It should also be noted that this capital gain was eliminated at the Group consolidation level.
The Company exercised its buy back option of Union Assurance PLC, resultant gain of LKR 3.10 bn has been reported under other operation income in 2015/16 income statement.
15.2. Other operating expenses
Group Company
For the year ended 31 March In LKR '000s
2017 2016 2017 2016
Nation building tax 1,105,567 1,029,657 22,909 22,533
Loss on sale of property, plant and equipment 41,183 34,050 - -
Impairment losses of non financial assets 34,332 215,764 900,419 525,000
Other overheads 1,989,023 2,150,090 17,844 19,147
3,170,105 3,429,561 941,172 566,680
The recoverable amount of the investments in the BPO business as at 31 March 2017, has been determined using the “fair value less cost to sell” basis. Accordingly, an impairment loss of LKR 900 mn (2016 - LKR 525 mn) has been recognized in the Company financial statements under other operating expenses. The said loss has been eliminated in the consolidated financial statements.
16. Net finance income Accounting policyFinance incomeFinance income comprises interest income on funds invested (including available-for-sale financial assets), dividend income and gains on the disposal of available-for-sale financial assets, fair value gains on financial assets at fair value through profit or loss, gains on the remeasurement to fair value of any pre-existing interest in an acquiree that are recognised in the income statement.
Interest income is recorded as it accrues using the effective interest rate (EIR), which is the rate that exactly discounts the estimated future cash receipts through the expected life of the
financial instrument or a shorter period, where appropriate, to the net carrying amount of the financial asset. Interest income is included in finance income in the income statement.
Finance costsFinance costs comprise interest expense on borrowings, unwinding of the discount on provisions, losses on disposal of available-for-sale financial assets, fair value losses on financial assets at fair value through profit or loss, impairment losses recognised on financial assets (other than trade receivables) that are recognised in the income statement.
Interest expense is recorded as it accrues using the effective interest rate (EIR), which is
the rate that exactly discounts the estimated future cash payments through the expected life of the financial instrument or a shorter period, where appropriate, to the net carrying amount of the financial liability.
Borrowing costs directly attributable to the acquisition, construction or production of an asset that necessarily takes a substantial period of time to get ready for its intended use or sale are capitalised as part of the cost of the respective assets. All other borrowing costs are expensed in the period they occur. Borrowing costs consist of interest and other costs that the Group incurs in connection with the borrowing of funds.
Group Company
For the year ended 31 March In LKR '000s
2017 2016 2017 2016
Net finance income Finance incomeInterest income 9,016,816 6,226,155 4,908,325 2,935,026
Dividend income on
Financial assets at fair value through profit or loss 164,269 102,328 - -
Available-for-sale financial assets 49,289 8,724 49,289 8,724
Investment related expenses (47,432) (22,909) - -
Net gain on
Financial assets at fair value through profit or loss 267,176 - - -
Available-for-sale financial assets 9 82,406 - 82,406
Exchange gains 583,154 1,614,248 583,154 1,614,248
Total finance income 10,033,281 8,010,952 5,540,768 4,640,404
Finance costInterest expense on borrowings (436,278) (391,721) (89,397) (81,579)
Net loss on
Financial assets at fair value through profit or loss - (602,081) - -
Total finance cost (436,278) (993,802) (89,397) (81,579)
Net finance income 9,597,003 7,017,150 5,451,371 4,558,825

218 John Keells Holdings PLC | Annual Report 2016/17
17. Profit before tax
Accounting policy
Expenditure recognitionExpenses are recognised in the income statement on the basis of a direct association between the cost incurred and the earning of specific items of income. All expenditure incurred in the running of the business and in maintaining the property, plant and equipment in a state of efficiency has been charged to the income statement.
For the purpose of presentation of the income statement, the “function of expenses” method has been adopted, on the basis that it presents fairly the elements of the Company’s and Group’s performance.
Group Company
For the year ended 31 March In LKR '000s
2017 2016 2017 2016
Profit before tax
Profit before tax is stated after charging all expenses including the following;
Remuneration to executive directors 363,411 375,934 154,024 163,099
Remuneration to non executive directors 47,470 51,698 16,920 22,320
Costs of defined employee benefits
Defined benefit plan cost 327,633 283,900 32,831 26,633
Defined contribution plan cost - EPF and ETF 841,237 775,679 31,571 29,316
Staff expenses 11,166,845 10,135,789 567,671 561,849
Auditors’ remuneration
Audit 44,992 41,014 7,273 6,943
Non-audit 6,654 7,588 3,183 2,753
Depreciation of property, plant and equipment 2,874,071 2,782,315 33,042 33,415
Amortisation of intangible assets 333,046 320,564 19,765 23,660
Amortisation of lease rentals paid in advance 592,983 738,407 - -
Impairment losses of non financial assets 34,332 215,764 900,419 525,000
Operating lease payments 913,962 1,068,459 - -
(Profit)/loss on sale of property, plant and equipment and intangible assets 41,183 34,050 (17) (1,656)
Donations 34,135 24,361 13,505 23,510
18. Earnings per share
Accounting policy
Basic EPS is calculated by dividing the profit for the year attributable to ordinary equity holders of the parent by the weighted average number of ordinary shares outstanding during the year. Diluted EPS is calculated by dividing the profit attributable to ordinary equity holders of the parent (after adjusting outstanding share option scheme and warrants) by the weighted average number of ordinary shares outstanding during the year plus the weighted average number of ordinary shares that would be issued on conversion of all the dilutive potential ordinary shares into ordinary shares.
Group
For the year ended 31 March Note 2017 2016
18.1. Basic earnings per share Profit attributable to equity holders of the parent (In LKR '000s) 16,275,158 14,070,009
Weighted average number of ordinary shares (In ’000s) 18.3 1,373,936 1,335,196
Basic earnings per share (LKR) 11.85 10.54
18.2. Diluted earnings per share Profit attributable to equity holders of the parent (In LKR '000s) 16,275,158 14,070,009
Adjusted weighted average number of ordinary shares (In ’000s) 18.3 1,374,525 1,337,984
Diluted earnings per share (LKR) 11.84 10.52
Notes to the Financial Statements

Group Highlights | Governance | Management Discussion & Analysis | Financial Statements | Supplementary Information 219
20. TaxesAccounting policyCurrent taxCurrent tax assets and liabilities for the current and prior periods are measured at the amount expected to be recovered from or paid to the taxation authorities. The tax rates and tax laws used to compute the amount are those that are enacted or substantively enacted, at the reporting date in the countries where the Group operates and generates taxable income.
Current income tax relating to items recognised directly in equity is recognised in equity and for items recognised in other comprehensive income shall be recognised in other comprehensive income and not in the income statement. Management periodically evaluates positions taken in the tax returns with respect to situations in which applicable tax regulations are subject to interpretation and establishes provisions where appropriate.
Management has used its judgment on the application of tax laws including transfer pricing regulations involving identification of associated undertakings, estimation of the respective arm’s length prices and selection of appropriate pricing mechanism.
The Group has complied with the arm’s length principles relating to transfer pricing as prescribed in the Inland Revenue Act, and has complied with the related Gazette notification issued by Ministry of Finance.
Deferred taxDeferred tax is provided using the liability method on temporary differences at the reporting date between the tax bases of assets and liabilities and their carrying amounts for financial reporting purposes.
Deferred tax liabilities are recognised for all taxable temporary differences, except:
• Where the deferred tax liability arising from the initial recognition of goodwill or of an asset or liability in a transaction that is not a business combination and, at the time of the transaction, affects neither the accounting profit nor taxable profit or loss; and
• In respect of taxable temporary differences associated with investments in subsidiaries, associates and interests in joint ventures, where the timing of the reversal of the temporary differences can be controlled and it is probable that the temporary differences will not reverse in the foreseeable future.
Deferred tax assets are recognised for all deductible temporary differences, and unused tax credits and tax losses carried forward, to the extent that it is probable that taxable profit will be available against which the deductible temporary differences and the unused tax credits and tax losses carried forward can be utilised except:
• Where the deferred income tax assets relating to the deductible temporary difference arises from the initial recognition of an asset or liability in a transaction that is not a business combination and, at the
time of the transaction, affects neither the accounting profit nor taxable profit or loss; and
• In respect of deducible temporary differences associated with investments in subsidiaries, associates and interests in joint ventures, deferred tax assets are recognised only to the extent that it is probable that the temporary differences will reverse in the foreseeable future and taxable profit will be available against which the temporary differences can be utilised.
The carrying amount of deferred tax assets is reviewed at each reporting date and reduced to the extent that it is no longer probable that sufficient taxable profit will be available to allow all or part of the deferred tax asset to be utilised. Unrecognised deferred tax assets are reassessed at each reporting date and are recognised to the extent that it has become probable that future taxable profit will allow the deferred tax asset to be recovered.
Deferred tax assets and liabilities are measured at tax rates that are expected to apply to the year when the asset realises or liability is settled, based on the tax rates and tax laws that have been enacted or substantively enacted as at the reporting date.
Deferred tax relating to items recognised outside the income statement is recognised outside the income statement. Deferred tax items are recognised in correlation to the underlying transaction either in other comprehensive income or directly in equity.
18.3. Amount used as denominator
In '000s 2017 2016
Ordinary shares at the beginning of the year 1,189,404 997,486
Bonus element on share split 2015/16 - 142,498
Bonus element on share split 2016/17 169,915 169,915
Effect of share options exercised / warrants exercised 14,617 25,297
Weighted average number of ordinary shares in issue before dilution 1,373,936 1,335,196
Effects of dilution from:
Employee share option scheme 589 929
Share warrants - 2015/16 - 1,859
Adjusted weighted average number of ordinary shares 1,374,525 1,337,984
19. Dividend per share
Company
For the year ended 31 March LKR
2017In LKR’000s LKR
2016In LKR’000s
Equity dividend on ordinary shares declared and paid during the year
Final dividend (Previous years' final dividend paid in the current year) 1.50 1,784,105 1.50 1,496,230
Interim dividend 4.00 5,496,392 5.50 6,541,560
Total dividend 5.50 7,280,497 7.00 8,037,790

220 John Keells Holdings PLC | Annual Report 2016/17
20.1. Tax expense
Group Company
For the year ended 31 March In LKR '000s
2017 2016 2017 2016
Current income tax
Current tax charge 20.5 3,461,444 2,294,854 1,092,976 578,959
Under/(over) provision of current tax of previous years 21,503 23,357 - 44,485
Irrecoverable economic service charge 20.7 199 445 - -
10% Withholding tax on inter company dividends 943,718 754,194 - -
Deferred tax charge/(reversal)
Relating to origination and reversal of temporary differences 20.2 344,204 333,516 - -
20.6 4,771,068 3,406,366 1,092,976 623,444
20.2. Deferred tax expense
Group
For the year ended 31 March In LKR '000s
2017 2016
Income statement Deferred tax expense arising from; Accelerated depreciation for tax purposes 149,894 102,019 Revaluation of investment property to fair value 26 6,134 Retirement benefit obligations (38,970) (1,030) Reversal/(benefit) arising from tax losses 222,940 156,990 Others 10,314 69,403 Deferred tax charged directly to income statement 344,204 333,516
Other comprehensive income Deferred tax expense arising from; Actuarial losses on defined benefit obligations (19,880) 9,710 Revaluation of land and building to fair value 28,237 20,796
Net gain/(loss) on available for sale financial assets (57,801) 21,842 Total deferred tax charged/(credited) directly to OCI (49,444) 52,348
Deferred tax has been computed at 28% for all standard rate companies (including listed companies), and at 12% for leisure Group companies and at rates as disclosed in notes 20.10 and 20.11.
Temporary differences associated with the undistributed reserves in subsidiaries for which a deferred tax liability has not been recognised, amounts to LKR 2,117 mn (2016 LKR 3,104 mn). The deferred tax effect on undistributed reserves of subsidiaries has not been recognised since the parent can control the timing of the reversal of these temporary differences.
Deferred tax assets and deferred tax liabilities are offset, if a legally enforceable right exists to set off current tax assets against current tax liabilities and when the deferred taxes relate to the same taxable entity and the same taxation authority.
No deferred tax asset or liability has been recognised in the companies which are
enjoying the Board of Investment (BOI) Tax Holiday period, if there are no qualifying assets or liabilities beyond the BOI period.
Sales taxRevenues, expenses and assets are recognised net of the amount of sales tax except:
• Where the sales tax incurred on the purchase of an asset or service is not recoverable from the taxation authority, in which case the sales tax is recognised as part of the cost
of acquisition of the asset or as part of the expense item as applicable; and
• Where receivables and payables are stated with the amount of sales tax included.
The net amount of sales tax recoverable from, or payable to, the taxation authority is included as part of receivables or payables in the statement of financial position.
Notes to the Financial Statements
20. Taxes (Contd.)

Group Highlights | Governance | Management Discussion & Analysis | Financial Statements | Supplementary Information 221
20.3. Income tax liabilities
Group CompanyAs at 31 MarchIn LKR '000s
Note 2017 2016 2017 2016
At the beginning of the year 1,873,472 1,592,079 345,555 263,240 Charge for the year 20.1 3,482,947 2,318,211 1,092,976 623,444 Payments and set off against refunds (2,961,040) (2,036,818) (802,999) (541,129)At the end of the year 2,395,379 1,873,472 635,532 345,555
20.4. Deferred tax
Group ASSETS LIABILITIES
As at 31 MarchIn LKR '000s
2017 2016 2017 2016
At the beginning of the year 129,837 108,585 2,029,371 1,625,394 Charge and release 11,591 26,598 306,351 412,462 Acquisition/(disposal) of subsidiary - - - 955 Transfers/exchange translation difference 2,120 (5,346) 519 (9,440)At the end of the year 143,548 129,837 2,336,241 2,029,371
The closing deferred tax asset and liability balances relate to the following;Revaluation of land and building to fair value - (642) 229,549 397,497 Revaluation of investment property to fair value - (13,670) 51,252 31,188 Accelerated depreciation for tax purposes 59,399 (15,028) 2,155,280 1,755,586 Employee benefit liability 62,620 72,680 (240,655) (182,131)Losses available for offset against future taxable income 18,557 83,596 (51,920) (215,730)Net gain/loss on available for sale financial assets - - (35,959) 21,842 Others 2,972 2,901 228,694 221,119
143,548 129,837 2,336,241 2,029,371
The Group has tax losses amounting to LKR 7,045 mn (2016 - LKR 7,287 mn) that are available indefinitely to offset against future taxable profits of the companies in which the tax losses arose.
Deferred tax liability amounting to LKR 230 mn (2016 – LKR 220 mn) for the Group recognised on the impact pertaining to the current year on declared dividends of subsidiaries and the Group's portion of distributable reserves of equity accounted investees.
Accounting judgements, estimates and assumptions The Group is subject to income tax and other taxes including VAT. Significant judgment was required to determine the total provision for current, deferred and other taxes due to uncertainties that exist with respect to
the interpretation of the applicability of tax laws, at the time of the preparation of these financial statements.
Uncertainties also exist with respect to the interpretation of complex tax regulations and the amount and timing of future taxable income. Given the wide range of business relationships and the long-term nature and complexity of existing contractual agreements, differences arising between the actual results and the assumptions made, or future changes to such assumptions, could necessitate future adjustments to tax income and expense already recorded. Where the final tax outcome of such matters is different from the amounts that were initially recorded, such differences will impact the income and deferred tax amounts in the period in which the determination is made.
The Group has tax losses relating to subsidiaries that have a history of losses that do not expire and may not be used to offset other tax liabilities and where the subsidiaries have no taxable temporary differences nor any tax planning opportunities available that could partly support the recognition of these losses as deferred tax assets.
The Group has contingent liabilities amounting to LKR 1,168 mn (2016 – LKR 1,168 mn). These have been arrived at after discussing with independent and legal tax experts and based on information available. All assumptions are revisited at the reporting date. Further details on contingent liabilities are disclosed in note 44 in the financial statement.

222 John Keells Holdings PLC | Annual Report 2016/17
20. Taxes (Contd.)20.5. Reconciliation between current tax charge and the accounting profit
Group Company
For the year ended 31 MarchIn LKR '000s
2017 2016 2017 2016
Profit before tax 22,887,833 19,198,231 17,245,418 17,693,558
Dividend income from Group companies 14,165,500 12,252,499 - -
Share of results of equity accounted investees (3,302,955) (2,781,233) - -
Other consolidation adjustments 3,908,163 3,357,687 - -
Profit after adjustment 37,658,541 32,027,184 17,245,418 17,693,558
Exempt profits (1,554,480) (2,555,264) (889,488) (639,902)
Income not liable for income tax (6,131,108) (4,545,016) (2,585,646) (3,875,227)
Resident dividend (14,194,939) (12,285,025) (10,518,312) (10,269,552)
Adjusted accounting profit chargeable to income taxes 15,778,014 12,641,879 3,251,972 2,908,877
Disallowable expenses 9,571,337 9,206,717 1,338,095 875,071
Allowable expenses (4,949,360) (6,024,919) (666,521) (1,694,336)
Utilization of tax losses (421,603) (366,929) - -
Qualifying payment deductions (54,692) (227,614) (20,059) (21,900)
Taxable income 19,923,696 15,229,134 3,903,487 2,067,712
Income tax charged at
Standard rate of 28% 2,885,195 1,842,728 1,092,976 578,959
Other concessionary rates 576,249 452,126 - -
Current tax charge 3,461,444 2,294,854 1,092,976 578,959
20.6. Reconciliation between tax expense and the product of accounting profit
Adjusted accounting profit chargeable to income taxes 15,778,014 12,641,879 3,251,972 2,908,877
Tax effect on chargeable profits 3,445,175 2,803,964 910,552 814,486
Tax effect on non deductible expenses 493,075 425,968 337,310 221,625
Tax effect on deductions claimed (156,497) (645,311) (172,889) (467,508)
Net tax effect of unrecognised deferred tax assets for the year 12,426 19,774 18,003 10,356
Net tax effect of unrecognised deferred tax assets for prior years 1,469 (46,025) - -
Under/(over) provision for previous years 21,503 23,357 - 44,485
Other income based taxes
Irrecoverable economic service charge 199 445 - -
10% Withholding tax on inter company dividends 943,718 754,194 - -
Deferred tax on withholding tax of inter company dividends 10,000 70,000 - -
Tax expense 4,771,068 3,406,366 1,092,976 623,444
Group tax expense is based on the taxable profit of individual companies within the Group. At present the tax laws of Sri Lanka do not provide for Group taxation.
20.7. Economic service charge (ESC)
Group
For the year ended 31 MarchIn LKR '000s
2017 2016
Irrecoverable economic service charge 199 445
199 445
Notes to the Financial Statements

Group Highlights | Governance | Management Discussion & Analysis | Financial Statements | Supplementary Information 223
20.8. Tax losses carried forward
Group Company
For the year ended 31 MarchIn LKR '000s
2017 2016 2017 2016
Tax losses brought forward 7,287,486 7,572,469 1,230,471 1,230,471
Adjustments on finalisation of liability 178,959 81,946 - -
Tax losses arising during the year 228,324 319,789 - -
Utilisation of tax losses (649,927) (686,718) - -
7,044,842 7,287,486 1,230,471 1,230,471
20.9. Details of investment relief
Year ofinvestment
Cost of approvedinvestment
In LKR '000s
Reliefclaimed/forgone
on investmentsIn LKR '000s
Liability toadditional tax on
disposal ofinvestment
Ceylon Cold Stores PLC. (CCS) 2011/2012 256,702 256,702 -
2012/2013 167,091 167,091 -
2013/2014 72,801 72,801 -
Keells Food Products PLC. (KFP) 2012/2013 457,732 457,732 -
Trans Asia Hotels PLC. (TAH) 2011/2012 81,522 81,522 -
CCS, KFP and TAH are eligible for qualifying payment relief granted under Section 34(2)(s) of the Inland Revenue Act No. 10 of 2006 and amendments thereto. CCS, KFP and TAH have now fully claimed the relief.
20.10 Applicable rates of income tax The tax liability of resident companies are computed at the standard rate of 28% except for the following companies which enjoy full or partial exemptions and concessions.
Company/Sector Basis Exemptions or concessions
Period
Exemptions/concessions granted under the Inland Revenue Act
Ceylon Cold Stores PLC. Off-shore activities for payment in foreign currency
Exempt Open-ended
John Keells Computer Services (Pvt) Ltd. - do - - do - - do -
John Keels Office Automation (Pvt) Ltd. - do - - do - - do -
Cinnamon Hotel Management Ltd. - do - - do - - do -
John Keells International (Pvt) Ltd. - do - - do - - do -
InfoMate (Pvt) Ltd. - do - - do - - do -
John Keells Computer Services (Pvt) Ltd. On-shore activities for payment in foreign currency
- do - - do -
John Keells Holdings PLC. - do - - do - - do -
Lanka Marine Services (Pvt) Ltd. Export consignment sales of Petroleum Products
- do - - do -
John Keells Properties Ja-Ela (Pvt) Ltd. New Undertaking engaged in construction of commercial buildings
- do - 9 years from 1 April 2015
South Asia Gateway Terminals (Pvt) Ltd. Operation of any port terminal in Sri Lanka - do - Exemption will continue even after the expiry of the BOI exemption
Sancity Hotels & Properties Ltd. Construction and operation of a tourist hotel - do - 12 years from 1st year of profit or 2 years from operations
John Keells Warehousing (Pvt) Ltd. Operation and maintenance of facilities for storage
10% Open-ended

224 John Keells Holdings PLC | Annual Report 2016/17
Notes to the Financial Statements
20. Taxes (Contd.)
20.10. Applicable rates of income tax (Contd.)
Company/Sector Basis Exemptions or concessions
Period
John Keells Logistics (Pvt) Ltd. (sites which are not covered by the BOI agreement)
Operation and maintenance of facilities for storage
10% Open-ended
Leisure sector Promotion of tourism 12% - do -
Mackinnons Travels (Pvt) Ltd. - do - - do - - do -
Consumer Foods and Retail sector Qualified export profits - do - - do -
Lanka Marine Services (Pvt) Ltd. - do - - do - - do -
Mackinnons Mackenzie Shipping (Pvt) Ltd. Provision of services to foreign ships - do - - do -
Exemptions / concessions granted under the Board of Investment Law
Beruwala Holiday Resorts (Pvt) Ltd. Construction and operation of a tourist hotel Exempt 8 years from 1st year of profit or 2 years from operations
Saffron Aviation (Pvt) Ltd. Domestic Airline - do - 8 years from 1st year of profit or 2 years from operations
John Keells Residential Properties (Pvt) Ltd. Real estate developer - do - 8 years from April 2011
Trinco Holiday Resorts (Pvt) Ltd. For upgrading and refurbishment of a hotel in the Eastern Province
- do - 10 years from 1st year of profit or 2 years from operations
South Asia Gateway Terminals (Pvt) Ltd. Port Services at Queen Elizabeth Quay - do - 20 years from September 1999
British Overseas (Pvt) Ltd. Infrastructure Development - do - 9 years from 1st April 2013
Waterfront Properties (Pvt) Ltd. Integrated super luxury tourist resort - do - 10 years from 1st year of profit or 3 years from operations
Asian Hotels and Properties PLC. Construction and operation of office, apartment complex and a hotel
2% of turnover 15 years from 1st April 2014
Other miscellaneous concessionsExemption on interest income earned from foreign currency denominated accounts. Capital gains from sale of shares are excluded from chargeability to income tax. Income/profits from offshore dividends and interest are exempt from income tax.
20.11. Income tax rates of off-shore subsidiaries
Country of incorporation Company Rate
India John Keells BPO Solutions India (Pvt) Ltd. 33% (Max)
John Keells Foods India (Pvt)Ltd. 30.9%
Serene Holidays (Pvt) Ltd. 30.9%
Mauritius John Keells BPO Holdings (Pvt) Ltd. 3%(Effective)
John Keells BPO International (Pvt) Ltd. 3%(Effective)
Republic of Maldives Fantasea World Investments (Pte) Ltd. 15%
Tranquility (Pte) Ltd. 15%
Travel Club (Pte) Ltd. 15%
John Keells Maldivian Resorts (Pte) Ltd. 15%
Mack Air Services Maldives (Pte) Ltd. 15%
Singapore John Keells Singapore (Pte) Ltd. 17% (Max)
USA John Keells BPO Solutions US (Pvt) Inc. 35%(Max)
Canada John Keells BPO Solutions Canada (Pvt) Inc 26.5%
20.12. Income tax exemptions / concessions of off-shore subsidiaries
Company / Sector Basis Exemptions or concessions Exemptions or concessions
John Keells BPO Solutions India (Pvt) Ltd. Eligible export turnover Only 50% of relevant profit is taxable 5 years starting Y/A 2015/2016

Group Highlights | Governance | Management Discussion & Analysis | Financial Statements | Supplementary Information 225
21. Property, plant and equipment Accounting policyBasis of recognitionProperty, plant and equipment are recognized if it is probable that future economic benefits associated with the asset will flow to the Group and the cost of the asset can be reliably measured.
Basis of measurementPlant and equipment are stated at cost less accumulated depreciation and any accumulated impairment loss. Such cost includes the cost of replacing component parts of the plant and equipment and borrowing costs for long-term construction projects if the recognition criteria are met. When significant parts of plant and equipment are required to be replaced at intervals, the Group derecognises the replaced part, and recognises the new part with its own associated useful life. Likewise, when a major inspection is performed, its cost is recognised in the carrying amount of the plant and equipment as a replacement if the recognition criteria are satisfied. All other repair and maintenance costs are recognised in the income statement as incurred.
Land and buildings are measured at fair value less accumulated depreciation on buildings and impairment charged subsequent to the date of the revaluation.
The carrying values of property, plant and equipment are reviewed for impairment when events or changes in circumstances indicate that the carrying value may not be recoverable.
Any revaluation surplus is recognised in other comprehensive income and accumulated in equity in the asset revaluation reserve, except to the extent that it reverses a revaluation decrease of the same asset previously recognised in the income statement, in which case the increase is recognised in the income statement. A revaluation deficit is recognised in the income statement, except to the extent that it offsets an existing surplus on the same asset recognised in the asset revaluation reserve.
Accumulated depreciation as at the revaluation date is eliminated against the gross carrying amount of the asset and the net amount is restated to the revalued amount of the asset. Upon disposal, any revaluation reserve relating to the particular asset being sold is transferred to retained earnings. Where land and buildings are subsequently revalued, the entire class of such assets is revalued at fair value on the date of revaluation. The Group has adopted a policy of revaluing assets by professional
valuers at least every 5 years, except for properties held for rental and occupied mainly by group companies, which are revalued by professional valuers at least every 3 years.
DerecognitionAn item of property, plant and equipment is derecognized upon replacement, disposal or when no future economic benefits are expected from its use. Any gain or loss arising on derecognition of the asset is included in the income statement in the year the asset is derecognised.
DepreciationDepreciation is calculated by using a straight-line method on the cost or valuation of all property, plant and equipment, other than freehold land, in order to write off such amounts over the estimated useful economic life of such assets.
The estimated useful life of assets are as follows:
Assets Years
Buildings (other than hotels) 50
Hotel buildings upto 60
Plant and machinery 10 – 20
Equipment 3– 15
Furniture and fittings 2– 15
Motor vehicles 4 – 10
Returnable Containers 10
Vessels 10-25
Borrowing costsBorrowing costs directly attributable to the acquisition, construction or production of an asset that necessarily takes a substantial period of time to get ready for its intended use or sale are capitalised as part of the cost of the asset. All other borrowing costs are expensed in the period in which they occur. Borrowing costs consist of interest and other costs that an entity incurs in connection with the borrowing of funds.
Group as a lesseeFinance leases which transfer to the Group substantially all the risks and benefits incidental to ownership of the leased item, are capitalised at the commencement of the lease at the fair value of the leased property or, if lower, at the present value of the minimum lease payments. Lease payments are apportioned between finance charges and reduction of the lease liability so as to achieve a constant rate of interest on the remaining balance of the liability. Finance charges are recognised in finance costs in the income statement.
A leased asset is depreciated over the useful life of the asset. However, if there is
no reasonable certainty that the Group will obtain ownership by the end of the lease term, the asset is depreciated over the shorter of the estimated useful life of the asset and the lease term. Operating lease payments are recognised as an operating expense in the income statement on a straight-line basis over the lease term.
Impairment of property plant and equipmentThe Group assesses at each reporting date whether there is an indication that an asset may be impaired. If any such indication exists, the Group makes an estimate of the asset’s recoverable amount. An asset’s recoverable amount is the higher of an asset’s or cash generating unit’s fair value less costs to sell and its value in use and is determined for an individual asset, unless the asset does not generate cash inflows that are largely independent of those from other assets or groups of assets. Where the carrying amount of an asset exceeds its recoverable amount, the asset is considered impaired and is written down to its recoverable amount. In assessing value in use, the estimated future cash flows are discounted to their present value using a pre-tax discount rate that reflects current market assessments of the time value of money and the risks specific to the asset. Impairment losses are recognised in the income statement, except that, impairment losses in respect of property, plant and equipment previously revalued are recognized against the revaluation reserve through the statement of other comprehensive income to the extent that it reverses a previous revaluation surplus.
An assessment is made at each reporting date as to whether there is any indication that previously recognised impairment losses may no longer exist or may have decreased. If such indication exists, the recoverable amount is estimated. A previously recognised impairment loss is reversed only if there has been a change in the estimates used to determine the asset’s recoverable amount since the last impairment loss was recognised. If that is the case, the carrying amount of the asset is increased to its recoverable amount. That increased amount cannot exceed the carrying amount that would have been determined, net of depreciation, had no impairment loss been recognised for the asset in prior years. Such reversal is recognised in the income statement unless the asset is carried at revalued amount, in which case the reversal is treated as a revaluation increase. After such a reversal, the depreciation charge is adjusted in future periods to allocate the asset’s revised carrying amount, less any residual value, on a systematic basis over its remaining useful life.

226 John Keells Holdings PLC | Annual Report 2016/17
21. Property, plant and equipment (Contd.)
21.1. Property, plant and equipment - Group
Motor vehicles
As at 31 MarchLKR '000s
Land andbuildings
Buildings on leasehold
land
Plant andmachinery
Equipment,furniture
and fittings
Freehold Leasehold Returnablecontainers
Others Vessels Capitalwork in
progress
Total 2017
Total2016
Cost or valuation
At the beginning of the year 30,644,715 13,627,625 8,263,213 9,130,300 609,764 13,292 848,129 3,940,867 504,487 511,402 68,093,794 63,142,568
Additions 217,927 976,691 750,293 973,455 53,629 - 169,276 612,877 - 577,434 4,331,582 4,582,064
Acquisition/(disposal) of subsidiary - - - - - - - - - - - 547,955
Disposals (63,438) (14,564) (60,600) (536,257) (20,471) - (12,373) (210,466) - (59,454) (977,623) (1,507,360)
Revaluations 10,206,472 154,663 - - - - - - - - 10,361,135 1,262,114
Transfers (from revaluation adjustment) (256,508) (55,392) - - - - - - - - (311,900) (294,393)
Impairment/derecognition - (4,133) (72,250) (85,033) - - - (22,108) - - (183,524) -
Transfers 106,359 138,994 133,791 8,650 319 - - 9,899 - (434,390) (36,378) (62,802)
Exchange translation difference 22,573 66,401 17,881 30,375 1,481 - - 1,631 - 2,999 143,341 423,648
At the end of the year 40,878,100 14,890,285 9,032,328 9,521,490 644,722 13,292 1,005,032 4,332,700 504,487 597,991 81,420,427 68,093,794
Accumulated depreciation and impairment
At the beginning of the year (690,842) (2,085,743) (3,577,489) (5,465,486) (354,924) (6,857) (494,688) (2,534,152) (147,238) - (15,357,419) (13,579,973)
Charge for the year (353,762) (347,129) (633,647) (938,299) (67,581) - (65,371) (468,282) - - (2,874,071) (2,782,315)
(Acquisition)/disposal of subsidiary - - - - - - - - - - - (87,249)
Disposals 7,669 5,656 49,105 504,378 18,763 - 11,533 181,417 - - 778,521 889,949
Revaluations - - - - - - - - - - - 315,257
Transfers (from revaluation adjustment) 256,508 55,392 - - - - - - - - 311,900 -
Impairment / derecognition - 2,659 60,857 68,801 - - - 17,926 - - 150,243 -
Transfers 2,079 34,300 653 3,981 - - - (4,635) - - 36,378 86,189
Exchange translation difference (6,781) (32,961) (8,488) (19,717) (1,000) - - (659) - - (69,606) (199,277)
At the end of the year (785,129) (2,367,826) (4,109,009) (5,846,342) (404,742) (6,857) (548,526) (2,808,385) (147,238) - (17,024,054) (15,357,419)
Carrying value
As at 31 March 2017 40,092,971 12,522,459 4,923,319 3,675,148 239,980 6,435 456,506 1,524,315 357,249 597,991 64,396,373
As at 31 March 2016 29,953,873 11,541,882 4,685,724 3,664,814 254,840 6,435 353,441 1,406,715 357,249 511,402 52,736,375
Notes to the Financial Statements
21.2. Property, plant and equipment - Company
In LKR '000s Plant and machinery
Equipment,furniture
Motorvehicles
Total 2017
Total 2016
Cost
At the beginning of the year 3,704 332,600 77,512 413,816 415,265
Additions - 11,110 - 11,110 30,002
Disposals - (92,374) - (92,374) (31,451)
At the end of the year 3,704 251,336 77,512 332,552 413,816
Accumulated depreciation and impairment
At the beginning of the year (3,322) (270,128) (24,327) (297,777) (289,214)
Charge for the year (123) (21,041) (11,878) (33,042) (33,415)
Disposals - 92,180 - 92,180 24,852
At the end of the year (3,445) (198,989) (36,205) (238,639) (297,777)
Carrying value
As at 31 March 2017 259 52,347 41,307 93,913
As at 31 March 2016 382 62,472 53,185 116,039

Group Highlights | Governance | Management Discussion & Analysis | Financial Statements | Supplementary Information 227
21. Property, plant and equipment (Contd.)
21.1. Property, plant and equipment - Group
Motor vehicles
As at 31 MarchLKR '000s
Land andbuildings
Buildings on leasehold
land
Plant andmachinery
Equipment,furniture
and fittings
Freehold Leasehold Returnablecontainers
Others Vessels Capitalwork in
progress
Total 2017
Total2016
Cost or valuation
At the beginning of the year 30,644,715 13,627,625 8,263,213 9,130,300 609,764 13,292 848,129 3,940,867 504,487 511,402 68,093,794 63,142,568
Additions 217,927 976,691 750,293 973,455 53,629 - 169,276 612,877 - 577,434 4,331,582 4,582,064
Acquisition/(disposal) of subsidiary - - - - - - - - - - - 547,955
Disposals (63,438) (14,564) (60,600) (536,257) (20,471) - (12,373) (210,466) - (59,454) (977,623) (1,507,360)
Revaluations 10,206,472 154,663 - - - - - - - - 10,361,135 1,262,114
Transfers (from revaluation adjustment) (256,508) (55,392) - - - - - - - - (311,900) (294,393)
Impairment/derecognition - (4,133) (72,250) (85,033) - - - (22,108) - - (183,524) -
Transfers 106,359 138,994 133,791 8,650 319 - - 9,899 - (434,390) (36,378) (62,802)
Exchange translation difference 22,573 66,401 17,881 30,375 1,481 - - 1,631 - 2,999 143,341 423,648
At the end of the year 40,878,100 14,890,285 9,032,328 9,521,490 644,722 13,292 1,005,032 4,332,700 504,487 597,991 81,420,427 68,093,794
Accumulated depreciation and impairment
At the beginning of the year (690,842) (2,085,743) (3,577,489) (5,465,486) (354,924) (6,857) (494,688) (2,534,152) (147,238) - (15,357,419) (13,579,973)
Charge for the year (353,762) (347,129) (633,647) (938,299) (67,581) - (65,371) (468,282) - - (2,874,071) (2,782,315)
(Acquisition)/disposal of subsidiary - - - - - - - - - - - (87,249)
Disposals 7,669 5,656 49,105 504,378 18,763 - 11,533 181,417 - - 778,521 889,949
Revaluations - - - - - - - - - - - 315,257
Transfers (from revaluation adjustment) 256,508 55,392 - - - - - - - - 311,900 -
Impairment / derecognition - 2,659 60,857 68,801 - - - 17,926 - - 150,243 -
Transfers 2,079 34,300 653 3,981 - - - (4,635) - - 36,378 86,189
Exchange translation difference (6,781) (32,961) (8,488) (19,717) (1,000) - - (659) - - (69,606) (199,277)
At the end of the year (785,129) (2,367,826) (4,109,009) (5,846,342) (404,742) (6,857) (548,526) (2,808,385) (147,238) - (17,024,054) (15,357,419)
Carrying value
As at 31 March 2017 40,092,971 12,522,459 4,923,319 3,675,148 239,980 6,435 456,506 1,524,315 357,249 597,991 64,396,373
As at 31 March 2016 29,953,873 11,541,882 4,685,724 3,664,814 254,840 6,435 353,441 1,406,715 357,249 511,402 52,736,375
21.3. Revaluation of land and buildingsAccounting judgements, estimates and assumptionsThe Group uses the revaluation model of measurement of land and buildings. The Group engaged independent expert valuers, to determine the fair value of its land and buildings. Fair value is determined by reference to market-based evidence of transaction prices for similar properties.
Valuations are based on open market prices, adjusted for any difference in the nature, location or condition of the specific property. These valuation techniques that are appropriate in the circumstances and for which sufficient data is available to measure fair value, maximising the use of relevant observable inputs and minimizing the use of unobservable inputs. The date of the most recent revaluation was on 31 March 2017.
The changes in fair value recognised in other comprehensive income and in the statement of equity. The valuer has used valuation techniques such as market values and discounted cash flow methods where there was lack of comparable market data available based on the nature of the property.

228 John Keells Holdings PLC | Annual Report 2016/17
21. Property, plant and equipment (Contd.)
21.3. Revaluation of land and buildings
Details of Group's land, building and other properties stated at valuation are indicated below;
Significant unobservable inputs
Property Name of the chartered valuation surveyor
Method of valuation*
Estimated price per perch
Estimated price per square foot
Estimated discount rate
Correlation to fair value
Land
Ahungalla Holiday Resorts (Pvt) Ltd.
S Fernando DCC LKR275,000 - - Positive
Resort Hotels Ltd. P B Kalugalagedara OMV LKR125,000 - - Positive
Nuwara Eliya Holiday Resorts (Pvt) Ltd.
S Fernando IM - - 10% Negative
Trinco Walk Inn Ltd. P B Kalugalagedara OMV LKR125,000 - - Positive
Wirawila Walk Inn Ltd. S Fernando IM - - 8% Negative
Land & Building
Asian Hotels & Properties PLC.
P B Kalugalagedara OMV / DCC LKR10,000,000-LKR15,000,000
LKR2,000-LKR15,000 - Positive
Beruwala Holiday Resorts (Pvt ) Ltd.
-do- DCC LKR550,000-LKR700,000 LKR3,000-LKR10,500 - Positive
Ceylon Cold Stores PLC. -do- DCC LKR125,000-LKR150,000 LKR500-LKR4,500 - Positive
Kandy Walk Inn Ltd. S Fernando OMV LKR400,000-LKR1,000,000 LKR850-LKR8,000 - Positive
Keells Food Products PLC.
P B Kalugalagedara OMV LKR 350,000 LKR400-LKR1,600 - Positive
Keells Realtors Ltd. (Ferguson Road,Colombo 15. Lot A IN,SP 2016)"
-do- OMV LKR1,700,000 LKR500-LKR1,000 - Positive
Mackinnons Keells Ltd. -do- OMV LKR6,500,000 LKR1,500 - Positive
Tea Smallholder Factories PLC.
K T D Tissera CM LKR3,000-LKR7,800 LKR500-LKR2,000 - Positive
Transware Logistics (Pvt) Ltd.
-do- DCC LKR175,000-LKR250,000 LKR500-LKR2,250 - Positive
Trinco Holiday Resorts (Pvt) Ltd.
P B Kalugalagedara DCC LKR200,000 LKR1,000-LKR7,000 - Positive
Union Assurance PLC. -do- OMV LKR10,000,000 LKR500-LKR4,000 - Positive
Whittal Boustead (Pvt) Ltd. 199,Union Place,Colombo 2
-do- OMV LKR5,250,000 LKR1,000-LKR2,000 - Positive
Whittal Boustead (Pvt) Ltd. 148,Vauxhall Street,Colombo 2
-do- OMV LKR4,500,000 LKR1,000-LKR4,000 - Positive
Notes to the Financial Statements
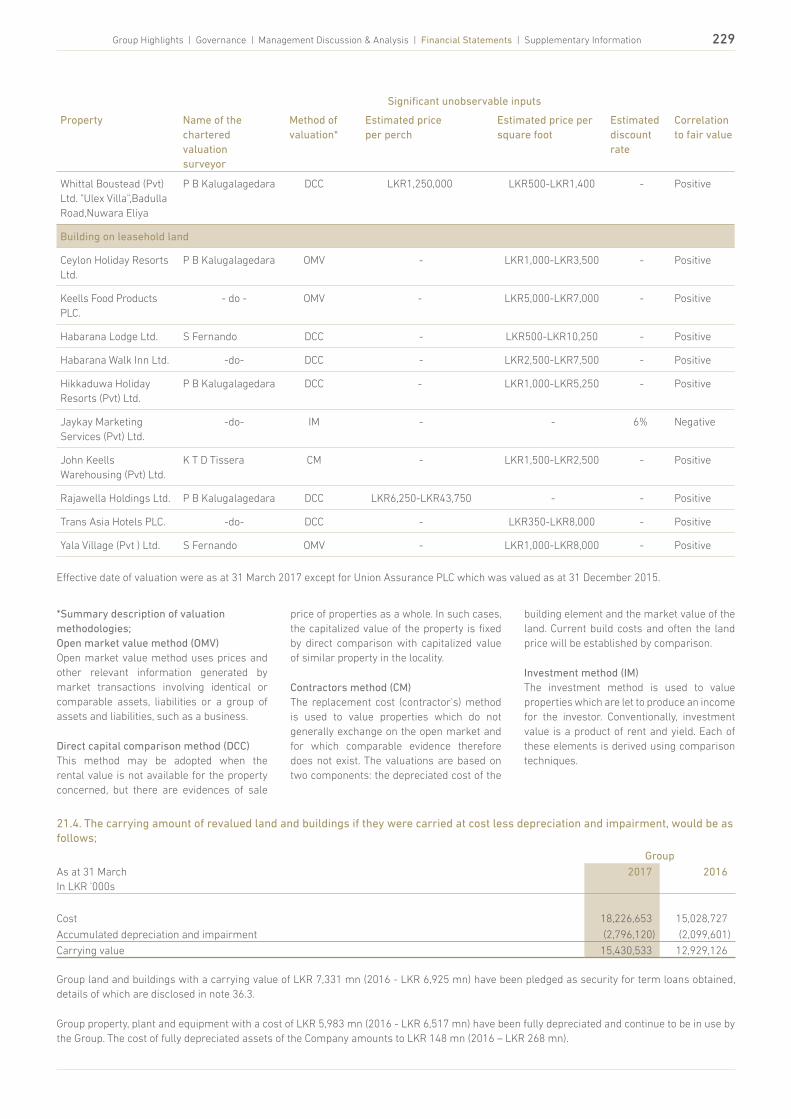
Group Highlights | Governance | Management Discussion & Analysis | Financial Statements | Supplementary Information 229
Significant unobservable inputs
Property Name of the chartered valuation surveyor
Method of valuation*
Estimated price per perch
Estimated price per square foot
Estimated discount rate
Correlation to fair value
Whittal Boustead (Pvt) Ltd. "Ulex Villa",Badulla Road,Nuwara Eliya
P B Kalugalagedara DCC LKR1,250,000 LKR500-LKR1,400 - Positive
Building on leasehold land
Ceylon Holiday Resorts Ltd.
P B Kalugalagedara OMV - LKR1,000-LKR3,500 - Positive
Keells Food Products PLC.
- do - OMV - LKR5,000-LKR7,000 - Positive
Habarana Lodge Ltd. S Fernando DCC - LKR500-LKR10,250 - Positive
Habarana Walk Inn Ltd. -do- DCC - LKR2,500-LKR7,500 - Positive
Hikkaduwa Holiday Resorts (Pvt) Ltd.
P B Kalugalagedara DCC - LKR1,000-LKR5,250 - Positive
Jaykay Marketing Services (Pvt) Ltd.
-do- IM - - 6% Negative
John Keells Warehousing (Pvt) Ltd.
K T D Tissera CM - LKR1,500-LKR2,500 - Positive
Rajawella Holdings Ltd. P B Kalugalagedara DCC LKR6,250-LKR43,750 - - Positive
Trans Asia Hotels PLC. -do- DCC - LKR350-LKR8,000 - Positive
Yala Village (Pvt ) Ltd. S Fernando OMV - LKR1,000-LKR8,000 - Positive
Effective date of valuation were as at 31 March 2017 except for Union Assurance PLC which was valued as at 31 December 2015.
*Summary description of valuation methodologies;Open market value method (OMV)Open market value method uses prices and other relevant information generated by market transactions involving identical or comparable assets, liabilities or a group of assets and liabilities, such as a business.
Direct capital comparison method (DCC)This method may be adopted when the rental value is not available for the property concerned, but there are evidences of sale
price of properties as a whole. In such cases, the capitalized value of the property is fixed by direct comparison with capitalized value of similar property in the locality.
Contractors method (CM)The replacement cost (contractor's) method is used to value properties which do not generally exchange on the open market and for which comparable evidence therefore does not exist. The valuations are based on two components: the depreciated cost of the
building element and the market value of the land. Current build costs and often the land price will be established by comparison.
Investment method (IM)The investment method is used to value properties which are let to produce an income for the investor. Conventionally, investment value is a product of rent and yield. Each of these elements is derived using comparison techniques.
21.4. The carrying amount of revalued land and buildings if they were carried at cost less depreciation and impairment, would be as follows;
Group
As at 31 MarchIn LKR '000s
2017 2016
Cost 18,226,653 15,028,727
Accumulated depreciation and impairment (2,796,120) (2,099,601)
Carrying value 15,430,533 12,929,126
Group land and buildings with a carrying value of LKR 7,331 mn (2016 - LKR 6,925 mn) have been pledged as security for term loans obtained, details of which are disclosed in note 36.3.
Group property, plant and equipment with a cost of LKR 5,983 mn (2016 - LKR 6,517 mn) have been fully depreciated and continue to be in use by the Group. The cost of fully depreciated assets of the Company amounts to LKR 148 mn (2016 – LKR 268 mn).

230 John Keells Holdings PLC | Annual Report 2016/17
Notes to the Financial Statements
22. LeasesAccounting PolicyLeasesThe determination of whether an arrangement contains a lease is based on the substance of the arrangement at the inception date, whether fulfillment of the arrangement is dependent on the use of a specific asset or
23. Investment propertyAccounting policyInvestment properties are measured initially at cost, including transaction costs. The carrying value of an investment property includes the cost of replacing part of an existing investment property, at the time
assets or the arrangement conveys a right to use the asset, even if that right is not explicitly specified in an arrangement.
For arrangements entered prior to 1 April 2011, the date of inception is deemed to be 1 April 2011 in accordance with the SLFRS 1.
Lease rentals paid in advancePrepaid lease rentals paid to acquire land use rights, are amortised over the lease term and assessed for impairment whenever there is an indication that the asset may be impaired.
22.1. Lease rentals paid in advance
Group
As at 31 MarchIn LKR '000s
Note 2017 2016
At the beginning of the year 10,888,158 8,709,033
Addition for the year 2,657,012 607,155
Acquisition of subsidiary (lease hold right) 9.2 - 1,507,818
Amortisation for the year (592,983) (738,407)
Exchange gain/(loss) 253,871 802,559
At the end of the year 13,206,058 10,888,158
Prepaid lease rentals paid in advance to acquire land use rights have been classified as lease rentals paid in advance and are amortised over the lease term in accordance with the pattern of benefits provided.
22.2. Details of lease rentals paid in advance
Amount
Property Land extent(in acres)
Lease period 2017In LKR '000s
2016In LKR '000s
Fantasea World Investment (Pte) Ltd. Chaaya Lagoon Hakuraa Huraa, Republic of Maldives
13.42 33 years from 27-08-2014 326,141 327,438
John Keells Warehousing (Pvt) Ltd. Muthurajawela
6.00 50 years from 19-09-2001 36,935 38,024
Rajawella Holdings Ltd. Digana
517.09 99 years from 02-12-1996 1,496,584 1,516,890
Tea Smallholder Factories PLC. Karawita Tea Factory
4.98 50 years from 15-08-1997 2,655 2,741
The Colombo Ice Company (Pvt) Ltd. Avissawella
9.30 50 Years from 18-07-2016 174,701 -
Tranquility (Pte) Ltd. Chaaya Island Dhonveli, Republic of Maldives
18.62 35 Years from 26-08-2010 9,121,221 6,917,044
Trans Asia Hotels PLC. Colombo
7.65 99 years from 07-08-1981 781,452 793,856
Travel Club (Pte) Ltd. Chaaya Reef Ellaidhoo, Republic of Maldives
13.75 14 years from 04-08-2006 1,207,738 1,230,540
Yala Village (Pvt) Ltd. Kirinda
11.25 30 years from 27-11-1997 58,631 61,625
13,206,058 10,888,158
that cost is incurred if the recognition criteria are met, and excludes the costs of day to- day servicing of the investment property. Subsequent to initial recognition, the investment properties are stated at fair values, which reflect market conditions at the reporting date.
Gains or losses arising from changes in fair value are included in the income statement in the year in which they arise. Fair values are evaluated at least every 3 years by an accredited external, independent valuer.

Group Highlights | Governance | Management Discussion & Analysis | Financial Statements | Supplementary Information 231
Group
As at 31 MarchIn LKR '000s
2017 2016
Carrying value
At the beginning of the year 4,878,406 4,608,941
Additions 4,220 6,590
Change in fair value during the year 483,554 262,875
At the end of the year 5,366,180 4,878,406
Freehold property 5,189,917 4,752,406
Leasehold property 176,263 126,000
5,366,180 4,878,406
Rental income earned 562,215 517,821
Direct operating expenses incurred 187,545 172,132
Accounting judgements, estimates and assumptions Fair value of the investment property is ascertained by independent valuations carried out by Chartered valuation surveyors, who have recent experience in valuing properties of akin location and category. Investment property is appraised in accordance with LKAS 40, SLFRS 13 and the 8th edition of
International Valuation Standards published by the International Valuation Standards Committee (IVSC) by the independent valuers. In determining the fair value, the current condition of the properties, future usability and associated re-development requirements have been considered. Also, the valuers have made reference to market evidence of transaction prices for similar
properties, with appropriate adjustments for size and location. The appraised fair values are rounded within the range of values.
The changes in fair value recognised in the income statement. The determined fair values of investment properties, using investment method, are most sensitive to the estimated yield as well as the long term occupancy rate.
Investment properties are derecognised when disposed, or permanently withdrawn from use because no future economic benefits are expected. Any gains or losses on retirement or disposal are recognised in the income statement in the year of retirement or disposal.
Transfers are made to or from investment property only when there is a change in use
for a transfer from investment property to owner occupied property or inventory (WIP). The deemed cost for subsequent accounting is the fair value at the date of change in use. If owner occupied property becomes an investment property or inventory (WIP), the Group accounts for such property in accordance with the policy stated under property, plant and equipment up to the date
of change in use. Where Group companies occupy a significant portion of the investment property of a subsidiary, such investment properties are treated as property, plant and equipment in the consolidated financial statements, and accounted using Group accounting policy for property, plant and equipment.
Description of valuation techniques used and key inputs to valuation on investment properties:
Significant unobservable inputs
Property Name of the Chartered Valuation Surveyor
* Method of valuation Estimated price per perch
Estimated price per square foot
Estimated discount rate
Correlation to Fair Value
Freehold property
Asian Hotels and Properties PLC. Crescat Boulevard, Colombo 3
P B Kalugalagedara IM - - 6.25% Negative
Ceylon Cold Stores PLC. Inner Harbour Road, Trincomalee
- do - OMV/DCC LKR 1,000,000 LKR 1,000 - LKR 2,000
- Positive
John Keells Properties Ja-Ela (Pvt) Ltd. Kapuwatte
- do - DCC LKR 800,000 LKR 5,500 - Positive
Keells Realtors Ltd. Ferguson Road, Colombo 15.
- do - OMV/DCC LKR 1,700,000 LKR 1,000 - Positive
John Keells PLC. 17/1, Temple Road, Ekala, Ja-Ela.
- do - Market comparable method
LKR 350,000 - LKR 450,000
- - Positive
Facets (Pvt) Ltd. Ahungalla. S Fernando IM - - 9.00% Negative
Leasehold property
Tea Smallholder Factories PLC. Stores Complex, Peliyagoda
P B Kalugalagedara OMV/DCC LKR 900,000 LKR 1,100 - Positive
* Summary description of valuation methodologies can be found in property plant and equipment note no 21.3.

232 John Keells Holdings PLC | Annual Report 2016/17
Notes to the Financial Statements
24. Intangible assetsAccounting policyBasis of recognitionAn Intangible asset is recognised if it is probable that future economic benefits associated with the asset will flow to the Group and the cost of the asset can be reliably measured.
Basis of measurementIntangible assets acquired separately are measured on initial recognition at cost. The cost of intangible assets acquired in a business combination is the fair value as at the date of acquisition.
Following initial recognition, intangible assets are carried at cost less any accumulated amortisation and any accumulated impairment losses.
Internally generated intangible assets, excluding capitalized development costs, are not capitalised, and expenditure is charged to income statement in the year in which the expenditure is incurred.
Useful economic lives, amortisation and impairmentThe useful lives of intangible assets are assessed as either finite or indefinite lives. Intangible assets with finite lives are amortised over the useful economic life and assessed for impairment whenever there is an indication that the intangible asset may be impaired.
The amortisation period and the amortization method for an intangible asset with a finite useful life is reviewed at least at each
financial year-end and treated as accounting estimates. The amortization expense on intangible assets with finite lives is recognised in the income statement.
Intangible assets with indefinite useful lives and Goodwill are not amortised but tested for impairment annually, or more frequently when an indication of impairment exists either individually or at the cash-generating unit level. The useful life of an intangible asset with an indefinite life is reviewed annually to determine whether indefinite life assessment continues to be supportable. If not, the change in the useful life assessment from indefinite to finite is made on a prospective basis.
Present value of acquired in-force business (PVIB)The present value of future profits on a portfolio of long term life insurance contracts as at the acquisition date is recognised as an intangible asset based on a valuation carried out by an independent actuary. Subsequent to initial recognition, the intangible asset is carried at cost less accumulated amortization and accumulated impairment losses.
The PVIB is amortised over the average useful life of the related contracts in the portfolio. The amortisation charge and any impairment losses would be recognised in the consolidated income statement as an expense.
Purchased softwarePurchased software is recognised as an intangible asset and is amortised on a straight line basis over its useful life.
Software licenseSoftware license costs are recognised as an intangible asset and amortised over the period of the related license.
Research and development costsResearch costs are expensed as incurred. An intangible asset arising from development expenditure on an individual project is recognised as an intangible asset, when the Group can demonstrate:
• the technical feasibility of completing the intangible asset so that it will be available for use or sale,
• its intention to complete and its ability to use or sell the assets,
• how the assets will generate future economic benefits,
• the availability of resources to complete the assets and
• the ability to measure reliably the expenditure during development.
Following initial recognition of the development expenditure of an asset, the cost model is applied requiring the asset to be carried at cost less any accumulated amortisation and accumulated impairment losses.
Amortisation of the asset begins when development is complete and the asset is available for use. It is amortised over the period of expected future benefit from the use or expected future sales from the related project. During the period of development, the asset is tested for impairment annually.
A summary of the policies applied to the Group’s intangible assets is as follows.
Intangible assets Useful life Type Impairment testing
PVIB 12
AcquiredWhen indicators of impairment exists. The amortization method is reviewed at each financial year end
Purchased software 5
Software license 5
Developed software 5 Internally generated
Annually for assets not yet in use and more frequently when indicators of impairment arise. Assets in use, when indicators of impairment arise. The amortization method is reviewed at each financial year end.
Gains or losses arising from derecognition of an intangible asset are measured as the difference between the net disposal proceeds and the carrying amount of the asset and are recognised in the income statement when the asset is derecognised.

Group Highlights | Governance | Management Discussion & Analysis | Financial Statements | Supplementary Information 233In
tang
ible
ass
ets
As
at 3
1 M
arch
Gro
upC
ompa
ny
LKR
'000
s 2
017
2016
2017
2016
Sof
twar
e
Not
eD
evel
oped
P
urch
ased
Lice
nses
WIP
PVI
B
Goo
dwill
Oth
erS
oftw
are
licen
ses
Cost
/car
ryin
g va
lue
At t
he b
egin
ning
of t
he y
ear
552
,153
1
81,2
47
599
,337
6
,589
2
,249
,000
7
38,5
96
49,
500
4,3
76,4
22
4,4
28,0
71
491
,081
4
86,8
85
Add
ition
s 2
,854
7
4,39
8 2
7,28
6 9
,860
-
-
-
1
14,3
98
162
,608
6
,746
4
,196
Tran
sfer
s 9
,978
-
-
(9
,978
) -
-
-
-
7
,384
-
Dis
posa
l -
-
-
-
-
-
-
-
(1
0,40
0) -
-
Acq
uisi
tion/
(dis
posa
l) of
sub
sidi
ary
9.2
-
-
-
-
-
-
-
-
4,5
23
-
-
Impa
irm
ent
(1,0
29)
-
-
(23)
-
-
-
(1,0
52)
(215
,764
) -
-
At t
he e
nd o
f the
yea
r 5
63,9
56
255
,645
6
26,6
23
6,4
48
2,2
49,0
00
738
,596
4
9,50
0 4
,489
,768
4
,376
,422
4
97,8
27
491
,081
Acc
umul
ated
am
ortis
atio
n an
d im
pair
men
t
At t
he b
egin
ning
of t
he y
ear
(92,
419)
(115
,033
) (5
19,1
97)
-
(1,3
11,9
13)
-
-
(2,0
38,5
62)
(1,7
08,6
14)
(447
,261
) (4
23,6
02)
Am
ortis
atio
n (7
7,55
6) (3
1,92
3) (3
6,15
1) -
(1
87,4
16)
-
-
(333
,046
) (3
20,5
64)
(19,
765)
(23,
659)
Tran
sfer
s -
-
-
-
-
-
-
-
(6
,385
) -
-
Dis
posa
l -
-
-
-
-
-
-
-
1
,040
-
-
(Acq
uisi
tion)
/dis
posa
l of s
ubsi
diar
y9.
2 -
-
-
-
-
-
-
-
(4
,039
) -
-
At t
he e
nd o
f the
yea
r (1
69,9
75)
(146
,956
) (5
55,3
48)
-
(1,4
99,3
29)
-
-
(2,3
71,6
08)
(2,0
38,5
62)
(467
,026
) (4
47,2
61)
Carr
ying
val
ue
As
at 3
1 M
arch
201
7 3
93,9
81
108
,689
7
1,27
5 6
,448
7
49,6
71
738
,596
4
9,50
0 2
,118
,160
3
0,80
1
As
at 3
1 M
arch
201
6 4
59,7
34
66,
214
80,
140
6,5
89
937
,087
7
38,5
96
49,
500
2,3
37,8
60
43,
820

234 John Keells Holdings PLC | Annual Report 2016/17
Notes to the Financial Statements
24. Intangible assets (Contd.)Present value of acquired in-force business (PVIB)Upon acquiring a controlling stake in Union Assurance PLC . (UA), the Group has recognised in the consolidated financial statements an intangible asset representing the present value of future profits on UA’s portfolio of long term life insurance contracts, known as the present value of acquired in-force business (PVIB) at the acquisition date. Further, PVIB recognised at the acquisition date will be amortised over the estimated life of the business acquired and reviewed annually for any impairment in value.
Net carrying value of goodwill
As at 31 MarchIn LKR '000s
2017
Goodwill acquired through business combinations have been allocated to 5 cash generating units (CGU's) for impairment testing as follows;
Airline Services 5,054
Cinnamon Hotels and Resorts 166,248
Consumer Foods and Retail 299,293
Financial Services 265,360
Logistics, Ports and Shipping 2,641
738,596
The recoverable amounts of all CGUs have been determined based on the fair value, less cost to sell or the value in use (VIU) calculation.
Accounting judgements, estimates and assumptions Impairment of goodwillImpairment exists when the carrying value of an asset or cash generating unit exceeds its recoverable amount, which is the higher of its fair value less costs to sell and its value in use (VIU). The fair value less costs to sell calculation is based on available data from an active market, in an arm’s length transaction, of similar assets or observable market prices less incremental costs for disposing of the asset. The value in use calculation is based on a discounted cash flow model. The cash flows are derived from the budget for the next five years and do not include restructuring activities that the Group is not yet committed to or significant future investments that will enhance the asset’s performance of the cash generating unit being tested. The recoverable amount is most sensitive to the discount rate used for the discounted cash flow model as well as the expected future cash inflows and the growth rate used for extrapolation purposes. The key assumptions used to determine the recoverable amount for the different cash generating units, are as follows;
Gross marginsThe basis used to determine the value assigned to the budgeted gross margins is the gross margins achieved in the year preceding the budgeted year adjusted for projected market conditions.
Discount ratesThe discount rate used is the risk free rate, adjusted by the addition of an appropriate risk premium.
InflationThe basis used to determine the value assigned to the budgeted cost inflation is the inflation rate based on projected economic conditions.
Volume growthVolume growth has been budgeted on a reasonable and realistic basis by taking into account the growth rates of one to four years, immediately subsequent to the budgeted year based on Industry growth rates. Cash flows beyond the five year period are extrapolated using 0% growth rate.
The recoverable amounts of all CGUs have been determined based on the fair value, less cost to sell or the value in use (VIU) calculation.
25.1. Carrying value
Company
As at 31 MarchIn LKR '000s
Note 2017 2016
Investment in subsidiariesCarrying value Investments in subsidiaries
Quoted 25.2 19,216,229 19,101,303
Unquoted 25.3 23,771,166 17,283,343
42,987,395 36,384,646
25. Investment in subsidiariesAccounting policyInvestment In subsidiaries are initially recognised at cost in the financial statements of the Company. Any transaction cost relating to acquisition of investment in subsidiaries is immediately recognised in the income statement. Following initial recognition, Investments in subsidiaries are carried at cost less any accumulated impairment losses.

Group Highlights | Governance | Management Discussion & Analysis | Financial Statements | Supplementary Information 235
25.2. Cost
Group Company
As at 31 March 2017 2017 2016
Number ofshares
Effectiveholding %
Number ofshares
Effectiveholding %
CostLKR ’000s
CostLKR ’000s
Group quoted investments
Asian Hotels and Properties PLC. 347,824,190 78.56 347,824,190 78.56 5,301,660 5,278,888
Ceylon Cold Stores PLC. 77,321,208 81.36 67,109,128 70.61 1,450,473 1,396,691
John Keells Hotels PLC. 1,169,598,478 80.32 1,169,598,478 80.32 7,102,140 7,102,140
John Keells PLC. 52,834,784 86.90 52,834,784 86.90 458,036 444,745
Keells Food Products PLC. 23,350,658 88.53 19,110,399 74.94 1,052,311 1,040,298
Tea Smallholder Factories PLC. 11,286,000 37.62 11,286,000 37.62 63,466 63,466
Trans Asia Hotels PLC. 184,107,284 82.74 97,284,256 48.64 1,604,606 1,601,482
Union Assurance PLC. 55,344,310 93.92 50,981,538 86.51 2,183,537 2,173,593
19,216,229 19,101,303
Group Company
As at 31 MarchIn LKR '000s
2017 2016 2017 2016
Market Value
Group quoted investments
Asian Hotels and Properties PLC. 19,304,243 16,625,996 19,304,243 16,625,996
Ceylon Cold Stores PLC. 62,707,500 33,248,119 54,425,503 28,856,925
John Keells Hotels PLC. 11,695,985 14,035,182 11,695,985 14,035,182
John Keells PLC. 2,699,857 3,698,435 2,699,857 3,698,435
Keells Food Products PLC. 3,385,845 3,969,612 2,771,008 3,248,768
Tea Smallholder Factories PLC. 270,864 220,077 270,864 220,077
Trans Asia Hotels PLC. 13,826,457 14,710,172 7,306,048 7,773,012
Union Assurance PLC. 7,858,892 8,849,555 7,239,378 8,151,948
121,749,643 95,357,148 105,712,886 82,610,343
25.3. Group unquoted investments
Group Company
As at 31 March 2017 2017 2016
Number ofshares
Effectiveholding %
Number ofshares
Effectiveholding %
CostLKR ’000s
CostLKR ’000s
Ahungalla Holiday Resort (Pvt) Ltd. 13,275,000 80.32 - - - -
Beruwala Holiday Resorts (Pvt ) Ltd. 219,725,653 79.78 - - 1,352 1,192
British Overseas (Pvt) Ltd 61 61.00 61 61.00 - 57,001
Ceylon Holiday Resorts Ltd. 12,119,739 79.24 - - 2,742 1,707
Cinnamon Hotels Management Services Ltd. 1,000,000 100.00 1,000,000 100.00 161,507 101,313
Cinnamon Holidays (Pvt) Ltd. 20,000 80.32 - - - -
Facets (Pvt) Ltd. 15,000 100.00 15,000 100.00 - -
Fantasea World Investments (Pte) Ltd. 7,299 80.32 - - 1,736 1,196
Habarana Lodge Ltd. 12,981,548 78.99 - - 3,369 2,705
Habarana Walk Inn Ltd. 4,321,381 79.34 - - 1,643 1,135
Hikkaduwa Holiday Resorts (Pvt) Ltd. 107,596,700 79.24 - - 1,138 974
InfoMate (Pvt) Ltd. 2,000,000 100.00 2,000,000 100.00 29,488 26,568
International Tourists and Hoteliers Ltd. 38,490,901 79.78 - - - -
J K Packaging (Pvt) Ltd. 1,450,000 100.00 1,450,000 100.00 - -
JKOA Mobiles (Pvt) Ltd. 800,000 100.00 800,000 100.00 - -
JayKay Marketing Services (Pvt) Ltd. 282,239,025 81.36 - - 111,355 73,648
John Keells BPO Holdings (Pvt) Ltd. 19,000,000 100.00 - - - -
John Keells BPO International (Pvt) Ltd. 1,500,000,000 100.00 - - - -
John Keells BPO Investments (Pvt) Ltd. 14,700 100.00 - - - -
John Keells BPO Investments (Pvt) Ltd. - Preference A 57,200,000 - - - - -

236 John Keells Holdings PLC | Annual Report 2016/17
Notes to the Financial Statements
Group Company
As at 31 March 2017 2017 2016
Number ofshares
Effectiveholding %
Number ofshares
Effectiveholding %
CostLKR ’000s
CostLKR ’000s
John Keells BPO Solutions Canada (Pvt) Ltd. 5,000 100.00 - - - -
John Keells BPO Solutions India (Pvt) Ltd. 34,131,306 100.00 - - - -
John Keells BPO Solutions Lanka (Pvt) Ltd. 32,843,578 100.00 - - - -
John Keells BPO Solutions US (Pvt) Ltd. 5,000 100.00 - - - -
John Keells Computer Services (Pvt) Ltd. 9,650,000 100.00 9,650,000 100.00 115,738 111,664
John Keells Computer Services (UK) Ltd. 100 100.00 100 100.00 9 9
John Keells Foods India (Pvt) Ltd. 8,999,990 89.65 - - - -
John Keells Holdings Mauritius (Pvt) Ltd. 2,303,225 100.00 2,303,225 100.00 - 38,007
John Keells International (Pvt) Ltd. 199,160,000 100.00 199,160,000 100.00 659,292 1,473,635
John Keells Logistics (Pvt) Ltd. 19,999,998 100.00 19,999,998 100.00 209,049 205,652
John Keells Maldivian Resorts (Pte) Ltd. 49,044,238 80.32 - - 9,934 6,666
John Keells Office Automation (Pvt) Ltd. 500,000 100.00 500,000 100.00 40,291 30,928
John Keells Properties (Pvt) Ltd. 24,000,000 100.00 24,000,000 100.00 192,169 192,169
John Keells Properties Ja-ela (Pvt) Ltd. 95,436,000 100.00 95,436,000 100.00 954,360 954,360
John Keells Residential Properties (Pvt) Ltd. 2,081,698 100.00 2,081,698 100.00 20,817 20,817
John Keells Singapore (Pte) Ltd. 160,000 80.00 160,000 80.00 4,209 4,209
John Keells Stock Brokers (Pvt) Ltd. 1,500,00 90.04 360,000 24.00 46,772 23,162
John Keells Teas Ltd. 12,000 100.00 12,000 100.00 11,903 7,895
John Keells Warehousing (Pvt) Ltd. 12,000,000 86.90 - - 2,680 1,803
Kandy Walk Inn Ltd. 6,165,484 79.03 - - 2,291 1,637
Keells Consultants (Pvt) Ltd. 4,621 100.00 4,621 100.00 1,094 2,554
Keells Realtors Ltd. 7,500,000 95.81 5,100,000 68.00 119,124 30,000
Keells Shipping (Pvt) Ltd. 50,000 100.00 50,000 100.00 502 502
Lanka Marine Services (Pvt) Ltd. 34,805,470 99.44 34,805,470 99.44 1,352,042 1,338,947
Mack Air (Pvt) Ltd. 90,133 100.00 90,133 100.00 14,629 50,221
Mack Air Services Maldives (Pvt) Ltd. 4,900 49.00 4,700 47.00 2,021 2,021
Mackinnon Keells Ltd. 806,443 100.00 806,443 90.00 364,476 11,912
Mackinnon Mackenzie and Company (Shipping) Ltd. 139,112 100.00 - - - -
Mackinnon Mackenzie and Company of (Ceylon) Ltd. 2,645 100.00 245 9.26 - -
Mackinnons Travels (Pvt) Ltd. 499,996 100.00 499,996 100.00 19,888 16,490
Mortlake (Pvt) Ltd. 43 100.00 43 100.00 20,000 327,240
Nuwara Eliya Holiday Resort (Pvt) Ltd. 31,606,252 80.32 - - - -
Rajawella Holdings Ltd. 25,615,561 49.85 11,573,339 45.18 801,707 801,707
Rajawella Hotels Company Ltd. 3,157,384 80.32 - - - -
Resort Hotels Ltd. 106,107 79.24 - - - -
Serene Holidays (Pvt) Ltd. 800,000 98.74 - - - -
The Colombo Ice Company (Pvt) Ltd. 27,000,000 81.36 - - - -
Tranquility (Pte) Ltd. 637,499 80.32 - - 3,187 2,011
Trans-ware Logistics (Pvt) Ltd. 11,000,007 50.00 11,000,007 50.00 114,577 114,577
Travel Club (Pte) Ltd. 29,059 80.32 - - 1,811 1,593
Trinco Holiday Resort (Pvt) Ltd 8,120,005 80.32 - - 1,684 1,167
Trinco Walk Inn Ltd. 3,000,007 80.32 - - - -
Walkers Tours Ltd. 4,925,577 98.51 4,925,577 98.51 169,351 153,359
25. Investment in subsidiaries (Contd.)
25.3. Group unquoted investments (Contd.)
Notes to the Financial Statements

Group Highlights | Governance | Management Discussion & Analysis | Financial Statements | Supplementary Information 237
Group Company
As at 31 March 2017 2017 2016
Number ofshares
Effectiveholding %
Number ofshares
Effectiveholding %
CostLKR ’000s
CostLKR ’000s
Waterfront Properties (Pvt) Ltd. 2,291,082,423 94.52 1,500,266,262 65.48 15,002,663 10,661,871
Whittall Boustead (Pvt) Ltd. 9,917,823 100.00 9,917,823 73.18 2,904,582 137,790
Whittall Boustead (Travel) Ltd. 25,041,000 100.00 25,040,996 99.70 292,230 288,259
Wirawila Walk Inn Ltd. 1,646,750 80.32 - - - -
Yala Village (Pvt) Ltd. 28,268,000 75.33 - - 1,754 1,070
Yala Village (Pvt) Ltd.- Non voting preference shares 10,000,000 80.32 - - - -
23,771,166 17,283,343
26. Investment in equity accounted investeesAccounting policyAn associate is an entity over which the Group has significant influence. Significant influence is the power to participate in the financial and operating policy decisions of the investee, but is not control or joint control over those policies.
Associate companies incorporated in Sri Lanka of the Group which have been accounted for under the equity method of accounting are:
Capitol Hotel Holdings (Pvt) Ltd. Fairfirst Insurance Ltd. (formally known as
Union Assurance General Ltd.) Maersk Lanka (Pvt) Ltd. Nations Trust Bank PLC. Saffron Aviation (Pvt) Ltd. South Asia Gateway Terminals (Pvt) Ltd.
A joint venture is a type of joint arrangement whereby the parties that have joint control of the arrangement have rights to the net assets of the joint venture. Joint control is the contractually agreed sharing of control of an arrangement, which exists only when decisions about the relevant activities require unanimous consent of the parties sharing control.
Joint ventures incorporated in Sri Lanka entered into by the Group, which have been accounted for using the equity method, are: DHL Keells (Pvt) Ltd. NDO Lanka (Pvt) Ltd. Sentinel Reality (Pvt) Ltd.
The considerations made in determining significant influence or joint control are
similar to those necessary to determine control over subsidiaries.
The Group’s investments in its associate and joint venture are accounted for using the equity method.
Under the equity method, the investment in an associate or a joint venture is initially recognised at cost. The carrying amount of the investment is adjusted to recognise changes in the Group’s share of net assets of the associate or joint venture since the acquisition date. Goodwill relating to the associate or joint venture is included in the carrying amount of the investment and is not tested for impairment individually.
The income statement reflects the Group’s share of the results of operations of the associate or joint venture. Any change in OCI of those investees is presented as part of the Group’s OCI. In addition, when there has been a change recognised directly in the equity of the associate or joint venture, the Group recognises its share of any changes, when applicable, in the statement of changes in equity.
Unrealised gains and losses resulting from transactions between the Group and the associate or joint venture are eliminated to the extent of the interest in the associate or joint venture.
The aggregate of the Group’s share of profit or loss of an associate and a joint venture is shown on the face of the statement of profit or loss outside operating profit and represents profit or loss after tax and non-controlling interests in the subsidiaries of the associate or joint venture.
After application of the equity method, the Group determines whether it is necessary to recognise an impairment loss on its investment in its associate or joint venture. At each reporting date, the Group determines whether there is objective evidence that the investment in the associate or joint venture is impaired. If there is such evidence, the Group calculates the amount of impairment as the difference between the recoverable amount of the associate or joint venture and its carrying value, and then recognises the loss as ‘Share of results of equity accounted investees' in the income statement.
Upon loss of significant influence over the associate or joint control over the joint venture, the Group measures and recognises any retained investment at its fair value. Any difference between the carrying amount of the associate or joint venture upon loss of significant influence or joint control and the fair value of the retained investment and proceeds from disposal is recognised in income statement.
The accounting policies of associate companies and joint ventures conform to those used for similar transactions of the Group. Accounting policies that are specific to the business of associate companies are discussed below.
Equity method of accounting has been applied for associate and joint ventures using their corresponding/matching 12 month financial period. In the case of associates, where the reporting dates are different to Group reporting dates, adjustments are made for any significant transactions or events up to 31 March.

238 John Keells Holdings PLC | Annual Report 2016/17
Notes to the Financial Statements
26. Investment in equity accounted (Contd.)
Investment in equity accounted investees
Group Company
As at 31 March Number ofshares
Effective Holding %
2017In
LKR’000s
2016In
LKR’000s
Number ofshares
Effective Holding %
2017In
LKR’000s
2016In
LKR’000s
26.1 . Investments in joint ventures
NDO Lanka (Pvt) Ltd. 7,800,000 60.00 63,041 63,041 7,800,000 60.00 - -
Sentinel Reality (Pvt) Ltd. 5,931,300 40.16 59,313 58,288
DHL Keells (Pvt) Ltd. 1,000,000 50.00 10,000 10,000 1,000,000 50.00 10,000 10,000
26.2. Investments in associatesQuoted
Nations Trust Bank PLC. 68,951,695 29.90 1,561,355 1,561,355 46,121,532 20.00 1,011,052 1,011,052
Unquoted
Capitol Hotel Holdings (Pvt) Ltd. 3,254,832 19.47 325,483 325,483 3,254,832 19.47 325,483 325,483
Fairfirst Insurance Ltd. (formally known as Union Assurance General Ltd.)
68,902,870 20.66 689,718 689,718
Maersk Lanka (Pvt) Ltd. 30,000 30.00 150 150 30,000 30.00 150 150
Saffron Aviation (Pvt) Ltd. 24,887,160 40.00 248,872 248,872 24,887,160 40.00 - -
Saffron Aviation (Pvt) Ltd. preference shares
21,774,750 217,748 174,570 21,774,750 217,748 174,570
South Asia Gateway Terminals (Pvt) Ltd.
159,826,750 42.19 7,346,367 7,346,367 159,826,750 42.19 7,346,367 7,346,367
Cumulative profit accruing to the Group net of dividend
4,335,610 3,886,868
Share of net assets of equity accounted investees
2,861,230 2,584,752
17,718,887 16,949,464 8,910,800 8,867,622
Group's shareholding in Nations Trust Bank PLC.The JKH Group currently holds 29.9% in Nations Trust Bank PLC. (NTB). The Monetary Board had previously directed that the Group reduces its share holdings in NTB to 15% or below by April 2012. The founder shareholders including JKH had written to the Central Bank of Sri Lanka (CBSL) requesting an extension of the deadline and a response is awaited.
Market Value Group Company
As at 31 MarchIn LKR '000s
2017 2016 2017 2016
Quoted
Nations Trust Bank PLC. 5,102,425 5,116,216 3,412,993 3,422,218
26.3 Summarised financial information of equity accounted investees
South Asia Gateway Terminals (Pvt) Ltd.
Other associates Joint ventures Total
As at 31 March In LKR '000s
2017 2016 2017 2016 2017 2016 2017 2016
Group Share of;
Revenue 4,955,789 4,336,078 6,641,880 5,703,083 1,751,781 1,433,929 13,349,450 11,473,090
Operating expenses including cost of sales
(2,988,281) (2,680,375) (5,075,534) (4,327,546) (1,543,168) (1,302,963) (9,606,983) (8,310,884)
Net finance income 35,867 23,599 137,738 130,769 11,185 5,402 184,790 159,770
Tax expense (6,746) (3,720) (555,997) (495,148) (61,559) (41,875) (624,302) (540,743)
Share of results of equity accounted investees
1,996,629 1,675,582 1,148,087 1,011,158 158,239 94,493 3,302,955 2,781,233

Group Highlights | Governance | Management Discussion & Analysis | Financial Statements | Supplementary Information 239
South Asia Gateway Terminals (Pvt) Ltd.
Other associates Joint ventures Total
As at 31 March In LKR '000s
2017 2016 2017 2016 2017 2016 2017 2016
Group share of;
Total assets 6,900,020 7,036,483 74,855,266 58,297,556 618,552 491,455 82,373,838 65,825,494
Total liabilities (1,260,608) (1,298,074) (67,857,907) (52,089,069) (266,426) (218,877) (69,384,941) (53,606,020)
Net assets 5,639,412 5,738,409 6,997,359 6,208,487 352,126 272,578 12,988,897 12,219,474
Goodwill 4,674,278 4,674,278 55,712 55,712 - - 4,729,990 4,729,990
10,313,690 10,412,687 7,053,071 6,264,199 352,126 272,578 17,718,887 16,949,464
Contingent liabilities - - - - - - - -
Capital commitments - - 409,975 593,431 - - 409,975 593,431
Other commitments and Guarantees
- - 42,201,702 32,042,386 - - 42,201,702 32,042,386
Dividend received 2,321,179 2,341,686 383,003 171,799 150,000 75,000 2,854,182 2,588,485
The share of results of equity accounted investees in Income Statement and Other Comprehensive Statement are shown net of all related taxes.
The Group and the Company have neither contingent liabilities nor capital and other commitments towards its associates and joint ventures..
Significant accounting policies that are specific to the business of equity accounted investeesNations Trust Bank PLC.Revenue recognitionRevenue is recognised to the extent that it is probable that the economic benefits will flow to the bank and the revenue can be reliably measured. The following specific recognition criteria must also be met before revenue is recognised.
Interest income and expenseFor all financial instruments interest income or expense is recorded using the EIR. EIR is the rate that exactly discounts estimated future cash payments or receipts through the expected life of the financial instrument or a shorter period, where appropriate, to the net carrying amount of the financial asset or financial liability. The calculation takes into account all contractual terms of the financial instrument (for example, prepayment options) and includes any fees or incremental costs that are directly attributable to the instrument and are an integral part of the EIR, but not future Impairment losses.
The carrying amount of the financial asset or financial liability is adjusted if the Group revises its estimates of payments or receipts. The adjusted carrying amount is calculated based on the original EIR and the change in carrying amount is recorded as ‘Interest Income’ for financial assets and ‘Interest Expense’ for financial liabilities.
Once the recorded value of a financial asset or a group of similar financial assets has been reduced due to an impairment loss, interest
income continues to be recognized using the rate of interest used to discount the future cash flows for the purpose of measuring the impairment loss.
Fee and commission incomeThe Group earns fee and commission income from a diverse range of services it provides to its customers. Fee income can be divided into the following two categories:
Fee income earned from services that are provided over a certain period of timeFees earned for the provision of services over a period of time are accrued over that period. These fees include commission income and asset management, custody and other management and advisory fees. Credit related fees are deferred and recognised as an adjustment to the EIR of the loan.
Fee income from providing transaction servicesFees arising from negotiating or participating in the negotiation of a transaction for a third party, such as the arrangement of the acquisition of shares or other securities or the purchase or sale of businesses, are recognised on completion of the underlying transaction.
Fees or components of fees that are linked to a certain performance are recognised after fulfilling the corresponding criteria.
Net trading incomeResults arising from trading activities include all gains and losses from changes in fair value.
South Asia Gateway Terminals (Pvt) Ltd.Revenue recognitionStevedoring revenue is recognised on the berthing time of the vessel. Storage revenue is recognised on the issue of delivery advice.
South Asia Gateway Terminals (Pvt) Ltd. uses United States Dollar (USD) as their functional currency.
Fairfirst Insurance Ltd. (formally known as Union Assurance General Ltd.)
Revenue recognitionGeneral insurance business-gross written premiumGross written premiums comprise the total premiums received/ receivable for the whole period of cover provided by contracts entered into during the accounting period. GWP is generally written upon inception of the policy. Rebates that form part of the premium rate, such as no-claim rebates, are deducted from the gross written premium
Insurance contract liabilities - generalNon-life insurance contract liabilities include the outstanding claims provision (Reserve for gross outstanding and incurred but not reported, and incurred and not enough reported - IBNR/ IBNER) and the provision for unearned premium and the provision for premium deficiency.

240 John Keells Holdings PLC | Annual Report 2016/17
Notes to the Financial Statements
27. Non current financial assets
Group Company
As at 31 MarchIn LKR '000s
Note 2017 2016 2017 2016
Other quoted equity investments 326 327 - -
Other unquoted equity investments 27.1 160,369 184,456 141,972 166,059
Other non equity investments 27.2 27,505,926 22,450,661 2,648,008 341,346
27,666,621 22,635,444 2,789,980 507,405
27.1. Other unquoted equity investments
Group Company
As at 31 March In LKR '000s
Number ofshares
2017 2016 Number ofshares
2017 2016
Asia Power (Pvt) Ltd. 388,527 141,972 166,059 388,527 141,972 166,059
Other equity instruments - 18,397 18,397 - - -
160,369 184,456 141,972 166,059
27.2. Other non equity investments
Group Company
As at 31 MarchIn LKR '000s
Note 2017 2016 2017 2016
Bank deposits 3,154,685 515,657 2,576,339 -
Debentures 4,244,764 4,939,118 - 268,366
Preference shares 267,275 254,024 - -
Government securities 17,750,289 15,287,098 - -
Loans to executives 27.3 733,037 618,850 71,669 72,980
Loans to life policyholders 902,300 783,373 - -
Cash flow hedge 331,679 - - -
Deposits 121,897 52,541 - -
27,505,926 22,450,661 2,648,008 341,346
27.3. Loans to executives
Group Company
As at 31 MarchIn LKR '000s
2017 2016 2017 2016
At the beginning of the year 786,790 699,330 92,803 82,442
Loans granted/transfers 635,300 433,303 66,469 55,949
Recoveries (504,427) (345,843) (68,951) (45,588)
At the end of the year 917,663 786,790 90,321 92,803
Receivable within one year 184,626 167,940 18,652 19,823
Receivable between one and five years 733,037 618,850 71,669 72,980
917,663 786,790 90,321 92,803

Group Highlights | Governance | Management Discussion & Analysis | Financial Statements | Supplementary Information 241
28. Other non current assets
Group Company
As at 31 MarchIn LKR '000s
Note 2017 2016 2017 2016
Pre paid staff cost 178,726 124,364 16,254 12,414
Work-in-progress - Cinnamon Life project 28.1 41,007,979 35,082,711 - -
Non current advances 505,611 350,073 - -
41,692,316 35,557,148 16,254 12,414
28.1. Work-in-progress - Cinnamon Life project Freehold property* 9,598,213 9,329,665
Leasehold property* 3,618,350 3,506,883
Other constructions in progress 21,538,694 15,948,350
Contractor advances 6,252,722 6,297,813
41,007,979 35,082,711
*The freehold and leasehold properties are located at Glennie Street and Justice Akbar Mawatha, Colombo 2.
Other non-current assets represents the construction work in progress, which mainly consists of freehold land, advance on leasehold land and other project cost incurred. Freehold land included under other non-current asset is carried at cost. Lease prepaid in advance consists of the prepayment made to obtaining the lease land rights for 99 years. Other project cost includes advances paid to contractors, directly attributable cost incurred on the project and capitalised borrowing costs.
Details of the Cinnamon Life projectThe company is engaged in the development and construction of an integrated complex with an approximate area of 4,500,000 square feet, comprising of offices, residential units, service apartments, a hotel and conference centre, retail and associate facilities and a car park.
Details of Freehold Property
Freehold property: Land Occupied Extent: 7A- 0R -16.63P
Details of Leasehold Property
Leased property: Land Occupied Extent: 3A- 0R -6.35P
Lessor: Board of Investment of Sri Lanka
Period: 99 years from 12/02/2014
Lease commitment: Upfront lease rental of LKR3.03 bn
29. InventoriesAccounting policy Inventories are valued at the lower of cost and net realizable value. Net realisable value is the estimated selling price less estimated costs of completion and the estimated costs necessary to make the sale.
The costs incurred in bringing inventories to its present location and condition, are accounted for as follows:
• Raw materials - On a weighted average basis
• Finished goods and work-in-progress - At the cost of direct materials, direct labour and an appropriate proportion of fixed production overheads based on normal operating capacity but excluding borrowing costs
• Other inventories – At actual cost
Group
As at 31 MarchIn LKR '000s
2017 2016
Inventories
Raw materials 527,124 463,186
Finished goods 3,977,944 2,964,930
Produce stocks 216,443 207,349
Other stocks 884,201 1,029,368
Total Inventories at the lower of cost & net realisable value 5,605,712 4,664,833

242 John Keells Holdings PLC | Annual Report 2016/17
Notes to the Financial Statements
30. Trade and other receivables
Group Company
As at 31 MarchIn LKR '000s
Note 2017 2016 2017 2016
Trade and other receivables 11,034,918 9,482,865 99,424 149,321
Reinsurance receivables 30.1 214,342 132,298 - -
Premiums receivable 30.2 253,543 215,846 - -
Loans to executives 27.3 184,626 167,940 18,652 19,823
11,687,429 9,998,949 118,076 169,144
30.1. Reinsurance receivables
Group
As at 31 MarchIn LKR '000s
2017 2016
Reinsurance receivables on outstanding claims 90,342 83,873
Reinsurance receivables on settled claims net of dues 124,000 48,425
Total assets arising from reinsurance contracts 214,342 132,298
30.2. Premiums receivable
Premium receivable 253,543 215,846
253,543 215,846
31. Other current assets
Group Company
As at 31 MarchIn LKR '000s
2017 2016 2017 2016
Prepayments and non cash receivables 1,803,924 962,316 60,301 89,212
Tax refunds 1,461,403 1,341,115 39,141 39,141
3,265,327 2,303,431 99,442 128,353
32. Short term investments
Group Company
As at 31 MarchIn LKR '000s
Note 2017 2016 2017 2016
Quoted equities at market value 32.1 3,433,852 3,006,875 - -
Debentures 1,381,855 631,846 268,306 -
Bank deposits (more than 3 months and less than 1 year) 23,335,897 17,338,169 20,205,768 15,312,664
Government securities (more than 3 months and less than 1 year) 4,234,194 5,156,765 - 4,475,018
32,385,798 26,133,655 20,474,074 19,787,682
Debentures (less than 3 months) 54,671 224,652 - -
Bank deposits (less than 3 months) 26,517,145 25,283,729 23,078,904 23,482,684
Government securities (less than 3 months) 20,216,713 20,993,034 16,690,302 13,591,870
Reported in statement of cash flow 46,788,529 46,501,415 39,769,206 37,074,554
79,174,327 72,635,070 60,243,280 56,862,236

Group Highlights | Governance | Management Discussion & Analysis | Financial Statements | Supplementary Information 243
32.1. Quoted equities at market value
Number of shares Cost Market value
As at 31 March 2017 2016 2017In LKR’000s
2016In LKR’000s
2017In LKR’000s
2016In LKR’000s
Access Engineering PLC. 4,005,642 1,124,524 105,508 33,898 95,334 23,390
Aitken Spence Hotel Holdings PLC. 364,900 490,393 25,931 34,934 12,844 25,991
Aitken Spence PLC. 125,493 650,890 9,004 76,951 4,418 47,840
Alumex PLC. 3,044,222 - 60,761 - 57,840 -
Asiri Hospital Holdings PLC. - 251,297 - 5,805 - 6,032
Cargills (Ceylon) PLC. - 180,968 - 27,335 - 27,145
Central Finance Company PLC. 590,800 285,871 54,445 54,445 50,927 60,033
Ceylinco Insurance PLC. - 5,530 - 7,669 - 8284
Ceylon Cold Stores PLC. - 8,133 - 3,278 - 3497
Ceylon Tobacco Company PLC. - 68,889 - 69,125 - 69,709
Chevron Lubricants Lanka PLC. 942,314 367,677 113,683 80,777 160,193 112,141
Colombo Dockyard PLC. 281,715 281,715 60,500 60,500 21,410 30,454
Commercial Bank of Ceylon PLC. (Non voting) 664,896 654,287 47,645 47,645 68,551 73,935
Commercial Bank of Ceylon PLC. 402,280 2,233,929 41,100 238,932 52,457 280,358
DFCC Bank PLC. 482,072 973,984 81,550 143,891 54,956 133,436
Dialog Axiata PLC. 15,752,754 6,337,348 167,142 59,806 178,006 64,641
Diesel and Motor Engineering PLC. 22,062 22,062 - 33,340 - 12,128
Distilleries Company of Sri Lanka PLC. - 1,090,930 33,340 233,803 12,353 224,949
Hatton National Bank PLC. 3,306,868 2,896,275 525,175 409,681 662,197 544,433
Hemas Holdings PLC. 1,479,150 839,729 94,808 37,446 160,784 67,682
HNB Assurance PLC. 336,266 336,266 23,645 23,645 19,537 18,158
John Keells Holdings PLC. 1,230,182 1,522,660 188,208 271,431 169,642 225,354
Lanka ORIX Finance Company PLC. - 275,713 - 20,852 - 19,851
Melstacorp Limited. 4,117,164 - 222,061 - 243,736 -
National Development Bank PLC. 1,087,945 1,544,335 198,072 281,314 151,877 260,683
Nestle Lanka PLC. - 19,188 - 34,282 - 38,921
People's Insurance Limited. 1,453,951 482,500 25,320 7,238 26,607 8155
Peoples Leasing and Finance PLC. 4,516,116 5,866,532 79,105 112,788 70,451 93,865
Piramal Glass PLC. 14,118,350 2,680,100 84,110 21,502 79,063 13,669
Sampath Bank PLC. 2,013,070 1,540,618 413,261 330,543 521,385 348,180
Textured Jersey Lanka PLC. 6,176,049 1,941,200 203,891 31,534 228,514 61,536
The Bukit Darah PLC. - 45,881 - 32,017 - 16,058
Tokyo Cement Company (Lanka) PLC. 2,175,777 640,777 99,377 7,817 132,722 23,709
Tokyo Cement Company (Lanka) PLC. (Non voting)
3,736,714 1,939,895 137,786 48,859 198,048 62,658
3,095,428 2,883,083 3,433,852 3,006,875
Above list mainly comprises of the investments made by Union Assurance PLC. (UA) under the unit linked equity tracker fund, which invests in the companies that comprise the S&P Price Index.

244 John Keells Holdings PLC | Annual Report 2016/17
Notes to the Financial Statements
33. Stated capital and other components of equityAccounting policyThe ordinary shares of John Keells Holdings PLC are quoted in the Colombo Stock Exchange and the Global Depository Receipts are listed on the Luxembourg Stock Exchange. The holders of ordinary shares are entitled to receive dividends as declared from time to time, and are eligible for one vote per share at General Meetings of the Company. The Group has in place an Employee Share Option Plan. Please refer note 34 for further details.
33.1. Stated capital
As at 31 March 2017 2016
Number of sharesIn ’000s
Value of sharesIn LKR '000s
Number of sharesIn ’000s
Value of sharesIn LKR '000s
Fully paid ordinary shares
At the beginning of the year 1,189,404 58,701,977 997,486 50,702,701
Share options exercised 6,869 911,261 165 26,516
Subdivision of shares 169,915 - 142,498 -
Exercise of share warrants 21,280 3,176,842 49,255 7,972,760
At the end of the year 1,387,468 62,790,080 1,189,404 58,701,977
The number of shares in issue as at 31 March 2017, include global depository receipts (GDRs) of 1,320,942 (2016 - 1,282,364). Further information on the composition of shares in issue is given under the Share Information section of the Annual Report.
35,415,944 shares (2016 - 29,959,331) have been reserved to be issued under the employee share option plan as at 31 March 2017.
33.2. Other components of equity
Group Company
As at 31 March In LKR '000s
2017 2016 2017 2016
Revaluation reserve 28,994,792 20,846,190 - -
Foreign currency translation reserve 8,303,895 7,080,979 - -
Other capital reserve 1,402,656 958,310 1,402,656 958,310
Cash flow hedge reserve 312,529 - - -
Available for sale reserve (362,304) (170,217) 102,220 126,307
38,651,568 28,715,262 1,504,876 1,084,617
Revaluation reserve consists of the net surplus on the revaluation of property, plant and equipment and present value of acquired in-force business (PVIB).
Foreign currency translation reserve comprises the net exchange movement arising on the currency translation of foreign operations and equity accounted investees into Sri Lankan rupees.
The other capital reserve is used to recognise the value of equity-settled share-based payments provided to employees, including key management personnel, as part of their remuneration.
Available for sale reserve includes changes of fair value of financial instruments designated as available for sale financial assets.

Group Highlights | Governance | Management Discussion & Analysis | Financial Statements | Supplementary Information 245
34. Share-based payment plansAccounting PolicyEmployee share option plan - Equity-settled transactionsEmployees of the Group receive remuneration in the form of share-based payment transactions, whereby employees render services as consideration for equity instruments (equity-settled transactions).
The Group applies SLFRS 2 Share Based Payments in accounting for employee remuneration in the form of shares from 1 April 2013 onwards.
The cost of equity-settled transactions are recognised, together with a corresponding increase in other capital reserves in equity, over the period in which the performance and service conditions are fulfilled. The cumulative expense recognised for equity-settled transactions at each reporting date until the vesting date reflects the extent to which the vesting period has expired and the Group’s best estimate of the number of equity instruments that will ultimately vest. The income statement expense or credit for a period represents the movement in
cumulative expense recognized as at the beginning and end of that period and is recognized in employee benefits expense.
No expense is recognised for awards that do not ultimately vest, except for equity-settled transactions where vesting is conditional upon a market or non-vesting condition, which are treated as vesting irrespective of whether or not the market or non-vesting condition is satisfied, provided that all other performance and service conditions are satisfied.
Where the terms of an equity-settled transaction award are modified, the minimum expense recognised is the expense had the terms not been modified, if the original terms of the award are met. An additional expense is recognized for any modification that increases the total fair value of the share-based payment transaction, or is otherwise beneficial to the employee as measured at the date of modification.
The dilutive effect of outstanding options is reflected as additional share dilution in the computation of diluted earnings per share (further details are given in note 18.2).
Employee Share Option SchemeUnder the John Keells Group’s Employees share option scheme (ESOP), share options of the parent are granted to executives of the Group generally with more than 12 months of service. The exercise price of the share options is equal to the 30 day volume weighted average market price of the underlying shares on the date of grant. The share options vest over a period of four years and is dependent on a performance criteria and a service criteria, performance criteria being the minimum performance achievement of "Met Expectations" and service criteria being the employee still being in employment at the time of vesting. The fair value of the share options is estimated at the grant date using a binomial option pricing model, taking into account the terms and conditions upon which the share options were granted.
The contractual term for each option granted is five years. There are no cash settlement alternatives. The Group does not have a past practice of cash settlement for these share options.
Share-based payment plans
Group Company
As at 31 MarchIn LKR '000s
2017 2016 2017 2016
Total expense arising from share-based payment transactions 444,346 395,592 119,822 128,541
Movements in the yearThe following table illustrates the number (No.) and weighted average exercise prices (WAEP) of, and movements in, share options during the year;
Group Company
As at 31 March 2017 2016 2017 2016
No. WAEP No. WAEP No. WAEP No. WAEP
Outstanding at the beginning of the year 23,372,526 197.46 14,015,893 241.42 7,501,984 198.60 4,508,542 241.42
Granted during the year 9,998,000 142.83 6,781,282 171.25 2,692,274 142.83 1,957,332 171.25
Transfers - - - - 1,256,175 167.37 206,837 207.75
Adjustment due to sub division of shares 3,301,351 172.59 2,963,779 198.05 1,062,440 173.68 953,197 199.40
Adjustment due to share warrants 136,944 190.96 324,455 219.03 43,309 190.96 110,200 219.03
Exercised during the year (3,224) 149.84 - - - - - -
Expired during the year (1,340,234) 167.31 (712,883) 202.02 (176,726) 164.93 (234,124) 206.87
Outstanding at the end of the year 35,465,363 164.43 23,372,526 197.46 12,379,456 166.43 7,501,984 198.60
Exercisable at the end of the year 15,044,992 177.30 6,119,220 211.98 5,583,774 178.46 1,910,954 212.82
Accounting judgements, estimates and assumptionsThe Group measures the cost of equity-settled transactions with employees by reference to the fair value of the equity instruments at the date at which they are granted. Estimating fair value for share-based payment transactions require determination of the most appropriate valuation model, which
is dependent on the terms and conditions of the grant. This estimate also requires determination of the most appropriate inputs to the valuation model including the expected life of the share option, volatility and dividend yield and making assumptions about them.
The expected life of the share options is based on historical data and current expectations
and is not necessarily indicative of exercise patterns that may occur. The expected volatility reflects the assumption that the historical volatility over a period similar to the life of the options is indicative of future trends, which may not necessarily be the actual outcome either.

246 John Keells Holdings PLC | Annual Report 2016/17
Notes to the Financial Statements
34. Share-based payment plans (Contd.)The following information were used and results were generated using binomial model for ESOP.
As at 31 March 2017Plan no 9
award 1
2016Plan no 8
award 3
2015Plan no 8
award 2
2014Plan no 8
award 1
Dividend yield (%) 2.18 1.44 1.42 2.07
Expected volatility (%) 21.05 19.19 19.34 27.50
Risk free interest rate (%) 11.91 8.13 8.70 11.26
Expected life of share options (Years) 5.00 5.00 5.00 5.00
Weighted average share price at the grant date (LKR) 142.83 171.25 229.93 253.16
Weighted average remaining contractual life for the share options outstanding (Years)
3.00 3.00 3.00 3.00
Weighted average fair value of options (LKR) 56.29 64.62 61.93 81.54
Exercise price for options outstanding at the end of the year (LKR) 142.83 171.25 229.93 253.16
Exercise price for options outstanding at the end of the year (LKR) (adjusted as at 31-03-2017)
142.83 149.84 176.04 191.65
35. Insurance contract liabilitiesAccounting policyInsurance contract liabilities - lifeThe Directors agree to the long term and unit link insurance business provisions on the recommendation of the actuary following annual valuation of the life insurance business. The actuarial valuation takes into account all liabilities including contingent liabilities and is based on assumptions recommended by the independent external actuary.
35.1. Insurance contract liabilities
Group
As at 31 MarchIn LKR '000s
2017 2016
Insurance contract liabilities 31,161,611 26,704,512
Unclaimed benefits 538,667 500,770
31,700,278 27,205,282
Long duration contract liabilities included in the life insurance fund, result primarily from traditional participating and non participating life insurance products. Short duration contract liabilities are primarily group term, accident and health insurance products.
The actuarial reserves have been established based on the following;
• Non participating liabilities are discounted using risk free yield curve provided by the Insurance Board of Sri Lanka and the participating liabilities are based on the fund yield of the life fund.
• Mortality rates based on published mortality tables adjusted for actual experience as required by regulations issued by the IBSL.
• Surrender rates based on the actual experience.
The amount of policy holder dividend to be paid is determined annually by the UA. The dividend includes life policy holders’ share of net income that is required to be allocated by the insurance contract.
The valuation of the conventional life insurance fund as at The valuation of the conventional life insurance fund as at 31 December 2016 was carried out by Mr. Vivek
Jalan FIA, FIAI of Willis Towers Watson and a sum of LKR 1,100 mn was transferred from the conventional life insurance fund to the shareholders fund for the year 2016. Subsequent to the transfer the conventional life fund stood at LKR 27,703 mn.
Similarly the non unit fund of linked long term business valuation was carried out by Mr. Vivek Jalan FIA, FIAI of Willis Towers Watson and the Non Unit fund as at 31 December 2016 stood at LKR 186 mn. In the opinion of the consultant actuary, the admissible assets of the conventional life insurance fund and the non unit fund of linked long term business as at 31 December 2016 is adequate to cover the liabilities of the funds.

Group Highlights | Governance | Management Discussion & Analysis | Financial Statements | Supplementary Information 247
Group
As at 31 DecemberIn LKR '000s
2016 2015
Conventional life insurance
Balance as at 1 January 23,581,967 20,308,965
Increase in life insurance fund before surplus transfer to share holders 5,123,562 3,927,534
Transfer to shareholders (1,100,000) (760,000)
Net change in unclaimed benefits 97,881 105,468
Balance as at 31 December - Conventional life insurance 27,703,410 23,581,967
Non unit fund of linked life insurance contracts
Balance as at 1 January 149,271 126,911
Increase in non unit fund of linked life insurance before surplus transfer to share holders 35,396 60,986
Transfer to shareholders - (40,000)
Net change in unclaimed benefits 1,605 1,374
Balance as at 31 December - Non unit fund of linked life insurance 186,272 149,271
27,889,682 23,731,238
35.2. Change in life insurance contract liabilitiesThe results of Union Assurance PLC’s (UA) is consolidated into the Group's consolidated income statement. The change in life insurance contract liabilities represents the transfer to the Life Fund, the difference between all income and expenditure attributable to life policy holders during the year.
Group
For the year ended 31 MarchIn LKR '000s
2017 2016
Revenue 8,181,868 6,952,717
Cost of sales (3,262,922) (2,740,644)
Gross profit 4,918,946 4,212,073
Operating expenses including distribution and administration expenses (2,331,918) (2,021,615)
Net finance income 3,556,360 2,044,301
Profit attributable to shareholders of UA (1,274,100) (804,226)
Change in insurance contract liabilities 4,869,288 3,430,533
Accounting judgements , estimates and assumptionsValuation of insurance contract liabilities and investment contract liabilities – Union Assurance PLC (UA) Insurance operations - Product classificationSLFRS 4 requires contracts written by insurers to be classified as either “insurance contracts” or “investment contracts” depending on the level of insurance risk transferred.
Insurance contracts are contracts under which one party (the Insurer) accepts significant insurance risk from another party (the policyholder) by agreeing to compensate the policyholder if a specified uncertain future event (the insured event) adversely affects the policyholder.
Significant insurance risk exists if an insured event could cause an insurer to pay significant additional benefits in any scenario, excluding scenarios that lack commercial substance (i.e. have no discernible effect
on the economics of the transaction). The classification of contracts identifies both the insurance contracts UA issues and reinsurance contracts holds by UA.
Contracts where UA does not assume a significant insurance risk is classified as investment contracts.
Investment contracts are those contracts that transfer significant financial risk and no significant insurance risk. Financial risk is the risk of a possible future change in one or more of a specified interest rate financial instrument price, commodity price, foreign exchange rate, index of price or rates, credit rating or credit index or other variable, provided in the case of a non financial variable that the variable is not specific to a party to the contract.
Once a contract has been classified as an insurance contract, it remains an insurance contract for the remainder of its lifetime, even if the insurance risk reduces significantly during
this period, unless all rights and obligations are extinguished or expire. Investment contracts can, however, be reclassified as insurance contracts after inception if insurance risk becomes significant.
Insurance and investment contracts are further classified as being either with or without discretionary participating features (“DPF”).
Life insurance contract liabilitiesThese liabilities are measured by using the net premium method. The liability is determined as the sum of the discounted value of the expected future benefits, claims handling and policy administration expenses, policyholder options and guarantees and investment income from assets backing such liabilities, which are directly related to the contract, less the discounted value of the expected premiums that would be required to meet the future cash outflows based on the valuation assumptions used. The liability is either based on current assumptions or

248 John Keells Holdings PLC | Annual Report 2016/17
Notes to the Financial Statements
calculated using the assumptions established at the time the contract was issued, in which case, a margin for risk and adverse deviation is generally included. Adjustments to the liabilities at each reporting date are recorded in the income statement in ‘Increase in life insurance contract liabilities’.
The liability is de-recognised when the contract expires, is discharged or is cancelled.
At each reporting date, an assessment is made of whether the recognised life insurance liabilities are adequate, by using an existing liability adequacy test in accordance with SLFRS 4.
For products containing discretionary participating features (DPF) the amount of the DPF is deemed to be the investment
return on all related assets where the apportionment between the shareholder and the policyholder has not yet been determined. The liability includes certain elements of net unrealized gains/(losses) and retained earnings attributable to the DPF, based on the mandated rates applied to these gains and earnings on the assumption that they had been realised as of the statement of financial position date.
The minimum mandated amounts, which are to be paid to policyholders plus any declared/undeclared additional benefits, are recorded in liabilities.
Liability adequacy test (LAT) - Life insuranceAt each reporting date, an assessment is made of whether the recognised life insurance liabilities are adequate by using
an existing liability adequacy test as laid out under SLFRS 4. The liability value is adjusted to the extent that it is insufficient to meet future benefits and expenses. In performing the adequacy test, current best estimates of future contractual cash flows, including related cash flows such as claims handling and policy administration expenses, policyholder options and guarantees, as well as investment income from assets backing such liabilities, are used. A number of valuation methods are applied, including discounted cash flows to the extent that the test involves discounting of cash flows, the interest rate applied based on management’s prudent expectation of current market interest rates.
Any deficiencies shall be recognized in the income statement by setting up a provision for liability adequacy.
36. Interest-bearing loans and borrowings
36.1 Movement
Group Company
As at 31 MarchIn LKR '000s
2017 2016 2017 2016
At the beginning of the year 16,698,430 9,358,789 1,482,508 2,670,784
Loans obtained 3,300,907 409,372 - -
Loans transferred - 10,027,539 - -
Repayments (3,443,821) (4,623,992) (1,469,884) (1,388,100)
Amortization of transaction cost 8,992 37,962 8,992 13,629
Exchange difference and interest accrued 556,982 1,488,760 (21,616) 186,195
At the end of the year 17,121,490 16,698,430 - 1,482,508
Repayable within one year 2,918,854 2,991,582 - 1,482,508
Repayable between one and five years 14,202,636 13,706,848 - -
17,121,490 16,698,430 - 1,482,508
Group interest bearing borrowings include finance lease obligations amounting to LKR 10 mn (2016 - LKR 45 mn), details of which are disclosed in following note.
35. Insurance contract liabilities (Contd.)
35.2. Change in life insurance contract liabilities (Contd.)

Group Highlights | Governance | Management Discussion & Analysis | Financial Statements | Supplementary Information 249
36.2. Finance leases
Group
As at 31 MarchIn LKR '000s
2017 2016
At the beginning of the year 44,865 75,674
Repayments (38,556) (32,397)
Adjustments/transfers 3,825 1,588
At the end of the year 10,134 44,865
Finance lease obligations repayable within one year
Minimum lease payments 10,254 37,740
Finance charges (120) (3,691)
Present value of minimum lease payments 10,134 34,049
Finance lease obligations repayable between one and five years
Minimum lease payments - 10,928
Finance charges - (112)
Present value of minimum lease payments - 10,816
36.3. Security and repayment terms
In LKR '000s LendingInstitution
Nominal Interest rate
Repaymentterms
Details of collaterals
2017 2016
John Keells Holdings PLC.
IFC 6 month LIBOR based plus margin
Bi-annual repayments commencing from December 2009
- - 1,482,508
Group companies
Beruwala Holiday Resorts (Pvt) Ltd.
HNB 1 month SLIBOR based plus margin
74 quarterly installments commencing from April 2013
LKR 3,395mn Primary floating mortgage bond over hotel property
439,683 559,683
Sampath Bank
6 month LIBOR based plus margin
20 quarterly installments commencing from July 2013
Corporate guarantee from John Keells Hotels PLC, amount of USD 4 mn
75,950 132,885
SCB 1 month LIBOR based plus margin
16 quarterly installments commencing from February 2014
Corporate guarantee from John Keells Hotels PLC for LKR equivalent of USD 2 mn
243,040 442,950
Ceylon Cold Stores PLC.
DFCC
DFCC
3 month AWDR based plus margin
3 month AWDR based plus margin
60 equal installments commencing from January 2012
60 monthly installments commencing from October 2012
LKR 2,769 mn Kaduwela land, building and machinery of soft drink plant- do -
-
15,000
39,073
45,000
Habarana Lodge Ltd. Sampath Bank
6 month LIBOR based plus margin
20 quarterly installments commencing from July 2013
Corporate guarantee of John Keells Hotels PLC of USD 2 mn
75,950 132,885
Habib Bank Limited
1 month LIBOR based plus margin
48 monthly installments commencing from July 2013
Corporate guarantee of John Keells Hotels PLC of USD 0.9 mn
6,076 32,483

250 John Keells Holdings PLC | Annual Report 2016/17
Notes to the Financial Statements
36. Interest-bearing loans and borrowings (Contd.)
36.3. Security and repayment terms (Contd.)
In LKR '000s LendingInstitution
Nominal Interest rate
Repaymentterms
Details of collaterals
2017 2016
Hikkaduwa Holiday Resorts (Pvt) Ltd.
DFCC 1 month AWPLR based plus margin
66 monthly installments commencing from November 2013
Primary mortgage over lease rights of LKR 940 mn and LKR 60 mn over movable plant, machinery and equipment
403,495 568,495
Sampath Bank
6 month LIBOR based plus margin
20 quarterly installments commencing from October 2013
Corporate guarantee of John Keells Hotels PLC for the LKR equivalent of USD 4 mn
167,280 295,300
John Keells Maldivian Resorts (Pte) Ltd.
Sampath Bank
6 month LIBOR based plus margin
The loan is payable within 90 days
Fixed deposit of USD 4.4 mn
1,477,455 -
John Keells Properties Ja-Ela (Pvt) Ltd.
Commercial Bank
1 month AWPLR based plus margin
60 monthly installments commencing from April 2014 with 1 year grace period
General terms and conditions for LKR 150 mn signed in relation to the term loan
- 125,000
Commercial Bank
1 month AWPLR based plus margin
60 monthly installments commencing from April 2014
- - 253,393
HSBC 1 month COF based plus margin
60 monthly installments commencing from December 2016.
General terms and conditions for LKR 450 mn signed relating to the term loan
394,907 -
Keells Food Products PLC.
DFCC 3 month AWDR plus margin
60 monthly installments commencing from December 2013 with 1 year grace period
Primary mortgage bond on the building and assets at Pannala
83,704 133,793
Kandy Walk Inn Ltd. HSBC 1 month LIBOR based plus margin
60 monthly installments commencing from October 2013 with 1 year grace period
Land and building value of LKR1,438 mn
91,840 252,933
The Colombo Ice Company (Pvt) Ltd.
HSBC COF based plus margin 60 monthly installments commencing from February 2016 with 1 year grace period
Corporate guarantee of Ceylon Cold Stores PLC for LKR3.8 bn
256,192 -
Trans Asia Hotels PLC.
HNB Fixed rate (annually reviewed)
16 quarterly installments commencing from September 2016
- 370,256 442,951
Travel Club (Pte) Ltd. HSBC 3 month LIBOR based plus margin
8 quarterly installments commencing from December 2014
- - 99,663
HSBC 1 month LIBOR based plus margin
12 quarterly installments commencing from September 2017
- 303,800 -
Trinco Holiday Resorts (Pvt) Ltd.
Sampath Bank
6 month LIBOR based plus margin
20 quarterly installments commencing from April 2014
Corporate guarantee of John Keells Hotels PLC for the LKR equivalent of USD 1.158 mn
70,360 102,588
Sampath Bank
3 month AWPLR based plus margin
83 monthly installments commencing July 2014
Letter of comfort from John Keells Hotels PLC
205,000 216,500

Group Highlights | Governance | Management Discussion & Analysis | Financial Statements | Supplementary Information 251
In LKR '000s LendingInstitution
Nominal Interest rate
Repaymentterms
Details of collaterals
2017 2016
Waterfront Properties (Pvt) Ltd.
Syndicated loan through SCB
1 month LIBOR based plus margin
13 quarterly installments commencing from September 2019
Freehold and leasehold land of LKR 11.4 bn. Additionally, as a part of the sponsor support, John Keells Holdings PLC has pledged 1.5 bn of its shares in Waterfront Properties (Pvt) Ltd.
12,334,739 11,128,070
Yala Village (Pvt) Ltd.
Habib Bank 1 month AWPLR based minus margin
30 monthly installments commencing from July 2014
- 39,666 67,748
Sampath Bank
6 month LIBOR based plus margin
20 quarterly installments commencing from July 2013
Corporate guarantee of John Keells Hotels PLC of USD 1.5 mn
56,963 99,664
17,111,356 16,653,565
JK BPO Solution India (Pvt) Ltd.
DLF Assets (Pvt) Ltd.
Finance lease 10,134 44,865
17,121,490 16,698,430
37. Employee benefit liabilitiesAccounting PolicyEmployee contribution plans - EPF/ETFEmployees are eligible for Employees’ Provident Fund contributions and Employees’ Trust Fund contributions in line with respective statutes and regulations. The companies contribute the defined percentages of gross
emoluments of employees to an approved Employees’ Provident Fund and to the Employees’ Trust Fund respectively, which are externally funded.
Employee defined benefit plan - gratuityThe liability recognised in the statement of financial position is the present value
of the defined benefit obligation at the reporting date using the projected unit credit method. Any actuarial gains or losses arising are recognized immediately in other comprehensive income this was previously recognized in income statement.
Group Company
As at 31 MarchIn LKR '000s
2017 2016 2017 2016
Employee benefit liabilities
At the beginning of the year 1,660,880 1,494,711 189,181 160,456
Current service cost 144,936 133,665 12,967 10,587
Acquisitions - 8,435 - -
Transfers - - 10,528 5,695
Interest cost on benefit obligation 182,697 150,235 19,864 16,046
Payments (219,443) (171,100) (19,940) (6,081)
(Gain)/Loss arising from changes in assumptions 110,758 44,627 5,310 2,478
Exchange translation difference 459 307 - -
At the end of the year 1,880,287 1,660,880 217,910 189,181
The expenses are recognised in the income statement in the following line items;
Cost of sales 149,829 140,319 11,387 10,890
Selling and distribution expenses 30,862 18,484 - -
Administrative expenses 146,942 125,097 21,444 15,743
327,633 283,900 32,831 26,633
Accounting judgements , estimates and assumptions Employee benefit liabilityThe employee benefit liability of the Group is based on the actuarial valuation carried out by Independent actuarial specialists. The actuarial valuations involve making
assumptions about discount rates and future salary increases. The complexity of the valuation, the underlying assumptions and its long term nature, the defined benefit obligation is highly sensitive to changes in these assumptions.
All assumptions are reviewed at each reporting date.
The principal assumptions used in determining the cost of employee benefits were:

252 John Keells Holdings PLC | Annual Report 2016/17
38. Other deferred liabilitiesAccounting policyGovernment grantsGovernment grants are recognised where there is reasonable assurance that the grant will be received and all attached conditions will be complied with. When the grant relates to an expense item, it is recognised as income over the period necessary to match to the costs, that it is intended to compensate. Where the grant relates to an asset, the fair
Notes to the Financial Statements
37. Employee benefit liabilities (Contd.)
As at 31 March 2017 2016
Discount rate 9.50% - 11.00% 10.50%
Future salary increases 6.00% - 10.00% 6.00% - 9.00%
37.1. Sensitivity of assumptions usedA one percentage change in the assumptions would have the following effects:
Group Company
As at 31 MarchIn LKR '000s
2017 2016 2017 2016
Discount rate:
1% Increase (85,863) (76,569) (6,691) (6,040)
1% Decrease 64,966 68,440 7,363 6,538
Salary Increment rate:
1% Increase 65,922 72,446 7,863 7,235
1% Decrease (96,150) (81,420) (7,331) (6,797)
37.2. Maturity analysis of the paymentsThe following payments are expected on employee benefit liabilities in future years
Group Company
As at 31 MarchIn LKR '000s
2017 2016 2017 2016
Within the next 12 months 286,965 236,306 60,239 23,236
Between 1 and 2 years 363,244 418,173 65,281 111,308
Between 2 and 5 years 522,475 466,695 21,792 16,948
Between 5 and 10 years 618,230 386,856 58,446 24,863
Beyond 10 years 89,373 152,850 12,152 12,826
Total expected payments 1,880,287 1,660,880 217,910 189,181
Weighted average duration (years) of define benefit obligation 5.41 4.91 10.20 8.67
value is credited to a deferred income account and is released to the income statement over the expected useful life of the relevant asset by equal annual installments.
Where the Group receives non-monetary grants, the asset and the grant are recorded gross at nominal amounts and released to the income statement over the expected useful life and pattern of consumption of
the benefit of the underlying asset by equal annual installments.
Deferred revenueDeferred revenue is the money received for goods or services which have not yet been delivered. According to the revenue recognition principle, it is recorded as a liability until delivery is made , at which time it is converted to revenue.
Group Company
As at 31 MarchIn LKR '000s
Note 2017 2016 2017 2016
Government grants 772 960 - -
Deferred revenue 838,119 670,286 - -
Deferred purchase consideration - 190,556 103,218 190,556
Amounts due to related parties 43.5 - - - 180,458
838,891 861,802 103,218 371,014

Group Highlights | Governance | Management Discussion & Analysis | Financial Statements | Supplementary Information 253
39. Other non current liabilitiesAccounting policyGroup classifies all non financial non current liabilities under other current liabilities which include non refundable advances and deposits.
Group
As at 31 MarchIn LKR '000s
2017 2016
Advances received 3,740,418 2,963,252
Deposits 193,464 131,929
3,933,882 3,095,181
40. Trade and other payablesAccounting policyTrade payables are the aggregate amount of obligations to pay for goods or services, that have been acquired in the ordinary course of business. Trade payable are classified as current liabilities if payment is due within one year.
Group Company
As at 31 MarchIn LKR '000s
2017 2016 2017 2016
Trade and other payables
Trade and other payables 13,665,569 12,392,889 330,078 332,506
Reinsurance payables 277,284 140,358 - -
Advances and deposits 193,187 222,219 - -
14,136,040 12,755,466 330,078 332,506
Trade and other payables are normally non-interesting bearing and settled within one year. Reinsurance payables normally settled within one year. For further explanation on the Group's liquidity risk management process refer note 10.2.2.
41. Short term borrowings
Group
As at 31 MarchIn LKR '000s
2017 2016
Bank loans 1,380,238 821,243
1,380,238 821,243
42. Other current liabilitiesAccounting policyGroup classifies all non financial current liabilities under other current liabilities.These include non refundable deposits and other tax payables. These liabilities are recorded at amounts expected to be set-off at the reporting date.
Group Company
As at 31 MarchIn LKR '000s
2017 2016 2017 2016
Other current liabilities
Non refundable deposits 1,481,641 1,706,292 2,566 2,566
Other tax payables 1,462,477 528,564 13,875 13,723
2,944,118 2,234,856 16,441 16,289
43. Related party transactionsTerms and conditions of transactions with related partiesThe Group and Company carried out transactions in the ordinary course of business with the following related entities. The list of Directors at each of the subsidiary, joint venture and associate companies have been disclosed in the Group directory under the Supplementary Information section of the Annual Report.
Transactions with related parties are carried out in the ordinary course of the business. Outstanding current account balances at
year end are unsecured, interest free and settlement occurs in cash.
Non-recurrent related party transactionsThere were no any non-recurrent related party transactions which aggregate value exceeds 10% of the equity or 5% of the total assets whichever is lower of the Company as per 31 March 2016 audited financial statements, which required additional disclosures in the 2016/17 Annual Report under Colombo Stock Exchange listing Rule 9.3.2 and Code of Best Practices on Related Party Transactions under the Security Exchange Commission Directive issued under Section 13(c) of the Security Exchange Commission Act.
Recurrent related party transactions,There were no any recurrent related party transactions which in aggregate value exceeds 10% of the consolidated revenue of the Group as per 31 March 2016 audited financial Statements, which required additional disclosures in the 2016/17 Annual Report under Colombo Stock Exchange listing Rule 9.3.2 and Code of Best Practices on Related Party Transactions under the Security Exchange Commission Directive issued under Section 13(c) of the Security Exchange Commission Act.

254 John Keells Holdings PLC | Annual Report 2016/17
43.1. Amounts due from related parties
Group Company
As at 31 MarchIn LKR '000s
Note 2017 2016 2017 2016
Subsidiaries 43.5 215,115 412,187
Equity accounted investees 43.5 111,639 133,031 71,620 182,995
Key management personnel - - - -
111,639 133,031 286,735 595,182
43.2. Amounts due to related parties
Subsidiaries 43.6 209,182 102,135
Equity accounted investees 10,434 28,982 847 -
Key management personnel - - - -
10,434 28,982 210,029 102,135
43.3. Transactions with related parties
Group Company
As at 31 MarchIn LKR '000s
Note 2017 2016 2017 2016
Subsidiaries
Purchases of goods - - 5,004 3,631
Rendering of services 43.5 - - 701,748 638,140
Receiving of services 43.6 - - 48,918 51,957
Rent paid - - 38,729 34,292
Equity accounted investees
Sales of goods 12,460 27,229 - -
Rendering of services 43.5 468,353 412,627 281,929 225,464
Receiving of services 330,436 192,155 193 393
Interest received 43.4 200,565 35,065 87,567 29,589
Interest paid 43.4 7,844 1,794 - -
Key management personnel (KMP)
Sales of goods - - - -
Close family members of KMP
Sales of goods - - - -
Companies controlled / jointly controlled / significantly Influenced by KMP and their close family members
Sales of goods - - - -
Post employment benefit plan
Contributions to the provident fund 262,326 232,437 58,907 54,999
43.4. Transactions with related parties - AssociatesNations Trust Bank PLC.
Interest received 200,565 35,065 87,567 29,589
Interest paid 7,844 1,794 - -
The Group and Company held interest bearing deposits of LKR 2,491mn (2016 - 2,929 mn) and LKR 604 mn (2016 - 2,568 mn) respectively, at Nations Trust Bank PLC as at 31 March 2017.
Notes to the Financial Statements

Group Highlights | Governance | Management Discussion & Analysis | Financial Statements | Supplementary Information 255
43.5. Transactions and amounts due from related parties
Company
Rendering of services Amounts due from
As at 31 March In LKR '000s
2017 2016 2017 2016
Subsidiaries
Asian Hotels and Properties PLC. 34,493 32,028 3,109 3,338
Ceylon Cold Stores PLC. 54,234 45,867 58 4,030
Cinnamon Hotel Management Services Ltd. 92,943 94,328 16,170 5,154
InfoMate (Pvt) Ltd. 23,010 19,608 1,789 576
JayKay Marketing Services (Pvt) Ltd. 79,814 66,395 9,268 3,997
John Keells Logistics (Pvt) Ltd. 17,715 15,281 1,208 2,314
John Keells Office Automation (Pvt) Ltd. 28,291 35,084 1,517 4,577
John Keells PLC. 16,323 16,350 - 1,472
Keells Food Products PLC. 22,790 20,938 2,199 2,339
Lanka Marine Services Ltd. 10,129 8,462 1,040 362,781
Mack Air (Pvt) Ltd. 11,422 11,069 879 1,248
Mackinnons Keells Ltd. 2,476 2,476 124,589 -
Mackinnons Travels (Pvt) Ltd. 12,133 10,390 - -
Trans Asia Hotels PLC. 24,298 22,207 - -
Union Assurance PLC. 51,396 31,376 32,929 3,164
Walkers Tours Ltd. 34,610 31,597 3,696 615
Waterfront properties (Pvt) Ltd. 37,831 34,596 3,606 4,638
Whittall Boustead (Pvt) Ltd. 16,456 14,791 - -
Other subsidiaries 131,384 125,297 13,058 11,944
701,748 638,140 215,115 412,187
Joint ventures 270,305 220,011 70,923 94,431
Associates 11,624 5,453 697 88,564
281,929 225,464 71,620 182,995
43.6. Transactions and amounts due to related parties
Company
Receiving of services Amounts due to
As at 31 March In LKR '000s
2017 2016 2017 2016
Subsidiaries
Current
Asian Hotels and Properties PLC. 5,334 4,481 - -
InfoMate (Pvt) Ltd. 8,157 6,041 - -
John Keells BPO Solutions India (Pvt) Ltd. - - - 6,724
Mack Air (Pvt) Ltd. 1,809 - - -
Mackinnons Travels (Pvt) Ltd. 18,046 23,276 2,221 1,574
Rajawella Holdings Ltd - - 203,104 90,300
Trans Asia Hotels PLC. 4,552 6,957 2,176 2,205
Whittall Boustead (Pvt) Ltd. 8,744 7,901 905 678
Other subsidiaries 2,276 3,301 776 654
48,918 51,957 209,182 102,135
Non-current
Rajawella Holdings Ltd. - - - 180,458

256 John Keells Holdings PLC | Annual Report 2016/17
43. Related party transactions (Contd.)
43.7. Compensation of key management personnelKey management personnel include members of the Board of Directors of John Keells Holdings PLC and its subsidiary companies.
Group Company
For the year ended 31st MarchIn LKR '000s
2017 2016 2017 2016
Short-term employee benefits 410,881 427,632 170,944 185,419
Post employment benefits - - - -
Other long-term benefits - - - -
Termination benefits - - - -
Share based payments 133,911 145,481 55,747 65,688
544,792 573,113 226,691 251,107
Directors' interest in the employee share option plan of the CompanyAs at 31 March 2017, the executive members of the Board of Directors held options to purchase ordinary shares under the employee share option plan as follows;
2017 2016
Expiry date Adjusted exercisepriceLKR
Outstanding atthe end of period
Exercisable atthe end of period
Outstanding atthe end of period
Exercisable atthe end of period
06.12.2016 151.39 - - 1,517,847 1,517,847
30.06.2018 191.65 2,295,814 1,721,859 1,548,202 769,187
30.06.2019 176.04 2,038,537 1,019,268 1,392,774 348,193
24.06.2020 149.84 1,675,073 418,766 1,025,984 -
14.08.2021 142.83 1,575,000 - - -
No share options have been granted to the non-executive members of the Board of Directors under the employee share option plan.
43.8. Gain on share restructure/repurchase transaction - John Keells Holdings PLC In the current year, the Company carried out an exercise to restructure the shareholding of the Company’s investments in a few of its unlisted subsidiaries to reduce the complexity of the shareholding structure. Accordingly, selected companies holding investments in other subsidiaries, transferred its respective investments to the Company, at valuations independently verified with the assistance of external consultants. The exercise was completed via a combination of share buybacks between the unquoted entities within the Group, and its subsidiaries for a consideration of either cash or owners’ shares.
In LKR 000's Transactionvalue
Gain
Shares bought back from
Keells Consultants Ltd 380,145 378,140
Mack Air Ltd. 1,007,985 960,978
Mackinnon Keells Ltd. 900,664 897,647
Mackinnon Mackenzie and Company of (Ceylon) Ltd. 239,745 239,745
Mortlake Ltd 378,410 98,074
Whittall Boustead (Pvt) Ltd 1,093 1,071
2,908,042 2,575,655
Notes to the Financial Statements
44. Contingent liabilitiesAccounting policyProvisions, contingent assets and contingent liabilitiesProvisions are recognised when the Group has a present obligation (legal or constructive) as a result of a past event,
it is probable that an outflow of resources embodying economic benefits will be required to settle the obligation and a reliable estimate can be made of the amount of the obligation. Where the Group expects some or all of a provision to be reimbursed, for example under an insurance contract, the
reimbursement is recognised as a separate asset but only when the reimbursement is virtually certain.
The expense relating to any provision is presented in the income statement net of any reimbursement.

Group Highlights | Governance | Management Discussion & Analysis | Financial Statements | Supplementary Information 257
If the effect of the time value of money is material, provisions are discounted using a current pre-tax rate that reflects, where appropriate, the risks specific to the liability. Where discounting is used, the increase in the provision due to the passage of time is recognised as a finance cost.
All contingent liabilities are disclosed as a note to the financial statements unless the outflow of resources is remote. A contingent liability recognised in a business combination is initially measured at its fair value.
Subsequently, it is measured at the higher of: The amount that would be recognised in accordance with the general guidance for provisions above (LKAS 37) or The amount initially recognised less, when appropriate, cumulative amortisation recognised in accordance with the guidance for revenue recognition (LKAS 18). Contingent assets are disclosed, where inflow of economic benefit is probable.
The contingent liability of the Group and the Company as at 31 March 2017, relates to the following;
John Keells Holdings PLC (JKH)The contingent liability of the Company as at 31 March 2017, relates to the following;
GST & VAT Assessments for the year of assessment 2002/03The company has filed appeals against these assessments and these are currently pending at the Court of Appeal.
Income tax assessment relating to year of assessment 2006/07The company has filed an appeal against this assessment and it is currently pending at the Court of Appeal.
Having discussed with independent legal and tax experts and based on information available, the contingent liability as at 31 March 2017 is estimated at LKR 123 mn.
Lanka Marine Services (Pvt) Ltd. (LMS)The contingent liability of LMS as at 31 March 2017, relates to the following:
Post privatisation turnover tax levied by the Western Provincial CouncilThe Company has disputed this on the basis that its business activity is that of an export. An appeal has been made by the Company to the Western Provincial Council.
Income tax assessment relating to year of assessment 2001/02Assessment was received by the Company based on normal tax rates. The company has appealed against this assessment on the grounds that the sale of bunker to foreign ships is an export, which is liable to concessionary
rates of taxes, but this has been disputed by the Department of Inland Revenue. The appeal made by the company is currently with the Court of Appeal of Sri Lanka.
Income tax assessments relating to years of assessments 2002/03, 2003/04 and 2004/05Assessments were received in January 2009, once again based on normal tax rates. It is the view of the Company, based on opinions from independent legal counsel and tax consultants, that the subject years were statutorily time barred as provided in the Inland Revenue Act. The appeals made by the Company to the Board of Review were transferred to the Tax Appeals Commission (TAC). The TAC determined that the assessments raised were time barred. A case stated has been filed with the Court of Appeal by an application made by the CGIR.
Income tax assessments relating to years of assessments 2005/06, 2006/07, 2007/08 and 2008/09Assessments were received in August 2008, October 2009 and March 2011, consequent to the Supreme Court judgement, whereby the original BOI concessions granted were annulled. Although the assessments were based on normal tax rates the company computed and paid income taxes at concessionary rates of taxes, based on opinions from independent legal counsel and tax consultants, that the supply of bunkers to foreign vessels is an export and therefore eligible to concessionary rates of taxes as provided in the Inland Revenue Act. Appeals were lodged against the balance taxes assessed and penalties charged by the Inland Revenue and the status of each of the appeals are as follows:
2005/06 and 2006/07 The Tax Appeals Commission determined that it has no jurisdiction in respect of appeals relating to these two years and a case stated has been filed with the Court of Appeal by an application made by the CGIR.
2007/08 – The appeal was determined in favour of the CGIR by the Tax Appeals Commission, and a case stated has been filed with the Court of Appeal by an application made by the company.
2008/09 – The appeal was determined in favour of the CGIR by the Tax Appeals Commission. The company intends to file the case stated with the Court of Appeal.
Income tax Assessments relating to years of assessments 2009/2010, 2010/2011 and 2011/2012Assessments were received based on normal tax rates. Appeals have been lodged with the Department of Inland Revenue within the stipulated time period for assessments raised for these years of assessment. All the
above three assessments were confirmed by the Commissioner General of Inland Revenue and the company being aggrieved by the decision has appealed to the Tax Appeals Commission.
Income Tax Assessments relating to years of assessments 2012/2013 and 2013/2014Assessments were received based on normal tax rates. Appeals have been lodged with the Department of Inland Revenue within the stipulated time period.
Having discussed with independent legal and tax experts and based on information available, the contingent liability as at 31 March 2017 is estimated at LKR 1,019 mn.
Mackinnons Travels (Pvt) Ltd (MTL)The contingent liability of MTL as at 31 March 2017, relates to the following;
VAT Assessments received for years of assessments 2009/10 and 2010/2011The company has filed appeals against these assessments with the Inland Revenue Department. The Tax Appeals Commission determined the appeal in favour of the company and upheld the position that the company is entitled to claim zero rated status on its taxable supplies The Department of Inland Revenue is currently awaiting the case stated from the Tax Appeals Commission to make an application to the Court of Appeal.
Having discussed with independent legal and tax experts and based on information available, the contingent liability as a 31 March 2017 is estimated at LKR 26mn.
Union Assurance PLC (UA)The contingent liability of UA PLC as at 31 March 2017, relates to the following;
Income Tax Assessments received for years of assessments 2010/11, 2011/2012, 2012/13 and 2013/14 The Department of Inland Revenue has raised assessments on Union Assurance PLC for the above years of assessment, assessing the Life insurance business to pay income taxes of LKR 13mn, LKR 132mn, LKR 466mn and LKR 175mn respectively. The company has filed valid appeals against these assessments.
Having discussed with independent legal and tax experts and based on information available, the Directors are of the view that the Company has followed due process and acted in accordance with the prevailing laws in its tax submissions for years of assessment 2010 /11, 2011/12, 2012/13 and 2013/14, and accordingly have concluded that the above assessments have no rationale or basis in law.

258 John Keells Holdings PLC | Annual Report 2016/17
46. Lease commitments
Group
As at 31 MarchIn LKR '000s
2017 2016
Lease rentals due on non-cancellable operating leases;
Within one year 562,965 492,294
Between one and five years 1,084,140 1,017,705
After five years 5,391,496 3,739,095
7,038,601 5,249,094
Company Lessor Leased properties
Ceylon Cold Stores PLC. CISCO Speciality Packaging (Pvt) Ltd. Pet bottle plant
Ceylon Holiday Resorts Ltd. Sri Lanka Tourist board Land occupied
Hikkaduwa Holiday Resort (Pvt) Ltd. Sri Lanka Tourist board Land occupied
Fantasea World Investment (Pte) Ltd. Government of Maldives Land occupied
Habarana Lodge Ltd. Kekirawa Divisional Secretariat Land occupied
Habarana Walk Inn Ltd. Kekirawa Divisional Secretariat Land occupied
Jaykay Marketing Services (Pvt) Ltd. Land owners Land occupied
Keells Food Products PLC. Pannala Divisional Secretariat Land occupied
The Colombo Ice Company (Pvt) Ltd. Board of Investment of Sri Lanka Land occupied
Travel Club (Pte) Ltd. Government of Maldives and a sub lease with Ellaidhoo Investments (Pte) Ltd.
Land occupied
Tranquility (Pte) Ltd. Government of Maldives Land occupied
Yala Village (Pvt) Ltd. Sri Lanka Tourist board Land occupied
Waterfront properties (Pvt) Ltd. Board of Investment of Sri Lanka Land occupied
Extent of lease hold land is given in the Group real estate portfolio in the Supplementary section of the Annual Report.
Notes to the Financial Statements
47. Assets pledgedAssets pledged for facilities obtained is given in note 36.3 to the financial statements.
48. Events after the reporting periodFinal dividendThe Board of Directors of the Company has declared a final dividend of LKR 2.00 per share for the financial year ended 31 March 2017. As required by section 56 (2) of the Companies Act No. 07 of 2007, the Board of Directors has confirmed that the Company satisfies the solvency test in accordance with section 57 of the Companies Act No.07 of 2007, and has obtained a certificate from auditors, prior to declaring a final dividend which is to be paid on the 16 June 2017.
In accordance with LKAS 10, Events after the reporting period, the final dividend has not been recognised as a liability in the financial statements as at 31 March 2017.
45. Capital and other commitments
Group Company
As at 31 MarchIn LKR '000s
2017 2016 2017 2016
Capital commitments approved but not provided for 66,186,343 64,837,411 - -
Guarantees 180,913 117,000 180,913 167,145
66,367,256 64,954,411 180,913 167,145