Embed Size (px)
Citation preview

BILL DOUGLAS EVP & CFO
JOHN F. BROCK Chairman & CEO

Forward-Looking Statements
INCLUDED IN THIS PRESENTATION ARE FORWARD-LOOKING MANAGEMENT
COMMENTS AND OTHER STATEMENTS THAT REFLECT MANAGEMENT’S
CURRENT OUTLOOK FOR FUTURE PERIODS.
▸ As always, these expectations are based on currently available competitive,
financial, and economic data along with our current operating plans and are
subject to risks and uncertainties that could cause actual results to differ materially
from the results contemplated by the forward-looking statements.
▸ The forward-looking statements in this presentation should be read in conjunction
with the risks and uncertainties discussed in our filings with the Securities and
Exchange Commission (“SEC”), including our Form 10-K for the year ended
December 31, 2012 and other SEC filings.
2

Agenda
▸OPPORTUNITY
▸GROWTH
▸ SHAREOWNER VALUE
▸CRS and KEY TAKEAWAYS
► SOLID FOUNDATION
3

CCE at a Glance
EUROPE
4
► $8.1 billion net sales
► 30 billion servings annually to 170 million consumers
► 17 production facilities
► ~13,000 employees
10-K 2012

Solid Fundamentals
MARKET1 ~$65B NARTD – A Growing Category
CCE NARTD
SHARE POSITION2
Brands Our Consumers Prefer and a
Successful Value & Volume Position
TRACK RECORD
OF GROWTH3
5
LT Targets 3 Yr CAGR 5 Yr CAGR
Net Sales 4 ─ 6% 7% 5%
OI 6 ─ 8% 6% 7%
EPS HSD 12% 10%
1. Non-alcoholic ready-to-drink AC Nielsen FY12 & Canadean FY11 2. AC Nielsen FY12 3. Long-term targets are comparable & currency neutral; comparable CAGRS, base years represents Legacy CCE EU operating segment except EPS which is total company; 2008-2011 includes segment remeasurement
Vision and Global Operating Framework
#1 OR STRONG #2 IN EVERY CATEGORY WE COMPETE
OUR CUSTOMERS’ MOST VALUED SUPPLIER
A WINNING AND INCLUSIVE CULTURE
Be the best beverage sales and
customer service company
VISION 1
2
3
Drive Consistent Long-Term Profitable Growth
6

Commitment to Shareowners
► Achieve long-term targets
► Return cash to shareowners
DRIVE CONSISTENT LONG-TERM
PROFITABLE GROWTH
7

Agenda
▸GROWTH
▸ SHAREOWNER VALUE
▸CRS and KEY TAKEAWAYS
▸ SOLID FOUNDATION
► OPPORTUNITY
8

~$25B NARTD Measured1
~$40B NARTD non-Measured2
Market – Opportunity Overview
SEGMENTS3
CHANNELS Grocery, Take Home,
and On-Premise
Ready-to-Drink: Sparkling,
Still, and Water
All
Channels
Hot Tea/Coffee,
All Alcohol, Dilutables
Liquid Refreshment Beverages (LRB) is a ~$160B Retail Market in CCE’s Territories
~$95B ALL OTHER2
1. AC Nielsen FY12 2. Canadean FY11 3. Excludes tap/bulk water & dairy
9
RETAIL SIZE

NARTD – Category Growth Opportunity
▸~$65B NARTD Retail Value with a 6+% 3 year CAGR
▸GROW NARTD – European consumption is ~0.6x of US
▸GROW SPARKLING – European consumption is ~0.5x of US
LRB PER CAP MIX OPPORTUNITIES
NARTD Sparkling1 NARTD Other2 All Other Bev2
10 1. FY12 AC Nielsen 2. FY11 Canadean
US CCE Territories
~30% ~15%
~40%
~25%
~30%
~60%

NARTD TOP 5 BRAND OWNERS
NARTD – A Competitive Category
20.2%
6.2%
7.0%
7.0% 2.3%
24.1%
33.2%
Private Label
Other Brand Owners
Orangina/Schweppes
Nestle
Danone
Pepsi
Coca-Cola
VOLUME
28.2%
9.3%
4.2% 3.9% 3.3%
26.5%
24.6%
VALUE
AC Nielsen FY12; Private Label and Other Brand Owners individual companies have value share < 3% 11
19.2%
6.3%
6.8%
7.0% 2.2%
25.0%
33.5%

1
1
1
3
4
NARTD – CCE Category and Segment Rank
CCE STRATEGY
NARTD
Colas
Sparkling Flavors
Energy
Stills
SELECTIVELY GROW VALUE SHARE
VALUE VOLUME
1
1
1
3
5
GROW SEGMENTS
AC Nielsen FY12 12

3%
CCE – Focused on High Value Segments
2 1 1
CATEGORY & CCE MIX
CCE participates in the highest value segments that drive favorable profit mix
1. AC Nielsen FY12 2. 10-K 2012 13
Sparkling Still Water
NARTD Volume NARTD Value CCE Volume
39% 17%
24%
37%
11%
37% 46%
86%

Agenda
14
▸ SHAREOWNER VALUE
▸CRS and KEY TAKEAWAYS
▸ SOLID FOUNDATION
▸OPPORTUNITY
► GROWTH

Capturing the Growth Opportunities
15
OUTSTANDING
MARKETING & EXECUTION
GREAT PEOPLE
SUCCESSFUL BRANDS

COCA-COLA TRADEMARK
SPARKLING FLAVORS AND ENERGY
STILLS
Successful Brand Portfolio
68%
MIX
18%
MIX
14%
MIX
16 10-K 2012

Sparkling – Coca-Cola Trademark
PACKAGE INNOVATION
► MyCoke 1.75 ltr , 375ml & 250ml
BRAND INNOVATION & EXPANSION
► Coke Zero Cherry
► Vanilla Coke
#1 IN VOLUME AND VALUE COLA SHARE IN EVERY TERRITORY
17 AC Nielsen FY12
COKE ZERO VOLUME 12.6% 3YR
CAGR
2009 2010 2011 2012

Sparkling – Flavors
#1 IN VOLUME AND VALUE FLAVORS SHARE
PACKAGE
INNOVATION BRAND INNOVATION &
EXPANSION
► Fanta 1 ltr
► Fanta Fridgepack
► Fanta Peach Apricot
► Sprite w/ Stevia
► Schweppes Summer Punch
18 AC Nielsen FY12

Sparkling – Energy
Energy
Segment
CCE
Brands
Volume 8% 19%
Value 9% 16%
PACKAGE INNOVATION
► Relentless 250/500ml can
► Burn 500ml
BRAND INNOVATION & EXPANSION
► Monster line extensions
► Relentless & Burn Lemon
SWEETENER INNOVATION
► Burn Sugar Free
2012 SEGMENT GROWTH
AC Nielsen FY12 19
CCE OUTPERFORMED THE SEGMENT IN 2012

Stills
PACKAGE INNOVATION
BRAND INNOVATION & EXPANSION
SWEETENER INNOVATION
► Oasis 2 ltr
► Nestea can & 1 ltr
► Oasis Mango &
Lemonade
► VitaminWater
Sunshine
► Ocean Spray
► Nestea
Lemon Stevia
► Oasis Citrus
Punch Light
20

2013 Marketing Calendar
“COKE WITH MEALS”
2013 GROWTH WILL BE DRIVEN BY ‘CORE’ BRANDS
21

Commercials
22

Procurement, Production, and Logistics Excellence
► Pan European scale with global procurement capability
► Flexible & responsive to customers
► Cost efficient & expandable infrastructure
► Responsible & sustainable
23
CUSTOMER CENTRIC SUPPLY CHAIN

Flexible and Efficient Distribution
93%
99%
62%
99%
99%
58%
7%
1%
38%
1%
1%
42%
Indirect Direct
ROUTES TO MARKET
INDIRECT ~90%
DIRECT ~10% through CCE
through customer,
wholesalers, or
3rdparty
Norway mix estimate of EOY13 run rate; included in total company mix 24

CUSTOMER VALUE-CREATION MODEL
Revenue Growth Management (RGM) Excellence
25
► Value-creating selling capabilities
► Investing in technology
► On-line & digital shopping

Optimize Sales and Marketing Structure
CHANNEL-CENTRIC MODEL TO BETTER ALIGN CENTRAL & FIELD SALES
IMPROVE OUR OPERATING MODEL AND PLATFORM
FOR DRIVING SUSTAINABLE FUTURE GROWTH
26
► Best practice evolution
► Proven results in Benelux
► More aligned to customer needs
► Better position to capitalize on opportunities

Hard Discount Channel Opportunity
27
► Large and important consumer channel
► One of the fastest growing channels
► Expanding our business with tailored offerings to better address consumer and customer needs
LEVERAGE OUR CUSTOMER VALUE-CREATION
SELLING MODEL

New Norway Operating Model
DRIVING VALUE FOR CUSTOMERS, CONSUMERS, AND CCE
► ROUTE TO MARKET CHANGE
Facilitating efficiency and tailoring delivery to match
customer preferences
28
► PACKAGING CHANGE
Unlocking value by creating expanded customer and
consumer options
► ENVIRONMENTAL IMPACT
New model expands recycling capabilities and reduces
the impact of production, packaging, and distribution

CRS is one of the top three employee engagement drivers
Focused on driving diversity
Our People
ATTRACT, DEVELOP AND
RETAIN A HIGHLY
TALENTED AND DIVERSE
WORKFORCE
29

Agenda
30
▸CRS and KEY TAKEAWAYS
▸ SOLID FOUNDATION
▸OPPORTUNITY
▸GROWTH
► SHAREOWNER VALUE

Financial Priorities
CONSISTENT earnings in line with
our long-term objectives
MAXIMIZE free cash flow and
maintain financial flexibility
INCREASE return on invested capital
and drive shareowner value
31
DRIVE
CONSISTENT
LONG-TERM
PROFITABLE
GROWTH

Financial Approach
32
CASH FROM OPS
CAPEX
OPTIMIZE CAPITAL STRUCTURE
M&A
RETURN CASH TO SHAREOWNERS
Achieve long-term targets
Invest prudently
Reach and operate within target leverage
Short Term “use” and long-term “source” of cash
Competitive dividend and share repurchase
─
+
=
+/–

GROWTH
Cash from Operations
NET SALES
OPERATING INCOME
GENERATE SOLID FREE CASH FLOW
ACHIEVE LONG-TERM TARGETS
4% – 6%
6% – 8%
Comparable & Currency Neutral 33
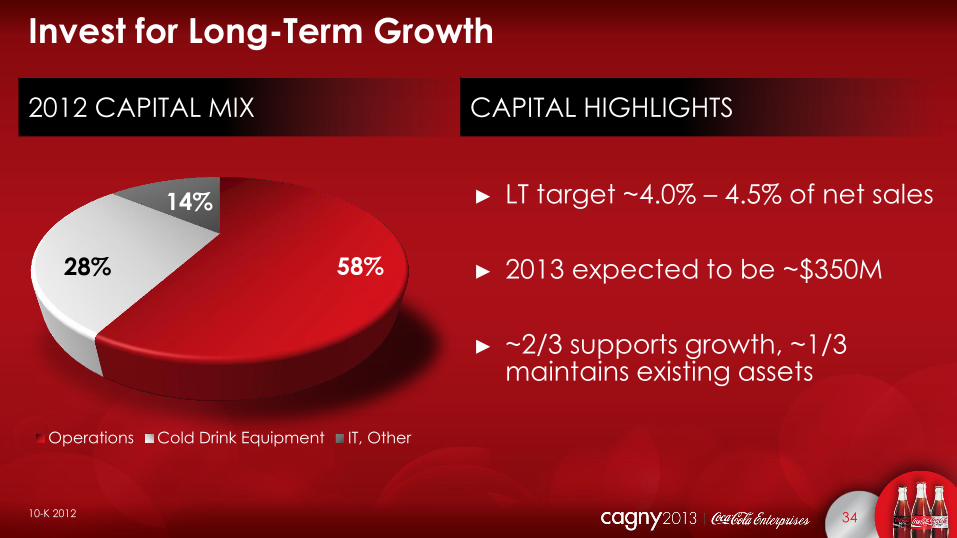
Invest for Long-Term Growth
Operations Cold Drink Equipment IT, Other
58% 28%
14%
2012 CAPITAL MIX CAPITAL HIGHLIGHTS
► LT target ~4.0% – 4.5% of net sales
► 2013 expected to be ~$350M
► ~2/3 supports growth, ~1/3 maintains existing assets
10-K 2012 34
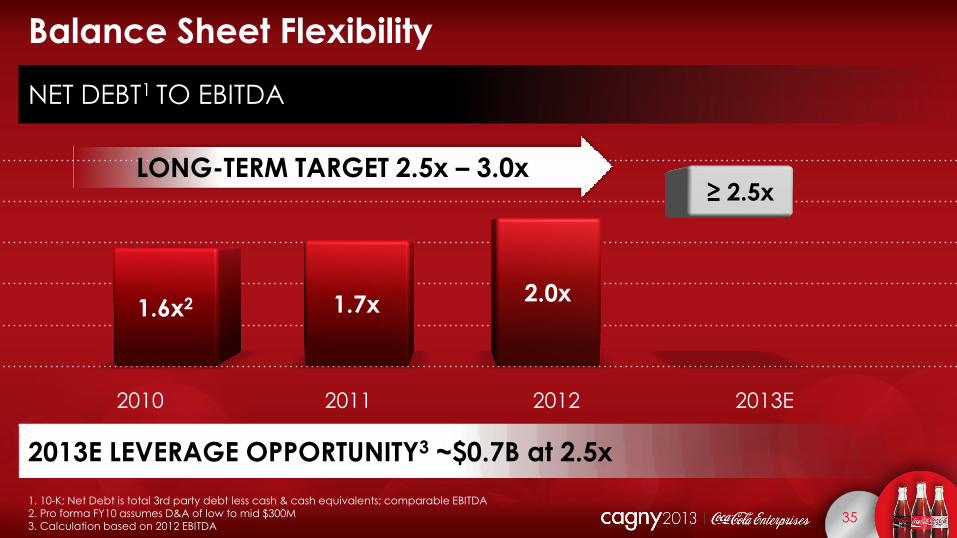
2010 2011 2012 2013E
1.6x2 1.7x 2.0x
≥ 2.5x
Balance Sheet Flexibility NET DEBT1 TO EBITDA
LONG-TERM TARGET 2.5x – 3.0x
2013E LEVERAGE OPPORTUNITY3 ~$0.7B at 2.5x
1. 10-K; Net Debt is total 3rd party debt less cash & cash equivalents; comparable EBITDA 2. Pro forma FY10 assumes D&A of low to mid $300M 3. Calculation based on 2012 EBITDA
35

LONG-TERM DEBT MATURITY ($M)
21201918171615142013
550 525 450 450
250
475
100
600
Balanced Debt Portfolio
10-K; rounded 36
WEIGHTED AVERAGE COST OF DEBT ~3%

OPPORTUNITIES EVALUATED AGAINST ALTERNATIVES,
INCLUDING RETURN OF CASH TO SHAREOWNERS
Investing in High Return Opportunities (including M&A)
OPPORTUNITIES EVALUATION CRITERIA
► Cash flow of existing business
► Incremental value creation by CCE
► Incremental value to CCE’s core business
► Risk, cost, and timeframe
37
► Core business growth
► Adjacent territories and adjacent categories
► Other territories
► New business
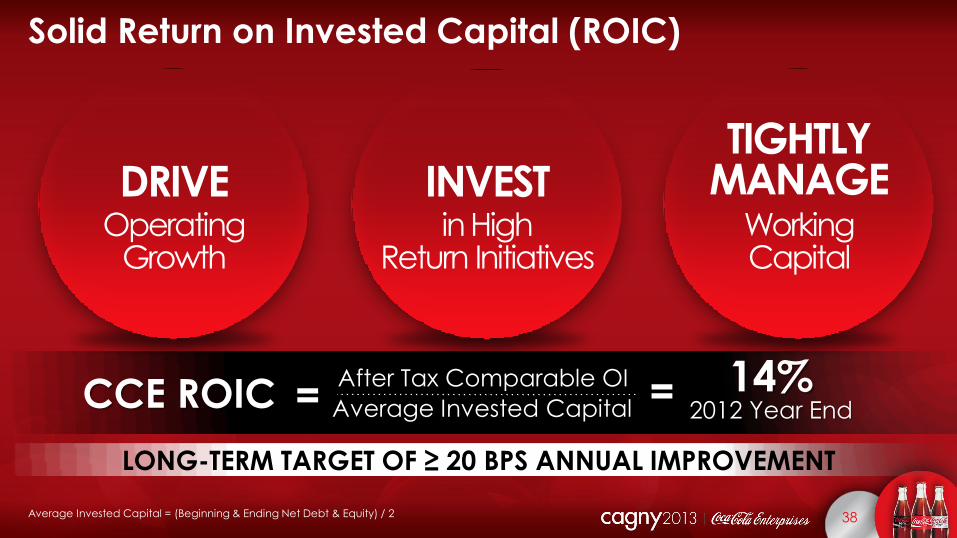
LONG-TERM TARGET OF ≥ 20 BPS ANNUAL IMPROVEMENT
After Tax Comparable OI
Average Invested Capital CCE ROIC 14% 2012 Year End = =
Solid Return on Invested Capital (ROIC)
INVEST in High
Return Initiatives Working Capital
TIGHTLY MANAGE
Operating Growth
DRIVE
Average Invested Capital = (Beginning & Ending Net Debt & Equity) / 2 38

Cash Returned to Shareowners – Dividends
10-K 39
ANNUAL DIVIDEND RATE
$0.60
$0.50
$0.40
$0.30
$0.20
$0.10
$0.70
$0.80
1999 00 01 02 03 04 05 06 07 08 09 10 11 12 13E
2013 RATE INCREASE OF 25%
$0.00

$0.2B
$0.8B
$0.8B
≥$0.5B
Cash Returned to Shareowners – Share Repurchases
≥$2.3B of
share repurchases after formation
of new CCE
through 2013E
2010
2011
2012
2013E
10-K; rounded 40

Presented
during our 2011
Investor Event
Progress Report
41
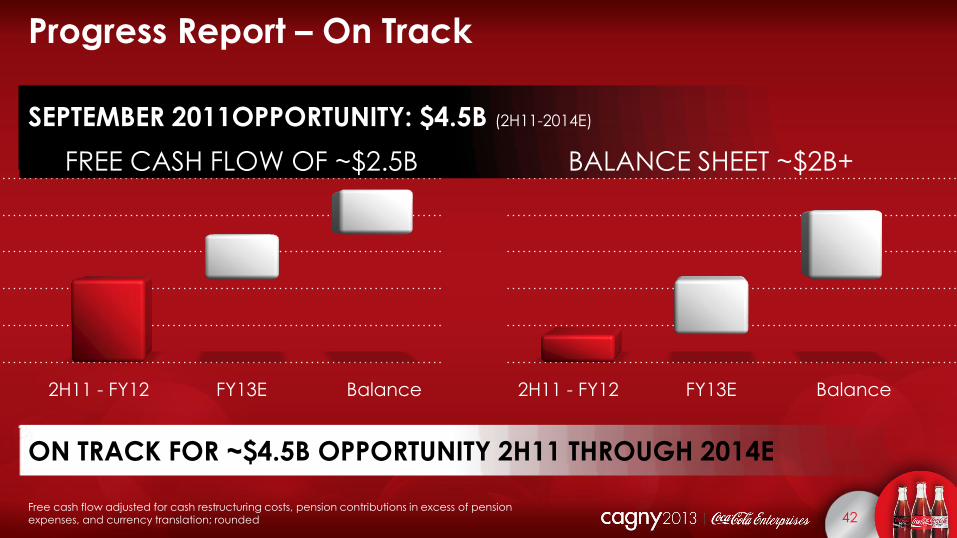
Progress Report – On Track
SEPTEMBER 2011OPPORTUNITY: $4.5B (2H11-2014E)
FREE CASH FLOW OF ~$2.5B BALANCE SHEET ~$2B+
2H11 - FY12 FY13E Balance
42 Free cash flow adjusted for cash restructuring costs, pension contributions in excess of pension expenses, and currency translation; rounded
2H11 - FY12 FY13E Balance
ON TRACK FOR ~$4.5B OPPORTUNITY 2H11 THROUGH 2014E

GROWTH
2013 Outlook
NET SALES
OI
EPS
NEAR TERM, WE EXPECT SOLID BUSINESS RESULTS & SHARE REPURCHASE
TO DRIVE EPS GROWTH ABOVE OUR LONG-TERM OBJECTIVES
2013 GUIDANCE
Mid-Single-Digits
Mid-Single-Digits
~10%
43 Comparable & Currency Neutral

FOCUS ON CONSISTENT LONG-TERM PROFITABLE GROWTH
Key Financial Takeaways
► History of managing the levers of our business to deliver growth
► Favorable and flexible capital structure
► Long-term financial objectives are challenging, yet achievable
► EPS outlook for 2013 exceeds our long-term objectives
44
Agenda
45
▸ SOLID FOUNDATION
▸OPPORTUNITY
▸GROWTH
► CRS and KEY TAKEAWAYS
▸ SHAREOWNER VALUE

CRS Vision and Framework
DELIVER FOR TODAY On our commitments and targets
LEAD THE INDUSTRY In energy and climate change and
sustainable packaging and recycling
INNOVATE FOR THE FUTURE Opportunities for innovation,
collaboration and partnership
STRATEGIC PRIORITIES
We will deliver for today, growing a low carbon, zero waste business, and inspire
and lead change for a more sustainable
tomorrow.
SUSTAINABILITY VISION
DELIVER FOR
TODAY
INSPIRE FOR
TOMORROW
46
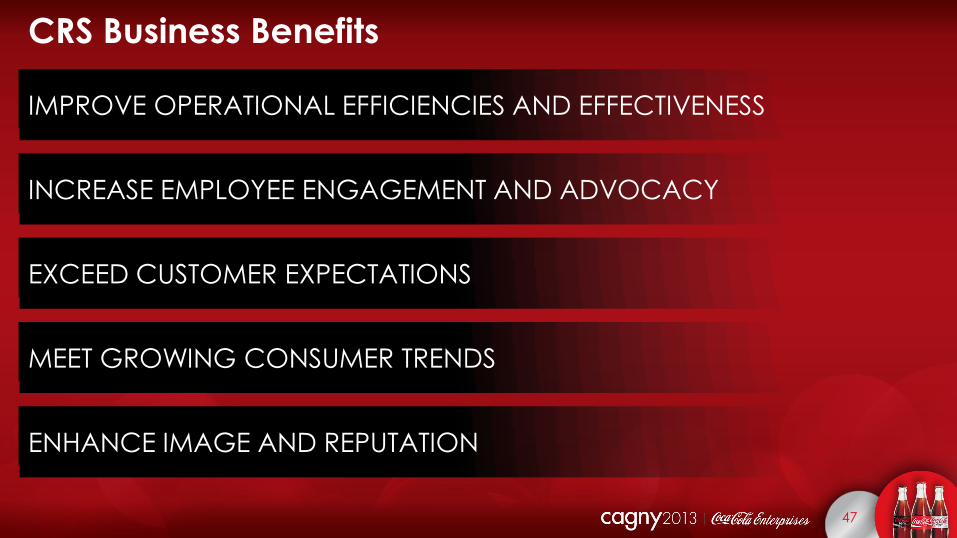
CRS Business Benefits
IMPROVE OPERATIONAL EFFICIENCIES AND EFFECTIVENESS
INCREASE EMPLOYEE ENGAGEMENT AND ADVOCACY
EXCEED CUSTOMER EXPECTATIONS
MEET GROWING CONSUMER TRENDS
ENHANCE IMAGE AND REPUTATION
47

► Water – reduced water use ratio
to 1.4 liters/liter
► Carbon – lowest ever carbon footprint
► Packaging – new recycling joint
ventures and residential recycling study
DECREASING ENVIRONMENTAL IMPACT
WHILE REDUCING COSTS
Key Achievements
48

Gaining External Recognition
CARBON
DISCLOSURE
PROJECT Leadership
Index
49

Business Environment Risks
CHALLENGING MACROECONOMIC ENVIRONMENT
VOLATILE COMMODITY COSTS
INCREASING FOCUS ON HEALTH AND WELLBEING
RISK OF INCREASED TAXES
Though
optimistic
about our outlook,
we are realistic
about key business
environment
risks
50

Key Takeaways
CCE IS EXECUTING OUR STRATEGIC PRIORITIES
► History of solid growth
► Financial priorities focused on long-term profitable growth
► Track record of delivering shareowner value
► Operating environment remains challenging
► In position to deliver our 2013 objectives
51

BILL DOUGLAS EVP & CFO
JOHN F. BROCK Chairman & CEO