Embed Size (px)
Citation preview

Job Satisfaction Among Russian Workers
By: Susan J. Linz
William Davidson Working Paper Number 468
May 2002

Job Satisfaction Among Russian Workers
Susan J. Linz Department of Economics Michigan State University
101 Marshall Hall East Lansing, Michigan 48824
(517) 353-7280 [email protected]
Research Fellow
William Davidson Institute University of Michigan
May 2002 revised March 2003
Research for this paper was supported by a grant from the International Research & Exchanges Board, with funds provided by the U.S. Department of State (Title VIII Program) and the National Endowment for the Humanities. None of these organizations is responsible for the views expressed. I thank Patricia Huddleston and Linda Good for allowing me to modify and use their survey instrument.

Job Satisfaction Among Russian Workers
Abstract
Are Russian workers satisfied with their jobs? If not, why does it matter and what can be done? Empirical evidence based on studies of U.S. workers suggests that job satisfaction tends to correlate positively with labor productivity and negatively with labor turnover, both of which influence firm performance. Improving firm performance without substantially increasing costs is uppermost in the minds of many Russian managers. This paper analyzes the nature and scope of job satisfaction among Russian workers, using survey data to: (1) identify the level of job satisfaction expressed by 1,200 survey participants in response to questions about satisfaction with the job and satisfaction with the work that is done in the job; (2) investigate the variation in job satisfaction explained by differences in worker characteristics – both objective characteristics (age, gender, education, work experience, supervisory responsibilities, unemployment experience, marital status, recent change in workplace, number of jobs held at the time of the interview, for example) and subjective characteristics (attitude toward work); (3) ascertain the link between job satisfaction and select intrinsic and extrinsic job characteristics; and (4) evaluate the extent to which job satisfaction is correlated with alternative measures of organizational commitment. While endogeneity and simultaneity preclude establishing causality, these cross section data do permit evaluation of factors highly correlated with job satisfaction. The specific aim of the paper is to identify factors which increase the probability that a worker will express a high level of job satisfaction. The results will prove useful in designing effective reward structures and/or reducing turnover, as well as establishing management training programs to promote more effective teamwork.
Key Words: Russia, job satisfaction, job characteristics, organizational commitment, gender JEL Classification: J28, P23

Job Satisfaction Among Russian Workers
Workers fared rather poorly during Russia’s transition from a planned economy to a
market economy (Clarke 1996 1998, Gimpel’son and Lippoldt 2001, Glinksaya and Mroz 2000,
Khotkina 2001, Lehmann et al 1999, Linz 2000 2002, Raiklin 1999). For much of the past
decade, falling real wages characterized many occupations, sectors and regions; unpaid wages
accounted for nearly one-third of the wage bill (Goskomstat 2000). Desai and Idson (2000)
provide a detailed account of “work without wages” in the 1990s, complementing existing
studies of the impact of the transition on Russia’s labor market (Clarke 1999, Commander and
Coricelli 1995, Gimpel’son and Lippoldt 1999, Katz 1997, Linz 1995 1996, Newell and Reilly
1996, Reilly 1999, Sabirianova 1998, Standing 1996). This paper takes Russia’s macroeconomic
and labor market conditions as given, focusing instead on how employees perceive their job and
workplace as the transition process draws to a close. In particular, the paper addresses the
question: Are Russian workers satisfied with their jobs?
Why does it matter if Russian workers express a high or low level of job satisfaction?
Several studies based on U.S. workers link job satisfaction to employee performance (Bagozzi
1980, Fisher 1980, Form 1973, Freeman 1978, Iffaldano and Muchinsky 1985, Kalleberg 1977,
Larwood et al 1998, Lopez 1982, Miller and Monge 1986, Petty et al 1984). Finding ways to
promote job satisfaction among Russian workers may enable managers, both domestic and
foreign, to improve their firm’s performance without incurring substantial additional costs. If,
for example, job satisfaction translates into higher labor productivity or lower labor turnover
among Russian workers, firms gain. In Russia’s liquidity-constrained economic environment,
improving firm performance without incurring additional costs appears to be uppermost in the
minds of many managers (Krueger 2003, Linz 2002, Linz and Krueger 1996). Finding ways to
promote job satisfaction among Russian workers may also have positive social consequences in
the form of improved health and family welfare.1 1 The negative consequences of Russia’s transition on the population are well-documented in Braithwaite et al (1999), Clarke (1999), Demko et al (1999), Desai and Idson (2000), Field and Twigg (2000), and Standing (1996), for example. Connections between job satisfaction and overall well-being are discussed in Ensher et al (2001),

2
Are Russian workers satisfied with their jobs? Job satisfaction generally implies a
positive evaluation of work and a positive effect deriving from it; that is, a “positive emotional
state resulting from the appraisal of one’s job or job experiences” (Locke 1976, p. 1300).
Utilizing survey data gathered from 1,200 Russian employees in summer 2000, this paper
analyzes the nature and scope of job satisfaction, with the objective of identifying factors which
increase the probability that a worker will express a high level of job satisfaction. The analysis
focuses on four specific aims: (1) identify the level of reported job satisfaction among the
participating Russian employees, using multiple measures to capture different dimensions of job
satisfaction; (2) investigate the variation in job satisfaction explained by differences in worker
characteristics, where worker characteristics include both objective factors (age, sex, education,
work experience, for example) and subjective factors (attitude toward work); (3) ascertain the
link between job satisfaction and select intrinsic and extrinsic job characteristics; and (4)
evaluate the extent to which job satisfaction is correlated with alternative measures of
organizational commitment. An important component of the paper is the analysis of gender and
generational differences in job satisfaction response patterns, to evaluate whether results
generated in studies of U.S. workers -- job satisfaction is positively correlated with age, but
exhibits no correlation with gender (Hunt and Saul 1975, Janson and Martin 1982, Lorence and
Mortimer 1985, Varca et al 1983, Weaver 1978) -- apply to the Russian employees participating
in this project.
The paper is divided into four parts. Part 1 describes the job satisfaction measures used
in this analysis, providing mean response values for each measure by occupational level, gender,
and generation. The methodology used to identify factors which increase the probability that a
worker will report a high level of job satisfaction is explained in Part 2. Three categories of
factors are examined: objective and subjective respondent characteristics; intrinsic and extrinsic
job characteristics; and degree of organizational commitment, as measured by attitudes
expressed about the workplace. Appendix A contains a description of the participating
Friedlander 1966, Glenn and Weaver (1982), Sousa-Poza and Sousa-Poza (2000).

3
employees. Part 3 presents the empirical results. Among participants in this survey, the
probability that a worker will report a high level of job satisfaction is influenced more by
subjective respondent characteristics – generally positive attitudes toward work – than by
objective respondent characteristics such as gender or generation. Workers reporting high levels
of job satisfaction tend to be those who have a high expectation of receiving a desired job
characteristic, whether it be intrinsic (developing additional skills, learning new things,
accomplishing something worthwhile) or extrinsic (pay, respect of co-workers). Positive
attitudes toward the workplace tend to coincide with a high level of reported job satisfaction. As
in studies of U.S. workers, gender differences are not apparent among the Russian workers
participating in this survey. When significant generational differences emerge, it is the case that
older workers tend to report higher levels of job satisfaction than younger workers. Part 4 offers
concluding remarks.
1. Measures of Job Satisfaction
Since job satisfaction may refer to an employee’s overall evaluation of the job or specific
components or tasks associated with the job (Andrisani 1978), both dimensions are explicitly
addressed in this analysis.2 The first measure of job satisfaction is derived from responses by
employees to the statement: Generally speaking, I am very satisfied with this job (SATISFY1).3
Participants were asked to select a number from 1 to 5, where 1 = strongly disagree and 5 =
strongly agree; 3 is interpreted as a neutral response. For the purposes of this analysis, it is
assumed that the higher the number selected, the greater the level of job satisfaction. A second
measure, using the same format and scale, asks employees to respond to the statement: I am
generally satisfied with the kind of work I do in this job (SATISFY2). A third measure attempts
to capture the level of job satisfaction using a negatively-worded phrase, asking employees to
respond to the statement: I frequently think of quitting this job (THNKQT). In this case, the level 2 In the survey instrument, participants were given the written instruction that: “The purpose of the following section is to give you a chance to tell how you feel about your present job, what things you are satisfied with and what things you are not satisfied with.” Participants were asked to “circle the appropriate answer” for five statements that follow the phrase: “On my present job, this is how I feel about ...”
3 Measures of job satisfaction used in studies of U.S. workers are reported in Freeman (1978) and Petty et al (1984).

4
of job satisfaction is assumed to be inversely related to the numerical response.
To complement direct questions, two additional measures have been used in the literature
to signal job satisfaction (Janson and Martin 1982): whether one would recommend the
workplace to a friend, and whether one would leave the workplace for a slightly higher income
elsewhere. Participants in this survey were asked about the extent to which they agree or
disagree with the following two statements: The offer of a little more money with another
company would not seriously make me think of changing jobs (NOTCHGJB) and I would
recommend a close friend to join this company (RECOMMEN). In both cases, participants were
given a scale of 1 to 5, where 1 = strongly disagree and 5 = strongly agree, with 3 interpreted as
a neutral response.
Finally, in an effort to check the veracity of self-reported job satisfaction, respondents
were asked to identify whether they agree or disagree, on a scale from one to five,4 with the
following two statements about their co-workers: Most people on this job are very satisfied with
the job (ALLSATIS) and People on this job often think of quitting (ALLQUIT). If respondents
report themselves as satisfied but their co-workers as dissatisfied (or vice versa), one would
treat the results somewhat differently than if the two sets of responses are similar.5
Correlation coefficients for each of these seven measures of job satisfaction are reported
in Table 1. Not surprisingly, SATISFY1 and SATISFY2 are highly correlated (.7046).
Moreover, a relatively strong positive correlation holds between the respondent’s self-reported
job satisfaction (SATISFY1, SATISFY2) and the reported perception of co-workers’ satisfaction
(ALLSATIS): .3229 and .3018, respectively. Similarly, THNKQT and ALLQUIT are positively
correlated (.3463). The fact that THNKQT and ALLQUIT are consistently negatively correlated
with the other job satisfaction measures suggests that the response patterns are congruous. 4 In the questionnaire, a 1-5 scale is provided where 1 = strongly disagree and 5 = strongly agree.
5 My concern was to protect against the possibility that workers falsely report themselves as satisfied (in an effort to protect themselves in case their supervisor gains access to the information, for example), but report their co-workers as dissatisfied in order to signal the true situation. Self-reports are considered accurate if the response patterns for these two sets of questions (about the individual, about the co-workers) are consistent. That is, if a positive correlation holds between SATISFY1 (SATISFY2) and ALLSATIS, and THNKQT and ALLQUIT, this is considered to be consistent, and therefore accurate.

5
Are the Russian workers participating in this project satisfied with their jobs? Table 2
provides the mean response for each of the job satisfaction measures. As seen in first panel of
Table 2, respondents were generally satisfied with their own job (SATISFY1) and the kind of
work they do in their job (SATISFY2); mean response rates were 3.79 and 3.86, respectively.6
Indeed, more than one-third of the employees participating in the survey selected “strongly
agree” when asked about their satisfaction with their job (34.7%) and the kind of work they do at
their job (36.3%). Part of the explanation for the high level of job satisfaction expressed by the
Russian workers participating in this survey may lie in the Soviet legacy of the centrality of
work. If work is central to one’s identity or quality of life, as was the case in the Soviet economy
(Gregory and Stuart 1986), it may be culturally difficult to admit dissatisfaction.7
While participants reported themselves to be rather satisfied, they were somewhat less
sanguine about their co-workers’ level of job satisfaction. The fact that respondents were
significantly less likely to say their co-workers were satisfied with their jobs, ALLSATIS = 2.82,
may reflect either an upward bias in the self-reported job satisfaction among the participants in
this survey, or a tendency to weight expressions of dissatisfaction, or “venting,” by co-workers
more heavily than their own in their perceptions of job satisfaction.8 A similar pattern is found
in the two statements regarding quits. Participants in this survey were statistically more likely to
6 Numerous studies of U.S. workers conducted between 1958 and 1977 report response rates exceeding 80% to a question asking participants whether they are satisfied with their job or not. See, for example, Glenn and Weaver (1982), Quinn et al (1974), Katzell (1979). About 2/3rds of the participants in this survey report themselves as satisfied with their job (that is, they selected either 4 or 5 on the scale provided).
7 Strauss (1974) documents response patterns among U.S. workers indicating high levels of satisfaction, even if the job is reported as “boring.” These results are associated with instances where individuals have a high stake in their job or hold their work role as central to their personal identity for whatever reason. See also Gecas (1986).
8 Why is it that workers who report themselves as satisfied with their job and the work that they do in their job are surrounded by co-workers who they regard as dissatisfied? One explanation may be that discussions with co-workers may frequently focus on workplace or job complaints. While respondents’ complaints may be interpreted by their co-workers as exhibiting dissatisfaction, and vice versa, when reporting about themselves, respondents report honestly that they are satisfied with their job and their work. Venting, or sharing complaints with co-workers, may be as routine in Russia as in the U.S. among individuals who find their job and the work that they do in their job to be generally satisfying. The fact that managers are significantly more likely than workers to agree that co-workers are satisfied suggests that workers may not share complaints with their supervisors. Alternatively, managers simply may not “hear” dissatisfaction expressed by their subordinates. There is certainly nothing to be gained by managers saying that their co-workers are dissatisfied, and possibly there is something to be lost.

6
disagree with the statement that they often they think of quitting (2.11) than with the statement
about the frequency that their co-workers think about quitting (2.50).
Reported levels of job satisfaction vary dramatically by occupational level (see Table 2).
Among managers, mean response rates were significantly higher for SATISFY1 and SATISFY2
than for workers.9 Indeed, more than 45% of the participating managers selected “strongly
agree” for both job satisfaction questions. Managers were more willing than workers to
recommend the workplace to their friends (RECOMMEN) and to refuse to consider changing
workplaces for the offer of more money (NOTCHGJB). Managers were significantly less likely
than workers to report themselves as thinking often of quitting.
No significant gender differences emerged in response patterns for SATISFY1 and
SATISFY2, nor were there gender differences in responses related to thoughts of quitting
(THNKQT, ALLQUIT).10 Women participating in this survey were, however, significantly less
likely than men to recommend the workplace to friends (RECOMMEN) and more likely to
consider changing workplaces for the offer of more money (NOTCHGJB).
Generational differences in response patterns to job satisfaction statements were evident
among the participants in this survey. As seen in Table 2, older workers (born before 1965) were
significantly more satisfied with their job and their work than younger workers; older workers
also thought less frequently about quitting.11 Holding age constant, participants with higher
education (more than 15 years of schooling) were significantly more likely to agree with the two
statements that they were satisfied with their job and satisfied with their work, and significantly
more likely to strongly disagree with the statement that they often thought of quitting.12 9 An OLS regression, where the job satisfaction measure is the dependent variable, and a dummy variable for manager (=1 if respondent holds supervisory position, =0 if respondent does not supervise others) as the independent variable, is used to establish whether workers and managers respond significantly differently.
10 OLS regression analysis used to determine whether significant gender differences exist in the job satisfaction measures: dummy variable =1 if woman (=0 if man) is the independent variable. The lack of gender differences in reported job satisfaction is consistent with findings based on surveys of U.S. workers conducted in the 1970s (Hunt and Saul 1975, Weaver 1978).
11 For more general discussion of the importance of age in explaining the level of job satisfaction, see Hunt and Saul (1975), Janson and Martin (1982) Kalleberg and Loscocco (1983), Mortimer et al (1988).
12 Glenn and Weaver (1982), Lincoln and Kalleberg (1985) and Miller (1980) analyze the relationship exhibited by

7
2. Research Methodology: Evaluating Job Satisfaction Among Russian Workers
What factors might increase the probability that a Russian worker will express a high
level of job satisfaction? Survey data gathered from 1,200 Russian employees in summer 2000
are used to address this question. Appendix A contains a description of the sample and sample
selection procedures.
The literature suggests that objective and subjective respondent characteristics are likely
to influence reported levels of job satisfaction (Hulin and Smith 1965, Hunt and Saul 1975,
Janson and Martin 1982, Porter and Steers 1973, Varca et al 1983, Weaver 1974 1978). The
objective respondent characteristics used in this analysis include: gender (WOMAN), age
(YRBORN),13 education (YREDUC),14 marital status (MARRIED),15 recent change in
workplace (CHGJOBS),16 experience with unemployment (UNEMPLOY),17 number of jobs held
at time of survey (NUMJOBS),18 and overall work experience (HOWLONG).19
Subjective respondent characteristics involve attitudes toward work in general.20 In this
survey, participants were asked: whether hard work makes one a better person (BETTERPR);
whether hard work leads to high productivity (WKHPROD), improved performance
U.S. workers between level of education and job satisfaction.
13 YRBORN =1 if the respondent was born after 1964, zero otherwise.
14 YREDUC = number of years of schooling that respondents reported completing.
15 MARRIED =1 if respondent is married at time that survey was completed, zero if respondent is single, widowed, or divorced.
16 Respondents were asked to report the number of times that they had changed places of work in the last five years.
17 Respondents were asked: In the last five years, have you been unemployed ... that is, without work for more than two weeks, when you wanted to be working? Yes = 1.
18 Respondents were asked: Including this job, how many jobs-for-pay do you currently hold? They were given the following options and instructed to select one: __ This is the only regular job that I have; __ Two regular jobs for pay; __ Three regular jobs for pay; __ More than three regular jobs for pay.
19 Respondents were asked: How many years have you worked at this organization?
20 The explanatory power of attitude toward work on the level of job satisfaction is discussed by Beynon and Blackburn (1972), Broom and Glenn (1966), Dubin and Champoux (1974), Friedlander (1966), Schuman (1971), Vroom (1964) and Warr et al (1979).

8
(WKHPERFM), and doing the job well (WKHWELL); and whether a person’s worth is defined
mainly by how well s/he does their job (WORTH). Participants also were asked to identify the
extent to which they agreed with the statements that “when the workday is finished a person
should forget his job” (FORGETJB) and that the “principal purpose of a person’s job is to
provide a means for enjoying free time” (ENJOY). Implicit in this analysis is the assumption
that positive attitudes toward work will be positively correlated with job satisfaction. It is
assumed, for example, that if individuals view work generally as a drudgery or an otherwise
unpleasant experience, it is unlikely that they will express a high level of job satisfaction.
Correlation coefficients for the satisfaction measures and respondent characteristics are
first calculated (see Table 3), and then ordered probit regression analysis is used to evaluate the
extent to which objective and subjective respondent characteristics increase the probability that a
worker will express a high level of job satisfaction.
Job satisfaction among U.S. workers appears to be highly correlated with intrinsic and
extrinsic job characteristics (Glick et al 1986, Glisson and Durick 1988, Hackman and Oldham
1975, Gerhart 1987, Lawler 1970). Intrinsic job characteristics are those factors which influence
the perceptions or feelings of workers about themselves and their work and/or motivate workers
to work harder or better. The literature identifies a number of questions which are asked in this
survey to address different dimensions of intrinsic job characteristics: does the job make the
individual feel good about himself/herself; does the job provide an opportunity to learn or
develop skills; does the job generate for the individual a sense of accomplishment; does the
individual feel a sense of freedom on the job. To the extent that these factors are important to
Russian workers, one would expect to find a positive correlation between the reported level of
job satisfaction and these intrinsic job characteristics. This correlation would be especially
strong if workers attach a high probability to experiencing these job characteristics at their
current place of employment.
In this analysis, five intrinsic job characteristics used in the Huddleston and Good survey
(1999) are evaluated. The intrinsic job characteristic variables used here are constructed from
responses relating to the importance of the variable and responses relating to the expectation of

9
receiving that same variable. That is, participants were asked: How important is the chance you have to do something at your job that makes you feel
good about yourself as a person? How important to you at your job is the opportunity to develop your skills and abilities?
How important to you at your job is the chance you have to learn new things? How important to you at your job is the chance you have to accomplish something
worthwhile?
How important to you is the amount of freedom you have on your job?
In each case, participants were given a scale of 1 to 5, where 1 = not important and 5 = extremely
important. These questions were followed by a second series of questions asking participants
about the likelihood that they would experience these elements at their current workplace, where
participants were once again given a five-point scale, but this time 1 = not at all likely, and 5 =
extremely likely. The intrinsic job characteristic variables are constructed by subtracting the
“likelihood” value (from the second set of questions) from the “importance” value (from the first
set of questions). The underlying presumption here is that the greater the perceived likelihood of
experiencing a desired characteristic, the more likely the respondent will report a high level of
job satisfaction.
Extrinsic job characteristics reflect outcomes generated by performing the job: pay,
promotion, job security, friendliness and respect of co-workers, praise from supervisors, for
example. I expect to find a positive correlation between extrinsic job characteristics and job
satisfaction.
The extrinsic job characteristics used in this analysis are constructed using responses to
questions about the importance of a particular variable and responses to questions about the
likelihood of receiving that same variable. In particular, the following six questions were asked
of the participants in this survey:
In your job, how important to you is the amount of pay that you receive?
How important to you is the amount of job security you have? How important to you is your chance at getting a promotion or better job within the
company?

10
How important to you is the respect you receive from your co-workers?
How important to you is the praise that you get from your supervisor?
How important to you at your job is the friendliness of your co-workers?
For each question, respondents were given a five-point scale, where 1 = not important and 5 =
extremely important. A second series of questions uses the same format and scale, but asks
about the likelihood of experiencing each characteristic. Subtracting the “likelihood” values
from the “importance” values gives the extrinsic job characteristic variable values used in this
analysis.
Table 4 reports the mean values of the intrinsic and extrinsic job characteristic variables
used in this analysis. Among the participants in this survey, the biggest gap between the
“importance” and “likelihood” values occurs for LEARN, FREEDOM and SKILLS among the
intrinsic characteristics, and for PAY and PROMOTN among the extrinsic characteristics. As
seen in Table 4, there are significant gender and generational differences in response patterns –
the gap between the “importance” and “likelihood” values is consistently higher for women and
older workers.21 Ordered probit regression analysis is used to evaluate the extent to which these
intrinsic and extrinsic job characteristics increase the probability that a worker will express a
high level of job satisfaction.
Finally, this paper addresses the link between job satisfaction and organizational
commitment (Mathieu and Hamel 1989, Morrison 1997, Porter et al 1974, Reichers 1985, Shore
and Martin 1989). Organizational commitment, referring to the attachment to one’s place of
work, is used in the literature to assess the likelihood among workers of turnover, absenteeism,
and improved job performance (Angel and Perry 1981, Bartol 1979, Darden et al 1989, Dunham
et al 1994, Mowday et al 1979, Weiner and Vardi 1980). While causality between
organizational commitment and job satisfaction has not been established, research linking job
satisfaction and organizational commitment has focused on (1) evaluating the role of respondent
21 OLS regression analysis using the gap variable as the dependent variable and dummy variables for gender and generation as the independent variables generated the significance test results.

11
characteristics in determining the level and variation in each (Ensher et al 2001, Elizur and
Koslowsky 2001); (2) finding ways to predict and thus reduce employee turnover (Ben-Bakr et
al 1994, Hatcher 1999, Ketchand and Strawson 1998, Poznanski and Bline 1997); (3) identifying
possible mechanisms to increase job performance (Putterill and Rohrer 1995, Yousef 1998); and
(4) exploring differences in organization commitment measures across cultures (Ibrahim and Rue
1994, Lincoln and Kalleberg 1996, Putterill and Rohrer 1995, Yousef 1998). Here, the objective
is to assess the level and variation in organizational commitment among the Russian workers
participating in this survey, as well as to analyze the extent to which it influences the probability
that a worker will express a high level job satisfaction.
Seven statements in the survey instrument address different dimensions of organizational
commitment (see Table 5). In each case, participants were asked to indicate their level of
agreement or disagreement with each statement, using a 5-point scale, where 1 = strongly
disagree and 5 = strongly agree. In five of the seven statements, the higher the score, the greater
the degree of organizational commitment. I expect that these variables will be positively
correlated with the job satisfaction measures (SATISFY1, SATISFY2). Two questions (QUIT,
DONOMORE) were worded in a negative way, so that the lower the score, the greater the degree
of organizational commitment. These variables should be negatively correlated with the job
satisfaction measures (SATISFY1, SATISFY2).
The bottom panel of Table 5 presents the mean response by occupation, gender and
generation. Managers consistently exhibited a stronger degree of organizational commitment
than workers. Gender differences in response patterns occur in only one instance (CONTRIB).
Generational differences are more frequent – older workers tend to exhibit a stronger degree of
organizational commitment than younger workers. Ordered probit regression analysis is used to
identify the impact of these organizational commitment variables on the probability that a worker
will express a high level of job satisfaction.
3. Empirical results
Does the level of reported job satisfaction vary significantly among the 1,200 Russian
employees participating in this survey? Table 6 provides the ordered probit regression results

12
generated from the question: to what extent do respondent characteristics influence the
probability that a worker will report a high level of job satisfaction? Because of the similarity of
the results across the different measures of job satisfaction, only four are reported in Table 6:
SATISFY1, SATISFY2, THNKQT and RECOMMEN.
In all seven specifications, where job satisfaction measures are the dependent variable
and respondent characteristics are the independent variables, subjective respondent
characteristics, that is, attitudes toward work in general, were more influential than objective
characteristics in explaining the probability that a worker would report a high level of job
satisfaction. More specifically, in all seven specifications, the probability that a worker would
report a high level of job satisfaction was greatest among those who believe that hard work
makes one a better person (BETTERPR), working hard leads to high productivity (WKHPROD),
working hard leads to doing my job well (WKHWELL), and who disagree with the statement
that when the workday is finished, a person should forget his job and enjoy himself
(FORGETJB). In two specifications, SATISFY2 and RECOMMEN, how long a respondent had
worked at the company (HOWLONG) was influential, and when SATISFY2 was the measure of
job satisfaction, married respondents also exhibited a higher probability of reporting themselves
satisfied with the work that they do in their job. Gender was not significant in any specification.
Generation emerged as significant only when ALLSATIS was used as the measure of job
satisfaction.
These results suggest a number of strategies managers might pursue to increase job
satisfaction among their workers, as well as strategies to avoid. In the hiring process, for
example, certain “screening” questions might be asked to identify individuals who have
generally positive attitudes toward work.22 Establishing measures of job “success,” and then
recognizing and celebrating employees who achieve these measures (picture or name posted
prominently on an “award board,” for example) may increase the level of job satisfaction by
creating a stronger link between behavior, attitude and outcome. Managers need not target 22 The questions used in this survey would not be appropriate employment screening questions, however. Potential employees would likely “strongly agree” with all, regardless of their actual beliefs.

13
workers by gender or generation in constructing teams or devising policies to enhance job
satisfaction, however.
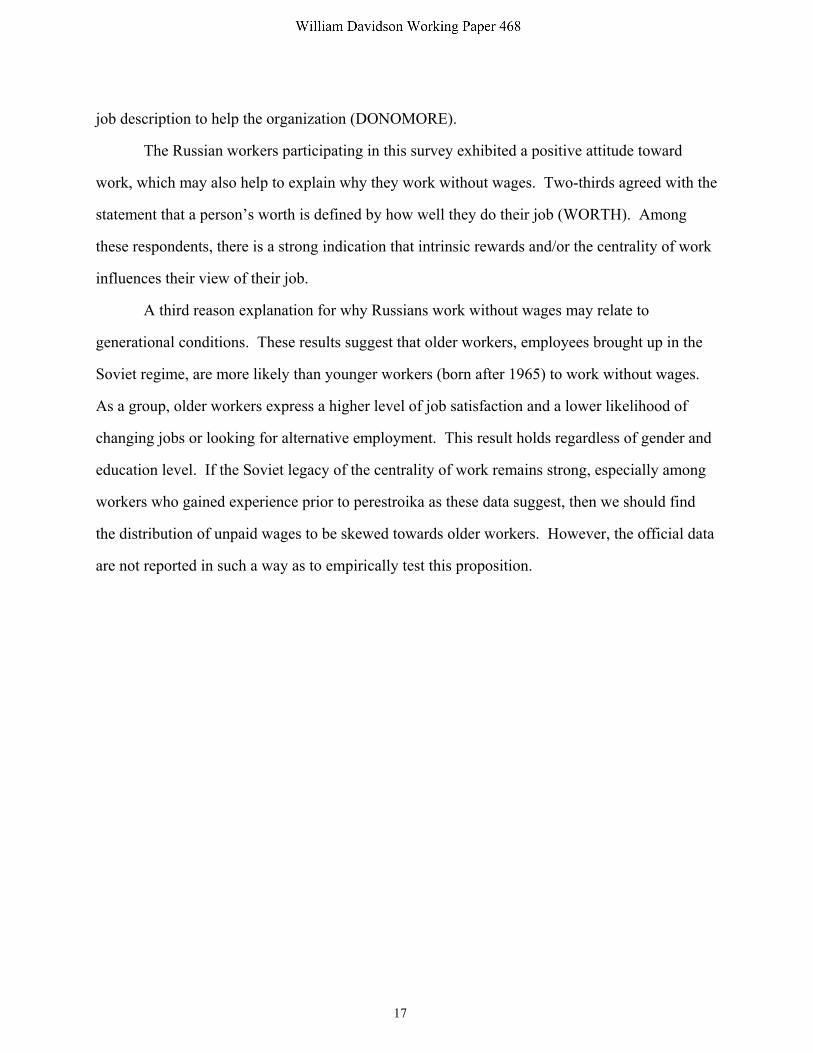
To what extent do job characteristics influence the probability that a worker will report a
high level of job satisfaction? Table 7 provides the ordered probit regression results generated
from this question. Once again, only four measures of job satisfaction are presented because of
the consistency in the pattern of results. As seen in Table 7, in the first, second, and fourth
panels where the job satisfaction measure is positively worded, the smaller the gap between
importance and likelihood values for the job characteristic variable, the greater the probability
that a worker will report a high level of job satisfaction; that is, the coefficients are negative. In
the third panel, where the job satisfaction measure is negatively worded, the opposite result
holds.23 More specifically, the likelihood that Russian workers will report a high level of job
satisfaction appears to depend among the participants in this survey upon whether their job
provides opportunities to develop skills and abilities (SKILLS), a chance to accomplish
something worthwhile (ACCMPL), the possibility of receiving additional pay (PAY) and the
respect of their co-workers (RESPECT).
These results suggest that to raise the level of job satisfaction among their employees,
managers need to reduce the gap between the importance and likelihood values for job
characteristics that involve the acquisition of skills, broadly interpreted. This might be done by
implementing a job-training or apprenticeship program, or sponsoring specific training
workshops. Job satisfaction is highest among workers who expect to receive additional pay for
doing their job well. If financial constraints preclude pursuing this strategy, managers might
consider offering release time from work (one half day, for example) in lieu of additional
payment.
To what extent is the probability that Russian workers will report a high level of job
satisfaction contingent upon their attitude toward their workplace? Table 8 reports the ordered
23 The exception to this result is reflected in the coefficient for PRAISE, when SATISFY2 is the measure of job satisfaction – praise from supervisor (PRAISE) is not so important to the participants in this survey but they do have a high expectation of receiving it if they do their jobs well.

14
probit regression results when measures of organizational commitment are used as the
independent variables. The signs on the coefficients which are significant (PROUD, NOTCHG,
GOODJOB, QUIT) are consistent with hypothesis that job satisfaction is higher among those
individuals who express a positive attitude about their workplace. When RECOMMEN is the
proxy for job satisfaction, a positive attitude toward the workplace, interpreted here as a strong
organizational commitment, plays an even more important role in accounting for the probability
that a worker will report a high level of job satisfaction. Moreover, when both the job
characteristic variables and organizational commitment variables are included in a single
specification, controlling for respondent characteristics, the organizational commitment variables
dominate the explanation of why some workers report a high level of job satisfaction.
Gender and Generational Differences
Among the employees participating in this survey, gender differences are evident in the
response patterns to a number of questions related to attitude toward work and attitude toward
the workplace. Moreover, significant gender differences are evident earnings, as well as in
expectations of receiving desired rewards for performing the job well. Gender differences do
not, however, emerge in any explanation of the probability that a high level of job satisfaction
will be reported. These results are consistent with studies conducted using U.S. workers.
Generational differences in job satisfaction are evident. Among the participants in this
survey, when generational differences emerge, older workers consistently express a higher level
of job satisfaction than younger workers. Once again, these results are consistent with studies
conducted using U.S. workers.
4. Conclusions
Are Russian workers satisfied with their jobs? Using survey data collected in Moscow,
Saratov, and Taganrog, from 1,200 employees in summer 2000, this paper examines the relative
importance of respondent characteristics, job characteristics, and attitude toward the workplace
in explaining the probability that workers will report a high level of job satisfaction. Given the
complexity associated with analyzing an attitude, as opposed to a performance outcome or work-

15
related behavior which is more easily observed, seven measures of job satisfaction are utilized in
this paper. Two of the measures are derived from questions which asked directly about the
respondent’s level of job satisfaction. Three measures asked indirectly about job satisfaction by
questioning the frequency that the respondent thinks about quitting, about whether the
respondent would recommend the company to a friend, and about whether the respondent would
change workplaces in response to offer of more money elsewhere. Two questions asked about
the perceived satisfaction level of co-workers.
Regardless of the measure used, the Russian workers participating in this survey were
generally satisfied with their own jobs, if somewhat less sanguine about their co-workers’ level
of job satisfaction. Response patterns associated with the job satisfaction measures used in this
analysis varied by occupation and generation, but not by gender.
To identify factors which increase the probability that a worker will express a high level
of job satisfaction, this analysis considered both objective and subjective respondent
characteristics, intrinsic and extrinsic job characteristics, and attitudes expressed by respondents
about their workplace. The results were robust across all seven job satisfaction measures: (1)
how individuals view work in general is more important than age, gender, or other objective
respondent characteristics in identifying which workers will express a high level of job
satisfaction; (2) the greater the expectation that individuals will receive in their job the things
that they value – opportunities to learn and develop skills, a chance to accomplish something
worthwhile, additional pay, and the respect of their co-workers – the higher the probability that
they will express a high level of job satisfaction; (3) the greater the degree of organizational
commitment, the greater the probability that a high level of job satisfaction will be expressed.
Gender differences did not emerge among the Russian employees participating in this survey.
Generational differences were evident – older workers exhibited a higher level of job
satisfaction than younger worker.
The results generated in this analysis suggest a number of strategies managers might
pursue in order to raise job satisfaction among their workers. First, while additional pay is
important – workers with high incomes were those who reported a high level of job satisfaction –

16
the Russian employees participating in this survey underscored the importance of acquiring skills
and opportunities to learn. Adopting reward structures tied to the development and mastery of
work-related skills would likely raise job satisfaction levels. Work-related skills might be
expanded to include general problem solving – how to use and interpret data, where the data
might involve time, energy or material use, or customer requirements, for example – or focus
instead on job-specific issues. Redesigning jobs to give workers more variety in their job tasks
or more responsibility would also likely coincide with higher job satisfaction among Russian
employees.
Second, the positive correlation between organizational commitment and job satisfaction
suggests that policies which contribute to employees being proud of where they work or
otherwise identifying in a positive way with their company will have a significant impact.
Sponsoring programs in the community (meals-on-wheels for pensioners, food or clothing drive
for orphanage) or advertising company policies which have local appeal (employing veterans or
disabled, for example) would likely be effective, as would producing a product or service that is
competitive in national or global markets.
Third, these results suggest screening in the hiring process to identify individuals who are
more apt to express a high level of job satisfaction can be done using a series of questions related
to attitude towards work in general.
Does the level of job satisfaction expressed by employees participating in this survey
account in any substantial way for the fact that Russians work without wages? While the data
collected in this survey are not strictly suited to analyzing the question of why Russians work
without wages, they do suggest a number of possible explanations for this phenomenon. The
first involves non-monetary rewards. Among the Russian employees participating in this survey,
it was important to feel that they made a contribution to their organization – more than 55%
selected “strongly agree” to the statement about the importance of making a contribution to the
organization (CONTRIB); nearly half selected “strongly agree” to the statement that they are
pleased to know their work made a contribution to the good of the organization (GOODJOB).
More than half disagreed with the statement that they would be unwilling to do more than their
17
job description to help the organization (DONOMORE).
The Russian workers participating in this survey exhibited a positive attitude toward
work, which may also help to explain why they work without wages. Two-thirds agreed with the
statement that a person’s worth is defined by how well they do their job (WORTH). Among
these respondents, there is a strong indication that intrinsic rewards and/or the centrality of work
influences their view of their job.
A third reason explanation for why Russians work without wages may relate to
generational conditions. These results suggest that older workers, employees brought up in the
Soviet regime, are more likely than younger workers (born after 1965) to work without wages.
As a group, older workers express a higher level of job satisfaction and a lower likelihood of
changing jobs or looking for alternative employment. This result holds regardless of gender and
education level. If the Soviet legacy of the centrality of work remains strong, especially among
workers who gained experience prior to perestroika as these data suggest, then we should find
the distribution of unpaid wages to be skewed towards older workers. However, the official data
are not reported in such a way as to empirically test this proposition.

18
Table 1: Correlation Coefficients: Measures of Job Satisfaction
SATISFY1 SATISFY2 ALLSATIS RECOMMEN NOTCHGJB THNKQT ALLQUIT Measures of job satisfaction SATISFY1 -- SATISFY2 .7046 -- ALLSATIS .3229 .3018 -- RECOMMEN .4067 .3370 .2685 -- NOTCHGJB .2564 .2614 .0642 .2682 -- THNKQT -.4498 -.4559 -.1544 -.2998 -.1919 -- ALLQUIT -.2472 -.1722 -.2358 -.2561 -.0909 .3463 --
TABLE 2: Job Satisfaction Measures: Mean Response by Occupational Level, Gender Generation
All Managers Workers Men Women Young Old Mean N Mean N Mean N Mean N Mean N Mean N Mean N
SATISFY1 3.79 1185 4.11* 122 3.76 1063 3.84 449 3.77 717 3.71** 512 3.85 673
SATISFY2 3.86 1171 4.19* 121 3.82 1050 3.85 442 3.86 710 3.73* 507 3.96 664
ALLSATIS 2.82 1177 3.05** 120 2.79 1057 2.84 447 2.80 711 2.87 514 2.78 663
RECOMMEN 3.27 1180 3.62* 120 3.23 1060 3.37** 445 3.20 716 3.32 513 3.23 667
NOTCHGJB 3.55 1178 3.84** 122 3.52 1056 3.67** 445 3.49 714 3.51 510 3.59 668
THNKQT 2.11 1170 1.80* 122 2.15 1048 2.13 441 2.10 710 2.23* 508 2.02 662
ALLQUIT 2.52 1178 2.39 120 2.54 1058 2.50 447 2.53 712 2.54 514 2.51 664 *Significant at 1%. **Significant at 5%.

19
Table 3: Correlation Coefficients: Job Satisfaction and Respondent Characteristics
SATISFY1 SATISFY2 ALLSATIS RECOMMEN NOTCHGJB THNKQT ALLQUIT Objective Respondent Characteristics WOMAN -.0289 .0051 -.0142 -.0579 -.0611 -.0118 .0104 YOUNG -.1090 -.1447 .0285 .0188 -.0432 .0998 .0372 YREDUC .0814 .0811 .0230 .0718 .0522 -.0875 -.0679 MARRIED .0264 .0546 -.0287 -.0032 .0208 -.0348 -.0460 CHGJOBS -.0758 -.1016 -.0222 .0319 -.1237 .1239 .0298 UNEMPLOY -.1065 -.0713 -.0321 -.0275 -.0744 .1222 .0643 NUMJOBS .0002 -.0001 -.0788 .0050 -.0057 .0455 .0042 HOWLONG .0755 .1280 .0186 -.0839 .0638 -.0764 -.0259 SATISFY1 SATISFY2 ALLSATIS RECOMMEN NOTCHGJB THNKQT ALLQUIT Subjective Respondent Characteristics BETTERPR .0895 .0607 .1946 .1229 .0535 .0438 .0130 WKHPROD .2568 .2323 .1596 .1811 .0343 -.1578 -.0994 WKHPERFM .1813 .1487 .1081 .1514 .0480 -.1050 -.0194 WKHWELL .2312 .2184 .1066 .1631 .1157 -.1623 -.0270 WORTH .1186 .1367 .0834 .1287 .1671 -.0911 -.0179 FORGETJB -.1379 -.1313 -.0268 -.1629 -.1738 .1574 .0920 ENJOY -.0439 -.0117 .0064 -.0946 -.1032 .0624 .0488

20
TABLE 4: Job Characteristics: Mean Values
Total Men Women Young Old Mean N Mean N Mean N Mean N Mean N Intrinsic Characteristics FEELGOOD .58 1165 .44 445 .67* 701 .52 506 .63 659 SKILLS .90 1160 .84 444 .95 697 .78 504 1.00* 656 LEARN 1.17 1148 1.04 437 1.27** 693 1.06 500 1.26** 648 ACCMPL .78 1161 .59 441 .91* 701 .84 503 .74 658 FREEDOM 1.08 1151 .88 442 1.20* 690 .89 502 1.25* 649 Mean N Mean N Mean N Mean N Mean N Extrinsic Characteristics PAY 2.01 1185 1.77 447 2.14* 719 1.73 512 2.22* 673 JOBSECUR .90 1168 .58 445 1.10* 704 .66 506 1.08* 662 PROMOTN 1.74 1146 1.41 437 1.95* 692 1.65 499 1.81** 647 RESPECT .83 1166 .65 444 .93* 704 .72 506 .91 660 PRAISE .64 1151 .37 436 .79* 696 .36 495 .84* 656 FRIENDLY .90 1173 .84 448 .94 706 .79 510 .98* 663 Significant @ 1% Significant @ 5%

21
Table 5: Measures of Organizational Commitment
Mean N
PARTORG I feel myself to be part of the organization. 3.67 1182
PROUD I am quite proud to be able to tell people the 3.57 1186 company where I work.
NOTCHG Even if the company were not doing well financially, 3.37 1180 I would be reluctant to change to another company.
GOODJOB To know that my work has made a contribution 3.97 1165 to the good of the company would please me.
CONTRIB In my work I like to feel that I am making some 4.25 1184 contribution, not just for myself but for the
organization as well.
QUIT I sometimes feel like leaving this company for good. 2.22 1179
DONOMORE I am not willing to do more than my job description 2.50 1178 requires just to help the organization. Manager Worker Men Women Young Old Mean N Mean N Mean N Mean N Mean N Mean N PARTORG 3.90** 120 3.64 1062 3.68 445 3.66 718 3.56 508 3.75* 674 PROUD 4.02* 122 3.52 1064 3.57 448 3.57 719 3.61 512 3.53 674 NOTCHG 3.70* 122 3.33 1058 3.37 446 3.37 715 3.14 510 3.55* 670 GOODJOB 4.27* 120 3.93 1045 3.95 439 3.98 707 3.79 502 4.10* 663 CONTRIB 4.52* 122 4.22 1062 4.18 446 4.30** 719 4.14 513 4.33* 671 QUIT 1.70* 122 2.28 1057 2.12 444 2.22 716 2.25 511 2.19 668 DONOMORE 2.16* 121 2.54 1057 2.57 445 2.46 714 2.53 510 2.48 668 *Significant @ 1% **Significant @ 5%

22
Table 6: Ordered Probit Regression Results: Job Satisfaction and Respondent Characteristics
SATISFY1 SATISFY2 THNKQT RECOMMEN coeff z coeff z coeff z coeff z WOMAN -.0145 -0.17 .0746 0.88 -.0180 -0.21 -.0454 -0.54 YRBORN .0490 0.52 .0463 0.49 .0517 0.53 .0314 0.33 YREDUC .0244 1.60 .0200 1.30 -.0207 -1.29 .0248 1.63 MARRIED .0971 1.19 .1990* 2.42 -.0902 -1.08 .0902 1.12 CHGJOBS .0261 0.70 -.0130 -0.35 .0361 0.94 .0269 0.73 UNEMPLOY -.1443 -1.41 .0199 0.19 .1307 1.24 -.1505 -1.47 NUMJOBS .0292 0.36 -.0113 -0.14 .1403 1.69 -.0071 -0.09 HOWLONG .0042 0.89 .0092** 1.91 .0024 0.48 -.0157* -3.38 BETTERPR .0748* 2.51 .0648** 2.15 .0669** 2.19 .0829* 2.84 WKHPROD .2276* 4.94 .2197* 4.73 -.1265* -2.65 .1413* 3.08 WKHPERFM .0109 0.20 .0306 0.57 .0486 0.88 .0428 0.80 WKHWELL .1557* 3.72 .1323* 3.11 -.1085* -2.50 .1414* 3.38 WORTH .0426 1.32 .0490 1.51 -.0597 -1.79 .0957* 2.98 FORGETJB -.1221* -3.93 -.1294* -4.13 .1177** 3.62 -.1200* -3.95 ENJOY -.0005 -0.02 .0324 1.09 .0116 0.38 -.0240 -0.83 n = 846 n = 837 n = 837 n = 849 pseudo R2 = .0522 pseudo R2 = .0539 pseudo R2 = .0288 pseudo R2 = .0437 * Significant @ 1% ** Significant @ 5%
23
Table 7: Ordered Probit Regression Results: Job Satisfaction and Job Characteristics
SATISFY1 SATISFY2 THNKQT RECOMMEN coeff z coeff z coeff z coeff z FEELGOOD -.0077 -0.29 -.0164 -0.62 .0143 0.53 -.0312 -1.21 SKILLS -.0915* -3.03 -.0260 -0.86 .0102 0.32 -.0648** -2.17 LEARN -.0224 -0.81 -.0375 -1.35 .0687* 2.41 .0059 0.22 ACCOMPL -.0723* -2.56 -.0439 -1.54 .0552** 1.89 -.0118 -0.42 FREEDOM -.0035 -0.15 .0314 1.30 .0136 0.54 .0071 0.31 PAY -.0622* -2.58 -.0470** -1.90 .0627* 2.49 -.0932** -3.92 JOBSECUR .0343 1.31 .0198 0.75 -.0113 -0.42 .0179 0.69 PROMOTN -.0045 -0.18 -.0021 -0.08 -.0087 -0.32 -.0228 -0.91 RESPECT -.0880** -2.22 -.0812** -2.03 -.0073 -0.18 -.0880** -2.22 PRAISE .0457 1.73 .0760* 2.85 -.0478 -1.74 .0273 1.04 FRIENDLY .0465 1.26 .0316 0.85 .0059 0.16 .0182 0.50 n = 1009 n = 1000 n = 1000 n = 1006 pseudo R2 = .0214 pseudo R2 = .0103 pseudo R2 = .0127 pseudo R2 = .0471 * Significant @ 1% ** Significant @ 5%

24
Table 8: Ordered Probit Regression Results: Job Satisfaction and Organizational Commitment SATISFY1 SATISFY2 THNKQT RECOMMEN coeff z coeff z coeff z coeff z PARTORG -.0343 -1.00 .0363 1.09 -.0492 -1.41 .1137* 3.45 PROUD .2315* 7.46 .1332* 4.31 .0780* 2.39 .2667* 8.65 NOTCHG .1441* 5.92 .1510* 5.56 -.0997* -3.44 .0675* 2.51 GOODJOB .2393* 5.62 .1900* 4.48 -.0860** -1.95 .0345 0.82 CONTRIB -.0025 -0.06 .0325 0.76 -.0446 -1.01 .1715* 3.96 QUIT -.2372* -8.17 -.2039* -7.03 .4688* 15.15 -.1068* -3.71 DONOMORE -.0142 -0.53 .0232 0.86 .0690* 2.48 .0216 -0.82 n = 1144 n = 1130 n = 1134 n = 1142 pseudo R2 = .1422 pseudo R2 = .1115 pseudo R2 = .1358 pseudo R2 = .1094 * Significant @ 1% ** Significant @ 5%

25
Appendix A: Sample Description
The survey of Russian employees was conducted in Moscow, Saratov, and Taganrog, in
summer 2000. Two project coordinators in each city administered the questionnaires at each
workplace, after having first secured permission to do so.24 The seventy-six participating
workplaces included 35 manufacturing (heavy and light industry) organizations, 19 retail shops, 6
schools, 5 university and other institutes of higher learning, and 11 other service organizations.
Project coordinators in some instances distributed questionnaires to employees in common areas
of the workplace; in other instances, questionnaires were distributed in the individual
shops/departments. In every instance, respondents who elected to participate were assured of
anonymity and confidentiality.25 While response rates by workplace were not calculated, overall,
more than 73% of the distributed questionnaires were completed.
Table A1 summarizes the basic sample characteristics. Just over 45% of the participants
were located in Taganrog; some 49% in Saratov, and nearly 6% in Moscow. By design, workers
comprised about 90% of the total number of participants.
While the mean age of the respondents was 39 years, the age distribution of the sample
consists of a nearly even split between participants who were 30 years old or younger at the time
the survey was conducted (28%), between the ages of 31 and 40 years old (25%), between the
ages of 41 and 50 years old (25%), and over 50 years old (22%). For the purposes of this
analysis, younger workers are defined as persons born after 1965. Younger workers account for
43% of the participants.
As a group, managers were significantly older than workers (44 years compared to 39
years), and earned significantly more each month (2312 rubles per month compared to 1067
rubles per month). Managers had worked at their current organization, on average, at least 14
years, compared to 10 years for workers. Managers were significantly less likely than workers to 24 Since funds were not available to construct a representative sample of workplaces by city, project coordinators were instructed to contact and include as wide a variety of workplaces as possible.
25 Individuals were given opportunity to take or decline taking the survey instrument. If taken, individuals had choice to return or not return the questionnaire.

26
have reported a period of unemployment
Women account for about 62% of the respondents, and 48% of the managers participating
in the survey. Women comprise a somewhat greater proportion of the older workers (66%) than
the younger workers (56%). Women participating in this project had significantly fewer years of
education and worked significantly more years at their current organization than the men
participating in this project. Women, both as workers and managers, earned significantly less, on
average, than their male counterparts. Women were significantly less likely than men to have
reported a period of unemployment, and significantly more likely to report their marital status as
divorced.26
Average earnings varied significantly by region: in Moscow, average earnings from the
respondent’s primary job totaled 1722 rubles per month (~$69);27 in Saratov, 1213 rubles ($48);
and in Taganrog, 1087 rubles ($43). More than 80% of those responding to the question
(n=1077) reported receiving $30 or less per month from their primary job at the time the survey
was conducted.28 Just under 10% reported receiving between $30 and $60 per month; a similar
percentage reported receiving over $60 per month. When asked about income received per month
from all jobs which the respondent held at the time of the survey: 36% reported receiving $30 or
less from all their jobs; 39% reported receiving between $30 and $60 per month; 11% reported
receiving between $60 and $90 per month; and 14% reported receiving over $90 per month.
In terms of work experience, nearly 20% of the participants reported working less than 2
years at their current place of employment; 47% reported working between 2 and 10 years at their
current place of employment; 15% reported working between 11 and 20 years at their current
workplace; and 19% reported working more than 20 years at their current place of employment.
Fewer than one-in-four participants responding to the question (n=1146) reported experiencing a 26 Just over 62% of the survey participants were married at the time the questionnaire was administered; 13% reported themselves as divorced; 21% single; and the remainder selected “widowed” or “other.”
27 The question asked respondents to report they monthly wage at the time. At the time, the exchange rate was approximately 25 rubles per $1. Income categories were created to put their responses into a broader perspective.
28 In many studies, absolute poverty is defined as incomes equal to $1 per day. See for example, UNDP’s Poverty in Transition (1998).

27
period of unemployment.

28
TABLE A1: Sample Characteristics
Number of Respondents Moscow Saratov Taganrog Total Frequency % Frequency % Frequency % Frequency % Workers 69 6.4 523 48.5 486 45.1 1078 100 Managers 0 0.0 62 49.2 60 50.8 122 100 Men 33 7.3 188 41.7 230 51.0 453 100 Women 36 5.0 383 52.7 307 42.3 726 100 Younger 19 1.7 233 44.7 269 51.6 521 100 Older 50 7.4 352 51.8 277 40.8 679 100 Total 69 5.8 585 48.8 546 45.5 1200 100 Respondent Characteristic Moscow Saratov Taganrog Total Mean Response Mean N Mean N Mean N Mean N Year born 1952 69 1960 582 1963 528 1961 1179 Years of schooling 16.3 65 15.0 571 14.9 534 15.0 1170 Income [main job] (rubles) 1722 69 1213 567 1087 441 1194 1077 Income [all jobs] (rubles) 2270 69 1374 555 1216 434 1368 1058 Years at current workplace 18.8 69 11.1 580 8.6 530 10.4 1179

29
References Andrisani, Paul. 1978. “Levels and Trends in Job Satisfaction, 1966-1972,” in Andrisani (ed)
Work Attitudes and Labor Market Experience (New York: Praeger). Angel, H.L and J.L. Perry. 1981. “Empirical Assessment of Organizational Commitment and
Organizational Effectiveness,” vol 26 Administrative Science Quarterly , pp. 1-14. Bagozzi, R. P. 1980. “Performance and Satisfaction in an Industrial Sales Force: An Examination
of their Antecedents and Simultaneity,” vol 15, no 4 Journal of Marketing pp. 65-67. Bartol, K.M. 1979. “Professionalism as a Predictor of Organizational Commitment, Role Stress,
and Turnover: A Multidimensional Approach,” vol 22 Academy of Management Journal, pp. 815-821.
Ben-Bakr, Kaled, Id Al-Shammari, Omar Jefri and Jyoti Prasad. 1994. “Organizational
Commitment, Satisfaction, and Turnover in Saudi Organizations: A Predictive Study,” vol 23, no 4 Journal of Socio-Economics (Winter), pp. 449-456.
Beynon, Huw and Robin Blackurn. 1972. Perceptions of Work: Variations within a Factory
(Cambridge: Cambridge University Press). Broom, Leonard and Norval Glenn. 1966. “Religious Differences in Reported Attitudes and
Behavior,” vol 27 Sociological Analysis (Winter), pp. 187-209. Clarke, Simon. 1996. Labour Relations in Transition (Northampton MA: Edward Elgar). Clarke, Simon. 1998. Structural Adjustment without Mass Unemployment (Northampton MA:
Edward Elgar). Clarke, Simon. 1999. The Formation of a Labour Market in Russia (Northampton MA: Edward
Elgar). Commander, Simon and Fabrizio Coricelli (eds).1995. Unemployment, Restructuring, and the
Labor Market in Eastern Europe and Russia (Washington D.C.” World Bank). Darden, W.R., R. Hampton and R.D. Howell. 1989. “Career Versus Organizational Commitment:
Antecedents and Consequences of Retail Salespeople’s Commitment,” vol 65 Journal of Retailing (Spring), pp. 80-106.
Desai, Padma and Todd Idson. 2000. Work Without Wages: Russia’s Nonpayment Crisis
(Cambridge MA: MIT Press). Dubin, Robert and Joseph Champoux. 1974. “Workers’ Central Life Interests and Job
Performance,” vol 1 Sociology of Work and Occupations, pp. 313-26. Dunham, R.B., J.A. Grube and M.B. Castaneda. 1994. “Organizational Commitment: The Utility

30
of an Integrative Definition,” vol 79 Journal of Applied Psychology , pp. 370-380. Elizur, Dov and Meni Koslowsky. 2001. “Values and Organizational Commitment,” vol 22, no 7-
8 International Journal of Manpower , pp. 593-599. Ensher, Ellen, Elisa Grant-Fallone and Stewart Donaldson. 2001. “Effects of Perceived
Discrimination on Job Satisfaction, Organizational Commitment, Organizational Citizenship Behavior, and Grievances,” vol 12, no 1 Human Resource Development Quarterly (Spring), pp. 53-72.
Field, Mark C and Judith L. Twigg. 2000. Russia’s Torn Safety Nets (New York: St. Martin’s
Press). Fisher, Cynthia. 1980. “On the Dubious Wisdom of Expecting Job Satisfaction to Correlate with
Performance,” Academy of Management Review vol 5, no 4 (October), pp. 607-612. Form, William. 1973. “Auto Workers and Their Machines: A Study of Work, Factory, and Job
Satisfaction in Four Countries,” vol 52, no 1 Social Forces (September), pp. 1-15. Freeman, Richard B. 1978. “Job Satisfaction as an Economic Variable,” American Economic
Review Papers and Proceedings, vol 68, no 2 (May), pp. 135-141. Friedlander, F. 1966. “Importance of Work versus Nonwork Among Socially and Occupationally
Stratified Groups,” vol 50 Journal of Applied Psychology (December), pp. 437-441. Gerhart, Barry. 1987. “How Important are Dispositional Factors as Determinants of Job
Satisfaction?” Journal of Applied Psychology vol 72, pp 366-373. Gimpel’son, Vladimir and Douglas Lippoldt. 1999. “Labour Turnover in Russia: Evidence from
the Administrative Reporting of Enterprises in Four Regions,” Transition Economics, Series No 4 (Vienna: Institute for Advanced Studies).
Gimpel’son, Vladimir and Douglas Lippoldt. 2001.The Russian Labor Market: Between
Transition and Turmoil (New York: Rowman & Littlefield Publishers). Glenn, Noval and Charles Weaver. 1982. “Further Evidence on Education and Job Satisfaction,”
vol 61 Social Forces , pp. 46-55. Glisson, Charles and Mark Durick. 1988. “Predictors of Job Satisfaction and Organizational
Commitment in Human Service Organizations,” Administrative Science Quarterly, vol 33, no 1 (March), pp. 61-81.
Goskomstat. 2000. Russia in Figures (Moscow). Hatcher, Timothy. 1999. “How Multiple Interventions Influenced Employee Turnover: A Case
Study,” vol 10, no 4 Human Resource Development Quarterly (Winter), pp. 365-382. Huddleston, Patricia and Linda Good. 1999. “Job Motivators in Russian and Polish Retail Firms,”

31
International Journal of Retail & Distribution Management vol 27, no 9, pp. 383-392. Hulin, C and P. Smith. 1964. “A Linear Model of Job Satisfaction,” Journal of Applied
Psychology vol 48, pp. 88-92. Hunt, John and Peter Saul. 1975. “The Relationship of Age, Tenure, and Job Satisfaction in Males
and Females,” Academy of Management Journal vol 18 no 4 (December), pp. 690-702. Iaffaldano, M.T. and P.M. Muchinsky 1985. “Job Satisfaction and Job Performance: A Meta
Analysis,” vol 97 Psychological Bulletin , pp. 251-271. Ibrahim, Nabil and Leslie Rue. 1994. “Organizational Commitment: Are there Differences
between American and Egyptian Employees of U.S. Multinational Corporations in Egypt?” Vol 1, no 1 Journal of Transnational Management Development , pp. 23-34.
Janson, Philip and Jack Martin. 1982. “Job Satisfaction and Age: A Test of Two Views,” Social
Forces vol 60 no 4 (June), pp. 1089-1102. Kalleberg, Arne. 1977. “Work Values and Job Rewards: A Theory of Job Satisfaction,” American
Sociological Review vol 42 no 1 (Februrary), pp. 124-143. Kalleberg, Arne and Karen Loscocco. 1983. “Aging, Values and Rewards: Explaining Age
Differences in Job Satisfaction,” vol 48 American Sociological Review , pp. 78-90. Katz, Katarina. 1997. “Gender, Wages, and Discrimination in the USSR: A Study of a Russian
Industrial Town,” Cambridge Journal of Economics vol 21, no 4 (July), pp. 431-452. Katzell, Raymond. 1979. “Changing Attitudes Toward Work,” in Clark Kerr and Jerome Rosow
(eds.) Work in America: The Decade Ahead (New York: Van Nostrand Reinhold). Ketchand Alice and Jerry Strawser. 1998. “The Existence of Multiple Measures of Organizational
Commitment and Experience-Related Differences in a Public Accounting Setting,” vol 10, no 1 Behavioral Research in Accounting , pp. 109-137.
Khotkina, Z. 2001. “Female Unemployment and Informal Employment in Russia,” Problems of
Economic Transition vol 43, no 9 (January), pp. 20-33. Krueger, Gary. 2003. Between Two Fires: Russian Industry in Transition. (forthcoming in St.
Martin’s Press). Larwood, L., Thomas Wright, Stephan Desrochers and Veronica Dahir. 1998. “Extending Latent
Role and Psychological Control Theories to Predict Intent to Turnover and Politics in Business Organizations,” vol 13 Group & Organization Management (June), pp. 100-123.
Lawler, Edward and Douglas Hall. 1970. “Relationship of Job Characteristics to Job Involvement,
Satisfaction, and Intrinsic Motivation,” vol 54 Journal of Applied Psychology, pp. 305-312.

32
Lehmann, Hartmut, Jonathan Wadsworth and Alessandro Acquisiti. 1999. “Grime and
Punishment: Job Insecurity and Wage Arrears in the Russian Federation,” Journal of Comparative Economics, vol 27, no 4 (December), pp. 96-133.
Lincoln, James and Arne Kalleberg. 1985. “Work Organization and Workforce Commitment: A
Study of Plants and Employees in the U.S. and Japan,” vol 50 American Sociological Review, pp. 738-760.
Lincoln, James and Arne Kalleberg. 1996. “Commitment, Quits, and Work Organization in
Japanese and U.S. Plants,” vol 50, no 1 Industrial and Labor Relations Review (October), pp. 39-59.
Linz, Susan J. 1995. “Russian Labor Market in Transition,” vol 43, no 4 Economic Development
and Cultural Change (July), pp. 693-716. Linz, Susan J. 1995. “Do Job Rights Govern Employment Patterns in Transition Economies?”
American Economic Review, Papers and Proceedings, vol 85, no 2 (May), pp. 425-431. Linz, Susan J. 1996. “Gender Differences in the Russian Labor Market,” Journal of Economic
Issues, vol 30, no 1 (March), pp. 161-185. Linz, Susan J. 2000. “Labor Productivity in Russian Industry: A Regional Analysis,” Economic
Development and Cultural Change vol 48, no 4 (July), pp. 685-718. Linz, Susan J. 2002. “Ownership and Employment in Russian Industry: 1992-1995,”
International Journal of Manpower vol 23, no 1 (forthcoming). Locke, Edwin. 1976. “Nature and Causes of Job Satisfaction,” in Marvine Dunnette (ed)
Handbook of Industrial and Organizational Psychology (Chicago: Rand McNally). Lopez, E. “Test of the Self-Consistency Theory of the Job Performance-Job Satisfaction
Relationship,” Academy of Management Journal vol 25, pp. 335-348. Lorence, Jon and Jeylan Mortimer. 1985. “Job Involvement Through the Life Course: A Panel
Study of Three Age Groups,” vol 50 American Sociological Review (October), pp. 618-638.
Mathieu, J.E. and K. Hammel. 1989. “A Causal Model of Antecedents of Organizational
Commitment Among Professionals and Nonprofessionals,” vol 34 Journal of Vocational Behavior , pp. 299-317.
Miller, Katherine and Peter Monge. 1986. “Participation, Satisfaction and Productivity: A Meta-
Analytic Review,” Academy of Management Journal vol 29 no 4 (December) pp. 727-753.
Morrison, K.A. 1997. “How Franchise Job Satisfaction and Personality Affects Performance,
Organizational Commitment, Franchiser Relations, and Intention to Remain,” vol 35, no 3

33
Journal of Small Business Management , pp. 39-45. Mortimer, Jeylan and Jon Lorence. 1989. “Satisfaction and Involvement: Disentangling a
Deceptively Simple Relationship,” vol 52 no 4 Social Psychology Quarterly , pp. 249-265.
Mowday, Richard, Lyman Porter and Richard Steers. 1982. Employee-Organization Linkages:
The Psychology of Commitment, Absenteeism, and Turnover (New York: Academic Press).
Newell, Andrew and Barry Reilly. 1996. “The Gender Wage Gap in Russia: Some Empirical
Evidence,” Labour Economics vol 3, pp. 337-356. Petty, M.M., GailW. McGee and Jerry W. Cavender. 1984. “A Meta Analysis of the
Relationships between Individual Job Satisfaction and Individual Peformance,” vol 9 Academy of Management Review, pp. 712-721.
Porter, L.W., R.M. Steers, R.T. Mowday and P.V. Boulian. 1974. “Organizational Commitment,
Job Satisfaction, and Turnover among Psychiatric Technicians,” vol 59 Journal of Applied Psychology , pp. 603-609.
Putterill, Martin and Thomas Rohrer. 1995. “A Causal Model of Employee Commitment in a
Manufacturing Setting,” vol 15, no 5-6, International Journal of Manpower , pp. 56-69. Quinn, Robert, Graham Staines and M.R. McCullogh. 1974. Job Satisfaction: Is there a Trend?
(Washington D.C.: USGPO). Raiklin, Ernest. 1999. “Unemployment Trands in Russia of the 1990s,” International Journal of
Social Economics, vol 6, no 12, pp. 1378-88. Reichers, A.E. 1985. “A Review and Reconceptualization of Organizational Commitment,” vol
10 Academy of Management , pp. 465-476. Reilly, Barry. 1999. “The Gender Pay Gap in Russia during the Transition, 1992-1996,”
Economics of Transition, vol 7 no 1 , pp. 245-264. Sabirianova, Klara. 1998. “Microeconomic Analysis of Dynamic Changes in the Russian Labor
Market,” Problems of Economic Transition, vol 41, no 3 (July), pp. 66-88. Schuman, Howard. 1971. “The Religious Factor in Detroit: Review, Replication and Re-
analysis,” vol 36 American Sociological Review , pp. 36-48. Shore, L.M. and H.J. Martin. 1989. “Job Satisfaction and Organizational Commitment in Relation
to Work Performance and Turnover Intentions,” vol 42 Human Relations , pp. 625-638. Sousa-Poza, Alfonso and Andres Sousa-Posa. 2000. “Well-Being at Work: A Cross-National
Analysis of the Levels and Determinants of Job Satisfaction,” vol 29 no 6 Journal of Socio-Economics , pp. 517-538.

34
Standing, Guy. 1996. Russian Unemployment and Enterprise Restructuring: Reviving Dead
Souls (Basingstoke: Macmillan). Strauss, George. 1974. “Is There a Blue Collar Revolt Against Work?” in James O’Toole (ed)
Work and Quality of Life (Cambridge MA: MIT Press). Varca, Philip, Garnet Shaffer and Cynthia McCauley. 1983. “Sex Differences in Job Satisfaction Revisited,” Academy of Management Journal, vol 26, no 2 (June), pp. 348-353. Vroom, Victor. 1964. Work and Motivation (New York: Wiley). Warr, Peter, John Cook and Toby Wall. 1979. “Scales for Measurement of Some Work Attitudes
and Aspects of Psychological Well-Being,” vol 52 Journal of Occupational Psychology , pp. 129-148.
Weaver, Charles. 1974. “Correlates of Job Satisfaction: Some Evidence from the National
Surveys,” Academy of Management Journal vol 17 no 2 (June), pp. 373-375. Weaver, Charles. 1978. “Sex Differences in the Determinants of Job Satisfaction,” Academy of
Management Journal vol 21 no 2 (June), pp. 265-274. Weiner, Y. and Y. Vardi. 1980. “Relationship between Job, Organization, and Career
Commitment and Work Outcomes: An Integrative Approach,” vol 26 Organizational Behavior and Human Performance , pp. 81-96.
Yousef, Darwish. 1998. “Satisfaction with Job Security as a Predictor of Organizational
Commitment and Job Performance in a Multicultural Environment,” vol 19, no 3 International Journal of Manpower , pp. 184-194.
DAVIDSON INSTITUTE WORKING PAPER SERIES - Most Recent Papers The entire Working Paper Series may be downloaded free of charge at: www.wdi.bus.umich.edu
CURRENT AS 5/22/02 Publication Authors Date No. 46 8: Job Satisfaction Among Russian Workers Susan J. Linz May 2003 No. 467: Assessing the Problem of Human Capital Mismatch in Transition Economies
Viliam Druska, Byeong ju Jeong, Michal Kejak, and Viatcheslav Vinogradov
Mar. 2002
No. 466: Motivating Russian Workers: Analysis of Age and Gender Differences
Susan J. Linz Feb. 2002
No. 465: Virtual Reality: Barter and Restructuring in Russian Industry Gary Krueger and Susan J. Linz Apr. 2001 No. 464: Lending of Last Resort, Moral Hazard and Twin Crises: Lessons from the Bulgarian Financial Crisis 1996/1997
Michael Berlemann, Kalin Hristov and Nikolay Nenovsky
May 2002
No. 463: Deindustrialisation. Lessons from the Structural Outcomes of Post-Communist Transition
Tomasz Mickiewicz and Anna Zalewska
Jan. 2002
No. 462: Joint Liability Lending and the Rise and Fall of China’s Township and Village Enterprises
Albert Park and Minggao Shen July 2001
No. 461: A Refinancing Model of Decentralization with Empirical Evidence from China
Albert Park and Minggao Shen Apr. 2002
No. 460: The Effects of Market Liberalization on the Relative Earnings of Chinese Women
Margaret Maurer-Fazio and James Hughes
Mar. 2002
No. 459: The Role of Education in Determining Labor Market Outcomes in Urban China’s Transitional Labor Markets
Margaret Maurer-Fazio Apr. 2002
No. 458: Real and Monetary Convergence within the European Union and Between the European Union and Candidate Countries: A Rolling Cointegration Approach
Josef C. Brada, Ali M. Kutan and Su Zhou
Apr. 2002
No. 457: Credit Ratings as Coordination Mechanisms Arnoud W. A. Boot and Todd T. Milbourn
Mar. 2002
No. 456: Balkan and Mediterranean Candidates for European Union Membership: The Convergence of their Monetary Policy with that of the European Central Bank
Josef C. Brada and Ali M. Kutan Apr. 2002
No. 455: Russian Financial Transition: The Development of Institutions and Markets for Growth
David M. Kemme Oct. 2001
No. 454: Does the Market Pay Off? Earnings Inequality and Returns to Education in Urban China
Xiaogang Wu and Yu Xie Apr. 2002
No. 453: Entrepreneurs’ Access to Private Equity in China: The Role of Social Capital
Bat Batjargal and Mannie M. Liu Apr. 2002
No. 452: The Determinants of Privatised Enterprise Performance in Russia
Alan A. Bevan, Saul Estrin, Boris Kuznetsov, Mark E. Schaffer, Manuela Angelucci, Julian Fennema and Giovanni Mangiarotti
June 2001
No. 451: Determinants of Financial Distress: What Drives Bankruptcy in a Transition Economy? The Czech Republic Case
Lubomír Lízal Jan. 2002
No. 450: Corporate Governance and the Global Social Void Lee A. Tavis Oct. 2001 No. 449: Financial Architecture and Economic Performance: International Evidence
Solomon Tadesse Aug. 2001
No. 448: Growth Slowdown Under Central Planning: A Model of Poor Incentives
Zuzana Brixiová and Aleš Bulír Mar. 2002
No. 447: Disentangling Treatment Effects of Polish Active Labor Market Policies: Evidence from Matched Samples
Jochen Kluve, Hartmut Lehmann, and Christoph M. Schmidt
Jan. 2002
No. 446: The Impact of Socialist Imprinting and Search for Knowledge on Resource Change: An Empirical Study of Firms in Lithuania
Aldas Kriauciunas and Prashant Kale
Mar. 2002
No. 445: The Costs, Wealth Effects, and Determinants of International Capital Raising: Evidence from Public Yankee Bonds
Darius P. Miller and John J. Puthenpurackal
Oct. 2001