Embed Size (px)
Citation preview

1
Social Work/Maatskaplike Werk 2014:50(1)
DO SOCIAL WORKERS REALLY MAKE A DIFFERENCE?
MEASURING CLIENT SATISFACTION IN AN OCCUPATIONAL
SETTING
Arnel Huisamen, Mike Weyers
INTRODUCTION
The past decade has seen a significant increase in the need amongst social workers to
ascertain how clients experience their services (Tilbury, Osmond & Crawford, 2010:77-
79). This has been exemplified locally by a statement in the South African Department
of Social Development’s Integrated Service Delivery Model (2005:47) that touts the
importance of client satisfaction surveys as a monitoring and evaluation instrument.
Although this policy document dictates how government-supported local social work
services should be delivered, very little has thus far been done to meet the need for client
satisfaction surveys on a practical level. This is primarily because of the lack of
appropriate, reliable and valid measuring instruments, as well as the logistical and
ethical problems involved in the use of any such tools.
The Employee Health and Wellness (EHW) component of the South African Police
Services (SAPS) experienced the same need and also faced the same challenges when its
National Head gave instructions during August 2011 that a client satisfaction measuring
instrument must be developed for this component. The responsibility for this task mainly
fell on the shoulders of the authors and some collaborators.
The instruction gave rise to a study in which three client satisfaction scales were
developed and pilot tested. Two of these scales, as well as the implications of their use
for the broader social work field, are discussed in this article.
PRACTICAL AND THEORETICAL CONTEXT OF THE STUDY
The study should first be seen against the backdrop of the structure of employee-focused
services in the SAPS. In the mid-2000s the then separate Police Social Work Services
(PSWS), Police Psychological Services (PPS) and Police Spiritual Services (PSS) were
grouped into one component, viz. Employee Health and Wellness (EHW). It was also
decided that these three sections must follow an integrated approach. This step implied,
among other things, that common ground should be sought between the services and
that, whenever possible, similar procedures should be followed and tools used. This
meant that representatives of the other professions also had to be consulted during the
development of the client satisfaction scales in order to create similar or equivalent
instruments for them at a later stage.
A second factor that should be taken into account is the accountability-related research
that members of the EWH had previously completed. Within this context, accountability
can be seen as a continuum that stretches from strategic leadership, on the one hand, to
client satisfaction, on the other. This continuum is summarised in Figure 1.
http://socialwork.journals.ac.za DOI: http://dx.doi.org/10.15270/50-1-13

2
Social Work/Maatskaplike Werk 2014:50(1)
FIGURE 1
THE ACCOUNTABILITY CONTINUUM
Based on: Jamali, Safieddine and Rabbath (2008:445-447) and Swift (2001:16,19-20).
The completed research that has a bearing on some of the components of the
accountability continuum (see Figure 1) includes:
a study that led to the acceptance of the strengths-focused approach as the strategic
service delivery paradigm for the Police Social Work section (Stutterheim & Weyers,
2004);
a number of return-on-investment (ROI) studies that have a bearing on financial
accountability and showed, among other things, that the organisation’s investment in
social work services is a “profitable endeavour” (Huisamen & Weyers, 2009:456-
457; Williams & Weyers, 2009:380);
a study into the effectiveness of EHW’s Service (delivery) Information Record (SIR)
system that has a bearing on the monitoring of the performance of its practitioners
(Janse van Rensburg, 2012); and
a large number of studies that dealt with the impact or effect of social work services
on personnel and new recruits (Weyers, Huisamen, Kleingeld & Williams, 2006).
The only component of the accountability continuum that has not yet received any direct
attention is client satisfaction (see Figure 1). One reason is probably the many difficulties that
are associated with this type of research. The six most pertinent difficulties are the following.
Determining who the “client” really is. Is it, for example:
- the direct recipients of services;
- the legislative structure, courts or an organisations management system that
demands that certain services should be rendered;
- the system that “pays” the social worker’s salary; or
- the system/person that refers someone to the social worker?
Obtaining informed consent from “clients”. Difficulties include:
- children and adults with cognitive impairments who are not in a position to
provide such consent;
- adults who are unwilling because of fear of being stigmatised or victimised; and
http://socialwork.journals.ac.za DOI: http://dx.doi.org/10.15270/50-1-13

3
Social Work/Maatskaplike Werk 2014:50(1)
- organisations that might fear the effect that negative responses will have on their
image.
Deciding on the most appropriate timing of measurements. Client satisfaction levels
can vary greatly over time, especially if measurements involve prolonged contact.
Selecting an appropriate data-collecting instrument. These instruments can vary
from:
- schedules for telephonic or personal interviews and the accompanying danger of
“data contamination”;
- to different types of self-administered questionnaires with their potentially low
return rates and scope for the misinterpretation of questions.
Meeting reliability and validity requirements. These requirements are notoriously
difficult to meet in the case of self-assessments or self-reports because of, amongst
other things:
- the overall subjective and emotive nature of this field;
- the inclination of some respondents not to be completely honest; and
- respondents’ tendency to give highly fluctuating responses because of the
“contrast effect” brought about by too high or too low original expectations.
Meeting ethical requirements. These include:
- safeguarding the anonymity of respondents; and
- at the same time acquiring sufficient data to make somewhat detailed changes to
services (Hsieh, 2012:529-533; Swift, 2001:18-19,23-24); Tilbury et al., 2010:83-86.
In order to overcome some of these difficulties, a strategic decision was taken at the
outset not to limit the study to a single instrument. The nature of the services rendered
by the EHW component through its social work section requires that two types of
services and two stakeholders would have to be accommodated. The services are, on the
one hand, those of a more therapeutic/individual-centred nature and, on the other, the
EHW’s various (group work-based) proactive personnel capacity-building programmes.
The stakeholders are the recipients of these services and the managers who refer them to
these services (known as “referral agents”). As a result, three instruments had to be
developed. They ultimately became known as:
the Individual Client Satisfaction Scale (ICSS);
the Referral Agent Satisfaction Scale (RASS); and
the Programme Satisfaction Scale (ProSS).
Because of length constraints and the fact that elements of the ProSS have already been
covered in other publication (Weyers et al., 2006), only the first two scales are dealt
with in this article.
http://socialwork.journals.ac.za DOI: http://dx.doi.org/10.15270/50-1-13

4
Social Work/Maatskaplike Werk 2014:50(1)
THE DESIGN AND DEVELOPMENT PROCESS
The study utilised the design and development (D&D) research model and process (De
Vos & Strydom, 2011:476-485) as a general guideline. In this case, the design of the
scales went through the following five phases:
A literature study;
Compiling of draft ICSS and RASS scales/questionnaires;
Peer review of these draft scales and revision and finalisation of the instruments;
Pilot testing of the scales;
Measurement of their reliability and validity.
In order to place the resulting scales into perspective, each phase is briefly discussed below.
Phase 1: The literature study
The draft questions and scales were based on the results of a comprehensive literature
study. The analysis focused on, amongst other things, the requirements that a client
satisfaction survey questionnaire and scale must meet, the constructs that can be covered
by such instruments and the protocols that should be followed in their utilisation.
Because of the rather unique occupational social work context in which the study was
conducted, sources from a variety of other fields also had to be consulted. These varied
from healthcare and nursing to psychology, and from human resources management to
social work (Dauenhauer, Mayer & Mason, 2007:47-53; Grinnell, Gabor & Unrau,
2012:253-259; O’Brien & Stewart, 2009:109-117; Tilbury et al., 2010:81-87; Trotter,
2008:266-272; Van Nie, Hollands & Hamars, 2010:340-343). Sources also covered the
nature of the SAPS and social work within this occupational setting, as well as previous
research into the effect of social work services (Huisamen & Weyers, 2006; Janse van
Rensburg, 2012; Stutterheim & Weyers, 2004; Weyers, Strydom, & Huisamen, 2008).
Phase 2: The development of draft scales/questionnaires
A clear design philosophy is required to overcome the difficulties inherent in client
satisfaction research and surveys (Ahlfors, Lewander, Lindstrom, Malt, Lublin & Malm,
2001:73). It was consequently decided from the outset that the questionnaires had to be:
self-administered (i.e. respondents had to be able to complete them independently);
short (preferably no more than 15 questions in total);
quick to complete (preferably not requiring more than 5 minutes);
easy to understand (i.e. accessible to client systems with different levels of education
and from different language groups);
in English (the language understood by most of the potential respondents);
able to yield statistical data that would be easy to capture and interpret (even by
persons who do not have a background in statistics);
able to provide a mechanism through which the experiences of client systems and
referral agents could be compared (if only on a very basic level); and
http://socialwork.journals.ac.za DOI: http://dx.doi.org/10.15270/50-1-13

5
Social Work/Maatskaplike Werk 2014:50(1)
able to produce reliable and valid scales and subscales.
It was then necessary to decide on the core components of the questionnaires. These
components should, according to McNeill, Nicholas, Szechy and Lach (1998:2-3),
constitute the specific and definable service attributes which individually influence the
extent to which clients are either satisfied or dissatisfied with the service they receive.
The literature study and analysis of SAPS needs indicated that the Individual Client
Satisfaction Scale (ICSS) should consist of four core components. They are:
the accessibility of the practitioner;
the quality and relevance of his/her services;
the degree of professionalism with which the case has been handled; and
the “general impression” that is left by the encounter.
Each of the four components was converted into a subscale of the ICSS. The same principle
was, with one exception, also applied to the Referral Agent Satisfaction Scale (RASS).
Because of the nature of social work in an occupational setting, the “quality and relevance”
subscale was replaced by a “feedback” subscale. An attempt was made to keep all the
subscales as similar as possible in order to facilitate the drawing of comparisons.
The final composition of the scales and subscales is depicted in Figure 2.
FIGURE 2
THE COMPOSITION OF THE ICSS AND RASS SCALES
http://socialwork.journals.ac.za DOI: http://dx.doi.org/10.15270/50-1-13

6
Social Work/Maatskaplike Werk 2014:50(1)
The nature of the subscales contained in the two instruments, as well as the core
constructs measured by each, will be covered briefly.
The accessibility of the practitioner (ICSS & RASS)
According to Barker (2003:3), the construct accessibility of service refers to “The
relative opportunity for people in need to obtain relevant services”. The subscale covers
three types of accessibility (see Tables 3 & 4). They are the ease with which contact can
be made with a practitioner (i.e. “reachability”), how soon after the first contact they
become available for an appointment (i.e. “availability”) and their availability after
hours (an element of “convenience”) (O’Brien & Stewart, 2009:113; Ribner & Knei-
Paz, 2002:383-384).
The three types of accessibility also form part of the criteria used by the SAPS to rate the
work performance of individual EHW practitioners. The results of the subscale could,
consequently, also be used as a performance monitoring instrument (see Figure 1) in
personnel management.
The quality and relevance of the practitioner’s services (ICSS only)
The quality and relevance subscale is only contained in the ICSS. In essence, it deals
with the technical competence of the practitioner and the extent to which his or her
services meet expectations (McNeill et al., 1998:3-4; Wolniak & Skotnicka-Zasadzien,
2011:1239-1241). It consists of six questions. The first two questions focus on the
practitioner’s perceived level of expertise and the quality of his/her service. The others
deal with the extent to which the service is on the client’s level, whether it makes a
difference in their lives and whose interest it serves best (see Table 3) (O’Brien &
Stewart, 2009:113; Tilbury et al., 2010:80-81, 85-86).
The practitioner’s level of professionalism (ICSS & RASS)
The second shared subscale (see Figure 2) deals with the extent to which the practitioner
demonstrated professional behaviour or conduct (Barker, 2003:341). This includes traits
such as punctuality, observing confidentiality, exhibiting empathy and treating the
client/referral agent with respect. The literature study indicated that these traits form an
integral part of effective service delivery (Jindani & Murdock, 2009:365-367; Kapp &
Vela, 2004:278-279; Ribner & Knei-Paz, 2002:380, 382-384; Tilbury et al., 2010:85-87).
The general impression that is created (ICSS & RASS)
The next shared subscale covers what is termed the “general impression” left by the
practitioner. It deals in essence with the perceived value of, or benefits derived from, the
service (Tilbury et al., 2010:79-80). In the case of the ICSS, the individual client can, for
example, evaluate if receiving the service is worth the effort (i.e. has a positive cost-benefit
ratio) and if they will urge other personnel members to make use of it (i.e. worth a personal
endorsement) (Hsieh, 2009:26-28; McNeill et al., 1998:3-4). The referral agents can, in the
case of the RASS, indicate whether it has helped them to fulfil their role as manager.
http://socialwork.journals.ac.za DOI: http://dx.doi.org/10.15270/50-1-13

7
Social Work/Maatskaplike Werk 2014:50(1)
The feedback received from the practitioner (RASS only)
Because of the nature of occupational social work, the study could not only focus on
individual clients. It also had to accommodate the organisation’s needs and best interest
(Iversen, 1998:555-556) and, consequently, measure this “client’s” satisfaction with
services. In the study the organisation (i.e. SAPS) as client was represented by the
referral agent.
The principle of confidentiality prevents practitioners from providing detailed
information about individual clients and their progress to referral agents. It is, however,
an organisational requirement that the managers who do these referrals must receive
more generalised verbal or written feedback on the matter. The timeliness and quality of
this feedback are covered by a separate subscale within the RASS (see Figure 2).
Phase 3: The peer-review of the concept scales and protocol
According to the design and development (D&D) process (De Vos & Strydom,
2011:480-484; Grinnell et al., 2012:36-37), it is prudent first to do a feasibility study and
test draft scales/questionnaires before embarking on a pilot study. In this case, it was
important to ascertain if the selected questions were concise and understandable, if
clients and referral agents would answer them honestly, if the principle of confidentiality
would be upheld, and if the intended protocol (i.e. distribution, completion and
collection of questionnaires) would be feasible and appropriate.
It was also evident from the outset of the study that the proposed protocol and scales
would, in the long run, have to serve a diversity of interests and provinces. This made it
inappropriate to follow the ‘usual’ panel of experts or focus group verification route
(Huisamen, 2005:61). The most appropriate alternative was to provide the draft
instruments, together with evaluation questionnaires, to all the different EHW
practitioners in three selected provinces for a peer review (Barker, 2003:320). The same
provinces would then later also be used for the pilot testing of the scales/instruments.
Sampling
Because of logistical and time constraints, only three provinces could be used for the
initial evaluation and subsequent pilot testing of the scales. The choice fell on Gauteng
(a north-central province), the Western Cape (a western and coastal province) and
Kwazulu-Natal (an eastern and coastal province). These three geographically dispersed
provinces cover substantial numbers of the different population groups found in the
Republic of South Africa. This criterion is important in order to ensure that people from
a diversity of language groups will be able to understand the questions contained in the
instruments. If taken as a whole, the triangle of selected provinces also provided a good
mixture of urban, peri-urban and rural settings. This is especially important as far as the
accessibility of practitioners is concerned.
Evaluation and recommendation by EHW practitioners
The protocol, scales and an accompanying evaluation questionnaire were sent to all the
different EHW practitioners (i.e. social workers, psychologists and chaplains) in the
three provinces. Their participation was completely voluntary and a total of 34
http://socialwork.journals.ac.za DOI: http://dx.doi.org/10.15270/50-1-13

8
Social Work/Maatskaplike Werk 2014:50(1)
evaluation questionnaires were returned to the researchers. This response rate represents
15% of the targeted population.
The data produced by the questionnaire are contained in Table 1.
TABLE 1
EVALUATION OF PROTOCOL AND DRAFT SCALES BY EHW
PRACTITIONERS
Question
Responses**
Totals* 1.
Strongly
disagree
2.
Disagree
3.
Unsure
4.
Agree
5.
Strongly
agree
1. I think the introduction of Client
Satisfaction Questionnaires by
EHW is a good initiative
4
11.8%
1
2.9%
5
14.7%
15
44.1%
9
26.5%
34
100%
2. I think the questions are clear and
understandable
3
9.1%
1
3.0%
2
6.1%
18
54.5%
9
27.3%
33
100%
3. I think the personnel members
will be honest in completing these
questionnaires
3
9.1%
1
3.0%
14
42.4%
9
27.3%
6
18.2%
33
100%
4. I think the process can be dealt
with confidentially
2
6.1%
2
6.1%
8
24.2%
10
30.3%
11
33.3%
33
100%
5. I think that the current way in
which questionnaires are
distributed and collected is
practical
4
12.5%
4
12.5%
6
18.8%
11
34.4%
7
21.9%
32
100%
* Note: Not all respondents completed all the questions. ** The 5-point Likert/scaled
questions ranged from “Strongly disagree” to “Strongly agree”.
It was clear from the responses to the five Likert-type (scaled) questions, as well as the
comments on the “recommendations” section of the evaluation questionnaire, that most
of the respondents viewed the new initiative in a very positive light. Some concern was,
however, expressed regarding the question of confidentiality and the protocol followed
in the distribution and collection of the questionnaires. These would have to be rectified
on an administrative level, when the project is implemented on a national level.
Recommended changes to individual questions were incorporated in the scales that were
readied for pilot testing.
Phase 4: The pilot testing of the instruments
The pilot testing of the ICSS and RASS in the three selected provinces took place from
18 September 2011 to 18 October 2011. As in the case of Phase 3, participation by
clients, practitioners and referral agents was completely voluntary. In spite of the pitfalls
associated with such a step, 136 ICSS questionnaires and 58 RASS questionnaires were
returned to the researchers. This response rate was higher than expected and possibly
indicative of a need amongst the participants to have the opportunity to air their views.
http://socialwork.journals.ac.za DOI: http://dx.doi.org/10.15270/50-1-13
9
Social Work/Maatskaplike Werk 2014:50(1)
All the completed scales were submitted to the North-West University’s Statistical
Consultation Services for data capturing and analysis.
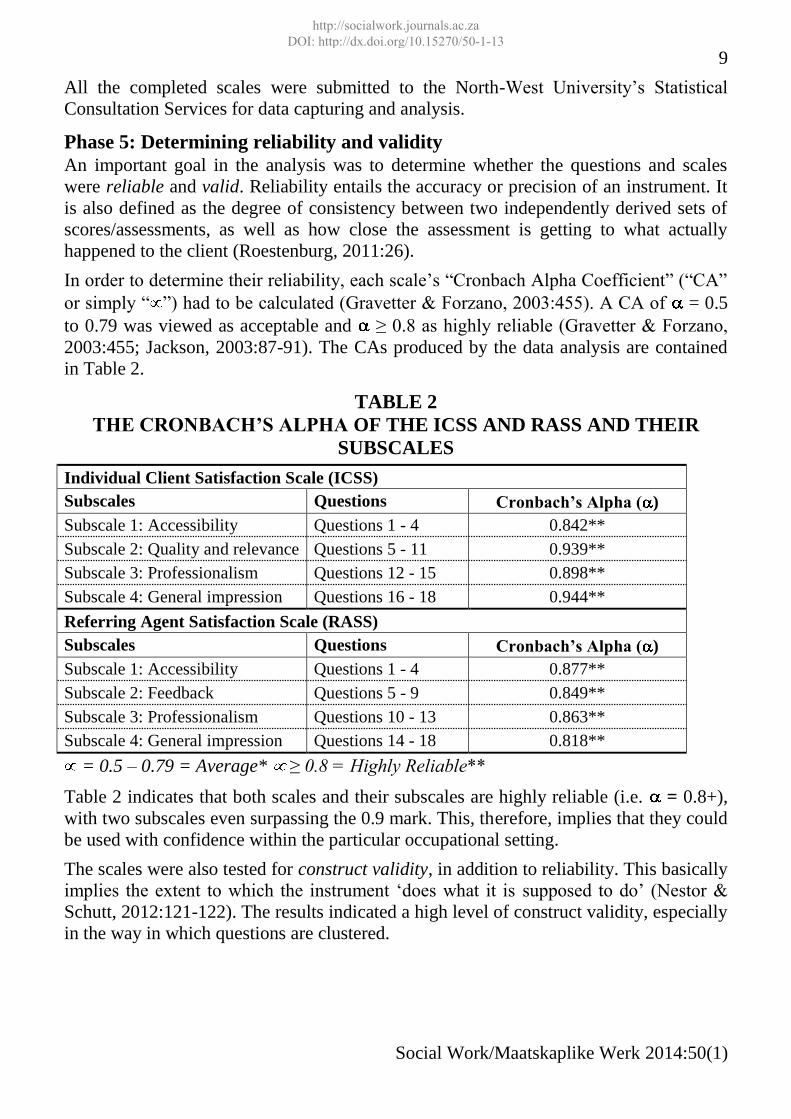
Phase 5: Determining reliability and validity
An important goal in the analysis was to determine whether the questions and scales
were reliable and valid. Reliability entails the accuracy or precision of an instrument. It
is also defined as the degree of consistency between two independently derived sets of
scores/assessments, as well as how close the assessment is getting to what actually
happened to the client (Roestenburg, 2011:26).
In order to determine their reliability, each scale’s “Cronbach Alpha Coefficient” (“CA”
or simply “ ”) had to be calculated (Gravetter & Forzano, 2003:455). A CA of = 0.5
to 0.79 was viewed as acceptable and ≥ 0.8 as highly reliable (Gravetter & Forzano,
2003:455; Jackson, 2003:87-91). The CAs produced by the data analysis are contained
in Table 2.
TABLE 2
THE CRONBACH’S ALPHA OF THE ICSS AND RASS AND THEIR
SUBSCALES
Individual Client Satisfaction Scale (ICSS)
Subscales Questions Cronbach’s Alpha ( )
Subscale 1: Accessibility Questions 1 - 4 0.842**
Subscale 2: Quality and relevance Questions 5 - 11 0.939**
Subscale 3: Professionalism Questions 12 - 15 0.898**
Subscale 4: General impression Questions 16 - 18 0.944**
Referring Agent Satisfaction Scale (RASS)
Subscales Questions Cronbach’s Alpha ( )
Subscale 1: Accessibility Questions 1 - 4 0.877**
Subscale 2: Feedback Questions 5 - 9 0.849**
Subscale 3: Professionalism Questions 10 - 13 0.863**
Subscale 4: General impression Questions 14 - 18 0.818**
= 0.5 – 0.79 = Average* ≥ 0.8 = Highly Reliable**
Table 2 indicates that both scales and their subscales are highly reliable (i.e. = 0.8+),
with two subscales even surpassing the 0.9 mark. This, therefore, implies that they could
be used with confidence within the particular occupational setting.
The scales were also tested for construct validity, in addition to reliability. This basically
implies the extent to which the instrument ‘does what it is supposed to do’ (Nestor &
Schutt, 2012:121-122). The results indicated a high level of construct validity, especially
in the way in which questions are clustered.
http://socialwork.journals.ac.za DOI: http://dx.doi.org/10.15270/50-1-13

10
Social Work/Maatskaplike Werk 2014:50(1)
THE RESULTS OF THE PILOT STUDY
Although the research was mainly aimed at the development and verification of
measuring instruments, their pilot testing has already produced results that could be of
great value to both the EHW component of the SAPS and other organisations. These
results and their implications are covered next.
Results produced by the Individual Client Satisfaction Scale (ICSS)
The data produced by the ICSS are contained in Table 3. This table is structured
according to the four constituent subscales/components.
TABLE 3
RESULTS PRODUCED BY THE ICSS
SUBSCALES RESPONSES TOTALS
Subscale 1:
Accessibility of practitioner
1.
Strongly
disagree
2.
Disagree
3.
Unsure
4.
Agree
5.
Strongly
agree
Totals* Total
positiveª
1. It was easy to make an
appointment with the EHW
practitioner
0
0.0%
7
5.3%
18
13.6%
65
49.2%
42
31.8% 132
100%
107
81.1%
2. The EHW practitioner was
quickly available when I
needed him/her
1
0.8%
6
4.5%
19
14.4%
67
50.8%
39
29.5% 132
100%
106
80.3%
3. It was possible to reach an
EHW practitioner after
hours
0
0.0%
11
8.5%
37
28.5%
58
44.6%
24
18.5% 130
100%
82
63.1%
Average responses (%) 0.3% 6.1% 18.8% 48.2% 26.6% 100% 74.8%
Subscale 2:
Quality and relevance of the
practitioner’s services
1.
Strongly
disagree
2.
Disagree
3.
Unsure
4.
Agree
5.
Strongly
agree
Totals* Total
positiveª
4. This EHW practitioner is an
expert in his/her field
0
0.0%
1
0.7%
19
14.1%
67
49.6%
48
35.6%
135
100%
115
85.2%
5. I received a quality service
from this EHW practitioner
1
0.8%
2
1.5%
11
8.3%
69
51.9%
50
37.6%
133
100%
119
89.5%
6. This EHW practitioner
could communicate on my
level
0
0.0%
2
1.5%
14
10.4%
72
53.7%
46
34.3% 134
100%
118
88.1%
7. The service I received was
in my best interest
1
0.8%
3
2.3%
11
8.3%
72
54.1%
46
34.6%
133
100%
118
88.7%
8. The service I received was
in the organisation’s best
interest
1
0.8%
4
3.2%
16
12.7%
74
58.7%
31
24.6% 126
100%
105
83.3%
9. The service I received made
a difference to my life
1
0.8%
2
1.6%
14
11.1%
82
65.1%
27
21.4%
126
100%
109
86.5%
Average responses (%) 0.5% 1.8% 10.8% 55.5% 31.3% 100% 86.9%
http://socialwork.journals.ac.za DOI: http://dx.doi.org/10.15270/50-1-13

11
Social Work/Maatskaplike Werk 2014:50(1)
Subscale 3:
The practitioner’s level of
professionalism
1.
Strongly
disagree
2.
Disagree
3.
Unsure
4.
Agree
5.
Strongly
agree
Totals* Total
positiveª
10. This EHW practitioner is
punctual (i.e. on time)
1
0.8%
4
3.1%
15
11.5%
77
58.8%
34
26.0%
131
100%
111
84.7%
11. This EHW practitioner is
polite (i.e. considerate)
0
0.0%
3
2.3%
8
6.1%
69
52.7%
51
38.9%
131
100%
120
91.6%
12. This EHW practitioner is
compassionate (i.e.
sympathetic)
0
0.0%
3
2.3%
8
6.1%
79
60.3%
41
31.3%
131
100%
120
91.6%
13. This EHW practitioner is
trustworthy (i.e. will treat
information as confidential)
0
0.0%
2
1.5%
13
10.0%
70
53.8%
45
34.6%
130
100%
115
88.5%
Average responses (%) 0.2% 2.3% 8.4% 56.4% 32.7% 100% 89.1%
Subscale 4:
General impression
1.
Strongly
disagree
2.
Disagree
3.
Unsure
4.
Agree
5.
Strongly
agree
Totals* Total
positiveª
14. I would recommend EHW
services to my colleagues
and/or family
2
1.5%
1
0.8%
6
4.6%
68
51.9%
54
41.2%
131
100%
122
93.1%
15. I would use EHW services
again when necessary
1
0.8%
2
1.6%
11
8.6%
68
53.1%
46
35.9%
128
100%
114
89.1%
16. My use of EHW services
was worth the effort
2
1.6%
3
2.4%
11
8.8%
65
52.0%
44
35.2%
125
100%
109
87.2%
Average responses (%) 1.3% 1.6% 7.3% 52.3% 37.5% 100% 89.8%
* Not all respondents completed all the questions. ª Positive responses consist of the
“Agree” plus “Strongly agree” options.
A number of trends emerged from the data produced by the ICSS (see Table 3). The
most important of these are summarised below.
An average of 74.8% respondents gave an overall positive rating (i.e. “agree” plus
“strongly agree”) to the accessibility of practitioners (Table 3: Subscale 1), with the
highest positive average going to the ease with which appointments could be made
with practitioners (Table 3: Q1). An unusual trend was the relatively large number of
respondents (37/28.5%) who were “unsure” whether practitioners could be reached
after hours and another 11 (8.5%) who were of the opinion that this was not the case
(Table 3: Q3). This could be indicative either of a lack of knowledge or no attempt to
do so. Because practitioners are on standby, this trend requires further investigation.
Respondents gave the quality and relevance of practitioners’ services (Table 3:
Subscale 2) a very high overall positive rating of 86.9%. The two strongest elements
were the quality of the services (Table 3: Q5, X = 89.5%) and the view that the
services were in the client’s best interest (Table 3: Q7, X = 88.7%).
Subscale 3: The practitioner’s level of professionalism produced the second highest
overall positive rating of 89.1% (see Table 3). Respondents indicated that
practitioners were compassionate (Table 3: Q12, X = 91.6%) and polite (Table 3:
http://socialwork.journals.ac.za DOI: http://dx.doi.org/10.15270/50-1-13

12
Social Work/Maatskaplike Werk 2014:50(1)
Q11, X = 91.6%), as well as trustworthy (Table 3: Q13, X = 88.5%). The only trait
that measured slightly lower was punctuality (Table 3: Q10, X = 84.7%).
The General impression subscale produced the highest overall positive rating (Table
3: Subscale 4, X = 89.8%), as well as the highest individual positive response (Table
3: Q14, X = 93.1%). These results should be viewed as significant, because the
subscale basically deals with the perceived value of, or benefits derived from, the
service (Tilbury et al., 2010:79-80). Especially the respondents’ willingness to
personally endorse the service (Table 3: Q14) bodes well for the extension of social
work services to a larger proportion of the organisation’s personnel.
Three of the four subscales produced an overall positive rating in the 80%+ range.
The only exception was Subscale 1 and in particular question 3 (see Table 3).
Results produced by the Referring Agent Satisfaction Scale (RASS)
A summary of the data produced by the pilot testing of the Referring Agent Satisfaction
Scale (RASS) is provided in Table 4. This table is structured according to the scale’s
four constituent subscales.
TABLE 4
RESULTS PRODUCED BY THE RASS
SUBSCALES RESPONSES TOTALS
Subscale 1:
Accessibility of practitioner
1
Strongly
disagree
2
Disagree
3
Unsure
4
Agree
5
Strongly
agree
Totals* Total
positiveª
1. It was easy to make an
appointment with the
EHW practitioner
0
0.0%
0
0.0%
0
0.0%
17
28.3%
43
71.7%
60
100%
60
100.0%
2. The EHW practitioner was
quickly available when I
needed him/her
0
0.0%
0
0.0%
1
1.7%
20
33.3%
39
65.0%
60
100%
59
98.3%
3. It was possible to reach an
EHW practitioner after
hours
1
1.7%
0
0.0%
8
13.3%
25
41.7%
26
43.3%
60
100%
51
85.0%
Average responses (%) 0.6% 0.0% 5.0% 34.4% 60.0% 100% 94.4%
Subscale 2:
Feedback received from the
practitioner
1
Strongly
disagree
2
Disagree
3
Unsure
4
Agree
5
Strongly
agree
Totals* Total
positiveª
4. I received proper verbal
feedback from the EHW
practitioner after this
referral
1
1.7%
0
0.0%
8
13.6%
17
28.8%
33
55.9%
59
100%
50
84.7%
5. I received the EHW
practitioner’s verbal
feedback within good time
0
0.0%
0
0.0%
1
1.7%
20
33.3%
39
65.0%
60
100%
59
98.3%
6. The written report I
received from the EHW
0
0.0%
0
0.0%
2
3.4%
19
32.8%
37
63.8%
58
100%
56
96.6%
http://socialwork.journals.ac.za DOI: http://dx.doi.org/10.15270/50-1-13

13
Social Work/Maatskaplike Werk 2014:50(1)
SUBSCALES RESPONSES TOTALS
practitioner was of a good
quality
7. I received the EHW
practitioner’s written report
within good time
0
0.0%
0
0.0%
0
0.0%
17
28.3%
43
71.7%
60
100%
60
100.0%
Average responses (%) 0.4% 0.0% 4.7% 30.8% 64.1% 100% 94.9%
Subscale 3:
The practitioner’s level of
professionalism
1
Strongly
disagree
2
Disagree
3
Unsure
4
Agree
5
Strongly
agree
Totals* Total
positiveª
8. This EHW practitioner is an
expert in his/her field
0
0.0%
0
0.0%
0
0.0%
17
28.3%
43
71.7%
60
100%
60
100.0%
9. This EHW practitioner is
punctual (i.e. on time)
0
0.0%
1
1.7%
1
1.7%
25
43.1%
31
53.4%
58
100%
56
96.6%
10. This EHW practitioner is
polite (i.e. considerate)
0
0.0%
0
0.0%
0
0.0%
20
35.1%
37
64.9%
57
100%
57
100.0%
11. This EHW practitioner is
trustworthy (i.e. will treat
information as
confidential)
0
0.0%
0
0.0%
0
0.0%
21
36.2%
37
63.8%
58
100%
58
100.0%
Average responses (%) 0.0% 0.4% 0.4% 35.7% 63.5% 100% 99.1%
Subscale 4:
General impression
1
Strongly
disagree
2
Disagree
3
Unsure
4
Agree
5
Strongly
agree
Totals* Total
positiveª
12. I would refer to / make use
of EHW services again
0
0.0%
0
0.0%
0
0.0%
20
34.5%
38
65.5%
58
100%
58
100.0%
13. I would encourage
members to use EHW
services / attend
programmes
0
0.0%
0
0.0%
0
0.0%
19
32.8%
39
67.2%
58
100%
58
100.0%
14. EHW’s intervention /
services were helpful to
me as a commander
1
1.8%
0
0.0%
2
3.5%
23
40.4%
31
54.4%
57
100%
54
94.7%
Average responses (%) 0.6% 0.0% 1.2% 35.9% 62.4% 100% 98.2%
* Not all respondents completed all the questions. ª Positive responses consist of the
“Agree” plus “Strongly agree” options.
The data produced by the RASS (see Table 4) brought a number of important trends to
the fore. They include the following:
The total positive rating (i.e. “agree” plus “strongly agree”) per subscale all exceeded
the 90% mark and was even 99.1% for the assessments of practitioners’ level of
professionalism (Table 4: Subscale 3).
The lowest overall rating was for the accessibility of practitioners (Table 4: Subscale
1, X = 94.4%) and availability after hours again produced as relatively low positive
response (Table 4: Q3, X = 85.0%). The other elements were, however, very positive
http://socialwork.journals.ac.za DOI: http://dx.doi.org/10.15270/50-1-13
14
Social Work/Maatskaplike Werk 2014:50(1)
and even reached the 100% mark for the ease with which appointments could be
made with practitioners (Table 4: Q1).
Although the overall positive rating in Subscale 2: Feedback received from the
practitioner fell in the 90%+ range (Table 4: Subscale 2), an interesting trend
emerged from the analysis of responses to individual questions. It was that, although
verbal and written feedback were provided “within good time” (i.e. expeditiously),
the quality of these responses was not on the same level (compare Table 4: Q5 & Q7
with Q4 & Q6). These are issues that would probably have to be taken up by the
management cadre of the EHW services.
The second highest positive result was produced by the General impression subscale
(Table 4: Subscale 4, X = 98.2%). This willingness to again make use of the EHW
practitioners’ services (Table 4: Q12, X = 100%) and encourage other members to
use it (Table 4: Q13, X = 100%), could be viewed as indicative of a large measure of
trust that managers place in the social workers.
Results produced by the testing of the implementation protocol
The research did not only test the measurement scales, but also the protocol used in their
distribution, completion, collection and interpretation. The results would ultimately
indicate whether it would be feasible to expand their use to the total organisation.
The testing of the protocol in three provinces showed that it was fundamentally sound and
could, with some minor changes, be replicated throughout the organisation and country.
These required changes have a bearing on four practical, logistical and ethical difficulties.
It was, firstly, clear that an alternative method for the distribution and return of
questionnaires will have to be considered. As opposed to the current process of using
sealed ‘drop-boxes’ for the return of questionnaires, prospective respondents could be
provided with pre-addressed envelopes. They could then mail them at the station/unit’s
registration office and from there they would be forwarded to EHW National Office in
Pretoria. This should result in a higher level of confidentiality and also ensure that all the
questionnaires would be mailed to a central point where the results could be calculated.
Secondly, one of the biggest concerns in the measurement of client satisfaction,
especially in a clinical setting, is the threat to the anonymity of respondents. This
concern was also shared by the EHW practitioners who participated in the peer-review
process (see Table 1). The use of pre-addressed envelopes would, however, go a long
way towards safeguarding each respondent’s identity.
There was, thirdly, a general concern about the contamination of results. This would
especially be the case in the completion of the ICSS, where the response rate will
depend on the EHW practitioner’s ability and willingness to convince his or her clients
to complete and mail their questionnaire. The danger is that only those clients that adopt
a “positive stance” towards the practitioner would be motivated to do so. There is no
direct remedy to this danger. It would, however, be possible to identify an unusually low
response rate by comparing a practitioner’s service delivery statistics with the number of
questionnaires received. It is also envisaged that, as the idea of client satisfaction is
http://socialwork.journals.ac.za DOI: http://dx.doi.org/10.15270/50-1-13

15
Social Work/Maatskaplike Werk 2014:50(1)
marketed throughout the organisation, clients would come to expect to have the
opportunity to evaluate services and would “demand” to do so.
It was possible during the study to make use of advanced statistical consultation services
and sophisticated computer programs in the capturing and interpretation of data. It
would not be possible to replicate this within the SAPS on a continuing basis.
Fortunately, both scales and their subscales had a very high Cronbach Alpha Coefficient
(see Table 2) and this, coupled with their construct validity, implies that they could be
viewed as standardised instruments for use within the organisation. It will consequently
not be necessary to test all new batches of questionnaires/scales for reliability and
validity. The data that they produce can be used with confidence in the interpretations of
the levels of the clients’ satisfaction. This can even be achieved through the use of
descriptive statistics.
The proposed protocol is that completed questionnaires would be forwarded from each
station’s/unit’s registration offices to the EHW National Office where the data would be
captured on an available computer program such as Epidata or MSExcel. In the
interpretation of the resultant descriptive statistics, note should be taken of the fact that
the selected 5-point Likert-type scale does not have a “0”. An average “mark” of
between 3.41 and 4.2 (68.2% and 84%) would consequently indicate an “above average”
or “good” positive response, and between 4.21 and 5 (84.2% & 100%) an “excellent”
rating. It is also proposed that the results would be communicated to the different
provinces on a regular (e.g. monthly) basis.
FINDINGS AND IMPLICATIONS
Only the main results produced by the study, as well as their implications, are covered next.
The literature study first of all clearly indicated that the field of client satisfaction
research and practice should not be taken lightly. It forms a vital part of the
responsibility to remain accountable that practitioners have towards both their employers
and clients and, in essence, answers the question: “Do the social workers really make a
difference?” To produce clear and substantiated answers requires scientifically tested
and verified measuring instruments based on in-depth research. The procedure used in
this study can be used as a guideline in such an endeavour.
A second finding was that it is possible to develop and standardise, as well as
successfully utilise, client satisfaction scales within South African social work practice.
This paves the way for the development of specific scales for different social work
settings. The latter can range from occupational social work to generic practice, and
from statutory social work to different types of specialised services.
The ICSS and RASS, thirdly, proved to be highly reliable and valid measuring
instruments. This result has the following three core implications:
The first is that the EHW component of the SAPS can proceed with the
implementation of the scales/instruments on a national level, as well as extend their
use to psychologists and chaplains;
http://socialwork.journals.ac.za DOI: http://dx.doi.org/10.15270/50-1-13

16
Social Work/Maatskaplike Werk 2014:50(1)
Secondly, because of the reliability and validity levels attained, it should be possible
to utilise the scales in other occupational social work settings. This will only require
minor changes to some of the wording used;
A third implication is that the scales/instruments can be used as a template in the
development of similar instruments for other settings. Especially the ICSS can be
used in generic practice, with a few additions and changes to mainly the
“Accessibility of practitioner” subscale.
The study, fourthly, did provide an answer to the question: “Do the social workers really
make a difference?” The very high level of satisfaction with their services in the selected
three provinces proves that this is indeed the case. The results, however, also pinpoint
two possible areas for further improvement. They are the availability of practitioners
after hours and the quality of the feedback provided to referral agents.
It is not expected that the statistically high levels of satisfaction attained with the pilot
will be maintained when the measurement process is rolled out to the entire
organisation. In order to accommodate a possible Hawthorne effect produced by the
knowledge of respondents that they were participating in a study (Grinnell et al.,
2012:220), a lower benchmark should be selected. The study indicated that a statistical
average “mark” per question/scale of between 3.41 and 4.2 (68.2% and 84%) should be
considered as “good” and between 4.21 and 5 (84.2% and 100%) as “excellent”.
The final finding pertains to the protocol followed in the utilisation of the client satisfaction
questionnaires/scales. The literature abounds with examples of practitioners and
organisations using practical, logistical and ethical considerations as a justification for not
utilising client satisfaction instruments in their particular settings. The current study
indicated that, even though it poses difficulties, such stumbling blocks can be overcome.
If the measurement of client satisfaction were to become as widespread as the Department
of Social Development’s Integrated Service Delivery Model (2005:47) envisaged, all
relevant parties would be the beneficiaries. This will include clients who will have a greater
say in the quality and relevance of the services that they receive as well as the social
workers who will be able to prove that their services really make a difference.
REFERENCES
AHLFORS, U.G., LEWANDER, T., LINDSTROM, E., MALT, U.F., LUBLIN, H. &
MALM, U. 2001. Assessment of patient satisfaction with psychiatric care. Nordic
Journal of Psychiatry, 55(44):71-90.
BARKER, R.L. 2003. The social work dictionary. Washington: NASW Press.
DAUENHAUER, J.A., MAYER, K.C. & MASON, A. 2007. Evaluation of adult
protection services: perspective of community professionals. Journal of Elder Abuse &
Neglect, 19(3-4):41-57.
DEPARTMENT OF SOCIAL DEVELOPMENT. 2005. Integrated service delivery
model: towards improved social services. Pretoria: Department of Social
Development.
http://socialwork.journals.ac.za DOI: http://dx.doi.org/10.15270/50-1-13

17
Social Work/Maatskaplike Werk 2014:50(1)
DE VOS, A.S. & STRYDOM, H. 2011. Intervention research. In: DE VOS, A.S.,
STRYDOM, H., FOUCHÉ, C.B. & DELPORT, C.S.L. (eds) Research at grass roots
for the social sciences and human service professions (4th
ed). Pretoria: Van Schaik
Publishers, 473-490.
GRAVETTER, F.J. & FORZANO, L.B. 2003. Research methods for the behavioral
sciences. Belmont: Thomson/Wadsworth.
GRINNELL, R.M., GABOR, P.A. & UNRAU, Y.A. 2012. Program evaluation for
social workers: foundations of evidence-based programs (6th
ed). Oxford: Oxford
University Press.
HSIEH, C-M. 2009. Importance counts: The role of relative importance of service elements
in client satisfaction measures. Journal of Social Service Research, 35(1):23-31.
HSIEH, C-M. 2012. Perceived importance of service elements in client satisfaction
measures. Journal of Social Service Research, 38(4):529-540.
HUISAMEN, P. 2005. Die effek van die besluitnemings- en lewensdoelkomponente
van die SAPD se Selfbestuur Personeelkapasiteitsbouprogram. (The effect of the
decision-making and purpose-in-life components of the SAPS Self-Management personnel
capacity-building programme). Potchefstroom: North-West University. (PhD thesis)
HUISAMEN, P. & WEYERS, M.L. 2006. Die meting van program-effek: Riglyne
vanuit geselekteerde subprojekte van die EPCaP-studie (Measuring programme effect:
Guidelines from selected subprojects of the EPCaP study). Social Work Researcher-
Practitioner/Maatskaplikewerk-Navorser-Praktisyn, 18(3):224-265.
HUISAMEN, P. & WEYERS, M.L. 2009. Teaching employees money management
skills and showing a profit in the process: lessons from a financial literacy course. Social
Work/Maatskaplike Werk, 45(4):443-460.
IVERSEN, R.R. 1998. Occupational social work for the 21st Century. Social Work
(NASW), 43(6):551-566.
JACKSON, S.L. 2003. Research methods and statistics: a critical thinking
approach. Belmont: Thomson/Wadsworth.
JAMALI, D., SAFIEDDINE, A.M. & RABBATH, M. 2008. Corporate governance and
corporate social responsibility: synergies and interrelationships. Corporate
Governance: an International Review, 16(5):443-459.
JANSE VAN RENSBURG, M.M. 2012. The capturing, provision and interpretation
of service delivery information by police social workers: obstacles and solutions. Potchefstroom: North-West University. (MSW dissertation)
JINDANI, S.G. & MURDOCK, V. 2009. Toward client-centered service: asking clients
for their views of TANF, food stamps, child care, and Medicaid services. Journal of
Social Service Research, 35:364-379.
KAPP, S.A. & VELA, R.H. 2004. The Parent Satisfaction with Foster Care Services
Scale. Child Welfare, LXIII(3):263-287.
http://socialwork.journals.ac.za DOI: http://dx.doi.org/10.15270/50-1-13

18
Social Work/Maatskaplike Werk 2014:50(1)
McNEILL, T., NICHOLAS, D., SZECHY, K. & LACH, L. 1998. Perceived outcome of
social work intervention: beyond consumer satisfaction. Social Work in Health Care,
26(3):1-18.
NESTOR, P.G. & SCHUTT, R.K. 2012. Research methods in psychology:
investigating human behaviour. Los Angeles: Sage Publications.
O’BRIEN, M.W. & STEWART, S.J. 2009. Measuring satisfaction with social work
services. Social Work in Health Care, 48(2):105-118.
RIBNER, D.S. & KNEI-PAZ, C. 2002. Client's view of a successful helping
relationship. Social Work (NASW), 47(4):379-387.
ROESTENBURG, J.H. 2011. Ecometrics in social work. Johannesburg: Afri.Yze
Publishing.
STUTTERHEIM, E. & WEYERS, M.L. 2004. Strengths-focused intervention: the new
approach of the Social Work Service of the South African Police Service (SAPS). Social
Work/Maatskaplike Werk, 40(1):1-14.
SWIFT, T. 2001. Trust, reputation and corporate accountability to stakeholders.
Business Ethics: A European Review, 10(1):16-26.
TILBURY, C., OSMOND, J. & CRAWFORD, M. 2010. Measuring client satisfaction
with Child Welfare Services. Journal of Public Child Welfare, 4:77-90.
TROTTER, C. 2008. What does client satisfaction tell us about effectiveness? Child
Abuse Review, 17:262-274.
VAN NIE, N.C., HOLLANDS, L.J.M. & HAMARS, J.P.H. 2010. Reporting quality of
nursing home care by an internet report card. Patient Education and Counseling,
78:337-343.
WEYERS, M.L., HUISAMEN, A., KLEINGELD, C. & WILLIAMS, M. 2006.
Personnel Capacity-Building Programs: an effective addition to curative services in
occupational social work settings? Journal of Workplace Behavioral Health
(previously EAP Quarterly), 22(1):65-87.
WEYERS, M.L., STRYDOM, H. & HUISAMEN, P. 2008. Triangulation in social work
research: the theory and examples of its practical application. Social
Work/Maatskaplike Werk, 44(2):207-222.
WILLIAMS, H.M. & WEYERS, M.L. 2009. Combating workplace conflict through
education: The content and effect of a conflict management and assertiveness training
programme. Social Work/Maatskaplike Werk, 45(4):367-384, October.
WOLNIAK, R. & SKOTNICKA-ZASADZIEN, B. 2011. The concept study of Servqual
method’s gap. Quality & Quantity, 46:1239-1247.
Lieutenant-Colonel (Dr) Arnel Huisamen, Police Social Work Services, SAPS, Mossel
Bay, South Africa; Prof Mike Weyers, Social Work Division, School for Psychosocial
Sciences, North-West University: Potchefstroom Campus, South Africa.
http://socialwork.journals.ac.za DOI: http://dx.doi.org/10.15270/50-1-13