Embed Size (px)
Citation preview
3
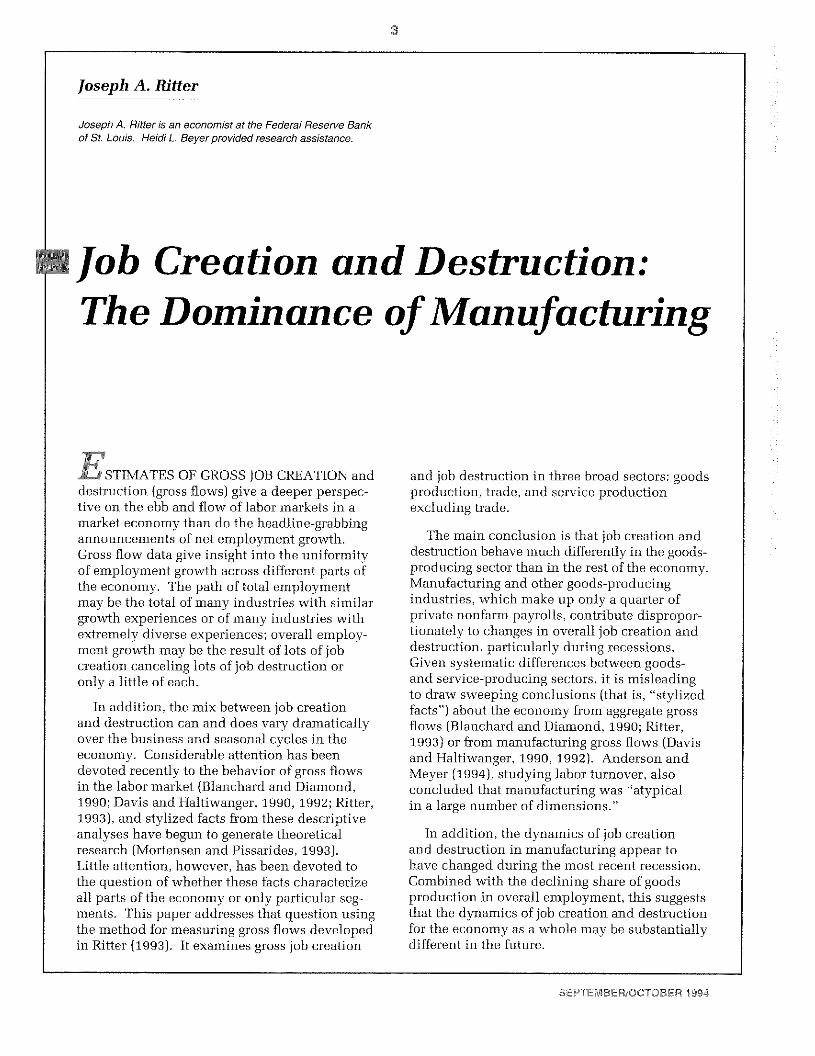
Joseph A. Ritter
Joseph A. Rifler is aneconomist at the Federal Reserve Bankof St. Louis. Heidi L. Beyer provided research assistance.
~ Job Creation and Destruction:The Dominance ofManufacturing
STIMATES OF GROSS JOB CREATION anddestruction (gross flows) give a deeper perspec-tive on the ebb and flow of labor markets in amarket economy than do the headline-grabbingannouncements of net employment growth.Gross flow data give insight into the uniformityof employment growth across different parts ofthe economy. The path of total employmentmay be the total of many industries with similargrowth experiences or of many industries withextremely diverse experiences; overall employ-ment growth may be the result of lots of jobcreation canceling lots of job destruction oronly a little of each.
In addition, the mix between job creationand destruction can and does vary dramaticallyover the business and seasonal cycles in theeconomy. Considerable attention has beendevoted recently to the behavior of gross flowsin the labor market (Blanchard and Diamond,1990; Davis and Haltiwanger, 1990, 1992; Ritter,1993), and stylized facts from these descriptiveanalyses have begun to generate theoreticalresearch (Mortensen and Pissarides, 1993).Little attention, however, has been devoted tothe question of whether these facts characterizeall parts of the economy or only particular seg-ments. This paper addresses that question usingthe method for measuring gross flows developedin Ritter (1993). It examines gross job creation
and job destruction in three broad sectors: goodsproduction, trade, and service productionexcluding trade.
The main conclusion is that job creation anddestruction behave much differently in the goods-producing sector than in the rest of the economy.Manufacturing and other goods-producingindustries, which make up only a quarter ofprivate nonfarm payrolls, contribute dispropor-tionately to changes in overall job creation anddestruction, particularly during recessions.Given systematic differences between goods-and service-producing sectors, it is misleadingto draw sweeping conclusions (that is, “stylizedfacts”) about the economy from aggregate grossflows (Blanchard and Diamond, 1990; Ritter,1993) or from manufacturing gross flows (Davisand Haltiwanger, 1990, 1992). Anderson andMeyer (1994), studying labor turnover, alsoconcluded that manufacturing was “atypicalin a large number of dimensions.”
In addition, the dynamics of job creationand destruction in manufacturing appear tohave changed during the most recent recession,Combined with the declining share of goodsproduction in overall employment, this suggeststhat the dynamics of job creation and destructionfor the economy as a whole may he substantiallydifferent in the future.
SEPTEMSER/DCTOSER 1994

4
CONSTRUCTING GROSS FLOW DATA
The raw data used to construct gross job cre-ation and destruction are monthly employmentlevels in several hundred industries in the privatenonfarm sector of the economy. The payrollor establishment survey, on which the employ-ment data are based, currently covers more than370,000 establishments, including all firms withmore than 250 employees and a subset of smallerfirms. These data are benchmarked annually usingyet more comprehensive information. The surveyexcludes agricultural workers, unpaid familyworkers, domestic workers in private homes,and self-employed persons. To focus on jobcreation and destruction driven primarily bymarket forces, the data used for this paper alsoexclude government workers, though the surveyincludes them.l
The details of constructing job creation anddestruction series (and caveats about them) aredescribed in Ritter (1993), but the main ideais as follows. First, the breadth of coverage isdefined by the set of industries for which con-tinuous employment data are available since1972, The 1972 start date was chosen because,for a large fraction of industries outside manu-facturing, disaggregated employment data arenot available for earlier years. Thus, the datacover a comprehensive cross-section of the non-farm business sector. In January 1972, employ-ment was 58.1 million for all private nonfarmpayrolls, with 97.6 percent in the industries usedin the job creation and destruction calculations.By March 1994, total employment was 93.4 millionfor all private nonfarm payrolls with 95.3 percentincluded in the present calculations. Second, aset of nonoverlapping industries is created usingthe finest level of detail available. These are three-and four-digit industries as well as the parts oftwo- and three-digit industries that are not morefinely classified into three- and four-digit indus-tries. The exact set of industries varies over timeas the Bureau of Labor Statistics (BLS) refinesthe industrial classification scheme.
Third, for a month t when there is no changein the industrial classification (most months),gross job creation is defined as the sum of
Including government workers in subsequent calculations
does not significantly change aggregate patterns of job cre-ation and destruction.
2 The exact procedure followed in months when a finer break-down of an industry appears in the data is described in theappendix to Ritter (1993).
employment changes in industries in whichemployment is increasing:
ICE =to~:IaEu,1=1
where S~ is I if employment is increasing inindustry i and 0 otherwise; ~ is employment inindustry i; and N is the number of industries inthe sector under consideration. Job destructionis defined as the sum of absolute values ofemployment changes in industries in whichemployment is decreasing:
N N
J1J~=E(1.-S~:1)~AE1H=JC~Et~~Eir
Job creation and destruction rates used belowdivide creation and destruction levels by totalemployment in the sector’s N industries:
JC1JC1i~=
E c~~1JDR, = JDr
In several different years, the standard indus-trial classification (SIC) used by BLS to allocateemployment among industries is revised. Ingeneral, the revision results in a finer breakdownof industries already included, but sometimesit adds coverage of entirely new industries. Aspreviously mentioned, the job creation anddestruction series are constructed so that thebreadth of industrial coverage does not changefrom the first period to the last. A lIner breakdownwithin a larger industry is exploited, however,by using an adjustment at the “birth” of a new(three- or four-digit) industry that accounts forthe fact that the start of data on the industry doesnot indicate job creation, but reclassification.Since new three- and four-digit industries aregenerally created to subdivide growing industries,this procedure tends to limit the extent to whichjob creation and destruction net out withinindustries.2
This paper presents data on three sectors: (1)goods production, which includes manufactur-ing, construction and mining; (2) wholesale and
FEDERAL RESERVE SANK OF ST. LOUIS
5
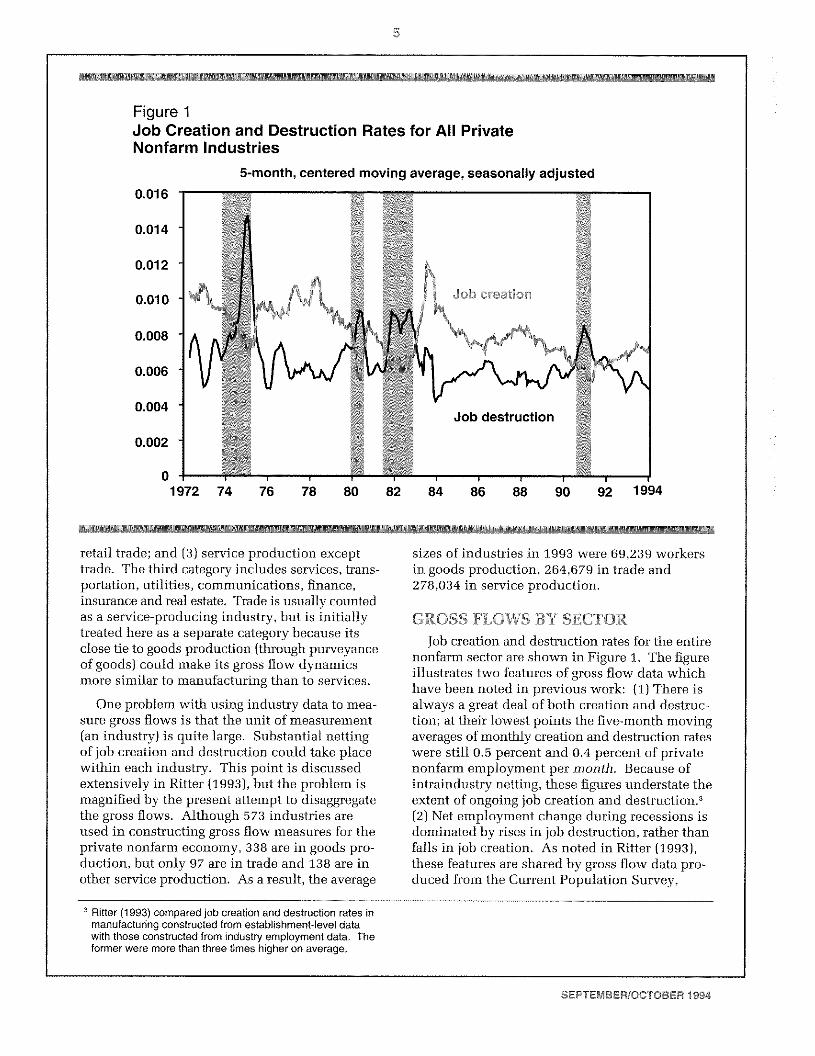
Figure 1Job Creation and Destruction Rates for All PrivateNonfarm Industries
‘44
5-month, centered moving average, seasonally adjusted
retail trade; and (3) service production excepttrade. The third category includes services, trans-portation, utilities, communications, finance,insurance and real estate. Trade is usually countedas a service-producing industry, but is initiallytreated here as a separate category because itsclose tie to goods production (through purveyanceof goods) could make its gross flow dynamicsmore similar to manufacturing than to services.
One problem with using industry data to mea-sure gross flows is that the unit of measurement(an industry) is quite large. Substantial nettingof job creation and destruction could take placewithin each industry. This point is discussedextensively in Ritter (1993), but the problem ismagnified by the present attempt to disaggregatethe gross flows. Although 573 industries areused in constructing gross flow measures for theprivate nonfarm economy, 338 are in goods pro-duction, but only 97 are in trade and 138 are inother service production. As a result, the average
69,239 workerstrade and
sizes of industries in 1993 werein goods production, 264,679 in278,034 in service production.
GROSS FLOWS BY SECTOR
Job creation and destruction rates for the entirenonfarm sector are shown in Figure 1. The figureillustrates two features of gross flow data whichhave been noted in previous work: (1) There isalways a great deal of both creation and destruc-tion; at thei.r lowest points the five-month movingaverages of monthly creation and destruction rateswere still 0.5 percent and 0.4 percent of privatenonfarm employment per month. Because ofintraindustry netting, these figures understate theextent of ongoing job creation and destruction.2(2) Net employment change during recessions isdominated by rises in job destruction, rather thanfalls in job creation. As noted in Ritter (1993),these features are shared by gross flow data pro-duced from the Current Population Survey,
2 Rifler (1993) compared job creation and destruction rates inmanufacturing constructed from establishment-level datawith those constructed from industry employment data. Theformer were more than three times higher on average.
0.016
0.014
0.012
0.010
0.008
0.006
0.004
0.002
01972 74 76 18 80 82 84 86 88 90 92 1994
SEPTEMSER/OCTOSER 1994

D
Figure 2Job Creation and Destruction Rates in Goods Production
5-month, centered moving average, seasonally adjusted0M25
0.020
0.015
0.010
0.005
Figure 3Job Creation and Destruction Rates in Ttade
5-month, centered moving average, seasonally adjusted0.014-
0.012
0.010
0.008 -
0.006
0.004 -
0.002 -
~1
0-1972 74
01972 74 76 78 80 82 84 86 88 90 92 1994
76 78 80 82 84 86 88 90 92 1994
FEDERAL RESERVE SANK OF ST. LOUIS

Figure 4Job Creation and Destruction Rates in Service Production*
0
5-month, centered moving average, seasonally adjusted
* Excluding trade
** Spikes in creation and destruction duringthe telephone communications industry.
which tracks individuals, and by gross flow dataproduced by Davis and Haltiwanger (1990, 1992)from the Census of Manufactures, which tracksemployment at single establishments.
Figures 2, 3 and 4 show job creation anddestruction rates for the goods-producing, tradeand service-producing sectors.4 Three pointsabout these charts stand out. First, the gapbetween creation and destruction for the tradeand service-producing sectors during the 1980sindicates the well-known fact that these sectorsproduced substantial net employment gains duringthe decade. In fact, in the service-producingsector, job creation exceeded job destructionduring all but a few months since 1972. Tradeexperienced more frequent employment declines,but even during recessions these drops were not
particularly large or prolonged. By contrast, fol-lowing the recovery from the 1982 recession, jobcreation and destruction were closely balancedin the goods-producing sector until the onset ofthe 1990 recession.
Second, goods production shows a sharpasymmetry between creation and destructionduring recessions; destruction is considerablymore volatile. Neither trade nor service produc-tion shows evidence of this asymmetry, however.
Finally, despite trade’s close link with goodsproduction, gross flows in the trade sector donot exhibit patterns that closely resemble thosein goods production.
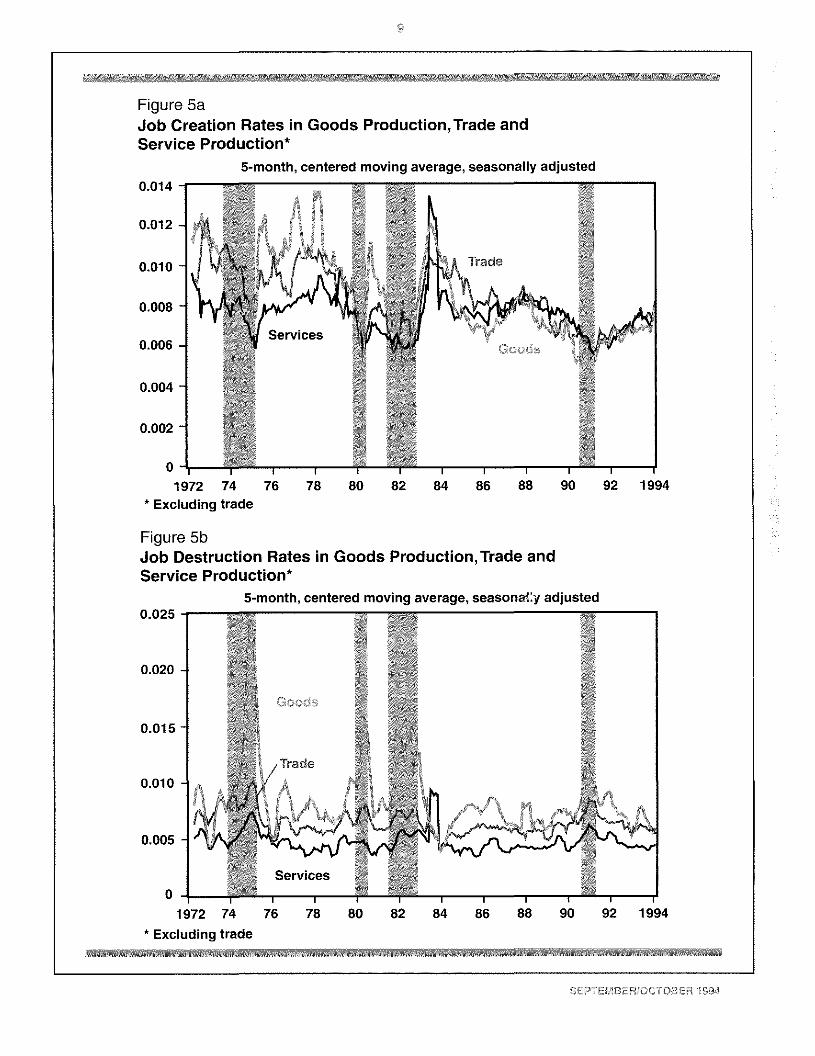
Job creation and destruction rates for differentsectors are compared directly in Figure 5, which
“The large spikes in destruction and creation during 1983 inFigure 4 reflect the beginning and end, respectively, of alarge strike in the telephone communications industry (SIC4813). A comparison of BLS data on new work stoppages(which starts in 1981) and the job destruction series shownin Figure 1 reveals that a few small spikes in job destruction
during the 1980s correspond to relatively large strikes, butthe telephone communications strike is the only one that hasa noticeable impact on the series.
0.014
0.012
0.010
0.008
0.006
0.004
0,002
1972
1983 are caused by a large strike inSee footnote 4.
SEPTEMSER/OCTOSER 1994

S
isolates a striking fact: Both creation and destruc-tion rates are far more volatile in goods-producingindustries than in trade or other service-producingindustries. Goods production thus contributesdisproportionately to fluctuation in aggregategross flows, particularly job destruction,
Figure 5 does not tell the whole story about therelative importance of gross flows in goods pro-duction because this sector made up 25 percentof private nonfarm employment in 1993 (downfrom 39 percent in 1972). Figure 6 displays thecontributions of goods-producing and service-producing (now including trade) industries tototal job creation and destruction levels.
Figure 6 appears to show that goods productioncontributes a disproportionate share of overall jobcreation and destruction levels. This is probablymisleading, however. The manufacturing sectoris more finely divided, so there is probably lessintraindustry netting of job creation and destruc-tion in the goods-producing sector than in theservice-producing sector. This would impart asubstantial upward bias to the relative contribu-tion of goods production to the level of overalljob creation and destruction.
The relative contributions of goods- and ser-vice-producing industries to cyclical changesin overall job creation arid destruction are shownmore reliably in Figure 6. Goods production hastypically accounted for more of the cyclical move-ments than the industries that make up the other75 percent of employment. This is particularlyevident in the lower panel of Figure 6, whichshows much more dramatic cyclical swingsin total job destruction than in service produc-tion alone.
Two pieces of evidence suggest that intrain-dustry netting does not substantially bias thecontribution of goods-producing industries tochanges in job creation and destruction. First, iffour-digit industries are ignored in constructingthe job creation and destruction series (thusincreasing the average size of industries used inthe calculation and the extent of intraindustrynetting), both series shifi down, but the ampli-tude of fluctuations is not significantly changed.’Second, in manufacturing, if job creation anddestruction series created from industry employ-
ment data are conipared to those created fromestablishment data by Davis and Haltiwanger, thesize of fluctuations is again very similar, thoughthe levels of the series differ dramatically (seeRitter, 1993).
‘FF53 GHANGFNG ROLE OF’~ V
Figure 2 reveals that gross flows in the goods-producing sector were less volatile during the1990 recession than during previous recessions.This warrants closer attention to manufacturing,which makes up more than three-quarters ofgoods-producing employment. Figure 7 showsthat the phenomenon is even more pronouncedin manufacturing. When the gross flow data formanufacturing are extended back to 1947 (which,unfortunately, cannot be done reliably for non-manufacturing industries), all previous recessionsshow much more dramatic swings in job creationand destruction than 1990. If manufacturing issplit into durables and nondurables, both showpatterns very similar to Figure 7. Gross flowsfor mining and construction (the remainder ofthe goods-producing sector) did not seem tofollow the same pattern as manufacturing duringthe 1990 recession. The very low levels of jobcreation and destruction during the 1990 reces-sion are, therefore, clearly due to developmentsin the manufacturing sector.
As measured by drops in either industrialproduction or manufacturing employment, the1990 recession was mild. Manufacturing employ-ment, however, declined almost continuouslyfrom the beginning of 1989 until late 1993. Itappears that, rather than the usual sharp cyclicalresponse, manufacturing firms have experienceda longer-term contraction over these five years.Though it is clear that something different hap-pened during the 1990 recession, it is impossibletoknow whether the old pattern of sharp increasesin job destruction will reassert itself in futuredownturns. If the fluctuations of gross flows inmanufacturing remain subdued during futurerecessions, the movement of overall gross flowswill be significantly damped. The decliningshare of employment found in manufacturingreinforces this effect by lowering the weightattached to the most volatile sector.
Regressing job creation constructed without four-digit indus-tries on job creation constructed with four-digit industries (orvice versa) produces a coefficient very close tO 1 .0 and anR2 greater than 0.99. The same is true of the job destructionseries.
FEDERAL RESERVE SANK OF ST. LOUIS
0
Figure 5aJob Creation Rates in Goods Production,Trade andService Production*
5-month, centered moving average, seasonally adjusted0.014 -
II
0.012 - 144 1~Tki
1~!0.010
0.008 -
0.006 -
0.004
0.002
01972 74
* Excluding trade
Figure 5bJob Destruction Rates in Goods Production, Trade andService Production*
5-month, centered moving average, seasonaCy adjusted0.025 -
0.020 -
0.015-
0.010
1972 74* Excluding trade
0.005
SEPTEMSER/OCTDSER 1994

10
Figure BaJob Creation in Goods Production and Service Production
Thousands 5-month, centered moving average, seasonally adjusted900 -
800 -
700 -
600 -
500
400
300
200
100 -
0
800
700
600
500
400
300
200
100
0-•,1972 74
Figure 6bJob Destruction in Goods Production and Service ProductionThousands 5-month, centered moving average, seasonally adjusted900-
.tt
I I I I I I I
76 78 80 82 84 86 88 90 92 1994
FEDERAL RESERVE SANK OF ST. LOUIS

‘4
Figure 7Job Creation and Destruction Rates in Manufacturing
5-month, centered moving average, seasonally adjusted
CONCLUSIONS
Job creation and destruction behave muchdifferently in the goods-producing sector than inthe rest of the economy. Job creation and destruc-tion have historically been much more volatilein manufacturing and other goods-producingindustries, so that they have contributed dispro-portionately to fluctuations in overall job creationand destruction. Further, there does not appearto be a cyclical asymmetry between creation anddestruction outside of manufacturing. The stylizedfact, cited by several authors (Blanchard andDiamond, 1990; Davis and Flaltiwanger, 1990,1992; Ritter, 1993), that job destruction tends todominate employment changes during recessionsthus appears to be generated by manufacturingindustries. In addition, job creation and destruc-tion in manufacturing were noticeably dampedduring the most recent recession. Combinedwith the fact that goods production makes up adeclining share of employment, this suggests
that the dynamics of job creation arid destructionmay be substantially different in the future.
R.I5.F~ERENCESAnderson, Patricia M., and Bruce D. Meyer. “The Extent and
Consequences of Job Turnover,” Brookings Papers onEconomic Activity (Micro000nomics 1994).
Blanchard, Olivier Jean, and Peter Diamond. “The CyclicalBehavior of the Gross Flows of U.S. Workers,” BrookingsPapers on Economic Activity (1990, No, 2), pp. 85-155.
Davis, Steven J., and John Haltiwanger. “Gross Job Creation,Gross Job Destruction, and Employment Reallocation,”Quarterly Journal of Economics (August 1992), pp. 819-63.
and . “Gross Job Creation and Destruction:Microeconomic Evidence and Macroeconomic Implications,”NBER Macroeconomics Annual (1990), pp. 128-86.
Mortensen, Dale, and Christopher Pissarides. “Job Creationand Job Destruction in the Theory of Unemployment,” TheReview of Economic Studies (July 1994), pp. 397-416.
Rifler, Joseph A. “Measuring Labor Market Dynamics:Gross Flows of Workers and Jobs,” this Review(NovemberlDecember 1993), pp. 39-57.
0.025
0.020
0.015
0.010
0.005
01972 74 76 78 80 82 84 86 88 90 92 1994
SEPTEMBER/OCTOBER 1994