Embed Size (px)
Citation preview

Track 11 UndergraduateInteractive session
The Patterns of Capital Flows within BRICS:FDI and Impacts on GDP
Abstract________________________________________________________________________
The purpose of this paper is to examine foreign direct investments (FDI) and the affects on GDP within the countries of the BRICS. This study examines the time frame from 2005-2011 with an emphasis on the affects of the financial crisis on the BRICS GDP due to FDI flows. This paper is divided into five sections. First, the introduction briefly explaining the theory of capital flow and FDI as well as a global look at FDI inflows to developing economies. Second, a description of the BRICS and potential growth within these countries. Third, a capital flow overview in terms of inward and outward FDI based on data from UNCTAD. Fourth, the general effects of FDI on GDP of the BRICS as a whole. Finally, an individual country analysis and the direct affects of FDI on each country’s GDP.
Key Terms: Foreign Direct Investment (FDI), Quantitative Easing (QE), BRICS, Capital Flow, Gross Domestic Product (GDP)

I. Introduction
In past years many have witnessed a dramatic change in the global financial system through the movement of capital from developed countries to developing countries for the seek of higher returns and better yields. It is important to note in recent years, many emerging economies have reduced many sorts of regulations on their own financial industries and have adopted the theory of financial liberalization (Munhoz). Emerging economies have acquired measures of financial liberalization, to provide simplicity to drive up foreign direct investments and overall capital flow. Therefore, creating a more globalized link between emerging economies and the overall world to fuel domestic growth and wealth within their developing economies. Foreign direct investments play an important role in the development of emerging economies. In conjunction with providing capital inflows, FDI can be a tool for obtaining foreign technology, managerial skills, as well as integration and production networks (UNCTAD, 2003).
Within this study we are interested in the analysis of foreign direct investment to emerging economies, specifically four economies who are regarded as some of the fastest growing economies: Brazil, Russia, India, and China, known as the BRICS, a term adopted by chief economist Jim O’ Neil in a Goldman Sachs report entitled Building Better Global Economics BRICS in 2001. Therefore by definition, a foreign direct investment is a direct investment made by an individual or company from one country into another by either buying a company or expanding the existing business in that country. According to the Department of Commerce in the United Sates, a foreign direct investment is defined at 10%, that is any foreign investor must own at least 10 percent of
2

voting stock or ordinary shares of the invested company. As stated earlier, FDI imposes many benefits to emerging economies in regards to growth, obtaining skills and business expansions. Due to such great importance of FDI on emerging markets, it should be clearly understood in regards to overall economic health on the emerging market. In this case, as noted earlier, the emphasis of this analysis will be in regards to the BRICS due to the potential future they hold in terms of growth and global financial impacts.
In regards to global foreign direct investments, according to The Global investment Trends Monitor by UNCTAD global foreign direct investments (FDI) inflows to developing economies reached a new high of US$759 billion, accounting for 52% of global FDI inflows in 2013. As well, figure 1 shows the percentage share of FDI inflows to selected regional and inter-regional groups with an average pre-crisis from 2005-2007 and years through 2008-2013.
(Insert Figure 1)
In relation to this report we will be studying specifically the FDI investments and affects on GDP within the BRICS pre and post United States financial crisis and the effects of US monetary policy. It is seen on average the BRICS accounted for nearly $158 billion of the world’s FDI flows from 2005-2007, accounting for 11 percent of the worlds FDI flows.
It is important to note that the following data and information within this report to examine capital flow in regards to FDI pre, post, and during financial crisis is based off information obtained from the United Nations Conference on Trade and Development (UNCTAD), the Federal Reserve of St Louis, The BRICS Report published by Oxford University Press, Goldman Sachs Economic Reports and the World Bank as well as other third party sources that are citied within.
II. The BRICS
3

The BRICS (Brazil, Russia, India and China), as stated earlier is a term popularized by economist Jim O’ Neill in 2001, in a Goldman Sachs report entitled Building Better Global Economics BRICS to contemplate the four largest emerging economies in the world, which are Brazil, Russia, India, and China. Then in 2003 a second report was published by Goldman Sachs stating that these four economies can in terms of US dollars, be larger than G6 (US, Japan, UK, Germany, France, and Italy) in nearly 40 years (Global Economics Paper No: 99). The BRICS economies have been noticed and recognized as some of the fastest growing economies by showing opportunities and resources to help their way of approaching total economic size of the G7’s by providing a more stabilized economy than other emerging economies. Together, the BRICS account for nearly 25% of the world’s GDP and is expected to grow within upcoming years. According to Wilson and Purushothaman, authors of Dreaming with BRICS: the Path to 2050 a key factor to such growth is the ability of the BRICS to maintain policies and the development of institutions that are supportive of growth. Therefore, if the BRICS are able to sustain an economy for growth by continuing to provide a location where there is a low starting point of development, unutilized workforce, cheap labor, low cost structures, commodity wealth, and favorable for savings it is predicted they will become four of the world’s largest economies.
(Insert Figure 2)
It is important to note that each of the BRICS countries provide their own important attribute in terms of development. China, which is the third largest country in size, is known as the manufacturing work-shop of the world by having a high skilled work force and low wages. Brazil, the fifth largest country in world is extremely rich in resources such as coffee, soybeans, sugar cane, iron ore, and crude oil as well as containing nearly 60 million acres of farmable land, and Russia who has accounted for nearly 20 per cent of the worlds oil and gas reserves.
In 2001, Jim O’ Neill stated within his Global Economics Paper that within the next ten years, the weight of the BRICS and especially China in world GDP will grow raising important issues about global economics and fiscal and monetary policies in the BRICS. Ten years later, in 2011 Jim O’ Neill then stated the following “my only regret on the first BRIC analysis of 2001 is that we weren’t bolder.” Since 2001 and 2010, the BRIC economies’ in terms of GDP increased much more rapidly than he had thought was even possible, and more so the citizens’ wealth showed equally remarkable increases bringing hundreds of millions of people out of poverty. Jim O’ Neill stated that Brazil has become the worlds’ 7th largest economy, surpassing Italy, China’s consumer market grew by $1.5 trillion since 2001, and Intra-trade within the BRICS has grown much faster than ever expected. As well as the leaders of BRICS talking more openly about continuing to do business with the US. It is clearly seen that the pace of growth within the four developing nations are easily on the path of surpassing many developed economies before 2050, and thus may even become the largest economies of the world in the upcoming decades.
III. Capital Flow Overview
4

According to the Oxford BRICS report there has been a noticeable increase in the amount of capital flow to the BRICS economies, therefore becoming a predominant recipient of FDI during the past decades. However as stated within a study performed by Vijayakumar, Sridharan, and Rao in 2010 published in the International Journal of Business Science and Applied Science there are many factors that determine FDI inflows into the BRICS countries that must be looked at to fully understand the reasoning behind such an influx of capital flows in recent years. Within the study there were seven potential factors that influence the FDI flows into the BRICS; Market Size, Economic Stability and Growth prospects, Labor cost, Infrastructure Facilities, Trade openness, Currency valuation, and Gross capital Formation. However a major factor that also must be looked at is the search for higher yield. In figure 3, it is seen that the percentage increase of capital flow within the BRICS starting from 2008 has significantly increased year after year. In relation to the time period, the US financial crisis created low yields within the United States, which encourage the shift of capital to location where higher yields were achievable.
(Insert figure 3)
Inward FDI Patterns
The BRICS have successfully contributed to an important part of global financial development, in regards to foreign direct investments (FDI). The BRICS are receiving much of the inflow in terms of emerging markets due to the potential for great economic growth in the upcoming years. A special addition of the Global Investment Trend Monitor by UNCTAD said that over the past decade FDI inflows have more than tripled to an estimated $263 billion in 2012, and for the first time ever FDI flows to developing economies exceeded that of developed countries. The biggest jump in FDI occurred between 2003 and 2008, which grew from $77 billion to $281 billion, with China and the Russian Federation being the larger stakeholders (UNCTAD). The BRICS continue to be a location for FDI reaching a total of 20% of the world total FDI. Almost half of (46%) of the FDI flows to China, (25%) to Brazil, (17%) to Russia and (10%) to India (UNCTAD).
(Insert Figure 4)
Key Inward Features:
From 2003 to 2008 there has been a steady increase in FDI into the BRICS FDI inflow into the BRICS was affected by the global financial crisis as other
economies, losing 30% of FDI China remained the largest recipient of FDI inflows among all the years starting
from 1998 and continuing
Outward FDI Patterns
5

The BRICS FDI outflow has also significantly increased between 2005-2009. FDI outflows have risen from $31 billion in 2005 to $93 billion in 2006 (UNCTAD, 2013). Figure 5 shows the increase of outward FDI and the jump from 2005 to 2006 and the stable outflow from then on. Observing data from the Federal Reserve of St. Louis, since 2005, the GDP for each of these economies has substantially increased in terms of US dollars from millions to billions. It is also important to take note that FDI outflow started after that of the increase in FDI inflow into the BRICS, ultimately relating FDI outflow to an increase of citizen’s wealth.
(Insert Figure 5)
Key Outward Features: The largest change of FDI outflow occurred between 2005 and 2006 FDI outflow seemed to increase to a new high in 2008, during the financial crisis BRICS are becoming a major player of FDI within other countries due to a
possible increase in wealth within their economies
IV. BRICS FDI and Affects on GDP
The aim of this section is to show the overall relationship of FDI and the affects on GDP within the BRICS as a whole in three time frames: pre financial crisis (2005-2007), during the financial crisis (2008-2009), and post financial crisis (2010-2011). The hypothesis of this section is that FDI should be directly related to the growth and health of the BRICS and as FDI increases so does the GDP and vise versa.
By examining FDI to the BRICS, it is clearly seen that the health of each one of these economies in terms of GDP is largely affected by the quantity of foreign Direct Investments. Figure 6 shows the amount in US Dollars of FDI in each of the BRICS economies and the percentage change from the following year, as well as the GDP of each of these economies in US dollars. It is clearly seen as FDI investments increase in each of these countries so does the GDP of the country. As well, when FDI decreased in each of these countries GDP either then decreased or grew at a rate lower than previous years, which is easily noticed in year 2009.
6

(Insert Figure 6)
First, pre financial crisis the BRICS on average received nearly $157 billion of FDI inflows showing a positive increase from year to year in terms of GDP in correlation with the increase of FDI inflows, for the years of 2005-2007 in all of the BRICS economies.
Second, during the US financial crisis years 2008-2009, the BRICS on average saw an inflow of $575 billion but witnessed only a 35 percent total average GDP increase year to year due to the large decrease of FDI in year 2009, in which every country, Brazil, Russia, India and China, saw from year 2007 to 2009 unlike the steady increase of FDI from year to year in 2005 to 2007. What this is showing is the relationship of growth between FDI and GDP within the BRICS economies and the impact of a reduction of FDI within the economies, as well as the importance of health of the US economy in relationship to FDI to each of the countries.
Third, post-financial crisis, years 2010 to 2011, FDI within the BRICS averaged nearly $811 billion. The cause of such a large increase from the average of 2008 to 2009 can be related to many affects of quantitative easing, a tool the Federal Reserve of The United States has implemented after reducing the federal-funds rate to nearly zero percent. Therefore much of the “cheap money” individuals and institutions received saw its way into the BRICS in terms such as, showing a persistent increase of FDI from year 2009 to 2011, relating in a positive average difference of 51.72% GDP increase year to year, compared to the years of the financial crisis (2008-2009).
V. Individual Country Analysis of FDI and GDP
Brazil
Brazil is an important factor in the structure of the BRICS from its economy becoming a major exporter due to agriculture development. Brazil has a very mature economy, which relates to a slow growth rate but also has a higher GDP per capita than China and India combined (Pereira, 2013). Due to Brazil having a mature economy, it is less susceptible to external shocks in the global economy than that of other emerging economies. From 2001-2012 Brazil ranked 53rd on the World Economic Forum’s Global Competitiveness index which makes Brazil the most attractive out of all the BRICS countries for foreign investors to try and penetrate Brazil’s market (Saran; Sharan, 2013).
To understand the role that Brazil plays in the BRICS, we have to take a deeper look into Brazil’s economy and how FDI directly affects its GDP. During the pre financial crisis years, 2005-2007, Brazil had an average increase of 46.6% in FDI’s and an average growth rate of 27.6% in their GDP. When the financial crisis hit from 2008-2009, there was a decrease of 24% in FDI’s, which slowed the growth rate of their GDP to 18% over those two years. Post-financial crisis, 2010-2011, the inflow of FDI’s increased on average of 51.5% and had a positive effect on the GDP by increasing on average of 24% from 2009 to 2011, in terms of US dollars.
7

As you can see by figure 7, the inflow of FDI’s directly affects Brazil’s GDP. When Brazil had an increase of FDI, there was also a positive increase in its GDP. When Brazil had a decrease of FDI Brazil GDP witnessed a 2% decrease from year 2008 to 2009. What this shows is the direct affect of GDP growth in relation to FDI to fuel its economies health.
(Insert Figure 7)
Russia
Russia has played a very big role in the creation of the BRICS. Along with the help of China, Russia has helped expand RIC (Russia, India and China) into BRICS (Stuenkel, 2013). But unlike the other countries in the BRICS, Russia is not the stereotypical emerging country. Russia was once looked at as a super power during the Cold War and has recently applied for an OECD (Organization for Economic Co-Operation and Development) membership (Stuenkel, 2013). If Russia is to be accepted into OECD it would diminish its credibility with the BRICS.
Taking a look at the financial perspective of how Russia fits into the BRICS, let’s take a look at their economy and the relationships of the inflow of FDI and how it affects their GDP. During the pre-financial crisis years, 2005-2007, Russia was showed a 95.5% average increase of FDI, while posting an increase of 30% GDP from 2004-2007. When the crisis hit in 2008-2009 the inflow of FDI decreased by 51% which negatively affected its GDP by having a 27% decrease from 2008 to 2009. After the financial crisis hit, Russia had an 18% increase of FDI which helped increase its GDP by 25%.
By looking at Figure 8 below, you can notice the flow of FDI’s into Russia directly affects its GDP. During the pre and post financial crisis periods when Russia was seeing an increased rate of inflowing FDI’s, it directly affected its GDP in a positive way. When the financial crisis hit and Russia had a decrease of inflowing FDI’s, it negatively affected its GDP.
(Insert Figure 8)
India
8

At first look India may not be the most attractive market for foreign investors to invest in. But in reality, India has good investment opportunities that exist in niche areas. India has fully embraced the wireless Internet revolution, which has helped fuel e-commerce and mobile banking. E-commerce currently constitutes 0.25 percent of India’s overall retail industry and is showing good signs of growth (Advani, 2014). Mobile banking is showing huge growth and will most likely replace credit and debit cards (Advani, 2014).
Another market that investors should look at is health care. Investors can have the opportunity to invest in the following areas: hospital growth, doctor and nurse training, medical record keeping and all supplementary businesses that support health care (Advani, 2014). India has also become a serious global player in pharmaceuticals and controls a major part of the world market in genetics (Advani, 2014).
To understand the importance of foreign direct investments on developing countries economies such as India’s, it is essential to look at the relation between the FDI and GDP on India’s economy. In the pre financial crisis period, India had a 337% increase in inflowing FDI which helped increase its GDP by 72%. During the financial crisis, India showed a decrease of 18% in FDI from year 2008 to 2009 and an increase of 14% in its GDP. In the two years after the financial crisis, India continued to show a decrease in FDI by 23% in 2010 but then a large increase of 33% from 2010 to 2011 of $9,101,769,564.08.
India is the only country in the BRICS to show a positive increase in both FDI and GDP over all three-time periods. By looking at figure 9 below, you are able to see how India is recovering steadily from its sharp decline of FDI in 2009 and its potential for continued growth in terms of GDP. Even during 2010 when India showed a decrease of 23% of inflow from the previous year, India’s GDP still increased.
(Insert Figure 9)
China
China is a major contributor when it comes to the BRICS. China is ranked third behind the United States and Japan in the value of domestic assets. Bank loans in China have increased by over $5 trillion since 2007 (Dobbs; Leung; Lund, 2013). China has also showed an increase in the corporate-bond market with room for growth. This attracts many foreign companies that want to get a piece of China’s increasing foreign market. But in order for China to receive more FDI from companies, it has to stop being a closed economy and slowly start opening up pathways for companies to gain access into their economy.
9

To further understand why investors want to start investing in China, take a look at the relationship of the inflow of FDI’s in relationship to its GDP must be looked at. Pre financial crisis years, China showed a 152% increase of FDI and its GDP grew 81% from 2004. During the financial crisis years, China showed a decrease of FDI but showed an increase of 43% in its GDP. Over the two years after the financial crisis, FDI in China increased 114% and its GDP increased by 46%. Figure 10 below shows both the steady increase of GDP for each starting from 2004 as well as the increase in FDI for every year except 2009.
(Insert Figure 10)
Recently there has been skepticism that most of the money flowing into China is “hot money.” “Hot money” can consist of any form of capital ranging from their normal capital flow of FDI, money coming in on the books and under the table (The Economist, 2014). The reason for this is so that exporters can hike up prices so they can evade China’s strict currency controls and bring back hidden money that the government does not know about. This recently started happening when the Federal Reserve began to buy up government bonds.
VI. Conclusion
Through the reduction and removal of much regulation within the financial markets, and by the adoption of financial liberalization, the BRICS have seen large amounts of capital within the markets in the past few years. By observing the time frames of pre financial crisis (2005-2007), during the financial crisis (2008-2009), and post financial crisis (2010-2011), it is seen that FDI has a tremendous impact on the growth of each of the economies. Based on the analysis of finding the correlation between FDI and GDP we have witnessed in all cases when the quantity of FDI decrease within one of the BRICS economies, so does the GDP. What we concluded from this was the direct health of each country’s economies in terms of GDP, is largely based off the health of the entire world. This was clearly seen by examining the years of the global financial crisis and the years pre and post financial crisis. As stated earlier, FDI imposes many benefits to emerging economies in regards to economic growth; therefore it is important to correlate the affects of capital flow especially in terms of FDI to that of the economies health measured in GDP.
10

References
"2013 Investment Climate Statement - Brazil." U.S. Department of State. U.S. Department of State, n.d. Web. Retrieved from <http://www.state.gov/e/eb/rls/othr/ics/2013/204608.htm>.
The BRICS Report: A Study of Brazil, Russia, India, China, and South Africa with Special Focus on Synergies and Complementarities. New Delhi: Oxford UP, 2012. Print.
"Developed Economies Are Global FDI Rose by 11%; Trapped in a Historically Low Share." Global Investment Trends Monitor (2014): n. pag. UNCTAD. Web.
Dobbs, Richard, Nick Leung, and Susan Lund. (July 2013). "China's Rising Stature in Global Finance." McKinsey & Company. N.p., n.d. Web.
Durden, Tyler. (3 Mar. 2014). "Russian Stocks Crash As Central Bank Scrambles, Hikes Rates Most Since 1998 Default." Zero Hedge. N.p. Web.
Foreign Direct Investment and Performance Requirements: New Evidence from Selected Countries. New York: United Nations, 2003. Print.
"Hot and Hidden." The Economist. The Economist Newspaper, 18 Jan. 2014. Web. Retrieved from <http://www.economist.com/news/finance-and-economics/21594345-despite-strict-currency-controls-money-finding-its-way-china-hot-and>
11

"India Fighting Worst Crisis Since '91 Limits Capital Flows (3)." Bloomberg Business Week. Bloomberg, n.d. Web. Retrieved from <http://www.bloomberg.com/news/2014-01-13/india-rupee-bonds-rally-as-fed-taper-concern-eases-on-u-s-data.html>
Munhoz, Vanessa da Costa Val, Vanessa de Paula Pereira, and Larissa Naves de Deus. "Dynamics of Financial Flows in BRICS Countries: An Analysis of the Period 2000-2010."
O’ Neill, Jim. (30 Nov. 2001). "Building Better Global Economic BRICS." GS Global Economics Website. N.p. Web.
O’ Neill, Jim, Dominic Wilson, Roopa Purushothaman, and Anna Stupnytska. (1 Dec. 2005). "How Solid Are the BRICS?" GS GLOBAL ECONOMIC WEBSITE. N.p. Web.
Pereira, Anthony. (11 June 2013). "Does Brazil Deserve Its 'B' for BRIC?" CNN. Cable News Network. Web. Retrieved from <http://edition.cnn.com/2013/06/03/business/opinion-pereira-brazil-bric-economies/>
"The Rise of BRICS FDI and Africa." Global Investment Trends Monitor (n.d.): 1-10. UNCTAD. Web.
Roberts, James M., and Ryan Olyson. "Time for Brazil to Reject Capital Controls and End Failing Statist Policies."
"Russia Is No. 3 in Attracting Foreign Direct Investment | Business." The Moscow Times. N.p., n.d. Web.
Summers, Lawrence H. 2000. "International Financial Crises: Causes, Prevention, and Cures." American Economic Review 90.2: 1-16. Print
Vijayakumar, Narayanamurthy, Perumal Sridharan, and Kode Rao. (2010). "Determinants of FDI in BRICS Countries: A Panel Analysis." Int. Journal of Business Science and Applied Management 5.3: 1-13. Web.
Wilson, Dominic, and Roopa Purushothaman. (1 Oct. 2003). "Dreaming With BRICS: The Path to 2050." GS Global Economics Website. N.p. Web.
12

Figure 1: FDI Inflow (Billions of US Dollars)
Source: UNCTAD Global Investment Trends Monitor (2014)
13

Figure 2: Largest Economies in 2050
Source: Goldman Sachs, Global Economics Paper No: 134
14

Figure 3:(per cent)
1990 1995 2000 2005 2008 2009 2010
BRICS 2.2 13.8 5.8 11.7 16 16.7 17.8Brazil 0.5 1.3 2.3 1.5 2.6 2.2 3.9Russia - 0.6 0.2 1.3 4.3 3.1 3.3India 0.1 0.6 0.3 0.8 2.4 3 2China 1.7 11 2.9 7.4 6.2 8 8.5South Africa
0 0.4 0.1 0.7 0.5 0.5 0.1
Source: Oxford BRICS ReportNote: Stated data was received from UNCTAD
15
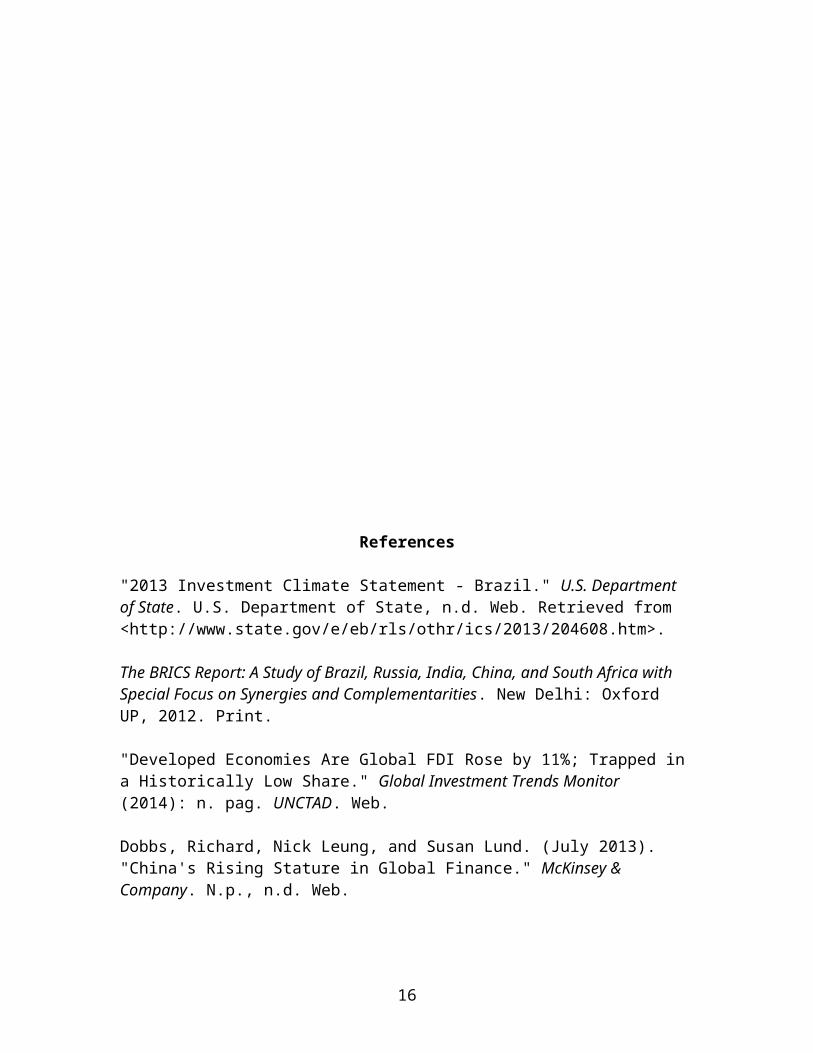
Figure 4: FDI inflows and their share in Global FDI Inflow1998-2012
Source: UNCTAD, FDI/TNC database (Global Investment Trends Monitor, 25 March, 2013)
16

: FDI outflows and their share in Global FDI outflows1998-2012
Source: UNCTAD, FDI/TNC database (Global Investment Trends Monitor, 25 March, 2013)
Figure 6: BRICS FDI and GDP, 2004-2011
17

2004 2005 2006 2007 2008 2009 2010 2011Brazil FDI
18,165,693,855.28
15,459,981,604.12
19,378,093,068.00
44,579,492,464.00
50,716,402,711.00
31,480,932,200.00
53,344,632,547.00
71,538,657,409.37
Percent Change
-15% 25% 130% 14% -38% 69% 34%
GDP 664,000,000,000
882,000,000,000
1,090,000,000,000
1,370,000,000,000
1,650,000,000,000
1,620,000,000,000
2,140,000,000,000
2,480,000,000,000
Percent Change
33% 24% 26% 20% -2% 32% 16%
Russian Federation FDI
15,444,370,800.00
15,508,100,000.00
37,594,700,000.00
55,873,700,000.00
74,782,900,000.00
36,583,100,000.00
43,167,700,000.00
55,083,600,000.00
Percent Change
0% 142% 49% 34% -51% 18% 28%
GDP 591,000,000,000
764,000,000,000
990,000,000,000
1,300,000,000,000
1,660,000,000,000
1,220,000,000,000
1,520,000,000,000
1,900,000,000,000
Percent Change
29% 30% 31% 28% -27% 25% 25%
India FDI 5,771,297,152.82
7,269,407,225.61
20,029,119,267.00
25,227,740,887.00
43,406,277,075.81
35,581,372,930.00
27,396,885,033.78
36,498,654,597.86
Percent Change
26% 176% 26% 72% -18% -23% 33%
GDP 722,000,000,000
834,000,000,000
949,000,000,000
1,240,000,000,000
1,220,000,000,000
1,370,000,000,000
1,710,000,000,000
1,870,000,000,000
Percent Change
16% 14% 31% -2% 12% 25% 9%
China FDI
62,108,043,001.00
104,108,693,867.00
124,082,035,619.00
156,249,335,203.00
171,534,650,312.00
131,057,052,870.00
243,703,434,558.00
280,072,219,150.00
Percent Change
68% 19% 26% 10% -24% 86% 15%
GDP 1,930,000,000,000
2,260,000,000,000
2,710,000,000,000
3,490,000,000,000
4,520,000,000,000
4,990,000,000,000
5,950,000,000,000
7,310,000,000,000
Percent Change
17% 20% 29% 30% 10% 19% 23%
Source: Data obtained from Word Bank and Federal Reserve of St. Louis
Figure 7: Brazil FDI and GDP Relationship
18

2005 2006 2007 2008 2009 2010 2011Brazil FDI
15,459,981,604.1
2
19,378,093,068.0
0
44,579,492,464.0
0
50,716,402,711.0
0
31,480,932,200.00
53,344,632,547.00
71,538,657,409.3
7Percent Change
-15% 25% 130% 14% -38% 69% 34%
GDP 882,000,000,000
1,090,000,000,00
0
1,370,000,000,00
0
1,650,000,000,00
0
1,620,000,000,000
2,140,000,000,000
2,480,000,000,00
0Percent Change
33% 24% 26% 20% -2% 32% 16%
Source: Data Obtained from the World Bank and The Federal Reserve of St. Louis
19

Figure 8: Russia FDI and GDP Relationship2004 2005 2006 2007 2008 2009 2010 2011
Russian Federation FDI
15,444,370,800.0
0
15,508,100,000.0
0
37,594,700,000.0
0
55,873,700,000.0
0
74,782,900,000.0
0
36,583,100,000.0
0
43,167,700,00
0.00
55,083,600,000.0
0Percent Change
0% 142% 49% 34% -51% 18% 28%
GDP 591,000,000,000
764,000,000,000
990,000,000,000
1,300,000,000,00
0
1,660,000,000,00
0
1,220,000,000,00
0
1,520,000,000,
000
1,900,000,000,00
0Percent Change
29% 30% 31% 28% -27% 25% 25%
Source: Data Obtained from the World Bank and The Federal Reserve of St. Louis
20
Figure 9: India FDI and GDP Relationship2004 2005 2006 2007 2008 2009 2010 2011
India FDI
5,771,297,152.82
7,269,407,225.61
20,029,119,267.0
0
25,227,740,887.0
0
43,406,277,075.8
1
35,581,372,930.0
0
27,396,885,033.7
8
36,498,654,597.8
6Percent Change
26% 176% 26% 72% -18% -23% 33%
GDP 722,000,000,000
834,000,000,000
949,000,000,000
1,240,000,000,00
0
1,220,000,000,00
0
1,370,000,000,00
0
1,710,000,000,00
0
1,870,000,000,00
0Percent Change
16% 14% 31% -2% 12% 25% 9%
Source: Data Obtained from the World Bank and The Federal Reserve of St. Louis
21

Figure 10: China FDI and GDP Relationship2004 2005 2006 2007 2008 2009 2010 2011
China FDI
62,108,043,001.0
0
104,108,693,867.00
124,082,035,619.00
156,249,335,203.00
171,534,650,312.00
131,057,052,870.00
243,703,434,558.00
280,072,219,150.00
Percent Change
68% 19% 26% 10% -24% 86% 15%
GDP 1,930,000,000,00
0
2,260,000,000,000
2,710,000,000,000
3,490,000,000,000
4,520,000,000,000
4,990,000,000,000
5,950,000,000,000
7,310,000,000,000
Percent Change
17% 20% 29% 30% 10% 19% 23%
Source: Data Obtained from the World Bank and The Federal Reserve of St. Louis
22


![Some document - Web viewPre-submission. Pre-submission. Pre-submission. EDCTP Application Form [Ref No] Pre-submission. Pre-submission. Pre-submission. CSA Strategic Action](https://img.dokumen.tips/doc/110x75/5a7884c87f8b9a1f128c31ac/some-document-web-viewpre-submission-pre-submission-pre-submission-edctp.jpg)