Embed Size (px)
Citation preview

Jeff S. Volek, Ph.D., R.D. Human Performance Laboratory Department of Kinesiology University of Connecticut Storrs, CT
34th Annual Lillian Fountain Smith Conference, Colorado State University, June 14, 2013

Overweight
(366 million Worldwide)
10 20 30 40 50 80 70 60
Obese
Metabolic Syndrome
Impaired Fasting Glucose
Diabetes

Mal- Adaptation
Carbohydrate Intake High
Keto- Adaptation
High Variability
Low
Low Variability
Conserved Trait: Everyone responds in a similar favorable way
Less Conserved Trait: More and more people respond in an undesirable way
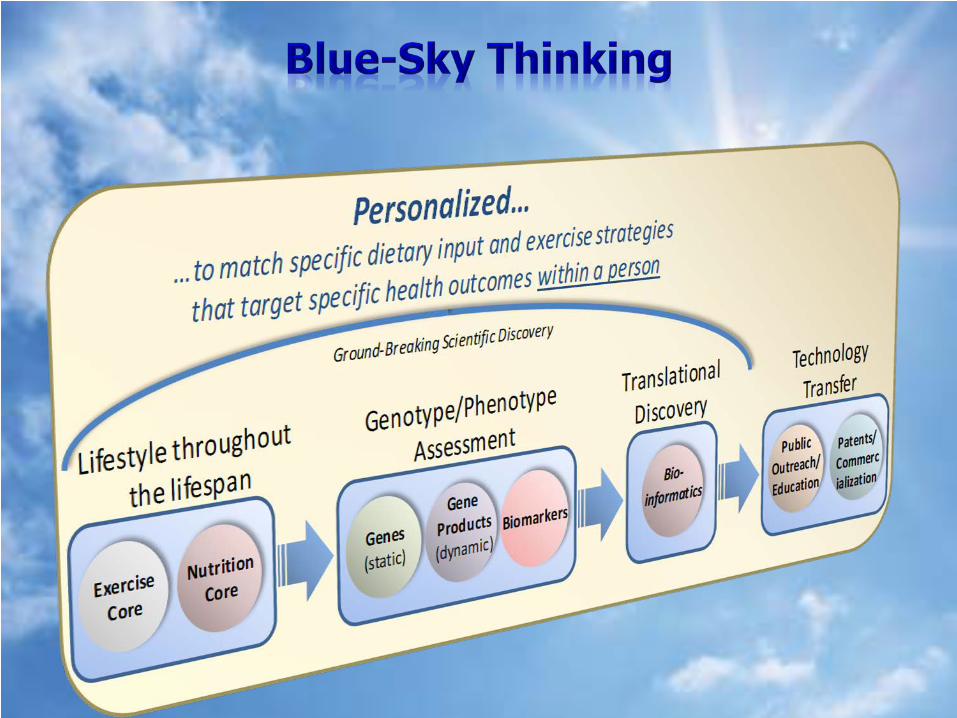
People vary in their ability to metabolize carbohydrate
Those who manage carbs well have more diet options
Those who don’t, have fewer options Obese, IFG, MetSyn, T2D
Insulin Resistance
Carbohydrate Intolerance =
Diabetes = Side effect of consuming too much carbohydrate relative to a person’s tolerance

But basic biochemistry and metabolism, and results of clinical trials all point to positive health effects of low carbohydrate diets Why such resistance to change?
Scientists don’t like to admit they were wrong
Common to criticize what we don’t understand
Scientist view new information with avoidance
Emotion trumps logic almost every time
Willful ignorance
Cognitive dissonance
Theories have four stages of acceptance:
1) This is worthless nonsense. 2) This is an interesting, but
perverse, point of view. 3) This is true, but quite
unimportant. 4) I always said so. -J.B.C Haldane
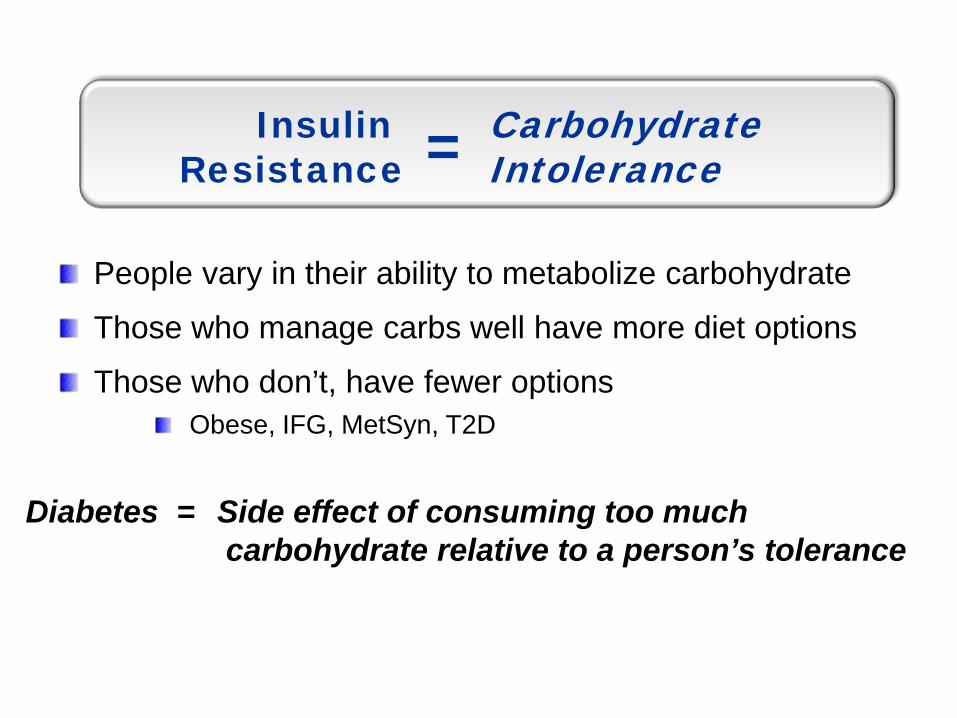
Glucose-Based Glycolytic Increased ROS
Diet/Carb-Driven Regulation
Fatty Acid-Based Mitochondrial Decreased ROS
Health Performance Recovery
The many facets of keto-
adaptation

0 100 300 200
Jenson et al. Diabetes. 38:1591-1601, 1989
Insulin (pmol/L)
Pal
mit
ate
Flux

Macronutrients – exert some of the most powerful signals
Carbohydrate:
Monitored more sensitively and acutely than fatty acids
Large range of intakes compatible with health
Triggers potent metabolic regulatory elements
When we eat typical meals consisting of multiple foods, the body must process potentially a hundred or more different chemical signals


-50
-40
-30
-20
-10
0
10
Glucose Insulin RBP-4 TG HDL-C ApoB/ApoA-1
CRD LFD
Perc
ent C
hang
e
**
******
******
Percent changes in glucose, insulin, RBP-4, and markers of atherogenic dyslipidemia after 12 wk of a CRD or low fat diet (LFD) (***P<0.001, **P<0.01, *P<0.05).

0.0
50.0
100.0
150.0
200.0
250.0
300.0
350.0
400.0
Pre IP 1 2 3 4 5 6
Low Fat Diet Wk 0
Low Fat Diet Wk 12
Time (hours)
0
50
100
150
200
250
300
350
400
Pre IP 1 2 3 4 5 6
CRD Wk 0
CRD Wk 12
Time (hours)
Trig
lyce
rides
(m
g/dL
)
Volek et al. Lipids. 44:297-309, 2009
Pre Occlusion Diameter Post Occlusion Diameter
Volek et al. Metabolism. 2009 July 24

-40
-35
-30
-25
-20
-15
-10
-5
0
5
10
IL-6 IL-8 TNF-a MCP-1 I-CAM E-Selectin
PAI-1
Perc
ent C
hang
e
VLCKD LFD
Forsythe et al. Lipids. 43(1):65-77, 2008
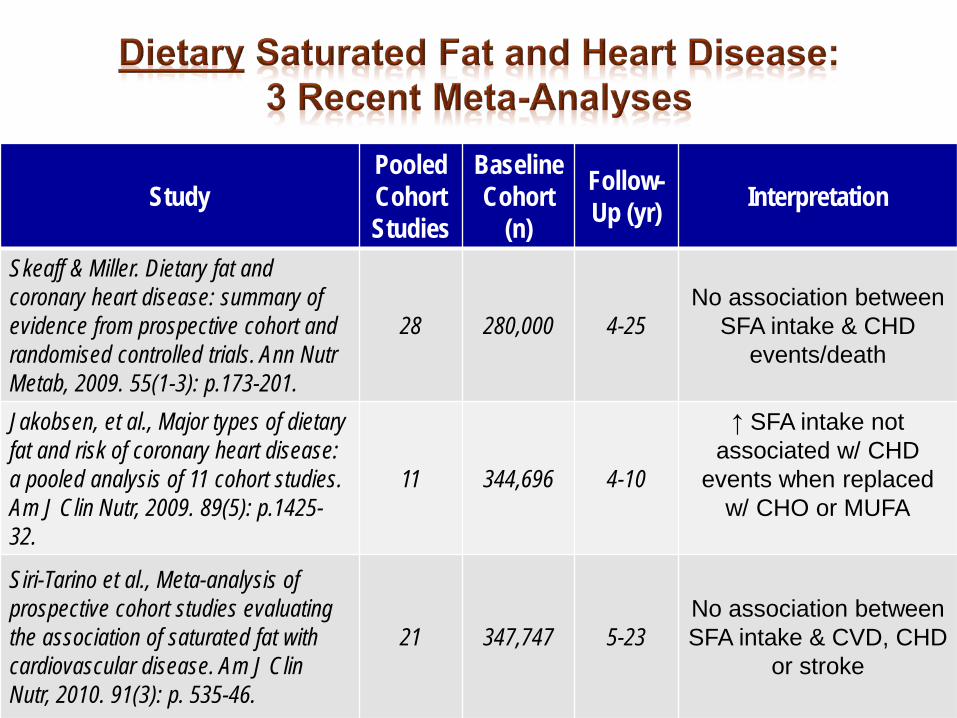
Study Pooled Cohort Studies
Baseline Cohort
(n)
Follow-Up (yr) Interpretation
Skeaff & Miller. Dietary fat and coronary heart disease: summary of evidence from prospective cohort and randomised controlled trials. Ann Nutr Metab, 2009. 55(1-3): p.173-201.
28 280,000 4-25 No association between
SFA intake & CHD events/death
Jakobsen, et al., Major types of dietary fat and risk of coronary heart disease: a pooled analysis of 11 cohort studies. Am J Clin Nutr, 2009. 89(5): p.1425-32.
11 344,696 4-10
↑ SFA intake not associated w/ CHD
events when replaced w/ CHO or MUFA
Siri-Tarino et al., Meta-analysis of prospective cohort studies evaluating the association of saturated fat with cardiovascular disease. Am J Clin Nutr, 2010. 91(3): p. 535-46.
21 347,747 5-23 No association between SFA intake & CVD, CHD
or stroke

Jakobsen et al. AJCN Feb 11 (Epub)
Replacing 5%en of SFA with carbs ↑ coronary events

Study Interpretation
Miettinen et al. Fatty-acid composition of serum lipids predicts myocardial infarction. Br Med J (Clin Res Ed) 1982;285:993-6
Healthy men w/ higher plasma SFA (16:0 & 18:0) had significantly greater incidence of heart attack
Simon et al. Serum Fatty Acids and the Risk of Coronary Heart Disease. Am J Epidemiol. 1995; 142: 469-76
Men who had heart attacks had higher serum palmitic acid (16:0) and a 68% greater risk of heart disease
Wang et al. Plasma fatty acid composition and incidence of coronary heart disease in middle aged adults: The Atherosclerosis Risk in Communities (ARIC) Study. Nut Metab Cardiovasc Dis 2003; 13:256-66
In 282 out of 3,591 men who had heart attacks over 11 yr, plasma CE & PL SFAs were higher
Yamagishi et al. Plasma fatty acid composition and incident heart failure in middle-aged adults: the Atherosclerosis Risk in Communities (ARIC) Study. Am Heart J. 2008; 156:965-74
In 197 out of 3,592 adults who developed heart failure, plasma CE & PL SFAs were higher

Study Interpretation
Wang et al. Plasma fatty acid composition and incidence of diabetes in middle-aged adults: the Atherosclerosis Risk in Communities (ARIC) Study. AJCN. 2003; 78:91-8
Depending upon whether you are looking at serum CE or PL, the risk of developing diabetes if you start out in the highest 20% is more that 2-to-3 times greater
Warensjo et al. Fatty acid composition of serum lipids predicts the development of the metabolic syndrome in men. Diabetologia. 2005; 48:1999-2005
↑ SFA was associated with development of metabolic syndrome 20 yr later
Hodge et al. Plasma phospholipid and dietary fatty acids as predictors of type 2 diabetes: interpreting the role of linoleic acid. AJCN. 2007; 86:189-97
In 3737 adults followed for 4 yr, those who developed diabetes had significantly greater plasma PL SFAs and stearic acid
Patel et al. Fatty acids measured in plasma and erythrocyte-membrane phospholipids and derived by food-frequency questionnaire and the risk of new-onset type 2 diabetes. AJCN. 2010; 92:1214-22
Both plasma and RBC palmitic acid correlate w/ risk of developing diabetes; top third >2x more likely to get diabetes than bottom third

CHOPRO
FAT
Low Fat Diet ~1500 kcal/day
CHOPRO
FAT
Low Carb Diet ~1500 kcal/day
Saturated Fat = 12 g (208 g CHO) Saturated Fat = 36 g (45 g CHO)
Low Carbohydrate Diet
12 wk
Low Fat Low SFA
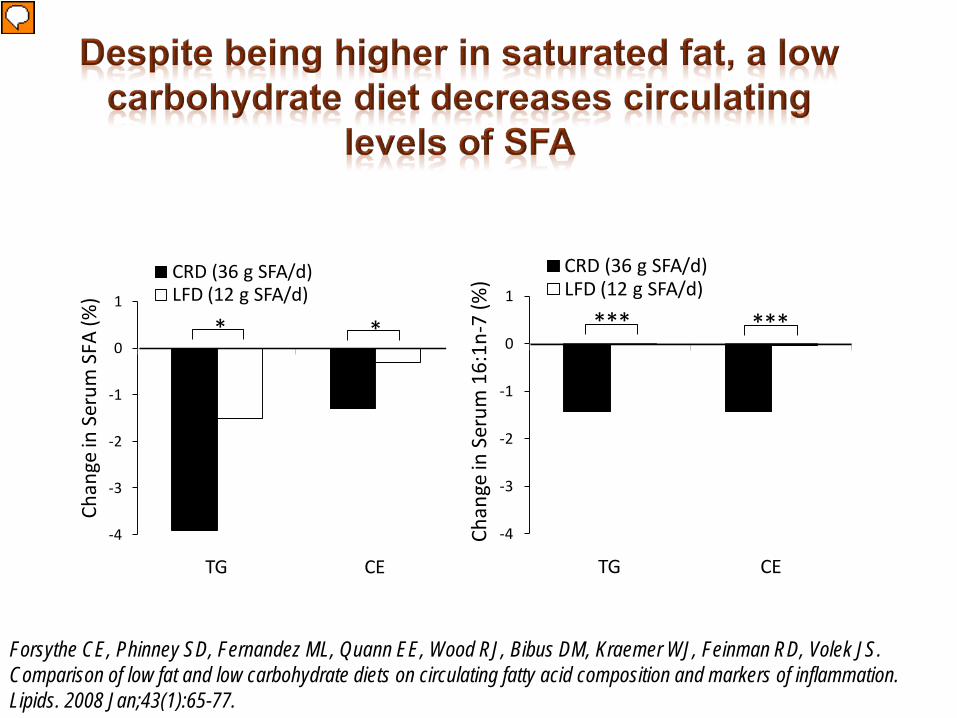
-4
-3
-2
-1
0
1
TG CE
CRD (36 g SFA/d)LFD (12 g SFA/d)
Chan
ge in
Ser
um S
FA (%
)
* *
-4
-3
-2
-1
0
1
TG CE
CRD (36 g SFA/d)LFD (12 g SFA/d)
Chan
ge in
Ser
um 1
6:1n
-7 (%
)
*** ***
Forsythe CE, Phinney SD, Fernandez ML, Quann EE, Wood RJ, Bibus DM, Kraemer WJ, Feinman RD, Volek JS. Comparison of low fat and low carbohydrate diets on circulating fatty acid composition and markers of inflammation. Lipids. 2008 Jan;43(1):65-77.

Dietary Matrix
CHO CHO
↓ Plasma SFA; ↓ 16:1 Insulin Sensitivity Normolipidemia
CHO
↑ Plasma SFA; ↑ 16:1 Insulin Resistance
Dyslipidema
CHO
Path Dependence on Ambient CHO
Metabolic Health Continuum
You are not what you eat…
You are what you save from what you eat!

A dietary carb level that keeps ketones in the desirable range
Typically, an adult eating 50 g/d of complex carbs in foods has serum BOHB of 1 mM (nutritional ketosis)
Some diabetics & insulin resistant individuals find they need to stay as low as 25 g/d carbohydrate to retain good control and weight stability
30g
50g
70g
40g
60g

Lipogenesis (fat synthesis)
Ingest Carbohydrate
Blood Glucose (∼1-2 teaspoons)
Path to Metabolic Syndrome
Path to Health
Glycogen (∼300-400 g)
Oxidation
Glycogen (∼100 g)
CarbohydrateIntolerance

MUFA, Desaturation of palmitic acid by ∆9 desaturase (SCD1)
Minimal dietary intake
Major product human lipogenesis
Serum and tissue 16:1 levels are associated with adiposity & IR
People without high blood sugar, but increased 16:1 are at high risk of developing T2D(Wang et al. AJCN. 78:91-8, 03; Lindgarde et al. AJCN. 84:1009-13, 06)
Adipose 16:1 predicts ability to maintain weight after weight loss (Kunesova et al. Physiol Rev. 2012)
16:0 16:1n-7
18:0 18:1n-9
SCD1

0
2
4
6
8
10
1 2 31% 25% 15% 36% 59% Dietary Fat
10
8
6
4
2
0
Wei
ght
%
Cholesteryl Ester 16:1
Considerable variance in 16:1 at any level of
dietary fat; lower variance as fat
is increased
16:1 drops sharply and uniformly for all
individuals as fat is increased
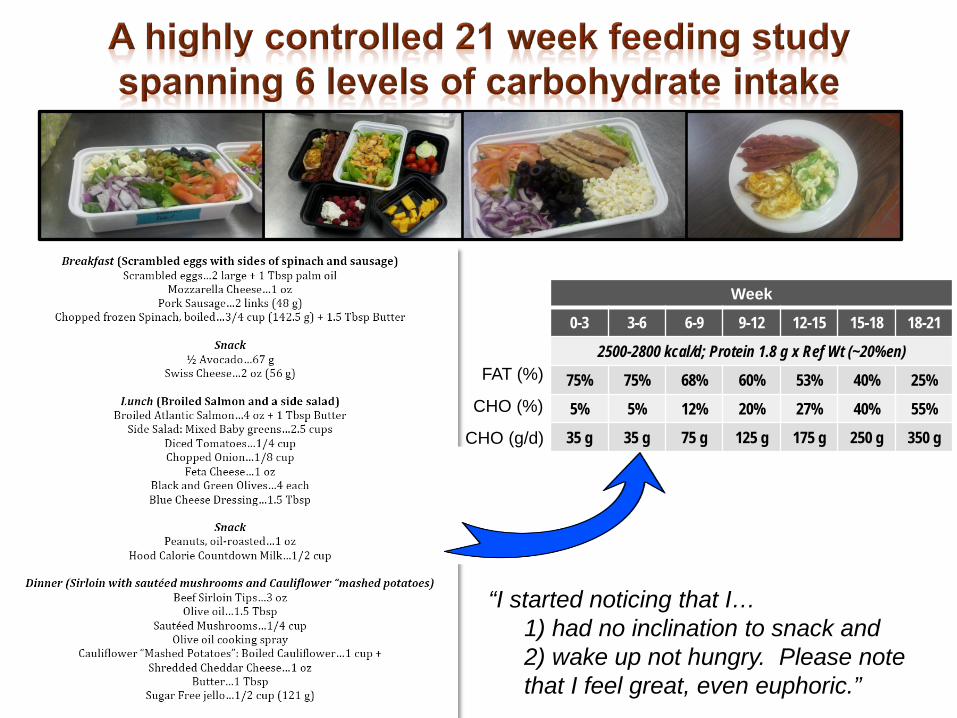
“I started noticing that I… 1) had no inclination to snack and 2) wake up not hungry. Please note
that I feel great, even euphoric.”
Week
0-3 3-6 6-9 9-12 12-15 15-18 18-21
2500-2800 kcal/d; Protein 1.8 g x Ref Wt (~20%en)
75% 75% 68% 60% 53% 40% 25%
5% 5% 12% 20% 27% 40% 55%
35 g 35 g 75 g 125 g 175 g 250 g 350 g
FAT (%)
CHO (%)
CHO (g/d)

-2.5
-2.0
-1.5
-1.0
-0.5
0.0
0.5
1.0
1.5
2.0
2.5
3.0
BL 35 g (FL) 35g 75g 125g 175g 250g 350g
Subject #1Subject #3Subject #5Subject #6Mean (n=4)
Chee
k Ce
ll 16
:1 (%
)

Fecal Microbiome
BacteriaFungi
PhenotypeResponses
• Weight loss• Adiposity• Inflammation• Insulin resistance• Lipoproteins• Oxidative stress
Salivary Microbiome
BacteriaFungi
?
? ?
?
Carb
Fat
Diet Manipulation
Significant variability between and within individuals across different diet phases despite constant caloric intake The absence of linearity in fat loss may be due to a number of factors, including alterations in gut microbiota

Clinical Applications of Low Carbohydrate Ketogenic Diets

Mol Cell Biochem 2007;302:249-56
Obese T2D w/ dyslipidemia Fed well-formulated low carbohydrate diet (20 and then 40 g/d) for 56 wk Meat, poultry, fish, eggs, cheese, vegetables, + 5 T olive oil providing 80-100 g/d protein Significant weight loss and metabolic improvements at 12 wk; continued improvement at 56 wk
-51%
-29%
63%
-33%-41%
-60
-40
-20
0
20
40
60
80
Perc
ent C
hang
e
Glucose TC HDL-C LDL-C TG

Nutrition 2012;1-8
“Building on this well-designed clinical experiment should help us to better understand the impact of dietary changes on cancer growth and guide us to more effective treatment and prevention strategies.”

Neuroprotective role of ketones in: Epilepsy Aging Alzheimer's disease Parkinson disease Mitochondrial disorders Brain trauma Others…autism, migraine, depression…

Ketones
Small energy containing substances derived from fatty acids that provide fuel to the body.
Ketosis A metabolic state characterized by an increase in ketone production, usually marked by blood levels greater than 0.5 mmol/L.
Nutritional Ketosis
The process of accelerating production of ketones through restriction of dietary carbohydrate.
Keto-acidosis
A dangerous side effect of Type I diabetes where ketone production reaches levels above 10 mmol/L. This does not happen in non-diabetics.
Keto-Adaptation
The process the body goes through when it is exposed to limited carbohydrate and continuous elevated ketone levels. It is characterized by a shift to using predominately fat for fuel, and takes at least several weeks if not months to fully develop.

A natural part of human metabolism Ketones, (BOHB) and acetoacetate (AcAc), are produced in liver and released into the blood Archaic molecules Metabolic program that is largely silenced since the advent of agricultural carbohydrates BOHB is a preferred substrate for brain

~70 mg/dL
~25 mg/dL
Cahill GF Jr, Aoki TT. Alternate fuel utilization by brain. In: Cerebral metabolism and neural function. Passonneau et al, Eds. Williams & Wilkins, Baltimore MD 1980.
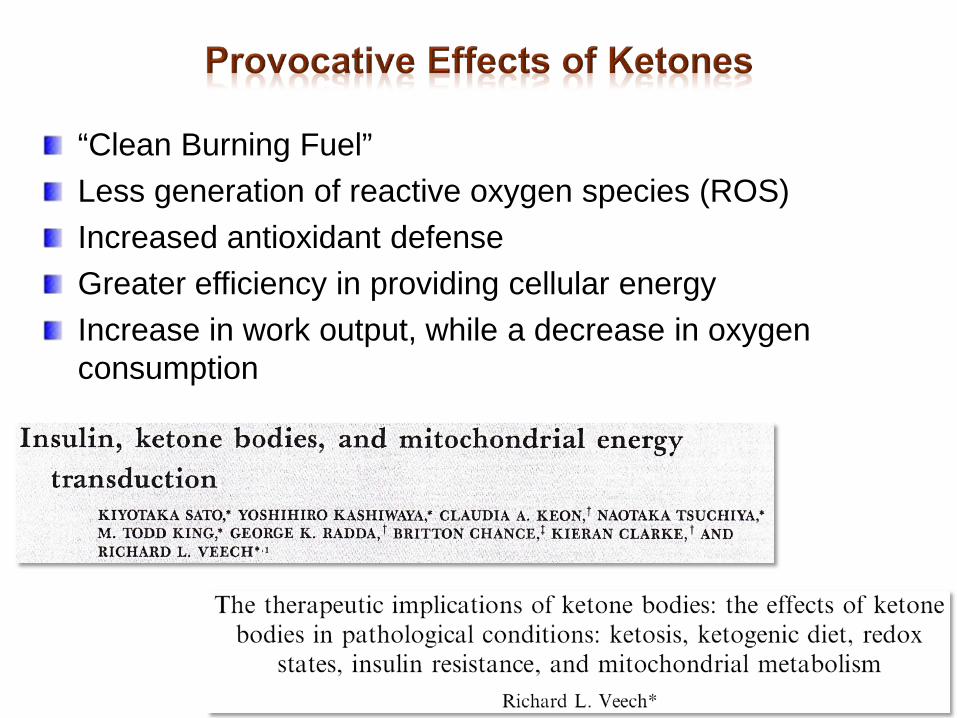
“Clean Burning Fuel” Less generation of reactive oxygen species (ROS) Increased antioxidant defense Greater efficiency in providing cellular energy Increase in work output, while a decrease in oxygen consumption


There is a strong basis for tailoring diets to individuals
We can make a huge dent in the prevalence of obesity and related complications by providing credible science-driven personalize dietary guidance (using genetic and non genetic biomarkers)
Carbohydrate is a good place to start

Collaborators William Kraemer, PhD Steve Phinney, MD, PhD Brian Kupchak, PhD Linda straussbaugh, PhD Richard Feinman, PhD Richard Bruno, PhD, RD Maria Luz Fernandez, PhD Rick Seip, PhD Gualberto Ruano, MD, PhD Richard Wood, PhD Doug Bibus, PhD Former Students Kevin Ballard, PhD Erin Quann, PhD Ricardo Silvestre, PhD Cassandra Forsythe, PhD Mike Puglusi, PhD Matt Sharman, PhD Diana Kawiecki, MA Cherise Labonte, MA
Current Students Brittanie Volk, MA, RD
Daniel Freidenreich, MA Juan Carlos Aristizabal, MS
Ryan deOgburn, MS Catherine Saenz,MS
Laura Kunces, MS, RD Dina Lajoie, RD