Embed Size (px)
Citation preview

1
WORKING PAPER
Demolition as Urban Policy in the American Rust Belt1
Jason Hackworth
University of Toronto

2
Introduction
Tyree Guyton grew up in the 1960s in Detroit’s McDougall-Hunt neighborhood, just
northeast of downtown. Unlike Paradise Valley to the south, or Poletown to the north,
McDougall-Hunt was not targeted by a large, systematic, single-purpose land clearance scheme.
Yet when Guyton returned to his neighborhood after a decade of military service in 1986, he
noted that it looked as if a bomb had been detonated there (Actipedia, 2014). The
neighborhood’s housing stock was almost completely missing after the city had demolished most
of it in response to arson, abandonment and code violations (see Figure 1). Heidelberg Street
looked as though it had been cleared by an urban renewal program, but what had occurred was a
series of ad hoc house demolitions. Guyton eventually funneled his energy and anxiety about the
matter into the now famous Heidelberg Project—a public art installation surrounding two blocks
of Heidelberg Street between Mount Elliot and Ellery Street—consisting of discarded remnants
of consumerist society.
More recently, some have suggested that ad hoc defensive demolition of this sort can
constitute an urban policy approach by itself, and should be expanded. This notion has been
bolstered intellectually by studies documenting the costs of “blight” and pragmatically by a
mixture of municipal-level desperation and copious demolition-focused funding provided by
federal and state governments. The logic of these efforts is most openly and unapologetically
articulated in the Detroit Blight Removal Task Force (DBRTF) report (2014), which calls for the
demolition of 86,000 additional units to remove the “cancerous blight” from the city. Like
similar programs in other cities, this is not an unfunded policy fantasy. The DBRTF identify
about half of the funding they need from a range of local, state and federal sources to finance this
massive demolition campaign.

Heidelberg Street
Benson Street
Mt.
Ellio
t Str
eet
Preston Street
Heidelberg Street
Benson Street
Mt.
Ellio
t Str
eet
Preston Street
Heidelberg Street
Benson Street
Mt.
Ellio
t Str
eet
Preston Street
Elle
ry S
tree
tEl
lery
Str
eet
Elle
ry S
tree
t
1951
1973
2014
Figure 1: Housing stock erosion near Heidelberg Street in Detroit, 1973-2014 (Note: Buildingfootprints were traced from the following maps: a. 1951: Sanborn Maps via the University of Michigan Library; b. 1973: Aerial photos via the Wayne State University Online Map Archive; and c. 2014: Google Maps).

3
The logic of the demolition paradigm is that if a city removes the houses being used for
criminal activity, or as targets for arsonists, or that are draining nearby house values, investors
will return to the neighborhood and allow communities to grow again. Though this is often
framed as a novel approach, Rust Belt cities have extensive experience with ad hoc demolition in
neighborhoods like McDougall-Hunt. In total, there are 269 neighborhoods in 49 American Rust
Belt cities that have lost more than 50% of their housing since 1970 (Figure 2). This article
explores what happened to housing markets and social marginality in extreme-housing-loss
neighborhoods (EHLN) after these demolitions took place. Three objectives frame this analysis.
First, it seeks to illustrate the extent of ad hoc demolition versus other systematic city-clearing
efforts like urban renewal. Second, it will detail the impact on housing markets that such
demolition accompanied. Third, it seeks to demonstrate the impact on social marginality in such
communities as their housing stock was demolished. The overall argument is that ad hoc
demolition is more impactful than even urban renewal, and has failed to stabilize markets and
communities as promised. Its reemergence as a dominant policy vehicle is better explained, I
argue, by the highly politicized intersection of city governance and growth.
Demolition as urban policy
The act of demolition is not exclusively associated with declining cities or
neighborhoods. In fact, it is arguably more often associated with land market investment—as the
necessary step before new development in already built-up areas (Weber et al., 2006). But as a
component of urban policy (or as a stand-alone urban policy) demolition has had an interesting
evolution—one that is overwhelmingly focused on distressed neighborhoods in older American
cities. The urban renewal period of the mid-twentieth century provides a crucial historical and
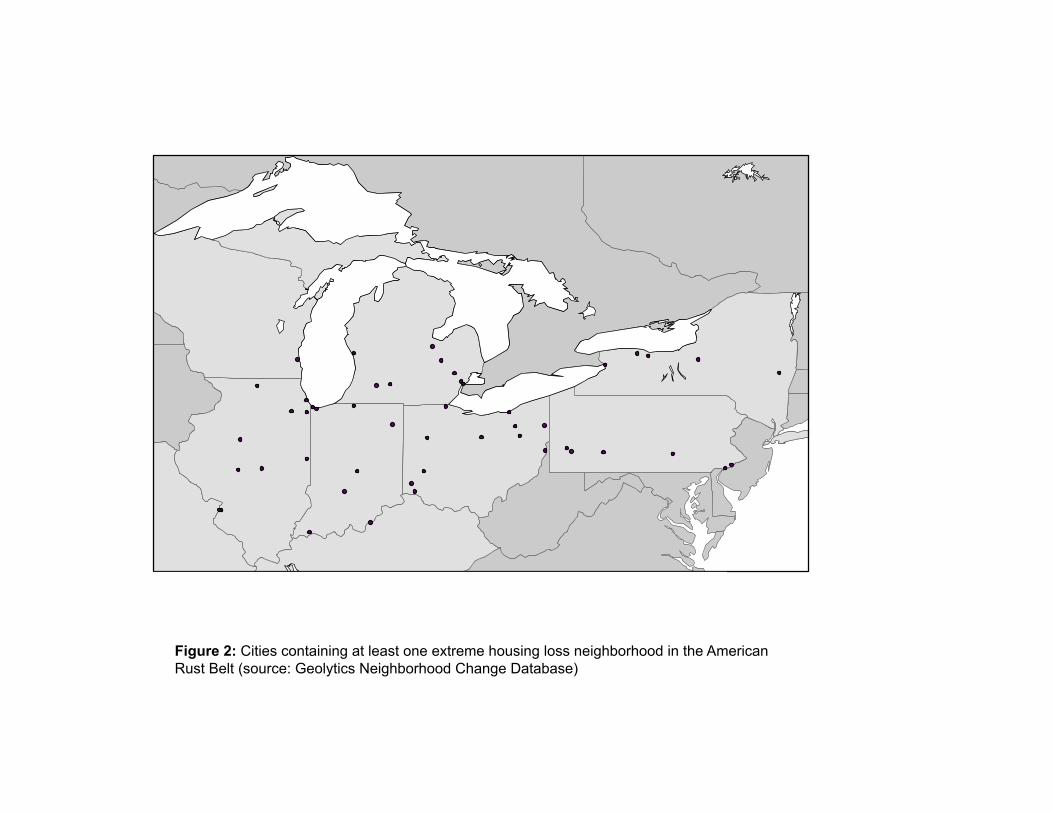
Figure 2: Cities containing at least one extreme housing loss neighborhood in the American Rust Belt (source: Geolytics Neighborhood Change Database)

4
philosophical pivot point in the evolution of demolition as urban policy. Prior to the urban
renewal period, local officials in large American cities increasingly used demolition to eradicate
“unhealthy” housing. Definitions of “unhealthy” varied, but generally revolved around issues of
sanitation (lack of indoor plumbing), unsafe construction methods, and poor ventilation (Plunz,
1990). Officials in large cities like New York and Boston boasted about the number of such
houses they were able to demolish in the 1920s and 1930s as the momentum for more activist
governance was gaining pace (Talen, 2014). Such efforts relied almost exclusively on local
funds, as federal urban programs were decades away from coming to fruition (Gordon, 2003).
Demolition strategies also dovetailed with the modernizing ethos of the late nineteenth century
that created the ethics and disciplines of urban planning and public health.
As the United States emerged from World War II as a global superpower, and with its
main rivals decimated, the federal government embarked on an urban modernization campaign.
It was largely built on these earlier efforts, but amplified considerably by government resources
and expanded condemnation powers (Goetz, 2013; Gordon, 2003). The Housing Acts of 1949
and 1954, along with a number of programs that facilitated the massive expansion of
expressways, were particularly important not only as enabling legislation that allowed cities to
demolish whole neighborhoods, but as the codification of a logic that embodied the period. This
logic was underpinned by the notion that cities could become efficient machines for living, if
only the housing stock was upgraded, and city form was built around the needs of the
automobile. The top-down rationalist planner, arguably best embodied by New York’s Robert
Moses, was born in this period. The rationally ordered, auto-focused city was the end that
justified the means of demolishing all or part of 2,500 neighborhoods in 993 cities nationwide
(Fullilove, 2005).

5
By the late 1960s, however, activists in a variety of cities had constructed a social
movement to contest the logic and practice of urban renewal (Weber, 2002). Jane Jacobs (1961),
who famously led opposition to expressway-related demolitions in Lower Manhattan (and later a
similar project in Toronto), argued that such efforts destroyed the fabric of community through
misguided, top-down, often indiscriminate efforts to modernize cities. Other activists lamented
that communities of color were first and most frequently targeted by demolition-heavy,
development-light programs (Highsmith, 2009; Thomas, 2012). Given that redlining, restrictive
covenants, and simple violence severely restricted the residential options of African-Americans,
the demolition of whole Black neighborhoods created overcrowding in a number of areas, and
cultivated resentment that grew into uprisings and distrust for urban development that persists to
this day (Sugrue, 2005). By the early 1970s, these relatively local activist efforts blended with a
federal government that was actively trying to reduce expenditures in the wake of the worst
economic downturn since the War. Urban programs, particularly the ones that funded and
authorized widespread demolition, were increasingly replaced with block grant programs—
smaller in financial scale and more local in application (Gordon, 2003). Cities were increasingly
left to their own devices over the ensuing four decades as federal urban expenditures continued
to evaporate and the logic of local autonomy reigned supreme (Hackworth, 2007; Harvey, 1989).
In the wake of urban renewal’s demise, demolition emerged as a much more ad hoc,
locally financed (and managed) process. Since the early 1970s, mass demolition and
redevelopment has largely evaporated, with two major exceptions. First, cities continue to
engage in economic development schemes that sometimes entail mass site demolition. High-
profile examples like Detroit’s Poletown neighborhood, which was partially razed to make way
for an expanding GM assembly plant, or New London, Connecticut’s waterfront neighborhood,

6
which was cleared and replaced with a mixed-use building2, continue to occur in cities around
the United States. The second major exception to the post-1970s ad hoc direction of demolition
as urban policy was the HOPE VI program, which aimed to demolish wide swaths of severely
distressed public housing (namely the “projects” that were built as part of urban renewal) and
replace them with smaller, mixed-income communities (Crump, 2002; Hanlon, 2012). Whatever
the similarities in logic and approach, however, these efforts were not of the scale or embedded
in the same modernizing logic that underpinned urban renewal.3
The dominant direction since 1970 has been more ad hoc, house-by-house demolition. Ad
hoc demolition focuses on heavily disinvested neighborhoods and is executed by local officials
as a result of code violations, tax foreclosure, arson, or other safety infractions. Often,
particularly in cash-strapped cities lacking the resources to demolish all such structures,
demolition is complaint-based, rather than part of a systematic campaign. It has been more of a
defensive reaction to creeping disinvestment than an urban policy. Recently, however, it has
been suggested that such efforts could be regenerative in their own right—that removing the
blight will generate growth and more functional communities (Williams, 2013). The emergence
of this paradigm has been paralleled and propelled by new funding sources to execute it.
The emphasis on ad hoc demolition is undergirded by theoretical, popular and academic
literature that clarifies the negative externalities of “blight”.4 First, scholars have argued that
there are important physical and psychological health effects of concentrated vacancy and blight.
Vacant structures attract vermin, drug activity and arson (National Vacant Properties Campaign,
2005). They can be especially dangerous places for children. Garvin et al. (2013) found that the
threat extends to the psycho-social realm. Such structures, they argue, have a stigmatizing effect,
lowering community morale, amplifying social disorder and provoking neighbors to turn inward

7
as a coping mechanism. Second, a variety of scholars have documented the links between vacant
housing and crime. As Kinder (2014, 1767), among others, points out, “empty resident structures
in Detroit are plentiful and notorious as havens of drug dealing, scraping, and arson”. Others
have extended this observation in studies aiming to document the precise impact of vacancy on
criminal activity (National Vacant Properties Campaign, 2005). A third group, perhaps most
important for the expansion of ad hoc demolition into an urban policy program, focuses on the
economic impact of vacancy and blight in general. Vacant structures are a strain on local
resources as they generate little or no tax revenue, yet come with significant service delivery
costs for a city. They have an immediate impact on the property values of nearby homes
(Griswold, et al., 2014; National Vacant Properties Campaign, 2005), and large clusters of vacant
housing generate an oversupply of units that makes adjacent homes difficult to sell, leading to
severely dysfunctional markets (Bernt, 2009; Hackworth, 2014). These factors multiply in
heavily disinvested neighborhoods, creating a spiral effect on municipal revenues, property
values and investment potential.
Though the ad hoc demolitions have largely been driven by local politics, nearly all
levels of government have recently been involved in expanding the resources or administrative
capacity to facilitate such efforts. At the federal level, the Neighborhood Stabilization Program
(NSP) authorized $7 billion in funds starting in 2007 to manage vacant properties. Though only
10% of the funding was permitted for demolition, the focus of NSP funds in already-disinvested
neighborhoods has been demolition and several cities such as Youngstown (OH) have been
given permission to increase this percentage (Rhodes and Russo, 2013). In 2010, the federal
government expanded these efforts to form the Hardest Hit Fund—resources devoted to the
twenty states (including all in this analysis) hardest hit by the foreclosure crisis. In 2013, the

8
Obama Administration announced $300 million in funds dedicated to blight removal (DBRTF,
2014, 2). The scope of these funds has varied, but some cities like Detroit have been using them
primarily to demolish blighted structures, particularly in heavily disinvested neighborhoods
(Hackworth, 2015a). In 2014 alone, Detroit demolished 3,300 additional houses using federal
funds, on top of the 3,700 demolished using municipal funds (Gallagher, 2015). The Genesee
County Land Bank (home to Flint, Michigan) garnered over $22 million from the same program
to demolish 1,084 structures in Flint (GCLB, 2015). In total, the state of Michigan has devoted
over $100 million of its $498 million Hardest Hit Fund resources to demolition (GCLB, 2015;
US Treasury, 2012).
State-level programs have also amplified the resource pool available for ad hoc
demolitions. Among other examples, the Moving Ohio Forward Program was announced in 2012
“to assist communities in their economic recovery by removing blighted or abandoned structures
to reclaim our neighborhoods” (State of Ohio Attorney General, 2015). As of 2014, the state had
allocated $68 million of a total of $75 million for this purpose. Combined with other funds,
Ohio’s attorney general (2015) recently boasted, the state has financed the demolition of 12,000
more housing units than demolished through local programs. Similar to these efforts, the Blight
Elimination Program in Michigan allocated $25 million statewide in 2012-13 to demolish
blighted structures (Flint Area Reinvestment Office, 2013). States have also increased the
capacity for counties and cities to foreclose and demolish housing, and to create land banks and
property registration systems, in recent years (Hackworth, 2014). Like the federal programs, the
focus of these efforts in highly disinvested places remains on demolition of vacant housing
(Hackworth, 2015a).

9
At the local level, cities are increasingly invoking the language of “right-sizing,” but
emphasizing demolition almost exclusively (Hackworth, 2015a). Cities across the Rust Belt are
now demolishing thousands of units per year and executing tax foreclosures with renewed vigor
(Klinefelter, 2015). In addition to the basic emphasis on demolition, cities throughout the region
are changing local ordinances to allow local recovery of demolition costs (namely through
charging delinquent homeowners) (PA Blight Library, 2015). Property registration programs are
emerging which allow cities to penalize and eventually condemn (then demolish) offending
structures.
Overall, such efforts aim to expand the scope of ad hoc demolitions in already-distressed
cities using a combination of new funding, authority, and attention being paid to the topic. This
expansion has several characteristics which, when combined, distinguish it from past demolition-
focused programs. First, government funding and public policy interest has increased
dramatically in the wake of the Great Recession housing crisis, even though the disinvestment of
heavily affected neighborhoods in the Rust Belt has been decades in the making. Second, the
programs aimed at ameliorating the housing crisis are varied in nature, often involving a mix of
mortgage assistance to residents, redevelopment money, and demolition funding. But the mixture
is uneven across the distressed cities. In extreme-housing-loss neighborhoods the emphasis is
overwhelmingly on continued demolition. Third, the justifications for such programs are heavily
focused on the immediate negative externalities. To the extent that justifications gesture to the
wider implications of an expansion of demolition, they tend to have a teleological quality. The
Detroit Blight Removal Task Force Report (2014), for example, is rooted in the assumption that
if you demolish the structures, investors will ameliorate the situation by purchasing and
improving the remaining houses. “In spite of the massive challenge ahead of us”, the task force

10
writes (2014, 9), “there is a growing demand from people who want to buy vacant homes in
recovering neighborhoods”. Demolition is increasingly seen as a stand-alone policy necessary to
unleash the equilibrating tendencies of the market, and the ostensibly community-stabilizing
benefits that follow. As a recent New York Times (Williams, 2013) piece on the subject put it,
“for a number of American cities in the Northeast and Midwest that have lost big chunks of their
population, [demolition]… is increasingly regarded as a path to salvation”. Ad hoc demolition
has moved from defensive local maneuver to an ostensibly generative policy vehicle in and of
itself.
A number of scholars have, conversely, expressed grave concern with the assumption that
demolition will improve the problems associated with such neighborhoods without some other
form of intervention. First, some scholars have argued that the putative connections between
physical deterioration and social disorder are spurious or overstated. Benediktsson (2014), for
example, argues that the actualized relationship between vacancy and disorder is socially
constructed rather than physically predetermined based on a level of “blight”, and dependent on
intra-community relationships more than anything else (also see Hipp, 2010; Sampson and
Raudenbush, 2004). Second, some have suggested that demolition may accelerate rather than
slow processes of disinvestment. By applying the highly problematic logic of “triage” to
neighborhoods or houses (Kirkpatrick, 2015), planners risk accelerating the underlying process
when they label something as beyond hope. Metzger (2000) argues that this triage logic was
applied to neighborhoods in the 1960s and 70s and served as a signal to investors, banks and
governments that any further funding there was pointless, thus making the declaration of
imminent death a self-fulfilling prophesy. Related to this point, some scholars have noted that,
absent other programs or investments, isolated demolition-only policies may exacerbate

11
economic and community conditions (Ryan, 2013). Finally, some have drawn upon the almost
universally criticized urban renewal experience to suggest that the demolition model did not
work then, and should not be replicated even if the underlying justifications for the programs are
marginally different. Hollander and Nemeth (2011) have argued, for example, that current
demolition plans threaten to replicate the top-down planning flaws of the urban renewal period.
Talen (2014) argues that urban renewal’s demolition focus did indeed change the landscape, but
not in a way that improved the lives of poor people or neighborhood livability (see also Ryan,
2012).
Given these concerns, it is curious that demolition as urban policy is being pursued so
uncritically in a wide variety of cities. The aforementioned government demolition programs
almost exclusively invoke the negative externalities literature when promoting such actions,
while leaving the more critical literature unmentioned (Hackworth, 2015a). Most of the housing
programs have several facets (e.g., demolition, mortgage help, redevelopment incentives), but
within extreme-housing-loss neighborhoods the focus is almost exclusively on more demolition.
The key question is why? No definitive treatment of this inquiry exists, but the urban political
economy literature offers useful clues.
First, at the local level it is difficult to overstate the fiscal desperation in cities with
widespread abandonment. Often hemmed in by hostile suburbs, they are desperate to stop the
hemorrhage of further abandonment. Vacant housing tends to be more expensive to maintain
than vacant land, and adjacent owners often advocate the demolition of vacant houses, so when
faced with the limited choice of one over the other, they tend to choose the latter. Second, while
local officials in places like Detroit are on record suggesting that no demolition-only urban
policy could succeed, the funding and enabling legislation for “urban policy” is often formed at

12
the state level, where the politics and understanding of blight are very different. In places like
Michigan and Ohio, hostility from “out-state” legislators—who score political points by
restricting the perceived abuses of cities like Detroit and Cleveland to their constituents—
severely constrains the range of policy options available (Greenblatt, 2014; Hackworth, 2014).
Third, and related, state-level urban public policy is deeply influenced by what Block and
Sommers (2014) have deemed “market fundamentalism”. Market-friendly think tanks are deeply
involved in writing legislation and promoting anti-statist, pro-market policies amongst legislators
governing disinvested urban land (Akers, 2013; Hackworth, 2015b). The notion that simple
eradication of blight will trigger an autonomous market rebound is more prevalent in Rust Belt
state legislatures than in Rust Belt city halls, and factors into the lopsided nature of state-level
funding programs designed to address the problem.
Finally, the local state is under pressure to maintain conditions for continued
accumulation and to sustain political legitimacy (O’Connor, 1972). These pressures are often
contradictory, but within this context demolition allows for both to be met, superficially at least.
By engaging in demolition, city governments respond to the demands of some constituents (thus
maintaining legitimacy), while also socializing an expensive segment of the process of returning
devalorized urban land to profitability (facilitating the reproduction of an accumulation-friendly
environment) (Weber, 2002). Given how unlikely it is for immediate investment to return to
such neighborhoods, however, this explanation is only partially helpful. Here, theorists of triage
offer interesting insights (Kirkpatrick, 2015). Triage (as urban policy) is the practice of
separating neighborhoods into three general categories to determine where public investment for
redevelopment and community-building should be devoted (Kleniewski, 1986). Deriving from
the wartime practice of separating injured soldiers into three categories based on their likelihood

13
of survival, urban triage involves categorizing neighborhoods into: A) those that are doing well
independently and thus do not need public intervention; B) those that are so mortally wounded
by disinvestment and associated processes that no intervention is likely to succeed; and C) those
with marginal damage that can be palpably improved with public assistance. Unlike past
applications of triage, however, the expansion of demolition in already heavily demolished
neighborhoods is not centrally about the application of resources to the “marginally wounded”.
Rather, it focuses on the removal of “mortally wounded” neighborhoods because of the expense
and risk they pose to investment elsewhere in the city.
The remainder of this article elaborates this argument about the approach to the “mortally
wounded” in four steps. First, I illustrate how post-1970s ad hoc demolitions, when aggregated,
are more extensive than during the urban renewal period. Second, I argue that extreme
demolition has had a mixed at best, and corrosive at worst, impact on EHLN markets. Third, I
argue that social marginality in heavily affected neighborhoods has definitively worsened as
demolition has taken place. To conclude, I return to the urban political economy literature to
explore how the expansion of demolition as urban policy can take place against the backdrop of
such countervailing evidence.
Extreme-housing-loss neighborhoods in the Rust Belt
This study focused on cities in New York, Pennsylvania, Ohio, Michigan, Indiana,
Illinois and Wisconsin. I added St. Louis (MO) and Louisville (KY) to the catchment because
they are large and economically similar to key Rust Belt cities, and their metropolitan areas spill
into the study area. New York City was eliminated because of qualitative differences with cities
in the industrial Midwest. Using the Geolytics Neighborhood Change Database, which allows for

14
normalized census tract comparisons over time, I then narrowed the sample to all cities that
contained at least one extreme-housing-loss neighborhood. Extreme-housing-loss neighborhoods
(EHLN) are defined as census tracts that lost more than 50% of their housing between 1970 and
2010, unless one of the following was true: 1) the tract contained fewer than 500 housing units in
1970, thus indicating that it is likely not a primarily residential area; or 2) the tract lost more than
80% of its housing in a single decade, thus indicating mass demolition as part of a commercial or
institutional development project. The aim was to find neighborhoods where the housing unit
demolitions were gradual but continuous. This resulted in 269 tracts in 49 cities (see Figure 2).
Once selected, the cities were then combined into a database and their tracts separated into three
neighborhood categories: 1) EHLN; 2) moderate-housing-loss neighborhoods (MHLN)—tracts
that lost between 0 and 49.9% of their housing between 1970 and 2010; and 3) growing
neighborhoods, which added housing units during that span (see Table 1).
Not only is there no identifiable spatial cluster to these cities (they are fairly evenly
dispersed throughout the region), but it becomes evident that high-profile cases like Detroit are
not even the most affected in relative terms (Table 2). Though Detroit possesses the greatest
absolute number and areal coverage of census tracts affected and parcels cleared, other cities like
Highland Park (MI) and East St. Louis (IL) have much higher percentages of land affected
(Figure 3). Not visible in this map is the large variation in extent of land categorized as EHLN.
As Table 2 illustrates, just 2.9% of the total land area in the 49 affected cities is composed of
EHLN, but this belies huge variation. Highland Park (MI), for example, is 70.6% EHLN, while
Springfield (IL) contains just one EHLN (0.1%). Moreover, some cities have a difficult
combination of extreme and moderate housing loss neighborhoods. East Chicago (IN) and Gary
(IN) for example, are almost entirely composed of EHL or MHL neighborhoods. At the opposite

Table 1: Population, household, and housing unit change in three Rust Belt1 neighborhood types, 1970‐2010 (source: Geolytics Neighborhood Change Database).
EHLN2 MHLN3 Growing4 Total
Year Amount Decade (%) Amount Decade (%) Amount Decade (%) Amount Decade (%)
Population 1970 1,731,280 ‐ 8,761,861 ‐ 6,506,210 ‐ 16,999,351 ‐
1980 1,102,487 ‐36.3 7,300,045 ‐16.7 6,537,345 0.5 14,939,877 ‐12.1 1990 805,069 ‐27.0 6,605,144 ‐9.5 6,521,785 ‐0.2 13,931,998 ‐6.7 2000 643,864 ‐20.0 6,172,419 ‐6.6 6,876,442 5.4 13,692,725 ‐1.7 2010 491,207 ‐23.7 5,324,260 ‐13.7 7,198,443 4.7 13,013,910 ‐5.0
Households 1970 564,275 ‐ 2,916,125 ‐ 2,119,825 ‐ 5,600,225 ‐
1980 392,678 ‐30.4 2,664,493 ‐8.7 2,486,300 17.3 5,543,471 ‐1.0 1990 291,734 ‐25.7 2,452,751 ‐7.9 2,612,867 5.1 5,357,352 ‐3.4 2000 227,668 ‐22.0 2,323,361 ‐5.2 2,800,648 7.2 5,351,677 ‐0.1 2010 178,852 ‐21.4 2,062,359 ‐11.2 2,971,428 6.1 5,212,639 ‐2.6
Housing Units 1970 629,865 ‐ 3,089,369 ‐ 2,201,332 ‐ 5,920,566 ‐
1980 455,546 ‐27.7 2,913,601 ‐5.7 2,622,429 19.1 5,991,576 1.2 1990 359,460 ‐21.1 2,743,396 ‐5.8 2,786,130 6.2 5,888,986 ‐1.7 2000 286,881 ‐20.2 2,625,379 ‐4.3 2,987,889 7.2 5,900,149 0.2 2010 236,210 ‐17.7 2,471,956 ‐5.8 3,279,669 9.8 5,987,835 1.5
Notes:
1 Includes cities in the following states: New York, Pennsylvania, Ohio, Michigan, Indiana, Illinois, and Wisconsin. St. Louis and Louisville were added because they are large cities whose MSAs spill into the study area, and New York City was eliminated because of its qualitative differences with cities in the Midwest. 2 Extreme housing loss neighborhoods (EHLN) are census tracts that lost more than 50 percent of their housing between 1970 and 2010, unless one of the following was true: 1) the tract contained fewer than 500 housing units in 1970 (thus indicating that it might not be a primarily residential area); or 2) the tract lost more than 80 percent of its housing in a single decade (thus indicating mass demolition as part of a commercial or institutional conversion). 3 Moderate housing loss neighborhoods (MHLN) are census tracts that lost between 0 and 49.9 percent of its housing units between 1970 and 2010. 4 Growing neighborhoods are census tracts that gained housing units between 1970 and 2010.

Table 2: Summary stats of three neighborhood types in the American Rust Belt (source: Geolytics Neighborhood Change Database).1
Variables Extreme Housing
Loss Neighborhoods2 Moderate Housing Loss Neighborhoods3
Growing Neighborhoods4 Total
Total number of census tracts 269 1,884 1,830 3,983 Total population (2010) 491,207 5,324,260 7,198,443 13,013,910
Total land area in affected cities 412.8km2 2,632.6km2 11,299.1 km2 14,344.5 km2 Percent of total land area in
affected cities 2.9 18.4 78.8 100.0
High percent of total land area 70.6 (Highland Park, MI)
96.9 (East Chicago, IL)
98.9 (Bloomington, IN)
‐
Low percent of total land area 0.1 (Springfield, IL)
0.0 (Brockport, NY)
0.0 (East St. Louis, IL)
‐
Notes:
1 Includes cities in the following states: New York, Pennsylvania, Ohio, Michigan, Indiana, Illinois, and Wisconsin. St. Louis and Louisville were added because they are large cities whose MSAs spill into the study area, and New York City was eliminated because of its qualitative differences with cities in the Midwest. 2 Extreme housing loss neighborhoods (EHLN) are census tracts that lost more than 50 percent of their housing between 1970 and 2010, unless one of the following was true: 1) the tract contained fewer than 500 housing units in 1970 (thus indicating that it might not be a primarily residential area); or 2) the tract lost more than 80 percent of its housing in a single decade (thus indicating mass demolition as part of a commercial or institutional conversion). 3 Moderate housing loss neighborhoods (MHLN) are census tracts that lost between 0 and 49.9 percent of its housing units between 1970 and 2010. 4 Growing neighborhoods are census tracts that gained housing units between 1970 and 2010.

Figure 3: The percentage of selected Rust Belt cities that are composed of extreme housing loss neighborhoods (source: Geolytics Neighborhood Change Database).
0% 10% 20% 30% 40% 50% 60%
LouisvilleRockford
PhiladelphiaJoliet
SpringfieldSouth BendRochester
Fort WaynePeoria
IndianapolisToledoCanton
MilwaukeeAlbany
KalamazooAkron
EvansvilleBloomington
MansfieldBattle Creek
LimaChicago
CincinnatiHamiltonPontiacDaytonDecatur
Chicago HeightsHarrisburgMuskegonPittsburghDanville
JohnstownSyracuseBuffalo
East ChicagoMcKeesport
FlintClevelandSaginaw
YoungstownSteubenvilleEast St. Louis
St. LouisBrockport
DetroitGary
ChesterHighland Park

15
end of the spectrum, Bloomington (IN) has just one EHL neighborhood and the remainder of the
city is growing. These mixtures represent very different burden levels for the cities involved.
Those with high percentages of land in this condition, generally have the most severe fiscal
problems.
Comparatively speaking, ad hoc demolition has affected more land, neighborhoods and
housing units than urban renewal.5 Following Talen (2014, 238), I view the urban renewal period
as being propelled by both the major Housing Acts in 1949 and 1954 and the various highway
construction bills of the mid-twentieth century. Using this broader definition, Talen derives a
“conservative” national estimate of 910,000 housing unit demolitions on 57,000 acres (230.7 sq.
km) between 1949 and 1971. Approximately 125,000 units were rebuilt on these sites, leaving a
net loss of 785,000 housing units. If we crudely apply these numbers to the catchment area for
this study, the approximate urban renewal impact is 295,763 units demolished, 40,627 rebuilt, for
a net loss of 255,136 housing units.6 This is useful as a broad barometer, but provides no
information about individual cities, so case studies are beneficial. White’s (1980, 73) case studies
of urban renewal (just the housing programs) in Chicago, Detroit, Cleveland and St. Louis are
beneficial in this regard (see Table 3).
While urban renewal sites were much bigger per project than ad hoc demolition, they
amounted to much less cleared land in total. Using an average parcel size of 5,000 square feet7
and applying it to 393,655 housing units removed after 1970 in all cities in the catchment area,
approximately 38,987 total acres (157.8 sq. km) were cleared as a result of these processes.
Individual city comparisons also show important differences. As Table 3 indicates, unit losses
from ad hoc demolition were higher in all sample cities, as were areal coverage totals. Only in
Chicago were more census tracts affected by urban renewal than ad hoc demolition during the

Table 3: Comparison of Urban Renewal and post‐1970 ad hoc demolition in selected cities.
Urban Renewal, 1949‐19741 Ad Hoc Demolition, 1970‐20102
Selected Cities Total
Projects Acres Tracts
Affected Net Unit Change Acres Tracts
Chicago 32 1,539 85 ‐50,454 5,791 39 Cleveland 7 600 15 ‐28,321 3,251 22
Detroit 16 986 16 ‐117,211 13,454 63 St. Louis 4 690 14 ‐36,294 4,166 20
NOTES:
1 Total projects, acres, and tracts affected for urban renewal period were derived from White (1980, 73). White’s counts only include projects related to the 1949 and 1954 Housing Acts. 2 These estimates only include housing units contained within extreme housing loss neighborhoods (i.e. those that lost more than 50 percent between 1970 and 2010). Acreage counts were derived by multiplying the number of units removed by an average lot size of 5,000 square feet (then converting to acreage to be consistent with White’s earlier estimates).

16
post-1970s period being evaluated here. And Table 3 examines only EHLN, which is a very
conservative way to measure ad hoc demolition, because it excludes the hundreds of thousands
of units removed in moderate-housing-loss neighborhoods (which can have rates of loss as high
as 49.9%), and the many cities in the region that have MHL neighborhoods but not EHL
neighborhoods (and thus were eliminated from the study altogether). Nevertheless, it is clear that
ad hoc demolition has cumulatively affected more housing units and land than urban renewal.
Beyond the quantitative perspective, however, the central question remains: did ad hoc
demolition stabilize markets and communities?
Market change after ad hoc demolition
To measure market changes in EHL neighborhoods, I employed a simple approach
involving five variables: owner-occupancy rate, renter-occupancy rate, vacancy rate, house
values, and contract rent values.8 For each variable, medians were recorded and then compared
to figures for growing neighborhoods in the study area. For percentage-based variables (i.e.,
owner-occupancy, renter-occupancy, and vacancy rates), the relative differences were gauged via
simple subtraction. So, for example, if the median owner-occupancy rate in 1980 for EHLN was
28.4%, while for growing neighborhoods it was 68.4%, the two figures were subtracted to derive
the difference of -40.0 points. For nominal medians (i.e., house values and contract rents), the
differences were expressed as ratios. For example, if median rents in 1990 for EHL
neighborhoods was $330, versus $441 in growing neighborhoods, the values were divided to
derive the ratio of 0.75. To make the different types of figures comparable, nominal data ratios
were then converted into percentage point differences between EHLN and growing
neighborhoods (see Table 4). Using the latter example, the ratio of 0.75 would be represented as

17
-25.0 percentage points (relative to growing neighborhoods). What follows is a description of
changes in the five market variables, paying particular attention to whether the differences
between EHL and growing neighborhoods converged, diverged or remained at similar levels.
Breakdowns for each neighborhood type and variable are contained in the appendix. The
description here centers around Table 4, which summarizes the changes illustrated in the tables.
At 30.1%, the 1970 owner-occupancy rate in EHL neighborhoods was substantially lower
(-39.8 points) than the growing neighborhood figure, but the figures converged significantly over
the following 40 years. By 2010, the median owner-occupancy rate in EHLN had fallen to
26.9%, but the difference with growing neighborhoods had narrowed, because the rate for the
latter had fallen substantially (to 52.6%). There were important fluctuations between 1970 and
2010. During the 1990s, for example, convergence was so significant that by 2000 the difference
was only 16.8 percentage points as the EHLN rate soared in absolute and relative terms. In the
most recent decade (to 2010), almost all of that convergence disappeared as rates of foreclosure
disproportionately impacted the most heavily disinvested areas. Rental-occupancy rates display
an inverse pattern. The rental-occupancy rate median for EHLN in 1970 was 60.1%,
substantially higher than both the national average (32.7%) and the growing neighborhood
median (26.1%) for that year. Over the next four decades, the EHLN rental-occupancy rate
converged substantially with the growing-neighborhoods rate. By 2010, the EHLN median
(45.9%) was similar to the growing-city median (37.2%). Here, the convergence has been more
linear (than owner-occupancy statistics) and associated with a mix of EHLN decreases (in rental-
occupancy) and growing-neighborhood increases.
The goal of lowering vacancy rates is one justification for ad hoc demolition programs—
the logic being that a removal of excess housing stock will by definition lower the percentage of

Table 4: Summary of extreme housing loss neighborhood statistics relative to growing neighborhoods in selected Rust Belt cities, 1970‐2010 (source: Geolytics Neighborhood Change Database).
Variable 1970 Position1 2010 Position Trajectory2 50%+ Trajectory3
Market Owner Occupied Units Substantially Lower (‐39.8) Substantially Lower (‐25.7) Converging significantly Growing City Renter Occupied Units Substantially Higher (+34.0) Similar (+8.7) Converging significantly EHLN
Vacant Units Similar (+6.3) Moderately Higher (+15.8) Diverging EHLN House Value Substantially Lower (‐45.0) Substantially Lower (‐49.0) Diverging Growing City
Contract Rent Moderately Lower (‐24.0)4 Moderately Lower (‐17.0) Converging EHLN
Social Black Population Substantially Higher (+76.4) Substantially Higher (+77.5) Diverging EHLN White Population Substantially Lower (‐76.4) Substantially Lower (‐67.6) Converging Growing City Other Population Similar (+0.1) Similar (‐4.0) Diverging Growing City
Household Income Substantially Lower (‐39.0) Substantially Lower (‐43.0) Diverging Growing City Unemployed Population Similar (+5.6) Moderately Higher (+14.2) Diverging EHLN
Less than HS Diploma Substantially Higher (+25.9) Moderately Higher (+13.5) Converging EHLN College or More Moderately Lower (‐10.9) Moderately Lower (‐16.4) Diverging Growing City
Notes
1 Position equals the EHLN rate relative to the growing city. The figures are classified as higher or lower, then further classified by the degree of difference. “Substantially" = +/‐25 points; "Moderately" = 10‐25 points; "Similar" = within 10 points. 2 Trajectory refers to the change in relative difference between 1970 and 2010. The figures are classified as “converging” or “diverging” (from the growing city figures, then further classified if they are “significant" = >10 points change. 3 This column refers to which variable change affected the trajectory the most. For example, if the unemployment rate difference between EHLN and Growing City was converging but the EHLN rate was constant (while the Growing City rate grew), then the growing city would be responsible for more of the shift than EHLN change. 4 Contract rent figures are for 1980‐2010.

18
unoccupied housing (see Bernt, 2009). Yet, the pattern since 1970 tells a different story in
EHLN. The vacancy-rate median for EHL neighborhoods in 1970 was 9.1%, higher than both
the national (8.8%) and growing-neighborhoods median (2.8%), but not radically so. The
similarity with both barometers evaporated during the ensuing four decades as the EHLN rate
grew to 24.0% in 2010, 15.8 points higher than growing neighborhoods for the same year.
Though the pattern seems to be one of definitive divergence from growing neighborhoods on this
metric, a substantial portion of that divergence occurred between 2000 and 2010 (likely because
of the final few years in that decade).
Median house values in EHL neighborhoods were only 55% of the median for growing
neighborhoods, and 90% of the national average, in 1970. Over the ensuing four decades relative
(to national rates) house values fell for both EHL and growing neighborhoods, but more rapidly
for the former. By 2010, the EHL median house value was 51% of that in growing
neighborhoods, indicating a slight divergence. But this rate represents a slight improvement on
even lower ratios in 1980, 1990 and 2000. Both categories (EHL and growing neighborhoods)
weakened considerably against national figures during the span. The gap between rent values in
EHL and growing neighborhoods has been less significant than the difference in house values
over the last three decades. In 1980 (the first year for which reliable data are available), the
median rent in EHL neighborhoods was $193, which was 76% of the growing city total and 79%
of the national figure for that year. Over the next three decades, rent levels grew faster in EHLN
than growing neighborhoods, so that by 2010, the median for the former was 83% of the latter.
Overall, and unsurprisingly, EHL neighborhoods contained substantially different
markets compared to growing neighborhoods in 1970. EHLN held substantially higher rental-
occupancy and vacancy rates, and substantially lower owner-occupancy, house value, and
19
contract rent levels. Over the ensuing four decades change was not linear, but several patterns
emerged. Owner- and renter-occupancy rates in EHLN became, paradoxically, more similar to
those in growing neighborhoods, while changes in the difference between house values and rent
levels remained relatively static, and vacancy rate differences soared. Massive ad hoc demolition
does not appear to be associated with significant changes in the markets targeted. EHL
neighborhoods had substantially weaker markets compared to growing neighborhoods in 1970.
After removing 63% of the housing in those neighborhoods, they emerged in 2010 with similarly
weaker markets, and much higher vacancy rates.
Social marginality after ad hoc demolition
I employed a similar method to evaluate broad changes in social marginality. The broad
idea is to evaluate whether EHL neighborhoods became more or less socially marginalized after
the four decades of intense demolition activity. The tract medians of eight variables were
evaluated: Black population, White population, “other”9 population, household income,
unemployment rate, population with less than high school education, and population with college
or more education. As with the market statistics, what follows is an analysis of medians within
each neighborhood category, with a focus on the relative changes between EHL and growing
tracts. The detailed variable tables are contained in the appendix. The generalized changes are
summarized in Table 4.
Of the variables assessed here none differ as much as the ethno-racial characteristics in
EHL versus growing neighborhoods. Put simply, EHL neighborhoods were substantially more
African-American (+76.4 points) and less White (-76.4 points) in 1970. By 2010, EHL
neighborhoods became even more Black (88.3% of population) and less White (7.7% of

20
population), though the relative differences in relation to the latter variable diminished somewhat
because growing neighborhoods also became somewhat more African-American during this
time. Interestingly, the neighborhood differences (EHLN versus growing) are more significant
than even differences with the national figures. Almost all of the ethno-racial difference was in
Black and White terms—very little of the population self-identified outside of these categories in
1970 (0.3% for EHLN and 0.2 for growing neighborhoods), and by 2010, the picture had
changed very little (2.0% for EHLN; 6.0% for growing). The level of ethno-racial segregation
still evident in such cities raises distressing equity questions for planners, especially considering
that EHL neighborhoods are, by definition, the overwhelming targets of demolition schemes,
today and yesterday.
Though less severe, similar household income differences were revealed during the
timeframe in question. Although nominal median household incomes increased in all
neighborhood categories, the relative differences between EHL and growing neighborhoods
increased from their already high levels. In 1970, the median household income for EHL
neighborhoods was $6,808, a mere 61% of the income level in growing neighborhoods. Though
the ratio fluctuated during the 1970-2010 period, the EHLN figure never exceeded that threshold.
By 2010, the EHLN median was $30,809, 57% of the growing neighborhood median (which had
itself fallen markedly in relation to national figures). Some of this difference is explained in a
yawning gap in employment rates between the two neighborhood types. In 1970, the two
neighborhood types had (more) similar rates of unemployment (8.7% for EHLN, 3.1% for
growing), but by 2010 the rates and gap had increased markedly. By 2010, the 23.1%
unemployment rate in EHL neighborhoods was 14.2 points higher than the rate in growing
neighborhoods. Perhaps most alarmingly, this was actually an improvement for EHL

21
neighborhoods from their peak unemployment of 25.6% (and a 20.3 point gap with growing
neighborhoods) in 1990.
Finally, education statistics reveal worsening social marginality in EHL neighborhoods
between 1970 and 2010. In 1970, the percentage of EHLN adult residents with less than a high
school diploma was 71.4%, 25.9 points higher than in growing neighborhoods. Over the next
four decades, national rates of high school attendance and completion increased across the board,
so the EHLN rate had dropped to 26.3%, marking a convergence but one likely due more to the
normalization of high school than to gains relative to growing neighborhoods. Similar gaps are
revealed when evaluating the opposite of the educational spectrum, those who have completed at
least some college. In 1970, a median of only 6.8% of EHLN residents fell into this category, but
such educational attainment was also relatively rare in growing neighborhoods (17.7%). By
2010, both categories had grown in absolute terms, but the gap between them had yawned to
16.4 points, revealing a divergence in advanced educational attainment.
In general, EHLNs were considerably more African-American, less White, poorer, less
employed, and less educated than growing neighborhood populations in 1970. By 2010, social
marginality had become even more acute. Only two EHLN variables converged with the
growing-city rates—Black population and less than high school diploma—and only one of these
variables was due to absolute improvements in EHL neighborhoods. Black population
concentration actually increased in EHL neighborhoods, but the relative difference decreased
somewhat because growing neighborhoods had also become more African-American. The
broader notion that demolition will stabilize markets, which will in turn stabilize neighborhoods,
appears not to have come to fruition, if measured by degree of social distance with the growing
city.

22
Understanding the demolition paradigm
Demolition has long been a part of urban policy in the United States, but recently its use
has been expanded. This expansion is fueled by new government resources in the wake of the
Great Recession, and a spate of studies linking blight to a range of pernicious outcomes. Some
have even suggested that demolition can serve as a stand-alone policy. If you remove the
“cancerous cells”, the thinking goes, healthy ones will grow in their place. Or, using the
language of neoclassical economics, if you remove the institutional barriers and cloudy land
titles, the market will soon take advantage of next-to-zero land values and return to forgotten
neighborhoods. Though it receives less attention than urban renewal, Rust Belt cities have
engaged in considerable housing demolition during the past 45 years. There are 269
neighborhoods in 49 cities with at least one neighborhood where more than 50% of the housing
has been demolished since 1970 in an ad hoc manner. The total land area and unit losses
experienced exceed even changes during the urban renewal period of the mid-twentieth century.
In the most affected neighborhoods, there has been no definitive market stabilization, and
struggling communities have become even more socially isolated from growing sections than
they were in 1970.
The question is why, given this mixed (at best) evidence, is there a call to expand
demolition-as-urban-policy? Here, the most compelling rationales come from the urban political
economy literature, which emphasizes the intense pressure to create conditions for profitability
in declining cities. The proximate motivator for cities is tax revenue, but the wider impulse to
facilitate such conditions is undergirded by the capitalist system and the various growth
machines that articulate it. Heavily disinvested neighborhoods are, by definition, places lacking

23
fixed investment in the built environment—high percentages of properties have already been
reverted to public ownership and are for sale to private investors for almost nothing. So the
explanation of direct self-interest—i.e., demolishing houses helps protect existing investments—
is unlikely given the scale of the expansion of demolition (large) in relation to the scale of
investment (small) by growth machine members.10 But heavily disinvested neighborhoods also
pose different obstacles that can counter those of the growth machine and its objectives at a
wider scale. Heavily disinvested neighborhoods are expensive to service given their increasingly
disparate settlement patterns. Precious resources that could be used for lucrative CBD
commercial redevelopment, for example, are diverted to finance the delivery of services to far-
flung houses and their residents. Such neighborhoods also symbolically taint a declining city’s
fragile image as a safe place for future investment. They often complicate future investment
possibilities by facilitating a crazy-quilt of tax liens, fraud and poverty that make it difficult for
ostensibly equilibrating capitalism to take advantage of the near-zero land values. Though it is
often framed in more microscopic terms—i.e., immediate externality effects—the wider
expansion of demolition as urban policy arguably aims to correct wider challenges. In a sense, it
is a return to triage, but rather than using such logic to determine which neighborhoods can be
saved with investment, it functions here as the extermination of the already-mortally-wounded
neighborhoods. The notion, in short, that ad hoc, stand-alone demolition as urban policy is a
means to market and community improvement is highly questionable. Its rationale is more
plausibly explained as a way to improve conditions for economic growth elsewhere in the city.

24
References:
Actipedia (2014). Heidelberg Project. Retrieved on 7 April 2015 from:
http://actipedia.org/project/heidelberg-project
Akers, J. (2013). Making markets: Think tank legislation and private property in Detroit. Urban
Geography, 34: 1070-1095.
Benediktsson, M.O. (2014). Territories of concern: Vacant housing and perceived disorder on
three suburban blocks. City and Community, 13(3): 191-213.
Bernt, M. (2009). Partnerships for demolition: The governance of urban renewal in East
Germany’s shrinking cities. International Journal of Urban and Regional Research, 33(3): 754-
69.
Block, F., and M. Sommers (2014). The Power of Market Fundamentalism: Karl Polanyi’s
Critique. Cambridge, MA: Harvard University Press.
Crump, J.R. (2002). Public housing, poverty and urban space. Environment and Planning D:
Society and Space, 20(5): 581-596.
Detroit Blight Removal Task Force (2014). Every Neighborhood Has a Future… And it Doesn’t
Include Blight: Detroit Blight Removal Task Force Plan May 2014. Retrieved on 20 April 2015
from: http://report.timetoendblight.org/
Detroit News (2014, December 16). Detroit getting $50 million to fight blight. Retrieved on 8
April 2015 from: http://www.detroitnews.com/story/news/local/michigan/2014/12/16/michigan-
detroit-blight-funding/20479333/
Flint Area Reinvestment Office (2013). Local, state officials work together to eliminate blight
from flint, Genesee County. Web-page. Retrieved on 8 April 2015 from:
http://www.reinvestflint.org/2q-2013-blight-elimination.html
Fullilove, M. (2005). Root Shock: How tearing up city neighborhoods hurts America and what
we can do about it. New York: Random House.
Gallagher, J. (2015). Detroit's blight-free vision curtailed as money dries up. Detroit Free Press.
Retrieved on 8 April 2015 from: http://www.freep.com/story/news/2015/02/26/detroit-blight-
removal-money/24053179/
Garvin, E., Branas, C., Keddem, S., Sellman, J., and C. Cannuscio (2013). More Than Just An
Eyesore: Local insights and solutions on vacant land and urban health. Journal of Urban Health,
90(3): 412-426.
Genesee County Land Bank (2015). Web-page. Retrieved on 8 April 2015 from:
http://www.thelandbank.org/blightfree.asp

25
Goetz, E. (2013). New Deal Ruins: Race, economic justice, and public housing policy. Ithaca:
Cornell University Press.
Gordon, C. (2003). Blighting the way: Urban renewal, economic development and the elusive
definition of blight. Fordham Urban Law Journal, 31(2): 305-337.
Greenblatt, A. (2014). Rural areas lose people but not power. Governing. April. Retrieved on 15
April 2015 from: http://www.governing.com/topics/politics/gov-rural-areas-lose-people-not-
power.html
Griswold, N., Calnin, B., Schramm, M., Anselin, L., and P. Boehnlein (2014). Estimating the
Effect of Demolishing Distressed Structures in Cleveland, OH, 2009-2013: Impacts on Real
Estate Equity and Mortgage-foreclosure. Available at:
http://www.thrivingcommunitiesinstitute.org/documents/FinalReportwithExecSummary_modifie
d.pdf
Hackworth, J. (2007). The Neoliberal city: Governance, ideology, and development in American
urbanism. Ithaca: Cornell University Press.
Hackworth, J. (2014). The limits to market-based strategies for addressing land abandonment in
shrinking American cities. Progress in Planning, 90: 1-37.
Hackworth, J. (2015a). Right-sizing as spatial austerity in the American rust-belt. Environment
and Planning A, in press.
Hackworth, J. (2015b). The normalization of market-fundamentalism in Detroit: The case of land
abandonment. In M.P. Smith and L.O. Kirkpatrick (Eds.), Reinventing Detroit. New Brunswick,
N.J. and London: Transaction Publishers, forthcoming.
Hackworth, J., and K. Nowakowski (2015). Using market-based policies to address market
collapse in the American Rust Belt: The case of land abandonment in Toledo, Ohio. Urban
Geography, forthcoming.
Hanlon, J. (2012). Beyond HOPE VI: Demolition/Disposition and the Uncertain Future of Public
Housing. Journal of Housing and the Built Environment, 27(3): 373-388.
Harvey, D. (1989). From managerialism to entrepreneurialism: The transformation of urban
governance in late capitalism. Geografiska Annaler, 71: 3-17.
Highsmith, A. (2009). Demolition means progress: Urban renewal, local politics, and state-
sanctioned ghetto formation in Flint, Michigan. Journal of Urban History, 35(3): 348-368.
Hipp, J. (2010). Micro-structure in micro-neighborhoods: A new social distance measure, and its
effect on individual and aggregated perceptions of crime and disorder. Social Networks, 32: 148-
59.

26
Hollander, J., and J. Nemeth (2011). The bounds of smart decline: A foundational theory for
planning shrinking cities. Housing Policy Debate, 21(3): 349-367.
Jacobs, J. (1961). Death and Life of Great American Cities. New York: Vintage Books.
Kinder, K. (2014). Guerrilla‐style defensive architecture in Detroit: A self‐provisioned security
strategy in a neoliberal space of disinvestment. International Journal of Urban and Regional
Research, 38(5): 1767-1784.
Kirkpatrick, L.O. (2015). Urban triage, city systems, and the remnants of community: some
‘sticky’ complications in the greening of Detroit. Journal of Urban History, 41(2): 261-278.
Kleniewski, N. (1986). Triage and urban planning: A case study of Philadelphia. International
Journal of Urban and Regional Research, 10(4): 563–79.
Klinefelter, Q. (2015). Mass foreclosure threatens Detroit homeowners. National Public Radio.
Retrieved on 29 April 2015 from: http://www.npr.org/2015/03/30/396317153/mass-tax-
foreclosure-threatens-detroit-homeowners
Metzger, J. (2000). Planned Abandonment: The neighborhood life-cycle theory and national
urban policy. Housing Policy Debate, 11(1): 7–40.
Molotch, H. (1976). The city as a growth machine: Toward a political economy of place. The
American Journal of Sociology, 82(2): 309-332.
National Vacant Properties Campaign (2005). Vacant properties—the true cost to communities.
Online report. Retrieved on 13 April 2015 from:
http://www.smartgrowthamerica.org/documents/true-costs.pdf
O’Connor, J. (1972). The Fiscal Crisis of the State. New York: St. Martin’s Press.
PA Blight Library (2015). Demolition: Removing unsafe structures and preparing properties for
reinvestment. Online report. Retrieved on 8 April 2015 from:
http://www.pablightlibrary.com/demolition-removing-unsafe-structures-and-preparing-
properties-for-reinvestment
Plunz, R. (1990). A History of Housing in New York City: Dwelling type and social change in the
American metropolis. New York: Columbia University Press.
Rhodes, J., and J. Russo (2013). Shrinking ‘smart’?: Urban redevelopment and shrinkage in
Youngstown, Ohio. Urban Geography, 34(3): 305-236.
Ryan, B. (2012). Design After Decline: How America rebuilds shrinking cities. Philadelphia:
University of Pennsylvania Press.

27
Sampson, R.J., and S.W. Raudenbush (2004). Seeing disorder: Neighborhood stigma and the
social construction of ‘broken windows’. Social Psychology Quarterly, 67: 319-42.
State of Ohio Attorney General (2015). Foreclosure. Web-page. Retrieved on 8 April 2015 from:
http://www.ohioattorneygeneral.gov/Foreclosure
Sugrue, T. (2005). The Origins of the Urban Crisis: Race and inequality in postwar Detroit.
(Princeton Classic Edition). Princeton, NJ: Princeton University Press.
Talen, E. (2014). Housing demolition during urban renewal. City and Community, 13(3): 233-
253.
Thomas, J.M. (2013). Redevelopment and Race: Planning a finer city in postwar Detroit.
Detroit: Wayne State University Press.
United States Department of Housing and Urban Development (US HUD) (2015). IMS/PIC
inventory removals. Retrieved on 20 April 2015 from:
http://www.hud.gov/offices/pih/systems/pic/sac
United States Treasury (2012). Michigan Hardest Hit Fund Allocation. Retrieved on 8 April
2015 from: http://www.treasury.gov/initiatives/financial-stability/TARP-
Programs/housing/Documents/Michigan%20fact%20sheet.pdf
Weber, R. (2002). Extracting value from the city: Neoliberalism and urban redevelopment.
Antipode, 34(3): 519-540.
Weber, R., Doussard, M., Bhatta, S.D., and D. McGrath (2006). Tearing the city down:
Explaining the incidence of privately initiated demolitions. Journal of Urban Affairs, 28 (1): 19-
41.
White, M. (1980). Urban Renewal and the Changing Residential Structure of the City. Chicago:
University of Chicago Press.
Williams, T. (2013, November 12). Blighted cities prefer razing to rebuilding. New York Times,
Retrieved on 13 April 2015 from: http://www.nytimes.com/2013/11/12/us/blighted-cities-prefer-
razing-to-rebuilding.html?_r=0

28
Endnotes
1 I would like to thank Tamara Augsten and Austin Zwick for research assistance, the Canadian Social
Science and Humanities Research Council for funding, and Ed Goetz and Emily Talen for sharing some
of their data with me. 2 Both of these examples generated high-profile Supreme Court cases that impacted the future ability of
cities to expropriate land for private real estate development. 3 This is not to say, of course, that they did not have their own underlying logics. Rather, it is to
emphasize that they were different from those underlying urban renewal, and the resulting efforts much
smaller in scale. 4 There is no fixed definition of “blight”, though courts, researchers and city officials have debated
various ways of understanding it for over 100 years (see Gordon, 2003). 5 HOPE VI demolitions were also compared, but their aggregate coverage is even smaller than urban
renewal. Nationally, 260,000 units of public housing were demolished between 1994 and 2015 (US HUD,
2015). As of 2010, 117,000 public housing units had been demolished nationally as part of the HOPE VI
program (and 56,800 were rebuilt) (Hanlon, 2012). Within the study area, approximately 43,000 units
were demolished, and 14,600 units were rebuilt, of which only 5,500 are public housing, for a net loss of
approximately 28,400 units total and 37,500 public housing units. These numbers include revitalization
grants from fiscal years 1997-2006 plus demo grants from 1996-2003. Only 5,500 (approximately)
rebuilds are public housing units. The net loss in the study area is approximately 37,500 public housing
units. 6 This number was derived by indexing Talen’s (2014) estimate (910,000 housing units) to the total
number of 1950 housing units in the US (45,983,398) then applying that percentage (1.98%) to the total
number of housing units in the study area in 1950 (14,945,252). 7 This figure is a rough estimate of housing parcel sizes in affected areas. Unlike the urban renewal period
(which focused on dense neighborhoods directly adjacent to the CBD), ad hoc demolition has largely
focused on the first ring of single-family houses in cities. 8 I am cautious about causality here. I do not want to suggest that demolition caused a drop in income or a
rise in vacancy in one neighborhood category or another. Rather, the logic here is conservative, and
oriented around falsification. That is, the claims of demolition proponents suggest that if only the
“cancer” is removed, more functional markets, and by extension less marginalized communities, will
occur in its wake. This study is a simple evaluation of those claims in places where demolition has, by
definition (more than half of the housing), been the most dominant policy intervention since 1970. 9 I am reluctant to use this language, not least because it belies much difference by lumping into such a
generic category. Operationally, it refers to all persons who did not identify as being either Black or
White for the US Census. I use it here, though, to highlight how incredibly bimodal the ethno-racial
landscapes of these cities are. They began as almost entirely Black-White cities, and remained that way
through 2010, despite significant diversification elsewhere in the country. 10 Most investors in highly disinvested neighborhoods do not fit the framework of a growth machine
member as outlined by Molotch (1976) and others. Rather, they tend to be petty capitalists, often living in
the city, who own side lots or a rental income house (see Hackworth and Nowakowski, 2015 for a case
study on this topic).

APPENDIX

Table A1: Housing tenure and occupancy change in three Rust Belt1 neighborhood types, 1970‐2010 (source: Geolytics Neighborhood Change Database).
EHLN2 MHLN3 Growing4
Year %
Decade (+/‐)5
National (+/‐)6
Growing (+/‐)7 %
Decade (+/‐)
National (+/‐)
Growing (+/‐) %
Decade (+/‐)
National (+/‐)
Owner
Occupied 1970 30.1 ‐ ‐28.4 ‐39.8 50.1 ‐ ‐8.4 ‐19.8 69.9 ‐ +11.4
1980 28.4 ‐1.8 ‐31.1 ‐35.0 47.6 ‐2.5 ‐11.9 ‐15.8 63.4 ‐6.5 +3.9 1990 27.0 ‐1.4 ‐29.7 ‐33.0 44.3 ‐3.3 ‐12.4 ‐15.7 60.0 ‐3.4 +3.3 2000 52.8 +25.8 ‐6.8 ‐16.8 60.3 +15.9 +0.7 ‐9.3 69.6 +9.5 +10.0 2010 26.9 ‐25.9 ‐30.4 ‐25.7 36.7 ‐23.6 ‐20.6 ‐15.9 52.6 ‐17.0 ‐4.7
Ren
ter
Occupied 1970 60.1 ‐ +27.4 +34.0 44.4 ‐ +11.7 +18.3 26.1 ‐ ‐6.6
1980 56.0 ‐4.1 +24.8 +23.9 43.0 ‐1.4 +11.8 +10.9 32.1 +6.0 +0.9 1990 55.1 ‐0.9 +23.1 +20.8 44.6 +1.6 +12.6 +10.3 34.3 +2.2 +2.3 2000 32.9 ‐22.2 +4.1 +7.0 30.4 ‐14.2 +1.6 +4.5 25.9 ‐8.4 ‐2.9 2010 45.9 +12.9 +17.5 +8.7 43.4 +13.0 +15.0 +6.2 37.2 +11.3 +8.8
Vacant Units 1970 9.1 ‐ +0.3 +6.3 4.4 ‐ ‐4.4 +1.6 2.8 ‐ ‐6.0
1980 12.9 +3.8 +3.7 +8.9 7.1 +2.7 ‐2.1 +3.1 4.0 +1.2 ‐5.2 1990 16.2 +3.3 +4.9 +11.2 9.4 +2.3 ‐1.9 +4.4 5.0 +1.0 ‐6.3 2000 12.8 ‐3.4 +1.2 +9.0 7.4 ‐2.0 ‐4.2 +3.5 3.8 ‐1.1 ‐7.8 2010 24.0 +11.2 +9.7 +15.8 16.0 +8.6 +1.7 +7.8 8.1 +4.3 ‐6.2
Notes:
1 Includes cities in the following states: New York, Pennsylvania, Ohio, Michigan, Indiana, Illinois, and Wisconsin. St. Louis and Louisville were added because they are large cities whose MSAs spill into the study area, and New York City was eliminated because of its qualitative differences with cities in the Midwest. 2 Extreme housing loss neighborhoods (EHLN) are census tracts that lost more than 50 percent of their housing between 1970 and 2010, unless one of the following was true: 1) the tract contained fewer than 500 housing units in 1970 (thus indicating that it might not be a primarily residential area); or 2) the tract lost more than 80 percent of its housing in a single decade (thus indicating mass demolition as part of a commercial or institutional conversion). 3 Moderate housing loss neighborhoods (MHLN) are census tracts that lost between 0 and 49.9 percent of its housing units between 1970 and 2010. 4 Growing neighborhoods are census tracts that gained housing units between 1970 and 2010. 5 Percentage point change from previous decade. 6 Percentage point difference from national figure for that year (derived from: http://www.census.gov/housing/hvs/data/histtabs.html (Table 7)). 7 The percentage point difference from the growing city figure for that year.

Table A2: House value changes in three different Rust Belt1 neighborhood types, 1970‐2010 (source: Geolytics NCDB).
EHLN2 MHLN3 Growing4
Year
Median House Value5
Decade (%)
National Ratio6
Growing City Ratio7
Median House Value
Decade (%)
National Ratio
Growing City Ratio
Median House Value
Decade (%)
National Ratio
1970 $11,037 ‐ 0.90 0.55 $14,402 ‐ 1.18 0.72 $20,008 ‐ 1.64 1980 $18,112 64.1 0.38 0.40 $26,517 84.1 0.56 0.59 $45,089 125.3 0.96 1990 $26,848 48.2 0.34 0.39 $40,183 51.5 0.51 0.58 $69,455 54.0 0.88 2000 $50,243 87.1 0.42 0.46 $64,288 60.0 0.54 0.59 $108,824 56.7 0.91 2010 $79,662 58.6 0.45 0.51 $97,781 52.1 0.55 0.63 $156,080 43.4 0.88
Notes:
1 Includes cities in the following states: New York, Pennsylvania, Ohio, Michigan, Indiana, Illinois, and Wisconsin. St. Louis and Louisville were added because they are large cities whose MSAs spill into the study area, and New York City was eliminated because of its qualitative differences with cities in the Midwest. 2 Extreme housing loss neighborhoods (EHLN) are census tracts that lost more than 50 percent of their housing between 1970 and 2010, unless one of the following was true: 1) the tract contained fewer than 500 housing units in 1970 (thus indicating that it might not be a primarily residential area); or 2) the tract lost more than 80 percent of its housing in a single decade (thus indicating mass demolition as part of a commercial or institutional conversion). 3 Moderate housing loss neighborhoods (MHLN) are census tracts that lost between 0 and 49.9 percent of its housing units between 1970 and 2010. 4 Growing neighborhoods are census tracts that gained housing units between 1970 and 2010. 5 House value is derived by dividing the aggregate value for owner‐occupied noncondo housing units by the number of owner‐occupied noncondo housing units for each census tract. After making this calculation, the median of all census tracts containing data in each category was identified. All figures are nominal. 6 National median house values for 1970‐2000 were derived from http://www.census.gov/hhes/www/housing/census/historic/values.html. For 2010, the figure was derived from http://quickfacts.census.gov/qfd/states/00000.html. The 2010 figure is derived from the American Community Survey and is the median value of all owner‐occupied units in the US. The figures are as follows: 1970= $12,200; 1980= $47,200; 1990= $79,100; 2000= $119,600; 2010=$176,700. 7 Growing city ratio was determined by dividing the median house value for EHLN the median house value for Growing Neighborhoods.

Table A3: Rent changes in three different Rust Belt1 neighborhood types, 1970‐2010 (source: Geolytics NCDB).
EHLN2 MHLN3 Growing4
Year Median Rent5
Decade (%)
National Ratio6
Growing City Ratio7
Median Rent
Decade (%)
National Ratio
Growing City Ratio
Median Rent
Decade (%)
National Ratio
1970 ‐ ‐ ‐ ‐ ‐ ‐ ‐ ‐ ‐ ‐ ‐ 1980 $193 ‐ 0.79 0.76 $222 ‐ 0.91 0.87 $253 ‐ 1.04 1990 $330 70.8 0.74 0.75 $391 76.5 0.88 0.89 $441 74.7 0.99 2000 $443 34.3 0.74 0.76 $516 31.9 0.86 0.89 $582 31.8 0.97 2010 $665 50.2 0.76 0.83 $749 45.0 0.85 0.94 $793 36.3 0.90
Notes:
1 Includes cities in the following states: New York, Pennsylvania, Ohio, Michigan, Indiana, Illinois, and Wisconsin. St. Louis and Louisville were added because they are large cities whose MSAs spill into the study area, and New York City was eliminated because of its qualitative differences with cities in the Midwest. 2 Extreme housing loss neighborhoods (EHLN) are census tracts that lost more than 50 percent of their housing between 1970 and 2010, unless one of the following was true: 1) the tract contained fewer than 500 housing units in 1970 (thus indicating that it might not be a primarily residential area); or 2) the tract lost more than 80 percent of its housing in a single decade (thus indicating mass demolition as part of a commercial or institutional conversion). 3 Moderate housing loss neighborhoods (MHLN) are census tracts that lost between 0 and 49.9 percent of its housing units between 1970 and 2010. 4 Growing neighborhoods are census tracts that gained housing units between 1970 and 2010. 5 Rents are derived from dividing the aggregate gross rent of renter‐occupied housing units paying cash rent by the number of renter‐occupied housing units paying cash rent. The rent median is derived from the census tract calculations, eliminating those with no data. Figures for 1970 were eliminated because they contained many apparently erroneous figures (67% of tracts registered average rents of less than $2; and 80% of tracts registered rents of less than $20). All figures are nominal (i.e. not adjusted for inflation). 6 National average rent figures for 1980‐2000 were derived from: http://www.census.gov/hhes/www/housing/census/historic/grossrents.html. For 2010, they were derived from: http://www.census.gov/prod/2013pubs/acsbr11‐07.pdf (note: 2011 figure was used). The figures are as follows: 1980= $243; 1990= $447; 2000= $602; 2010=$880. 7 Growing city ratio was determined by dividing the EHLN median rent by the Growing Neighborhoods median rent.

Table A4: Racial change in three Rust Belt1 neighborhood types, 1970‐2010 (source: Geolytics NCDB).
EHLN2 MHLN3 Growing4
Year %
Decade (+/‐)5
National (+/‐)6
Growing (+/‐)7 %
Decade (+/‐)
National (+/‐)
Growing (+/‐) %
Decade (+/‐)
National (+/‐)
Black
1970 76.7 ‐ +65.6 +76.4 5.3 ‐ ‐5.8 +5.0 0.3 ‐ ‐10.8 1980 85.4 +8.7 +73.7 +83.2 22.6 +17.3 +10.9 +20.4 2.2 +1.9 ‐9.5 1990 90.1 +4.7 +78.0 +86.5 36.2 +13.6 +24.1 +32.6 3.6 +1.4 ‐8.5 2000 90.7 +0.6 +78.4 +83.8 50.0 +13.8 +37.7 +43.1 7.0 +3.3 ‐5.3 2010 88.3 ‐2.4 +75.3 +77.5 53.2 +3.2 +40.2 +42.4 10.8 +3.9 ‐2.2
White
1970 22.7 ‐ ‐64.8 ‐76.4 93.4 ‐ +5.9 ‐5.7 99.1 ‐ +11.6 1980 12.6 ‐10.1 ‐70.5 ‐82.4 66.0 ‐27.4 ‐17.1 ‐29.0 95.0 ‐4.2 +11.9 1990 8.1 ‐4.5 ‐72.2 ‐83.9 49.6 ‐16.3 ‐30.7 ‐42.3 91.9 ‐3.0 +11.6 2000 6.8 ‐1.2 ‐68.3 ‐76.4 36.8 ‐12.8 ‐38.3 ‐46.4 83.2 ‐8.7 +8.1 2010 7.7 +0.9 ‐70.7 ‐67.6 35.3 ‐1.5 ‐43.1 ‐40.0 75.3 ‐7.9 ‐3.1
Other
1970 0.3 ‐ ‐1.1 +0.1 0.3 ‐ ‐1.1 +0.1 0.2 ‐ ‐1.2 1980 0.9 +0.6 ‐4.3 ‐0.4 1.2 +0.9 ‐4.0 ‐0.1 1.3 +1.1 ‐3.9 1990 0.9 +0.1 ‐6.8 ‐1.1 1.7 +0.5 ‐6.0 ‐0.4 2.1 +0.8 ‐5.6 2000 1.5 +0.5 ‐11.0 ‐2.3 2.7 +1.0 ‐9.8 ‐1.1 3.8 +1.7 ‐8.7 2010 2.0 +0.5 ‐6.6 ‐4.0 3.8 +1.0 ‐4.8 ‐2.2 6.0 +2.2 ‐2.6
Notes:
1 Includes all cities in the following states: New York, Pennsylvania, Ohio, Michigan, Indiana, Illinois, and Wisconsin. St. Louis and Louisville were added because they are large cities whose MSAs spill into the study area, and New York City was eliminated because of its qualitative differences with cities in the Midwest. 2 Extreme housing loss neighborhoods (EHLN) are census tracts that lost more than 50 percent of their housing between 1970 and 2010, unless one of the following was true: 1) the tract contained fewer than 500 housing units in 1970 (thus indicating that it might not be a primarily residential area); or 2) the tract lost more than 80 percent of its housing in a single decade (thus indicating mass demolition as part of a commercial or institutional conversion). 3 Moderate housing loss neighborhoods (MHLN) are census tracts that lost between 0 and 49.9 percent of its housing units between 1970 and 2010. 4 Growing neighborhoods are census tracts that gained housing units between 1970 and 2010. 5 Percentage point change from previous decade. 6 Percentage point difference from national figure for that year. National figures were derived from: 1) for 1970‐2000 national percentages (http://www.census.gov/prod/2002pubs/censr‐4.pdf); 2) for 2010 figures (http://www.census.gov/popest/data/historical/2010s/index.html) (for 2010 figures; note: “two or more races” are included under “other”). 7 The percentage point difference from the growing city figure for that year.

Table A5: Household income changes in three different Rust Belt1 neighborhood types, 1970‐2010 (source: Geolytics NCDB).
EHLN2 MHLN3 Growing4
Year
Median HH
Income5 Decade (%)
National Ratio6
Growing City Ratio7
Median HH
Income Decade (%)
National Ratio
Growing City Ratio
Median HH
Income Decade (%)
National Ratio
1970 $6,808 ‐ 0.80 0.61 $8,742 ‐ 1.03 0.78 $11,243 ‐ 1.32 1980 $11,456 68.3 0.70 0.57 $15,548 77.9 0.94 0.77 $20,214 79.8 1.23 1990 $16,489 43.9 0.57 0.49 $24,386 56.8 0.84 0.72 $33,931 67.9 1.17 2000 $28,232 71.2 0.69 0.59 $35,779 46.7 0.88 0.74 $48,026 41.5 1.18 2010 $30,809 9.1 0.62 0.57 $38,410 7.4 0.77 0.71 $54,328 13.1 1.09
Notes:
1 Includes cities in the following states: New York, Pennsylvania, Ohio, Michigan, Indiana, Illinois, and Wisconsin. St. Louis and Louisville were added because they are large cities whose MSAs spill into the study area, and New York City was eliminated because of its qualitative differences with cities in the Midwest. 2 Extreme housing loss neighborhoods (EHLN) are census tracts that lost more than 50 percent of their housing between 1970 and 2010, unless one of the following was true: 1) the tract contained fewer than 500 housing units in 1970 (thus indicating that it might not be a primarily residential area); or 2) the tract lost more than 80 percent of its housing in a single decade (thus indicating mass demolition as part of a commercial or institutional conversion). 3 Moderate housing loss neighborhoods (MHLN) are census tracts that lost between 0 and 49.9 percent of its housing units between 1970 and 2010.. 4 Growing neighborhoods are census tracts that gained housing units between 1970 and 2010. 5 After gathering household median incomes for each tract, the median of all census tracts containing data in each category was identified. All figures are nominal. 6 National median household incomes for 2009, 1999, 1989, and 1979 were derived from: http://www.census.gov/hhes/www/income/data/historical/household/ (Table H6). I used the figure for the years prior to the census taking (2009 = $49,777; 1999 = $40,696; 1989 = $28,906; 1979 = $16,461). The national figure for 1969 ($8,486) was derived from: https://www.census.gov/hhes/www/income/data/historical/state/state1.html 7 Growing city ratio was determined by dividing the median house value for HHLN and Marginal (separately) by the median house value for Growing.

Table A6: Unemployment rate changes in three different Rust Belt1 neighborhood types, 1970‐2010 (source: Geolytics NCDB).
HHLN2 Marginal3 Growing4
Year Rate (%)5
Decade (+/‐)6
National (+/‐)7
Growing City (+/‐)8
Rate %
Decade (+/‐)
National (+/‐)
Growing City (+/‐)
Rate (%)
Decade (+/‐)
National (+/‐)
1970 8.7 ‐ +3.8 +5.6 4.8 ‐ ‐0.1 +1.7 3.1 ‐ ‐1.8 1980 20.0 +11.3 +12.9 +13.6 12.2 +7.3 +5.1 +5.7 6.4 +3.3 ‐0.7 1990 25.6 +5.6 +20.0 +20.3 12.7 +0.5 +7.1 +7.4 5.3 ‐1.1 ‐0.3 2000 19.4 ‐6.2 +15.4 +14.2 11.7 ‐1.0 +7.7 +6.5 5.2 ‐0.1 +1.2 2010 23.1 +3.7 +13.5 +14.2 16.2 +4.6 +6.6 +7.3 8.9 +3.7 ‐0.7
Notes:
1 Includes all cities in the following states: New York, Pennsylvania, Ohio, Michigan, Indiana, Illinois, and Wisconsin. St. Louis and Louisville were added because they are large cities whose MSAs spill into the study area, and New York City was eliminated because of its qualitative differences with cities in the Midwest. 2 Extreme housing loss neighborhoods (EHLN) are census tracts that lost more than 50 percent of their housing between 1970 and 2010, unless one of the following was true: 1) the tract contained fewer than 500 housing units in 1970 (thus indicating that it might not be a primarily residential area); or 2) the tract lost more than 80 percent of its housing in a single decade (thus indicating mass demolition as part of a commercial or institutional conversion). 3 Moderate housing loss neighborhoods (MHLN) are census tracts that lost between 0 and 49.9 percent of its housing units between 1970 and 2010. 4 Growing neighborhoods are census tracts that gained housing units between 1970 and 2010. 5 This figure is the median of all census tract umemployment figures, with no data cells eliminated. The census definition of unemployment is: Persons 16+ years old in the civilian labor force and unemployed. 6 Percentage point change from previous decade. 7 Percentage point difference from national figure for that year. National figures were derived from: 1) for 1970‐2000 (http://www.census.gov/statab/hist/HS‐29.pdf); 2) for 2010 (http://www.census.gov/compendia/statab/2012/tables/12s0622.pdf). 8 The percentage point difference from the growing city figure for that year.

Table A7: Educational attainment change in three Rust Belt1 neighborhood types, 1970‐2010 (source: Geolytics NCDB).
High Housing Loss Neighborhoods2 Marginal Neighborhoods3 Growing Neighborhoods4
Year %
Decade (+/‐)5
National (+/‐)6
Growing (+/‐)7 %
Decade (+/‐)
National (+/‐)
Growing (+/‐) %
Decade (+/‐)
National (+/‐)
Less than
HS
Di ploma8 1970 71.4 ‐ +26.7 +25.9 60.4 ‐ +15.7 +14.9 45.5 ‐ +0.8
1980 59.6 ‐11.8 +26.1 +27.3 47.8 ‐12.7 +14.3 +15.5 32.3 ‐13.3 ‐1.2
1990 49.5 ‐10.0 +27.1 +25.8 38.3 ‐9.5 +15.9 +14.6 23.8 ‐8.5 +1.4 2000 38.5 ‐11.0 +22.6 +20.9 30.1 ‐8.2 +14.2 +12.5 17.6 ‐6.1 +1.7 2010 26.3 ‐12.2 +13.4 +13.5 21.9 ‐8.2 +9.0 +9.1 12.8 ‐4.8 ‐0.1
College or
More
9
1970 6.8 ‐ ‐14.4 ‐10.9 10.2 ‐ ‐11.0 ‐7.5 17.7 ‐ ‐3.5 1980 12.6 +5.9 ‐19.3 ‐14.9 17.7 +7.6 ‐14.2 ‐9.8 27.5 +9.9 ‐4.4 1990 18.7 +6.1 ‐20.5 ‐17.0 24.6 +6.9 ‐14.6 ‐11.1 35.7 +8.2 ‐3.5 2000 24.6 +5.8 ‐26.4 ‐18.3 30.2 +5.6 ‐20.8 ‐12.6 42.9 +7.2 ‐8.1 2010 37.5 +12.9 ‐18.3 ‐16.4 40.7 +10.5 ‐15.1 ‐13.2 53.9 +11.0 ‐1.9
Notes:
1 Includes cities in the following states: New York, Pennsylvania, Ohio, Michigan, Indiana, Illinois, and Wisconsin. St. Louis and Louisville were added because they are large cities whose MSAs spill into the study area, and New York City was eliminated because of its qualitative differences with cities in the Midwest. 2 Extreme housing loss neighborhoods (EHLN) are census tracts that lost more than 50 percent of their housing between 1970 and 2010, unless one of the following was true: 1) the tract contained fewer than 500 housing units in 1970 (thus indicating that it might not be a primarily residential area); or 2) the tract lost more than 80 percent of its housing in a single decade (thus indicating mass demolition as part of a commercial or institutional conversion). 3 Moderate housing loss neighborhoods (MHLN) are census tracts that lost between 0 and 49.9 percent of its housing units between 1970 and 2010. 4 Growing neighborhoods are census tracts that gained housing units between 1970 and 2010.. 5 Percentage point change from previous decade. 6 Percentage point difference from national figure for that year. National figures were derived from: 1) for Less than High School graduate (http://www.census.gov/compendia/statab/2012/tables/12s0230.pdf); 2) for 1970‐2000 “College or More” (http://www.census.gov/hhes/socdemo/education/data/cps/historical/tabA‐1.csv); 3) for 2010 “College or More” (http://www.census.gov/compendia/statab/2012/tables/12s0231.pdf). 7 The percentage point difference from the growing city figure for that year. 8 This includes the percentage of all persons 25+ who: a) did not attend high school; and b) attended but did not graduate from high school. 9 This includes the percentage of all persons 25+ who have attended college or graduate school (even if they did not graduate).


![[Leo Jason-Lloyd, Leonard Jason-Lloyd] an Introduc(BookSee.org)](https://img.dokumen.tips/doc/110x75/55cf8e0f550346703b8e1817/leo-jason-lloyd-leonard-jason-lloyd-an-introducbookseeorg.jpg)