Embed Size (px)
Citation preview

Jardine M
atheson A
nnual Report 2011
Jardine Matheson Annual Report 2011
2011
www.jardines.com

Founded as a trading company in China in 1832, Jardine
Matheson is today a diversified business group focused
principally on Asia. Its businesses comprise a combination of
cash generating activities and long-term property assets.
The Group’s interests include Jardine Pacific, Jardine
Motors, Jardine Lloyd Thompson, Hongkong Land, Dairy
Farm, Mandarin Oriental, Jardine Cycle & Carriage and
Astra International. These companies are leaders in the
fields of engineering and construction, transport services,
insurance broking, property investment and development,
retailing, restaurants, luxury hotels, motor vehicles and
related activities, financial services, heavy equipment, mining
and agribusiness. The Group also has a minority investment in
Rothschilds Continuation, the global financial advisory group.
Jardine Matheson Holdings Limited is incorporated in
Bermuda and has a premium listing on the London Stock
Exchange, with secondary listings in Bermuda and Singapore.
Jardine Matheson Limited operates from Hong Kong and
provides management services to Group companies.
Jardine Matheson Holdings LimitedJardine House HamiltonBermuda
Contents
Highlights 1
Chairman’s Statement 2
Group Structure 4
Managing Director’s Review 5
People and the Community 22
Financial Review 24
Directors’ Profiles 27
Financial Statements 28
Independent Auditors’ Report 94
Five Year Summary 95
Responsibility Statement 96
Corporate Governance 97
Principal Risks and Uncertainties 102
Shareholder Information 103
Group Offices 104

1Jardine Matheson | Annual Report 2011
Highlights
Analysis of Underlying Profit
By Business2011 2010
US$m % US$m %
Jardine Pacific 179 12 156 11
Jardine Motors 61 4 87 6
Jardine Lloyd Thompson 53 4 48 4
Hongkong Land 289 19 332 24
Dairy Farm 301 20 259 19
Mandarin Oriental 35 2 27 2
Jardine Cycle & Carriage 36 2 32 2
Astra 561 37 437 32
1,515 100 1,378 100
Corporate and other interests (20) (14)
Underlying profit 1,495 1,364
By Geographical Area2011 2010
US$m % US$m %
Greater China 615 40 561 41
Southeast Asia 861 57 761 56
United Kingdom 48 3 48 3
Rest of the world (9) – 8 –
1,515 100 1,378 100
Corporate and other interests (20) (14)
Underlying profit 1,495 1,364
Results
2011US$m
2010
US$m
Change
%
Gross revenue† 57,306 46,963 22
Revenue 37,967 30,053 26
Underlying profit before tax* 4,784 4,232 13
Underlying profit attributable to shareholders* 1,495 1,364 10
Profit attributable to shareholders 3,449 3,084 12
Shareholders’ funds 16,356 13,710 19
US$ US$ %
Underlying earnings per share* 4.13 3.80 9
Earnings per share 9.53 8.58 11
Dividends per share 1.25 1.15 9
Net asset value per share 45.09 37.99 19
• Underlying earnings per share up 9%• Full-year dividend up 9%• Excellent performances from Astra and Dairy Farm• Increased shareholding in Jardine Lloyd Thompson• Hongkong Land’s property portfolio value rises; iconic Beijing
site acquired
Includes 100% of revenue from associates and joint ventures.
The Group uses ‘underlying profit’ in its internal financial reporting to distinguish between ongoing business performance and non-trading items, as more fully described in note 1. Management considers this to be a key measure which provides additional information to enhance understanding of the Group’s underlying business performance.
†
*
Underlying Earnings per Share* (US$)
2.0407
2.3408
2.8609
3.8010
4.1311
Net Asset Value per Share (US$)
25.9707
25.1308
29.8709
37.9910
45.0911

2 Jardine Matheson | Annual Report 2011
OverviewThe Group performed well in 2011 against a background of an
increasingly challenging business environment. There were,
in particular, excellent results from Astra and Dairy Farm.
PerformanceThe Group’s revenue for 2011, including 100% of revenue from
associates and joint ventures, was US$57 billion, compared
with US$47 billion in 2010. Jardine Matheson achieved an
underlying profit before tax for the year of US$4,784 million,
an increase of 13%. Underlying profit attributable to
shareholders was 10% higher at US$1,495 million while
underlying earnings per share were 9% higher at US$4.13.
The profit attributable to shareholders for the year was
higher at US$3,449 million, with the main non-trading item
being a significant increase in the value of Hongkong Land’s
investment property portfolio. Shareholders’ funds were 19%
higher at US$16.4 billion.
The steady growth in profits, cash flows and retained
earnings achieved in recent years has enabled the Group to
maintain high levels of capital expenditure while keeping
low levels of debt. Net debt excluding financial services
companies at the year end was US$2.4 billion, representing
6% of consolidated total equity.
The Board is recommending a final dividend of US¢92.00
per share, which represents an overall increase of 9% for
the full year.
Business DevelopmentsJardine Pacific produced a satisfactory result despite the
more difficult trading conditions experienced by a number of
its businesses. JOS benefited from the successful acquisition
of an IT distribution business early in the year, and the
group’s restaurant operations were expanded with additional
interests acquired in KFC and Pizza Hut in Vietnam. Gammon
continued to win major infrastructure contracts thereby
maintaining its US$3 billion order book.
Jardine Motors’ operation in Hong Kong produced a good
result, but there were disappointing performances in
Southern China and the United Kingdom. During the year the
group completed the acquisition of a 22 dealership motor
retailing group in the United Kingdom, further growing its
position in that market.
Chairman’s Statement
With its extensive Asian networks and financial strength the Group is well positioned in its chosen markets.

3Jardine Matheson | Annual Report 2011
Jardine Lloyd Thompson continued to perform well and
its business transformation programme, which is nearing
completion, is delivering increased savings. Investment for
future growth is continuing with bolt-on acquisitions and
the recruitment of leading industry professionals. Jardine
Matheson acquired a further 10% shareholding in the
company in November 2011 by way of a partial offer which
was heavily oversubscribed, increasing the Group’s interest
to 40.2%.
Hongkong Land’s office and retail portfolio in Hong Kong
produced strong results and its growing Singapore portfolio
made an increased contribution. This improvement was,
however, offset by lower profits from its residential business
due to the timing of completions, leading to a reduced
underlying profit for 2011. Several new development sites
were secured during the year, including an iconic commercial
site in Wangfujing in the heart of Beijing, residential sites in
Chongqing and Singapore, and a small portfolio in Cambodia.
Dairy Farm continued to generate profitable growth
during 2011 as good increases in comparable store sales
were complemented by organic expansion from new store
openings. In the more mature markets of Hong Kong,
Singapore and Taiwan, the group is concentrating on
improving operational efficiencies and enhancing store
attractiveness, while in Indonesia and Malaysia significant
funds are being invested in enlarging the network of existing
formats. Acquisition opportunities are also being sought in
existing and new markets in the Region.
Mandarin Oriental benefited from increased demand
throughout 2011 which led to improved profitability across
most of the group’s portfolio, particularly in Asia and Europe.
Its new Paris hotel opened to great acclaim in June, and the
group’s development activities continue with a new hotel
in Guangzhou scheduled to open in late 2012. Mandarin
Oriental currently has 27 hotels in operation and 15 under
development, all of which are to be management contracts.
Astra’s businesses performed excellently in 2011 with good
earnings growth from its automotive, financial services,
heavy equipment and mining activities, helped in part by
the continuing strength of the Indonesian economy, which
is transforming the country’s global standing. Progress was
made in the development of the group’s operations with
a significant expansion of the manufacturing capacity in
both its motor car and motorcycle plants, the addition of a
further five coal mining concessions with reserves in excess
of 250 million tonnes, and the acquisition of a new toll road
project near Surabaya.
PeopleThe fine performances achieved by our businesses are a
reflection of the hard work, dedication and professionalism
of the 330,000 employees that we have across the Group.
I would like to thank them all for their excellent contribution.
Y.K. Pang joined the Board in April 2011. R.C. Kwok retired
from the Board in May 2011 and I would like to thank him for
his significant contribution during his 47 years of service to
the Group.
Anthony Nightingale is stepping down as Managing Director
on 31st March 2012 after six highly successful years in the
role. Anthony has had a long and very distinguished career
with Jardine Matheson and we are delighted that he will
remain to give his advice as a non-executive Director. Ben
Keswick will take over as Managing Director and Adam
Keswick as Deputy Managing Director.
OutlookThere may be increasing fragility in some of the Group’s
markets in the year ahead as the present uncertain economic
conditions show little sign of improvement. Hongkong Land’s
contribution to the Group’s results will also be affected by
fewer residential completions. The current year has, however,
begun satisfactorily and with its extensive Asian networks
and financial strength the Group is well positioned in its
chosen markets.
Sir Henry Keswick
Chairman
2nd March 2012

4 Jardine Matheson | Annual Report 2011
Jardine Matheson
Jardine Strategic
A holding company with a select portfolio representing many of the Group’s non-listed Asian businesses, principally in engineering and construction, transport services, restaurants and IT services. (100%)
A listed property group with some 450,000 sq. m. of prime commercial property in central Hong Kong and further high quality commercial and residential developments in Asia. (50%)
A Singapore-listed company with an interest of just over 50% in Astra, a major listed Indonesian conglomerate, and other motor interests in Southeast Asia. (71%)
(Figures in brackets show effective ownership by Jardine Matheson as at 22nd March 2012.)
(Figures in brackets show effective ownership by Jardine Strategic as at 22nd March 2012.)
A listed company holding most of the Group’s major listed interests, including 55% of Jardine Matheson. (82%)
An unlisted holding company, Rothschilds Continuation has various interests, including global financial advisory, wealth management and trusts. (21%)
A leading listed insurance and reinsurance broker, risk specialist and employee benefits consultant, combining specialist skills in the London and international insurance markets with a worldwide network. (42%)
A listed pan-Asian retail group operating over 5,400 outlets, including supermarkets, hypermarkets, health and beauty stores, convenience stores, home furnishings stores and restaurants. (78%)
A group engaged in the sales and service of motor vehicles in Hong Kong, Macau and the United Kingdom, and with a large and growing presence in Southern China. (100%)
A listed hotel investment and management group with a portfolio of 42 deluxe and first class hotels and resorts worldwide, including 15 under development. (74%)
The largest Indonesian motor group, manufacturing, assembling and distributing motor vehicles, motorcycles and components in partnership with industry leaders such as Toyota, Daihatsu and Honda.
Astra’s financial services businesses consist of consumer finance (principally motor vehicle and motorcycle), insurance and banking.
Astra’s other interests include heavy equipment and mining, oil palm plantations, infrastructure and logistics, and information technology.

5Jardine Matheson | Annual Report 2011
Managing Director’s Review
PerformanceA record underlying profit before tax was achieved in 2011 of
US$4,784 million, an increase of 13%, with fine performances
from a number of the Group’s operations. Underlying
profit attributable to shareholders was 10% higher at
US$1,495 million while underlying earnings per share were
9% higher at US$4.13.
Of the Group’s businesses, Jardine Pacific saw good
performances across its operations, although there were
some areas of weakness, while Jardine Motors experienced
a decline in its earnings. Jardine Lloyd Thompson continued
to make progress and its contribution was enhanced by
the Group’s increased shareholding. Hongkong Land’s
commercial property activities did well in 2011, but its results
were lower following a reduced contribution from residential
developments. Dairy Farm achieved higher earnings across
most of its banners. Mandarin Oriental’s profits continued
to recover following improvements in occupancy and room
rates. Astra achieved record results as its businesses
performed well in a strong trading environment, enhanced on
consolidation by the strengthened Indonesian rupiah.
Non-trading items in 2011 primarily consisted of the Group’s
US$1,924 million share of the increase in the valuation
of investment properties, producing a profit attributable
to shareholders of US$3,449 million, compared with
US$3,084 million in 2010.
The Group continues to benefit from robust operating cash
flows, ample committed facilities and access to the capital
markets. This has provided a sound financial base on which
to support investment in maintaining and expanding its
leading market positions. Total capital investment across
the Group in 2011 exceeded US$4.9 billion. The consolidated
net debt at the end of 2011, excluding financial services
companies, was US$2.4 billion, representing gearing of 6%,
which compares to US$2.3 billion at the end of 2010 and
gearing of 7%.
Business ModelAs a diversified business group, Jardine Matheson is focused
principally on Greater China and Southeast Asia, although
some of its operations have a more global reach. In 2011
40% of underlying profit came from Greater China while
57% was from Southeast Asia, primarily due to an excellent
contribution from Indonesia. The Group companies are
leaders in the fields of motor vehicles and related activities,
property investment and development, retailing and
restaurants, engineering and construction, transport services,
luxury hotels, financial services, heavy equipment, mining
and agribusiness.
The Group’s representation in this broad mix of business
sectors and the spread between cash generating activities
and long-term property assets enables it to focus its
investment in high growth markets while spreading the
risk that might otherwise be associated with its geographic
concentration. This strategy combined with a strong balance
sheet is designed to achieve long-term growth in both
earnings and net asset value.
6 Jardine Matheson | Annual Report 2011
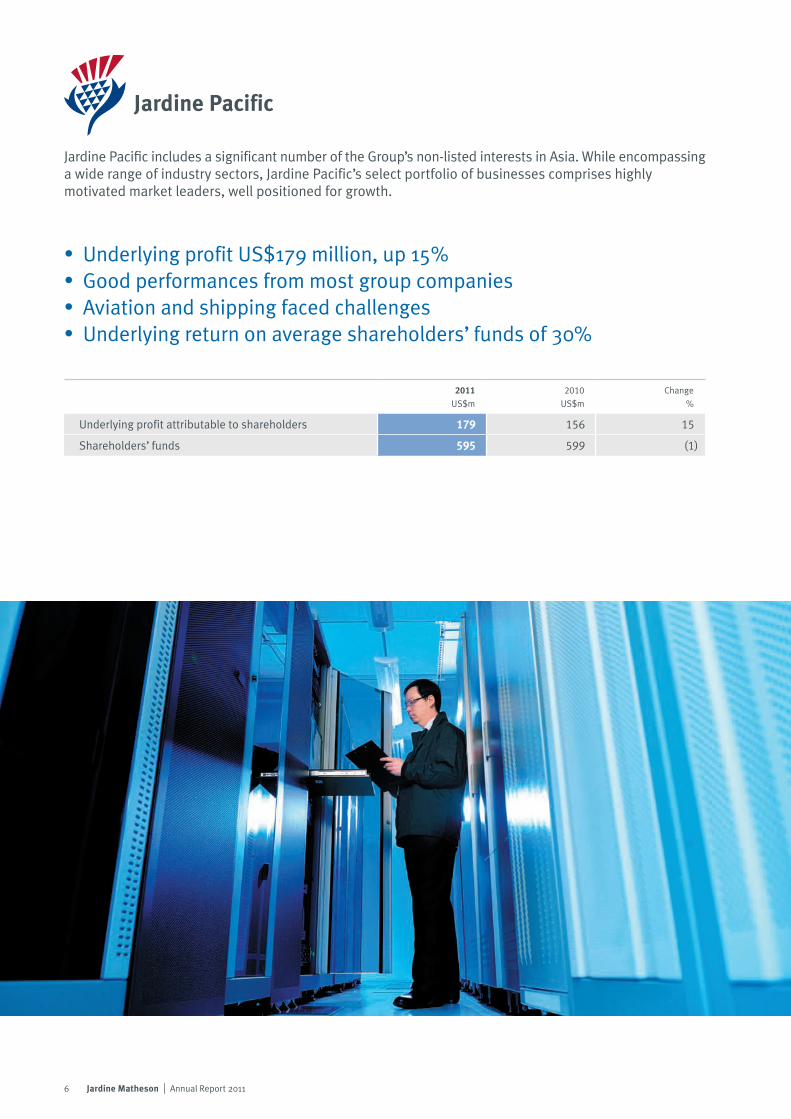
Jardine Pacific includes a significant number of the Group’s non-listed interests in Asia. While encompassing a wide range of industry sectors, Jardine Pacific’s select portfolio of businesses comprises highly motivated market leaders, well positioned for growth.
• Underlying profit US$179 million, up 15%• Good performances from most group companies• Aviation and shipping faced challenges• Underlying return on average shareholders’ funds of 30%
2011
US$m
2010
US$m
Change
%
Underlying profit attributable to shareholders 179 156 15
Shareholders’ funds 595 599 (1)

7Jardine Matheson | Annual Report 2011
Managing Director’s Review (continued)
Jardine Pacific’s underlying profit rose 15% to US$179 million
in 2011. A US$23 million gain arising on the revaluation of
investment properties, together with gains from property
disposals, contributed to a profit attributable to shareholders
of US$216 million, up 19%. Shareholders’ funds were
US$595 million at the end of 2011, and the underlying return
on average shareholders’ funds was 30%.
Gammon’s earnings were maintained, despite absorbing
losses from two difficult projects, and its order book remains
high at US$3 billion. Jardine Schindler generated improved
profits from new installations across the Region and
produced further growth in its maintenance portfolio. JEC also
achieved a good increase in profit as its joint ventures and
operations in Thailand and the Philippines performed well.
Hong Kong Air Cargo Terminals recorded a decline in earnings
because of reduced cargo throughput, but its contribution
was broadly maintained due to Jardine Pacific’s increased
shareholding. Jardine Aviation Services’ profit was little
changed, but Jardine Shipping Services only recorded a
breakeven result following a decline in freight rates and
volumes in a very difficult shipping sector.
Jardine Restaurants’ Pizza Hut operations in Hong Kong and
Taiwan achieved growth in both sales and profits. The KFC
franchise in Taiwan acquired in 2010 produced a stable
year on year operating performance, although it recorded
profit growth due to the recognition of a deferred tax gain
of US$5 million. JOS recorded strong revenue and earnings
growth, with an excellent first year’s contribution from SiS,
acquired in January 2011.
Underlying Profit Attributable to Shareholders (US$ million)
Underlying Return on Average Shareholders’ Funds (%)
11507
11608
11909
15610
17911
2507
2608
2809
3010
3011
JOS’ acquisition of SiS contributed to an excellent result for 2011.

8 Jardine Matheson | Annual Report 2011
Jardine Motors is engaged in the sales and service of motor vehicles and related activities. It has operations in Hong Kong, Macau and the United Kingdom, and a large and growing presence in Southern China.
• Underlying profit down 29% to US$61 million• Record sales in Hong Kong• Lower margins impact Southern China• Weak UK market
Revenue Underlying profit
attributable to shareholdersShareholders’ funds
2011US$m
2010
US$m
2011US$m
2010
US$m
2011US$m
2010
US$m
Hong Kong, Macau and mainland China 2,315 1,851 59 69 242 187
United Kingdom 1,967 1,437 3 19 117 127
Corporate – – (1) (1) 3 1
4,282 3,288 61 87 362 315

9Jardine Matheson | Annual Report 2011
Managing Director’s Review (continued)
Jardine Motors recorded an underlying profit of US$61 million
in 2011, a reduction of 29% due to the poor trading conditions
in the United Kingdom and margin erosion in mainland China.
The 2010 comparative also included a gain of US$6 million
from property disposals. Including non-trading items, the
profit attributable to shareholders was US$68 million.
Zung Fu produced a fine performance in Hong Kong and
Macau with higher deliveries of Mercedes-Benz passenger
cars. Despite good volume growth in mainland China,
Zung Fu’s results were negatively impacted by lower margins.
Zung Fu now has 24 outlets in Southern China with a further
five under development. The group’s dealerships in the United
Kingdom continued to face weak demand with declining new
vehicles sales and lower margins.
Revenue (US$ million)
2,91107
2,67708
2,52209
3,28810
4,28211
Underlying Profit Attributable toShareholders (US$ million)
6407
4508
5209
8710
6111
Mercedes-Benz deliveries in Hong Kong and Macau reached record levels.

10 Jardine Matheson | Annual Report 2011
JLT is a leading insurance and reinsurance broker, risk specialist and employee benefits consultant. The UK-listed company combines specialist skills in the London and international insurance markets with an extensive network of offices worldwide.
• Underlying profit before tax up 13%• Good contributions from Asia and Latin America• Increased savings from business transformation project• Group interest increased
Jardine Lloyd Thompson performed well in 2011 in a
challenging trading environment as it benefited from further
organic growth and contributions from acquisitions. Total
revenue was US$1,315 million and profit before exceptional
items and tax was US$237 million, increases of 10% and
13%, respectively, in the company’s reporting currency. Profit
attributable to shareholders was US$143 million, compared
with US$140 million in 2010.
Jardine Lloyd Thompson’s Risk & Insurance group, comprising
its worldwide retail operations and its specialist, insurance,
wholesale and reinsurance broking businesses, produced
increases of 11% in revenue and 8% in underlying trading
profit. Its Latin American and Asian activities once again
achieved strong growth. The Employee Benefits business
also had a successful year, with revenue up 5% and a trading
margin rising from 17% to 19%.
JLT continues to invest for growth.

11Jardine Matheson | Annual Report 2011
Managing Director’s Review (continued)
2011
US$m
2010
US$m
Change*%
Total revenue 1,315 1,152 10
Underlying profit attributable to shareholders 160 136 13
Based on the change in UK sterling, being the reporting currency of Jardine Lloyd Thompson.*
Total Revenue (US$ million)
98407
1,01808
97109
1,15210
1,31511
Underlying Profit Attributable to Shareholders (US$ million)
11207
12008
11309
13610
16011

12 Jardine Matheson | Annual Report 2011
Hongkong Land is a major listed group with some 450,000 sq. m. of prime commercial property in the heart of Hong Kong. The group also develops high quality commercial and residential projects in other cities in the Region.
• Strong commercial leasing performance• Lower underlying profit due to fewer Singapore residential completions• Net assets per share up 22% on higher capital values• Prime commercial site secured in Beijing
Hongkong Land’s commercial property interests achieved
good growth in 2011, although profits from its residential
development activities were lower due to the timing of
completions. As a result, the company reported a 13% decline
in underlying profit for the year of US$703 million. Taking
into account the increase in the value of its investment
properties, profit attributable to shareholders for 2011 was
US$5,306 million, compared with US$4,739 million in 2010,
while net asset value per share rose 22%.
The Hong Kong commercial property market remained firm
in 2011 enabling Hongkong Land to achieve positive rental
reversions. At the year end its office vacancy stood at 2% and
its luxury retail portfolio was fully let. In Singapore, where
conditions were stable, the group benefited from a first full
year’s rental income from the Marina Bay Financial Centre
joint venture. A third tower in the project, which will complete
this year, is 65% pre-let. In Beijing, an iconic site has been
secured in Wangfujing which will be developed as a premier
retail centre including a small luxury hotel. In Cambodia, a
property portfolio has been acquired that includes two future
development sites in Phnom Penh.
In the residential sector, one project was completed in
Singapore, compared with three in 2010, and three new
projects were successfully launched for sale enabling a
US$44 million reversal of writedowns. There were also
contributions from developments in Hong Kong and Macau.
In mainland China, development profits were earned in
Beijing and Chongqing, where an additional site was secured
in December 2011. Mid-year sales launches in Chongqing
and Shenyang were well received, but sales volumes
in general have decreased significantly in response to
government measures.
2011 2010 Change (%)
Underlying profit attributable to shareholders (US$ million) 703 810 (13)
Net asset value per share (US$) 10.58 8.64 22
Full year’s contribution from Marina Bay Financial Centre in Singapore.

13Jardine Matheson | Annual Report 2011
Managing Director’s Review (continued)
Underlying Earnings per Share (US¢)
15.0207
16.4108
34.5509
36.0210
30.2911
Net Asset Value per Share (US$)
6.1207
5.9208
6.6409
8.6410
10.5811
Hong Kong Portfolio Average Monthly Office Rent (US$ per sq. ft)
6.3307
8.5208
10.8409
10.8510
11.2211

14 Jardine Matheson | Annual Report 2011
Dairy Farm is a leading pan-Asian retailer. The listed group, together with its associates and joint ventures, operates over 5,400 outlets – including supermarkets, hypermarkets, health and beauty stores, convenience stores, home furnishings stores and restaurants.
• Underlying profit up 16% to US$474 million• Earnings growth in all regions• Maxim’s performing well• Continued investment in business expansion
Stable trading environments in Dairy Farm’s major markets
across Asia led to strong sales and profits growth in 2011.
Sales, including 100% of associates, increased by 15% to
US$10.4 billion, while underlying profit for the year was up
16% at US$474 million. Favourable exchange movements
enhanced both sales and profit by 4%. The profit attributable
to shareholders, which rose 18% to US$484 million, included
a US$10 million non-trading gain arising from the disposal
by Maxim’s of its remaining interest in Starbucks in mainland
China. The group had net cash of US$466 million at the
year end.
There was a strong performance from the group’s operations
in North Asia with profit growth exceeding that of sales.
Mannings health and beauty stores produced another
excellent result in Hong Kong, while IKEA traded well in
both Hong Kong and Taiwan. A good result from East Asia
benefited from another fine contribution from the Guardian
health and beauty chain in Malaysia and particularly
pleasing performances from hypermarkets and supermarkets
in Indonesia. A steady performance was seen in South
Asia. Restaurant associate, Maxim’s, made an excellent
contribution, based on strong improvements in like-for-like
sales, despite facing increases in both food and wage costs.
Dairy Farm is seeking to expand its operations through
acquisitions, and in February 2012, agreed to acquire a 70%
equity interest in a supermarket chain in Cambodia. It is
also continuing to invest in the development of its business
with the modernization and standardization of its retail
processes and systems, the improvement of its supply chain
management, and the expansion of its offering of private
label products.
Dairy Farm’s supermarkets performed well across the Region.

15Jardine Matheson | Annual Report 2011
Managing Director’s Review (continued)
Gross Revenue* (US$ billion)
6.807
7.708
8.109
9.110
10.411
Underlying Profit Attributableto Shareholders (US$ million)
25807
32008
36409
41010
47411
Capital Expenditure and Investments (gross) (US$ million)
22307
30808
29209
27610
24311
2011 2010 Change (%)
Gross revenue* (US$ billion) 10.4 9.1 15
Underlying profit attributable to shareholders (US$ million) 474 410 16
Includes 100% of revenue from associates.*

16 Jardine Matheson | Annual Report 2011
Mandarin Oriental is a hotel investment and management group. It has a portfolio of 42 deluxe and first class hotels and resorts worldwide, including 15 under development, and has ‘Residences’ connected to a number of its properties. The listed company holds equity in selected hotels.
• Underlying profit rose to US$59 million• Improved performances in most markets, particularly Hong Kong• Significant contribution from ‘The Residences’ in London• Successful opening of Paris hotel
2011
US$m
2010
US$m
Change
%
Combined total revenue of hotels under management 1,196 1,026 17
Underlying profit attributable to shareholders 59 44 33

17Jardine Matheson | Annual Report 2011
Managing Director’s Review (continued)
Increased demand led to improved performances for
Mandarin Oriental, particularly in Asia and Europe.
Underlying profit for 2011 was up 33% at US$59 million.
The result included US$16 million in branding fees from
The Residences at Mandarin Oriental, London which helped
to offset the impact on earnings of reduced occupancy in
Tokyo and pre-opening costs in Paris. Profit attributable
to shareholders of US$67 million included US$8 million
of net non-trading profit, being primarily a gain of some
US$10 million representing the value of a long-term leasehold
interest in part of The Residences in London. There were no
non-trading items in 2010.
In Asia, the group’s hotels in Hong Kong and Singapore
traded well, but Bangkok was affected by the floods in
Thailand and Tokyo suffered low occupancy for a number of
months following the earthquake and tsunami. In Europe,
there were particularly strong performances in London and
Munich, while Mandarin Oriental, Paris opened in June 2011
to considerable acclaim. In The Americas, business levels
improved across the portfolio, although the rate of earnings
growth was lower than in the group’s other regions. Mandarin
Oriental will open in Guangzhou in the second half of 2012,
followed in 2013 by hotels in Taipei, Milan and Shanghai. The
group now has 27 hotels in operation and a further 15 under
development, including a recently announced property in
Bodrum, Turkey due to open in 2014.
* With freehold and leasehold properties at valuation.
Combined Total Revenue by Geographical Area (US$ million)
1,00807
1,01608
83809
1,02610
1,19611
Underlying Profit Attributable to Shareholders (US$ million)
8607
6708
1209
4410
5911
Net Asset Value per Share* (US$)
2.3407
2.0808
2.1809
2.3310
2.7011
Europe
North America
Other Asia
Hong Kong
Mandarin Oriental, Paris opened to great acclaim in June 2011.

18 Jardine Matheson | Annual Report 2011
Jardine Cycle & Carriage is a Singapore-listed company with an interest of just over 50% in Astra, a major listed Indonesian conglomerate, and other motor interests in Southeast Asia.
• Underlying profit up 25% to US$1,019 million• Good results from Indonesia and Singapore• Challenging market in Vietnam
Jardine Cycle & Carriage produced another excellent result
in 2011 with underlying profit up 25% at US$1,019 million.
Its profit attributable to shareholders of US$1,030 million
included a non-trading gain of US$11 million due to a fair
value gain on revaluation of Astra’s oil palm plantations.
Astra produced improved results in all its major businesses,
and its contribution to the underlying profit of Jardine Cycle &
Carriage was up 27% to US$1,011 million, benefiting in part
from a stronger rupiah on translation.
The contribution from the group’s other motor interests rose
10% to US$62 million. The results from Singapore improved
reflecting the strength of the Mercedes-Benz brand at a time
when government quotas reduced the size of the market.
Tunas Ridean had a good year as it benefited from the strong
consumer demand in Indonesia. In Malaysia, however,
Cycle & Carriage Bintang’s earnings were flat in the face of
competition. In Vietnam, while Truong Hai Auto Corporation
achieved a 26% increase in unit sales, its profit was lower
due to reduced margins as well as higher finance and
operating costs.
2011 2010 Change (%)
Revenue (US$ billion) 20.1 15.7 28
Underlying profit attributable to shareholders (US$ million) 1,019 812 25
Shareholders’ funds (US$ million) 4,407 3,743 18
Underlying Profit Attributable to Shareholders (US$ million)
38007
48308
52409
81210
1,01911

19Jardine Matheson | Annual Report 2011
Managing Director’s Review (continued)
• Record net profit of Rp17.8 trillion• Strong growth in automotive sector• Heavy equipment and mining contracting performed well• Palm oil produced profit growth
Astra enjoyed a record year in 2011 producing a net profit
under Indonesian accounting standards of Rp17.8 trillion,
up 24%, equivalent to US$2,027 million. Its progress
was supported by growth in the Indonesian economy
that benefited from increased domestic demand, strong
commodity prices and the availability of financing at
attractive interest rates, reflecting the country’s enhanced
global credit standing.
Net income from Astra’s automotive businesses grew by 13%
in local currency terms. Astra’s motor vehicle sales rose by
13% to 483,000 units, representing a market share of 54%
compared to 56% in 2010. Astra Honda Motor’s motorcycle
sales improved by 25% to 4.3 million units, with its market
share increasing from 46% to 53%. Increased manufacturing
capacity was introduced in both its motor vehicle and
motorcycle operations. Astra Otoparts reported a decline in
net income of 12% due to increased material costs and higher
marketing and branding expenses.
The net income from Astra’s financial services businesses
rose 26%. Astra’s finance operations benefited from loan
book growth in line with industry growth, reduced offshore
funding costs and a stable customer credit experience.
Astra is a listed diversified Indonesian group with interests in the automotive sector, financial services, heavy equipment and mining, oil palm plantations, infrastructure and logistics, and information technology.
2011 2010 Change* (%)
Gross revenue† (US$ billion) 29.2 22.9 23
Profit attributable to shareholders# (US$ million) 2,027 1,582 24
Shareholders’ funds# (US$ million) 6,666 5,484 23
Based on the change in Indonesian rupiah, being the reporting currency of Astra.
Includes 100% of revenue from associates and joint ventures.
Reported under Indonesian GAAP.
*†
#

20 Jardine Matheson | Annual Report 2011
Insurance company, Asuransi Astra Buana, benefited from
higher premiums, while Astra’s joint venture, Bank Permata,
reported net income rising 15%.
United Tractors’ net income was up 52% as its Komatsu
heavy equipment business sold 8,467 units, a rise of 57%.
Its contract mining operations achieved an increase in coal
production of 11% to 87 million tonnes and an increase
in overburden removal of 22% to 796 million bcm. United
Tractors also sold 4.5 million tonnes of coal produced from
its own mines and acquired a further five concessions with
estimated reserves of between 250 and 370 million tonnes.
Astra Agro Lestari reported earnings up 19% as palm oil
production rose 14% and average prices achieved were
8% higher.
There was some improvement in the contribution from
infrastructure and logistics as well as from information
technology activities. A 95% stake in a greenfield 40 km toll
road near Surabaya was acquired during the year, and the
total project cost is expected to be some US$400 million.
Astra (continued)
Motor Vehicle Sales including Associates and Joint Ventures(thousand units)
22307
31808
28109
42610
48311
Motorcycle Sales including Associatesand Joint Ventures (thousand units)
2,14207
2,87508
2,70109
3,41610
4,27411
Gross Revenue† (US$ billion)
12.307
16.008
15.309
22.910
29.211
† Includes 100% of revenue from associates and joint ventures.

21Jardine Matheson | Annual Report 2011
Managing Director’s Review (continued)
Further Interests
Rothschilds Continuation
Rothschilds Continuation, in which Jardine Strategic holds
a 21% interest, is the holding company of an independent
global financial advisory group with 51 offices in 40 countries
worldwide. In common with most financial institutions, the
company has continued to face challenging markets during
2011. Despite this, it has maintained its market share and
is well positioned in the areas of financial advisory, wealth
management, and merchant banking.
Other
ACLEDA Bank of Cambodia, in which Jardine Strategic holds a
12% stake, achieved a record profit in 2011 and is optimistic
of further growth in 2012. Similarly, Asia Commercial Bank,
which is 7% held, performed creditably as Vietnam faced
up to the challenge of restoring balanced growth while
containing inflation.
In India, Tata Power’s large generation projects are
progressing to completion, while its business is benefiting
from stable Indian utility earnings and increasing returns
from its Indonesian coal investments. Jardine Strategic has a
3% investment.
Anthony Nightingale
Managing Director
2nd March 2012

22 Jardine Matheson | Annual Report 2011
People and the Community
Jardine Matheson Group companies actively seek opportunities to serve the communities in which they operate through a wide range of philanthropic activities.
In Hong Kong, mainland China and
Singapore, Group companies focus
their philanthropic activities on the area
of mental health through MINDSET,
the Group’s in-house charitable
organization. Led by the Jardine
Ambassadors, young executives drawn
from across the Group, the MINDSET
programme aims to raise awareness
and understanding of mental health
issues, while at the same time providing
practical support in this under-
resourced area.
MINDSET remained active in 2011. In
Hong Kong, following the opening of
MINDSET Place in 2010, a residential
care home for 38 rehabilitated
individuals, the Jardine Ambassadors
conducted a number of activities with
the residents, which included joining
them in delivering new year gifts to
the elderly in the local community.
A donation was made to support the
setting up of a Child & Adolescent
Mental Health Centre in a local hospital.
Its school-based Health in Mind
programme, undertaken in collaboration
with the Hong Kong Hospital Authority,
has entered into its tenth year. Students
are empowered as ‘advocates’ to
promote mental health to their fellow
pupils and to raise the awareness of
mental health issues among young
people. The programme reached 22
secondary schools in 2011 with the
participation of more than 300 students.
In mainland China, MINDSET
concluded its three-year funding
support for school children affected
by the 2008 earthquake in Sichuan
through the provision of integrated
services provided by the Hong Kong
Polytechnic University.
Group companies in Hong Kong also
offered job training opportunities for
rehabilitated individuals, preparing
them for a return to the workforce.
In addition, MINDSET funded a
number of projects that benefited the
mentally ill, their carers and families.
(www.mindset.org.hk)
In late 2010, MINDSET Singapore was
launched with 15 Jardine Ambassadors
participating in the programme.
Four Fun Days were hosted for the
beneficiaries of three major NGO
partners. To promote reintegration,
internal forums were arranged for
Group companies regarding job
placement for rehabilitated individuals,
and the first successful candidates
have been placed. It also partnered
with selected NGOs to help promote
and sell products made by the service
users in social enterprises.
In Indonesia, Astra provided free
medical services for more than
5,000 patients from disadvantaged
communities. The company also
extended an US$584,000 relief
aid package to the reconstruction
programme following the Mount
Merapi eruption in November 2011.
In the United Kingdom, Jardine
Lloyd Thompson has extended its
charitable activities to Mumbai,
where its employees in its Mumbai
office provided transportation for
underprivileged children to and from
the local Udaan school, and spent time
teaching and coaching the children.
Globally the group also encouraged
its staff to be involved in community
projects and matched money raised by
employees for charitable causes.Student advocates of the Health in Mind programme take service users to a traditional Chinese pastry shop during the City Orienteering programme.

23Jardine Matheson | Annual Report 2011
Providing ExpertiseGroup executives are active on external
management boards and professional
and advisory bodies where they
provide expertise and knowledge.
These activities are encouraged as they
contribute to the development of the
communities and the business sectors
in which the Group operates.
Supporting our PeopleThe Group supports its people with
various management training and
development programmes. A good
example is the central recruitment
of graduates who attain a Chartered
Institute of Management Accountants
qualification at the end of their
first three years with the Group; an
approach that brings rare balance of
management breadth and financial
depth, and readies them for leadership
positions. A similar scheme has now
been launched specifically targeting
graduates from mainland China, who
will subsequently work in the Group’s
businesses. Another example is the
Director Development Initiative, which
provides senior executives with the
opportunity to meet chief executives
from some of the world’s most
admired companies.
The Group also conducts a series of
development centres every year to
identify talent within the organization.
In 2011 these were supplemented by
a cross-Group performance coaching
process, designed to benefit those
identified as having the potential for
larger roles.
Encouraging Higher EducationIn January 2012, 15 students from
Hong Kong, Bermuda, Indonesia,
mainland China, Singapore and the
Philippines were awarded scholarships
by the Jardine Foundation to pursue
their studies in the United Kingdom.
Scholarships are available for selected
colleges at Oxford and Cambridge
Universities, and scholars are
chosen for their academic ability,
leadership qualities and community
participation. Since its establishment,
some 135 scholarships have been
awarded to students from the
regions in which the Group operates.
(www.jardine-foundation.org)
In Indonesia, Astra distributed
scholarships through a number of
foundations. Michael D. Ruslim –
Astra Education Foundation supported
27 elementary schools, seven junior
high schools and one senior high
school by providing training for 519
teachers and benefiting some 8,400
students from undeveloped areas.
Meanwhile, in Singapore, Jardine Cycle
& Carriage scholarships are awarded
yearly to three outstanding business
management undergraduates.
Children from a primary school in Hanwang, Sichuan benefit from the integrated services provided by social workers in a programme financed by MINDSET.

24 Jardine Matheson | Annual Report 2011
Financial Review
Summarized Cash Flow
2011 2010US$m US$m
Operating cash flow of subsidiaries 1,938 1,474Dividends from associates and joint ventures 736 736Operating activities 2,674 2,210Capital expenditure and investments (2,675) (1,372)
Cash flow before financing (1) 838
Accounting PoliciesThe Directors continue to review the
appropriateness of the accounting
policies adopted by the Group having
regard to developments in International
Financial Reporting Standards. In 2011,
a number of amendments to these
standards became effective and
the Group adopted those which are
relevant to the Group’s operations.
As mentioned in note 1 to the financial
statements, their adoption does not
have a material impact on the Group’s
accounting policies.
ResultsIn 2011, revenue increased by 26%
to US$38.0 billion. Gross revenue,
including 100% of revenue from
associates and joint ventures, which is
a better measure of the extent of the
Group’s operations, increased by 22%
to US$57.3 billion.
Underlying operating profit was
US$3,909 million, an increase of
US$519 million or 15%. This reflected
increased contributions from most
of the businesses, in particular
increases of US$494 million from
Astra on strong performances from
automotive, heavy equipment and
financial services; US$66 million
from Dairy Farm with sales growths
in all its key markets; US$17 million
from Jardine Pacific due mainly to the
contribution from the SiS IT distribution
business acquired by JOS in January
2011; US$15 million from Mandarin
Oriental, offset by a reduction in
contributions of US$50 million from
Hongkong Land due to the reduced
number of residential completions and
US$27 million from Jardine Motors due
to difficult market conditions in the
United Kingdom and margin erosion in
mainland China.
The operating profit of US$8,381 million
included a number of non-trading
items, by far the largest of which
was the increase in the fair value of
investment properties in Hongkong
Land and Jardine Pacific.
Net financing charges decreased
slightly over 2010 primarily due to
lower interest rates. Interest cover
remained strong at 40 times, calculated
as the underlying operating profit,
including the share of results of
associates and joint ventures, divided
by net financing charges.
The Group’s share of underlying results
of associates and joint ventures
increased by 3% to US$998 million.
The impact of less residential property
completions in Hongkong Land’s
joint ventures was more than offset
by higher contributions from the
associates and joint ventures of Astra,
Jardine Pacific and Dairy Farm.
The overall contribution from the
Group’s associates and joint ventures
included a number of non-trading
items, among which were increases in
the fair value of investment properties
held by Hongkong Land’s associates
and joint ventures and Dairy Farm’s
share of the gain on sale by Maxim’s
of its remaining interest in Starbucks
in mainland China, partly offset by an
asset impairment in Hongkong Land.
The underlying effective tax rate for the
year was 23%, which is in line with that
of last year.

25Jardine Matheson | Annual Report 2011
Underlying earnings per share
increased by 9% to US$4.13.
The growth of US$131 million in
underlying earnings was due to
increased contributions from most
businesses, in particular increases of
US$23 million from Jardine Pacific;
US$42 million from Dairy Farm;
US$8 million from Mandarin Oriental
and US$124 million from Astra, partly
offset by a reduction in contributions of
US$26 million from Jardine Motors and
US$43 million from Hongkong Land.
The profit attributable to shareholders
for the year of US$3,449 million
included the surplus of US$1,924 million
on the revaluation of investment
properties in Hongkong Land and
Jardine Pacific, gains from property
disposals of US$14 million in Jardine
Pacific and an increase of US$6 million
in the fair value of Astra’s plantations.
Earnings per share were US$9.53, an
increase of 11%.
DividendsThe Board is recommending a final
dividend of US$0.92 per share, giving
a total dividend of US$1.25 per share
for the year, payable on 16th May
2012 to those persons registered as
shareholders on 16th March 2012. The
dividends are payable in cash with a
scrip alternative.
Cash FlowThe cash inflow from operating
activities for the year was
US$2,674 million. This represented an
increase of US$464 million on 2010
principally due to higher operating
profit, partly offset by the increase in
the level of working capital due in part
to higher financing debtors in Astra’s
motor finance businesses.
Capital expenditure for the year
before disposals amounted to
US$2,962 million and was broadly
spread throughout the Group. This
included US$363 million for the
purchase of subsidiaries, the main
ones being the acquisition by Astra of
a coal mine concession company and
a toll road company, the acquisition
by Jardine Pacific of an IT distribution
group and the acquisition by Jardine
Motors of a motor retail group in the
United Kingdom; US$276 million for
the acquisition of an additional 10%
interest in Jardine Lloyd Thompson;
US$86 million for the purchase of
additional stakes in various associates
and joint ventures; US$265 million for
the purchase of other investments,
mainly in Jardine Cycle & Carriage and
Astra; US$255 million for the purchase
of intangible assets, which included
US$120 million for the purchase of
leasehold land mainly for use by
new motor dealerships in Astra;
US$1,280 million for the purchase
of tangible assets, which included
US$64 million in Jardine Motors,
US$214 million in Dairy Farm,
US$62 million in Mandarin Oriental and
US$903 million in Astra mainly for the
acquisition of some US$600 million
heavy equipment and machinery
predominately by Pamapersada
Nusantara in response to capacity
expansion in its mine contracting
business and US$270 million in
the fleet of motor vehicles held
for lease by Serasi Autoraya in
response to increased customer
demand; US$87 million for additions
to investment properties mainly in
Hongkong Land; US$91 million for the
investment in plantations in Astra;
and US$259 million of advances to
associates and joint ventures, mainly in
Hongkong Land.
The repayment from associates and
joint ventures in Hongkong Land
and sale of other investments in
Astra contributed US$111 million and
US$124 million, respectively, to the
Group’s cash flow.
In addition to the above capital
expenditure, the Group purchased
additional interests in group companies
for a total cost of US$526 million which
is presented as financing activities in
the cash flow statement.

26 Jardine Matheson | Annual Report 2011
Financial Review (continued)
FundingAt the year end, undrawn committed
facilities totaled US$4.2 billion. In
addition, the Group had available
liquid funds of US$4.2 billion. Net
borrowings, excluding those relating to
Astra’s financial services companies,
were US$2.4 billion, representing 6%
of total equity. Astra’s financial services
companies had net borrowings of
US$3.4 billion, US$1.1 billion up from
2010 as their overall loan book grew.
The Group’s total equity increased
by US$7.3 billion to US$39.3 billion
during the year.
The average tenor of the Group’s
debt at 31st December 2011 was
6.2 years compared with 4.2 years
at the end of 2010. US dollar
denominated borrowings comprised
11% of the Group’s total borrowings.
Non-US dollar denominated borrowings
are directly related to the Group’s
businesses in the countries of the
currencies concerned. As at 31st
December 2011 approximately 54% of
the Group’s borrowings, exclusive of
financial services companies, were at
floating rates and the remaining 46%
were covered by interest rate hedges
with major creditworthy financial
institutions and fixed rate borrowings.
Overall, the Group’s funding
arrangements are designed to keep an
appropriate balance between equity
and debt, both short and long term, to
give flexibility to develop the business.
Treasury PolicyThe Group manages its exposure
to financial risk using a variety of
techniques and instruments. The
main objectives are to limit exchange
and interest rate risks and to provide
a degree of certainty about costs.
The investment of the Group’s cash
resources is managed so as to minimize
risk while seeking to enhance yield.
Principal Risks and UncertaintiesA review of the principal risks and
uncertainties facing the Group is set
out on page 102.
James Riley
Group Finance Director
2nd March 2012
*Excluding net debt of financial services companies
Net Debt Total Equity
Net Debt* and Total Equity(US$ billion)
1139.3
2.4
102.3
092.2
080.5
070.6
14.4
14.2
25.1
32.0

27Jardine Matheson | Annual Report 2011
Directors’ Profiles
Sir Henry Keswick*ChairmanSir Henry joined the Group in 1961 and has been a Director of its holding company since 1967. He is chairman of Matheson & Co. and Jardine Strategic, and a director of Dairy Farm, Hongkong Land and Mandarin Oriental. He is also vice chairman of the Hong Kong Association.
Ben Keswick*Managing DirectorMr Ben Keswick joined the Board in 2007 and was appointed as Managing Director in April 2012. He has held a number of executive positions since joining the Group in 1998, including finance director and then chief executive officer of Jardine Pacific between 2003 and 2007 and, thereafter, group managing director of Jardine Cycle & Carriage until March 2012. He has an MBA from INSEAD. Mr Keswick is chairman of Jardine Matheson Limited and Jardine Cycle & Carriage and a commissioner of Astra and United Tractors. He is also managing director of Dairy Farm, Hongkong Land, Jardine Strategic and Mandarin Oriental, and a director of Jardine Pacific and Jardine Motors.
Adam Keswick*Deputy Managing DirectorMr Adam Keswick joined the Board in 2007 and was appointed Deputy Managing Director in April 2012. He is chairman of Jardine Pacific and chairman and chief executive of Jardine Motors. He has held a number of executive positions since joining the Group from N M Rothschild & Sons in 2001, including group strategy director and, thereafter, group managing director of Jardine Cycle & Carriage between 2003 and 2007. Mr Keswick is also deputy chairman of Jardine Matheson Limited, and a director of Dairy Farm, Hongkong Land, Jardine Strategic, Mandarin Oriental and Rothschilds Continuation.
Mark Greenberg*Mr Greenberg joined the Board as Group Strategy Director in 2008 having first joined the Group in 2006. He had previously spent 16 years in investment banking with Dresdner Kleinwort Wasserstein in London. He is a director of Jardine Matheson Limited, Dairy Farm, Hongkong Land, Jardine Cycle & Carriage and Mandarin Oriental, and a commissioner of Astra and Bank Permata.
Jenkin HuiMr Hui was appointed a Director in 2003. He is a director of Hongkong Land, Jardine Strategic, Central Development and a number of property and investment companies.
Simon Keswick*Mr Simon Keswick joined the Group in 1962 and has been a Director of its holding company since 1972. He is a director of Matheson & Co., chairman of Dairy Farm, Hongkong Land and Mandarin Oriental, and a director of Jardine Lloyd Thompson and Jardine Strategic.
Lord Leach of Fairford*Lord Leach joined the Board in 1984 after a career in banking and merchant banking. He is a director of Matheson & Co., deputy chairman of Jardine Lloyd Thompson, and a director of Dairy Farm, Hongkong Land, Jardine Strategic, Mandarin Oriental and Rothschilds Continuation.
Dr Richard LeeDr Lee joined the Board in 1999. Dr Lee’s principal business interests are in the manufacturing of textiles and apparel in Southeast Asia, and he is the chairman of TAL Apparel. He is also a director of Hongkong Land and Mandarin Oriental.
A.J.L. NightingaleMr Nightingale joined the Board in 1994 and was Managing Director of the Company from 2006 to March 2012. He held a number of senior positions since first joining the Group in 1969 until his retirement from executive office in March 2012. He is also a director of Dairy Farm, Hongkong Land, Jardine Cycle & Carriage, Jardine Strategic and Mandarin Oriental and a commissioner of Astra. Mr Nightingale is also a member of the Commission on Strategic Development, a member of the Committee on Strategic Enhancement of Hong Kong as an International Financial Centre, a vice president of The Real Estate Developers Association of Hong Kong, a council member of the Employers’ Federation of Hong Kong, a Hong Kong representative to the APEC Business Advisory Council, a member of Chongqing Mayor’s International Economic Advisory Council and a member of the UK ASEAN Business Council Advisory Panel. He is also chairman of The Sailors Home and Missions to Seamen in Hong Kong.
Y.K. Pang*Mr Pang joined the Board in April 2011. He was appointed chief executive of Hongkong Land in 2007. He previously held a number of senior executive positions in the Group, which he joined in 1984. He is a director of Jardine Matheson Limited and Jardine Matheson (China) Limited. He is also chairman of the Employers’ Federation of Hong Kong and vice chairman of the Hong Kong General Chamber of Commerce.
James Riley*Mr Riley joined the Board as Group Finance Director in 2007, having been Chief Financial Officer since 2005. A Chartered Accountant, he joined the Group from Kleinwort Benson in 1993. He was appointed chief financial officer of Jardine Cycle & Carriage in 1994, and in 1999 he took over responsibility for the businesses grouped under Jardine Pacific. He is also a director of Jardine Matheson Limited, Dairy Farm and The Hongkong and Shanghai Banking Corporation Limited.
Percy WeatherallMr Weatherall first joined the Company in 1976 and was appointed to the Board in 1999 before being made Managing Director in 2000. He retired from executive office in 2006. He is also a director of Matheson & Co., Dairy Farm, Hongkong Land, Jardine Strategic and Mandarin Oriental. He is chairman of Corney and Barrow.
Giles White*Mr White was appointed to the Board in January 2010, having first joined the Group as Group General Counsel in 2009. He was previously Asia managing partner of Linklaters based in Hong Kong, prior to which he was the firm’s head of global finance and projects in London. Mr White is also a director of Jardine Matheson Limited, Dairy Farm and Mandarin Oriental.
Executive Director
Company Secretary and Registered OfficeJohn C. LangJardine House, 33-35 Reid StreetHamiltonBermuda
1st April 2012
*

28 Jardine Matheson | Annual Report 2011
Consolidated Profit and Loss Accountfor the year ended 31st December 2011
2011 2010
Underlyingbusiness
performanceNon-trading
items
Underlyingbusiness
performanceNon-trading
itemsTotal TotalNote US$m US$m US$m US$m US$m US$m
Revenue 5 37,967 – 37,967 30,053 – 30,053Net operating costs 6 (34,058) 65 (33,993) (26,663) 442 (26,221)Change in fair value of investment properties – 4,407 4,407 – 3,216 3,216Operating profit 3,909 4,472 8,381 3,390 3,658 7,048Net financing charges 7
– financing charges (251) – (251) (232) – (232)– financing income 128 – 128 101 – 101
(123) – (123) (131) – (131)Share of results of associates and joint ventures 8
– before change in fair value of investment properties 998 (6) 992 973 7 980– change in fair value of investment properties – 238 238 – 731 731
998 232 1,230 973 738 1,711Sale of associates and joint ventures – – – – 3 3Profit before tax 4,784 4,704 9,488 4,232 4,399 8,631Tax 9 (862) (11) (873) (741) (106) (847)
Profit after tax 3,922 4,693 8,615 3,491 4,293 7,784
Attributable to:Shareholders of the Company 10 & 11 1,495 1,954 3,449 1,364 1,720 3,084Non-controlling interests 2,427 2,739 5,166 2,127 2,573 4,700
3,922 4,693 8,615 3,491 4,293 7,784
US$ US$ US$ US$
Earnings per share 10
– basic 4.13 9.53 3.80 8.58– diluted 4.11 9.46 3.77 8.34

29Jardine Matheson | Annual Report 2011
Consolidated Statement of Comprehensive Incomefor the year ended 31st December 2011
2011 2010Note US$m US$m
Profit for the year 8,615 7,784Revaluation surpluses before transfer to investment properties from– intangible assets 12 27 –– tangible assets 13 4 –
31 –Revaluation of other investments– net (loss)/gain arising during the year 17 (84) 70– transfer to profit and loss (20) (14)
(104) 56Net actuarial (loss)/gain on employee benefit plans (150) 23Net exchange translation differences– (losses)/gains arising during the year (74) 223Cash flow hedges– net loss arising during the year – (6)– transfer to profit and loss 7 9
7 3Share of other comprehensive (expense)/income of associates and joint ventures 16 (130) 253Tax relating to components of other comprehensive income or expense 9 21 (8)Other comprehensive (expense)/income for the year (399) 550
Total comprehensive income for the year 8,216 8,334
Attributable to:Shareholders of the Company 3,153 3,279Non-controlling interests 5,063 5,055
8,216 8,334

30 Jardine Matheson | Annual Report 2011
Consolidated Balance Sheetat 31st December 2011
At 31st December2011 2010
Note US$m US$m
AssetsIntangible assets 12 2,310 1,958Tangible assets 13 5,924 4,816Investment properties 14 22,979 18,426Plantations 15 1,058 954Associates and joint ventures 16 7,256 6,385Other investments 17 1,095 1,044Non-current debtors 18 2,512 1,898Deferred tax assets 19 181 133Pension assets 20 34 102Non-current assets 43,349 35,716
Properties for sale 21 1,521 1,184Stocks and work in progress 22 3,276 2,680Current debtors 18 5,845 4,085Current investments 17 5 6Current tax assets 69 130Bank balances and other liquid funds 23
– non-financial services companies 3,963 4,099– financial services companies 222 176
4,185 4,27514,901 12,360
Non-current assets classified as held for sale 24 47 –Current assets 14,948 12,360
Total assets 58,297 48,076
Approved by the Board of Directors
A.J.L. NightingaleJames RileyDirectors
2nd March 2012

31Jardine Matheson | Annual Report 2011
At 31st December2011 2010
Note US$m US$m
EquityShare capital 25 165 162Share premium and capital reserves 27 82 69Revenue and other reserves 17,964 14,980Own shares held 29 (1,855) (1,501)Shareholders’ funds 16,356 13,710Non-controlling interests 30 22,906 18,250Total equity 39,262 31,960
LiabilitiesLong-term borrowings 31
– non-financial services companies 5,048 4,294– financial services companies 2,002 1,128
7,050 5,422Deferred tax liabilities 19 653 572Pension liabilities 20 259 176Non-current creditors 32 289 216Non-current provisions 33 112 94Non-current liabilities 8,363 6,480
Current creditors 32 7,275 5,848Current borrowings 31
– non-financial services companies 1,347 2,057– financial services companies 1,670 1,403
3,017 3,460Current tax liabilities 323 273Current provisions 33 57 55Current liabilities 10,672 9,636
Total liabilities 19,035 16,116
Total equity and liabilities 58,297 48,076

32 Jardine Matheson | Annual Report 2011 33Jardine Matheson | Annual Report 2011
Consolidated Statement of Changes in Equityfor the year ended 31st December 2011
Sharecapital
Sharepremium
Capitalreserves
Revenuereserves
Assetrevaluation
reservesHedgingreserves
Exchangereserves
Ownshares
held
Attributable toshareholders of
the Company
Attributable tonon-controlling
interestsTotal
equityUS$m US$m US$m US$m US$m US$m US$m US$m US$m US$m US$m
2011At 1st January 162 10 59 14,723 159 (34) 132 (1,501) 13,710 18,250 31,960Total comprehensive income – – – 3,210 9 (6) (60) – 3,153 5,063 8,216Dividends paid by the Company – – – (427) – – – – (427) 77 (350)Dividends paid to non-controlling interests – – – – – – – – – (935) (935)Unclaimed dividends forfeited – – – 3 – – – – 3 – 3Issue of shares – 1 – – – – – – 1 – 1Employee share option schemes – – 15 – – – – – 15 2 17Scrip issued in lieu of dividends 3 (3) – 523 – – – – 523 – 523Increase in own shares held – – – – – – – (354) (354) (64) (418)Subsidiaries acquired – – – – – – – – – 140 140Conversion of convertible bonds in a subsidiary – – – – – – – – – 319 319Capital contribution from non-controlling interests – – – – – – – – – 315 315Purchase of additional interests in subsidiaries – – – (266) – – – – (266) (260) (526)Change in interests in associates and joint ventures – – – (2) – – – – (2) (1) (3)Transfer – – – (1) – – 1 – – – –
At 31st December 165 8 74 17,763 168 (40) 73 (1,855) 16,356 22,906 39,262
2010At 1st January 159 4 44 11,611 159 (25) (28) (1,230) 10,694 14,446 25,140Total comprehensive income – – – 3,128 – (9) 160 – 3,279 5,055 8,334Dividends paid by the Company – – – (341) – – – – (341) 61 (280)Dividends paid to non-controlling interests – – – – – – – – – (780) (780)Issue of shares – 6 – – – – – – 6 – 6Employee share option schemes – 2 16 – – – – – 18 2 20Scrip issued in lieu of dividends 3 (3) – 388 – – – – 388 – 388Increase in own shares held – – – – – – – (271) (271) (58) (329)Subsidiaries disposed of – – – – – – – – – (10) (10)Conversion of convertible bonds in a subsidiary – – – – – – – – – 5 5Capital contribution from non-controlling interests – – – – – – – – – 16 16Purchase of additional interests in subsidiaries – – – (63) – – – – (63) (487) (550)Transfer – 1 (1) – – – – – – – –
At 31st December 162 10 59 14,723 159 (34) 132 (1,501) 13,710 18,250 31,960
Total comprehensive income included in revenue reserves comprises profit attributable to shareholders of the Company of US$3,449 million (2010: US$3,084 million), net fair value loss on other investments of US$79 million (2010: gain of US$34 million) and net actuarial loss on employee benefit plans of US$160 million (2010: gain of US$10 million). Cumulative net fair value gain on other investments and net actuarial loss on employee benefit plans amounted to US$126 million (2010: US$205 million) and US$387 million (2010: US$227 million), respectively.

34 Jardine Matheson | Annual Report 2011
Consolidated Cash Flow Statementfor the year ended 31st December 2011
2011 2010Note US$m US$m
Operating activitiesOperating profit 8,381 7,048Change in fair value of investment properties (4,407) (3,216)Depreciation and amortization 34 (a) 914 762Other non-cash items 34 (b) 116 (271)Increase in working capital 34 (c) (2,139) (1,874)Interest received 130 104Interest and other financing charges paid (249) (214)Tax paid (808) (865)
1,938 1,474Dividends from associates and joint ventures 736 736Cash flows from operating activities 2,674 2,210
Investing activitiesPurchase of subsidiaries 34 (d) (363) (51)Purchase of shares in Jardine Lloyd Thompson 34 (e) (276) (5)Purchase of other associates and joint ventures 34 (f) (86) (228)Purchase of other investments 34 (g) (265) (231)Purchase of intangible assets (255) (160)Purchase of tangible assets (1,280) (868)Purchase of investment properties (87) (33)Additions to plantations (91) (87)Advance to associates, joint ventures and others 34 (h) (259) (223)Repayment from associates, joint ventures and others 34 (i) 115 286Sale of subsidiaries 34 (j) 4 21Sale of associates and joint ventures 1 –Sale of other investments 34 (k) 124 110Sale of intangible assets – 2Sale of tangible assets 39 77Sale of investment properties 4 18Cash flows from investing activities (2,675) (1,372)
Financing activitiesIssue of shares 1 6Capital contribution from non-controlling interests 315 16Repayment to non-controlling interests (6) (11)Purchase of additional interests in subsidiaries 34 (l) (526) (550)Drawdown of borrowings 17,914 10,874Repayment of borrowings (16,602) (10,040)Dividends paid by the Company (244) (220)Dividends paid to non-controlling interests (935) (780)Cash flows from financing activities (83) (705)Net increase in cash and cash equivalents (84) 133Cash and cash equivalents at 1st January 4,278 4,077Effect of exchange rate changes (26) 68
Cash and cash equivalents at 31st December 34 (m) 4,168 4,278

35Jardine Matheson | Annual Report 2011
Notes to the Financial Statements
1 Principal Accounting PoliciesBasis of preparationThe financial statements have been prepared in accordance with International Financial Reporting Standards, including International Accounting Standards and Interpretations adopted by the International Accounting Standards Board. The financial statements have been prepared under the historical cost convention except as disclosed in the accounting policies below.
Standards, amendments and interpretations effective in 2011 which are relevant to the Group’s operations
Revised IAS 24 Related Party DisclosuresAmendment to IAS 32 Classification of Rights IssuesAmendments to IFRIC 14 Prepayments of a Minimum Funding RequirementIFRIC 19 Extinguishing Financial Liabilities with Equity InstrumentsImprovements to IFRSs (2010)
The adoption of these standards, amendments and interpretations does not have a material impact on the Group’s accounting policies.
Revised IAS 24 ‘Related Party Disclosures’ supersedes IAS 24 (as revised in 2003). It simplifies the disclosure requirements for government-related entities and clarifies the definition of a related party.
Amendment to IAS 32 ‘Classification of Rights Issues’ clarifies that rights issues are equity instruments when they are denominated in a currency other than the issuer’s functional currency and are issued pro-rata to an entity’s existing shareholders for a fixed amount of currency.
Amendments to IFRIC 14 ‘Prepayments of a Minimum Funding Requirement’ require an entity to recognize an asset for a prepayment that will reduce future minimum funding contributions required by the entity.
IFRIC 19 ‘Extinguishing Financial Liabilities with Equity Instruments’ provides guidance on the application of IAS 39 and IAS 32 when an entity issues its own equity instruments to extinguish all or part of a financial liability.
The Improvements to IFRSs (2010) comprise a number of non-urgent but necessary amendments to IFRSs. The amendments which are relevant to the Group’s operations include IFRS 3 (amendments) ‘Business Combinations’, IFRS 7 (amendments) ‘Financial Instruments: Disclosures’, IAS 1 (amendments) ‘Presentation of Financial Statements’, IAS 34 (amendments) ‘Interim Financial Reporting’ and IFRIC 13 (amendment) ‘Customer Loyalty Programmes’.
IFRS 3 (amendments) ‘Business Combinations’ clarify the transition requirements for contingent consideration from business combination that occurred before the effective date of the revised IFRS, the measurement of non-controlling interests and un-replaced and voluntarily replaced share-based payment awards.
IFRS 7 (amendments) ‘Financial Instruments: Disclosures’ emphasize the interaction between qualitative and quantitative disclosures and the nature and extent of risks associated with financial instruments.
IAS 1 (amendments) ‘Presentation of Financial Statements’ clarify that entities may present the required reconciliations for each component of other comprehensive income either in the statement of changes in equity or in the notes to the financial statements.
IAS 34 (amendments) ‘Interim Financial Reporting’ provide guidance to illustrate how to apply disclosure principles in IAS 34 and add disclosure requirements around the circumstances likely to affect fair values of financial instruments and their classification, transfers of financial instruments between different levels of fair value hierarchy, changes in classification of financial assets and changes in contingent liabilities and assets.
IFRIC 13 (amendment) ‘Customer Loyalty Programmes’ clarifies that when the fair value of award credits is measured on the basis of the value of the awards for which they could be redeemed, the fair value of the award credits should take account of expected forfeitures as well as the discounts or incentives that would otherwise be offered to customers who have not earned award credits from an initial sale.

36 Jardine Matheson | Annual Report 2011
Notes to the Financial Statements (continued)
Standards and amendments effective after 2011 which are relevant to the Group’s operations and yet to be adopted
Amendments to IFRS 7 Financial Instruments: Disclosures on DerecognitionIFRS 9 Financial InstrumentsIFRS 10 Consolidated Financial StatementsIFRS 11 Joint ArrangementsIFRS 12 Disclosure of Interests in Other EntitiesIFRS 13 Fair Value MeasurementAmendments to IAS 1 Presentation of Items of Other Comprehensive IncomeIAS 19 (amended 2011) Employee BenefitsIAS 27 (2011) Separate Financial StatementsIAS 28 (2011) Investments in Associates and Joint VenturesIFRIC 20 Stripping Costs in the Production Phase of a Surface Mine
Amendments to IFRS 7 ‘Financial Instruments: Disclosures on Derecognition’ (effective for annual period beginning 1st July 2011) promotes transparency in the reporting of transfer transactions and improves users’ understanding of the risk exposures relating to transfer of financial assets and the effect of those risks on an entity’s financial position particularly those involving securitization of financial assets.
IFRS 9 ‘Financial Instruments’ (effective 1st January 2015) is the first standard issued as part of a wider project to replace IAS 39. IFRS 9 (2009) retains but simplifies the mixed measurement model and establishes two primary measurement categories for financial assets: amortized cost and fair value. The basis of classification depends on the entity’s business model and the contractual cash flow characteristics of the financial asset. The guidance in IAS 39 on impairment of financial assets and hedge accounting continues to apply. IFRS 9 (2010) adds the requirements related to the classification and measurement of financial liabilities, and derecognition of financial assets and liabilities, to the version issued in November 2009. It also includes those paragraphs of IAS 39 dealing with how to measure fair value and accounting for derivatives embedded in a contract that contains a host that is not a financial asset, as well as the requirements of IFRIC 9 ‘Remeasurement of Embedded Derivatives’. The Group has yet to assess the full impact of IFRS 9 and will apply the standard from 1st January 2015.
IFRS 10 ‘Consolidated Financial Statements’ (effective 1st January 2013) replaces SIC Interpretation 12 ‘Consolidation – Special Purpose Entities’ and most of IAS 27 ‘Consolidated and Separate Financial Statements’. It contains a new single consolidation model that identifies control as the basis for consolidation for all types of entities. It provides a definition of control that comprises the elements of power over an investee; exposure of rights to variable returns from an investees; and ability to use power to affect the reporting entity’s returns. The Group has yet to assess the full impact of IFRS 10 and will apply the standard from 1st January 2013.
IFRS 11 ‘Joint Arrangements’ (effective 1st January 2013) replaces IAS 31 ‘Interests in Joint Ventures’ and classifies joint arrangements as either joint operations (whereby the parties that have joint control have rights to the assets and obligations for the liabilities of the joint arrangements) or joint ventures (whereby the parties that have joint control have rights to the net assets of the joint arrangements). It prescribes the accounting for interests in joint operations as its interest in the assets, liabilities, revenues and expenses. The current option permitted by IAS 28 (amended) to proportionately consolidate for joint ventures is no longer permitted. The Group has yet to assess the full impact of IFRS 11 and will apply the standard from 1st January 2013.
IFRS 12 ‘Disclosure of Interests in Other Entities’ (effective 1st January 2013) requires entities to disclose information that helps financial statements readers to evaluate the nature, risks and financial effects associated with the entity’s interests in subsidiaries, associates, joint arrangements and unconsolidated structured entities. Disclosure required includes significant judgements and assumptions made in determining whether an entity controls, jointly controls, significantly influences or has some other interest in other entities. The Group will apply the standard from 1st January 2013.
IFRS 13 ‘Fair Value Measurement’ (effective 1st January 2013) requires entities to disclose information about the valuation techniques and inputs used to measure fair value, as well as information about the uncertainty inherent in fair value measurements. The standard applies to both financial and non-financial items measured at fair value. Fair value is now defined as ‘the price that would be received to sell an asset or paid to transfer a liability in an orderly transaction between market participants at the measurement date’ (i.e. an exit price). The Group will apply the standard from 1st January 2013.

37Jardine Matheson | Annual Report 2011
Amendments to IAS 1 ‘Presentation of Items of Other Comprehensive Income’ (effective 1st July 2012) improve the consistency and clarity of the presentation of items of other comprehensive income. The amendments require entities to separate items presented in other comprehensive income into two groups, based on whether or not they may be recycled to profit or loss in the future. Items that will not be recycled – such as actuarial gains or losses on defined benefit pension plans – will be presented separately from items that may be recycled in the future – such as deferred gains and losses on cash flow hedges. The amounts of tax related to the two groups are required to be allocated on the same basis. The Group will apply the standard from 1st January 2013.
IAS 19 (amended 2011) ‘Employee Benefits’ (effective 1st January 2013) requires the assumed return on plan assets recognized in the profit and loss to be the same as the rate used to discount the defined benefit obligation. It also requires actuarial gains and losses to be recognized immediately in other comprehensive income and past service costs immediately in profit or loss. Additional disclosures are required to present the characteristics of benefit plans, the amount recognized in the financial statements, and the risks arising from defined benefit plans and multi-employer plans. The Group will apply the standard from 1st January 2013.
IAS 27 (2011) ‘Separate Financial Statements’ (effective 1st January 2013) supersedes IAS 27 (2008) and prescribes the accounting and disclosure requirements for investments in subsidiaries, joint ventures and associates when an entity prepares separate financial statements. There will be no impact on the consolidated financial statements as the changes only affect the separate financial statements of the investing entity.
IAS 28 (2011) ‘Investments in Associates and Joint Ventures’ (effective 1st January 2013) supersedes IAS 28 (2008) and prescribes the accounting for investments in associates and joint ventures and sets out the requirements for the application of the equity method when accounting for investments in associates and joint ventures. The adoption of this standard is not expected to have any significant impact on the results of the Group as the Group is already following the standard.
IFRIC 20 ‘Stripping Costs in the Production Phase of a Surface Mine’ (effective 1st January 2013) clarifies when production stripping should lead to the recognition of an asset and how that asset should be measured, both initially and in subsequent periods. The Group has yet to assess the full impact of IFRIC 20 and will apply the Interpretation from 1st January 2013.
The principal operating subsidiaries, associates and joint ventures have different functional currencies in line with the economic environments of the locations in which they operate. The functional currency of the Company is United States dollars. The consolidated financial statements are presented in United States dollars.
The Group’s reportable segments are set out in note 4 and are described on page 4 and pages 6 to 21.
Basis of consolidation(i) The consolidated financial statements include the financial statements of the Company, its subsidiaries, and its associates and joint ventures.
(ii) Subsidiaries are entities over which the Group has the power to govern the financial and operating policies. The purchase method of accounting is used to account for the acquisition of subsidiaries by the Group. The cost of an acquisition include the fair value at the acquisition date of any contingent consideration. In a business combination achieved in stages, the Group remeasures its previously held interest in the acquiree at its acquisition-date fair value and recognized the resulting gain or loss in profit and loss. Changes in a parent’s ownership interest in a subsidiary that do not result in the loss of control are accounted for as equity transactions. When control over a previous subsidiary is lost, any remaining interest in the entity is remeasured at fair value and the resulting gain or loss is recognized in profit and loss.
All material intercompany transactions, balances and unrealized surpluses and deficits on transactions between Group companies have been eliminated. The cost of and related income arising from shares held in the Company by subsidiaries are eliminated from shareholders’ funds and non-controlling interests, and profit, respectively.
(iii) Associates are entities, not being subsidiaries or joint ventures, over which the Group exercises significant influence. Joint ventures are entities which the Group jointly controls with one or more other venturers. Associates and joint ventures are included on the equity basis of accounting.

38 Jardine Matheson | Annual Report 2011
Notes to the Financial Statements (continued)
Rothschilds Continuation has a financial year end of 31st March. The company publishes audited financial statements annually and prepares half-year unaudited financial statements. The results of Rothschilds Continuation are included in these financial statements by reference to its latest half-year and annual financial statements adjusted for the effects of significant transactions or events that occur up to the balance sheet date.
Profits and losses resulting from upstream and downstream transactions between the Group and its associates are recognized in the consolidated financial statements only to the extent of unrelated investor’s interests in the associates.
(iv) Non-controlling interests represent the proportion of the results and net assets of subsidiaries and their associates and joint ventures not attributable to the Group.
(v) The results of subsidiaries, associates and joint ventures are included or excluded from their effective dates of acquisition or disposal, respectively. The results of entities other than subsidiaries, associates and joint ventures are included to the extent of dividends received when the right to receive such dividend is established.
Foreign currenciesTransactions in foreign currencies are accounted for at the exchange rates ruling at the transaction dates.
Assets and liabilities of subsidiaries, associates and joint ventures, together with all other monetary assets and liabilities expressed in foreign currencies, are translated into United States dollars at the rates of exchange ruling at the year end. Results expressed in foreign currencies are translated into United States dollars at the average rates of exchange ruling during the year, which approximate the exchange rates at the dates of the transactions.
Exchange differences arising from the retranslation of the net investment in foreign subsidiaries, associates and joint ventures, and of financial instruments which are designated as hedges of such investments, are recognized in other comprehensive income and accumulated in equity under exchange reserves. On the disposal of these investments, such exchange differences are recognized in profit and loss. Exchange differences on available-for-sale investments are recognized in other comprehensive income as part of the gains and losses arising from changes in their fair value. Exchange differences relating to changes in the amortized cost of monetary securities classified as available-for-sale and all other exchange differences are recognized in profit and loss.
Goodwill and fair value adjustments arising on acquisition of a foreign entity after 1st January 2003 are treated as assets and liabilities of the foreign entity and translated into United States dollars at the rate of exchange ruling at the year end.
ImpairmentAssets that have indefinite useful lives are not subject to amortization and are tested for impairment annually and whenever there is an indication that the assets may be impaired. Assets that are subject to amortization are reviewed for impairment whenever events or changes in circumstances indicate that the carrying amount may not be recoverable. For the purpose of assessing impairment, assets are grouped at the lowest level for which there is separately identifiable cash flows. Cash-generating units or groups of cash-generating units to which goodwill has been allocated are tested for impairment annually and whenever there is an indication that the units may be impaired. An impairment loss is recognized for the amount by which the carrying amount of the asset exceeds its recoverable amount, which is the higher of an asset’s fair value less costs to sell and value in use.
Intangible assets(i) Goodwill represents the excess of the cost of an acquisition over the fair value of the Group’s share of the net identifiable assets of the acquired subsidiary, associate or joint venture at the effective date of acquisition. Non-controlling interests are measured at their proportionate share of the net identifiable assets at the acquisition date. If the cost of acquisition is less than the fair value of the net assets acquired, the difference is recognized directly in profit and loss. Goodwill on acquisitions of subsidiaries is included in intangible assets. Goodwill on acquisitions of associates and joint ventures is included in investment in associates and joint ventures. Goodwill is allocated to cash-generating units or groups of cash-generating units for the purpose of impairment testing and is carried at cost less accumulated impairment loss.
The profit or loss on disposal of subsidiaries, associates and joint ventures includes the carrying amount of goodwill relating to the entity sold.

39Jardine Matheson | Annual Report 2011
(ii) Franchise rights, which are rights under franchise agreements, are separately identified intangible assets acquired as part of a business combination. These franchise agreements are deemed to have indefinite lives because either they do not have any term of expiry or their renewal by the Group would be probable and would not involve significant costs, taking into account the history of renewal and the relationships between the franchisee and the contracting parties. The useful lives are reviewed at each balance sheet date. Franchise rights are carried at cost less accumulated impairment loss.
(iii) Leasehold land represents payments to third parties to acquire short-term interests in property. These payments are stated at cost and are amortized over the useful life of the lease which includes the renewal period if the lease can be renewed by the Group without significant cost.
(iv) Concession rights are operating rights for toll roads under service concession arrangements. The cost of the construction services provided under the arrangements is amortized over the period of the concession.
(v) Other intangible assets are stated at cost less accumulated amortization. Amortization is calculated on the straight line basis to allocate the cost of intangible assets over their estimated useful lives.
Tangible fixed assets and depreciationFreehold land and buildings, and the building component of owner-occupied leasehold properties are stated at cost less any accumulated depreciation and impairment. Long-term interests in leasehold land are classified as finance leases and grouped under tangible assets if substantially all risks and rewards relating to the land have been transferred to the Group, and are amortized over the useful life of the lease. Grants related to tangible assets are deducted in arriving at the carrying amount of the assets. Mining properties, which are contractual rights to mine and own coal reserves in specified concession areas, and other tangible fixed assets are stated at cost less amounts provided for depreciation. Cost of mining properties includes expenditure to restore and rehabilitate coal mining areas following the completion of production.
Depreciation of tangible fixed assets other than mining properties is calculated on the straight line basis to allocate the cost or valuation of each asset to its residual value over its estimated useful life. The residual values and useful lives are reviewed at each balance sheet date. The estimated useful lives are as follows:
Buildings 14 – 150 yearsSurface, finishes and services of hotel properties 20 – 30 yearsLeasehold improvements period of the leaseLeasehold land period of the leasePlant and machinery 2 – 20 yearsFurniture, equipment and motor vehicles 2 – 16 years
No depreciation is provided on freehold land as it is deemed to have an indefinite life. Mining properties are depreciated using the unit of production method.
Where the carrying amount of a tangible fixed asset is greater than its estimated recoverable amount, it is written down immediately to its recoverable amount.
The profit or loss on disposal of tangible fixed assets is recognized by reference to their carrying amount.
Investment propertiesProperties including those under operating leases which are held for long-term rental yields or capital gains are classified and accounted for as investment properties, but the business model does not necessarily envisage that the properties will be held for their entire useful life. Investment properties are carried at fair value, representing estimated open market value determined annually by independent qualified valuers who have recent experience in the location and category of the investment property being valued. The market value of each property is calculated on the discounted net rental income allowing for reversionary potential. Changes in fair value are recognized in profit and loss.
PlantationsPlantations, which principally comprise oil palm plantations and exclude the related land, are measured at each balance sheet date at their fair values, representing the present value of expected net cash flows from the assets in their present location and condition determined internally, less estimated point of sale costs. Changes in fair values are recorded in the profit and loss account. The plantations which have a life of approximately 25 years are considered mature three to four years after planting and once they are generating fresh fruit bunches which average four to six tonnes per hectare per year.

40 Jardine Matheson | Annual Report 2011
Notes to the Financial Statements (continued)
Investments(i) Investments are classified by management as available for sale or held to maturity on initial recognition. Available-for-sale investments are shown at fair value. Gains and losses arising from changes in the fair value are recognized in other comprehensive income. On the disposal of an investment or when an investment is determined to be impaired, the cumulative gain or loss previously deferred in equity is recognized in profit and loss. Held-to-maturity investments are shown at amortized cost. Investments are classified under non-current assets unless they are expected to be realized within 12 months after the balance sheet date.
(ii) At each balance sheet date, the Group assesses whether there is objective evidence that an investment is impaired. In the case of equity securities classified as available for sale, a significant or prolonged decline in the fair value of the security below its cost is considered as an indicator that the securities are impaired.
(iii) All purchases and sales of investments are recognized on the trade date, which is the date that the Group commits to purchase or sell the investment.
LeasesLeases are classified as finance leases when the terms of the lease transfer substantially all the risks and rewards of ownership to the lessee. All other leases are classified as operating leases.
(i) Amount due from lessees under finance leases are recorded as receivables at the amount of the Group’s net investment in the leases. Finance lease income is allocated to accounting periods so as to reflect a constant periodic rate of return on the Group’s net investment outstanding in respect of the leases.
(ii) Plant and machinery under finance leases are capitalized at the commencement of the lease at the lower of the fair value of the leased asset and the present value of the minimum lease payments. Lease payments are allocated between the liability and finance charges so as to achieve a constant rate on the finance balance outstanding.
(iii) Payments made under operating leases (net of any incentives received from the lessor) are charged to profit and loss on a straight line basis over the period of the lease. When a lease is terminated before the lease period has expired, any payment required to be made to the lessor by way of penalty is recognized as an expense in the year in which termination takes place.
Properties for saleProperties for sale, which comprise land and buildings held for resale, are stated at the lower of cost and net realizable value. The cost of properties for sale comprises land costs, and construction and other development costs.
Stocks and work in progressStocks, which principally comprise goods held for resale, are stated at the lower of cost and net realizable value. Cost is determined by the first-in, first-out method. The cost of finished goods and work in progress comprises raw materials, labour and an appropriate proportion of overheads.
DebtorsConsumer financing debtors and finance lease receivables are measured at amortized cost using the effective interest method. The gross amount due from customers for contract work is stated at cost plus an appropriate proportion of profit, established by reference to the percentage of completion, and after deducting progress payments and provisions for foreseeable losses. Repossessed assets of finance companies are measured at the lower of the carrying amount of the debtors in default and fair value less costs to sell. All other debtors, excluding derivative financial instruments, are measured at amortized cost except where the effect of discounting would be immaterial. Provision for impairment is established when there is objective evidence that the outstanding amounts will not be collected. Significant financial difficulties of the debtor, probability that the debtor will enter bankruptcy or financial reorganization, and default or delinquency in payments are considered indicators that the debtor is impaired. The carrying amount of the asset is reduced through the use of an allowance account and the amount of the loss is recognized in arriving at operating profit. When a debtor is uncollectible, it is written off against the allowance account. Subsequent recoveries of amount previously written off are credited to profit and loss.
Debtors with maturities greater than 12 months after the balance sheet date are classified under non-current assets.
Cash and cash equivalentsFor the purposes of the cash flow statement, cash and cash equivalents comprise deposits with banks and financial institutions, bank and cash balances, and liquid investments, net of bank overdrafts. In the balance sheet, restricted bank balances and deposits are included in non-current debtors, and bank overdrafts are included in current borrowings.

41Jardine Matheson | Annual Report 2011
Liquid investments, which are readily convertible to known amounts of cash and which are subject to an insignificant risk of change in value, are included in bank balances and other liquid funds and are stated at market value. Increases or decreases in market value are recognized in profit and loss.
ProvisionsProvisions are recognized when the Group has present legal or constructive obligations as a result of past events, it is probable that an outflow of resources embodying economic benefits will be required to settle the obligations, and a reliable estimate of the amount of the obligations can be made.
Borrowings and borrowing costsBorrowings are initially recognized at fair value, net of transaction costs incurred. In subsequent periods, borrowings are stated at amortized cost using the effective interest method.
On the issue of bonds which are convertible into a fixed number of ordinary shares of the issuing entity, the fair value of the liability portion is determined using a market interest rate for an equivalent non-convertible bond; this amount is included in long-term borrowings on the amortized cost basis until extinguished on conversion or maturity of the bond. The remainder of the proceeds is allocated to the conversion option which is recognized and included in shareholders’ funds. On the issue of convertible bonds which are not convertible into the issuing entity’s own shares or which are not convertible into a fixed number of ordinary shares of the issuing entity, the fair value of the conversion option component is determined and included in current liabilities, and the residual amount is allocated to the carrying amount of the bond. Any conversion option component included in current liabilities is shown at fair value with changes in fair value recognized in profit and loss.
Borrowing costs relating to major development projects are capitalized until the asset is substantially completed. Capitalized borrowing costs are included as part of the cost of the asset. All other borrowing costs are expensed as incurred.
Borrowings are classified under non-current liabilities unless these are due to be settled within 12 months after the balance sheet date.
Deferred taxDeferred tax is provided, using the liability method, for all temporary differences arising between the tax bases of assets and liabilities and their carrying values. Deferred tax is determined using tax rates and laws that have been enacted or substantially enacted by the balance sheet date and are expected to apply when the related deferred tax asset is realized or the deferred tax liability is settled.
Provision for deferred tax is made on the revaluation of certain non-current assets and, in relation to acquisitions, on the difference between the fair value of the net assets acquired and their tax base. Deferred tax is provided on temporary differences associated with investments in subsidiaries, associates and joint ventures, except where the Group is able to control the reversal of the temporary difference and it is probable that the temporary difference will not reverse in the foreseeable future. Deferred tax assets relating to the carry forward of unused tax losses are recognized to the extent that it is probable that future taxable profit will be available against which the unused tax losses can be utilized.
Employee benefitsPension obligationsThe Group operates a number of defined benefit and defined contribution plans, the assets of which are held in trustee administered funds.
Pension accounting costs for defined benefit plans are assessed using the projected unit credit method. Under this method, the costs of providing pensions are charged to profit and loss spreading the regular cost over the service lives of employees in accordance with the advice of qualified actuaries, who carry out a full valuation of major plans every year. The pension obligations are measured as the present value of the estimated future cash outflows by reference to market yields on high quality corporate bonds which have terms to maturity approximating the terms of the related liability. Plan assets are measured at fair value. Actuarial gains and losses are recognized in other comprehensive income in the year in which they occur.
The Group’s total contributions relating to the defined contribution plans are charged to profit and loss in the year to which they relate.

42 Jardine Matheson | Annual Report 2011
Notes to the Financial Statements (continued)
Share-based compensationThe Company and its subsidiaries and associates operate a number of equity settled employee share option schemes. The fair value of the employee services received in exchange for the grant of the options in respect of options granted after 7th November 2002 is recognized as an expense. The total amount to be expensed over the vesting period is determined by reference to the fair value of the options granted as determined on the grant date. At each balance sheet date, the entity revises its estimates of the number of options that are expected to become exercisable. The impact of the revision of original estimates, if any, is recognized in profit and loss.
Non-current assets held for saleNon-current assets are classified as assets held for sale and stated at the lower of carrying amount and fair value less costs to sell if their carrying amount is recovered principally through a sale transaction rather than through continuing use.
Derivative financial instrumentsThe Group only enters into derivative financial instruments in order to hedge underlying exposures. Derivative financial instruments are initially recognized at fair value on the date a derivative contract is entered into and are subsequently remeasured at their fair value. The method of recognizing the resulting gain or loss is dependent on the nature of the item being hedged. The Group designates certain derivatives as a hedge of the fair value of a recognized asset or liability (‘fair value hedge’), or a hedge of a forecasted transaction or of the foreign currency risk on a firm commitment (‘cash flow hedge’), or a hedge of a net investment in a foreign entity.
Changes in the fair value of derivatives that are designated and qualify as fair value hedges and that are highly effective, are recognized in profit and loss, along with any changes in the fair value of the hedged asset or liability that is attributable to the hedged risk. When a hedging instrument expires or is sold, or when a hedge no longer meets the criteria for hedge accounting, the cumulative adjustment to the carrying amount of a hedged item for which the effective interest method is used is amortized to profit and loss over the residual period to maturity.
Changes in the fair value of derivatives that are designated and qualify as cash flow hedges and that are highly effective, are recognized in other comprehensive income and accumulated in equity under hedging reserves. Where the forecasted transaction or firm commitment results in the recognition of a non-financial asset or of a non-financial liability, the gains and losses previously deferred in hedging reserves are transferred from hedging reserves and included in the initial measurement of the cost of the asset or liability. Otherwise, amounts deferred in hedging reserves are transferred to profit and loss in the same periods during which the hedged firm commitment or forecasted transaction affects profit and loss. When a hedging instrument expires or is sold, or when a hedge no longer meets the criteria for hedge accounting, any cumulative gain or loss existing in hedging reserves at that time remains in the hedging reserves and is recognized when the committed or forecasted transaction ultimately is recognized in profit and loss. When a committed or forecasted transaction is no longer expected to occur, the cumulative gain or loss that was reported in hedging reserves is immediately transferred to profit and loss.
Certain derivative transactions, while providing effective economic hedges under the Group’s risk management policies, do not qualify for hedge accounting under the specific rules in IAS 39. Changes in the fair value of any derivative instruments that do not qualify for hedge accounting under IAS 39 are recognized immediately in profit and loss.
Hedges of net investments in foreign entities are accounted for on a similar basis to that used for cash flow hedges. Any gain or loss on the hedging instrument relating to the effective portion of the hedge is recognized in exchange reserves; the gain or loss relating to the ineffective portion is recognized immediately in profit and loss.
The fair value of derivatives which are designated and qualify as effective hedges are classified as non-current assets or liabilities if the remaining maturities of the hedged assets or liabilities are greater than 12 months after the balance sheet date.
Insurance contractsInsurance contracts are those contracts that transfer significant insurance risk.
Premiums on insurance contracts are recognized as revenue proportionately over the period of coverage. The portion of premium received on in-force contracts that relates to unexpired risks at the balance sheet date is reported as the unearned premium liability. Claims and loss adjustment expenses are charged to profit and loss as incurred based on the estimated liabilities for compensation owed to contract holders or third parties damaged by the contract holders. They include direct and indirect claims settlement costs and arise from events that have occurred up to the balance sheet date even if they have not yet been reported to the Group. The Group does not discount its liabilities for unpaid claims. Liabilities for unpaid claims are estimated using the input of assessments for individual cases reported to the Group and statistical analyses for the claims incurred but not reported.

43Jardine Matheson | Annual Report 2011
Financial guarantee contracts under which the Group accepts significant risk from a third party by agreeing to compensate that party on the occurrence of a specified uncertain future event are accounted for in a manner similar to insurance contracts. Provisions are recognized when it is probable that the Group has obligations under such guarantees and an outflow of resources embodying economic benefits will be required to settle the obligations.
Non-trading itemsNon-trading items are separately identified to provide greater understanding of the Group’s underlying business performance. Items classified as non-trading items include fair value gains or losses on revaluation of investment properties and plantations; gains and losses arising from the sale of businesses, investments and properties; impairment of non-depreciable intangible assets and other investments; provisions for the closure of businesses; acquisition-related costs in business combinations; and other credits and charges of a non-recurring nature that require inclusion in order to provide additional insight into underlying business performance.
Earnings per shareBasic earnings per share are calculated on profit attributable to shareholders and on the weighted average number of shares in issue during the year. The weighted average number excludes the Company’s share of the shares held by subsidiaries and the shares held by the Trustee under the Senior Executive Share Incentive Schemes. For the purpose of calculating diluted earnings per share, profit attributable to shareholders is adjusted for the effects of the conversion of dilutive potential ordinary shares of subsidiaries, associates or joint ventures, and the weighted average number of shares is adjusted for the number of shares which are deemed to be issued for no consideration under the Senior Executive Share Incentive Schemes based on the average share price during the year.
DividendsDividends proposed or declared after the balance sheet date are not recognized as a liability at the balance sheet date.
The nominal amount of the ordinary shares issued as a result of election for scrip is capitalized out of the share premium account or other reserves, as appropriate.
Revenue recognitionRevenue is measured at the fair value of the consideration received and receivable and represents amounts receivable for goods and services provided in the normal course of business, net of discounts and sales related taxes.
(i) Revenue from the sale of goods, including properties for sale, is recognized on the transfer of significant risks and rewards of ownership, which generally coincides with the time when the goods are delivered to customers and title has passed.
(ii) Revenue from a contract to provide services is recognized by reference to the stage of completion of the contract.
(iii) Revenue from consumer financing and financing leases is recognized over the term of the respective contracts based on a constant rate of return on the net investment.
(iv) Dividend income is recognized when the right to receive payment is established.
Pre-operating costsPre-operating costs are expensed as they are incurred.
Comparative figuresCertain comparative figures have been reclassified to conform with the current year presentation.

44 Jardine Matheson | Annual Report 2011
Notes to the Financial Statements (continued)
2 Financial Risk ManagementFinancial risk factorsThe Group’s activities expose it to a variety of financial risks: market risk (including foreign exchange risk, interest rate risk and price risk), credit risk and liquidity risk.
The Group’s treasury function co-ordinates, under the directions of the board of Jardine Matheson Limited, financial risk management policies and their implementation on a group-wide basis. The Group’s treasury policies are designed to manage the financial impact of fluctuations in interest rates and foreign exchange rates and to minimize the Group’s financial risks. The Group uses derivative financial instruments, principally interest rate swaps, caps and collars, cross-currency swaps, forward foreign exchange contracts and foreign currency options as appropriate for hedging transactions and managing the Group’s assets and liabilities in accordance with the Group’s financial risk management policies. Financial derivative contracts are executed between third party banks and the Group entity that is directly exposed to the risk being hedged. Certain derivative transactions, while providing effective economic hedges under the Group’s risk management policies, do not qualify for hedge accounting under the specific rules in IAS 39. Changes in the fair value of any derivative instruments that do not qualify for hedge accounting under IAS 39 are recognized immediately in the profit and loss account. It is the Group’s policy not to enter into derivative transactions for speculative purposes. The notional amounts and fair values of derivative financial instruments at 31st December 2011 are disclosed in note 35.
(i) Market riskForeign exchange riskEntities within the Group are exposed to foreign exchange risk from future commercial transactions, net investments in foreign operations and net monetary assets and liabilities that are denominated in a currency that is not the entity’s functional currency.
Entities in the Group use cross-currency swaps, forward foreign exchange contracts and foreign currency options in a consistent manner to hedge firm and anticipated foreign exchange commitments and manage their foreign exchange risk arising from future commercial transactions. The Group does not usually hedge its net investments in foreign operations except in circumstances where there is a material exposure arising from a currency that is anticipated to be volatile and the hedging is cost effective. Group entities are required to manage their foreign exchange risk against their functional currency. Foreign currency borrowings are swapped into the entity’s functional currency using cross-currency swaps except where the foreign currency borrowings are repaid with cash flows generated in the same foreign currency. The purpose of these hedges is to mitigate the impact of movements in foreign exchange rates on assets and liabilities and the profit and loss account of the Group.
Currency risks as defined by IFRS 7 arise on account of monetary assets and liabilities being denominated in a currency that is not the functional currency. At 31st December 2011 the Group’s Indonesian rupiah functional entities had United States dollar denominated net monetary assets of US$748 million (2010: liabilities of US$159 million). At 31st December 2011, if the United States dollar had strengthened/weakened by 10% against the Indonesian rupiah with all other variables unchanged, the Group’s profit after tax would have been US$56 million higher/lower (2010: US$12 million lower/ higher), arising from foreign exchange losses/gains taken on translation. The impact on amount attributable to the shareholders of the Company would be US$11 million higher/lower (2010: US$1 million lower/ higher). This sensitivity analysis ignores any offsetting foreign exchange factors and has been determined assuming that the change in foreign exchange rates had occurred at the balance sheet date. The stated change represents management’s assessment of reasonably possible changes in foreign exchange rates over the period until the next annual balance sheet date. There are no other significant monetary balances held by Group companies at 31st December 2011 that are denominated in a non-functional currency. Differences resulting from the translation of financial statements into the Group’s presentation currency are not taken into consideration.
Since the Group manages the interdependencies between foreign exchange risk and interest rate risk of foreign currency borrowings using cross-currency swaps, the sensitivity analysis on financial impacts arising from cross-currency swaps is included in the sensitivity assessment on interest rates under the interest rate risk section.
Interest rate riskThe Group is exposed to interest rate risk through the impact of rate changes on interest bearing liabilities and assets. These exposures are managed partly by using natural hedges that arise from offsetting interest rate sensitive assets and liabilities, and partly through fixed rate borrowings and the use of derivative financial instruments such as interest rate swaps, caps and collars. The Group monitors interest rate exposure on a monthly basis by currency and business unit, taking into consideration proposed financing and hedging arrangements. The Group’s guideline is to maintain 40% to 60% of its gross borrowings, exclusive of the financial services companies, in fixed rate instruments. At 31st December 2011 the Group’s interest rate hedge

45Jardine Matheson | Annual Report 2011
exclusive of the financial services companies was 46% (2010: 56%), with an average tenor of six years (2010: five years). The financial services companies borrow predominately at a fixed rate. The interest rate profile of the Group’s borrowings after taking into account hedging transactions are set out in note 31.
Cash flow interest rate risk is the risk that changes in market interest rates will impact cash flows arising from variable rate financial instruments. Borrowings at floating rates therefore expose the Group to cash flow interest rate risk. The Group manages this risk by using forward rate agreements to a maturity of one year, and by entering into interest rate swaps, caps and collars for a maturity of up to five years. Forward rate agreements and interest rate swaps have the economic effect of converting borrowings from floating rate to fixed rate, caps provide protection against a rise in floating rates above a pre-determined rate, whilst collars combine the purchase of a cap and the sale of a floor to specify a range in which an interest rate will fluctuate.
Fair value interest rate risk is the risk that the value of a financial asset or liability and derivative financial instruments will fluctuate because of changes in market interest rates. The Group manages its fair value interest rate risk by entering into interest rate swaps which have the economic effect of converting borrowings from fixed rate to floating rate, to maintain the Group’s fixed rate instruments to within the Group’s guideline.
At 31st December 2011, if interest rates had been 100 basis points higher/lower with all other variables held constant, the Group’s profit after tax would have been US$16 million (2010: US$22 million) higher/lower, and hedging reserves would have been US$90 million (2010: US$70 million) higher/lower as a result of fair value changes to cash flow hedges. The sensitivity analysis has been determined assuming that the change in interest rates had occurred at the balance sheet date and had been applied to the exposure to interest rate risk for both derivative and non-derivative financial instruments in existence at that date. There is no significant variation in the sensitivity analysis as a result of interest rate caps and collars. The 100 basis point increase or decrease represents management’s assessment of a reasonably possible change in those interest rates which have the most impact on the Group, specifically the United States, Hong Kong and Indonesian rates, over the period until the next annual balance sheet date. In the case of effective fair value hedges, changes in the fair value of the hedged items caused by interest rate movements balance out in the profit and loss account against changes in the fair value of the hedging instruments. Changes in market interest rates affect the interest income or expense of non-derivative variable-interest financial instruments, the interest payments of which are not designated as hedged items of cash flow hedges against interest rate risks. As a consequence, they are included in the calculation of profit after tax sensitivities. Changes in the market interest rate of financial instruments that were designated as hedging instruments in a cash flow hedge to hedge payment fluctuations resulting from interest rate movements affect the hedging reserves and are therefore taken into consideration in the equity-related sensitivity calculations.
Price riskThe Group is exposed to securities price risk because of listed and unlisted investments which are available for sale and held by the Group at fair value. Gains and losses arising from changes in the fair value of available-for-sale investments are recognized in other comprehensive income. The performance of the Group’s listed and unlisted available-for-sale investments are monitored regularly, together with an assessment of their relevance to the Group’s long term strategic plans. Details of the Group’s available-for-sale investments are contained in note 17.
Available-for-sale investments are unhedged. At 31st December 2011, if the price of listed and unlisted available-for-sale investments had been 25% higher/lower with all other variables held constant, total equity would have been US$273 million (2010: US$259 million) higher/lower unless impaired. The sensitivity analysis has been determined based on a reasonable expectation of possible valuation volatility over the next 12 months.
The Group is exposed to financial risks arising from changes in commodity prices, primarily crude palm oil, coal, steel rebar and copper. The Group’s policy is generally not to hedge commodity price risk, although limited hedging is undertaken for strategic reasons. In such cases the Group uses forward contracts to hedge the price risk. To mitigate or hedge the price risk, Group entities may enter into a forward contract to buy the commodity at a fixed price at a future date, or a forward contract to sell the commodity at a fixed price at a future date. The Group considers the outlook for crude palm oil, coal, steel rebar and copper prices regularly in considering the need for active financial risk management.
(ii) Credit riskThe Group’s credit risk is primarily attributable to deposits with banks, credit exposures to customers and derivative financial instruments with a positive fair value. The Group has credit policies in place and the exposures to these credit risks are monitored on an ongoing basis.

46 Jardine Matheson | Annual Report 2011
Notes to the Financial Statements (continued)
The Group manages its deposits with banks and financial institutions and transactions involving derivative financial instruments by monitoring credit ratings and capital adequacy ratios of counterparties, and limiting the aggregate risk to any individual counterparty. The utilization of credit limits is regularly monitored. At 31st December 2011, over 64% (2010: 83%) of deposits and balances with banks and financial institutions were made to institutions with credit ratings of no less than A- (Fitch). Similarly transactions involving derivative financial instruments are with banks with sound credit ratings and capital adequacy ratios. In developing countries it may be necessary to deposit money with banks that have a lower credit rating, however the Group only enters into derivative transactions with counterparties which have credit ratings of at least investment grade. Management does not expect any counterparty to fail to meet its obligations.
In respect of credit exposures to customers, the Group has policies in place to ensure that sales on credit without collateral are made principally to corporate companies with an appropriate credit history and credit insurance is purchased for businesses where it is economically effective. The Group normally obtains collateral over vehicles from consumer financing debtors towards settlement of vehicle receivables. Customers give the right to the Group to sell the repossessed collateral or take any other action to settle the outstanding receivable. Sales to other customers are made in cash or by major credit cards.
The maximum exposure to credit risk is represented by the carrying amount of each financial asset in the balance sheet after deducting any impairment allowance.
(iii) Liquidity riskPrudent liquidity risk management includes managing the profile of debt maturities and funding sources, maintaining sufficient cash and marketable securities, and ensuring the availability of funding from an adequate amount of committed credit facilities and the ability to close out market positions. The Group's ability to fund its existing and prospective debt requirements is managed by maintaining diversified funding sources with adequate committed funding lines from high quality lenders, and by monitoring rolling short-term forecasts of the Group’s cash and gross debt on the basis of expected cash flows. In addition long-term cash flows are projected to assist with the Group’s long-term debt financing plans.
At 31st December 2011, total available borrowing facilities amounted to US$16.4 billion (2010: US$14.4 billion) of which US$10.1 billion (2010: US$8.9 billion) was drawn down. Undrawn committed facilities, in the form of revolving credit and term loan facilities, and undrawn uncommitted facilities totaled US$4.2 billion (2010: US$4.3 billion) and US$2.1 billion (2010: US$1.2 billion), respectively.
The table below analyses the Group’s non-derivative financial liabilities and derivative financial liabilities into relevant maturity groupings based on the remaining period at the balance sheet date to the contractual maturity date. Derivative financial liabilities are included in the analysis if their contractual maturities are essential for an understanding of the timing of the cash flows. The amounts disclosed in the table are the contractual undiscounted cash flows.
Withinone
year
Betweenone and
two years
Betweentwo and
three years
Betweenthree andfour years
Betweenfour and
five years
Beyondfive
years
Totalundiscounted
cash flowsUS$m US$m US$m US$m US$m US$m US$m
At 31st December 2011Borrowings 3,303 2,508 2,537 778 482 1,869 11,477Creditors 6,470 54 52 22 12 29 6,639Net settled derivative financial instruments 15 12 5 2 – – 34Gross settled derivative financial instruments 939 700 881 121 24 936 3,601
At 31st December 2010Borrowings 3,838 1,772 1,297 1,217 431 1,783 10,338Creditors 5,145 64 41 16 20 24 5,310Net settled derivative financial instruments 24 14 10 2 – – 50Gross settled derivative financial instruments 1,074 240 158 524 21 935 2,952

47Jardine Matheson | Annual Report 2011
Capital managementThe Group’s objectives when managing capital are to safeguard the Group’s ability to continue as a going concern whilst seeking to maximize benefits to shareholders and other stakeholders. Capital is equity as shown in the consolidated balance sheet plus net debt.
The Group actively and regularly reviews and manages its capital structure to ensure optimal capital structure and shareholder returns, taking into consideration the future capital requirements of the Group and capital efficiency, prevailing and projected profitability, projected operating cash flows, projected capital expenditures and projected strategic investment opportunities. In order to maintain or adjust the capital structure, the Group may adjust the amount of dividends paid to shareholders, purchase Group shares, return capital to shareholders, issue new shares or sell assets to reduce debt.
The Group monitors capital on the basis of the Group’s consolidated gearing ratio and consolidated interest cover. The gearing ratio is calculated as net debt divided by total equity. Net debt is calculated as total borrowings less bank balances and other liquid funds. Interest cover is calculated as underlying operating profit and share of results of associates and joint ventures divided by net financing charges. The ratios are monitored both inclusive and exclusive of the Group’s financial services companies, which by their nature are generally more highly leveraged than the Group’s other businesses. The Group does not have a defined gearing or interest cover benchmark or range.
The ratios at 31st December 2010 and 2011 are as follows:
2011 2010
Gearing ratio exclusive of financial services companies (%) 6 7Gearing ratio inclusive of financial services companies (%) 15 14Interest cover exclusive of financial services companies (times) 33 29Interest cover inclusive of financial services companies (times) 40 33
Fair value estimation(i) Financial instruments that are measured at fair valueFor financial instruments that are measured at fair value in the balance sheet, the corresponding fair value measurements are disclosed by level of the following fair value measurement hierarchy:
(a) Quoted prices (unadjusted) in active markets for identical assets or liabilities (‘quoted prices in active markets’)The fair value of listed securities, which are classified as available-for-sale, is based on quoted prices in active markets at the balance sheet date. The quoted market price used for listed investments held by the Group is the current bid price.
(b) Inputs other than quoted prices in active markets that are observable for the asset or liability, either directly or indirectly (‘observable current market transactions’)The fair values of all interest rate swaps and caps, cross-currency swaps, forward foreign exchange contracts and credit default swaps have been determined using rates quoted by the Group’s bankers at the balance sheet date which are calculated by reference to market interest rates and foreign exchange rates.
(c) Inputs for assets or liabilities that are not based on observable market data (‘unobservable inputs’)The fair value of unlisted securities, which are classified as available-for-sale, is determined using valuation techniques by reference to observable current market transactions or the market prices of the underlying investments with certain degree of entity specific estimates.
(ii) Financial instruments that are not measured at fair valueThe fair values of current debtors, bank balances and other liquid funds, current creditors and current borrowings are assumed to approximate their carrying amounts due to the short-term maturities of these assets and liabilities.
The fair values of long-term borrowings are based on market prices or are estimated using the expected future payments discounted at market interest rates.

48 Jardine Matheson | Annual Report 2011
Notes to the Financial Statements (continued)
3 Critical Accounting Estimates and JudgementsEstimates and judgements used in preparing the financial statements are continually evaluated and are based on historical experience and other factors, including expectations of future events that are believed to be reasonable. The resulting accounting estimates will, by definition, seldom equal the related actual results. The estimates and assumptions that have a significant effect on the carrying amounts of assets and liabilities are discussed below.
Acquisition of subsidiaries, associates and joint venturesThe initial accounting on the acquisition of subsidiaries, associates and joint ventures involves identifying and determining the fair values to be assigned to the identifiable assets, liabilities and contingent liabilities of the acquired entities. The fair values of franchise rights, leasehold land, concession rights, tangible assets, investment properties and plantations are determined by independent valuers by reference to market prices or present value of expected net cash flows from the assets. Any changes in the assumptions used and estimates made in determining the fair values, and management’s ability to measure reliably the contingent liabilities of the acquired entity will impact the carrying amount of these assets and liabilities.
Tangible fixed assets and depreciationManagement determines the estimated useful lives and related depreciation charges for the Group’s tangible fixed assets. Management will revise the depreciation charge where useful lives are different to those previously estimated, or it will write off or write down technically obsolete or non-strategic assets that have been abandoned.
Investment propertiesThe fair values of investment properties are determined by independent valuers on an open market for existing-use basis calculated on the discounted net income allowing for reversionary potential.
Consideration has been given to assumptions that are mainly based on market conditions existing at the balance sheet date and appropriate capitalization rates. These estimates are regularly compared to actual market data and actual transactions entered into by the Group.
PlantationsThe fair values of plantations are determined by management based on the expected cash flows from the plantations.
Management applies judgement in determining the assumptions to be used; the significant ones include management’s estimate of the crude palm oil price as the basis for deriving the price of fresh fruit bunches, maintenance costs, the yield per hectare based on industry standards and historical experience and the appropriate capitalization rates.
Impairment of assetsThe Group tests annually whether goodwill and other assets that have indefinite useful lives suffered any impairment. Other assets are reviewed for impairment whenever events or changes in circumstances indicate that the carrying amount of the asset exceeds its recoverable amount. The recoverable amount of an asset or a cash generating unit is determined based on the higher of its fair value less costs to sell and its value in use, calculated on the basis of management’s assumptions and estimates. Changing the key assumptions, including the amount of estimated coal reserves, the discount rates or the growth rate assumptions in the cash flow projections, could materially affect the value-in-use calculations.
The results of the impairment reviews undertaken at 31st December 2011 on the Group’s indefinite life franchise rights indicated that no impairment charge was necessary. If there is a significant increase in the discount rate and/or a significant adverse change in the projected performance of the business to which these rights attach, it may be necessary to take an impairment charge to profit and loss in the future.
In determining when an available-for-sale equity investment is impaired, significant judgement is required. In making this judgement, the Group evaluates, among other factors, the duration and extent to which the fair value of an investment is less than its cost; and the financial health of and near-term business outlook for the investee, including factors such as industry and sector performance, changes in technology and operational and financing cash flow.

49Jardine Matheson | Annual Report 2011
Income taxesThe Group is subject to income taxes in numerous jurisdictions. Significant judgement is required in determining the worldwide provision for income taxes. There are many transactions and calculations for which the ultimate tax determination is uncertain during the ordinary course of business. Where the final tax outcome of these matters is different from the amounts that were initially recorded, such differences will impact the income tax and deferred tax provisions in the period in which such determination is made.
Provision of deferred tax follows the way management expects to recover or settle the carrying amount of the related assets or liabilities, which the management may expect to recover through use, sale or combination of both. Accordingly, deferred tax will be calculated at income tax rate, capital gains tax rate or combination of both. There is a rebuttable presumption in International Financial Reporting Standards that investment properties measured at fair value are recovered through sale. Thus, deferred tax on revaluation of investment properties held by the Group are calculated at the capital gains tax rate.
Recognition of deferred tax assets, which principally relate to tax losses, depends on the management’s expectation of future taxable profit that will be available against which the tax losses can be utilized. The outcome of their actual utilization may be different.
Pension obligationsThe present value of the pension obligations depends on a number of factors that are determined on an actuarial basis using a number of assumptions. The assumptions used in determining the net cost/income for pensions include the expected long-term rate of return on the relevant plan assets and the discount rate. Any changes in these assumptions will impact the carrying amount of pension obligations.
The expected return on plan assets assumption is determined on a uniform basis, taking into consideration long-term historical returns, asset allocation and future estimates of long-term investment returns.
The Group determines the appropriate discount rate at the end of each year. This is the interest rate that should be used to determine the present value of estimated future cash outflows expected to be required to settle the pension obligations. In determining the appropriate discount rate, the Group considers the interest rates of high-quality corporate bonds that are denominated in the currency in which the benefits will be paid and that have terms to maturity approximating the terms of the related pension obligation.
Other key assumptions for pension obligations are based in part on current market conditions.
Non-trading itemsThe Group uses underlying business performance in its internal financial reporting to distinguish between the underlying profits and non-trading items. The identification of non-trading items requires judgement by management, but follows the consistent methodology as set out in the Group’s accounting policies.

50 Jardine Matheson | Annual Report 2011 51Jardine Matheson | Annual Report 2011
Notes to the Financial Statements (continued)
4 Segmental InformationOperating segments are identified on the basis of internal reports about components of the Group that are regularly reviewed by the Board for the purpose of resource allocation and performance assessment. The Group has eight operating segments as
JardinePacific
JardineMotors
JardineLloyd
ThompsonHongkong
LandDairyFarm
MandarinOriental
JardineCycle &
Carriage Astra
Corporateand otherinterests
Intersegmenttransactions
Underlyingbusinesses
performanceNon-trading
items GroupUS$m US$m US$m US$m US$m US$m US$m US$m US$m US$m US$m US$m US$m
2011Revenue (refer note 5) 2,655 4,282 – 1,224 9,134 614 1,448 18,636 – (26) 37,967 – 37,967Net operating costs (2,583) (4,178) – (392) (8,599) (534) (1,392) (16,365) (41) 26 (34,058) 65 (33,993)Change in fair value of investment properties – – – – – – – – – – – 4,407 4,407 Operating profit 72 104 – 832 535 80 56 2,271 (41) – 3,909 4,472 8,381Net financing charges– financing charges (4) (21) – (100) (21) (15) (1) (81) (8) – (251) – (251)– financing income – – – 33 4 3 – 82 6 – 128 – 128
(4) (21) – (67) (17) (12) (1) 1 (2) – (123) – (123)Share of results of associates and joint ventures– before change in fair value of investment properties 122 – 53 77 55 10 24 650 7 – 998 (6) 992– change in fair value of investment properties – – – – – – – – – – – 238 238
122 – 53 77 55 10 24 650 7 – 998 232 1,230Profit before tax 190 83 53 842 573 78 79 2,922 (36) – 4,784 4,704 9,488Tax (11) (18) – (133) (99) (19) (11) (563) (8) – (862) (11) (873) Profit after tax 179 65 53 709 474 59 68 2,359 (44) – 3,922 4,693 8,615Non-controlling interests – (4) – (420) (173) (24) (32) (1,798) 24 – (2,427) (2,739) (5,166)
Profit attributable to shareholders 179 61 53 289 301 35 36 561 (20) – 1,495 1,954 3,449
Net (debt)/cash (excluding net debt of financial services companies)* (193) (312) – (2,359) 466 (113) (45) (66) 191 (1) (2,432)Total equity 597 401 453 24,764 1,148 1,019 650 9,484 764 (18) 39,262
2010Revenue (refer note 5) 1,286 3,288 – 1,341 7,971 513 1,320 14,360 – (26) 30,053 – 30,053Net operating costs (1,231) (3,158) – (459) (7,502) (448) (1,272) (12,583) (36) 26 (26,663) 442 (26,221)Change in fair value of investment properties – – – – – – – – – – – 3,216 3,216Operating profit 55 130 – 882 469 65 48 1,777 (36) – 3,390 3,658 7,048Net financing charges– financing charges (4) (10) – (112) (26) (15) (1) (54) (10) – (232) – (232)– financing income 1 – – 35 3 2 – 56 4 – 101 – 101
(3) (10) – (77) (23) (13) (1) 2 (6) – (131) – (131)Share of results of associates and joint ventures– before change in fair value of investment properties 117 – 48 174 47 4 23 544 16 – 973 7 980– change in fair value of investment properties – – – – – – – – – – – 731 731
117 – 48 174 47 4 23 544 16 – 973 738 1,711Sale of associates and joint ventures – – – – – – – – – – – 3 3Profit before tax 169 120 48 979 493 56 70 2,323 (26) – 4,232 4,399 8,631Tax (12) (27) – (123) (85) (12) (9) (467) (6) – (741) (106) (847)Profit after tax 157 93 48 856 408 44 61 1,856 (32) – 3,491 4,293 7,784Non-controlling interests (1) (6) – (524) (149) (17) (29) (1,419) 18 – (2,127) (2,573) (4,700)
Profit attributable to shareholders 156 87 48 332 259 27 32 437 (14) – 1,364 1,720 3,084
Net (debt)/cash (excluding net debt of financial services companies)* (8) (77) – (2,358) 223 (144) 41 (396) 465 2 (2,252)Total equity 601 349 186 19,477 954 1,008 567 7,660 1,177 (19) 31,960
Net (debt)/cash is total borrowings less bank balances and other liquid funds. Net debt of financial services companies amounted to US$3,450 million at 31st December 2011 (2010: US$2,355 million) and relates to Astra.
*
more fully described on page 4. No operating segments have been aggregated to form the reportable segments. Set out below is an analysis of the Group’s underlying profit, net debt and total equity by reportable segment.

52 Jardine Matheson | Annual Report 2011
Notes to the Financial Statements (continued)
4 Segment Information (continued)
Set out below are analyses of the Group’s underlying profit attributable to shareholders and non-current assets, by geographical areas:
2011 2010US$m US$m
Underlying profit attributable to shareholders:Greater China 615 561Southeast Asia 861 761United Kingdom 48 48Rest of the world (9) 8
1,515 1,378Corporate and other interests (20) (14)
1,495 1,364
Non-current assets*:Greater China 24,959 20,320Southeast Asia 13,096 11,088United Kingdom 922 630Rest of the world 550 501
39,527 32,539
Excluding financial instruments, deferred tax assets and pension assets.*

53Jardine Matheson | Annual Report 2011
5 Revenue
Gross revenue Revenue2011 2010 2011 2010US$m US$m US$m US$m
By business:Jardine Pacific 5,430 3,577 2,655 1,286Jardine Motors 4,282 3,288 4,282 3,288Jardine Lloyd Thompson 1,315 1,152 – –Hongkong Land 2,077 2,788 1,224 1,341Dairy Farm 10,449 9,113 9,134 7,971Mandarin Oriental 957 819 614 513Jardine Cycle & Carriage 2,957 2,577 1,448 1,320Astra 29,182 22,924 18,636 14,360Corporate and other interests 1,313 1,120 – –Intersegment transactions (656) (395) (26) (26)
57,306 46,963 37,967 30,053
By product and service:Agribusiness 1,228 974 1,228 974Engineering and construction 5,873 4,037 3,438 2,171Mining 3,175 2,208 3,175 2,208Financial services 5,102 4,249 1,319 1,122Logistics and IT services 3,077 1,707 2,539 1,143Motor vehicles 24,746 20,559 14,810 12,219Property and hotels 3,251 3,760 1,934 1,895Restaurants 1,648 1,434 390 350Retail 9,206 8,035 9,134 7,971
57,306 46,963 37,967 30,053
By geographical location of customers:Greater China 13,649 11,134 9,676 7,907Southeast Asia 38,701 31,798 25,998 20,444United Kingdom 4,142 3,297 2,071 1,500Rest of the world 814 734 222 202
57,306 46,963 37,967 30,053
Gross revenue comprises revenue together with 100% of revenue from associates and joint ventures.

54 Jardine Matheson | Annual Report 2011
Notes to the Financial Statements (continued)
6 Net Operating Costs
2011 2010US$m US$m
Cost of sales (29,368) (22,614)Other operating income 488 809Selling and distribution costs (3,428) (3,018)Administration expenses (1,645) (1,343)Other operating expenses (40) (55)
(33,993) (26,221)
The following credits/(charges) are included in net operating costs:Cost of stocks recognized as expense (26,391) (20,254)Cost of properties for sale recognized as expense (229) (309)Amortization of intangible assets (75) (57)Depreciation of tangible assets (839) (705)Impairment of intangible assets (1) (2)Write down of stocks and work in progress (35) (32)Reversal of write down of stocks and work in progress 14 9Reversal of write down of properties for sale 44 51Impairment of debtors (121) (104)Operating expenses arising from investment properties (122) (111)Employee benefit expense– salaries and benefits in kind (2,665) (2,200)– share options granted (8) (8)– defined benefit pension plans (refer note 20) (39) (45)– defined contribution pension plans (58) (48)
(2,770) (2,301)Net foreign exchange gains 18 –Operating leases– minimum lease payments (848) (747)– contingent rents (21) (15)– subleases 48 43
(821) (719)Auditors’ remuneration– audit (16) (15)– non-audit services (4) (3)
(20) (18)Dividend and interest income from available-for-sale investments 43 45Dividend and interest income from held-to-maturity investments 1 1Rental income from owner-occupied properties 28 20
Net operating costs included the following gains/(losses) from non-trading items:Increase in fair value of plantations 37 422Asset impairment (1) (1)Sale and closure of businesses 1 19Sale of property interests 15 3Acquisition-related costs (2) (2)Value added tax recovery in Jardine Motors 5 –Gain on One Hyde Park lease space 10 –Discount on acquisition of business – 1
65 442

55Jardine Matheson | Annual Report 2011
7 Net Financing Charges
2011 2010US$m US$m
Interest expense– bank loans and advances (125) (106)– other (99) (107)
(224) (213)Fair value gains/(losses) on fair value hedges 58 (42)Fair value adjustment on hedged items attributable to the hedged risk (58) 42
– –(224) (213)
Interest capitalized 2 3Commitment and other fees (29) (22)Financing charges (251) (232)Financing income 128 101
(123) (131)
8 Share of Results of Associates and Joint Ventures
2011 2010US$m US$m
By business:Jardine Pacific 122 117Jardine Motors 2 –Jardine Lloyd Thompson 51 44Hongkong Land 298 906Dairy Farm 66 47Mandarin Oriental 10 4Jardine Cycle & Carriage 24 23Astra 650 555Corporate and other interests 7 15
1,230 1,711
Share of results of associates and joint ventures included the following gains/(losses) from non-trading items:Increase in fair value of investment properties 238 731Asset impairment (17) –Sale and closure of businesses 16 –Restructuring of businesses (4) (4)Discount on acquisition of businesses – 11Other (1) –
232 738
Results are shown after tax and non-controlling interests in the associates and joint ventures.

56 Jardine Matheson | Annual Report 2011
Notes to the Financial Statements (continued)
9 Tax
2011 2010US$m US$m
Tax charged to profit and loss is analyzed as follows:Current tax (921) (750)Deferred tax 48 (97)
(873) (847)
Greater China (189) (172)Southeast Asia (676) (671)United Kingdom (5) (7)Rest of the world (3) 3
(873) (847)
Reconciliation between tax expense and tax at the applicable tax rate*:Tax at applicable tax rate (1,499) (1,304)Income not subject to tax– change in fair value of investment properties 726 532– other items 41 42Expenses not deductible for tax purposes (83) (62)Tax losses and temporary differences not recognized (29) (21)Utilization of previously unrecognized tax losses and temporary differences 12 7Recognition of previously unrecognized tax losses and temporary differences 8 –Deferred tax assets written off (1) (3)Deferred tax liabilities written back 12 3(Under)/over provision in prior years (3) 2Withholding tax (55) (42)Change in tax rates – (1)Other (2) –
(873) (847)
Tax relating to components of other comprehensive income is analyzed as follows:Revaluation of other investments – (1)Actuarial valuation of employee benefit plans 22 (5)Cash flow hedges (1) (2)
21 (8)
Share of tax charge of associates and joint ventures of US$357 million and credit of US$16 million (2010: charge of US$299 million and US$3 million) are included in share of results of associates and joint ventures and share of other comprehensive income of associates and joint ventures, respectively.
The applicable tax rate for the year was 18.1% (2010: 18.9%) and represents the weighted average of the rates of taxation prevailing in the territories in which the Group operates. The decrease in applicable tax rate was caused by a change in the geographic mix of the Group’s profitability and a reduction in the income tax rate in Indonesia.
*

57Jardine Matheson | Annual Report 2011
10 Earnings per ShareBasic earnings per share are calculated on profit attributable to shareholders of US$3,449 million (2010: US$3,084 million) and on the weighted average number of 362 million (2010: 359 million) shares in issue during the year.
Diluted earnings per share are calculated on profit attributable to shareholders of US$3,435 million (2010: US$3,006 million), which is after adjusting for the effects of the conversion of dilutive potential ordinary shares of subsidiaries, associates or joint ventures, and on the weighted average number of 363 million (2010: 360 million) shares in issue during the year.
The weighted average number of shares is arrived at as follows:
Ordinary sharesin millions
2011 2010
Weighted average number of shares in issue 653 643Shares held by the Trustee under the Senior Executive Share Incentive Schemes – (1)Company’s share of shares held by subsidiaries (291) (283)Weighted average number of shares for basic earnings per share calculation 362 359Adjustment for shares deemed to be issued for no consideration under the Senior Executive Share Incentive Schemes 1 1
Weighted average number of shares for diluted earnings per share calculation 363 360
Additional basic and diluted earnings per share are also calculated based on underlying profit attributable to shareholders. A reconciliation of earnings is set out below:
2011 2010Basic
earnings per share
Dilutedearnings
per share
Basicearnings
per share
Dilutedearnings
per shareUS$m US$ US$ US$m US$ US$
Profit attributable to shareholders 3,449 9.53 9.46 3,084 8.58 8.34Non-trading items (refer note 11) (1,954) (1,720)
Underlying profit attributable to shareholders 1,495 4.13 4.11 1,364 3.80 3.77

58 Jardine Matheson | Annual Report 2011
Notes to the Financial Statements (continued)
11 Non-trading Items
2011 2010US$m US$m
By business:Jardine Pacific 37 26Jardine Motors 6 –Jardine Lloyd Thompson (2) (4)Hongkong Land 1,894 1,621Dairy Farm 7 1Mandarin Oriental 5 –Astra 7 76
1,954 1,720
An analysis of non-trading items after interest, tax and non-controlling interests is set out below:Increase in fair value of investment properties– Hongkong Land 1,901 1,621– other 23 18
1,924 1,639Increase in fair value of plantations 6 71Asset impairment (8) (1)Sale and closure of businesses 13 9Sale of property interests 15 3Acquisition-related costs (2) (2)Restructuring of businesses (4) (4)Value added tax recovery in Jardine Motors 5 –Gain on One Hyde Park lease space 6 –Discount on acquisition of businesses – 5Other (1) –
1,954 1,720

59Jardine Matheson | Annual Report 2011
12 Intangible Assets
GoodwillFranchise
rightsLeasehold
landConcession
rights Other TotalUS$m US$m US$m US$m US$m US$m
2011Cost 953 235 592 168 214 2,162Amortization and impairment (4) – (98) (9) (93) (204)Net book value at 1st January 949 235 494 159 121 1,958Exchange differences (9) (2) (6) (7) (1) (25)New subsidiaries 113 2 1 138 18 272Additions – – 89 50 77 216Disposals (2) – – – – (2)Revaluation surplus before transfer to investment properties – – 27 – – 27Transfer to tangible assets and investment properties – – (31) – (29) (60)Amortization – – (23) (4) (48) (75)Impairment charge – – – – (1) (1)
Net book value at 31st December 1,051 235 551 336 137 2,310
Cost 1,055 235 670 349 279 2,588Amortization and impairment (4) – (119) (13) (142) (278)
1,051 235 551 336 137 2,310
2010Cost 870 225 533 140 131 1,899Amortization and impairment (3) – (76) (5) (56) (140)Net book value at 1st January 867 225 457 135 75 1,759Exchange differences 38 10 21 6 4 79New subsidiaries 44 – – – – 44Additions 1 – 51 22 77 151Disposals – – (16) – – (16)Amortization – – (19) (4) (34) (57)Impairment charge (1) – – – (1) (2)
Net book value at 31st December 949 235 494 159 121 1,958
Cost 953 235 592 168 214 2,162Amortization and impairment (4) – (98) (9) (93) (204)
949 235 494 159 121 1,958
2011 2010US$m US$m
Goodwill allocation by business:Jardine Pacific 90 12Jardine Motors 48 17Dairy Farm 463 468Mandarin Oriental 40 40Astra 410 412
1,051 949

60 Jardine Matheson | Annual Report 2011
Notes to the Financial Statements (continued)
12 Intangible Assets (continued)
Goodwill relating to Dairy Farm is allocated to groups of cash-generating units identified by geographical segments. Cash flow projections for impairment reviews are based on budgets prepared on the basis of assumptions reflective of the prevailing market conditions, and are discounted appropriately. Key assumptions used for value-in-use calculations include budgeted gross margins of between 24% and 49% and growth rates of up to 5% to extrapolate cash flows, which vary across the group’s business segments and geographical locations, over a five-year period, and are based on management expectations for the market development; and pre-tax discount rates of between 7% and 17% applied to the cash flow projections. The discount rates used reflect business specific risks relating to the relevant industry, business life-cycle and geographical location. On the basis of these reviews, management concluded that no impairment is required.
Goodwill relating to Astra has been allocated to the operating segment of Astra. Accordingly, for the purpose of impairment review, the carrying value of Astra is compared with the recoverable amount measured by reference to the quoted market price of the shares held. On the basis of this review and the continued expected level of profitability, management concluded that no impairment has occurred.
Franchise rights are rights under franchise agreements with automobile and heavy equipment manufacturers. These franchise agreements are deemed to have indefinite lives because either they do not have any term of expiry or their renewal would be probable and would not involve significant costs, taking into account the history of renewal and the relationships between the franchisee and the contracting parties. The carrying amounts of franchise rights, which comprised automotive of US$84 million and heavy equipment of US$149 million, are not amortized as such rights will contribute cash flows for an indefinite period. Management has performed an impairment review of the carrying amounts of franchise rights at 31st December 2011 and has concluded that no impairment has occurred. The impairment review was made by comparing the carrying amounts of the cash-generating units in which the franchise rights reside with the recoverable amounts of the cash-generating units. The recoverable amounts of the cash-generating units are determined based on value-in-use calculations. These calculations use pre-tax cash flow projections based on budgets covering a three-year period. Cash flows beyond the three-year period are extrapolated using growth rates of between 3% and 4%. Pre-tax discount rates of between 17% and 18%, reflecting business specific risks, are applied to the cash flow projections.
Other intangible assets comprised trademarks, computer software, hotel development costs, deferred acquisition costs for insurance contracts and customer contracts.
At 31st December 2011, the carrying amount of leasehold land pledged as security for borrowings amounted to US$13 million (2010: US$5 million) (refer note 31).
The amortization charges are all recognized in arriving at operating profit and are included in cost of sales, selling and distribution costs and administration expenses.
The remaining amortization periods for intangible assets are as follows:
Leasehold land 1 to 88 yearsConcession rights 36 yearsComputer software 0 to 7 yearsOther 1 to 40 years

61Jardine Matheson | Annual Report 2011
13 Tangible Assets
Freeholdproperties
Leaseholdproperties
Leaseholdimprove-
mentsMining
propertiesPlant &
machinery
Furniture,equipment
& motorvehicles Total
US$m US$m US$m US$m US$m US$m US$m
2011Cost 556 1,788 845 299 2,685 1,738 7,911Depreciation and impairment (62) (330) (487) (52) (1,255) (909) (3,095)Net book value at 1st January 494 1,458 358 247 1,430 829 4,816Exchange differences (7) (3) (9) (15) (23) (15) (72)New subsidiaries 3 1 5 400 6 3 418Additions 54 217 113 22 765 525 1,696Disposals (3) (1) (5) – (3) (13) (25)Revaluation surplus before transfer to investment properties – 4 – – – – 4Transfer to investment properties, and stocks and work in progress – (6) – – (17) (31) (54)Transfer from intangible assets – 22 – – – 7 29Depreciation charge (5) (61) (80) (22) (428) (243) (839)Classified as non-current assets held for sale (19) (30) – – – – (49)
Net book value at 31st December 517 1,601 382 632 1,730 1,062 5,924
Cost 591 1,972 900 705 3,307 2,070 9,545Depreciation and impairment (74) (371) (518) (73) (1,577) (1,008) (3,621)
517 1,601 382 632 1,730 1,062 5,924
2010Cost 499 1,525 705 272 2,104 1,476 6,581Depreciation and impairment (45) (269) (398) (35) (886) (832) (2,465)Net book value at 1st January 454 1,256 307 237 1,218 644 4,116Exchange differences (5) 40 13 11 58 33 150New subsidiaries – 15 18 – 5 2 40Additions 62 139 90 15 514 394 1,214Disposals (11) (9) (3) – (5) (17) (45)Transfer to investment properties, and stocks and work in progress – (1) – – – (27) (28)Depreciation charge (6) (56) (67) (16) (360) (200) (705)Reclassified from non-current assets held for sale – 74 – – – – 74
Net book value at 31st December 494 1,458 358 247 1,430 829 4,816
Cost 556 1,788 845 299 2,685 1,738 7,911Depreciation and impairment (62) (330) (487) (52) (1,255) (909) (3,095)
494 1,458 358 247 1,430 829 4,816
Freehold properties include a hotel property of US$101 million (2010: US$102 million), which is stated net of a grant of US$26 million (2010: US$27 million).
Net book value of leasehold properties and plant and machinery acquired under finance leases amounted to US$282 million and US$107 million (2010: US$298 million and US$89 million), respectively.
At 31st December 2011, the carrying amount of tangible assets pledged as security for borrowings amounted to US$837 million (2010: US$949 million) (refer note 31).

62 Jardine Matheson | Annual Report 2011
Notes to the Financial Statements (continued)
14 Investment Properties
Freeholdproperties
Leaseholdproperties Total
US$m US$m US$m
2011At 1st January 13 18,413 18,426Exchange differences (1) 28 27Additions 34 50 84Disposals – (2) (2)Transfer from intangible and tangible assets – 37 37Net increase in fair value 5 4,402 4,407
At 31st December 51 22,928 22,979
2010At 1st January 12 15,189 15,201Exchange differences 1 (9) (8)Additions – 30 30Disposals – (14) (14)Transfer from tangible assets – 1 1Net increase in fair value – 3,216 3,216
At 31st December 13 18,413 18,426
The fair value of the Group’s investment properties at 31st December 2011, which were principally held by Hongkong Land, has been determined on the basis of valuations carried out by independent valuers not related to the Group. Hongkong Land employed Jones Lang LaSalle to value its commercial investment properties. The valuations, which conform to the International Valuation Standards issued by the International Valuation Standards Committee and the HKIS Valuation Standards on Properties issued by the Hong Kong Institute of Surveyors, were arrived at by reference to the net income allowing for reversionary potential of each property.
Rental income from investment properties amounted to US$696 million (2010: US$677 million) including contingent rents of US$12 million (2010: US$10 million).
Future minimum rental payments receivable under non-cancellable leases are as follows:
2011 2010US$m US$m
Within one year 640 604Between one and two years 483 378Between two and five years 479 402Beyond five years 79 76
1,681 1,460
Generally the Group’s operating leases in respect of investment properties are for terms of three or more years.
The Group’s investment properties had not been pledged as security for borrowings at 31st December 2010 and 2011.

63Jardine Matheson | Annual Report 2011
15 PlantationsThe Group’s plantation assets are primarily for the production of palm oil.
2011 2010US$m US$m
Movements for the year:At 1st January 954 425Exchange differences (12) 24Additions 83 94Disposals (4) (11)Net increase in fair value 37 422
At 31st December 1,058 954
Immature plantations 253 261Mature plantations 805 693
1,058 954
The plantations were valued internally at their fair values less point of sale costs using the discounted cash flow method. The major assumptions used in the valuation of the 207,087 (2010: 206,549) hectares of plantations are as follows:
2011 2010
Crude palm oil price per tonne (US$) 889 745Annual price inflation (for the first five years) (%) 11 10Annual cost inflation (for the first five years) (%) 6 6Post-tax discount rates (%) 14 14
During the year, the Group harvested 3.6 million (2010: 3.3 million) tonnes of produce from the plantations with a fair value at the point of harvest less point of sale costs of US$638 million (2010: US$509 million).

64 Jardine Matheson | Annual Report 2011
Notes to the Financial Statements (continued)
16 Associates and Joint Ventures
2011 2010US$m US$m
Listed associates– Jardine Lloyd Thompson 231 182– PT Tunas Ridean 73 60– OHTL 16 17
320 259Unlisted associates 872 709
1,192 968Listed joint venture – Bank Permata 501 441Unlisted joint ventures 5,187 4,790
5,688 5,231Share of attributable net assets 6,880 6,199Goodwill on acquisition 376 186
7,256 6,385
By business:Jardine Pacific 331 340Jardine Motors 1 2Jardine Lloyd Thompson 453 186Hongkong Land 3,551 3,177Dairy Farm 196 163Mandarin Oriental 82 82Jardine Cycle & Carriage 203 187Astra 2,202 2,025Corporate and other interests 237 223
7,256 6,385
Movements of associates and joint ventures for the year:At 1st January 6,385 4,811Share of results after tax and non-controlling interests 1,230 1,711Discount on acquisition of associates and joint ventures – (11)Share of other comprehensive income after tax and non-controlling interests (130) 253Dividends received (736) (736)Share of employee share options granted 9 10Acquisitions and increases in attributable interests 617 599Disposals and decreases in attributable interests (119) (276)Reclassification of subsidiaries as associates and joint ventures – 22Advance of mezzanine loan 1 –Other (1) 2
At 31st December 7,256 6,385
Fair value of listed associates 1,170 878
Fair value of listed joint venture 603 801

65Jardine Matheson | Annual Report 2011
16 Associates and Joint Ventures (continued)
The Group’s share of assets, liabilities, capital commitments, contingent liabilities and results of associates and joint ventures are summarized below:
2011 2010US$m US$m
AssociatesTotal assets 4,343 3,843Total liabilities (3,013) (2,738)Total equity 1,330 1,105Attributable to non-controlling interests (138) (137)
Attributable net assets 1,192 968
Revenue 3,565 2,793Profit after tax 280 236
Capital commitments 171 165Contingent liabilities – –
Joint venturesNon-current assets 6,894 5,064Current assets 6,988 6,466Non-current liabilities (1,861) (1,391)Current liabilities (6,278) (4,896)Total equity 5,743 5,243Attributable to non-controlling interests (55) (12)
Attributable net assets 5,688 5,231
Revenue 8,329 7,198Profit after tax 1,014 1,506
Capital commitments 81 143Contingent liabilities 196 150
Financial guarantees issued by the Group to associates and joint ventures and outstanding at 31st December 2011 amounted to US$90 million (2010: US$22 million).

66 Jardine Matheson | Annual Report 2011
Notes to the Financial Statements (continued)
17 Other Investments
2011 2010US$m US$m
Available-for-sale financial assetsListed securities– Asia Commercial Bank 70 91– Schindler Holdings 147 152– Tata Power 114 212– The Bank of N.T. Butterfield & Son 28 30– other 605 426
964 911Unlisted securities 129 126
1,093 1,037Held-to-maturity financial assetsListed securities 7 13
1,100 1,050
Non-current 1,095 1,044Current 5 6
1,100 1,050
Analysis by geographical area of operation:Greater China 88 94Southeast Asia 822 722Rest of the world 190 234
1,100 1,050
Movements for the year:At 1st January 1,050 844Exchange differences (10) 15Additions 266 231Disposals (122) (110)Net revaluation (deficit)/surplus (84) 70
At 31st December 1,100 1,050
The fair value measurements of available-for-sale financial assets are based on the following data:
2011 2010US$m US$m
Quoted prices in active markets 964 911Observable current market transactions 36 31Unobservable inputs 93 95
1,093 1,037

67Jardine Matheson | Annual Report 2011
17 Other Investments (continued)
Movements of available-for-sale financial assets which are valued based on unobservable inputs are as follows:
2011 2010US$m US$m
At 1st January 95 56Exchange differences (1) 4Additions 2 36Net revaluation deficit (3) (1)
At 31st December 93 95
The fair value of held-to-maturity financial assets is US$7 million (2010: US$13 million).
18 Debtors
2011 2010US$m US$m
Consumer financing debtors– gross 3,953 2,971– provision for impairment (206) (178)
3,747 2,793Financing lease receivables– net investment 798 548– provision for impairment (19) (15)
779 533Trade debtors– third parties 2,293 1,529– associates and joint ventures 62 50
2,355 1,579– provision for impairment (26) (24)
2,329 1,555Other debtors– third parties 1,354 961– associates and joint ventures 159 154
1,513 1,115– provision for impairment (11) (13)
1,502 1,102
8,357 5,983
Non-current 2,512 1,898Current 5,845 4,085
8,357 5,983
Analysis by geographical area of operation:Greater China 878 591Southeast Asia 7,346 5,287United Kingdom 78 52Rest of the world 55 53
8,357 5,983

68 Jardine Matheson | Annual Report 2011
Notes to the Financial Statements (continued)
18 Debtors (continued)
2011 2010US$m US$m
Fair value:Consumer financing debtors 3,840 2,929Financing lease receivables 711 485Trade debtors 2,329 1,555Other debtors* 759 549
7,639 5,518
Excluding prepayments, rental and other deposits.
Consumer financing debtorsThe consumer financing debtors relate primarily to Astra’s motor vehicle and motorcycle financing. Before accepting any new customer, the group assesses the potential customer’s credit quality and sets credit limits by customer using internal grading systems. The group obtains collateral in the form of motor vehicles and motorcycles from consumer financing debtors who give the group the right to sell the repossessed collateral or take any other action to settle the outstanding debt.
The loan repayment period ranges from 12 to 36 months for both motor vehicles and motorcycles. Significant financial difficulties of the debtor, probability that the debtor will enter bankruptcy or financial reorganization, and default or delinquency in payment are considered indicators that the debtor is impaired. An allowance for impairment is made based on an assessment with reference to historical loss experience and when there is an objective evidence that the outstanding amounts will probably not be collected. Assets are repossessed if monthly instalments are overdue for 30 days for motor vehicles and 60 days for motorcycles. Management has considered the balances against which collective impairment provision is made as impaired.
The maturity analysis of consumer financing debtors, including related finance income, at 31st December is as follows:
2011 2010US$m US$m
Within one year 2,887 2,192Between one and two years 1,394 1,032Between two and five years 749 653
5,030 3,877
Financing lease receivablesAn analysis of financing lease receivables is set out below:
2011 2010US$m US$m
Lease receivables 910 630Guaranteed residual value 248 185Security deposits (248) (185)Gross investment 910 630Unearned lease income (112) (82)
Net investment 798 548
*

69Jardine Matheson | Annual Report 2011
18 Debtors (continued)
The maturity analyses of financing lease receivables at 31st December are as follows:
2011 2010Gross
investmentNet
investmentGross
investmentNet
investmentUS$m US$m US$m US$m
Within one year 506 428 348 291Between one and two years 304 275 205 184Between two and five years 99 94 77 73Beyond five years 1 1 – –
910 798 630 548
Trade and other debtorsThe average credit period on sale of goods and services varies among Group businesses and is generally not more than 60 days. Before accepting any new customer, the individual Group business assesses the potential customer’s credit quality and sets credit limits by customer using internal credit scoring systems. These limits and scoring are reviewed periodically.
An allowance for impairment of trade and other debtors is made based on the estimated irrecoverable amount. Significant financial difficulties of the debtor, probability that the debtor will enter bankruptcy or financial reorganization, and default or delinquency in payment are considered indicators that the debtor is impaired.
At 31st December 2011, trade debtors of US$60 million (2010: US$31 million) and other debtors of US$11 million (2010: US$14 million) were impaired. The amounts of the provisions were US$26 million (2010: US$24 million) and US$11 million (2010: US$13 million), respectively. It was assessed that a portion of the debtors is expected to be recovered. The ageing analysis of these debtors is as follows:
Trade debtors Other debtors2011 2010 2011 2010US$m US$m US$m US$m
Below 30 days 1 3 1 9Between 31 and 60 days 1 4 – –Between 61 and 90 days 3 2 – –Over 90 days 55 22 10 5
60 31 11 14
At 31st December 2011, trade debtors of US$763 million (2010: US$387 million) and other debtors of US$29 million (2010: US$47 million), respectively, were past due but not impaired. The ageing analysis of these debtors is as follows:
Trade debtors Other debtors2011 2010 2011 2010US$m US$m US$m US$m
Below 30 days 361 205 8 9Between 31 and 60 days 250 98 6 1Between 61 and 90 days 111 48 1 13Over 90 days 41 36 14 24
763 387 29 47
The risk of trade and other debtors that are neither past due nor impaired at 31st December 2011 becoming impaired is low as they have a good track record with the Group. Based on past experience, management believes that no impairment allowance is necessary in respect of these balances as there has not been a significant change in credit quality and the balances are still considered fully recoverable.

70 Jardine Matheson | Annual Report 2011
Notes to the Financial Statements (continued)
18 Debtors (continued)
Other debtorsOther debtors are further analyzed as follows:
2011 2010US$m US$m
Prepayments 546 381Rental and other deposits 161 147Mezzanine loans – 5Derivative financial instruments 132 62Restricted bank balances and deposits (refer note 23) 10 10Loans to employees 39 32Other amounts due from associates and joint ventures 159 152Repossessed assets of finance companies 12 17Reinsurers’ share of estimated losses on insurance contracts 73 44Other 370 252
1,502 1,102
Restricted bank balances and deposits comprise cash and time deposits which are either restricted for interest payments or placed as margin deposits for letter of credit facilities obtained by certain subsidiaries and guarantee deposits to third parties.
Repossessed assets of finance companies represent collateral obtained from customers towards settlement of automobile and motorcycle receivables which are in default. The fair value of the collateral held amounted to US$12 million (2010: US$17 million). The finance company is given the right by the customers to sell the repossessed collateral. Any excess of proceeds from the sale over the outstanding receivables is refunded to the customer.
Debtors other than derivative financial instruments and reinsurers’ share of estimated losses on insurance contracts are stated at amortized cost. The fair value of these debtors is estimated using the expected future receipts discounted at market rates ranging from 7% to 19% (2010: 7% to 29%) per annum. Derivative financial instruments are stated at fair value.
Movements in the provisions for impairment are as follows:
Consumerfinancing debtors
Financinglease receivables Trade debtors Other debtors
2011 2010 2011 2010 2011 2010 2011 2010US$m US$m US$m US$m US$m US$m US$m US$m
At 1st January (178) (133) (15) (13) (24) (29) (13) (11)Exchange differences 3 (6) 1 (1) – (1) – –New subsidiaries – – – – (2) – – –Additional provisions (112) (101) (5) (1) (8) (4) (3) (2)Unused amounts reversed – – – – 5 4 2 –Amounts written off 81 62 – – 3 6 3 –
At 31st December (206) (178) (19) (15) (26) (24) (11) (13)
At 31st December 2011, the carrying amount of consumer financing debtors, financing lease receivables and trade debtors pledged as security for borrowings amounted to US$2,017 million, US$353 million and US$1 million (2010: US$1,376 million, US$332 million and US$1 million), respectively (refer note 31).

71Jardine Matheson | Annual Report 2011
19 Deferred Tax Assets/(Liabilities)
Acceleratedtax
depreciation
Fair valuegains/losses Losses
Employeebenefits
Provisionsand other
temporarydifferences Total
US$m US$m US$m US$m US$m US$m
2011At 1st January (169) (400) 20 27 83 (439)Exchange differences – 7 – – (3) 4New subsidiaries 1 (107) – – – (106)Credited to profit and loss (2) (14) 3 4 57 48Credited to other comprehensive income – (1) – 22 – 21
At 31st December (170) (515) 23 53 137 (472)
Deferred tax assets 57 (54) 16 44 118 181Deferred tax liabilities (227) (461) 7 9 19 (653)
(170) (515) 23 53 137 (472)
2010At 1st January (142) (275) 19 30 50 (318)Exchange differences (3) (12) – 1 3 (11)Subsidiaries disposed of – (5) – – – (5)Charged to profit and loss (24) (105) 1 1 30 (97)Charged to other comprehensive income – (3) – (5) – (8)
At 31st December (169) (400) 20 27 83 (439)
Deferred tax assets 50 (57) 18 29 93 133Deferred tax liabilities (219) (343) 2 (2) (10) (572)
(169) (400) 20 27 83 (439)
Deferred tax balances predominantly comprise non-current items. Deferred tax assets and liabilities are netted when the taxes relate to the same taxation authority and where offsetting is allowed.
Deferred tax assets of US$97 million (2010: US$89 million) arising from unused tax losses of US$417 million (2010: US$390 million) have not been recognized in the financial statements. Included in the unused tax losses, US$219 million have no expiry date and the balance will expire at various dates up to and including 2020.
Deferred tax liabilities of US$290 million (2010: US$228 million) arising on temporary differences associated with investments in subsidiaries of US$2,899 million (2010: US$2,283 million) have not been recognized as there is no current intention of remitting the retained earnings of these subsidiaries to the holding companies in the foreseeable future.

72 Jardine Matheson | Annual Report 2011
Notes to the Financial Statements (continued)
20 Pension PlansThe Group has a number of defined benefit pension plans, covering all the main territories in which it operates with the major plans relating to employees in Hong Kong, Indonesia and the United Kingdom. Most of the pension plans are final salary defined benefit plans and are either funded or unfunded. The assets of the funded plans are held independently of the Group’s assets in separate trustee administered funds. The Group’s major plans are valued by independent actuaries annually using the projected unit credit method.
The principal actuarial assumptions used for accounting purposes at 31st December are as follows:
2011 2010Weighted
averageWeighted
average% %
Discount rate applied to pension obligations 5.4 5.9Expected return on plan assets 7.0 7.5Future salary increases 5.1 5.1
The expected return on plan assets is determined on the basis of long-term average returns on global equities of 3.8% to 11.4% per annum and global bonds of 2.8% to 10% per annum, and the long-term benchmark allocation of assets between equities and bonds in each plan.
The amounts recognized in the consolidated balance sheet are as follows:
2011 2010US$m US$m
Fair value of plan assets 898 924Present value of funded obligations (948) (846)
(50) 78Present value of unfunded obligations (192) (169)Unrecognized past service cost 17 17
Net pension liabilities (225) (74)
Analysis of net pension liabilities:Pension assets 34 102Pension liabilities (259) (176)
(225) (74)
Movements in the fair value of plan assets:At 1st January 924 858Exchange differences (3) (8)New subsidiaries 1 4Expected return on plan assets 70 62Actuarial (losses)/gains (81) 35Contributions from sponsoring companies 27 35Contributions from plan members 4 4Benefits paid (45) (56)Curtailment and settlement – (6)Transfer to other plans 1 (4)
At 31st December 898 924

73Jardine Matheson | Annual Report 2011
20 Pension Plans (continued)
2011 2010US$m US$m
Movements in the present value of obligations:At 1st January (1,015) (960)Exchange differences 5 (3)New subsidiaries (1) (6)Subsidiaries disposed of – 1Current service cost (50) (46)Interest cost (59) (59)Contributions from plan members (4) (4)Actuarial losses (69) (12)Benefits paid 52 56Settlement of unfunded obligations – 8Curtailment and settlement – 6Plan amendment 2 –Transfer to other plans (1) 4
At 31st December (1,140) (1,015)
The analysis of the fair value of plan assets at 31st December is as follows:
2011 2010US$m US$m
Equity instruments 438 463Debt instruments 363 342Other assets 97 119
898 924
The five year history of experience adjustments is as follows:
2011 2010 2009 2008 2007US$m US$m US$m US$m US$m
Fair value of plan assets 898 924 858 637 1,018Present value of obligations (1,140) (1,015) (960) (765) (949)
(Deficit)/surplus (242) (91) (102) (128) 69
Experience adjustments on plan assets (81) 35 118 (277) 34Percentage of plan assets (%) (9) 4 14 (44) 3
Experience adjustments on plan obligations (23) 22 (46) 34 8Percentage of plan obligations (%) (2) 2 (5) 4 1
The estimated amount of contributions expected to be paid to the plans in 2012 is US$47 million.

74 Jardine Matheson | Annual Report 2011
Notes to the Financial Statements (continued)
20 Pension Plans (continued)
The amounts recognized in profit and loss are as follows:
2011 2010US$m US$m
Current service cost 50 46Interest cost 59 59Expected return on plan assets (70) (62)Past service cost – 2
39 45
Actual (loss)/return on plan assets in the year (11) 97
The above amounts are all recognized in arriving at operating profit and are included in cost of sales, selling and distribution costs and administration expenses.
21 Properties for Sale
2011 2010US$m US$m
Properties in the course of development 1,374 987Completed properties 147 197
1,521 1,184
At 31st December 2011, the carrying amount of properties for sale pledged as security for borrowings amounted to US$294 million (2010: US$405 million) (refer note 31).
22 Stocks and Work in Progress
2011 2010US$m US$m
Finished goods 2,980 2,399Work in progress 43 28Raw materials 87 76Spare parts 72 97Other 94 80
3,276 2,680
At 31st December 2011, the carrying amount of stocks and work in progress pledged as security for borrowings amounted to US$2 million. At 31st December 2010, the Group’s stocks and work in progress were not pledged as security for borrowings (refer note 31).

75Jardine Matheson | Annual Report 2011
23 Bank Balances and Other Liquid Funds
2011 2010US$m US$m
Deposits with banks and financial institutions 2,684 3,380Bank balances 1,406 810Cash balances 105 95
4,195 4,285Less restricted bank balances and deposits (refer note 18) (10) (10)
4,185 4,275
Analysis by currency:Chinese renminbi 156 118Euro 24 16Hong Kong dollar 537 703Indonesian rupiah 1,065 624Japanese yen 19 24Malaysian ringgit 130 62New Taiwan dollar 53 33Singapore dollar 219 356Thailand baht 17 14United Kingdom sterling 29 20United States dollar 1,909 2,290Other 27 15
4,185 4,275
The weighted average interest rate on deposits with banks and financial institutions is 2.3% (2010: 1.2%) per annum.
24 Non-current Assets Classified as Held for SaleThe major class of assets classified as held for sale is set out below:
2011 2010US$m US$m
Tangible assets 47 –
At 31st December 2011, the non-current assets classified as held for sale included Dairy Farm’s interest in two retail properties in Malaysia and one retail property in Singapore.

76 Jardine Matheson | Annual Report 2011
Notes to the Financial Statements (continued)
25 Share Capital
2011 2010US$m US$m
Authorized:1,000,000,000 shares of US¢25 each 250 250
Ordinary sharesin millions 2011 2010
2011 2010 US$m US$m
Issued and fully paid:At 1st January 648 637 162 159Scrip issued in lieu of dividends 11 10 3 3Issued under employee share option schemes – 1 – –
At 31st December 659 648 165 162
26 Senior Executive Share Incentive SchemesThe Senior Executive Share Incentive Schemes were set up in order to provide selected executives with options to purchase ordinary shares in the Company.
The exercise price of the granted options is based on the average market price for the five trading days immediately preceding the date of grant of the options. Options are vested in tranches over a period of up to five years and are exercisable for up to ten years following the date of grant. Prior to the adoption of the 2005 Plan on 5th May 2005, ordinary shares were issued on the date of grant of the options to the Trustee of the Schemes, Clare Investment Overseas (PTC) Limited, a wholly-owned subsidiary, which holds the ordinary shares until the options are exercised. Under the 2005 Plan, ordinary shares may be issued upon exercise of the options.
The shares issued under the Schemes held on trust by the wholly-owned subsidiary are, for presentation purposes, netted off the Company’s share capital in the consolidated balance sheet (refer note 25) and the premium attached to them is netted off the share premium account (refer note 27).
Movements for the year:
2011 2010Weighted
averageexercise
price Optionsin millions
Weightedaverageexercise
price Optionsin millionsUS$ US$
At 1st January 22.8 1.8 18.9 2.0Granted 46.6 0.5 32.2 0.3Exercised 11.5 (0.1) 13.0 (0.5)
At 31st December 28.2 2.2 22.8 1.8
The average share price during the year was US$49.8 (2010: US$38.2) per share.

77Jardine Matheson | Annual Report 2011
26 Senior Executive Share Incentive Schemes (continued)
Outstanding at 31st December:
Exerciseprice
Optionsin millions
Expiry date US$ 2011 2010
2014 9.8 – 0.12015 18.2 – 18.4 0.1 0.12016 18.2 0.1 0.12017 21.7 0.6 0.62018 27.3 0.3 0.32019 16.7 – 24.5 0.3 0.32020 32.2 0.3 0.32021 45.7 – 46.8 0.5 –
Total outstanding 2.2 1.8
of which exercisable 0.8 0.5
The fair value of options granted during the year, determined using the Trinomial valuation model, was US$6 million (2010: US$4 million). The significant inputs into the model, based on the weighted average number of options issued, were share price of US$45.4 (2010: US$34.1) at the grant dates, exercise price shown above, expected volatility based on the last seven years of 32.1% (2010: 33.1%), dividend yield of 2.2% (2010: 2.5%), option life disclosed above, and annual risk-free interest rate of 2.7% (2010: 3.1%). Options are assumed to be exercised at the end of the seventh year following the date of grant.
27 Share Premium and Capital Reserves
Sharepremium
Capitalreserves Total
US$m US$m US$m
2011At 1st January 13 59 72Capitalization arising on scrip issued in lieu of dividends (3) – (3)Employee share option schemes– exercise of share options 1 – 1– value of employee services – 15 15At 31st December 11 74 85Outstanding under employee share option schemes (3) – (3)
8 74 82
2010At 1st January 12 44 56Capitalization arising on scrip issued in lieu of dividends (2) – (2)Employee share option schemes– exercise of share options 2 – 2– value of employee services – 16 16Transfer 1 (1) –At 31st December 13 59 72Outstanding under employee share option schemes (3) – (3)
10 59 69
Capital reserves represent the value of employee services under the Group’s employee share option schemes. At 31st December 2011, US$10 million (2010: US$7 million) relate to the Company’s Senior Executive Share Incentive Schemes.

78 Jardine Matheson | Annual Report 2011
Notes to the Financial Statements (continued)
28 Dividends
2011 2010US$m US$m
Final dividend in respect of 2010 of US¢85.00 (2009: US¢65.00) per share 551 414Interim dividend in respect of 2011 of US¢33.00 (2010: US¢30.00) per share 216 194
767 608Company’s share of dividends paid on the shares held by subsidiaries (340) (267)
427 341
Shareholders elected to receive scrip in respect of the following:Final dividend in respect of previous year 376 258Interim dividend in respect of current year 147 130
523 388
A final dividend in respect of 2011 of US¢92.00 (2010: US¢85.00) per share amounting to a total of US$606 million (2010: US$551 million) is proposed by the Board. The dividend proposed will not be accounted for until it has been approved at the Annual General Meeting. The net amount after deducting the Company’s share of the dividends payable on the shares held by subsidiaries of US$273 million (2010: US$244 million) will be accounted for as an appropriation of revenue reserves in the year ending 31st December 2012.
29 Own Shares HeldOwn shares held of US$1,855 million (2010: US$1,501 million) represent the Company’s share of the cost of 361 million (2010: 352 million) ordinary shares in the Company held by subsidiaries and are deducted in arriving at shareholders’ funds.
30 Non-controlling Interests
2011 2010US$m US$m
By business:Hongkong Land 14,547 11,438Dairy Farm 378 307Mandarin Oriental 362 361Jardine Cycle & Carriage 211 180Astra 7,193 5,750Jardine Strategic 590 531Other 31 26
23,312 18,593Less own shares held attributable to non-controlling interests (406) (343)
22,906 18,250

79Jardine Matheson | Annual Report 2011
31 Borrowings
2011 2010Carryingamount
Fairvalue
Carryingamount
Fairvalue
US$m US$m US$m US$m
Current– bank overdrafts 27 27 7 7– other bank advances 967 967 762 762– other advances 5 5 – –
999 999 769 769Current portion of long-term borrowings– bank loans 1,414 1,414 1,240 1,240– bonds and notes 494 494 1,315 1,315– finance lease liabilities 47 47 36 36– other loans 63 63 100 100
2,018 2,018 2,691 2,6913,017 3,017 3,460 3,460
Long-term borrowings– bank loans 4,002 4,024 2,468 2,479– bonds and notes 2,925 2,976 2,829 2,810– finance lease liabilities 59 59 47 47– other loans 64 64 78 78
7,050 7,123 5,422 5,414
10,067 10,140 8,882 8,874
The fair values are based on market prices or are estimated using the expected future payments discounted at market interest rates ranging from 0.6% to 13.0% (2010: 0.4% to 12.8%) per annum. The fair value of current borrowings approximates their carrying amount, as the impact of discounting is not significant.
2011 2010US$m US$m
Secured 4,475 3,437Unsecured 5,592 5,445
10,067 8,882
Secured borrowings at 31st December 2011 included Hongkong Land’s bank borrowings of nil (2010: US$41 million) which were secured against its properties for sale, Mandarin Oriental’s bank borrowings of US$541 million (2010: US$542 million) which were secured against its tangible assets, and Astra’s bonds and notes of US$1,155 million (2010: US$808 million) which were secured against its various assets as described below and bank borrowings of US$2,779 million (2010: US$2,046 million) which were secured against its various assets.

80 Jardine Matheson | Annual Report 2011
Notes to the Financial Statements (continued)
31 Borrowings (continued)
Fixed rate borrowingsWeighted
averageinterest rates
Weightedaverage period
outstanding
Floatingrate
borrowings TotalBy currency: % Years US$m US$m US$m
2011Chinese renminbi 7.6 – – 256 256Euro 5.9 1.7 8 – 8Hong Kong dollar 2.2 9.7 1,260 1,627 2,887Indonesian rupiah 9.2 1.7 3,636 610 4,246Japanese yen 1.2 2.5 2 37 39Malaysian ringgit 4.5 0.8 110 81 191New Taiwan dollar 2.4 0.4 17 6 23Singapore dollar 2.5 4.6 621 497 1,118Swiss franc 1.7 20.3 2 44 46United Kingdom sterling 2.7 2.5 31 140 171United States dollar 2.7 1.5 489 586 1,075Other 2.5 0.2 2 5 7
6,178 3,889 10,067
2010Chinese renminbi 5.5 – – 184 184Euro 5.9 2.7 10 – 10Hong Kong dollar 2.7 7.2 1,521 1,454 2,975Indonesian rupiah 10.2 1.5 2,197 578 2,775Japanese yen 0.8 – – 33 33Malaysian ringgit 4.4 1.5 155 134 289New Taiwan dollar 2.5 1.0 34 9 43Singapore dollar 2.7 4.9 711 240 951Swiss franc 1.8 21.3 2 43 45United Kingdom sterling 2.8 3.5 32 96 128United States dollar 4.4 1.6 981 461 1,442Other 2.2 0.2 1 6 7
5,644 3,238 8,882
The weighted average interest rates and period of fixed rate borrowings are stated after taking into account hedging transactions.

81Jardine Matheson | Annual Report 2011
31 Borrowings (continued)
The exposure of the Group’s borrowings to interest rate changes and the contractual repricing dates at 31st December are as follows:
2011 2010US$m US$m
Within one year 3,017 3,460Between one and two years 2,234 1,484Between two and three years 2,391 1,136Between three and four years 642 1,172Between four and five years 343 368Beyond five years 1,440 1,262
10,067 8,882
The finance lease liabilities are as follows:
Minimum lease paymentsPresent value of
finance lease liabilities2011 2010 2011 2010US$m US$m US$m US$m
Within one year 50 39 47 36Between one and five years 61 48 59 47
111 87 106 83Future finance charges on finance leases (5) (4)Present value of finance lease liabilities 106 83
Current 47 36Non-current 59 47
106 83

82 Jardine Matheson | Annual Report 2011
Notes to the Financial Statements (continued)
31 Borrowings (continued)
An analysis of the carrying amount of the bonds and notes at 31st December is as follows:
2011 2010Current Non-current Current Non-current
US$m US$m US$m US$m
Jardine Strategic 6.375% guaranteed bonds – – 276 –Hongkong Land 7% bonds – – 605 –Hongkong Land 2.75% convertible bonds 57 – – 374Hongkong Land 5.50% bonds – 545 – 548Hongkong Land 3.65% notes – 290 – 293Hongkong Land 3.86% notes – 41 – 39Hongkong Land 4.135% notes – 25 – 25Hongkong Land 4.1875% notes – 39 – 39Hongkong Land 4.25% notes – 39 – 39Hongkong Land 4.22% notes – 70 – 64Hongkong Land 4.24% notes – 64 – 64Hongkong Land 3.43% notes – 115 – 116Hongkong Land 3.95% notes – 64 – 64Hongkong Land 4.28% notes – 72 – 63Hongkong Land 4.10% notes – 38 – 38Hongkong Land 4.50% notes – 606 – 554Hongkong Land 3.75% notes – 39 – –Hongkong Land 4.11% notes – 103 – 103Hongkong Land 4.125% notes – 25 – –Hongkong Land 5.25% notes – 32 – 32Astra Sedaya Finance VIII bonds – – 22 –Astra Sedaya Finance IX bonds – – 36 –Astra Sedaya Finance X bonds 29 – 15 23Astra Sedaya Finance XI bonds 58 49 48 108Astra Sedaya Finance XII bonds 65 160 – –Astra Sedaya Finance I notes – – 75 –Astra Sedaya Finance II notes – – 51 –Federal International Finance VII bonds – – 37 –Federal International Finance VIII bonds – – 36 –Federal International Finance IX bonds 60 – 10 48Federal International Finance X bonds 22 99 33 122Federal International Finance XI bonds 68 255 – –Federal International Finance II notes – – 56 –Federal International Finance III notes 33 – – 33San Finance I bonds 11 43 – –Serasi Auto Raya II bonds 27 72 – –Serasi Auto Raya I notes – – 11 –Serasi Auto Raya II notes 11 – 4 7Shogun bonds FIF 20 40 – –Surya Artha Nusantara Finance I notes 33 – – 33
494 2,925 1,315 2,829

83Jardine Matheson | Annual Report 2011
31 Borrowings (continued)
Details of the bonds and notes outstanding at 31st December 2011 are as follows:
Maturity Interest rates % Nominal values
Hongkong Land2.75% convertible bonds 2012 2.75 US$400 million5.50% bonds 2014 5.50 US$500 million3.65% 10-year notes 2015 3.65 S$375 million3.86% 8-year notes 2017 3.86 S$50 million4.135% 10-year notes 2019 4.135 HK$200 million4.1875% 10-year notes 2019 4.1875 HK$300 million4.25% 10-year notes 2019 4.25 HK$300 million4.22% 10-year notes 2020 4.22 HK$500 million4.24% 10-year notes 2020 4.24 HK$500 million3.43% 10-year notes 2020 3.43 S$150 million3.95% 10-year notes 2020 3.95 HK$500 million4.28% 12-year notes 2021 4.28 HK$500 million4.10% 15-year notes 2025 4.10 HK$300 million4.50% 15-year notes 2025 4.50 US$600 million3.75% 15-year notes 2026 3.75 HK$302 million4.11% 20-year notes 2030 4.11 HK$800 million4.125% 20-year notes 2031 4.125 HK$200 million5.25% 30-year notes 2040 5.25 HK$250 million
AstraAstra Sedaya Finance X bonds 2012 14.9 Rp260 billionAstra Sedaya Finance XI bonds 2014 9.0 – 10.9 Rp970 billionAstra Sedaya Finance XII bonds 2015 7.95 – 10.0 Rp2,050 billionFederal International Finance IX bonds 2012 14.6 Rp542 billionFederal International Finance X bonds 2014 8.75 – 10.55 Rp1,100 billionFederal International Finance XI bonds 2014 7.8 – 9.6 Rp2,940 billionFederal International Finance III notes 2012 10.5 Rp300 billionSan Finance I bonds 2014 7.7 – 9.3 Rp500 billionSerasi Auto Raya II bonds 2015 7.9 Rp900 billionSerasi Auto Raya II notes 2012 11.5 Rp96 billionShogun bonds FIF 2014 7.9 – 9.25 US$60 millionSurya Artha Nusantara Finance I notes 2012 11.38 Rp300 billion
The Hongkong Land bonds and medium term notes were issued by several wholly-owned subsidiaries of Hongkong Land. The 2.75% convertible bonds are convertible up to and including 11th December 2012 into fully-paid ordinary shares of Hongkong Land at a conversion price of US$3.85 per ordinary share. The Hongkong Land medium term notes were issued under its US$3,000 million guaranteed medium term note programme.
The Astra Sedaya Finance bonds were issued by a wholly-owned subsidiary of Astra and are collateralized by fiduciary guarantee over financing debtors of the subsidiary amounting to 60% of the total outstanding principal of the bonds.
The Federal International Finance bonds and notes were issued by a wholly-owned subsidiary of Astra and are collateralized by fiduciary guarantee over financing debtors of the subsidiary amounting to 60% of the total outstanding principal of the bonds and notes.
The San Finance bonds and Surya Artha Nusantara Finance notes were issued by a partly-owned subsidiary of Astra and are collateralized by fiduciary guarantee over net investment in finance leases of the subsidiary amounting to 60% of the total outstanding principal of the bonds and 100% of the total outstanding principal of the notes, respectively.
The Serasi Auto Raya bonds and notes were issued by a wholly-owned subsidiary of Astra. The bonds are unsecured, while the notes are collateralized by fiduciary guarantee over transport equipment of the subsidiary amounting to 80% of the total outstanding principal of the notes.
The Shogun bonds FIF were issued by a wholly-owned subsidiary of Astra and are collateralized by fiduciary guarantee over financing debtors of the subsidiary amounting to 60% of the total outstanding principal of the bonds.

84 Jardine Matheson | Annual Report 2011
Notes to the Financial Statements (continued)
32 Creditors
2011 2010US$m US$m
Trade creditors– third parties 3,800 2,824– associates and joint ventures 310 229
4,110 3,053Accruals 1,581 1,414Other amounts due to associates and joint ventures 147 143Rental and other refundable deposits 468 432Derivative financial instruments 54 111Other creditors 200 167Financial liabilities 6,560 5,320Gross estimated losses on insurance contracts 133 101Net amount due to customers for contract work 23 25Proceeds from properties for sale received in advance 315 280Rental income received in advance 18 16Other income received in advance 174 49Deferred warranty income 28 15Unearned premiums on insurance contracts 313 258
7,564 6,064
Non-current 289 216Current 7,275 5,848
7,564 6,064
Analysis by geographical area of operation:Greater China 2,317 2,049Southeast Asia 4,852 3,727United Kingdom 241 160Rest of the world 154 128
7,564 6,064
Derivative financial instruments are stated at fair value. Other creditors are stated at amortized cost. The fair values of these creditors approximate their carrying amounts.

85Jardine Matheson | Annual Report 2011
33 Provisions
Motorvehicle
warranties
Closurecost
provisions
Obligations Reinstatement under and onerous restoration leases costs
Statutoryemployee
entitlements Others TotalUS$m US$m US$m US$m US$m US$m US$m
2011At 1st January 21 10 3 37 68 10 149Exchange differences – – – (1) (1) – (2)Additional provisions 6 4 1 4 20 3 38Unused amounts reversed – (1) – (1) – (1) (3)Utilized (4) (3) (1) – (3) (2) (13)
At 31st December 23 10 3 39 84 10 169
Non-current – – 2 36 70 4 112Current 23 10 1 3 14 6 57
23 10 3 39 84 10 169
2010At 1st January 20 8 4 31 50 12 125Exchange differences 2 – – 2 2 – 6New subsidiaries – – – 2 – – 2Additional provisions 3 4 – 4 19 1 31Unused amounts reversed – (1) – (1) – – (2)Utilized (4) (1) (1) (1) (3) (3) (13)
At 31st December 21 10 3 37 68 10 149
Non-current – – 2 34 55 3 94Current 21 10 1 3 13 7 55
21 10 3 37 68 10 149
Motor vehicle warranties are estimated liabilities that fall due under the warranty terms offered on sale of new and used vehicles beyond that which is reimbursed by the manufacturers.
Closure cost provisions are established when legal or constructive obligations arise on closure or disposal of businesses.
Provisions are made for obligations under onerous operating leases when the properties are not used by the Group and the net costs of exiting from the leases exceed the economic benefits expected to be received.
Other provisions principally comprise provisions in respect of indemnities on disposal of businesses and legal claims.

86 Jardine Matheson | Annual Report 2011
Notes to the Financial Statements (continued)
34 Notes to Consolidated Cash Flow Statement(a) Depreciation and amortization
2011 2010US$m US$m
By business:Jardine Pacific 25 19Jardine Motors 16 13Hongkong Land 1 1Dairy Farm 182 167Mandarin Oriental 50 45Jardine Cycle & Carriage 9 8Astra 631 509
914 762
(b) Other non-cash items
2011 2010US$m US$m
By nature:Profit on sale of subsidiaries (1) (15)Profit on sale of other investments (23) (13)Profit on sale of leasehold land – (1)Profit on sale of tangible assets (17) (7)Profit on sale of investment properties (2) (3)Loss on sale of repossessed assets 81 63Loss on sale of plantations and related assets 4 4Increase in fair value of plantations (37) (422)Impairment of intangible assets 1 2Impairment of debtors 121 104Write down of stocks and work in progress 35 32Reversal of write down of stocks and work in progress (14) (9)Reversal of write down of properties for sale (44) (51)Change in provisions 33 26Net foreign exchange (gains)/losses (19) 12Discount on acquisition of business – (1)Options granted under employee share option schemes 8 8Gain on One Hyde Park lease space (10) –
116 (271)
By business:Jardine Pacific (12) (8)Jardine Motors 7 2Hongkong Land (44) (51)Dairy Farm 9 11Mandarin Oriental – 5Jardine Cycle & Carriage 9 12Astra 144 (244)Corporate and other interests 3 2
116 (271)

87Jardine Matheson | Annual Report 2011
34 Notes to Consolidated Cash Flow Statement (continued)
(c) Increase in working capital
2011 2010US$m US$m
Increase in properties for sale (299) (296)Increase in stocks and work in progress (782) (841)Increase in debtors (2,422) (1,465)Increase in creditors 1,359 718Increase in pension obligations 5 10
(2,139) (1,874)
(d) Purchase of subsidiaries
2011 2010Fair value Fair value
US$m US$m
Intangible assets 159 –Tangible assets 418 40Deferred tax assets 1 –Current assets 364 77Long-term borrowings (4) –Deferred tax liabilities (107) –Non-current provisions – (1)Pension liabilities – (2)Current liabilities (313) (58)Fair value of identifiable net assets acquired 518 56Adjustment for non-controlling interests (140) –Goodwill 113 43Total consideration 491 99Adjustment for contingent consideration (7) –Adjustment for deferred consideration (6) –Consideration paid in previous year (42) –Carrying value of associates and joint ventures (7) –Cash and cash equivalents of subsidiaries acquired (66) (48)
Net cash outflow 363 51
Net cash outflow for purchase of subsidiaries in 2011 included US$102 million and US$8 million for Jardine Pacific’s acquisition of 100% of certain IT distribution businesses of SiS International Holdings (‘SiS’) in January 2011 and the increase in its interest from 25% to 100% in Pizza Hut Vietnam in January 2011, respectively; US$44 million for Jardine Motors’ acquisition of 100% of Wayside Group (‘Wayside’), a motor retail group in the United Kingdom, in May 2011; US$5 million for Jardine Cycle & Carriage’s acquisition of 100% of Lowe Motor, a motor retail group in Malaysia, in May 2011; and US$147 million and US$67 million for Astra’s acquisition of 60% of PT Asmin Bara Bronang, a coal mine concession company, in May 2011, and 95% of Marga Hanurata Intrinsic, a toll road company, in August 2011, respectively; less a net cash inflow of US$10 million for Astra’s acquisition of an additional 11% of PT Fuji Technica Indonesia, a dies manufacturer in Indonesia, in June 2011.
88 Jardine Matheson | Annual Report 2011
Notes to the Financial Statements (continued)
34 Notes to Consolidated Cash Flow Statement (continued)
(d) Purchase of subsidiaries (continued)Jardine Pacific’s wholly owned subsidiary, JOS, acquired 100% of the IT distribution businesses of SiS in Hong Kong, Singapore and Malaysia. The goodwill arising from the acquisition amounted to US$69 million and was attributable to the acquired businesses’ strong distribution network and partnership with manufacturers, and the synergies expected to be achieved from integrating the acquired businesses with JOS. The contingent consideration arrangement requires JOS to pay the former owners an additional consideration which is equivalent to a pre-agreed percentage of the adjusted profit of the enlarged IT distribution business of JOS for each of the two years ending 31st December 2011 and 2012, and subject to a minimum payment of US$1.5 million and up to a maximum of US$4.5 million in each year. At the date of acquisition of SiS, the contingent consideration was estimated at US$7 million.
The goodwill arising from the acquisition of Wayside amounted to US$33 million and was attributable to the acquired businesses’ strong regional dealership network and the synergies expected to be achieved from the geographical and organization integration with the existing businesses.
None of the goodwill is expected to be deductible for tax purposes.
Net cash outflow for purchase of subsidiaries in 2010 of US$51 million mainly comprised Dairy Farm’s acquisition of Bintang Retail Industries.
Revenue and profit after tax since acquisition in respect of subsidiaries acquired during the year amounted to US$1,552 million and US$11 million, respectively. Had the acquisitions occurred on 1st January 2011, consolidated revenue and consolidated profit after tax for the year ended 31st December 2011 would have been US$38,206 million and US$8,617 million, respectively.
(e) The Group increased its interest in Jardine Lloyd Thompson from 32% to 42% through a partial cash offer, which became wholly unconditional in November 2011, at a total cost of US$273 million and purchase of shares amounting to US$3 million in the open market in 2011.
(f ) Purchase of other associates and joint ventures in 2011 included US$17 million for Jardine Pacific’s acquisition of a 25% interest in KFC Vietnam; US$5 million for Dairy Farm’s additional capital injection in Foodworld India; US$19 million for Jardine Cycle & Carriage’s acquisition of an additional 4% interest in Truong Hai Auto Corporation; US$6 million and US$21 million for Astra’s acquisition of a 26% interest in PT TD Automotive Compressor Indonesia and a 20% interest in PT Bukit Enim Energi, respectively; and US$6 million for Jardine Strategic’s capital injection into JRE Asia Capital.
Purchase of other associates and joint ventures in 2010 included US$80 million for Hongkong Land’s acquisition of an additional 20% interest in Shenyang joint venture; US$13 million for Jardine Cycle & Carriage’s acquisition of an additional 6% interest in PT Tunas Ridean; and US$18 million, US$98 million and US$13 million for Astra’s acquisition of an additional 19% interest in PT Pam Lyonnaise Jaya, subscription to Bank Permata’s rights issue and capital injection to its financial services joint ventures, respectively. In addition, Jardine Pacific acquired an additional 17% interest in HACTL for a non-cash consideration of US$137 million.
(g) Purchase of other investments in 2011 mainly comprised acquisition of securities by Jardine Cycle & Carriage and Astra.
Purchase of other investments in 2010 included US$163 million for Astra’s acquisition of securities, and US$34 million and US$25 million for Jardine Strategic’s purchase of shares in ACLEDA Bank and The Bank of N.T. Butterfield & Son, respectively.
(h) Advance to associates, joint ventures and others in 2011 and 2010 included Hongkong Land’s loans to its property joint ventures of US$258 million and US$214 million, respectively.
(i) Repayment from associates, joint ventures and others in 2011 and 2010 mainly comprised repayment from Hongkong Land’s property joint ventures of US$111 million and US$275 million, respectively.

89Jardine Matheson | Annual Report 2011
34 Notes to Consolidated Cash Flow Statement (continued)
(j) Sale of subsidiaries
2011 2010US$m US$m
Intangible assets 2 15Tangible assets 2 12Plantations – 7Deferred tax assets – 5Current assets 6 33Pension liabilities – (1)Current liabilities (9) (20)Net assets 1 51Adjustment for non-controlling interests – (9)Net assets disposed of 1 42Profit on disposal 1 15Sale proceeds 2 57Adjustment for deferred consideration 2 (11)Adjustment for carrying value of associates and joint ventures – (22)Cash and cash equivalents of subsidiaries disposed of – (3)
Net cash inflow 4 21
Sale proceeds in 2010 of US$57 million included US$28 million from Astra’s sale of a 2% interest in PT Komatsu Remanufacturing Asia, which became an associate, and US$27 million from Astra’s sale of PT Surya Panen Subur.
The revenue and profit after tax in respect of subsidiaries disposed of during the year amounted to US$25 million and nil, respectively.
(k) Sale of other investments in 2011 and 2010 mainly comprised Astra’s sale of securities.
(l) Purchase of additional interests in subsidiaries
2011 2010US$m US$m
Increase in attributable interests– Hongkong Land 239 100– Mandarin Oriental – 4– Jardine Cycle & Carriage 97 84– Jardine Strategic 189 9– other 1 353
526 550
Increase in attributable interests in other subsidiaries in 2010 included US$160 million for Hongkong Land’s acquisition of an additional 23% interest in MCL Land and US$178 million for Astra’s acquisition of an additional 47% interest in PT Astra Sedaya Finance.
(m) Analysis of balances of cash and cash equivalents
2011 2010US$m US$m
Bank balances and other liquid funds including restricted balances (refer note 23) 4,195 4,285Bank overdrafts (refer note 31) (27) (7)
4,168 4,278

90 Jardine Matheson | Annual Report 2011
Notes to the Financial Statements (continued)
35 Derivative Financial InstrumentsThe fair values of derivative financial instruments at 31st December are as follows:
2011 2010Positive
fairvalue
Negativefair
value
Positivefair
value
Negativefair
valueUS$m US$m US$m US$m
Designated as cash flow hedges– forward foreign exchange contracts 2 1 – 2– interest rate swaps and caps – 33 1 37– cross currency swaps 59 20 7 27
61 54 8 66
Designated as fair value hedges– forward foreign exchange contracts 1 – – –– interest rate swaps 10 – 1 2– cross currency swaps 60 – 53 42
71 – 54 44
Not qualifying as hedges– forward foreign exchange contracts – – – 1
Forward foreign exchange contractsThe contract amounts of the outstanding forward foreign exchange contracts at 31st December 2011 were US$318 million (2010: US$215 million).
Interest rate swaps and capsThe notional principal amounts of the outstanding interest rate swap and cap contracts at 31st December 2011 were US$1,291 million (2010: US$1,525 million).
At 31st December 2011 the fixed interest rates relating to interest rate swaps and caps vary from 0.7% to 11.9% (2010: 0.7% to 13.7%) per annum.
The fair values of interest rate swaps are based on the estimated cash flows discounted at market rates ranging from 0.2% to 4.9% (2010: 0.2% to 9.8%) per annum.
Cross currency swapsThe contract amounts of the outstanding cross currency swap contracts at 31st December 2011 totaled US$2,815 million (2010: US$2,451 million).
Credit default swapThere was no credit default swap outstanding at 31st December 2011. The contract amount of the outstanding credit default swap contract at 31st December 2010 was US$25 million.

91Jardine Matheson | Annual Report 2011
36 Commitments
2011 2010US$m US$m
Capital commitments:Authorized not contracted 2,164 1,729Contracted not provided 813 399
2,977 2,128
Operating lease commitments:Total commitments under operating leases– due within one year 738 644– due between one and two years 547 475– due between two and three years 346 311– due between three and four years 222 210– due between four and five years 182 162– due beyond five years 1,254 1,235
3,289 3,037
Total future sublease payments receivable relating to the above operating leases amounted to US$46 million (2010: US$44 million).
In addition, the Group has operating lease commitments with rentals determined in relation to sales. It is not possible to quantify accurately future rentals payable under such leases.
37 Contingent LiabilitiesVarious Group companies are involved in litigation arising in the ordinary course of their respective businesses. Having reviewed outstanding claims and taking into account legal advice received, the Directors are of the opinion that adequate provisions have been made in the financial statements.

92 Jardine Matheson | Annual Report 2011
Notes to the Financial Statements (continued)
38 Related Party TransactionsIn the normal course of business the Group undertakes a variety of transactions with certain of its associates and joint ventures. The more significant of such transactions are described below.
The Group purchases motor vehicles and spare parts from its associates and joint ventures in Indonesia including PT Toyota-Astra Motor, PT Astra Honda Motor and PT Astra Daihatsu Motor. Total cost of motor vehicles and spare parts purchased in 2011 amounted to US$7,115 million (2010: US$5,929 million). The Group also sells motor vehicles and spare parts to its associates and joint ventures in Indonesia including PT Astra Honda Motor and PT Astra Daihatsu Motor. Total revenue from sale of motor vehicles and spare parts in 2011 amounted to US$988 million (2010: US$643 million).
The Group uses Jardine Lloyd Thompson to place certain of its insurance. Brokerage fees and commissions, net of rebates, paid by the Group in 2011 to Jardine Lloyd Thompson were US$4 million (2010: US$4 million).
The Group manages five associate hotels (2010: five associate hotels). Management fees received by the Group in 2011 from these managed hotels amounted to US$12 million (2010: US$11 million).
Bank Permata provides banking services to the Group. The Group’s deposits with Bank Permata at 31st December 2011 amounted to US$401 million (2010: US$221 million).
Amounts of outstanding balances with associates and joint ventures are included in debtors and creditors, as appropriate (refer notes 18 and 32).
Details of Directors’ remuneration (being the key management personnel compensation) are shown on page 98 under the heading of Directors’ Appointment, Retirement, Remuneration and Service Contracts.
39 Summarized Balance Sheet of the CompanyIncluded below is certain summarized balance sheet information of the Company disclosed in accordance with Bermuda law.
2011 2010US$m US$m
Subsidiaries 1,137 881
Share capital (refer note 25) 165 162Share premium and capital reserves (refer note 27) 21 20Revenue and other reserves 940 687Shareholders’ funds 1,126 869Current liabilities 11 12
Total equity and liabilities 1,137 881
Subsidiaries are shown at cost less amounts provided.

93Jardine Matheson | Annual Report 2011
40 Principal Subsidiaries and AssociatesThe principal subsidiaries and associates of the Group at 31st December 2011 are set out below.
Country ofincorporation Particulars of issued capital
Attributableinterests
Nature of business2011 2010
% %
Dairy Farm International Holdings Ltd
Bermuda USD 75,011,125 ordinary 64 63 Supermarkets,hypermarkets,health and beauty stores,convenience stores,home furnishings storesand restaurants
Hongkong Land Holdings Ltd Bermuda USD 233,813,146 ordinary 41 41 Property development &investment, leasing &management
Jardine Cycle & Carriage Ltd Singapore SGD 355,699,660 ordinary 58 57 A 50.1% interest in PTAstra International Tbkand motor trading
Jardine Lloyd Thompson Group plc*
England GBP 10,960,625 ordinary 42 32 Insurance and reinsurancebroking, risk managementand employee benefitservices
Jardine Matheson Ltd Bermuda USD 12,000 ordinary 100 100 Group management
Jardine Motors Group Holdings Ltd
Bermuda USD 8,947,702 ordinary 100 100 Motor trading
Jardine Pacific Holdings Ltd Bermuda USD 62,500,000 ordinary 100 100 Engineering & construction,transport services,restaurants, property and IT services
Jardine Strategic Holdings Ltd† Bermuda USD 55,998,236 ordinary 82 81 Holding
Mandarin Oriental International Ltd
Bermuda USD 49,864,937 ordinary 61 60 Hotel management &ownership
Matheson & Co., Ltd England GBP 20,000,000 ordinary 100 100 Holding and management
PT Astra International Tbk Indonesia IDRm 2,024,178 ordinary 29 29 Automotive, financialservices, agribusiness,heavy equipment andmining, infrastructure andlogistics, and informationtechnology
Rothschilds Continuation Holdings AG*
Switzerland CHF 60,975,765 ordinary 17 17 Global financial advisory,wealth management and trusts
Attributable interests represent the proportional holdings of the Company, held directly or through its subsidiaries, in the issued share capitals of the respective companies, after the deduction of any shares held by the trustees of the employee share option schemes of any such company and any shares in any such company owned by its wholly-owned subsidiaries.
The financial statements of Jardine Lloyd Thompson can be accessed through the internet at its website.
Associates. All other companies are subsidiaries.
Jardine Strategic held 55% (2010: 54%) of the share capital of the Company.
*†

94 Jardine Matheson | Annual Report 2011
Independent Auditors’ Report
To the members of Jardine Matheson Holdings Limited
Report on the Financial StatementsWe have audited the accompanying consolidated financial statements of Jardine Matheson Holdings Limited and its subsidiaries (the ‘Group’) which comprise the Consolidated Balance Sheet as at 31st December 2011 and the Consolidated Profit and Loss Account, Consolidated Statement of Comprehensive Income, Consolidated Statement of Changes in Equity and Consolidated Cash Flow Statement for the year then ended and a summary of significant accounting policies and other explanatory notes.
Directors’ Responsibility for the Financial StatementsThe Company’s Directors are responsible for the preparation and fair presentation of these consolidated financial statements in accordance with International Financial Reporting Standards and with the requirements of Section 90 of the Bermuda Companies Act. This responsibility includes: designing, implementing and maintaining internal control relevant to the preparation and fair presentation of financial statements that are free from material misstatement, whether due to fraud or error; selecting and applying appropriate accounting policies; and making accounting estimates that are reasonable in the circumstances.
Auditors’ ResponsibilityOur responsibility is to express an opinion on these consolidated financial statements based on our audit. We conducted our audit in accordance with International Standards on Auditing. Those Standards require that we comply with ethical requirements and plan and perform the audit to obtain reasonable assurance whether the financial statements are free from material misstatement.
An audit involves performing procedures to obtain audit evidence about the amounts and disclosures in the financial statements. The procedures selected depend on the auditors’ judgment, including the assessment of the risks of material misstatement of the financial statements, whether due to fraud or error. In making those risk assessments, the auditors consider internal control relevant to the entity’s preparation and fair presentation of the financial statements in order to design audit procedures that are appropriate in the circumstances, but not for the purpose of expressing an opinion on the effectiveness of the entity’s internal control. An audit also includes evaluating the appropriateness of accounting policies used and the reasonableness of accounting estimates made by management, as well as evaluating the overall presentation of the financial statements.
We believe that the audit evidence we have obtained is sufficient and appropriate to provide a basis for our audit opinion.
OpinionIn our opinion, the accompanying consolidated financial statements present fairly, in all material respects, the financial position of the Group as at 31st December 2011, and its financial performance and its cash flows for the year then ended in accordance with International Financial Reporting Standards and with the requirements of the Bermuda Companies Act.
Report on Legal and Regulatory RequirementsWe have nothing to report in respect of the following matters that under the UK Listing Rules we are required to review:• Directors’ statement in relation to going concern; and• the part of the Corporate Governance Statement relating to the Company’s compliance with the UK Corporate Governance
Code specified for our review.
Other MattersThis report, including the opinion, has been prepared for and only for the Company’s members as a body in accordance with Section 90 of the Bermuda Companies Act and for no other purpose. We do not, in giving this opinion, accept or assume responsibility for any other purpose or to any other person to whom this report is shown or into whose hands it may come save where expressly agreed by our prior consent in writing.
PricewaterhouseCoopers LLPChartered AccountantsLondonUnited Kingdom
2nd March 2012

95Jardine Matheson | Annual Report 2011
Five Year Summary
Profit and Loss
2011 2010 2009 2008 2007US$m US$m US$m US$m US$m
Revenue 37,967 30,053 22,501 22,362 19,445
Profit attributable to shareholders 3,449 3,084 1,731 619 2,028Underlying profit attributable to shareholders 1,495 1,364 1,016 826 723
Earnings per share (US$) 9.53 8.58 4.87 1.75 5.73Underlying earnings per share (US$) 4.13 3.80 2.86 2.34 2.04Dividends per share (US$) 1.25 1.15 0.90 0.75 0.65
Balance Sheet
2011 2010 2009 2008 2007US$m US$m US$m US$m US$m
Total assets 58,297 48,076 38,835 22,694 22,795Total liabilities (19,035) (16,116) (13,695) (8,453) (8,380)
Total equity 39,262 31,960 25,140 14,241 14,415
Shareholders’ funds 16,356 13,710 10,694 8,896 9,154
Net debt (excluding net debt of financial services companies) 2,432 2,252 2,200 545 618
Net asset value per share (US$) 45.09 37.99 29.87 25.13 25.97
Cash Flow
2011 2010 2009 2008 2007US$m US$m US$m US$m US$m
Cash flows from operating activities 2,674 2,210 2,786 2,091 2,198Cash flows from investing activities (2,675) (1,372) (122) (1,409) (573)
Net cash flow before financing (1) 838 2,664 682 1,625
Cash flow per share from operating activities (US$) 7.38 6.15 7.83 5.92 6.21

96 Jardine Matheson | Annual Report 2011
Responsibility Statement
The Directors of the Company confirm to the best of their knowledge that:
(a) the consolidated financial statements have been prepared in accordance with International Financial Reporting Standards, including International Accounting Standards and Interpretations adopted by the International Accounting Standards Board; and
(b) the sections of this Report, including the Chairman’s Statement, Managing Director’s Review and Principal Risks and Uncertainties, which constitute the management report include a fair review of all information required to be disclosed by the Disclosure and Transparency Rules 4.1.8 to 4.1.11 issued by the Financial Services Authority of the United Kingdom.
For and on behalf of the Board
A.J.L. NightingaleJames RileyDirectors
2nd March 2012

97Jardine Matheson | Annual Report 2011
Corporate Governance
Jardine Matheson Holdings Limited is incorporated in Bermuda. The majority of the Group’s business interests are in Asia. The Company’s equity shares have a premium listing on the London Stock Exchange, and secondary listings in Bermuda and Singapore. The Company’s share capital is 55%-owned by Jardine Strategic Holdings Limited, a Bermuda incorporated 82%-owned subsidiary of the Company similarly listed in London, Bermuda and Singapore. The Company attaches importance to the corporate stability that is fundamental to the Group’s ability to pursue a long-term strategy in Asian markets. It is committed to high standards of governance. Its approach, however, developed over many years, differs from that envisaged by the UK Corporate Governance Code (the ‘UK Code’), which was originally introduced as a guide for United Kingdom incorporated companies listed on the London Stock Exchange. As provided in the Listing Rules issued by the Financial Services Authority in the United Kingdom, the Company’s premium listed status requires that this Report address how the main principles of the UK Code have been applied by the Company, and explain the reasons for the different approach adopted by the Company as compared to the UK Code’s provisions. The Company’s governance differs from that contemplated by provisions of the UK Code on board balance and refreshment, director independence, board evaluation procedures, nomination and remuneration committees and the appointment of a senior independent director.
The Management of the GroupThe Company is the parent company of the Jardine Matheson Group. Its management is therefore concerned both with the direct management of Jardine Matheson’s own activities, and with the oversight of the operations of other listed companies within the wider Group. Management is delegated to the appropriate level, and co-ordination with the Group’s listed subsidiaries is undertaken by the board of Group management company, Jardine Matheson Limited (‘JML’). JML meets regularly in Hong Kong and is chaired by the Managing Director. Its six other members, whose names appear on page 104 of this Report, include the Deputy Managing Director, the Group Finance Director, the Group Strategy Director and the Group General Counsel. In addition, as part of the Company’s tiered approach to oversight and management, certain Directors who do not serve on the board of JML and who are based outside Asia make regular visits to Asia and Bermuda where they participate in four annual Group strategic reviews. All of these reviews precede the Board meetings. These Directors are not directly involved in the operational management of the Group’s business activities, but their knowledge and close oversight of the Group’s affairs reinforces the process by which business is reviewed before consideration by the Board.
The BoardThe Company currently has a Board of 13 Directors; nine are executive and four are non-executive. Their names and brief biographies appear on page 27 of this Report. The composition and operation of the Board reflect the Group’s commitment to its long-term strategy, the Company’s shareholding structure and the Group’s tiered approach to oversight and management as described above. These factors explain the balance on the Board between executive and non-executive Directors, the stability of the Board, the absence of nomination and remuneration committees and the conduct of Board evaluation procedures. The Board regards Asian business experience and relationships as more valuable attributes of its non-executive Directors than formal independence criteria. Accordingly the Board has not designated a ‘senior independent director’ as set out in the UK Code. Recommendations and decisions on remuneration result from consultations between the Chairman and the Managing Director as well as other Directors as they consider appropriate.
Among the matters which the Board decides are the Group’s business strategy, its annual budget, dividends and major corporate activities. The Board is scheduled to hold four meetings in 2012 and ad hoc procedures are adopted to deal with urgent matters. In 2011 one meeting was held in Bermuda and three were held in Asia. All current Directors who held office in 2011 attended all four Board meetings, save that Jenkin Hui attended three meetings and Y.K. Pang, who was appointed in April 2011, attended all three Board meetings following his appointment. The Board receives high quality, up to date information for each of its meetings. This information is approved by the Company’s management before circulation, and is then the subject of a strategy review in a cycle of meetings (in Bermuda or Asia, as appropriate) prior to consideration by the Board itself. Responsibility for implementing the Group’s strategy within designated financial parameters is delegated to JML.
The division of responsibilities between the Chairman and the Managing Director is well established. The Chairman’s role is to lead the Board as it oversees the Group’s strategic and financial direction. The role of Managing Director, with the support of the Deputy Managing Director, is to implement the strategy set by the Board and to manage the Group’s operations. An important part of this is undertaken in his capacity as chairman of the board of JML.
Directors’ Appointment, Retirement, Remuneration and Service ContractsCandidates for appointment as executive Directors of the Company, as executive directors of JML or as senior executives elsewhere in the Group may be sourced internally or externally using the services of specialist executive search firms. The aim is to appoint individuals who combine international best practice with adaptability to Asian markets.

98 Jardine Matheson | Annual Report 2011
Corporate Governance (continued)
Each new Director is appointed by the Board and, in accordance with Bye-law 91 of the Company’s Bye-laws, each new Director is subject to retirement at the first Annual General Meeting after appointment. Thereafter, the Director will be subject to retirement by rotation pursuant to Bye-law 84 whereby one-third of the Directors retire at the Annual General Meeting each year. These provisions apply to both executive and non-executive Directors, but the requirement to retire by rotation pursuant to Bye-law 84 does not extend to the Chairman or Managing Director.
Y.K. Pang was appointed as a Director of the Company with effect from 1st April 2011. On 12th May 2011, R.C. Kwok retired from the Board. On 1st April 2012, Ben Keswick succeeded A.J.L. Nightingale as Managing Director (the latter remaining as a non-executive Director of the Company). Adam Keswick was appointed Deputy Managing Director with effect from 1st April 2012. In accordance with Bye-law 84, A.J.L. Nightingale, James Riley and Percy Weatherall retire by rotation at the Annual General Meeting and, being eligible, offer themselves for re-election. James Riley has a service contract with a subsidiary of the Company that has a notice period of six months. A.J.L. Nightingale and Percy Weatherall do not have service contracts with the Company or its subsidiaries.
The Company’s policy is to offer competitive remuneration packages to its senior executives. It is recognized that, due to the nature of the Group and its diverse geographic base, a number of its senior executives are required to be offered international terms and the nature of the remuneration packages is designed to reflect this. Executive Directors joining from outside the Group are normally offered an initial fixed term service contract, reflecting the requirement for them to relocate. These contracts will be expected to reduce to a notice period of not more than one year after the initial term.
Certain Directors are discretionary objects under a trust created in 1947 (the ‘1947 Trust’) which holds 35,915,991 ordinary shares in the Company representing 5.45% of the Company’s issued share capital. Under the terms of the 1947 Trust, its income is to be distributed to senior executive officers and employees of the Company and its wholly-owned subsidiaries. Such distribution is made by the trustee after consultation between the Chairman and the Managing Director and such other Directors as they consider appropriate.
Directors’ fees which are payable to the Chairman and all non-executive Directors are decided upon by shareholders in general meeting as provided for by the Company’s Bye-laws. For the year ended 31st December 2011, the Directors received from the Group US$15.4 million (2010: US$12 million) in Directors’ fees and employee benefits, being US$0.2 million (2010: US$0.2 million) in Directors’ fees, US$13.2 million (2010: US$9.9 million) in short-term employee benefits including salary, bonuses, accommodation and deemed benefits in kind, US$1.3 million (2010: US$1.1 million) in post-employment benefits and US$0.7 million (2010: US$0.8 million) in share-based payments. The 1947 Trust also made distributions to Directors amounting to US$41.3 million (2010: US$31.6 million). The information set out in this paragraph forms part of the audited financial statements.
Senior executive share incentive schemes have also been established to provide longer-term incentives for executive Directors and senior managers. Share options are granted by the scheme trustee after consultation between the Chairman and the Managing Director as well as other Directors as they consider appropriate. Share options are granted at the then prevailing market prices and the scheme rules provide that they normally vest after the third anniversary of the date of grant. Grants may be made in a number of instalments. Share options are not granted to non-executive Directors.
The Company purchases insurance to cover its Directors against their costs in defending themselves in civil proceedings taken against them in that capacity and in respect of damages resulting from the unsuccessful defence of any proceedings. To the extent permitted by law, the Company also indemnifies its Directors. Neither the insurance nor the indemnity provides cover where the Director has acted fraudulently or dishonestly.
Directors’ Responsibilities in respect of the Financial StatementsThe Directors are required under the Bermuda Companies Act 1981 to prepare financial statements for each financial year and to present them annually to the Company’s shareholders at the Annual General Meeting. The financial statements should present fairly in accordance with International Financial Reporting Standards (‘IFRS’) the financial position of the Group at the end of the year and the results of its operations and its cash flows for the year then ended. The Directors consider that applicable accounting policies under IFRS, applied on a consistent basis and supported by prudent and reasonable judgments and estimates, have been followed in preparing the financial statements.

99Jardine Matheson | Annual Report 2011
Going ConcernThe Directors are required to consider whether it is appropriate to prepare financial statements on the basis that the Company and the Group are going concerns. The Group prepares comprehensive financial forecasts and, based on these forecasts, cash resources and existing credit facilities, the Directors consider that the Company and the Group have adequate resources to continue in business for the foreseeable future. For this reason, the Directors continue to adopt the going concern basis in preparing the financial statements.
Code of ConductThe Group conducts business in a professional, ethical and even-handed manner. Its ethical standards are clearly set out in its Code of Conduct, a set of guidelines to which every employee must adhere. The code requires that all Group companies comply with all laws of general application, all rules and regulations that are industry specific and proper standards of business conduct. The code prohibits the giving or receiving of illicit payments, and requires all employees to be treated fairly, impartially and with respect. It also requires that all managers must be fully aware of their obligations under the Code of Conduct and establish procedures to ensure compliance at all levels within their organizations. The Group has in place procedures by which employees can raise, in confidence, matters of serious concern in areas such as financial reporting or compliance.
Risk Management and Internal ControlThe Board has overall responsibility for the Group’s system of risk management and internal control. The system of internal control is designed to manage, rather than eliminate, business risk; to help safeguard the Group’s assets against fraud and other irregularities; and to give reasonable, but not absolute, assurance against material financial misstatement or loss.
The principal risks and uncertainties facing the Company are set out on page 102.
The Board has delegated to the Audit Committee responsibility for reviewing areas of risk and uncertainty, the operation and effectiveness of the Group’s system of internal control and the procedures by which these are monitored. The Audit Committee considers the system and procedures on a regular basis, and reports to the Board semi-annually. The members of the Audit Committee are Simon Keswick, Lord Leach of Fairford and Percy Weatherall; they have extensive knowledge of the Group while at the same time not being directly involved in operational management. The Board considers that the members of the Audit Committee have, collectively, the requisite skills, knowledge and experience to enable it to discharge its responsibilities in a proper manner. All current members of the Audit Committee attended both its meetings during the year. The Company’s Managing Director, Deputy Managing Director, Group Finance Director, Group Strategy Director and Group General Counsel, together with representatives of the internal and external auditors, also attend the Audit Committee meetings by invitation.
Executive management oversees the implementation of the systems of internal control within the Group’s operating companies, the responsibility for which rests with each company’s board and its own executive management. The effectiveness of these systems is monitored by the internal audit function, which is outside the operating companies, and by a series of audit committees that operate in each major business unit across the Group. The internal audit function also monitors the approach taken by the business units to risk. The findings of the internal audit function and recommendations for any corrective action required are reported to the relevant audit committee and, if appropriate, to the Audit Committee of the Company. The Audit Committee also reviews the effectiveness of the internal audit function.
The Group has in place an organizational structure with defined lines of responsibility and delegation of authority. Across the Group there are established policies and procedures for financial planning and budgeting; for information and reporting systems; for assessment of risk; and for monitoring the Group’s operations and performance. The information systems in place are designed to ensure that the financial information reported is reliable and up to date.
The Company’s policy on commercial conduct underpins the Group’s internal control process, particularly in the area of compliance. The policy, as set out in the Code of Conduct, is reinforced and monitored by an annual compliance certification process.
The Audit Committee has also been given the responsibility to oversee the effectiveness of the formal procedures for employees to raise any matters of serious concern and is required to review any reports made under those procedures that are referred to it by the internal audit function.

100 Jardine Matheson | Annual Report 2011
Corporate Governance (continued)
Prior to completion and announcement of the half-year and year-end results, a review of the Company’s financial information and any issues raised in connection with the preparation of the results, including the adoption of new accounting policies, is undertaken by the Audit Committee with the executive management and a report is received from the external auditors. The Audit Committee also assesses any reports on frauds identified during the period under review. The external auditors also have access to the full Board and other senior executives, and to the boards of the Group’s operating companies.
The Audit Committee keeps under review the nature, scope and results of the external audit, the audits conducted by the internal audit function and the findings of the various Group audit committees. The Audit Committee also keeps under review the independence and objectivity of the external auditors, and as part of that process considers and approves the level and nature of non-audit work performed. The terms of reference of the Audit Committee can be found on the Company’s website at www.jardines.com.
Directors’ Share InterestsThe Directors of the Company in office on 1st April 2012 had interests (within the meaning of the Disclosure and Transparency Rules (‘DTRs’) of the Financial Services Authority (the ‘FSA’) of the United Kingdom) in the ordinary share capital of the Company at 22nd March 2012 as set out below. These interests included those notified to the Company in respect of the Directors’ connected persons (as that term is used in the DTRs in relation to companies incorporated outside the United Kingdom).
Sir Henry Keswick 10,294,325Ben Keswick 40,508,786(a) (b) (c)
Adam Keswick 34,201,515(a) (b)
Simon Keswick 11,525,574(a) (c)
Lord Leach of Fairford 1,087,325Dr Richard Lee 104,904A.J.L. Nightingale 1,099,060Y.K. Pang 281,666James Riley 188,370Percy Weatherall 35,568,761(a) (b)
Notes:(a) Includes 2,000,004 ordinary shares held by a family trust, the trustees of which are connected persons of Adam Keswick, Ben Keswick, Simon Keswick
and Percy Weatherall.
(b) Includes 29,437,369 ordinary shares held by family trusts, the trustee of which is a connected person of Adam Keswick, Ben Keswick and Percy Weatherall.
(c) Includes 6,694,572 ordinary shares held by family trusts, the trustees of which are connected persons of Ben Keswick and Simon Keswick.
In addition, Ben Keswick, Adam Keswick, Mark Greenberg, Y.K. Pang, James Riley and Giles White held options in respect of 310,000, 190,000, 240,000, 133,334, 140,000 and 100,000 ordinary shares, respectively, issued pursuant to the Company’s Senior Executive Share Incentive Schemes.
Substantial ShareholdersAs a non-UK issuer, the Company is subject to the DTRs pursuant to which a person must in certain circumstances notify the Company of the percentage of voting rights attaching to the share capital of the Company that he holds. The obligation to notify arises if that person acquires or disposes of shares in the Company which results in the percentage of voting rights which he holds reaching, exceeding or falling below 5%, 10%, 15%, 20%, 25%, 30%, 50% and 75%.
The Company has been informed of the following holdings of voting rights of 5% or more attaching to the Company’s issued ordinary share capital: (i) Jardine Strategic and its subsidiary undertakings are directly and indirectly interested in 363,682,341 ordinary shares carrying 55.16% of the voting rights; and (ii) the 1947 Trust is interested in 35,915,991 ordinary shares carrying 5.45% of the voting rights. Apart from these shareholdings, the Company is not aware of any holders of voting rights of 5% or more attaching to the issued ordinary share capital of the Company as at 22nd March 2012.
There were no contracts of significance with corporate substantial shareholders during the year under review.

101Jardine Matheson | Annual Report 2011
Relations with ShareholdersThe 2012 Annual General Meeting will be held at The Fairmont Southampton, Bermuda on 10th May 2012. The full text of the resolutions and explanatory notes in respect of the meeting are contained in the Notice of Meeting which accompanies this Report. All shareholders are invited to attend the Annual General Meeting and participate in communicating with the Company. The Company holds regular meetings with institutional shareholders. A corporate website is maintained containing a wide range of information of interest to investors at www.jardines.com.
Securities Purchase ArrangementsAt the Annual General Meeting held on 12th May 2011, shareholders renewed the approval of a general mandate authorizing the Directors to effect purchases by the Company or its subsidiaries of the Company’s own ordinary shares of less than 15% in aggregate of its issued share capital.
During the year, Jardine Matheson International Services Limited, a wholly-owned subsidiary of the Company, acting in its capacity as trustee of The Jardine Foundation which is a non-profit-making educational trust, purchased 1,206,800 ordinary shares of the Company in the market for a total cost of US$59.3 million as part of the restructuring of its investment portfolio. The ordinary shares purchased represented some 0.18% of the Company’s issued ordinary share capital.
Arrangements under which Shareholders have agreed to Waive DividendsClare Investment Overseas (PTC) Limited has waived the interim dividend and has undertaken to waive the recommended final dividend for 2011 in respect of the ordinary shares in which it is interested as the Trustee of the Company’s Senior Executive Share Incentive Schemes.
Related Party TransactionsDetails of transactions with related parties entered into by the Company during the course of the year are included in note 38 to the financial statements on page 92. There were no transactions entered into by the Company during the course of the year to which the related party transaction rules of the FSA in the United Kingdom apply.

102 Jardine Matheson | Annual Report 2011
Principal Risks and Uncertainties
The Board has overall responsibility for risk management and internal control. The process by which the Group identifies and manages risk is set out in more detail on pages 99 and 100 of the Corporate Governance section of this Report. The following are the principal risks and uncertainties facing the Company as required to be disclosed pursuant to the Disclosure and Transparency Rules issued by the Financial Services Authority of the United Kingdom and are in addition to the matters referred to in the Chairman’s Statement and Managing Director’s Review.
Economic RiskMost of the Group’s businesses are exposed to the risk of negative developments in global and regional economies and financial markets, either directly or through the impact on the Group’s joint venture partners, franchisors, bankers, suppliers or customers. These developments can result in recession, inflation, deflation, currency fluctuations, restrictions in the availability of credit, business failures, or increases in financing costs, oil prices and in the cost of raw materials. Such developments might increase operating costs, reduce revenues, lower asset values or result in the Group’s businesses being unable to meet in full their strategic objectives.
Commercial Risk and Financial RiskRisks are an integral part of normal commercial practices, and where practicable steps are taken to mitigate such risks. These risks are further pronounced when operating in volatile markets.
A number of the Group’s businesses make significant investment decisions in respect of developments or projects that take time to come to fruition and achieve the desired returns and are, therefore, subject to market risks.
The Group’s businesses operate in areas that are highly competitive, and failure to compete effectively in terms of price, product specification or levels of service can have an adverse effect on earnings. Significant pressure from such competition may lead to reduced margins. The quality and safety of the products and services provided by the Group’s businesses are also important and there is an associated risk if they are below standard.
The steps taken by the Group to manage its exposure to financial risk are set out in the Financial Review on page 26 and note 2 to the financial statements on pages 44 to 47.
Concessions, Franchises and Key ContractsA number of the Group’s businesses and projects are reliant on concessions, franchises, management or other key contracts. Cancellation, expiry or termination, or the renegotiation of any such concession, franchise, management or other key contracts, could have an adverse effect on the financial condition and results of operations of certain subsidiaries, associates and joint ventures of the Group.
Regulatory and Political RiskThe Group’s businesses are subject to a number of regulatory environments in the territories in which they operate. Changes in the regulatory approach to such matters as foreign ownership of assets and businesses, exchange controls, planning controls, emission regulations, tax rules and employment legislation have the potential to impact the operations and profitability of the Group’s businesses. Changes in the political environment in such territories can also affect the Group’s businesses.
Terrorism, Pandemic and Natural DisastersA number of the Group’s operations are vulnerable to the effects of terrorism, either directly through the impact of an act of terrorism or indirectly through the impact of generally reduced economic activity in response to the threat of or an actual act of terrorism.
All Group businesses would be impacted by a global or regional pandemic which could be expected to seriously affect economic activity and the ability of our businesses to operate smoothly. In addition, many of the territories in which the Group operates can experience from time to time natural disasters such as earthquakes and typhoons.

103Jardine Matheson | Annual Report 2011
Shareholder Information
Financial Calendar
2011 full-year results announced 2nd March 2012Share registers closed 19th to 23rd March 20122011 final dividend scrip election period closes 20th April 2012Annual General Meeting to be held 10th May 20122011 final dividend payable 16th May 20122012 half-year results to be announced 27th July 2012*Share registers to be closed 20th to 24th August 2012*2012 interim dividend scrip election period closes 21st September 2012*2012 interim dividend payable 10th October 2012*
Subject to change
DividendsShareholders will receive their dividends in United States dollars, unless they are registered on the Jersey branch register where they will have the option to elect for sterling. These shareholders may make new currency elections for the 2011 final dividend by notifying the United Kingdom transfer agent in writing by 20th April 2012. The sterling equivalent of dividends declared in United States dollars will be calculated by reference to a rate prevailing on 2nd May 2012. Shareholders holding their shares through The Central Depository (Pte) Ltd (‘CDP’) in Singapore will receive United States dollars unless they elect, through CDP, to receive Singapore dollars. Shareholders, including those who hold their shares through CDP, may also elect to receive a scrip alternative to their dividends.
Registrars and Transfer AgentShareholders should address all correspondence with regard to their shareholdings or dividends to the appropriate registrar or transfer agent.
Principal RegistrarJardine Matheson International Services LtdP.O. Box HM 1068Hamilton HM EXBermuda
Jersey Branch RegistrarCapita Registrars (Jersey) Ltd 12 Castle StreetSt Helier, Jersey JE2 3RTChannel Islands
United Kingdom Transfer AgentCapita RegistrarsThe Registry34 Beckenham RoadBeckenhamKent BR3 4TU, England
Singapore Branch RegistrarM & C Services Private Ltd138 Robinson Road #17-00The Corporate OfficeSingapore 068906
Press releases and other financial information can be accessed through the internet at www.jardines.com.
*

104 Jardine Matheson | Annual Report 2011
Group Offices
Jardine Matheson Ltd 48th Floor, Jardine HouseG.P.O. Box 70Hong Kong
TelephoneFacsimileEmailWebsite
(852) 2843 8288(852) 2845 [email protected]
DirectorsBen Keswick, ChairmanAdam Keswick, Deputy ChairmanMark GreenbergDavid HsuY.K. PangJames RileyGiles White
Group Corporate SecretaryN.M. McNamara
Matheson & Co., Ltd 3 Lombard StreetLondon EC3V 9AQUnited Kingdom
TelephoneFacsimileEmailWebsite
(44 20) 7816 8100(44 20) 7623 [email protected] Leach of Fairford
Jardine Pacific Ltd 25th Floor, Devon HouseTaikoo Place979 King’s RoadQuarry BayHong Kong
TelephoneFacsimileEmail
(852) 2579 2888(852) 2856 [email protected] Birks
Jardine Motors Group Ltd 25th Floor, Devon HouseTaikoo Place979 King’s RoadQuarry BayHong Kong
TelephoneFacsimileEmail
(852) 2579 2888(852) 2856 [email protected] Keswick
Jardine Lloyd Thompson Group plc 6 Crutched FriarsLondon EC3N 2PHUnited Kingdom
TelephoneFacsimileEmailWebsite
(44 20) 7528 4444(44 20) 7528 [email protected] Burke
Hongkong Land Ltd 8th FloorOne Exchange SquareCentralHong Kong
TelephoneFacsimileEmailWebsite
(852) 2842 8428(852) 2845 [email protected]. Pang
Dairy Farm Management Services Ltd 7th Floor, Devon HouseTaikoo Place979 King’s RoadQuarry BayHong Kong
TelephoneFacsimileEmailWebsite
(852) 2299 1888(852) 2299 [email protected] Kok
Mandarin Oriental Hotel GroupInternational Ltd
7th Floor281 Gloucester RoadCauseway BayHong Kong
TelephoneFacsimileEmailWebsite
(852) 2895 9288(852) 2837 [email protected] Ettedgui
Jardine Cycle & Carriage Ltd 239 Alexandra RoadSingapore 159930
TelephoneFacsimileEmailWebsite
(65) 6473 3122(65) 6475 [email protected] Newbigging
PT Astra International Tbk Jl. Gaya Motor Raya No. 8Sunter II, Jakarta 14330Indonesia
TelephoneFacsimileEmailWebsite
(62 21) 652 2555(62 21) 651 [email protected] Sugiarto
BermudaJardine Matheson International Services Ltd
4th Floor, Jardine House33-35 Reid StreetHamilton HM 12
P.O. Box HM 1068Hamilton HM EX
TelephoneFacsimile
(1 441) 292 0515(1 441) 292 4072John C. Lang
CambodiaJardine Matheson Ltd(Representative Office)
Colonial Mansion INo. 1A, Street 102Sangkat Wat PhnomKhan Daun Penh, Phnom Penh
Telephone (855) 16 819 119John Brinsden
Hong Kong SARJardine Matheson Ltd
48th Floor, Jardine HouseG.P.O. Box 70Hong Kong
TelephoneFacsimile
(852) 2843 8288(852) 2845 9005Ben Keswick
IndonesiaJardine Matheson Ltd(Representative Office)
Level 17, World Trade CentreJalan Jendral Sudirman Kav. 29-31Jakarta 12920
TelephoneFacsimile
(62 21) 522 8981/2(62 21) 522 8983Jonathan Chang
Mainland ChinaJardine Matheson (China) Ltd(Representative Office)
Rm 528, 5/F, China World Office 1China World Trade CentreNo. 1 Jianguomenwai AvenueChaoyang District, Beijing 100004
TelephoneFacsimile
(8610) 6505 2801(8610) 6505 2805Adam C.N. Williams
MalaysiaJardine Matheson (Malaysia) Sdn Bhd
Tingkat 4, Bangunan Setia 115 Lorong DungunBukit Damansara50490 Kuala Lumpur
TelephoneFacsimile
(603) 2093 5512(603) 2093 5168Datuk Syed Tamim Mohamed
NetherlandsJardine Matheson Europe B.V.
Atrium BuildingStrawinskylaan 30071077 ZX Amsterdam
TelephoneFacsimile
(31 20) 470 0258(31 20) 470 0323Pim Bertels
PhilippinesJardine Matheson Ltd(Representative Office)
25/F Philamlife Tower8767 Paseo de Roxas1226 Makati City
TelephoneFacsimile
(632) 706 8573(632) 885 7078A.B. Colayco
SingaporeJardine Matheson (Singapore) Ltd
239 Alexandra Road, 3rd FloorSingapore 159930
TelephoneFacsimile
(65) 6220 4254(65) 6323 0694Y.C. Boon
TaiwanJardine, Matheson & Co., Ltd
6F, 39 Jinan RoadSection 2, Taipei 10059
TelephoneFacsimile
(8862) 2395 1166(8862) 2394 5625Liang Chang
ThailandJardine Matheson (Thailand) Ltd
21-03, 21st Floor, Times Square Building246 Sukhumvit Road, KIong ToeyBangkok 10110
TelephoneFacsimile
(662) 254 0674(662) 254 0677Dr Pisit Leeahtam
United KingdomMatheson & Co., Ltd
3 Lombard StreetLondon EC3V 9AQ
TelephoneFacsimile
(44 20) 7816 8100(44 20) 7623 5024Lord Leach of Fairford
VietnamJardine Matheson Ltd
5th Floor, Gemadept Tower6 Le Thanh Ton StreetDistrict 1, Ho Chi Minh City
TelephoneFacsimile
(848) 3822 2340(848) 3823 0030Alain Cany