Embed Size (px)
Citation preview


0
2
4
6
1985 1986 1987 1988 1989 1990 1991 1992 1993 1994 1995 1996 1997 1998 1999 2000 2001 2002
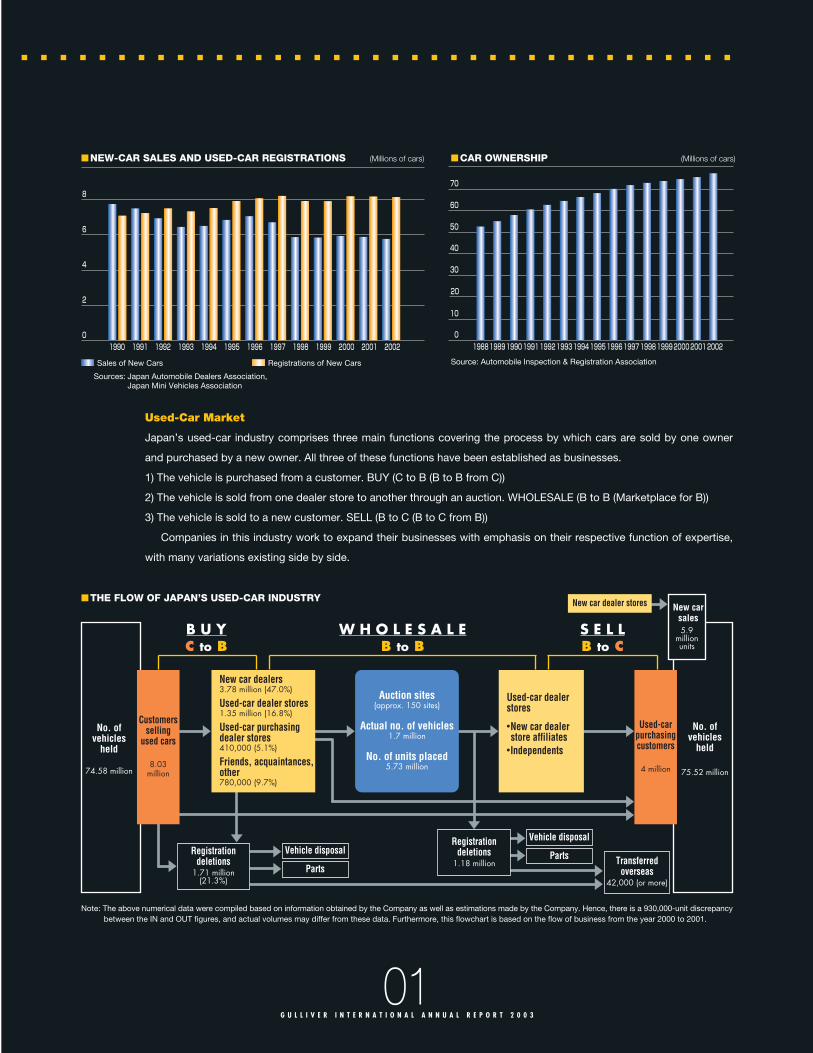
Japan’s Used-Car Market
Used-car registrations first exceeded those for new cars in 1992, and the used-car market has grown steadily ever
since. (However, calculations of used-car registrations may be artificially high since ownership titles are changed when auto-
mobiles are traded from business to business. The actual number of units is estimated to be half the number of registrations.)
The ratio of new cars to used cars is estimated at 3:2. Although Japan’s used-car market has shown little fluctuation in
recent years, considering that the new-car to used-car ratio in Europe and North America is approximately 1:2, the
Japanese used-car market still has room for growth.
The Rise of Auctions
As stated above, since the new-car to used-car ratio is higher than that of Europe and North America, the Japanese auto-
mobile market features an overabundance of used cars. Hence, used-car prices change every two to three weeks on the auc-
tion market, and, in many cases, used cars that are left in long-term inventory become dead stock. New-car dealer
stores and used-car businesses must dispose of their inventories of dead-stock automobiles that they are unable to sell on
their own. This situation has led to the rise in the number of auction sites that conduct B-to-B resale of automobiles.
Auction sites are often run by the Japan Used Car Distributors Association and have increased in activity with the emer-
gence of such independent auction administration companies as USS Co., Ltd., and Aucnet Inc. Today’s auctions consist
of on-site auctions, in which the vehicles are transported to any actual site, and TV auctions, which use satellite commu-
nications without physically moving the actual cars. USS conducts both TV auctions and on-site auctions, while Aucnet spe-
cializes in TV auctions.
Approximately six million automobiles are put up for auction annually at Japan’s approximately 150 auction sites, and more
than 50% of these automobiles are successfully sold. Moreover, recent years have seen an increase in the use of computer
systems, with some cars sold in a matter of seconds. Such features make Japan’s automobile auctions among the most
advanced in the world.
TRENDS IN THE USED-CAR MARKET
CONTENTS
01
02
06
08
10
11
34
Trends in the Used-Car Market
Message from the President
The Gulliver Business Model
The Sales Process—Auctions and the Dolphinet System
Directors and Auditors
Financial Section
Gulliver’s History/Corporate Data
Source: Monthly Used CarNo. of cars sold
■ NO. OF CARS PUT UP FOR AUCTION AND NO. ACTUALLY SOLD (Millions of cars) ■AUCTION COMPANIES’MARKET SHARE(No. of cars put up for auction in 2002)
No. of cars put up for auction
Cautionary Statement with Respect to Forward-Looking Statements
This annual report contains statements about Gulliver’s future business
plans and strategies as well as estimates. Statements regarding the
Company’s projected business results are not based on historical facts and
are subject to various risks and uncertainties.
. . . . . . . . . . . . . . . . . . .
Total of USS25%
Other21%
JU affiliated19%
7%6%
5%6%
Total of HanatenTAA 5 districts
Total of JAA
Total of Arai AA
Aucnet
CAA
5%
5%
Source: Monthly Used Car
01G U L L I V E R I N T E R N A T I O N A L A N N U A L R E P O R T 2 0 0 3
Registrations of New Cars
Used-Car Market
Japan’s used-car industry comprises three main functions covering the process by which cars are sold by one owner
and purchased by a new owner. All three of these functions have been established as businesses.
1) The vehicle is purchased from a customer. BUY (C to B (B to B from C))
2) The vehicle is sold from one dealer store to another through an auction. WHOLESALE (B to B (Marketplace for B))
3) The vehicle is sold to a new customer. SELL (B to C (B to C from B))
Companies in this industry work to expand their businesses with emphasis on their respective function of expertise,
with many variations existing side by side.
■ THE FLOW OF JAPAN’S USED-CAR INDUSTRY
Sales of New Cars Source: Automobile Inspection & Registration Association
Sources: Japan Automobile Dealers Association, Japan Mini Vehicles Association
Note: The above numerical data were compiled based on information obtained by the Company as well as estimations made by the Company. Hence, there is a 930,000-unit discrepancybetween the IN and OUT figures, and actual volumes may differ from these data. Furthermore, this flowchart is based on the flow of business from the year 2000 to 2001.
. . . . . . . . . . . . . . . . . . . . . . . . . . . . . . . . . . . . .
0
2
4
6
8
1990 1991 1992 1993 1994 1995 1996 1997 1998 1999 2000 2001 2002
■ NEW-CAR SALES AND USED-CAR REGISTRATIONS (Millions of cars)
0
10
20
30
40
50
60
70
198819891990199119921993199419951996199719981999200020012002
■ CAR OWNERSHIP (Millions of cars)
B U YC to B
S E L LB to C
W H O L E S A L EB to B
No. of vehicles
held
74.58 million
No. of vehicles
held
75.52 million
Transferred overseas
42,000 (or more)
Vehicle disposal
Parts
Used-carpurchasingcustomers
4 million
New carsales5.9
millionunits
Vehicle disposal
Parts
New car dealers3.78 million (47.0%)
Used-car dealer stores1.35 million (16.8%)
Used-car purchasingdealer stores410,000 (5.1%)
Friends, acquaintances,other 780,000 (9.7%)
Used-car dealerstores●New car dealerstore affiliates
●Independents
New car dealer stores
Registration deletions
1.18 millionRegistration
deletions 1.71 million
(21.3%)
Customersselling
used cars
8.03million
Auction sites(approx. 150 sites)
Actual no. of vehicles1.7 million
No. of units placed5.73 million

02G U L L I V E R I N T E R N A T I O N A L A N N U A L R E P O R T 2 0 0 3
Earnings
Consolidated net sales for Gull iver
International Co., Ltd., for the fiscal year
ended February 28, 2003, increased
11.9%, compared with the previous fiscal
year, to ¥94,957 million. Consolidated
operating income grew 24.5%, to ¥5,244
million, and consolidated net income
grew 47.9%, to ¥2,777 million. These
year-on-year increases in both revenue
and profit reflect both an increase in the
number of customers attracted by each
Gulliver dealer store as well as a steady
increase in the number of vehicles pur-
chased, thanks to the continual opening
of new Gulliver dealer stores.
For the nine consecutive years since
its establishment in 1994, Gull iver
International has continually recorded
increases in both revenue and profit (net
sales and operating income). We attribute
this success to our swift capture of the
largest share of Japan’s used-car pur-
chasing market, which was a completely
new industry at the time of our establish-
ment, and we have been quick to expand
our nationwide franchise operations.
Having thus established its basic infra-
structure, starting in 2000, the Company
shifted its focus from franchise-based
operations to directly managed operations
in determined efforts to further expand
profitability. As a result, in the future we
expect to have 300 directly managed
dealer stores and 200 franchised dealer
stores, for a total of 500 dealer stores.
TodayÕs Used-Car Industry
In recent years, the used-car industry has
seen an increasing shift from the core
business toward expansion into other
sectors. In the purchasing industry, it is
sometimes claimed that the competition
has become fierce with such industry
giants as Toyota entering the market.
However, I consider this to be a blessing
rather than a curse because, whereas tra-
ditionally the Japanese used-car business
has been perceived to lack transparency,
the entry of major automakers into the
MESSAGE FROM THE PRESIDENT . . . . . . . . . . . . . . . . . . . . . . . .
Kenichi Hatori, President

03G U L L I V E R I N T E R N A T I O N A L A N N U A L R E P O R T 2 0 0 3
market has served to increase con-
sumers’ confidence in the industry.
Moreover, the used-car purchasing mar-
ket is still not generally well known, and
increasing overall awareness of the pur-
chasing market will certainly be of benefit
to Gulliver International. Indeed, the num-
ber of Gulliver assessments and purchas-
es has risen as more and more people
feel at ease about visiting used-car pur-
chasers or using the Internet to obtain
assessments of their vehicles. Most
recently, we have seen expansion of the
age range of our customers, with those in
their 40s and 50s beginning to use our
services as well.
It is a fact that billboards advertising
used-car purchasing franchises are
increasing along Japan’s highways.
However, Gulliver still lacks any true com-
petitors: the reason being that, although
other companies’ franchises may resem-
ble ours externally, they have not taken
the same steps that we have to tran-
scend traditional business models and
offer low-cost operations. There is also a
substantial difference in brand strength
and market recognition.
At the same time, this is a good devel-
opment in the sense that only the compa-
nies that provide the most value to the
customers will be on the winning side. I
think companies that concentrate simply
on reaping the most profit out of each
individual vehicle sold, or offer no post-
sales service or warranty, will find it very
difficult to survive in the months and years
ahead without changing their ways.
Business is not just about competing on
price. It is also important to get to know
one’s customers well and nurture long-
lasting relationships. Furthermore, it is
crucial to achieve low-cost operations
with minimal expenses and raise rev-
enues by steadily increasing the number
of vehicles traded, even at relatively low
per-vehicle profit.
. . . . . . . . . . . . . . . . . . . . . . . . . . . . . . . . . . . . . .
■ NET SALES (Millions of yen) ■ OPERATING INCOME (Millions of yen) ■ NET INCOME (Millions of yen)
0
20,000
40,000
60,000
80,000
100,000
0
1,000
2,000
3,000
4,000
5,000
0
500
1,000
1,500
2,000
2,500
1995 1996 1997 1998 1999 2000 2001 2002 2003 1995 1996 1997 1998 1999 2000 2001 2002 2003 1995 1996 1997 1998 1999 2000 2001 2002 2003
Consolidated basisNon-consolidated basis Consolidated basisNon-consolidated basis Consolidated basisNon-consolidated basis
Strategy for Opening and
Placement of Dealer Stores
One of Gulliver’s tasks in the short term is
to attract those customers who have not
yet set foot inside a Gulliver dealer store.
According to one market survey, approxi-
mately 70% of the population never con-
sider visiting any car businesses other
than new-car dealer stores. We must
come up with ways to approach this mar-
ket stratum. To this end, we will take vari-
ous steps to attract a greater number of
customers to our directly managed dealer
stores by giving them a high-class feel on
a par with new-car dealer stores. We will
open larger dealer stores, refurbish exist-
ing ones, and experiment with new dealer
store designs that break away from our
traditional use of a bright yellow color
scheme, the Gulliver mascot, and the
“used-car purchasing” signboard.
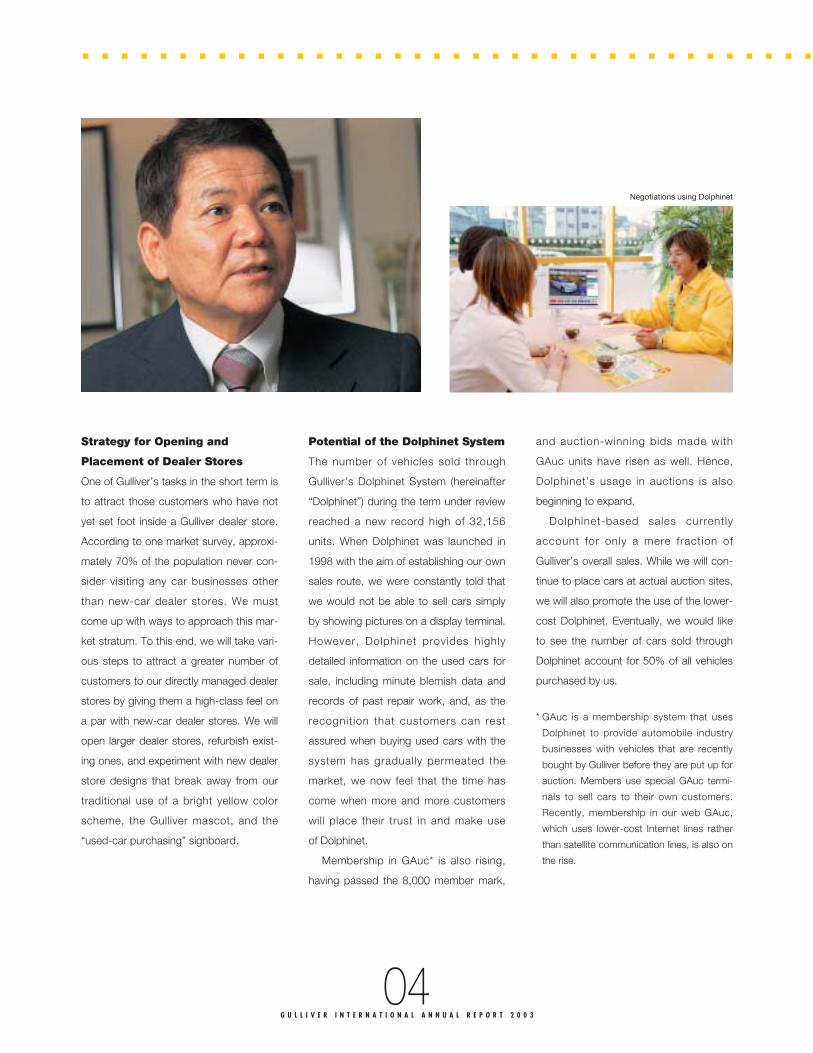
Potential of the Dolphinet System
The number of vehicles sold through
Gulliver’s Dolphinet System (hereinafter
“Dolphinet”) during the term under review
reached a new record high of 32,156
units. When Dolphinet was launched in
1998 with the aim of establishing our own
sales route, we were constantly told that
we would not be able to sell cars simply
by showing pictures on a display terminal.
However, Dolphinet provides highly
detailed information on the used cars for
sale, including minute blemish data and
records of past repair work, and, as the
recognition that customers can rest
assured when buying used cars with the
system has gradually permeated the
market, we now feel that the time has
come when more and more customers
will place their trust in and make use
of Dolphinet.
Membership in GAuc* is also rising,
having passed the 8,000 member mark,
and auction-winning bids made with
GAuc units have risen as well. Hence,
Dolphinet’s usage in auctions is also
beginning to expand.
Dolphinet-based sales currently
account for only a mere fraction of
Gulliver’s overall sales. While we will con-
tinue to place cars at actual auction sites,
we will also promote the use of the lower-
cost Dolphinet. Eventually, we would like
to see the number of cars sold through
Dolphinet account for 50% of all vehicles
purchased by us.
* GAuc is a membership system that uses
Dolphinet to provide automobile industry
businesses with vehicles that are recently
bought by Gulliver before they are put up for
auction. Members use special GAuc termi-
nals to sell cars to their own customers.
Recently, membership in our web GAuc,
which uses lower-cost Internet lines rather
than satellite communication lines, is also on
the rise.
04G U L L I V E R I N T E R N A T I O N A L A N N U A L R E P O R T 2 0 0 3
. . . . . . . . . . . . . . . . . . . . . . . . . . . . . . . . . . . . . .
Negotiations using Dolphinet

IR Efforts
In IR activities, Gulliver has undertaken a
serious study of the best way to promote
understanding of its business among
investors and analysts as well as gain
their trust. In December 2002, Gulliver
International received the Japan Investor
Relations Association’s IR Excellence
Incentive Award, which I consider an
extremely valuable accomplishment.
Future Outlook
My goal in establishing Gulliver
International is to bring about a distribution
revolution in Japan’s automobile industry.
We have a strong desire to clean up the
used-car industry’s image, put consumers
at ease, and instill a sense of the quality of
used cars; it is out of our conviction to our-
selves to change automobile distribution to
these ends that we as a company were
formed. Our signboards declaring us as
used-car purchasing specialists and our
nationwide network of 500 branches are
only minute steps toward our goal. My
ultimate aim is to tear down the used-car
industry’s traditional image and to be a
pioneer in the creation of a new automo-
bile culture. To this end, we have adopted
the medium-term goal of attaining annual
Group purchases of one million units, and
we will strive to capture unparalleled mar-
ket share in the used-car industry. Our
initial goal is to achieve annual purchases
of 500,000 units. By the time we are able
to achieve our one million unit objective,
the Gulliver style of business will have
become the industry standard, and we
will be able to establish reasonable and
trustworthy used-car prices.
In October 2003, Gulliver will celebrate
its 10th anniversary of its establishment,
but I believe that it has just now reached
its starting line. Until now, we have been
creating our mechanisms and setting the
stage for our business, and now it is time
to take that stage. Gulliver seeks not
merely to grow as a large corporation by
amassing its earnings. It is a company
that seeks to broaden its social signifi-
cance by bringing about a distribution
revolution in Japan’s automobile industry.
I look forward to fulfilling the expecta-
tions of al l stakeholders in Gull iver
International.
May 2003
Kenichi HatoriPresident
05G U L L I V E R I N T E R N A T I O N A L A N N U A L R E P O R T 2 0 0 3
. . . . . . . . . . . . . . . . . . . . . . . . . . . . . . . . . . . . .
One of the new Gulliver dealer stores
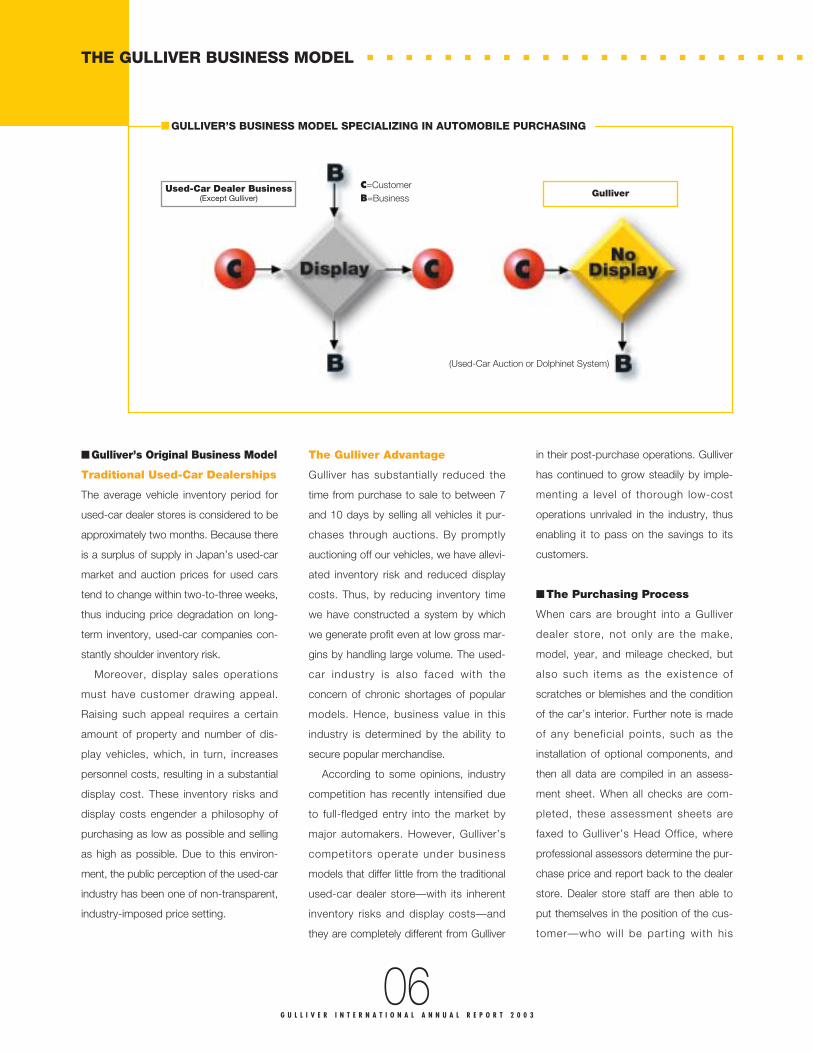
■ Gulliver’s Original Business Model
Traditional Used-Car Dealerships
The average vehicle inventory period for
used-car dealer stores is considered to be
approximately two months. Because there
is a surplus of supply in Japan’s used-car
market and auction prices for used cars
tend to change within two-to-three weeks,
thus inducing price degradation on long-
term inventory, used-car companies con-
stantly shoulder inventory risk.
Moreover, display sales operations
must have customer drawing appeal.
Raising such appeal requires a certain
amount of property and number of dis-
play vehicles, which, in turn, increases
personnel costs, resulting in a substantial
display cost. These inventory risks and
display costs engender a philosophy of
purchasing as low as possible and selling
as high as possible. Due to this environ-
ment, the public perception of the used-car
industry has been one of non-transparent,
industry-imposed price setting.
The Gulliver Advantage
Gulliver has substantially reduced the
time from purchase to sale to between 7
and 10 days by selling all vehicles it pur-
chases through auctions. By promptly
auctioning off our vehicles, we have allevi-
ated inventory risk and reduced display
costs. Thus, by reducing inventory time
we have constructed a system by which
we generate profit even at low gross mar-
gins by handling large volume. The used-
car industry is also faced with the
concern of chronic shortages of popular
models. Hence, business value in this
industry is determined by the ability to
secure popular merchandise.
According to some opinions, industry
competition has recently intensified due
to full-fledged entry into the market by
major automakers. However, Gulliver’s
competitors operate under business
models that differ little from the traditional
used-car dealer store—with its inherent
inventory risks and display costs—and
they are completely different from Gulliver
in their post-purchase operations. Gulliver
has continued to grow steadily by imple-
menting a level of thorough low-cost
operations unrivaled in the industry, thus
enabling it to pass on the savings to its
customers.
■The Purchasing Process
When cars are brought into a Gulliver
dealer store, not only are the make,
model, year, and mileage checked, but
also such items as the existence of
scratches or blemishes and the condition
of the car’s interior. Further note is made
of any beneficial points, such as the
installation of optional components, and
then all data are compiled in an assess-
ment sheet. When all checks are com-
pleted, these assessment sheets are
faxed to Gulliver’s Head Office, where
professional assessors determine the pur-
chase price and report back to the dealer
store. Dealer store staff are then able to
put themselves in the position of the cus-
tomer—who wil l be parting with his
06G U L L I V E R I N T E R N A T I O N A L A N N U A L R E P O R T 2 0 0 3
THE GULLIVER BUSINESS MODEL
(Used-Car Auction or Dolphinet System)
C=CustomerB=Business
■ GULLIVER’S BUSINESS MODEL SPECIALIZING IN AUTOMOBILE PURCHASING
Used-Car Dealer Business(Except Gulliver) Gulliver
. . . . . . . . . . . . . . . . . . . . . . .

■ THE PURCHASING PROCESS
5-10 minutes
beloved vehicle—and provide highly satis-
factory negotiations. For customers relin-
quishing their cars, the greatest concern
is price. At Gulliver, we believe that, by
offering prices commensurate with mar-
ket value, we can provide peace of mind
to used-car customers. Because used-
car prices tend to change in two-to-three
weeks’ time, purchase prices must be
determined based on an assessment of
fluctuating auction rates and an accurate
prediction of winning bid prices. With the
inclusion of different models and classes,
there are more than 6,000 different auto-
mobile models, both domestic and for-
eign, in market circulation. In addition,
when such items as mileage, year, color,
features, and repair records are factored
in, the result is a near-infinite variety of
vehicles. Gull iver employs a system
whereby professional assessors at its
Head Office provide comprehensive
assessments based on a database of
450,000 entries reflecting the most recent
auction prices. By so doing, we are able
to offer clearly based prices for any type
of car, eliminate inconsistency in price
setting, and offer a uniform level of high-
quality service nationwide.
■ ISO Certification for
Its Purchasing Business
In November 2001, Gulliver became the
first in the industry to attain certification in
the ISO 9001 quality assurance system
(2000 version) for the assessment and
price computation operations of its used-
car purchasing business. Through the
implementation of the ISO 9001 quality
management system, we will enhance the
quality of our assessment services (the
accuracy and speed of our price calcula-
tions) and offer highly precise assess-
ments along with the negotiations
provided by our nationwide network of
dealer stores.
■Contact Center and Dispatched
Purchasing Service
Gulliver’s Contact Center handles cus-
tomer inquiries and consultation. By either
telephone (toll free: 0120-22-1616) or the
Internet (http://221616.com), customers
can easily reach our Contact Center to
make assessment inquiries. A sales rep-
resentative from one of our nationwide
dispatch centers then visits the customer
directly. Sales representatives’ schedules
are managed by the Contact Center, and
these operations are conducted in a high-
ly efficient manner.
07G U L L I V E R I N T E R N A T I O N A L A N N U A L R E P O R T 2 0 0 3
. . . . . . . . . . . . . . . . . . . . . . . . . . . . . . . . . . . . . .
Customer Inspection AssessmentSheet
Head Office DeterminedPurchasing Price
Ship
ment
Dolphinet System
Fax Agreement
Sale agreement
Used-Car Auction
NegotiationsAssessment result
7 to 10 days
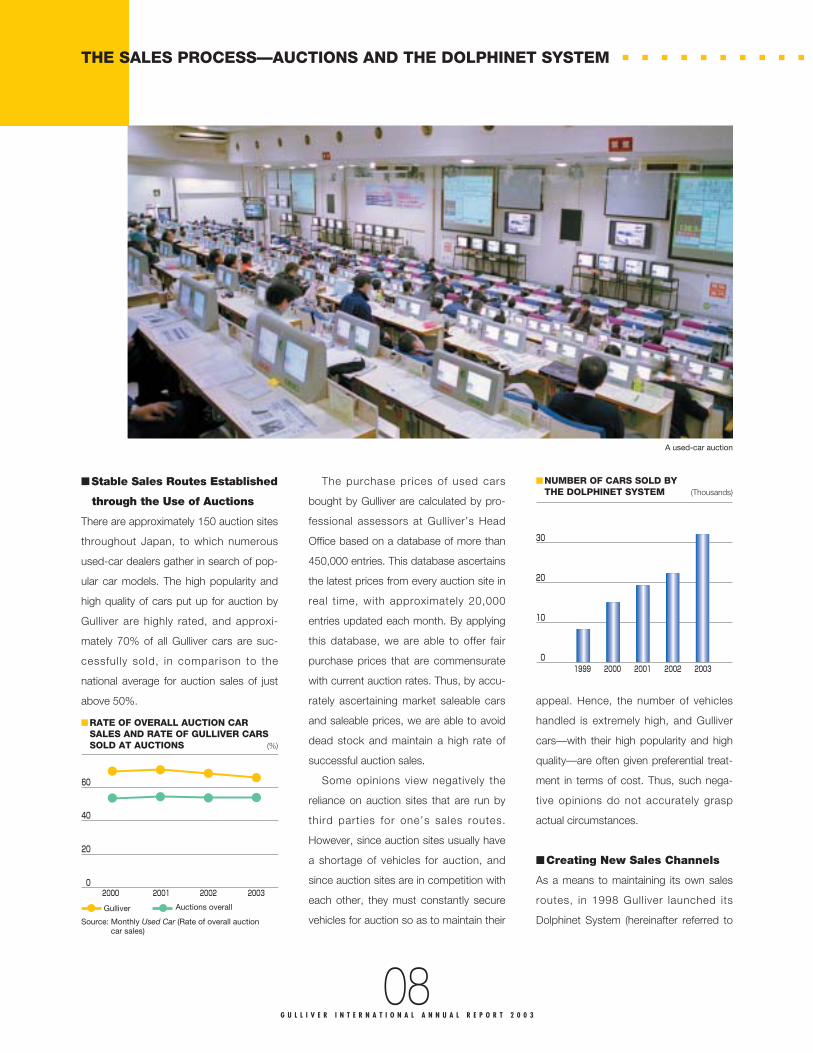
■Stable Sales Routes Established
through the Use of Auctions
There are approximately 150 auction sites
throughout Japan, to which numerous
used-car dealers gather in search of pop-
ular car models. The high popularity and
high quality of cars put up for auction by
Gulliver are highly rated, and approxi-
mately 70% of all Gulliver cars are suc-
cessfully sold, in comparison to the
national average for auction sales of just
above 50%.
The purchase prices of used cars
bought by Gulliver are calculated by pro-
fessional assessors at Gulliver’s Head
Office based on a database of more than
450,000 entries. This database ascertains
the latest prices from every auction site in
real time, with approximately 20,000
entries updated each month. By applying
this database, we are able to offer fair
purchase prices that are commensurate
with current auction rates. Thus, by accu-
rately ascertaining market saleable cars
and saleable prices, we are able to avoid
dead stock and maintain a high rate of
successful auction sales.
Some opinions view negatively the
reliance on auction sites that are run by
third parties for one’s sales routes.
However, since auction sites usually have
a shortage of vehicles for auction, and
since auction sites are in competition with
each other, they must constantly secure
vehicles for auction so as to maintain their
appeal. Hence, the number of vehicles
handled is extremely high, and Gulliver
cars—with their high popularity and high
quality—are often given preferential treat-
ment in terms of cost. Thus, such nega-
tive opinions do not accurately grasp
actual circumstances.
■Creating New Sales Channels
As a means to maintaining its own sales
routes, in 1998 Gulliver launched its
Dolphinet System (hereinafter referred to
0
10
20
30
1999 2000 2001 2002 2003
08G U L L I V E R I N T E R N A T I O N A L A N N U A L R E P O R T 2 0 0 3
THE SALES PROCESS—AUCTIONS AND THE DOLPHINET SYSTEM . . . . . . . . . .
Gulliver Auctions overall
■ NUMBER OF CARS SOLD BYTHE DOLPHINET SYSTEM (Thousands)
Source: Monthly Used Car (Rate of overall auction car sales)
0
20
40
60
2000 2001 2002 2003
■ RATE OF OVERALL AUCTION CARSALES AND RATE OF GULLIVER CARSSOLD AT AUCTIONS (%)
A used-car auction

09G U L L I V E R I N T E R N A T I O N A L A N N U A L R E P O R T 2 0 0 3
simply as “Dolphinet”), leveraging both
satellite communications and graphics
technology. Dolphinet is used to sell auto-
mobiles in the brief 7- to 10-day time
frame following purchase by Gulliver deal-
er stores, after which they are placed at
auctions. The Dolphinet display monitor
provides not only such basic information
as images of the vehicle but also such
detailed data as past repair records and
whether there are any scratches or
dents. The vehicle’s exterior is further
assessed on a scale of 100 and its interi-
or rated according to a five-stage system,
thus providing comprehensive vehicle
value data.
Consumers who find it difficult to dis-
cern a used car’s value try their best to
do so by examining the vehicle itself.
However, detailed information is seldom
disclosed, making the decision to pur-
chase difficult. With Dolphinet, such prob-
lems are alleviated without the need for
hands-on examination of the vehicle by
providing professional assessment and
price setting as well as the open disclo-
sure of detailed data.
For automobile industry businesses,
Gulliver also offers GAuc, a membership-
based system that uses Dolphinet to sup-
ply cars that are recently purchased by
Gulliver before they are put up for auc-
tion. GAuc members use specialized ter-
minals to sell cars through their own
dealer stores. Recently, membership is
also rising in Gulliver’s web GAuc, which
uses Internet-based communication,
which is much less costly than satellite
communications. Furthermore, in autumn
2002 we began accepting membership in
the web GAuc Gold Lounge, which pro-
vides a variety of services to existing web
GAuc members. While image-based car
sales have not permeated the general
market, we at Gulliver feel that for the
sale of used cars—each with differing
value—this form of sale offers the best
service to the consumer. We are steadily
increasing sales in this sector, which have
already exceeded a total of 100,000
units, and, should the day come when
buying cars based on visual data alone is
a common affair, the development of
Dolphinet has strong potential to con-
tribute to future revenue.
. . . . . . . . . . . . . . . . . . . . . . . . . . . . . . . . . . . . . .
■ DOLPHINET SYSTEM
Communication satellite or Internet
Purchasefrom
customer
Communicationsatellite or
Internet
Vehicle purchase
(winning bid) Sale
▲
❚❚❚❚❚❚❚❚❚❚❚❚❚
▲
❚❚❚❚❚❚
❚❚❚
Gulliver store Dolphinet SystemPut up for auction within 7 to 10 days
GulliverStore
GAucMember
Customer Customer
Used-Car Auction
Gulliver revenue from Dolphinet operations includes gross profit on vehicles in the case of sales by directly managed Gulliver dealer stores and service charges in thecase of sales by Gulliver franchise dealer stores and GAuc members.
A Dolphinet System terminal

10G U L L I V E R I N T E R N A T I O N A L A N N U A L R E P O R T 2 0 0 3
DIRECTORS AND AUDITORS (As of February 28, 2003) . . . . . . . . . . . . . .
President
Kenichi Hatori
Senior Executive Vice President
Ikuo Murata
Senior Managing Director
Yusuke Hatori
Managing Directors
Yukihiro Yoshida
Takao Hatori
Standing Corporate Auditor
Nitsumasa Ito
Corporate Auditors
Etsuya Washio
Masakatsu Endo
(From left) Takao Hatori, Ikuo Murata, Kenichi Hatori, Yusuke Hatori, and Yukihiro Yoshida

11G U L L I V E R I N T E R N A T I O N A L A N N U A L R E P O R T 2 0 0 3
. . . . . . . . . . . . . .CONSOLIDATED FINANCIAL HIGHLIGHTSFor the years ended February 28, 2003 and 2002Gulliver International Co., Ltd.
Thousands ofThousands Thousands U.S. dollars
of yen of yen (Note 1)
2003 2002 2003
For the year:Net sales ¥94,957,515 ¥84,880,972 $806,433Operating income 5,244,913 4,212,432 44,543Net income 2,777,175 1,877,556 23,585
At year-end:Total assets 20,057,544 18,941,856 170,340Total shareholders’ equity 12,565,484 11,092,972 106,714
Per share data (Yen/U.S. dollars):Net income:
Basic ¥00,275.67 ¥0,180.59 $02.34Diluted 274.49 — 2.33
Cash dividends 80.00 45.00 0.68Shareholders’ equity 1,197.99 1,091.64 10.17
Ratios (%):Return on equity (Note 2) 23.5 17.3Return on assets (Note 3) 26.9 22.6Equity ratio 62.6 58.6
Employees:Number of employees 1,199 1,057
NON-CONSOLIDATED SIX-YEAR SUMMARYYears ended February 28 or 29Gulliver International Co., Ltd.
Thousandsof yen
1998 1999 2000 2001 2002 2003
For the year:Net sales ¥14,019,638 ¥25,429,560 ¥42,340,143 ¥58,285,250 ¥82,503,511 ¥91,071,908Operating income 699,216 1,181,799 2,514,698 2,541,888 4,033,953 5,032,169Net income 285,728 552,391 1,036,557 1,251,516 1,780,142 2,667,689
At year-end:Total assets 3,930,503 6,851,202 15,516,320 18,286,974 18,339,282 18,931,226Total shareholders’ equity 590,955 1,652,686 9,422,714 10,580,780 10,962,262 12,329,634
Per share data (Yen/U.S. dollars):Net income:
Basic 75,388.48 94.15 146.87 124.17 171.22 264.80Diluted — — — — — 233.67
Cash dividends (Old) 2,500.00 5.00 5.00 20.00 45.00 80.00(New) 1,280.00
Shareholders’ equity 103,822.19 254.57 1,257.70 1,008.76 1,078.78 1,045.14
Ratios (%):Return on equity (Note 2) 79.5 49.2 18.7 12.5 16.5 22.9Return on assets (Note 3) 24.3 21.9 22.5 15.0 22.0 14.3Equity ratio 15.0 24.1 60.7 57.9 59.8 65.1Dividends ratio 3.3 5.5 3.6 16.7 25.9 30.0
Common stock (Shares):Number of shares issued 5,692 6,492,000 7,492,000 10,488,800 10,488,800 10,488,800
Employees:Number of employees 201 350 559 733 1,035 1,177
Notes: 1. Translation into U.S. dollars has been made on the basis of ¥117.75=$1, the effective exchange rate at February 28, 2003.Notes: 2. ROE=Net income/shareholders’ equity (yearly average) X 100Notes: 3. ROA=Operating income/total assets (yearly average) X 100
. . . . . . . . . . . . . . .
12G U L L I V E R I N T E R N A T I O N A L A N N U A L R E P O R T 2 0 0 3
MANAGEMENT’S DISCUSSION AND ANALYSIS
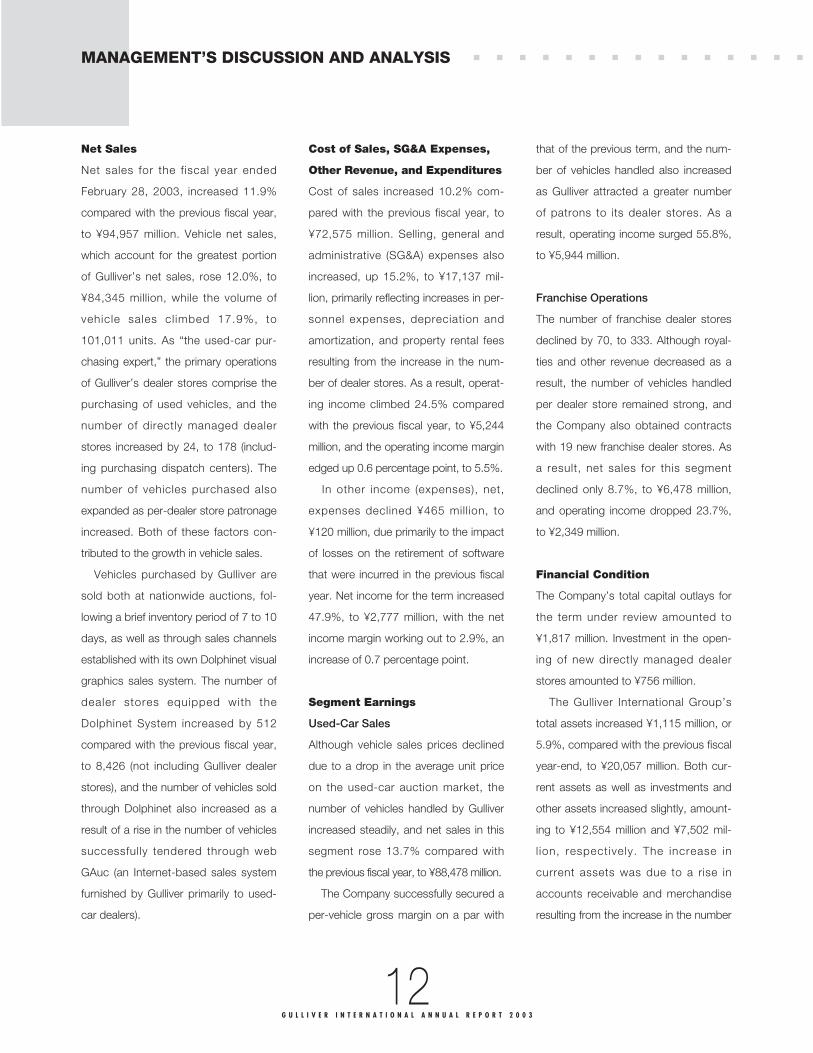
Net Sales
Net sales for the fiscal year ended
February 28, 2003, increased 11.9%
compared with the previous fiscal year,
to ¥94,957 million. Vehicle net sales,
which account for the greatest portion
of Gulliver’s net sales, rose 12.0%, to
¥84,345 million, while the volume of
vehicle sales cl imbed 17.9%, to
101,011 units. As “the used-car pur-
chasing expert,” the primary operations
of Gulliver’s dealer stores comprise the
purchasing of used vehicles, and the
number of directly managed dealer
stores increased by 24, to 178 (includ-
ing purchasing dispatch centers). The
number of vehicles purchased also
expanded as per-dealer store patronage
increased. Both of these factors con-
tributed to the growth in vehicle sales.
Vehicles purchased by Gulliver are
sold both at nationwide auctions, fol-
lowing a brief inventory period of 7 to 10
days, as well as through sales channels
established with its own Dolphinet visual
graphics sales system. The number of
dealer stores equipped with the
Dolphinet System increased by 512
compared with the previous fiscal year,
to 8,426 (not including Gulliver dealer
stores), and the number of vehicles sold
through Dolphinet also increased as a
result of a rise in the number of vehicles
successfully tendered through web
GAuc (an Internet-based sales system
furnished by Gulliver primarily to used-
car dealers).
Cost of Sales, SG&A Expenses,
Other Revenue, and Expenditures
Cost of sales increased 10.2% com-
pared with the previous fiscal year, to
¥72,575 million. Selling, general and
administrative (SG&A) expenses also
increased, up 15.2%, to ¥17,137 mil-
lion, primarily reflecting increases in per-
sonnel expenses, depreciation and
amortization, and property rental fees
resulting from the increase in the num-
ber of dealer stores. As a result, operat-
ing income climbed 24.5% compared
with the previous fiscal year, to ¥5,244
million, and the operating income margin
edged up 0.6 percentage point, to 5.5%.
In other income (expenses), net,
expenses declined ¥465 mill ion, to
¥120 million, due primarily to the impact
of losses on the retirement of software
that were incurred in the previous fiscal
year. Net income for the term increased
47.9%, to ¥2,777 million, with the net
income margin working out to 2.9%, an
increase of 0.7 percentage point.
Segment Earnings
Used-Car Sales
Although vehicle sales prices declined
due to a drop in the average unit price
on the used-car auction market, the
number of vehicles handled by Gulliver
increased steadily, and net sales in this
segment rose 13.7% compared with
the previous fiscal year, to ¥88,478 million.
The Company successfully secured a
per-vehicle gross margin on a par with
that of the previous term, and the num-
ber of vehicles handled also increased
as Gulliver attracted a greater number
of patrons to its dealer stores. As a
result, operating income surged 55.8%,
to ¥5,944 million.
Franchise Operations
The number of franchise dealer stores
declined by 70, to 333. Although royal-
ties and other revenue decreased as a
result, the number of vehicles handled
per dealer store remained strong, and
the Company also obtained contracts
with 19 new franchise dealer stores. As
a result, net sales for this segment
declined only 8.7%, to ¥6,478 million,
and operating income dropped 23.7%,
to ¥2,349 million.
Financial Condition
The Company’s total capital outlays for
the term under review amounted to
¥1,817 million. Investment in the open-
ing of new directly managed dealer
stores amounted to ¥756 million.
The Gulliver International Group’s
total assets increased ¥1,115 million, or
5.9%, compared with the previous fiscal
year-end, to ¥20,057 million. Both cur-
rent assets as well as investments and
other assets increased slightly, amount-
ing to ¥12,554 million and ¥7,502 mil-
l ion, respectively. The increase in
current assets was due to a rise in
accounts receivable and merchandise
resulting from the increase in the number

. . . . . . . . . . . . . . . . . . . . . . . . . . . . . . . .
13G U L L I V E R I N T E R N A T I O N A L A N N U A L R E P O R T 2 0 0 3
of vehicles handled. Although property
and equipment increased ¥530 million,
or 16.8%, to ¥3,692 million, this was a
reflection of the growth in the number of
directly managed dealer stores and
comprised primarily the acquisition of
buildings and structures.
Total liabilities declined ¥405 million,
or 5.2%, to ¥7,413 million. Current lia-
bilities decreased ¥222 million, or 3.2%,
to ¥6,670 million.
Shareholders’ equity increased
¥1,472 million, or 13.3%, to ¥12,565
million. This increase was due to the
growth in consolidated retained earn-
ings that resulted from the net income
for the term, which exceeded the
decline in treasury stock. The Group’s
equity ratio increased by 4.0 percent-
age points, to 62.6%.
Gulliver International places great
emphasis on return on equity (ROE) as
a vital indicator of its fiscal standing and
strives to maintain an ROE of greater
than 10% over the long term. ROE for
the term under review increased 6.2
percentage points, to 23.5%.
Cash Flow Analysis
Net cash provided by operating activi-
ties declined ¥2,894 million, to ¥2,093
million. This was due to a substantial
decline in the rate of increase in debts
and credits, which offset the increase in
income before income taxes and minor-
ity interest that resulted from the growth
in vehicle sales volume.
Net cash used in investing activities
declined ¥625 million, to ¥983 million.
This was due to an increase in expendi-
tures related to the opening of new
directly managed dealer stores and
internal systems upkeep, which coincid-
ed with an increase in net revenue from
the purchase and sale of marketable
securities.
Net cash used in financing activities
dropped ¥2,458 million, to ¥1,011 million,
due primarily to a decline in expenditures
for the repayment of short-term loans.
Dividends
Gulliver International considers the
return of profit to its shareholders to be
one of the most vital tasks of its busi-
ness operations. Our basic policy is to
emphasize dividend payout and provide
returns commensurate with our earnings.
In line with this policy, the annual share-
holder’s dividend has been increased
by ¥35 compared with the previous
fiscal year, to ¥80 per share, thus pro-
ducing an increase in the Company’s
payout ratio of 4.1 points, to 30.0%.
Retained earnings will be used effi-
ciently and effectively in the Company’s
efforts to further expand future profit-
ability and increase corporate value and
will be applied in such areas as the
opening of new directly managed dealer
stores, fortifying internal infrastructure,
and personnel education and training so
as to augment its competitive strength
and enhance its level of service.
Outlook
Japan’s vast used-car market now
totals eight million annual registrations
(including buses, trucks, and other vehi-
cle types), and it is the aim of the
Gulliver International Group to capture
the top share of this market and expand
its profitability. In terms of a numerical
target, the Group will strive to attain
annual vehicle purchases of one million
units over the medium-to-long term.
Tasks immediately facing the Group
include strategic marketing efforts
aimed at expanding its customer appeal
by augmenting its brand strength and
increasing its recognition among a
wider range of age-groups; the qualita-
tive enhancement of services and cus-
tomer satisfaction; bolstering its
business competence through the train-
ing and education of i ts human
resources; and the implementation of
thoroughgoing, low-cost operations.

. . . . . . . . . . . . . . . . . . .
14G U L L I V E R I N T E R N A T I O N A L A N N U A L R E P O R T 2 0 0 3
CONSOLIDATED BALANCE SHEETSAs of February 28, 2003 and 2002Gulliver International Co., Ltd.
Thousands ofThousands Thousands U.S. dollars
of yen of yen (Note 2)
ASSETS 2003 2002 2003
Current assets:Cash and cash equivalents ¥06,513,298 ¥06,419,198 $055,315Time deposits — 552,521 —Short-term investments (Note 2) 78,188 226,163 664Accounts receivable:
Trade 3,260,617 2,783,780 27,691Allowance for doubtful accounts (34,104) (51,767) (290)
3,226,513 2,732,013 27,401Inventories 1,703,495 1,579,106 14,467Deferred income tax assets (Note 12) 216,802 267,267 1,841Other current assets 816,588 696,436 6,935
Total current assets 12,554,887 12,472,706 106,623
Property and equipment:Land 323,011 323,011 2,743Buildings and structures 3,532,784 2,856,568 30,002Furniture, fixtures and equipment 1,483,277 1,207,354 12,597Construction in progress 31,642 36,729 269
5,370,715 4,423,662 45,611Less—Accumulated depreciation (1,677,871) (1,261,529) (14,249)
Net property and equipment 3,692,845 3,162,134 31,362
Investments and other assets:Investment securities (Note 3) 189,909 256,693 1,613Leasehold and guarantee deposits (Note 4) 1,708,191 1,476,279 14,507Deferred income tax assets (Note 12) 177,436 214,080 1,507Software costs, net 1,217,628 948,653 10,341Other assets 785,356 657,880 6,669Allowance for doubtful accounts (268,713) (246,572) (2,282)
Total investments and other assets 3,809,811 3,307,014 32,355
¥20,057,544 ¥18,941,856 $170,340
The accompanying notes are an integral part of these statements.
. . . . . . . . . . . . . . . . . . . . . . . . . . . . . . . . .
15G U L L I V E R I N T E R N A T I O N A L A N N U A L R E P O R T 2 0 0 3
Thousands ofThousands Thousands U.S. dollars
of yen of yen (Note 2)
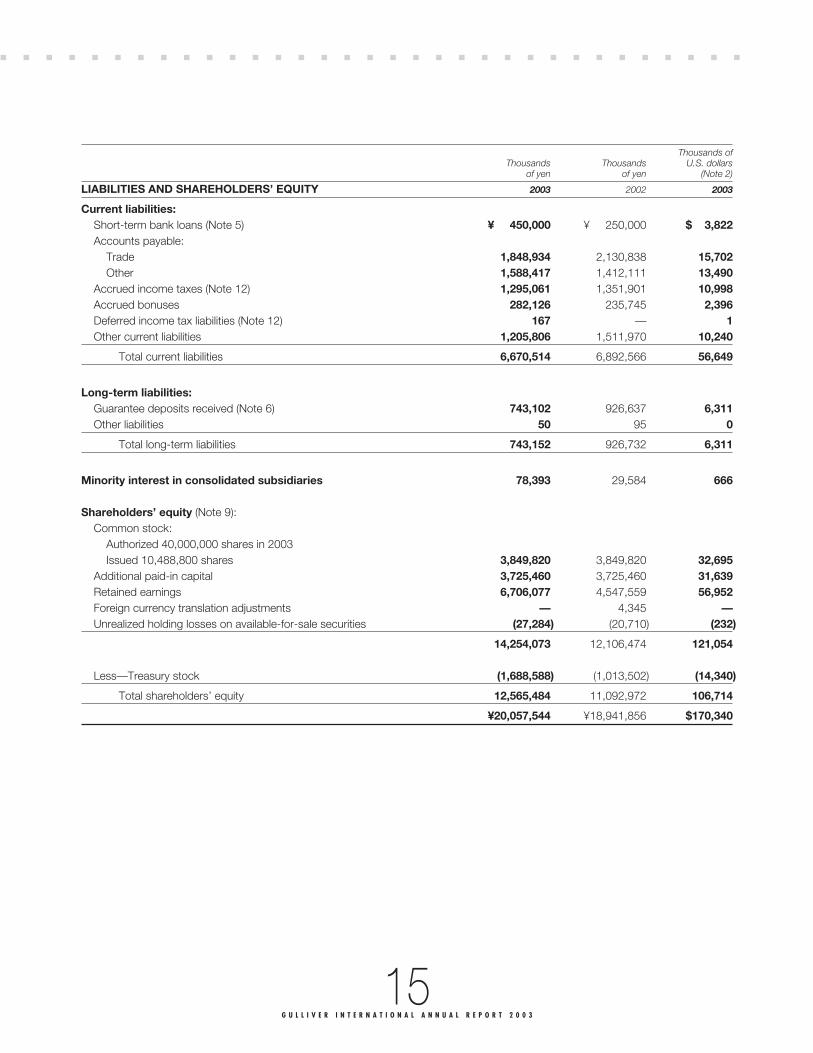
LIABILITIES AND SHAREHOLDERS’ EQUITY 2003 2002 2003
Current liabilities:Short-term bank loans (Note 5) ¥00,450,000 ¥00,250,000 $003,822Accounts payable:
Trade 1,848,934 2,130,838 15,702Other 1,588,417 1,412,111 13,490
Accrued income taxes (Note 12) 1,295,061 1,351,901 10,998Accrued bonuses 282,126 235,745 2,396Deferred income tax liabilities (Note 12) 167 — 1Other current liabilities 1,205,806 1,511,970 10,240
Total current liabilities 6,670,514 6,892,566 56,649
Long-term liabilities:Guarantee deposits received (Note 6) 743,102 926,637 6,311Other liabilities 50 95 0
Total long-term liabilities 743,152 926,732 6,311
Minority interest in consolidated subsidiaries 78,393 29,584 666
Shareholders’ equity (Note 9):Common stock:
Authorized 40,000,000 shares in 2003Issued 10,488,800 shares 3,849,820 3,849,820 32,695
Additional paid-in capital 3,725,460 3,725,460 31,639Retained earnings 6,706,077 4,547,559 56,952Foreign currency translation adjustments — 4,345 —Unrealized holding losses on available-for-sale securities (27,284) (20,710) (232)
14,254,073 12,106,474 121,054
Less—Treasury stock (1,688,588) (1,013,502) (14,340)
Total shareholders’ equity 12,565,484 11,092,972 106,714
¥20,057,544 ¥18,941,856 $170,340

. . . . . . . . . . . . .
16G U L L I V E R I N T E R N A T I O N A L A N N U A L R E P O R T 2 0 0 3
CONSOLIDATED STATEMENTS OF INCOMEFor the years ended February 28, 2003 and 2002Gulliver International Co., Ltd.
Thousands ofThousands Thousands U.S. dollars
of yen of yen (Note 2)
2003 2002 2003
Net sales ¥94,957,515 ¥84,880,972 $806,433
Costs and expenses:Cost of sales 72,575,504 65,798,885 616,352Selling, general and administrative expenses (Note 10) 17,137,097 14,869,653 145,538
89,712,601 80,668,538 761,890
Operating income 5,244,913 4,212,432 44,543
Other income (expenses):Losses on disposal of software, property and equipment (Note 11) (121,746) (502,033) (1,034)Losses on valuation of investment securities (3,541) (25,678) (30)Losses on settlement of severance indemnity liabilities (Note 11) — (44,068) —Other, net 4,545 (14,466) 38
(120,742) (586,245) (1,026)
Income before income taxes and minority interest 5,124,170 3,626,186 43,517
Income taxes (Note 12):Current 2,239,150 2,034,100 19,016Deferred 92,047 (292,646) 782
2,331,197 1,741,453 19,798
Minority interest, net of taxes 15,797 7,176 134
Net income ¥02,777,175 ¥01,877,556 $023,585
U.S. dollarsYen Yen (Note 2)
2003 2002 2003
Net income per share:Basic ¥000,275.67 ¥000,180.59 $0002.34Diluted 274.49 — 2.33
Cash dividends per share 80 45 0.68
The accompanying notes are an integral part of these statements.

17G U L L I V E R I N T E R N A T I O N A L A N N U A L R E P O R T 2 0 0 3
. . . . . . .
Thousands of yen
UnrealizedForeign holding
Number of Additional currency losses onshares of Common paid-in Retained translation available-for- Treasury
common stock stock capital earnings adjustments sale securities stock
Balance at February 28, 2001 10,488,800 ¥3,849,820 ¥3,725,460 ¥3,034,451 ¥ — ¥ — ¥ (45)Net income for the year 1,877,556Unrealized holding losses on available-for-sale securities (20,710)
Foreign currency translation adjustments 4,345
Cash dividends paid (340,397)Bonuses to directors and corporate auditors (24,050)
Increase in treasury stock (1,013,457)
Balance at February 28, 2002 10,488,800 3,849,820 3,725,460 4,547,559 4,345 (20,710) (1,013,502)Net income for the year 2,777,175Unrealized holding losses on available-for-sale securities (6,574)
Foreign currency translation adjustments (4,345)
Cash dividends paid (555,957)Bonuses to directors and corporate auditors (62,700)
Increase in treasury stock (675,086)
Balance at February 28, 2003 10,488,800 ¥3,849,820 ¥3,725,460 ¥6,706,077 ¥ — ¥(27,284) ¥(1,688,588)
Thousands of U.S. dollars (Note 2)
UnrealizedForeign holding
Additional currency losses onCommon paid-in Retained translation available-for- Treasury
stock capital earnings adjustments sale securities stock
Balance at February 28, 2002 $32,695 $31,639 $38,621 $37 $(176) $ (8,607)Net income for the year 23,585Unrealized holding losses on available-for-sale securities (56)
Foreign currency translation adjustments (37)
Cash dividends paid (4,722)Bonuses to directors and corporate auditors (532)
Increase in treasury stock (5,733)
Balance at February 28, 2003 $32,695 $31,639 $56,952 $ — $(232) $(14,340)
The accompanying notes are an integral part of these statements.
CONSOLIDATED STATEMENTS OF SHAREHOLDERS’ EQUITYFor the years ended February 28, 2003 and 2002Gulliver International Co., Ltd.

. . . . . . . . . . .
18G U L L I V E R I N T E R N A T I O N A L A N N U A L R E P O R T 2 0 0 3
CONSOLIDATED STATEMENTS OF CASH FLOWSFor the years ended February 28, 2003 and 2002Gulliver International Co., Ltd.
Thousands ofThousands Thousands U.S. dollars
of yen of yen (Note 2)
2003 2002 2003
Operating activities:Income before income taxes and minority interest ¥5,124,170 ¥3,626,186 $043,517Adjustments for:
Depreciation and amortization 875,833 790,359 7,438Losses on disposal of software, property and equipment 121,746 502,033 1,034
(Increase) decrease in accounts receivable—trade (318,389) 93,237 (2,704)(Increase) decrease in inventories (124,389) 169,309 (1,056)(Decrease) increase in accounts payable—trade (394,196) 828,948 (3,348)Other, net (894,454) 183,574 (7,596)
Subtotal 4,390,321 6,193,646 37,285Interest and dividend income received 3,194 18,636 27Interest expenses paid (4,793) (10,105) (41)Income taxes paid (2,295,372) (1,214,786) (19,494)
Net cash provided by operating activities 2,093,348 4,987,390 17,777
Investing activities:Payments for purchase of short-term investments (498,532) (1,600,476) (4,234)Proceeds from sales of short-term investments 700,332 1,400,496 5,948Payments for purchase of property and equipment (1,155,622) (1,016,065) (9,814)Payments for purchase of software and intangible assets (568,682) (451,242) (4,830)Decrease in time deposits 552,521 — 4,692Other, net (13,728) 58,384 (117)
Net cash used in investing activities (983,711) (1,608,903) (8,355)
Financing activities:Decrease (increase) in short-term bank loans, net 200,000 (600,000) 1,699Repayments of long-term debt — (1,502,560) —Cash dividends paid (555,957) (341,897) (4,721)Purchase of treasury stock (675,086) (1,013,456) (5,733)Other, net 19,850 (12,078) 169
Net cash used in financing activities (1,011,192) (3,469,991) (8,586)
Effect of exchange rate changes on cash and cash equivalents (4,345) — (37)
Net increase (decrease) in cash and cash equivalents 94,099 (91,504) 799Cash and cash equivalents at beginning of year 6,419,198 6,510,703 54,516
Cash and cash equivalents at end of year ¥6,513,298 ¥6,419,198 $055,315
The accompanying notes are an integral part of these statements.

19G U L L I V E R I N T E R N A T I O N A L A N N U A L R E P O R T 2 0 0 3
. . . . . . . . .NOTES TO CONSOLIDATED FINANCIAL STATEMENTSFor the year ended February 28, 2003 and 2002Gulliver International Co., Ltd.
1. Nature of Operations
Gulliver International Co., Ltd. (the “Company”) and its consolidated subsidiaries are mainly engaged in thepurchase and sale of used cars through a nationwide network and franchising business.
2. Summary of Significant Accounting Policies
The accompanying consolidated financial statements have been prepared from the accounts maintained bythe Company and its consolidated subsidiaries in accordance with the provisions set forth in the JapaneseCommercial Code and Japanese Securities and Exchange Law, and in conformity with accounting princi-ples and practices generally accepted in Japan, which are different in certain respects as to the applicationand disclosure requirements of the International Accounting Standards. The consolidated financial state-ments are not intended to present the consolidated financial position, results of operations and cash flowsin accordance with accounting principles and practices generally accepted in countries and jurisdictionsother than Japan. However, certain items presented in the consolidated financial statements filed with theDirector of the Kanto Finance Bureau in Japan have been reclassified and relevant notes have been added,if appropriate, for the convenience of readers outside Japan. Certain prior-year amounts have also beenreclassified to conform to the current year’s presentation. All figures in the accompanying consolidatedfinancial statements and their notes are rounded to thousands of yen, with figures of less than a thousandyen being omitted.
Amounts in U.S. dollars are included solely for the convenience of readers outside Japan. The rate of¥117.75=U.S.$1, the rate of exchange on February 28, 2003, has been used in translation. The inclusion ofsuch amounts is not intended to imply that Japanese yen have been or could be readily converted, realizedor settled in U.S. dollars at this or any other rate.
(a) Basis of ConsolidationThe accompanying consolidated financial statements include the accounts of the Company and its threesubsidiaries, as shown below.
Country of Fiscalincorporation year-end
G Trading Co., Ltd. Japan February 28E-Investment Co., Ltd. Japan February 28Gulliver Europe Ltd. Switzerland December 31
All significant intercompany accounts and transactions and unrealized intercompany profits are eliminatedin consolidation.
The financial statements of subsidiaries are included in the consolidated financial statements on the basisof their respective fiscal years after making appropriate adjustments for material transactions during theperiods from their respective year-ends to the date of the consolidated financial statements, as required.
Upon acquisition of a subsidiary, all of the subsidiary’s assets and liabilities are revalued to their respec-tive fair value at the date of acquisition.
(b) Translation of Foreign CurrenciesEffective from the year ended February 28, 2002, the Company and its subsidiaries have adopted therevised Financial Accounting Standard for Foreign Currency Translation issued by the Business AccountingDeliberation Council. The adoption of this revised standard had no effect on the accompanying consolidatedfinancial statements.
(c) Cash and Cash EquivalentsCash and cash equivalents comprise cash on hand, bank deposits withdrawable on demand and all highlyliquid investments with original maturities of three months or less which present insignificant risk of changein value.

. . . . . . . . . . . . . . . . . . . . . . . . . . . . . . . .
20G U L L I V E R I N T E R N A T I O N A L A N N U A L R E P O R T 2 0 0 3
(d) Short-Term Investments and Investment SecuritiesEffective from the year ended February 28, 2002, as a result of the adoption of the new Financial AccountingStandard for Financial Instruments issued by the Business Accounting Deliberation Council, securities havebeen classified into four categories: trading securities, held-to-maturity debt securities, equity securities ofunconsolidated subsidiaries and affiliates, and available-for-sale securities. The classification of securitiesbetween current and noncurrent was also reexamined, the result being that debt securities with a maturitydate of one year or less were classified as current and debt securities with a maturity date of more than oneyear and equity securities other than trading securities were classified as noncurrent. As a result of the reclas-sification, the balance of securities in the current asset section increased by ¥10,300 thousand ($77 thousand)and the balance of “Investment securities” decreased by the same amount, as at March 1, 2001.
Held-to-maturity securities are carried at amortized cost under the straight-line method. Marketable avail-able-for-sale securities are stated at market value with unrealized gains and losses, net of applicable taxes,being reported in a separate component of shareholders’ equity. The cost of securities sold is determinedbased on the moving-average method. Available-for-sale securities that do not have readily determinablefair values are reported at cost.
Under the previous standard, marketable securities were stated at the lower of cost or market, cost beingdetermined by the moving average method. Other securities without market quotations were stated at cost,cost being determined by the moving average method.
(e) Allowance for Doubtful AccountsEffective from the year ended February 28, 2002, as a result of the adoption of the new FinancialAccounting Standard for Financial Instruments issued by the Business Accounting Deliberation Council,receivables are required to be categorized into “normal receivables” and “doubtful receivables” for the pur-pose of providing an allowance for doubtful accounts. An allowance is then provided for “normal receiv-ables” based on the Company’s historical write-off experience rate and an estimate of irrecoverableamounts for doubtful receivables on an individual account basis.
As a result of the adoption of the new standard for Financial Instruments, “Income before income taxesand minority interest” for the year ended February 28, 2002 increased by ¥35,738 thousand ($266 thou-sand) as compared with the amount which would have been reported if the previous standard had beenapplied consistently.
Under the previous standard, the allowance for doubtful accounts of the Company was provided at theaverage percentage of actual bad debt losses to total accounts receivable, as stipulated by the Income TaxLaw, together with an amount deemed uncollectible based on management’s best estimate. The allowancefor doubtful accounts of its subsidiaries was provided at the maximum deductible amount based on thepercentage permitted by the Income Tax Law, together with an amount deemed uncollectible based onmanagement’s best estimate.
(f) InventoriesVehicles for resale are stated at cost, cost being determined by the individual cost method.
Other merchandise is stated at cost, cost being determined by the first-in, first-out method.Supplies are valued under the last invoice cost method.
(g) Property and EquipmentProperty and equipment are stated at cost. Depreciation is computed using the declining-balance method,except for buildings acquired on or after April 1, 1998, for which it is computed using the straight-linemethod.
The range of the estimated useful lives for property and equipment is as follows:Buildings and structures 15 to 20 years Motor vehicles 02 to 6 years
Expenditures for maintenance, repairs and minor renewals are charged to income as incurred.

. . . . . . . . . . . . . . . . . . . . . . . . . . . . . . . .
21G U L L I V E R I N T E R N A T I O N A L A N N U A L R E P O R T 2 0 0 3
(h) Finance LeasesLease payments under finance lease contracts are charged to income as incurred. Under Japaneseaccounting principles, finance leases where ownership of the assets does not transfer to the lessee at theend of the lease period may be accounted for as operating leases with an appropriate footnote disclosure.
(i) Capitalized Software CostsThe costs of software for internal use are amortized based on the straight-line method over its estimateduseful life, five years.
( j) Intangible and Other AssetsAmortization of intangible assets and long-term prepaid expenses included in “Other assets” is computedusing the straight-line method.
Development costs for new markets are deferred and amortized over five years, as permitted under theCommercial Code.
Common stock issue costs are charged to income as incurred.
(k) Accrued BonusesAccrued employees’ bonuses are provided at the estimated amount to be paid.
(l) Income TaxesIncome taxes consist of corporate income tax, local inhabitants’ taxes and enterprise tax.
Income taxes are determined using the “asset and liability approach,” in which deferred income taxassets and liabilities are recognized for the expected future tax consequences of temporary differencesbetween the carrying amounts and the tax bases of assets and liabilities.
(m) DerivativesDerivative financial instruments are stated at fair value. Deferred hedge accounting is applied to hedginginstruments which meet certain criteria.
(n) Net Income and Dividends per ShareBasic net income per share is computed based on the weighted average number of shares of commonstock outstanding during each year. The weighted average number of shares used in the computation was10,074 thousand and 10,396 thousand for the years ended February 28, 2003 and 2002, respectively.
As a result of calculation with appropriate adjustments, diluted net income per share was not applicablefor the year ended February 28, 2002.
Cash dividends per share represent interim dividends paid and annual dividends declared as applicableto the respective years.
(o) Appropriation of Retained EarningsUnder the Commercial Code and the Articles of Incorporation of the Company, a proposal by the Board ofDirectors for the appropriation of retained earnings, including the payment of annual cash dividends, shouldbe approved by the shareholders’ meeting which must be held within three months after the end of eachfiscal year. The appropriation of retained earnings is recorded in the accompanying consolidated financialstatements following the approval of the shareholders’ meeting. As is customary practice in Japan, the pay-ment of bonuses to directors and corporate auditors is made out of retained earnings instead of beingcharged to income for the year and constitutes a part of the appropriation referred to above.

22G U L L I V E R I N T E R N A T I O N A L A N N U A L R E P O R T 2 0 0 3
3. Short-Term Investments and Investments in Securities
Held-to-maturity securities and available-for-sale securities as of February 28, 2003 and 2002 were analyzedas follows:
Thousands of yen
2003 Carrying amount Market value Difference
Held-to-maturity securities:With available market value ¥ — ¥— ¥—
Without market value 52,910
Total ¥52,910
Thousands of yen
2003 Carrying amount Acquisition cost Difference
Available-for-sale securities:With available market value:
Securities whose carrying amount does not exceed their acquisition cost ¥080,658 ¥127,742 ¥47,083
Without market value 134,529
Total ¥215,187
Thousands of yen
2002 Carrying amount Market value Difference
Held-to-maturity securities:With available market value:
Securities whose market value does not exceed their carrying amount ¥199,980 ¥199,980 ¥—
Without market value 52,801
Total ¥252,781
Thousands of yen
2002 Carrying amount Acquisition cost Difference
Available-for-sale securities:With available market value:
Securities whose carrying amount does not exceed their acquisition cost ¥081,703 ¥120,942 ¥39,239
Without market value 148,371
Total ¥230,074
. . . . . . . . . . . . . . . . . . . . . . . . . . . . . . . .
23G U L L I V E R I N T E R N A T I O N A L A N N U A L R E P O R T 2 0 0 3
Thousands of U.S. dollars
2003 Carrying amount Market value Difference
Held-to-maturity securities:With available market value $ — $— $—
Without market value 449
Total $449
Thousands of U.S. dollars
2003 Carrying amount Acquisition cost Difference
Available-for-sale securities:With available market value:
Securities whose carrying amount does not exceed their acquisition cost $0,685 $1,085 $400
Without market value 1,143
Total $1,828
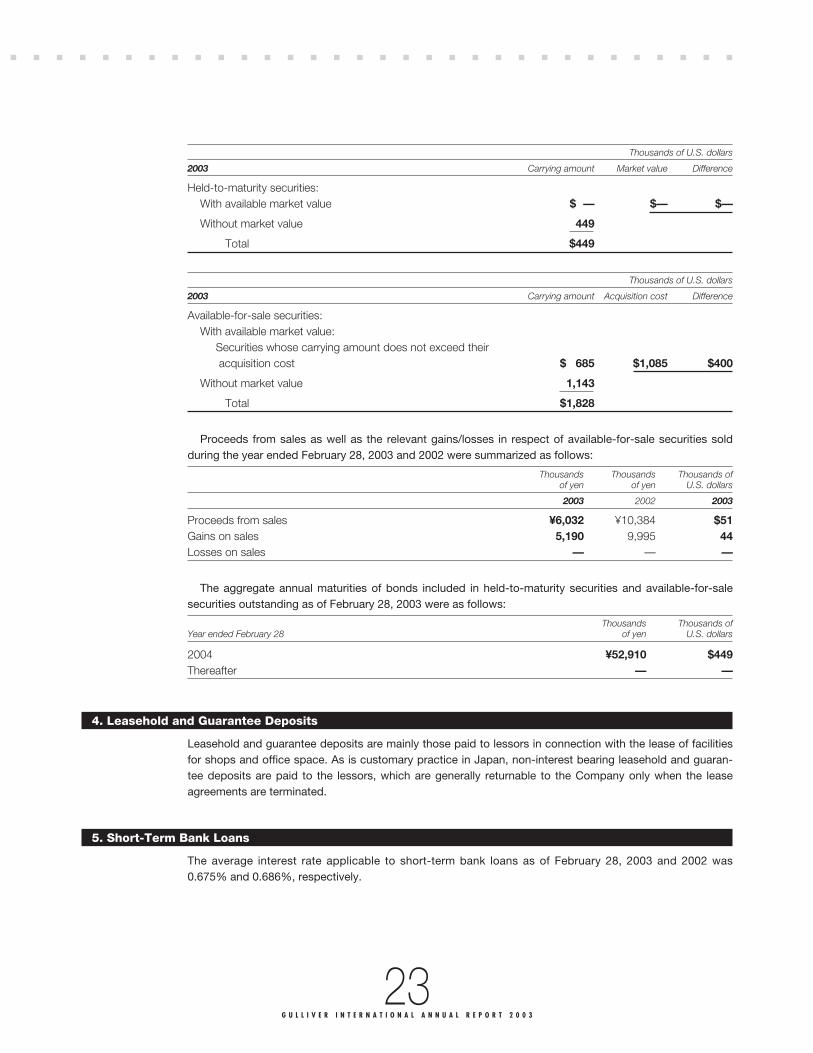
Proceeds from sales as well as the relevant gains/losses in respect of available-for-sale securities soldduring the year ended February 28, 2003 and 2002 were summarized as follows:
Thousands Thousands Thousands ofof yen of yen U.S. dollars
2003 2002 2003
Proceeds from sales ¥6,032 ¥10,384 $51Gains on sales 5,190 9,995 44Losses on sales — — —
The aggregate annual maturities of bonds included in held-to-maturity securities and available-for-salesecurities outstanding as of February 28, 2003 were as follows:
Thousands Thousands ofYear ended February 28 of yen U.S. dollars
2004 ¥52,910 $449Thereafter — —
4. Leasehold and Guarantee Deposits
Leasehold and guarantee deposits are mainly those paid to lessors in connection with the lease of facilitiesfor shops and office space. As is customary practice in Japan, non-interest bearing leasehold and guaran-tee deposits are paid to the lessors, which are generally returnable to the Company only when the leaseagreements are terminated.
5. Short-Term Bank Loans
The average interest rate applicable to short-term bank loans as of February 28, 2003 and 2002 was0.675% and 0.686%, respectively.
. . . . . . . . . . . . . . . . . . . . . . . . . . . . . . . .

24G U L L I V E R I N T E R N A T I O N A L A N N U A L R E P O R T 2 0 0 3
6. Guarantee Deposits Received
Guarantee deposits received were non-interest bearing guarantee deposits paid by franchisees for fran-chise agreements, which are returnable to franchisees upon termination of the franchise agreements.
7. Leases
Leased assets and related expenses in respect of the Company’s finance leases, other than those whichtransfer ownership of the leased assets to the lessee, are accounted for using a method similar to that foroperating leases. Finance lease charges for the years ended February 28, 2003 and 2002 were ¥288,579thousand ($2,450 thousand) and ¥267,285 thousand, respectively. Had the leased assets been capitalizedon the balance sheets, the following items would have been recognized on the consolidated balance sheetsand the consolidated statements of income at, and for the years ended, February 28, 2003 and 2002.
Thousands Thousands Thousands ofof yen of yen U.S. dollars
2003 2002 2003
Furniture, fixtures and equipment—at cost ¥1,176,720 ¥1,186,640 $9,993Software—at cost 75,397 64,767 640Other 5,980 6,704 51
Less—Accumulated depreciation (722,423) (607,997) (6,135)
¥0,535,676 ¥0,650,115 $4,549
Depreciation ¥0,269,244 ¥0,247,167 $2,286Interest expense 21,445 25,235 182
The depreciation above is computed based on the straight-line method over the lease term of the leasedassets, the residual value of which is deemed to be zero.
The present values of future finance lease payments at February 28, 2003 and 2002 were as follows:
Thousands Thousands Thousands ofof yen of yen U.S. dollars
2003 2002 2003
Within one year ¥262,213 ¥260,255 $2,226Over one year 299,921 414,628 2,547
¥562,134 ¥674,883 $4,773
8. Derivatives and Hedging Activities
The Company entered into interest rate swap agreements as hedging instruments. These agreements aredesigned to hedge the Company’s exposures to interest rate fluctuations upon its debt. The Company doesnot hold or issue any financial instruments for trading or speculative purposes. The Company’s manage-ment believes that there is no credit risk associated with the swaps since they are executed with domesticcreditworthy financial institutions. Deferred hedge accounting was applied to these derivatives.
. . . . . . . . . . . . . . . . . . . . . . . . . . . . . . . .
25G U L L I V E R I N T E R N A T I O N A L A N N U A L R E P O R T 2 0 0 3
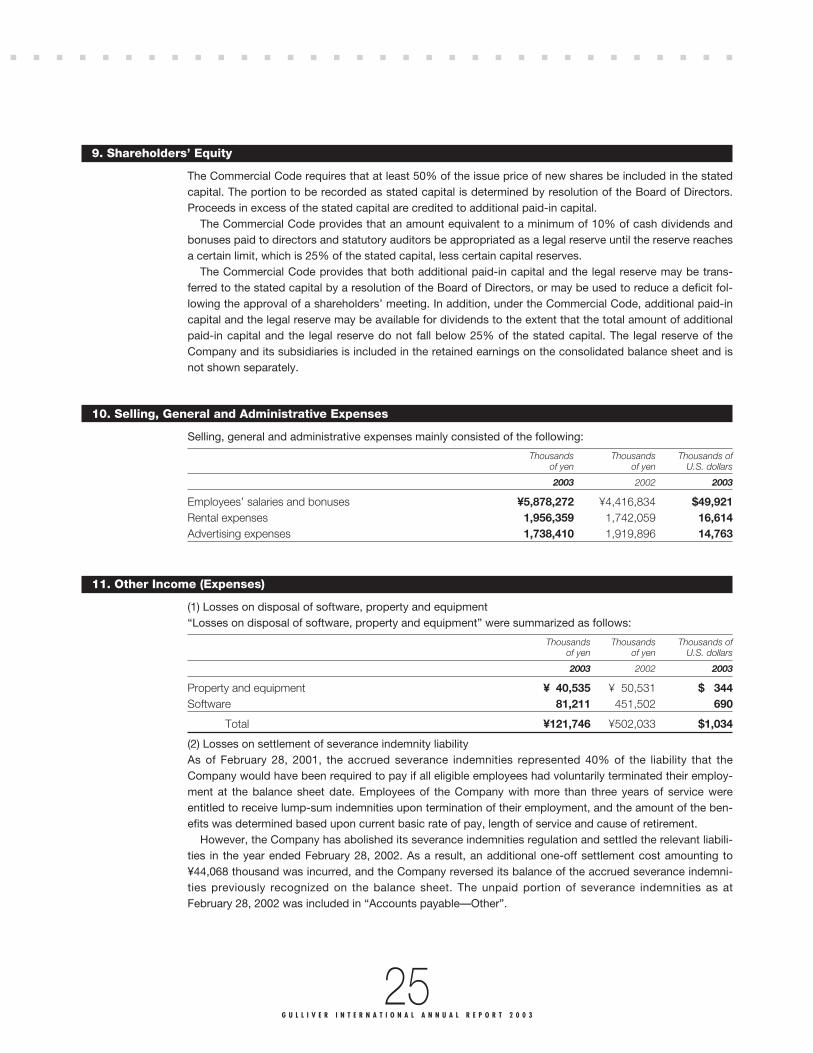
9. Shareholders’ Equity
The Commercial Code requires that at least 50% of the issue price of new shares be included in the statedcapital. The portion to be recorded as stated capital is determined by resolution of the Board of Directors.Proceeds in excess of the stated capital are credited to additional paid-in capital.
The Commercial Code provides that an amount equivalent to a minimum of 10% of cash dividends andbonuses paid to directors and statutory auditors be appropriated as a legal reserve until the reserve reachesa certain limit, which is 25% of the stated capital, less certain capital reserves.
The Commercial Code provides that both additional paid-in capital and the legal reserve may be trans-ferred to the stated capital by a resolution of the Board of Directors, or may be used to reduce a deficit fol-lowing the approval of a shareholders’ meeting. In addition, under the Commercial Code, additional paid-incapital and the legal reserve may be available for dividends to the extent that the total amount of additionalpaid-in capital and the legal reserve do not fall below 25% of the stated capital. The legal reserve of theCompany and its subsidiaries is included in the retained earnings on the consolidated balance sheet and isnot shown separately.
10. Selling, General and Administrative Expenses
Selling, general and administrative expenses mainly consisted of the following:
Thousands Thousands Thousands ofof yen of yen U.S. dollars
2003 2002 2003
Employees’ salaries and bonuses ¥5,878,272 ¥4,416,834 $49,921Rental expenses 1,956,359 1,742,059 16,614Advertising expenses 1,738,410 1,919,896 14,763
11. Other Income (Expenses)
(1) Losses on disposal of software, property and equipment“Losses on disposal of software, property and equipment” were summarized as follows:
Thousands Thousands Thousands ofof yen of yen U.S. dollars
2003 2002 2003
Property and equipment ¥040,535 ¥050,531 $0,344Software 81,211 451,502 690
Total ¥121,746 ¥502,033 $1,034
(2) Losses on settlement of severance indemnity liabilityAs of February 28, 2001, the accrued severance indemnities represented 40% of the liability that theCompany would have been required to pay if all eligible employees had voluntarily terminated their employ-ment at the balance sheet date. Employees of the Company with more than three years of service wereentitled to receive lump-sum indemnities upon termination of their employment, and the amount of the ben-efits was determined based upon current basic rate of pay, length of service and cause of retirement.
However, the Company has abolished its severance indemnities regulation and settled the relevant liabili-ties in the year ended February 28, 2002. As a result, an additional one-off settlement cost amounting to¥44,068 thousand was incurred, and the Company reversed its balance of the accrued severance indemni-ties previously recognized on the balance sheet. The unpaid portion of severance indemnities as atFebruary 28, 2002 was included in “Accounts payable—Other”.
. . . . . . . . . . . . . . . . . . . . . . . . . . . . . . . .

26G U L L I V E R I N T E R N A T I O N A L A N N U A L R E P O R T 2 0 0 3
12. Income Taxes
The Company is subject to several taxes based on income, which resulted in a statutory tax rate of approxi-mately 42.0% in the aggregate.
The effective tax rates for the years ended February 28, 2003 and 2002 differed from the statutory taxrates for the following reasons:
2003 2002
Statutory tax rate: 42.0% 42.0%Expenses not deductible for income tax purposes,entertainment expenses and other 1.4 1.5
Tax charged upon undistributed net income 1.0 2.7Local inhabitants’ taxes levied per capita 1.6 2.0Other (0.5) (0.2)
Effective tax rate 45.5% 48.0%
Major components of deferred income tax assets as of February 28, 2003 and 2002 are as follows:
Thousands Thousands Thousands ofof yen of yen U.S. dollars
2003 2002 2003
Deferred income tax assetsCurrent assets:
Enterprise tax payable ¥108,475 ¥109,287 $0,921Accrued bonuses 54,363 21,039 462Losses on valuation of inventories 9,211 22,772 78Automobile acquisition tax to be refunded — 87,257 —Other 44,752 26,912 380
Total ¥216,802 ¥267,267 $1,841
Investments and other assets:Allowance for doubtful accounts ¥112,220 ¥102,808 $0,953Losses on valuation of investment securities 46,452 44,963 395Software development expense — 28,173 —Other 18,762 38,136 159
Total ¥177,436 ¥214,080 $1,507
. . . . . . . . . . . . . . . . . . . . . . . . . . . . . . . .

27G U L L I V E R I N T E R N A T I O N A L A N N U A L R E P O R T 2 0 0 3
13. Segment Information
The Company has two business segments, covering its used-car sales and franchising businesses. The carsales business mainly involves the purchase and sale of used cars through the Company’s directly man-aged dealership organization. The franchising business includes earning royalty income on franchise con-tracts, providing staff education services and acting as an agent for used-car transactions.
Certain financial information relating to these two operating segments is summarized below.
Thousands of yen
Used-car Franchising Corporate/2003 sales business business (eliminations) Consolidated
Sales to external customers ¥88,478,636 ¥6,478,878 ¥ — ¥94,957,515Intersegment sales/transfers — — — —
Total 88,478,636 6,478,878 — 94,957,515Operating costs and expenses 82,533,678 4,129,337 3,049,586 89,712,601
Operating income 5,944,958 2,349,541 (3,049,586) 5,244,913Segment assets 9,749,407 1,905,027 8,403,109 20,057,544Depreciation and amortization 386,652 139,673 349,507 875,833
Expenditures to acquire long-lived assets 1,015,721 264,884 489,788 1,770,394
Thousands of yen
Used-car Franchising Corporate/2002 sales business business (eliminations) Consolidated
Sales to external customers ¥77,783,945 ¥7,097,026 ¥ — ¥84,880,972Intersegment sales/transfers — — — —
Total 77,783,945 7,097,026 — 84,880,972Operating costs and expenses 73,970,543 4,017,695 2,680,299 80,668,538
Operating income 3,813,401 3,079,330 (2,680,299) 4,212,432Segment assets 7,677,599 1,556,578 9,707,679 18,941,856Depreciation and amortization 307,106 127,069 303,166 737,341
Expenditures to acquire long-lived assets 838,299 305,063 193,682 1,337,045
Thousands of U.S. dollars
Used-car Franchising Corporate/2003 sales business business (eliminations) Consolidated
Sales to external customers $751,410 $55,022 $ — $806,433Intersegment sales/transfers — — — —
Total 751,410 55,022 — 806,433Operating costs and expenses 700,923 35,068 25,899 761,890
Operating income 50,487 19,954 (25,899) 44,543Segment assets 82,798 16,179 71,363 170,340Depreciation and amortization 3,284 1,186 2,968 7,438
Expenditures to acquire long-lived assets 8,626 2,249 4,160 15,035
. . . . . . . . . . . . . . . . . . . . . . . . . . . . . . . .

. . . . . . . . . . . . . . . . . . . . . . . . . . . . .
28G U L L I V E R I N T E R N A T I O N A L A N N U A L R E P O R T 2 0 0 3
The method of allocating corporate expenses and assets to each segment was changed in the year endedFebruary 28, 2002. This change was made to provide a more rational allocation of these items in line with theinternal control purposes. The effect of the change for the year ended February 28, 2002 was to increase“Operating income” for the “Used-car sales business” and “Franchising business” by ¥752 million and ¥624million, respectively, and to decrease “Operating income” for “Corporate/(eliminations)” by ¥1,376 million.This also decreased “Segment assets” for the “Used-car sales business” and the “Franchising business” by¥245 million and ¥330 million, respectively, and increased “Segment assets” for “Corporate/(eliminations)” by¥576 million.
Operating costs and expenses shown as “Corporate” are mainly administrative division expenses of theCompany’s headquarters. The major components of “Segment assets” shown as “Corporate” are theCompany’s surplus funds included in “Cash and cash equivalents” and short-term investments, and assetsof the administrative division.
There are no major geographic areas other than Japan in which sales and assets are material. The ratio offoreign customer sales to consolidated sales is also immaterial, meaning less than 10%.
14. Related Party Transactions
The Company’s transactions with its directors for the years ended February 28, 2003 and 2002 were as follows:
Thousands Thousands Thousands ofof yen of yen U.S. dollars
2003 2002 2003
Sales of vehicles ¥11,049 ¥05,658 $93Rental expense for company houses 11,510 11,510 97
The terms and conditions of these transactions were determined in accordance with the Company’sinternal rules.
The Company sold vehicles and supplies to Tokyo My Car Co., Ltd., which is wholly owned by YusukeHatori, a director of the Company. The Company’s directors own the majority of the voting rights of itsBoard of Directors. Sales for the years ended February 28, 2003 and 2002 were ¥11,139 thousand ($357thousand) and ¥47,904 thousand, respectively. The terms and conditions of these sales transactions werethe same as those available to other customers in the ordinary course of business.
Kenichi Hatori, a director, guaranteed the Company’s obligations in connection with used-car auctionsand the Company’s leased assets for the years ended February 28, 2003 and 2002. Such guarantees areprovided by the directors to the Company without any compensation being paid.
15. Subsequent Events
The following appropriation of the Company’s retained earnings in respect of the year ended February 28,2003 was approved by the shareholders at the annual general meeting held on May 21, 2003.
Thousands Thousands ofof yen U.S. dollars
Cash dividends (¥55 per share) ¥548,986 $4,662Bonuses to directors and corporate auditors 73,150 621
Total ¥622,136 $5,283
29G U L L I V E R I N T E R N A T I O N A L A N N U A L R E P O R T 2 0 0 3
. . . . . . . . . . . . .
The Board of Directors
Gulliver International Co., Ltd.
We have audited the accompanying consolidated balance sheets of Gulliver International Co., Ltd. and its consolidated sub-
sidiaries as of February 28, 2003 and 2002, and the related consolidated statements of income, shareholders’ equity, and cash
flows for the years then ended, all expressed in Japanese yen. Our audits were carried out in accordance with auditing stan-
dards, procedures and practices generally accepted and applied in Japan and, accordingly, included such tests of the account-
ing records and such other auditing procedures as we considered necessary in the circumstances.
In our opinion, the consolidated financial statements referred to above present fairly the consolidated financial position of
Gulliver International Co., Ltd. and its consolidated subsidiaries as of February 28, 2003 and 2002, and the consolidated results
of their operations and their cash flows for the years then ended in conformity with accounting principles and practices general-
ly accepted in Japan (see Note 2) applied on a consistent basis.
As described in Note 2, Gulliver International Co., Ltd. and its consolidated subsidiaries have adopted new Japanese
Accounting Standards for Financial Instruments and Foreign Currency Translation effective for the year ended February 28,
2002.
The amounts expressed in U.S. dollars, provided solely for the convenience of the reader, have been translated on the basis set
forth in Note 2 to the accompanying consolidated financial statements.
Yusei Audit Corporation
Tokyo, Japan
May 21, 2003
REPORT OF INDEPENDENT ACCOUNTANTS

. . . . . . . . . . . .
30G U L L I V E R I N T E R N A T I O N A L A N N U A L R E P O R T 2 0 0 3
NON-CONSOLIDATED BALANCE SHEETS (UNAUDITED)As of February 28, 2003 and 2002(Supplemental Information)Gulliver International Co., Ltd.
Thousands ofThousands Thousands U.S. dollars
of yen of yen (Note 1)
ASSETS 2003 2002 2003
Current assets:Cash and cash equivalents ¥05,655,527 ¥06,106,083 $048,030Time deposits — 552,521 —Short-term investments 78,188 226,163 664Accounts receivable:
Trade 3,083,870 2,602,139 26,190Allowance for doubtful accounts (37,523) (50,188) (319)
3,046,347 2,551,951 25,871Inventories 1,415,060 1,331,301 12,017Deferred income tax assets 207,346 261,658 1,761Other current assets 864,126 578,107 7,339
Total current assets 11,266,599 11,607,789 95,682
Property and equipment:Land 323,011 323,011 2,743Buildings and structures 3,527,873 2,851,991 29,961Furniture, fixtures and equipment 1,476,031 1,206,170 12,535Construction in progress 31,642 36,729 269
5,358,557 4,417,901 45,508Less—Accumulated depreciation (1,674,478) (1,261,529) (14,221)
Net property and equipment 3,684,080 3,156,374 31,287
Investments and other assets:Investment securities 532,538 589,570 4,523Leasehold and guarantee deposits 1,640,375 1,432,255 13,931Deferred income tax assets 176,569 214,815 1,500Software costs, net 1,216,905 948,653 10,335Other assets 680,341 638,103 5,778Allowance for doubtful accounts (266,189) (248,282) (2,261)
Total investments and other assets 3,980,545 3,375,114 33,806
¥18,931,226 ¥18,339,282 $160,775
Notes: 1. Translation into U.S. dollars has been made on the basis of ¥117.75=$1, the effective exchange rate at February 28, 2003.
2. Retained earnings included legal reserve, which was ¥39,556 thousand ($335 thousand) and ¥39,556 thousand as of February 28, 2003 and 2002, respectively.
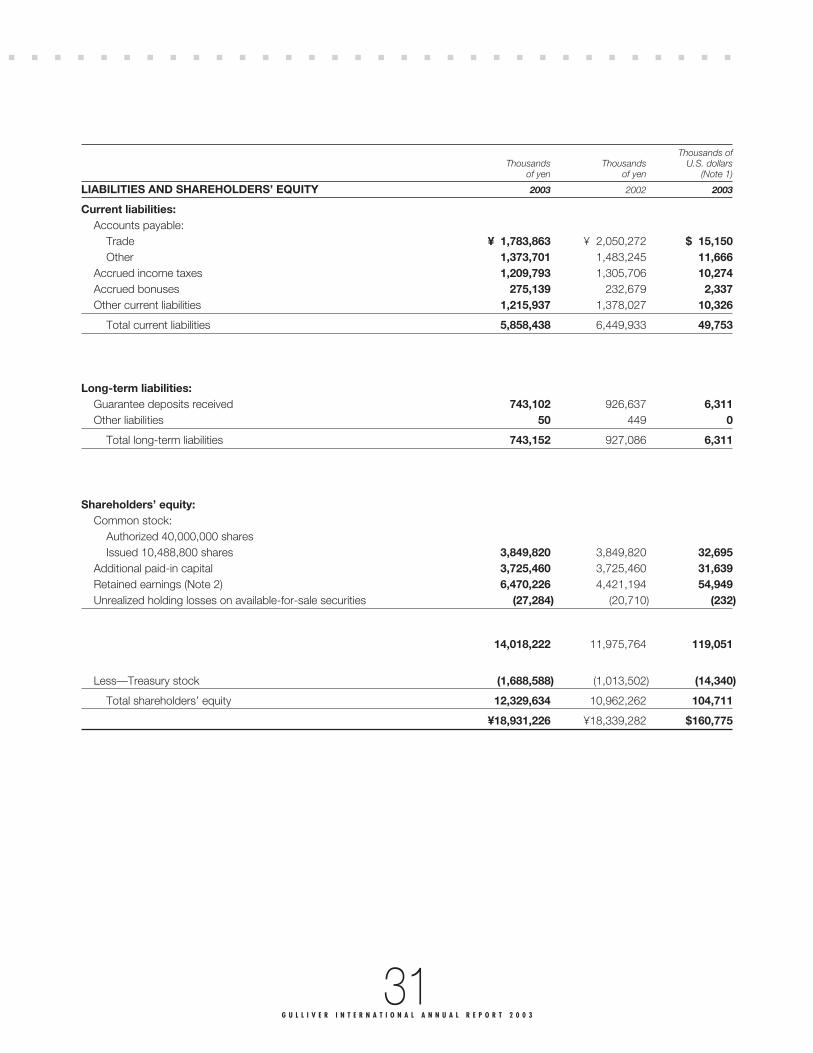
. . . . . . . . . . . . . . . . . . . . . . . . . . . . . . . .
31G U L L I V E R I N T E R N A T I O N A L A N N U A L R E P O R T 2 0 0 3
Thousands ofThousands Thousands U.S. dollars
of yen of yen (Note 1)
LIABILITIES AND SHAREHOLDERS’ EQUITY 2003 2002 2003
Current liabilities:Accounts payable:
Trade ¥01,783,863 ¥02,050,272 $015,150Other 1,373,701 1,483,245 11,666
Accrued income taxes 1,209,793 1,305,706 10,274Accrued bonuses 275,139 232,679 2,337Other current liabilities 1,215,937 1,378,027 10,326
Total current liabilities 5,858,438 6,449,933 49,753
Long-term liabilities:Guarantee deposits received 743,102 926,637 6,311Other liabilities 50 449 0
Total long-term liabilities 743,152 927,086 6,311
Shareholders’ equity:Common stock:
Authorized 40,000,000 sharesIssued 10,488,800 shares 3,849,820 3,849,820 32,695
Additional paid-in capital 3,725,460 3,725,460 31,639Retained earnings (Note 2) 6,470,226 4,421,194 54,949Unrealized holding losses on available-for-sale securities (27,284) (20,710) (232)
14,018,222 11,975,764 119,051
Less—Treasury stock (1,688,588) (1,013,502) (14,340)
Total shareholders’ equity 12,329,634 10,962,262 104,711
¥18,931,226 ¥18,339,282 $160,775
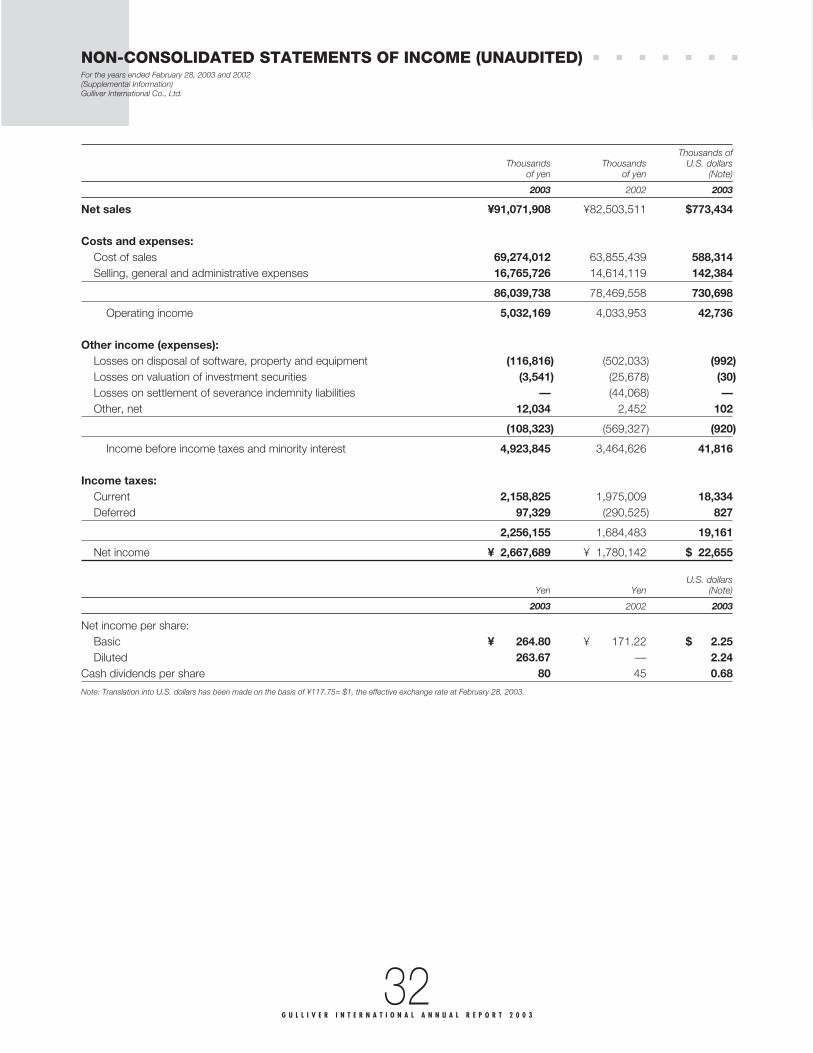
. . . . . . .
32G U L L I V E R I N T E R N A T I O N A L A N N U A L R E P O R T 2 0 0 3
NON-CONSOLIDATED STATEMENTS OF INCOME (UNAUDITED)For the years ended February 28, 2003 and 2002(Supplemental Information)Gulliver International Co., Ltd.
Thousands ofThousands Thousands U.S. dollars
of yen of yen (Note)
2003 2002 2003
Net sales ¥91,071,908 ¥82,503,511 $773,434
Costs and expenses:Cost of sales 69,274,012 63,855,439 588,314Selling, general and administrative expenses 16,765,726 14,614,119 142,384
86,039,738 78,469,558 730,698
Operating income 5,032,169 4,033,953 42,736
Other income (expenses):Losses on disposal of software, property and equipment (116,816) (502,033) (992)Losses on valuation of investment securities (3,541) (25,678) (30)Losses on settlement of severance indemnity liabilities — (44,068) —Other, net 12,034 2,452 102
(108,323) (569,327) (920)
Income before income taxes and minority interest 4,923,845 3,464,626 41,816
Income taxes:Current 2,158,825 1,975,009 18,334Deferred 97,329 (290,525) 827
2,256,155 1,684,483 19,161
Net income ¥02,667,689 ¥01,780,142 $022,655
U.S. dollarsYen Yen (Note)
2003 2002 2003
Net income per share:Basic ¥00,0264.80 ¥000,171.22 $0002.25Diluted 263.67 — 2.24
Cash dividends per share 80 45 0.68
Note: Translation into U.S. dollars has been made on the basis of ¥117.75= $1, the effective exchange rate at February 28, 2003.

33G U L L I V E R I N T E R N A T I O N A L A N N U A L R E P O R T 2 0 0 3
.NON-CONSOLIDATED STATEMENTS OF SHAREHOLDERS’ EQUITY (UNAUDITED)For the years ended February 28, 2003 and 2002(Supplemental Information)Gulliver International Co., Ltd.
Thousands of yen
Unrealizedholding gains/
Number of Additional (losses) onshares of Common paid-in Retained available-for- Treasury
common stock stock capital earnings sale securities stock
Balance at February 28, 2001 10,488,800 ¥3,849,820 ¥3,725,460 ¥3,005,499 ¥ — ¥ (45)Net income 1,780,142Unrealized holding gains on available-for-sale securities (20,710)
Cash dividends paid (340,397)Bonuses to directors and corporate auditors (24,050)
Increase in treasury stock (1,013,457)
Balance at February 28, 2002 10,488,800 3,849,820 3,725,460 4,421,194 (20,710) (1,013,502)Net income 2,667,689Unrealized holding gains on available-for-sale securities (6,574)
Cash dividends paid (555,957)Bonuses to directors and corporate auditors (62,700)
Increase in treasury stock (675,086)
Balance at February 28, 2003 10,488,800 ¥3,849,820 ¥3,725,460 ¥6,470,226 ¥(27,284) ¥(1,688,588)
Thousands of U.S. dollars (Note)
Unrealizedholding gains/
Additional (losses) onCommon paid-in Retained available-for- Treasury
stock capital earnings sale securities stock
Balance at February 28, 2002 $32,695 $31,639 $37,547 $(176) $ (8,607)Net income 22,655Unrealized holding gains on available-for-sale securities (56)
Cash dividends paid (4,722)Bonuses to directors and corporate auditors (532)Increase in treasury stock (5,733)
Balance at August 31, 2003 $32,695 $31,639 $54,949 $(232) $(14,340)
Note: Translation into U.S. dollars has been made on the basis of ¥117.75= $1, the effective exchange rate at February 28, 2003.
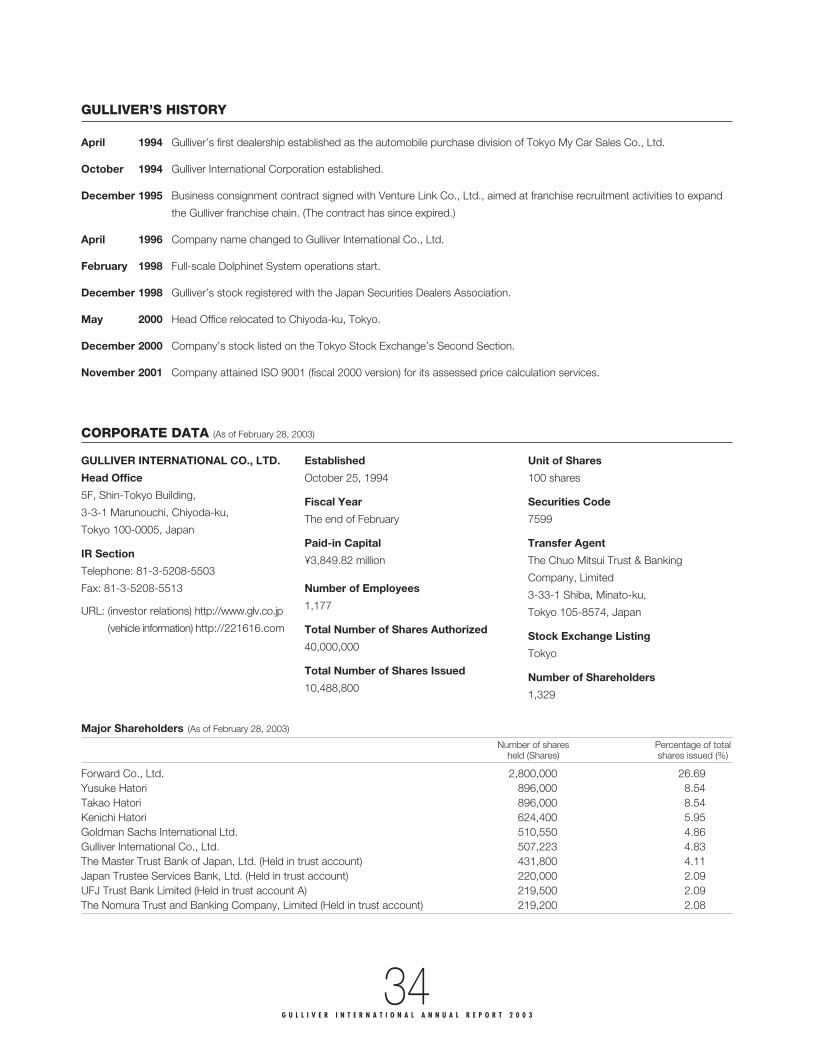
34G U L L I V E R I N T E R N A T I O N A L A N N U A L R E P O R T 2 0 0 3
GULLIVER’S HISTORY
April 1994 Gulliver’s first dealership established as the automobile purchase division of Tokyo My Car Sales Co., Ltd.
October 1994 Gulliver International Corporation established.
December 1995 Business consignment contract signed with Venture Link Co., Ltd., aimed at franchise recruitment activities to expand
the Gulliver franchise chain. (The contract has since expired.)
April 1996 Company name changed to Gulliver International Co., Ltd.
February 1998 Full-scale Dolphinet System operations start.
December 1998 Gulliver’s stock registered with the Japan Securities Dealers Association.
May 2000 Head Office relocated to Chiyoda-ku, Tokyo.
December 2000 Company’s stock listed on the Tokyo Stock Exchange’s Second Section.
November 2001 Company attained ISO 9001 (fiscal 2000 version) for its assessed price calculation services.
CORPORATE DATA (As of February 28, 2003)
GULLIVER INTERNATIONAL CO., LTD.
Head Office
5F, Shin-Tokyo Building,
3-3-1 Marunouchi, Chiyoda-ku,
Tokyo 100-0005, Japan
IR Section
Telephone: 81-3-5208-5503
Fax: 81-3-5208-5513
URL: (investor relations) http://www.glv.co.jp
(vehicle information) http://221616.com
Established
October 25, 1994
Fiscal Year
The end of February
Paid-in Capital
¥3,849.82 million
Number of Employees
1,177
Total Number of Shares Authorized
40,000,000
Total Number of Shares Issued
10,488,800
Unit of Shares
100 shares
Securities Code
7599
Transfer Agent
The Chuo Mitsui Trust & Banking
Company, Limited
3-33-1 Shiba, Minato-ku,
Tokyo 105-8574, Japan
Stock Exchange Listing
Tokyo
Number of Shareholders
1,329
Major Shareholders (As of February 28, 2003)
Number of shares Percentage of totalheld (Shares) shares issued (%)
Forward Co., Ltd. 2,800,000 26.69Yusuke Hatori 896,000 8.54Takao Hatori 896,000 8.54Kenichi Hatori 624,400 5.95Goldman Sachs International Ltd. 510,550 4.86Gulliver International Co., Ltd. 507,223 4.83The Master Trust Bank of Japan, Ltd. (Held in trust account) 431,800 4.11Japan Trustee Services Bank, Ltd. (Held in trust account) 220,000 2.09UFJ Trust Bank Limited (Held in trust account A) 219,500 2.09The Nomura Trust and Banking Company, Limited (Held in trust account) 219,200 2.08

GULLIVER INTERNATIONAL CO., LTD.5F, Shin-Tokyo Building, 3-3-1 Marunouchi, Chiyoda-ku, Tokyo 100-0005, JapanTelephone: 81-3-5208-5503Fax: 81-3-5208-5513URL: http://www.glv.co.jp
http://221616.com
Printed on recycled paper in Japan