Embed Size (px)
Citation preview

Bank of Japan’s Monetary Easing Measures: Are They Powerful and Comprehensive?
W. Raphael Lam
WP/11/264

© 2011 International Monetary Fund WP/11/264
IMF Working Paper
Asia and Pacific Department
Bank of Japan’s Monetary Easing Measures: Are They Powerful and Comprehensive?
Prepared by W. Raphael Lam 1
Authorized for distribution by Kenneth Kang
November 2011
Abstract
With policy rates near the zero bound, the Bank of Japan (BoJ) has introduced a series of unconventional monetary easing measures since late 2009 in response to lingering deflation and a weakening economy. These measures culminated in a new Asset Purchase Program under the Comprehensive Monetary Easing (CME) which differs from typical quantitative easing in other central banks by including purchases of risky asset in an effort to reduce term and risk premia. This note assesses the impact of monetary easing measures on financial markets using an event study approach. It finds that the BoJ’s monetary easing measures has had a statistically significant impact on lowering bond yields and improving equity prices, but no notable impact on inflation expectations.
JEL Classification Numbers: E4, E5
Keywords: Monetary and Credit Easing, Quantitative Easing, Large-scale Asset Purchases
Author’s E-Mail Address: [email protected]
1 The author benefited from the discussions with Professor K. Ueda, IMF Japan team and the seminar participants in the IMF Asia Pacific Department Seminar and IMF Surveillance Meeting, and comments by the Bank of Japan. Ms. J. Lee and Ms. I. Hussiada provided research assistance.
This Working Paper should not be reported as representing the views of the IMF. The views expressed in this Working Paper are those of the author(s) and do not necessarily represent those of the IMF or IMF policy. Working Papers describe research in progress by the author(s) and are published to elicit comments and to further debate.

2
Contents Page
I. Introduction ............................................................................................................................3
II. Quantitative Assessment .......................................................................................................5 A. Event Study Methodology ........................................................................................6 B. Impact on Financial Markets .....................................................................................7
III. Potential Impact of Further Asset Purchases .....................................................................14
IV. Conclusion .........................................................................................................................17
References ................................................................................................................................18
Tables
1. Recent Conduct of Monetary Policy Measures by the Bank of Japan ...........................4 2. Event Classification of Bank of Japan Monetary Easing Measures ..............................7 3a. Impact of the Bank of Japan’s Monetary Easing Measures on Financial Markets
(Two-Trading Day Window) .......................................................................................10 3b. Impact of the Bank of Japan’s Monetary Easing Measures on Financial Markets
(Weekly Window) ........................................................................................................11 4. Impact from Fed’s Quantitative Easing Measures .......................................................13 5. Expected Impact on Assets from Portfolio Rebalance Model .....................................16 6. Asset Purchase Program and Relative Market Share ...................................................17
Figures
1. Current Status of Asset Purchase Program under the CME ..........................................5 2. Cross-sectional Cumulative Impact of BoJ’s Monetary Easing Measures ..................12 3. Risk Appetite Improved following Monetary Easing Measures ..................................14

3
I. INTRODUCTION
The Bank of Japan (BoJ) has expanded its toolkit through a series of monetary easing measures since early-2009. The measures included a fixed-rate funds-supplying operation, increased purchases of government securities, and a clearer policy commitment to the zero interest rate policy (Table 1). The overall objective of various measures is to achieve sustainable growth and price stability. High public debt and large fiscal deficits limit the fiscal space to provide support in narrowing the wide output gap, whereas close-to-zero interest rate limits the scope of further reduction of policy rate. Unconventional monetary easing that includes large-scale asset purchases appears to be a policy instrument to support the recovery.
A key innovation in the series of monetary easing by the BOJ was the introduction of a new asset purchase program under its Comprehensive Monetary Easing (CME) policy in last October. The purchases in this program comprise private sector financial assets—corporate bonds, commercial paper, exchange-traded funds (ETFs) and real estate investment trusts (REITs)—in addition to government securities, which differ from typical quantitative easing of other central banks. The objectives are to encourage a decline in long-term interest rates and reduce the risk premium.1
The easing measures could potentially stimulate growth and overcome deflation through various channels. The asset purchase program could lower long-term interest rates through portfolio rebalancing effect, and catalyzing investors’ risk appetite. The new funding operations and lending facility intend to reduce short-term interest rates, by providing financial institutions with ample funds at extremely low interest rate and revive lending activities to target sectors to support the foundations of economic growth. Combined with conventional monetary steps, these measures are broad in scope and potentially powerful, helping to support lending and private demand.
Against this background, this paper assesses whether the BoJ’s easing measures, particularly the asset purchase program, are powerful and comprehensive in affecting financial markets. Using an event study similar to Gagnon et al (2010) and Neely (2010) to assess the impact on a broad range of financial indicators, this paper analyzes (i) how financial markets responded following the announcement of the BoJ’s easing measures; (ii) whether the impact came mostly from the announcement of the program or the subsequent asset purchases; and (iii) which asset purchases, private risky assets or government securities, are more effective in reducing risk premia.
1 The Bank of Japan introduced a new lending facility through the financial institutions at low cost to support the foundation of economic growth.

4
Table 1. Recent Conduct of Monetary Policy Measures by the Bank of Japan
The results suggest that the BoJ’s easing measures have had a significant and broad-based impact on financial markets. The estimated impact stems mainly from the announcement of the new measures rather than from subsequent operations or purchases, suggesting investors could have already priced-in the expected impact of subsequent operations or purchases. The easing measures have eased financial conditions by lowering long-term interest rates and reducing downside tail risks. The financial impact has also been broad-based and comprehensive, extending beyond the assets purchased by the BoJ.
The paper is organized as follows. Section II illustrates the quantitative impact of the monetary easing measures using an event study. Based on these results, Section III illustrates the potential impact from hypothetical additional purchases beyond the current target. These results suggest that asset purchases, particularly of private risky assets, could be an effective tool for further monetary easing.
Measures 1/ Description DateCurrent target
scale (in ¥ trillion)
Actual bal. as of end-August 2011
2/
Outright purchases of government bonds
- expand measures to ensure financial stability Dec-08¥21.6 trillion per
year¥62.1 trillion
Subsequent size expansion on JGB purchases Mar-09
Fixed-rate funds-supplying operation against pooled collateral 3/
- provide ample funding at very low interest rate to banks to ease financing conditions, thereby encouraging the decline of long-term rates.
Dec-09 ¥35 trillion ¥31.2 trillion
Subsequent size expansion and maturity extensionMar 2010 and
Aug 2010
Providing support to strengthen the foundations for economic growth
- provide long-term funds at low interest rate to eligible financial institutions to finance actual investment projects in selected industries that support the foundations of economic growth.
Apr-10Not exceeding
¥3 trillion¥2.9 trillion
Subsequent announcement of operational framework, principal terms and conditions, and disbursements.
Four times in 2010, and
twice in 2011
"Comprehensive Monetary Easing (CME)"
Oct-10
Virtually zero-interest rate policy- guide expectations on the duration of accommodative stance of monetary policy
Asset Purchase Program 3/-encourage the decline of long-term interest rate and catalyse investors' risk appetite to reduce risk premium.
-preempt a deterioration in business sentiment and rise in risk aversion.
Mar-11
- ensure a successful transition from the recovery phase following the March disaster to a sustainable growth path with price stability.
Aug-11 ¥50 trillion ¥38.6 trillion
Source: Bank of Japan.1/ Additional measures following the earthquake in March 2011 were introduced, including funds-supplying operation to support financial institutions in disaster area (March) and the new lending facility to support asset-based lending (June). 2/ Outstanding balance of government securities include previous purchases before easing measures introduced.3/ The size of asset purchase program was expanded by 5 trillion yen to 40 trillion yen on 14 March, of which 30 trillion yenis related to the fixed-rate funds supplying operations. The target size was further expanded in August 2011 to 50 trillion yen, of which 40 trillion yen on the fixed-rate funds supplying operations.

5
Bank of Japan Asset Purchase Program (In billions of yen)Total JGBs T-bills Corp. bond CP ETFs REITs
Total purchases 8913.1 1450.0 2400.0 800.0 3900.0 340.4 22.7Total outstanding balance (end-July 2011) 6551.1 1305.1 2504.3 1580.3 798.1 340.6 22.7New target 15000 4000 4500 2100 2900 1390 110
1/ Target as of August, 2011 after expanding the scale twice since its inception.
II. QUANTITATIVE ASSESSMENT
Facing an appreciating yen and a slowing recovery, the BoJ introduced an asset purchase program under its Comprehensive Monetary Easing (CME) policy in last October. The purchases in this program comprise private sector financial assets—corporate bonds, commercial paper, exchange-traded funds (ETFs) and real estate investment trusts (REITs)—in addition to government securities, which differ from typical quantitative easing of other central banks. Along with the commitment to the virtually zero interest rate policy (V-ZIRP), the BOJ aims to encourage a decline in long-term interest rates and reduce the risk premium.
To preempt the deterioration of consumer and business sentiments, the BoJ expanded its asset purchase program to stabilize financial markets after the March earthquake. It doubled the size of asset purchases to ¥10 trillion with plans to complete the purchases by end-2012. The move was to preempt any deterioration in investors’ appetites.
The BOJ further eased monetary conditions as concerns on European and U.S. sovereign debts have put the global recovery at risk. During the summer of 2011, the yen has strengthened against the U.S. dollar and euro due to ‘safe-haven’ flows, while the global recovery has significantly slowed. Against this backdrop, the asset purchase program was increased by ¥10 trillion to a total of ¥50 trillion to ease monetary conditions. The BoJ has reached about half of the target level as of end-August, with plans to complete the purchases by end-2012 (Figure 1).
Figure 1. Current Status of Asset Purchase Program under the CME
Source: Bank of Japan, as of end-July 2011. Solid and dash lines represent target asset levels.
0
500
1000
1500
2000
2500
3000
Oct
-10
Dec
-10
Feb
-11
Apr
-11
Jun-
11
JGBs
T-bills
in billion yen
0
500
1000
1500
2000
2500
3000
3500
4000
Nov
-10
Jan-
11
Mar
-11
May
-11
Jul-1
1
Corporate bonds
CP
in billion yen
0
200
400
600
800
1000
Nov
-10
Jan-
11
Mar
-11
May
-11
Jul-1
1
ETFsREITsTarget amount for ETFsTarget amount for J-REITs
in billion yen

6
A. Event Study Methodology
Event studies provide a useful approach for assessing the impact of policy measures on financial markets. The financial markets typically react rapidly to ‘news’ of an event that shapes investor expectations, such as Gagnon et al. (2010), Joyce et al (2010), and Neely (2010), which assess the impact of the U.S. Fed’s quantitative easing. This approach, however, is not able to distinguish between the confluence of other factors, especially those that are beyond the central bank’s control, such as external shocks. Market anticipation before the event may also obscure the true impact, while some indirect effect may take time to develop beyond the event window.2
In this event study, the impact of monetary easing is measured as the change in asset returns and volatility. Financial indicators include equity prices, sovereign and corporate bond yields, exchange rates, inflation expectations, and the term premium. To assess the significance of events, we compare the percentage change of financial indicators around the event window against that in a typical trading day. This paper uses two types of event windows: (i) two trading days, defined to be t+1 vs t-1 where t refers to the event day; and (ii) five trading days (a week)—allowing an assessment whether the initial two-day effect persists or wanes after a week. Daily data are obtained from Bloomberg on various financial indicators based on their closing prices or yields. The events are linked to the BoJ’s monetary easing measures, which include recent measures such as the introduction of the asset purchase program last October but exclude those earlier measures during the onset of the global financial crisis that aimed at ensuring financial stability (Table 2). Overall, there are five events related to announcements of new programs and over 30 events of subsequent expansion or purchases or exits of earlier programs.
The Bank of Japan typically introduces a new measure in stages, providing a basis for classifying the events. The events are classified into announcement of new policy, modification (expansion or extension) of current policies, actual purchases or operations, and exits of policies. New measures are generally announced in the monetary policy statement, followed by an operational framework and guidelines on the principal terms and conditions about a month later. Under the asset purchase program, BOJ usually conducts multiple auctions with fixed schedules for government securities, CPs, and corporate bonds. Purchases of ETFs and J-REITs are under flexible dates. Exits of previous outright purchases are usually preannounced and contingent on macro-conditions. In that regard, the event study is enriched by narrowing down more precisely on the effects of announcement, expansion or exit, and actual purchases.
2 For instance, the Fed’s second phase of quantitative easing in November 2010 was largely anticipated by the market after Governor Bernanke’s speech at the Jackson Hole meeting in end-August.

7
DateExtraordinary Measures and Powerful Monetary Easing
Introduction of New Measures and Facilities Program Expansion / Extension
Measure / Program Exits
19-Dec-08Expansion of measures to facilitate corporate fianncing and financial stability
Outright purchases of JGBs
22-Jan-09 Outright purchases of CP Program expansion on purchases of JGB
19-Feb-09Extension of outright purcahse of CP, corporate bonds and JGB
18-Mar-09Extension of outright purcahse of CP, corporate bonds and JGB
15-Jul-09Extension of outright purcahse of CP, corporate bonds and JGB
30-Oct-09Exit of outright purchases of CP
01-Dec-09Enhancement of easy monetary conditions
Fixed-rate funds supplying operation against pooled collateral (fixed rate operation)
31-Dec-09Exit of outright purchase of corporate bonds
17-Mar-10Measures expanded to encourage decline of long-term rate
Fixed-rate funds supplying operation against pooled collateral (fixed rate operation)
31-Mar-10
30-Apr-10Fund provisioning measure to support growth
30-Aug-10 Enhancement of easy monetary conditions
Fixed-rate funds supplying operation against pooled collateral (fixed rate operation)
05-Oct-10 Comprehensive monetary easingOutright purchases of CPs, corporate bonds, ETFs, J-REITs
Fixed-rate funds supplying operation against pooled collateral (fixed rate operation)
28-Oct-1005-Nov-10
14-Mar-11 Enhancement of monetary easingExpand the size of asset purchase program
28-Apr-11Funds-Supplying Operation to Support Financial Institutions in Disaster Areas
14-Jun-11Establish a new credit line for equity investments and asset-based lending.
04-Aug-11 Enhancement of monetary easingExpand the size of asset purchase program
Source: Bank of Japan1/ The two events on new operations in disaster areas and credit line for equity investment and asset-based lending are excludedfrom the analysis.
Release of principal terms and conditions on asset purchase
Table 2. Event Classification of the Bank of Japan Monetary Easing Measures
B. Impact on Financial Markets
The impact on financial markets is measured as the change of returns on sovereign yields or asset prices during the event windows. To assess whether monetary easing measures have a positive impact, we measure the cumulative change of returns over the events against the standard errors relative to returns of typical trading days (daily frequency excluding the event dates) from January 2005 to mid-2011.3 Specifically,
3 Varying the sample period does not substantially change the standard errors in terms of statistical significance. The main results on the statistical significance of the impact of monetary easing would not change.

8
-30
-25
-20
-15
-10
-5
0
5
10
1-year JGB
2-year JGB
10-year JGB
Corp. yields
Exp. Inflation
Cumulative impact from announcementImpact from actual purchases under asset purchase program
in basis points
Announcement and Purchases Impact on financial markets
-6-4-202468
10121416
Yen/USD Nikkei Index
JREITs
in percent
-30-25-20-15-10-505
101520
1-ye
ar J
GB
2-ye
ar J
GB
10-y
ear
JGB
Int.
rat
e fu
ture
s 2/
Ter
m p
rem
ium
2/
Cor
p. y
ield
s (B
BB
)
Exp
. Inf
latio
n 3/
Spo
t JP
Y/U
SD
3/
Nik
kei 3
/
J-R
EIT
s 3/
Two-day window
One-week window
Impact of Monetary Easing to Financial Markets (in basis points, unless otherwise stated 1/)
Sources: Bloomberg and staff estimates.1/ Events defined as the announcement dates of powerful monetary easing by BoJ. Symbol ※ denotes statistical significant at 5 percent level.2/ Refers to 3-month interest rate futures and term premium defined as 10-year net of 2-year sovereign yields.3/ in percent.
※※ ※※※ ※※ ※※ ※※ ※※
∑ R RI
√I · σ~Z . , . .
Where i denotes a particular event and I denotes the total number of events in the set (e.g., five events of new monetary easing measures). Another set of events is the actual purchases by the BOJ under its asset purchase program, which accounts for more than 50 events since its introduction. R refers to the change of returns on particular event of an asset (e.g., 10-year sovereign bond) when the event occurs at time t, and the returns of various asset classes are calculated similarly. In the case of weekly window, the expression will be t+4 versus t-1. The standard error is calculated based on daily volatility of typical trading days from January 2005 to June 2011. The cumulative change of returns is compared to the Z-statistics for statistical significance at 5 percent level.4
Overall, the BoJ’s monetary easing measures have had a positive impact on financial markets. The impact is broad-based and extends beyond the assets that the BoJ purchases.
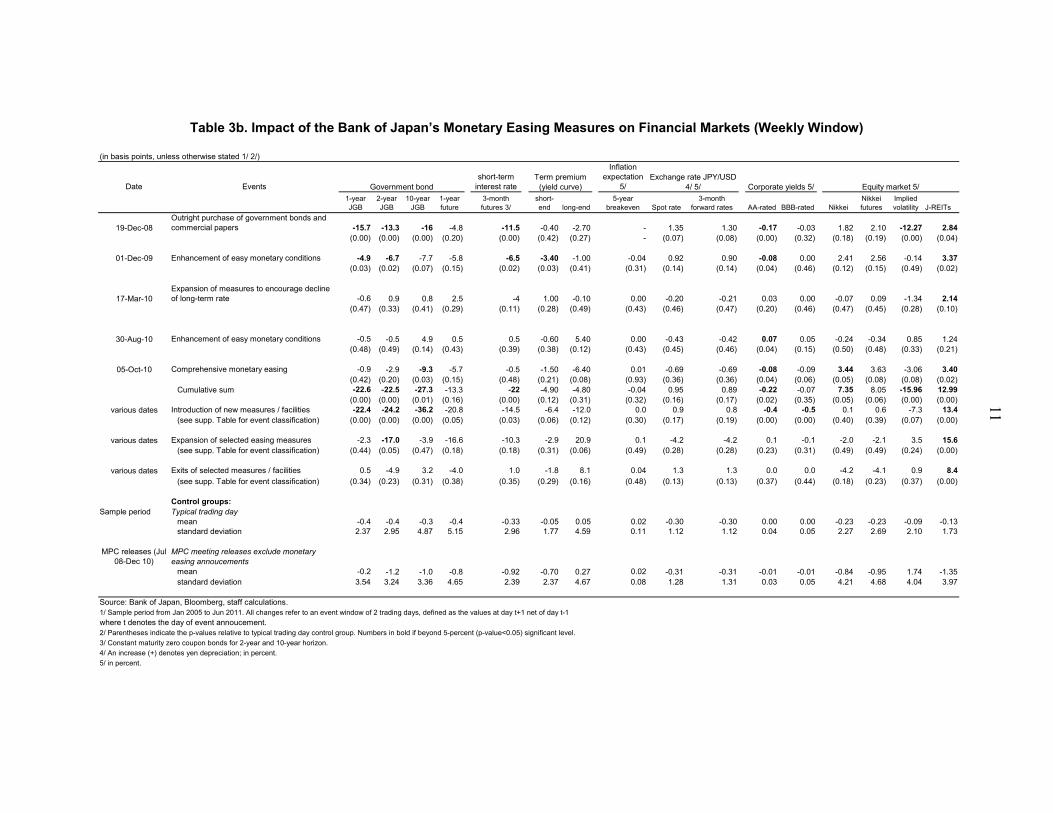
Government securities. Sovereign yields across all maturities declined in three out of the five events at the 5 percent significance level. The 10-year JGB yield fell by a cumulative 24 basis points while the 2-year JGB yield fell by 14 basis points compared to a 0.1 basis point of change in a typical trading day (Table 3a). The initial fall in sovereign yields appears to persist and reinforces the decline in the following week (Table 3b). Declines of shorter maturity yields were not significant at the event of the introduction of CME, in part because those yields were already at very low levels.
Corporate bonds. Corporate yields across investment grades cumulatively decreased by 15–22 basis points in the two-day window (with a p-value of around 0.05), though the impact stayed broadly the same throughout the week. Bond issuances also improved following the announcement of the asset purchase program (Bank of Japan, 2011).
4 The daily returns of typical trading days on various financial assets cannot reject the hypothesis that those returns follow normal distributions under Shapiro-Wilk test.

9
Equity markets. Stock and futures markets strengthened in four out of the five easing events, cumulatively increasing by 5–7 percent, in the week after. The impact has been statistically significant with a small p-value less than 0.05. The implied volatility in the equity market generally declined following the monetary easing measures.
Real estate investment trusts (REITs). Prices of REITs in particular, surged for cumulatively 14 percent (Table 3a) following the monetary easing events, reflecting large BOJ purchases in a relatively small market. Initial impact also reinforced during the remaining of the week.
The easing measures, however, had no appreciable impact on the yen exchange rates and inflation expectations. The spot and forward yen rates against the dollar changed little and were not significantly different from movements during typical trading days. Inflation expectations derived from breakeven rates based on inflation-linked bonds remained unchanged within the event windows.
Most of the impact on financial markets came from the announcement of new easing measures, rather than from subsequent purchases. Under the asset purchase program, the announcement effect outweighed that of the actual purchases, which often had only a modest impact on financial indicators (text chart). This could suggest investors already pricing-in the expected impact of subsequent operations or purchases. The purchases of ETFs however, were usually associated with a fall in equity prices during the event windows, possibly suggesting the purchases were made to support asset prices. Announcements to expand the measures (size or duration) or exits from earlier monetary easing measures had a modest impact on financial markets.

10
Table 3a. Impact of the Bank of Japan’s Monetary Easing Measures on Financial Markets (Two-Trading Day Window)
(in basis points, unless otherwise stated 1/ 2/)
Date Eventsshort-term
interest rate
Inflation expectation
5/
1-year JGB
2-year JGB
10-year JGB
1-year future
3-month futures 3/
short-end long-end
5-year breakeven Spot rate
3-month forward rates AA-rated BBB-rated Nikkei
Nikkei futures
Implied volatility J-REITs
19-Dec-08Outright purchase of government bonds and commercial papers -7.3 -7.7 -7.3 -2.6 -7 0.90 0.40 - 0.93 0.84 -0.06 -0.01 0.65 0.92 -7.05 3.91
(0.00) (0.00) (0.02) (0.24) (0.00) (0.24) (0.46) - (0.11) (0.13) (0.03) (0.38) (0.32) (0.26) (0.00) (0.00)01-Dec-09 Enhancement of easy monetary conditions -4.3 -4.5 -5.8 -3.8 -6.5 -0.90 -1.30 -0.03 1.12 1.12 -0.06 0.00 2.82 3.22 -2.53 5.74
(0.00) (0.02) (0.05) (0.15) (0.00) (0.26) (0.34) (0.28) (0.07) (0.07) (0.04) (0.48) (0.03) (0.01) (0.06) (0.00)
17-Mar-10Expansion of measures to encourage decline of long-term rate -0.1 0.5 2.7 3.4 1.5 -0.10 2.20 0.03 0.08 0.07 0.03 0.00 0.21 0.19 -1.45 1.19
(0.48) (0.37) (0.21) (0.17) (0.09) (0.48) (0.26) (0.38) (0.43) (0.43) (0.20) (0.48) (0.43) (0.44) (0.19) (0.19)
30-Aug-10 Enhancement of easy monetary conditions -0.3 -1.5 -3.9 -3.5 -0.5 -1.10 -2.40 -0.02 -1.20 -1.20 -0.04 -0.05 -1.86 -1.90 3.20 1.17(0.45) (0.26) (0.14) (0.17) (0.35) (0.21) (0.23) (0.37) (0.08) (0.08) (0.13) (0.14) (0.11) (0.10) (0.02) (0.19)
05-Oct-10 Comprehensive monetary easing -1.1 -0.9 -10 -5.4 0 -0.40 -9.10 -0.01 -0.50 -0.50 -0.09 -0.09 3.31 3.74 -1.17 2.25(0.23) (0.36) (0.00) (0.07) (0.48) (0.39) (0.00) (0.78) (0.29) (0.29) (0.00) (0.02) (0.01) (0.00) (0.24) (0.05)
Cumulative sum -13.1 -14.1 -24.3 -11.9 -12.5 -1.6 -10.2 -0.03 0.43 0.34 -0.22 -0.15 5.13 6.17 -9.00 14.26(0.00) (0.00) (0.00) (0.08) (0.00) (0.31) (0.07) (0.32) (0.34) (0.36) (0.00) (0.06) (0.05) (0.03) (0.01) (0.00)
various dates Introduction of new measures / facilities -13.1 -15.9 -21.8 -12.6 -11.5 -2.2 -5.9 -0.1 1.3 1.2 -0.2 -0.1 6.0 7.1 -14.2 18.5(see supp. Table for event classification) (0.00) (0.00) (0.00) (0.07) (0.00) (0.25) (0.19) (0.26) (0.18) (0.20) (0.00) (0.16) (0.03) (0.01) (0.00) (0.00)
various dates Expansion of selected easing measures -1.8 -12.0 -1.4 -3.3 4.0 1.5 10.6 0.1 -4.9 -4.8 0.0 -0.1 -0.4 -1.3 -4.5 5.7(see supp. Table for event classification) (0.44) (0.03) (0.47) (0.41) (0.09) (0.32) (0.15) (0.45) (0.03) (0.03) (0.48) (0.37) (0.49) (0.40) (0.17) (0.07)
various dates Exits of selected measures / facilities 0.2 -2.7 -2.1 -2.8 1.0 0.1 0.6 0.0 -0.2 -0.2 0.0 0.0 0.0 0.4 -1.9 4.1(see supp. Table for event classification) (0.39) (0.27) (0.38) (0.35) (0.28) (0.46) (0.48) (0.48) (0.49) (0.49) (0.49) (0.47) (0.48) (0.43) (0.25) (0.04)
Control groups:Typical trading day
mean -0.2 -0.2 -0.1 -0.1 -0.06 -0.04 0.10 0.01 -0.07 -0.06 0.00 0.00 -0.04 -0.03 -0.01 0.00standard deviation 1.31 2.01 3.46 3.60 1.17 1.32 3.31 0.07 0.80 0.80 0.03 0.04 1.47 1.45 1.61 1.35
MPC releases (Jul 08-Dec 10)
MPC meeting releases exclude monetary easing annoucements
mean -0.5 -0.9 -1.1 -0.7 -0.34 -0.59 -0.21 0.01 -0.12 -0.12 -0.01 0.00 -0.89 -0.90 1.41 -0.58standard deviation 1.96 3.24 3.36 4.65 2.39 2.37 4.67 0.08 1.28 1.31 0.03 0.05 2.61 2.74 3.17 3.06
Source: Bank of Japan, Bloomberg, staff calculations.1/ Sample period from Jan 2005 to Jun 2011. All changes refer to an event window of 2 trading days, defined as the values at day t+1 net of day t-1
where t denotes the day of event annoucement.2/ Parentheses indicate the p-values relative to typical trading day control group. Numbers in bold if beyond 5-percent (p-value<0.05) significant level.
3/ Constant maturity zero coupon bonds for 2-year and 10-year horizon.
4/ An increase (+) denotes yen depreciation; in percent.
5/ in percent.
Exchange rate JPY/USD 4/ 5/ Corporate yields 5/
Term premium (yield curve) Equity market 5/Government bond
11
Table 3b. Impact of the Bank of Japan’s Monetary Easing Measures on Financial Markets (Weekly Window)
(in basis points, unless otherwise stated 1/ 2/)
Date Eventsshort-term
interest rate
Inflation expectation
5/
1-year JGB
2-year JGB
10-year JGB
1-year future
3-month futures 3/
short-end long-end
5-year breakeven Spot rate
3-month forward rates AA-rated BBB-rated Nikkei
Nikkei futures
Implied volatility J-REITs
19-Dec-08Outright purchase of government bonds and commercial papers -15.7 -13.3 -16 -4.8 -11.5 -0.40 -2.70 - 1.35 1.30 -0.17 -0.03 1.82 2.10 -12.27 2.84
(0.00) (0.00) (0.00) (0.20) (0.00) (0.42) (0.27) - (0.07) (0.08) (0.00) (0.32) (0.18) (0.19) (0.00) (0.04)
01-Dec-09 Enhancement of easy monetary conditions -4.9 -6.7 -7.7 -5.8 -6.5 -3.40 -1.00 -0.04 0.92 0.90 -0.08 0.00 2.41 2.56 -0.14 3.37(0.03) (0.02) (0.07) (0.15) (0.02) (0.03) (0.41) (0.31) (0.14) (0.14) (0.04) (0.46) (0.12) (0.15) (0.49) (0.02)
17-Mar-10Expansion of measures to encourage decline of long-term rate -0.6 0.9 0.8 2.5 -4 1.00 -0.10 0.00 -0.20 -0.21 0.03 0.00 -0.07 0.09 -1.34 2.14
(0.47) (0.33) (0.41) (0.29) (0.11) (0.28) (0.49) (0.43) (0.46) (0.47) (0.20) (0.46) (0.47) (0.45) (0.28) (0.10)
30-Aug-10 Enhancement of easy monetary conditions -0.5 -0.5 4.9 0.5 0.5 -0.60 5.40 0.00 -0.43 -0.42 0.07 0.05 -0.24 -0.34 0.85 1.24(0.48) (0.49) (0.14) (0.43) (0.39) (0.38) (0.12) (0.43) (0.45) (0.46) (0.04) (0.15) (0.50) (0.48) (0.33) (0.21)
05-Oct-10 Comprehensive monetary easing -0.9 -2.9 -9.3 -5.7 -0.5 -1.50 -6.40 0.01 -0.69 -0.69 -0.08 -0.09 3.44 3.63 -3.06 3.40(0.42) (0.20) (0.03) (0.15) (0.48) (0.21) (0.08) (0.93) (0.36) (0.36) (0.04) (0.06) (0.05) (0.08) (0.08) (0.02)
Cumulative sum -22.6 -22.5 -27.3 -13.3 -22 -4.90 -4.80 -0.04 0.95 0.89 -0.22 -0.07 7.35 8.05 -15.96 12.99(0.00) (0.00) (0.01) (0.16) (0.00) (0.12) (0.31) (0.32) (0.16) (0.17) (0.02) (0.35) (0.05) (0.06) (0.00) (0.00)
various dates Introduction of new measures / facilities -22.4 -24.2 -36.2 -20.8 -14.5 -6.4 -12.0 0.0 0.9 0.8 -0.4 -0.5 0.1 0.6 -7.3 13.4(see supp. Table for event classification) (0.00) (0.00) (0.00) (0.05) (0.03) (0.06) (0.12) (0.30) (0.17) (0.19) (0.00) (0.00) (0.40) (0.39) (0.07) (0.00)
various dates Expansion of selected easing measures -2.3 -17.0 -3.9 -16.6 -10.3 -2.9 20.9 0.1 -4.2 -4.2 0.1 -0.1 -2.0 -2.1 3.5 15.6(see supp. Table for event classification) (0.44) (0.05) (0.47) (0.18) (0.18) (0.31) (0.06) (0.49) (0.28) (0.28) (0.23) (0.31) (0.49) (0.49) (0.24) (0.00)
various dates Exits of selected measures / facilities 0.5 -4.9 3.2 -4.0 1.0 -1.8 8.1 0.04 1.3 1.3 0.0 0.0 -4.2 -4.1 0.9 8.4(see supp. Table for event classification) (0.34) (0.23) (0.31) (0.38) (0.35) (0.29) (0.16) (0.48) (0.13) (0.13) (0.37) (0.44) (0.18) (0.23) (0.37) (0.00)
Control groups:Sample period Typical trading day
mean -0.4 -0.4 -0.3 -0.4 -0.33 -0.05 0.05 0.02 -0.30 -0.30 0.00 0.00 -0.23 -0.23 -0.09 -0.13standard deviation 2.37 2.95 4.87 5.15 2.96 1.77 4.59 0.11 1.12 1.12 0.04 0.05 2.27 2.69 2.10 1.73
MPC releases (Jul 08-Dec 10)
MPC meeting releases exclude monetary easing annoucements
mean -0.2 -1.2 -1.0 -0.8 -0.92 -0.70 0.27 0.02 -0.31 -0.31 -0.01 -0.01 -0.84 -0.95 1.74 -1.35standard deviation 3.54 3.24 3.36 4.65 2.39 2.37 4.67 0.08 1.28 1.31 0.03 0.05 4.21 4.68 4.04 3.97
Source: Bank of Japan, Bloomberg, staff calculations.1/ Sample period from Jan 2005 to Jun 2011. All changes refer to an event window of 2 trading days, defined as the values at day t+1 net of day t-1
where t denotes the day of event annoucement.2/ Parentheses indicate the p-values relative to typical trading day control group. Numbers in bold if beyond 5-percent (p-value<0.05) significant level.
3/ Constant maturity zero coupon bonds for 2-year and 10-year horizon.
4/ An increase (+) denotes yen depreciation; in percent.
5/ in percent.
Government bondTerm premium
(yield curve)Exchange rate JPY/USD
4/ 5/ Corporate yields 5/ Equity market 5/

12
Across sectors, the BOJ’s measures have had the largest impact on the financial and real estate sectors. Stock prices of the financial sector, notably the major banks and insurance companies, rose strongly relative to the market index (adjusted by the industry beta). For instance, the megabanks and insurance companies have excess returns of over 10 percent during the week after the announcement of new easing measures. This could partly reflect financial institutions’ lower financing cost and their large holdings of government securities. By contrast, equity prices in other sectors did not show significant excess returns compared to the overall market, regardless of company size or credit status (Figure 2).
Figure 2: Cross-sectional Cumulative Impact of BoJ’s Monetary Easing Measures
Sources: Bloomberg and staff estimates. 1/ Events are defined as in the text. Beta-adjusted return is calculated as industry beta*market return. Symbol ※ denotes statistical significant at the 5 percent level from the adjusted returns.
Compared to the easing measures by the U.S. Fed, the BOJ’s easing measures have generated similar effects, but with two notable exceptions.4 Asset prices responded strongly in both the United States and Japan following the announcements of their monetary easing measures, although the magnitude apparently fell short of those of the Fed’s and ECB’s quantitative easing measures (Table 4). By contrast, the Fed’s large-scale asset purchases have had a stronger impact on global financial markets, including Japan and the euro-area, compared with no such global spillovers from the BoJ’s measures. Second, the Fed’s easing measures were found to have influenced the dollar exchange rates and domestic inflation expectations (D’Amico and King, 2010; Yellen, 2011), while the BoJ’s measures appeared to have no such effect. This could reflect the yen could be more correlated to external factors and greater linkages of the United States to global financial markets.
2 2 3 4 The Fed announced purchases of government securities and mortgage-backed securities in December 2008. The Fed purchased securities across the yield curve, with maturities from 3 months to 30 years, but bought most heavily in 4- to 10-year maturities. The rate of purchase was broadly steady and varied with liquidity.
0
5
10
15
20
25
302-day window
One-week window
beta-adjusted returns (2-day)
beta-adjusted returns (5-day)
Sources: Bloomberg and staff estimates.1/ Events defined as in the text. Beta-adjusted return is calculated as industry beta*market return. Symbol ※ denotes statistical significant at 5 percent level from the adjusted returns.
Cumulative Impact of Monetary EasingAnnouncements on Financial Sector
(in percent)
※※ ※※ ※※※0
5
10
15
20
25
30
2-day window
One-week window
beta-adjusted return (2-day)
beta-adjusted return (5-day)
Sources: Bloomberg and staff estimates.1/ Impact measured in a 2-day or weekly event window. Beta adjusted return is calculated as industry beta multiplied by the market return. None of these are statistically significant at 5 percent level from the adjusted returns.
Cumulative Impact of Monetary EasingAnnouncements on Corporate Sector
(in percent; by size and credit status)

13
Table 4. Impact of U.S. Fed’s Monetary Easing Measures (in basis points, unless otherwise stated 1/ 2/)
Date Events
short-term interest
rate
1-year Treasury
bonds
2-year Treasury
bonds
10-year Treasury
bonds1-year future
3-month futures 3/
short-end
long-end
Expected inflation
Spot rate
3-month forward rates
AA-rated
BBB-rated
Stock index
Index futures
Implied volatility J-REITs
25-Nov-08 Initial announcement of monetary easing through LSAPUnited States -2 -18.7 -41.9 -31.6 -1.25 -1.6 -23.2 0.4 0.3 0.3 -0.02 -0.03 4.2 4.5 -15.1 -
(0.41) (0.02) (0.00) (0.00) (0.47) (0.38) (0.00) (0.00) (0.32) (0.32) (0.48) (0.47) (0.00) (0.00) (0.00) -
Japan 3.8 4 -2.6 -0.2 3 0.5 -6.6 - -1.7 -1.7 0.0 0.0 3.8 2.4 -5.9 7.5(0.00) (0.02) (0.23) (0.49) (0.04) (0.34) (0.02) - (0.06) (0.06) (0.18) (0.26) (0.02) (0.11) (0.00) (0.01)
Euro-area or Germany 0 0 -14.6 -16.2 7.5 -1.6 -14.6 0.079 -0.5559 -0.38015 2.4 -1.8 0.1355 0.3385 -9.2047 -(0.42) (0.45) (0.04) (0.02) (0.08) (0.38) (0.01) (0.17) (0.34) (0.39) (0.29) (0.42) (0.48) (0.44) (0.13) -
21-Sep-10 FOMC release following Bernanke's speech at Jackson HoleUnited States -3 -7.1 -10.5 -10.3 -2.5 -3.7 -3.4 0.0 0.6 0.6 -0.25 -0.24 1.8 2.1 -4.9 -
(0.36) (0.22) (0.19) (0.15) (0.41) (0.25) (0.32) (0.44) (0.16) (0.16) (0.15) (0.19) (0.12) (0.09) (0.12) -
Japan -0.3 -1.1 -4.4 -4.2 0.5 -0.2 -3.3 - -1.4 -1.37 -0.04 -0.05 -0.62 -0.52 0.61 1.13(0.46) (0.33) (0.11) (0.13) (0.37) (0.45) (0.15) - (0.10) (0.11) (0.13) (0.09) (0.37) (0.39) (0.35) (0.36)
Euro-area or Germany 0.2 -6.6 -8.9 -12.1 -3 -2.1 -2.3 -0.13 2.63 2.58 -5.50 -5.50 -1.37 -1.24 4.15 -(0.41) (0.24) (0.14) (0.07) (0.38) (0.35) (0.33) (0.08) (0.01) (0.02) (0.18) (0.18) (0.26) (0.28) (0.31) -
03-Nov-10 Expansion of monetary easing (QE2) United States -1 -1.4 -9.4 -12.2 -0.5 1.6 -8 -0.2 0.1 0.7 -0.14 -0.17 2.3 2.2 -14.1 -
(0.47) (0.46) (0.21) (0.11) (0.49) (0.40) (0.15) (0.02) (0.44) (0.12) (0.28) (0.27) (0.07) (0.08) (0.00) -
Japan -0.1 -0.8 -2.4 -2 0 -0.1 1.6 - 0.2 0.2 0.0 0.0 2.2 2.1 -2.4(0.48) (0.38) (0.25) (0.30) (0.48) (0.48) (0.33) - (0.47) (0.46) (0.38) (0.33) (0.13) (0.14) (0.07) (0.50)
Euro-area or Germany -3.5 -0.1 2.6 -4.3 -1 1.6 2.7 -0.1 1.2 1.1 -3.5 -4.4 1.2 1.1 -9.5 -(0.34) (0.46) (0.35) (0.31) (0.50) (0.40) (0.38) (0.27) (0.13) (0.16) (0.30) (0.24) (0.30) (0.31) (0.12) -
Cumulative sum across various annoucement datesUnited States -27.0 -45.8 -105.5 -93.8 -79.04 -8.25 -71.88 0.40 5.03 4.87 -1.26 -1.52 3.73 3.66 -8.76 -
(0.15) (0.07) (0.00) (0.00) (0.00) (0.30) (0.00) (0.12) (0.01) (0.01) (0.05) (0.04) (0.23) (0.24) (0.22) -Japan -6.7 -13.0 -12.3 -15.6 -26.90 -2.70 0.70 - -11.96 -11.80 -0.11 0.04 -1.20 -3.06 -13.54 19.33
(0.11) (0.04) (0.15) (0.10) (0.00) (0.28) (0.48) - (0.00) (0.00) (0.17) (0.32) (0.42) (0.30) (0.00) (0.02)Euro-area or Germany -47.4 -55.3 -73.2 -80.5 -91.90 -11.30 -17.90 -0.62 3.57 3.38 -21.00 -28.80 -0.47 0.13 -4.53 -
(0.02) (0.04) (0.00) (0.00) (0.00) (0.24) (0.13) (0.02) (0.12) (0.15) (0.19) (0.10) (0.46) (0.49) (0.42) -Control group:
1843 Typical trading dayUnited States -0.6 -0.5 0.0 -0.1 -0.64 0.14 0.46 0.00 -0.02 -0.02 -0.01 -0.01 0.01 0.01 0.17 -
standard deviation 6.5 8.6 11.8 9.9 8.08 5.71 8.31 0.10 0.65 0.63 0.23 0.3 1.54 1.57 4.26 -Japan -0.2 -0.2 -0.1 -0.1 -0.11 -0.03 0.12 - 0.06 0.06 0.00 0.0 0.01 0.01 -0.01 0.02
standard deviation 1.3 2.0 3.5 3.6 1.82 1.31 3.33 - 1.15 1.16 0.03 0.04 1.91 1.94 1.61 3.06Euro-area or Germany -1.1 -1.0 -0.4 -0.5 -1.07 0.14 0.62 0.00 -0.07 -0.05 -0.62 -0.7 0.02 0.03 0.09 -
standard deviation 5.7 8.1 7.9 7.69 6.2 5.71 6.73 0.09 1.17 1.22 5.39 5.4 2.21 2.21 8.11 -
Source: Bank of Japan, Federal Reserve Board, European Central Bank, Bloomberg, and staff calculations.1/ Sample period from 1 Jul 2008 to 11 Jan 2011. All changes refer to an event window of 2 trading days, defined as the values at day t+1 net of day t-1
where t denotes the day of event annoucement.2/ Parentheses indicate the p-values relative to typical trading day control group. Numbers in bold if beyond 5-percent (p-value<0.05) significant level.
3/ Constant maturity zero coupon bonds for 2-year and 10-year horizon.
4/ Percentage increase (+) denotes currency depreciation against USD. For USD, exchange rate refers to nominal trade-weighted rate.
5/ in percent.
Government bondTerm premium
(yield curve) Exchange rate 4/ 5/Corporate yields 5/ Equity market 5/

14
Besides raising asset prices, the asset purchase program contributed to lower the probability of tail risks to materialize in financial markets. Implied volatility based on option prices in the equity market fell cumulatively by nearly 10 percent (significant at 5 percent level) after the BoJ’s easing, suggesting an improvement of investors risk appetite—one of the objectives under the Comprehensive Monetary Easing—for the subsequent months until the March earthquake and tsunami took place. Markets’ perceived risk of a double-dip recession also receded, as indicated by the decline in the implied volatility of out-of-the-money call and put options—a measure of the cost of insuring against extreme tail risk events. And business and consumer confidence generally improved following an easing event (Figure 3). The BoJ’s easing likely contributed to stabilizing Japan’s economy and narrowing the perceived distribution of risks surrounding the outlook. This is in line with the finding of Baumeister and Benati (2011) who uses a structural VAR model and find statistically significant on real activities after the monetary easing.
Figure 3. Risk Appetite Improved following Monetary Easing Measures
III. POTENTIAL IMPACT OF FURTHER ASSET PURCHASES
This section assesses the potential impact of a further expansion of the asset purchase program. To do so would require a framework to compute the impact of raising the target level of purchase. Using a portfolio rebalancing framework as in Neely (2010), we analyze a hypothetical scenario of the potential impact on financial markets if CME had not included private asset purchases.
The portfolio rebalancing model links the expected asset returns to investors portfolio weights on the assets. Following the framework of Neely (2010), we consider how a reduction of available supply of government securities affects the portfolio choice of a typical mean-variance investor. The investor chooses the portfolio weight of N assets to maximize the asset returns in the following way:
Max 1
2`
where E(R) is the expected net returns on various assets, Wis the covariance matrix of n-by-
n dimension. is the coefficient of risk aversion. The maximization problem implies that the
0
20
40
60
80
100
120
0
10
20
30
40
50
60
Jan-
08
Apr
-08
Jul-
08
Oct
-08
Jan-
09
Apr
-09
Jul-
09
Oct
-09
Jan-
10
Apr
-10
Jul-
10
Oct
-10
Jan-
11
Apr
-11
Jul-
11
VIX for Nikkei (RHS) Current conditions Future conditions
Source: Cabinet office. Vertial lines indicate monetary easing events.
Implied Volatility and Economy Watchers Survey (diffusion index)
-50
-30
-10
10
30
50
70
90
0
20
40
60
80
100
120
140
160
180
Jan-
08
Apr-
08
Jul-0
8
Oct
-08
Jan-
09
Apr-
09
Jul-0
9
Oct
-09
Jan-
10
Apr-
10
Jul-1
0
Oct
-10
Jan-
11
Apr-
11
Jul-1
1
VIX--Implied volatility of Nikkei (1-month; LHS)
Tail-risk measure based on skewness of implied volatility from out-of-money options (1-month historical moving average; RHS)
Lehman crisis Great EastJapanEarthquake
European debt crisis(e.g., Greece)
Pricing of Extreme Tail Risk and VIX on Nikkei
Sources: Bloomberg and IMF staff estimates.
Rise of global risk

15
-60
-50
-40
-30
-20
-10
0
long-term JGB yields
Corporate bond yields
¥1 tr JGB purchase ¥1 tr corp bond & CP purchase¥1/2 tr equity purchase
Impact of Hypothetical Expansion of Asset Purchase Program beyond the Current Target Levels
(in basis points)
Sources: staff estimate and Neely (2010).
0.0
1.0
2.0
3.0
4.0
5.0
6.0
Equity asset return (in percent)
optimal portfolio weights can be expressed as a function of risk aversion, expected return,
and covariance of asset returns: .
Given that financial assets are imperfect substitutes, purchases of one asset class by the BOJ could affect the returns on all correlated assets. A reduction of net supply of financial assets by the BOJ would shift investor portfolio and asset returns provided those assets are inelastic in supply in the short term. The expected asset returns would change to induce investors to willingly reduce their holdings to maintain the market clearing condition such that ∆ ∆ , which is a function of the portfolio weight, risk aversion, and covariance among asset returns. We measure the portfolio weight held by private investors across various asset classes using the total outstanding amount or market capitalization published by various financial agencies (e.g., BOJ, Tokyo Stock Exchange, Japan Securities Dealers Association, JSDA). The covariance of asset returns is estimated using daily data from 2000, while the risk aversion parameters are calibrated similar to the level used in the literature around 0.9–1.1. The calculations show that including private risky asset in the program is a key factor to support asset prices, and further increasing purchase target could further support financial markets. Specifically,
The overall impact of BOJ’s monetary easing would have been smaller if the asset purchase program had not included private risky assets (Table 5—last column). Specifically, the rise of equity prices would have been 2–3 percent less if the BOJ had not directly purchased the ETFs and J-REITs. The model also predicts a sharper decline of sovereign yields than the observed impact, likely due to the interest rates (particularly short-term) have been already low in Japan.
Increased purchases of private assets could further support financial markets. The above model also suggests that if the target purchase level was expanded, it could further support asset prices (text chart). For example, an additional purchase of ¥1 trillion of government securities beyond the current target level would have limited impact on sovereign yields and equity markets, especially given the already-low level of interest rates (see chart). However, the same amount of additional purchases of corporate bonds and commercial paper would have a larger impact by lowering the risk premium in the corporate sector. In addition, purchasing additional ¥½ trillion equities-related assets would reduce long-term sovereign yields by about 30 basis points and raise equity prices by 3 percent. The magnitude appears to be economically significant and larger

16
than those from sole purchases of government securities, probably reflecting the already-low level of government bond yields. A purchase of equity-related asset had contributed to a fall of government bond yields through portfolio rebalancing. The positive impact on financial markets could have contributed to the general activities noted in Berkmen (2011).
Table 5. Expected Impact on Assets from Portfolio Rebalance Model
While increasing purchases may raise asset prices, large-scale purchases could also raise the credit risk on the BOJ’s balance sheet. In the case of excessive capital losses, it could undermine the independence and credibility of BOJ, and could potentially lead to distortive funds misallocation. While the risk to the credibility or independence of the BOJ is more difficult to assess, anecdotal evidence from financial markets suggests the risk tends to be small. The target purchase of risky assets constitutes a small fraction in terms of liquidity and total market capitalization of the stock market and the corporate bond market. Nevertheless, there are risks to the unconventional easing policies that could potentially weaken the effectiveness of those policies as discussed in Fujita, Ishi, and Stone (2011).
The purchases of private assets so far represent only a small amount relative to the size of the BoJ’s balance sheet. The BoJ’s asset purchase program is small relative to the total market share, even if it was fully used, perhaps with an exception in the real estate investment trust (Table 6). The outstanding amount of risky assets held by the BoJ is less
Various funds supplying operations and asset purchase program Target
As of August 2011 Total
What-if without CME?
Government bonds 2/ 21.8 per year 62.1 732of which: with remaining maturity 1 year or less 3/ 21.4 148 -36 to -44 -31 to -38 More than 1 year but less than 10 years 3/ 37.2 186 -42 to -52 -37 to -45More than 10 years 3/ 3.5 398 -28 to -35 -24 to -29
Treasury bills - 3.3 31 - -Funds supplying operations against pooled collateral (under multiple-price competitive auction) - 17.3 - -Funds provisioning measure to support strengthening the foundations for economic growth 3 1.5 - -
Asset purchase program (APP) under CME 50 38.6Government bonds 4 1.6 732 -2 to -4 -2 to -4Treasury bills 4.5 2.7 31 - -Fixed-rate funds supplying operation against pooled collateral 35 24.8 - - -Commercial papers 2.1 1.6 - - -Corporate bonds 2.9 1.0 - -23 to -29 -18 to - 23ETFs 1.4 0.5 - 328 to 401 125 to 153J-REITs 0.11 0.04 3 535 to 654 192 to 234
Sources: Bank of Japan and Haver.1/ Data as of end December 2010, unless otherwise stated.2/ Gross purchases by Bank of Japan. The Bank increased its monthly outright purcahses of JGBs from 1.4 trillion yen to 1.8 trillion yen since March 2009. 3/ Estimated to include inflation-linked bonds and floating bonds. 4/ Predicted with portfolio balance model based on net increase of BoJ's purchases during the crisis. Risk aversion parameter is set to 0.9 to 1.1 and covariance on asset returns is estimated between Jul 2008 and Dec 2010.
(in trillion yen)
Bank of Japan purchasesOutstanding amount or
market cap. 1/
Expected change on yields or returns (in basis points) 4/

17
than ¥1½ trillion as of end-May, and would reach ¥5 trillion when the target level is met. This would amount to about 3½ percent of the total balance sheet, suggesting the risk to its balance sheet from asset purchases would still remain relatively modest. As such, expanding the asset purchase program is unlikely to crowd out private transactions in financial markets but it is difficult to ascertain whether additional purchases would generate the same extent of impact (Cochrane, 2011).
Table 6. Asset Purchase Program and Relative Market Size (In trillions of yen)
1/
IV. CONCLUSION
The BoJ’s easing measures had a statistically significant impact on bond yields and equity prices, but no notable effect on exchange rate and inflation expectation. The impact stems mainly from the announcement effect rather than from the actual operations or purchases. The easing measures have contributed to a decline in long-term interest rates and lowered downside tail risks, thereby helping to support investors’ risk appetite. Furthermore, the impact has been broad-based and comprehensive, extending beyond the assets purchased by the BoJ, but so far have only tentative signs to raising real activities (Kuttner, 2010 and Berkmen, 2011). Nevertheless, the positive impact from asset purchases would need to be weighed against potential risks of undermining the independence of BOJ and crowding out of private transactions in the financial markets.
Target level 1/
Amount outstanding (as
of end-May 2011)
Market capitalization /
outstanding amount
Asset purchasesGovernment securities 2/ 5.0 3.0 850.0Commercial paper 2.0 1.2 15.0Corporate bonds 2.0 0.5 60.8Exchange-traded funds 3/ 0.9 0.3 457.4Real estate investment trusts 0.1 0.0 3.2
Subtotal 10.0 5.0 -
Fixed-rate fund-supplying operation against pooled collateral 30.0 29.6 -Total 40.0 34.6 -
Sources: Bank of Japan, Tokyo Stock Exchange, Japan Securities Dealers Association.
1/ Target level was raised from ¥35 to 40 trillion after the earthquake in
mid-March 2011.2/ Includes government bonds and Treasury bills. 3/ Market capitalization refers to the equities markets in Tokyo Stock Exchange.

18
REFERENCES
Bank of Japan, 2011, Financial Markets Report, February (Japan). Baumeister, Christiane and Luca Benati, 2011, “Unconventional Monetary Policy and the
Great Recession,” Bank of Canada, Working Paper. Berkmen, Pelin, 2011, Japan—Bank of Japan’s Monetary Easing: Is It Now More
Effective?” IMF Selected Issues Report No. 95/96 (Washington: International Monetary Fund).
Cochrane, John, 2011, “Understanding Fiscal and Monetary Policy in the Great Recession:
Some Unpleasant Fiscal Arithmetic,” European Economic Review, Vol. 55 (January), pp. 2–30.
D’Amico, Stefania, and Thomas B. King, 2010, “Flow and Stock Effects of Large-Scale
Treasury Purchases,” Federal Reserve Board, Staff Working Papers in the Finance and Economics Discussion Series (FEDS), Vol. 2010–52.
Fujita, Kenji, Kotaro Ishi, and Mark Stone, 2011, “Should Unconventional Balance Sheet
Policies be Added to the Central Bank Toolkit? A Review of the Experience So Far,” IMF Working Paper, No. 11/145 (Washington: International Monetary Fund).
Gagnon, Joseph, Matthew Raskin, Julie Remache, and Brian Sack, 2010, “Large Scale Asset
Purchases by the Federal Reserve: Did They Work?” Federal Reserve Bank of New York, Staff Reports, No.441 (March).
Kuttner, Kenneth, 2010, The Fed’s Response to the Financial Crisis: Pages from Bank of
Japan Playbook, or a Whole New Ball Game?, Policy Research Institute, Ministry of Finance, Japan, Public Policy Review: Vol. 6/3 (March).
Neely, Christopher, 2010, “The Large-Scale Asset Purchases Had Large International
Effects,” Federal Reserve Bank of St. Louis, Working Paper, October. Joyce, Michael, Ana Lasaosa, Ibrahim Stevens, and Matthew Tong, 2010, “The Financial
Market Impact of Quantitative Easing,” Bank of England Working Paper No. 393 (July).
Yellen, Janet, 2011, “Unconventional Monetary Policy and Central Bank Communications,”
Speech at the U.S. Monetary Policy Forum, New York on February 25.