Embed Size (px)
Citation preview
The work described in this report was funded by the U.S. Department of Energy’s Wind Energy Technologies Office within the Office of Energy Efficiency and Renewable Energy under Lawrence Berkeley National Laboratory Contract No. DE-AC02-05CH11231.
S U M M A R Y O F P R O J E C T R E S U L T S
January 2018
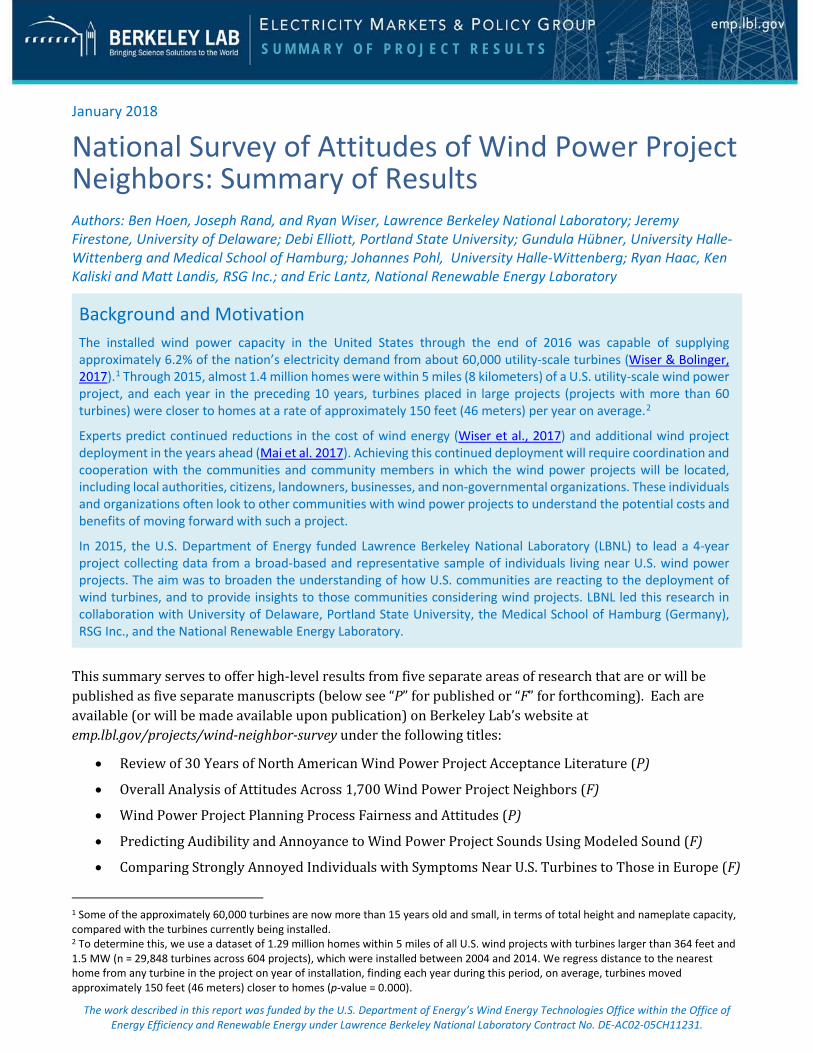
National Survey of Attitudes of Wind Power Project Neighbors: Summary of Results Authors: Ben Hoen, Joseph Rand, and Ryan Wiser, Lawrence Berkeley National Laboratory; Jeremy Firestone, University of Delaware; Debi Elliott, Portland State University; Gundula Hübner, University Halle-Wittenberg and Medical School of Hamburg; Johannes Pohl, University Halle-Wittenberg; Ryan Haac, Ken Kaliski and Matt Landis, RSG Inc.; and Eric Lantz, National Renewable Energy Laboratory
Background and Motivation The installed wind power capacity in the United States through the end of 2016 was capable of supplying approximately 6.2% of the nation’s electricity demand from about 60,000 utility-scale turbines (Wiser & Bolinger, 2017).1 Through 2015, almost 1.4 million homes were within 5 miles (8 kilometers) of a U.S. utility-scale wind power project, and each year in the preceding 10 years, turbines placed in large projects (projects with more than 60 turbines) were closer to homes at a rate of approximately 150 feet (46 meters) per year on average.2
Experts predict continued reductions in the cost of wind energy (Wiser et al., 2017) and additional wind project deployment in the years ahead (Mai et al. 2017). Achieving this continued deployment will require coordination and cooperation with the communities and community members in which the wind power projects will be located, including local authorities, citizens, landowners, businesses, and non-governmental organizations. These individuals and organizations often look to other communities with wind power projects to understand the potential costs and benefits of moving forward with such a project.
In 2015, the U.S. Department of Energy funded Lawrence Berkeley National Laboratory (LBNL) to lead a 4-year project collecting data from a broad-based and representative sample of individuals living near U.S. wind power projects. The aim was to broaden the understanding of how U.S. communities are reacting to the deployment of wind turbines, and to provide insights to those communities considering wind projects. LBNL led this research in collaboration with University of Delaware, Portland State University, the Medical School of Hamburg (Germany), RSG Inc., and the National Renewable Energy Laboratory.
This summary serves to offer high-level results from five separate areas of research that are or will be published as five separate manuscripts (below see “P” for published or “F” for forthcoming). Each are available (or will be made available upon publication) on Berkeley Lab’s website at emp.lbl.gov/projects/wind-neighbor-survey under the following titles:
• Review of 30 Years of North American Wind Power Project Acceptance Literature (P)
• Overall Analysis of Attitudes Across 1,700 Wind Power Project Neighbors (F)
• Wind Power Project Planning Process Fairness and Attitudes (P)
• Predicting Audibility and Annoyance to Wind Power Project Sounds Using Modeled Sound (F)
• Comparing Strongly Annoyed Individuals with Symptoms Near U.S. Turbines to Those in Europe (F)
1 Some of the approximately 60,000 turbines are now more than 15 years old and small, in terms of total height and nameplate capacity, compared with the turbines currently being installed. 2 To determine this, we use a dataset of 1.29 million homes within 5 miles of all U.S. wind projects with turbines larger than 364 feet and 1.5 MW (n = 29,848 turbines across 604 projects), which were installed between 2004 and 2014. We regress distance to the nearest home from any turbine in the project on year of installation, finding each year during this period, on average, turbines moved approximately 150 feet (46 meters) closer to homes (p-value = 0.000).

S U M M A R Y O F P R O J E C T R E S U L T S – 2 –
Research Objectives and Methods Despite the significant existing literature on public acceptance of U.S. wind projects, there were various research gaps that were addressed through the study, including the following:
• What is the distribution of attitudes and annoyances of those living close to U.S. wind power projects, and what factors help explain those attitudes and annoyances?
• How are U.S. wind power project siting and planning processes perceived by community members, and what helps explain differences in those perceptions?
• How well do modeled sound levels from U.S. wind power projects predict respondent levels of audibility and annoyance to those sounds, and what additional factors help explain those levels?
• What percentages of individuals living near U.S. wind power projects are “strongly” annoyed—reporting symptoms caused by turbine sounds, shadow flicker, or visual effects—and what factors help explain those percentages?
• Is there evidence that communities’ attitudes change over time as residents move in and out of the area near U.S. wind power projects?
• How does hosting a turbine(s) and/or being compensated by the wind power project owner influence attitudes, annoyances, and perceptions of the planning process?
• How do U.S. attitudes toward local wind power projects compare with those in Europe, and are there insights that can be drawn from any apparent differences?
The study also sought to address methodological gaps in the previously available literature:
• Ensuring the sample of wind power project neighbors is randomly drawn from all U.S. wind projects and weighted to the population so it can be considered representative
• Collecting data from multiple survey modes—including phone, mail, and internet—to minimize non-response and test for non-response bias
• Over-sampling certain segments of the population to ensure there are sufficient numbers of such individuals who complete the survey to allow for statistical inferences to be drawn on sub-populations, including those living:
o near a wind turbine o near large projects (often in very rural areas) o near the 15 sites for which estimates of A-weighted sound levels were modeled3
The sample population included households within 5 miles (8 kilometers) of “modern, utility-scale wind turbines,” which are defined as at least 354 feet (108 meters) tall—from the base of the tower to the tip of the blade at its apex—and at least 1.5 MW in capacity. This resulted in a sample of 1,289,478 possible households near 604 wind power projects composed of 28,0784 wind turbines built between 1996 and
3 Modeled A-weighted sounds levels are: Overall predicted sound pressure level at a location, adjusted to the approximate frequency sensitivity of human hearing at nominal levels, expressed as “dBA” or “dB(A)”. 4 The 28,078 turbines include all turbines in any project with at least one turbine within 5 miles of a home, so some of these 28,078 turbines could be further than 5 miles from a home.

S U M M A R Y O F P R O J E C T R E S U L T S – 3 –
2014 and totaling 50 GW of installed capacity (See Figure 1). To address the methodological gaps mentioned above, the population was stratified (for example, by distance to a wind turbine and by project size), a stratified random sample was drawn, and data were collected from 1,705 residents across 24 states who were living within 5 miles of 250 U.S. wind power projects. Weighting was employed to account for over-sampling in some strata as well as non-response, thus ensuring the responses accurately represent the population from which the overall sample was drawn.
Figure 1: Map of surveyed projects
A 50-question multi-mode (phone, mail, and internet) survey was distributed to each homeowner in the sample, eliciting the following information:
• Present attitude toward their local wind power project and their attitude prior to construction
• Perceptions of and possible stress reactions to the project (related to appearance, landscape changes, turbine sounds, shadow flicker, and lighting)
• Participation in and perceived fairness of the project’s planning and siting process
• Relationship to the project (for example, distance to the nearest turbine, presence of turbines on their property, compensation, number of turbines visible and ability to hear turbines from property and inside home)
• Background information (for example, length of residence in home, awareness of the project-development process, attachment to place of residence, noise sensitivity, experiences of acute and chronic stress)
• General attitudes toward sources of electricity, climate change, and wind energy’s effectiveness at mitigating climate change
• Demographic information
Preliminary Research Findings A high-level summary of the key findings is presented below. As with other studies of this nature, a number of limitations and considerations apply to the findings, including the following:

S U M M A R Y O F P R O J E C T R E S U L T S – 4 –
• These results have been or will be submitted for peer review in scientific journals and should only be considered final following publication (see those noted as “published” or “P” on page 1)
• Results may not be generalized to areas beyond the sample, such as areas near turbines smaller than 354 feet (108 meters), larger than 492 feet (150 meters), smaller than 1.5 MW, or larger than 3.1 MW, or areas outside the United States—unless other research that encompasses those data supports such generalization
• Results only permit limited conclusions about causality and instead focus on correlations
• Results should be considered in the context of all published peer-reviewed literature on the subject In the summary of findings below, all responses are weighted to the overall population and only include those respondents who answered the specific question(s).5
Present attitude toward local wind project
Each of the more than 1,700 survey respondents was asked, “What is your attitude toward your local wind power project now?”
• A total of 1,674 respondents responded as follows: very negative (4%), negative (4%), neutral (34%), positive (32%), and very positive (25%)—see Figure 2. These results equate to a mean attitude between neutral and positive, and a median of positive.
• The distribution of responses differs by the distance the respondent was from the nearest turbine. For example, those who lived within 0.5 miles (0.8 kilometers) of the nearest turbine responded as follows: very negative (13%), negative (12%), neutral (24%), positive (27%), and very positive (23%)—see Figure 3. This equates to a mean between neutral and positive, and a median of positive, and is slightly less positive than attitudes of those living between 0.5 and 3 miles (0.8 and 4.8 kilometers) away.
Figure 2: Distribution of responses about present attitude toward their local wind power project, from all respondents
5 For example, we asked respondents if they had ever heard the sound from the wind project. If they had not, then they were not asked a question on sound annoyance. Additionally, almost every question had a few respondents that did not answer it even though they were expected to. In either case, these non-responses are not considered in the results below

S U M M A R Y O F P R O J E C T R E S U L T S – 5 –
Figure 3: Distribution of responses about present attitudes toward local wind power projects,
by distance from nearest turbine
• Most demographic and wind power project characteristics are not correlated with attitudes, including gender, age, income, and race as well as the number of turbines in the project and their height. Respondent education is weakly correlated with attitude, as is the age of the project. The attitudes of respondents with more formal education were slightly more positive, and respondents tended to view more-recent projects slightly more negatively.
• Attitudes toward the local wind project are positively correlated with6: o Respondents being compensated o The perception of the planning process as fair o Respondents’ general attitude toward wind power
• Attitudes toward the local wind project are negatively correlated with: o Respondents considering turbine sounds to be annoying o Respondents perceiving the wind turbines to not fit well within the landscape o Respondents’ attachment to the local community
• Individuals who moved to their home after wind project construction have significantly more positive attitudes than those who lived in their homes prior to construction.
Perceived planning process fairness
Each survey respondent who was living in the area during the planning process period and was aware of the process was asked, “To what extent do you believe the planning process was fair?”
• Responses were as follows: not at all (15%), slightly (14%), somewhat (17%), moderately (35%), and very (20%)—see Figure 4. This equates to a mean fairness between somewhat and moderately, and a median of moderately.
6 In this context, positive correlation means attitudes become more positive as the listed factors become more true or positive. Negative correlation means attitudes become more negative as the listed factors become more true or positive.

S U M M A R Y O F P R O J E C T R E S U L T S – 6 –
Figure 4: Distribution of responses about planning process fairness
• The most important component of perceived planning process fairness is developer transparency and openness. The ability of the community or individual to influence the outcome of the project (for example, the number or location of the wind turbines) is also significantly related to beliefs about planning process fairness.
• Compensation is not an indicator of perceived planning process fairness. In addition, survey respondents were asked, “During the planning process for the wind power project did you take any actions?” And they were asked, “Were your actions supportive or opposed to the wind project?”
• Although only 1/3 of respondents who were aware of the planning process reported taking any action, the most common action was attending a meeting (70%), followed by speaking at a meeting (12%) and contributing to a web page (10%)—see Figure 5.
Figure 5: Distribution of actions taken during the wind project planning process
S U M M A R Y O F P R O J E C T R E S U L T S – 7 –
• Although almost five times as many individuals had a positive or very positive attitude toward their local project as compared to negative or very negative, only about twice as many actions were wholly supportive versus wholly opposing.
• Of those who spoke at a meeting, the ratio of those opposed to those supportive was roughly 1 to 1, despite the approximately 5 to 1 imbalance between those with positive (or very positive) attitudes and those with negative (or very negative) attitudes.
Annoyance to sound
Each survey respondent was asked, “Have you ever heard sound from the wind power project?”
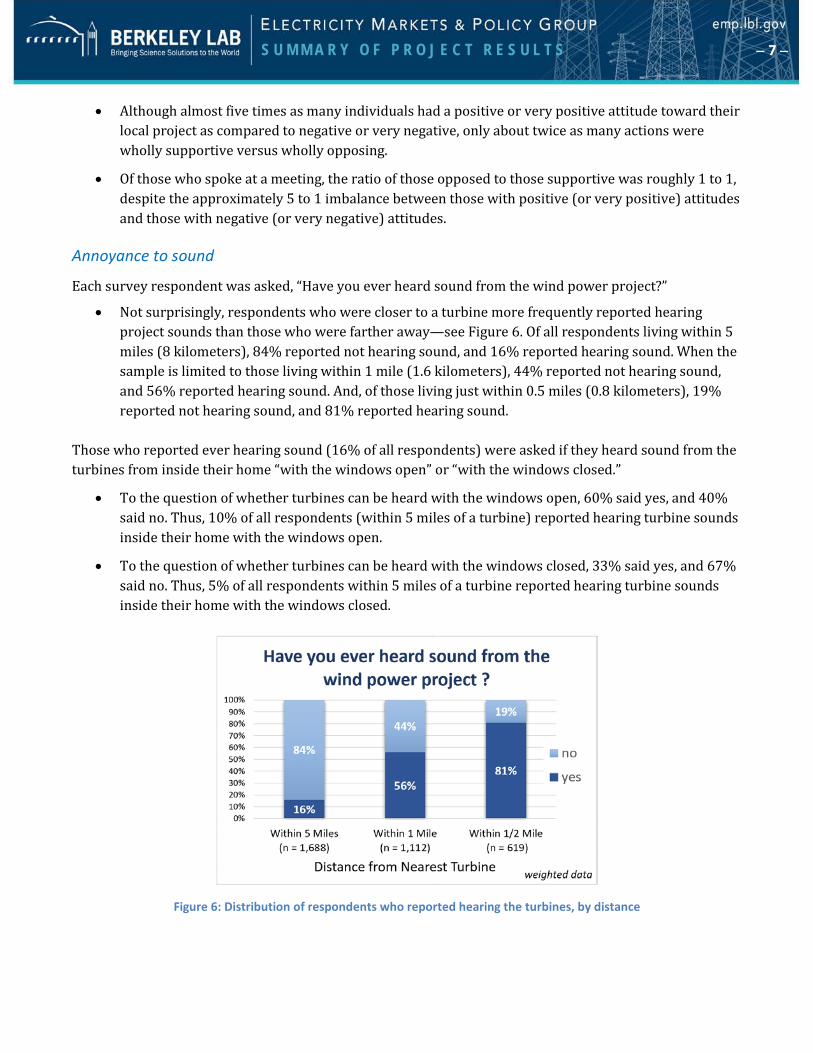
• Not surprisingly, respondents who were closer to a turbine more frequently reported hearing project sounds than those who were farther away—see Figure 6. Of all respondents living within 5 miles (8 kilometers), 84% reported not hearing sound, and 16% reported hearing sound. When the sample is limited to those living within 1 mile (1.6 kilometers), 44% reported not hearing sound, and 56% reported hearing sound. And, of those living just within 0.5 miles (0.8 kilometers), 19% reported not hearing sound, and 81% reported hearing sound.
Those who reported ever hearing sound (16% of all respondents) were asked if they heard sound from the turbines from inside their home “with the windows open” or “with the windows closed.”
• To the question of whether turbines can be heard with the windows open, 60% said yes, and 40% said no. Thus, 10% of all respondents (within 5 miles of a turbine) reported hearing turbine sounds inside their home with the windows open.
• To the question of whether turbines can be heard with the windows closed, 33% said yes, and 67% said no. Thus, 5% of all respondents within 5 miles of a turbine reported hearing turbine sounds inside their home with the windows closed.
Figure 6: Distribution of respondents who reported hearing the turbines, by distance
S U M M A R Y O F P R O J E C T R E S U L T S – 8 –
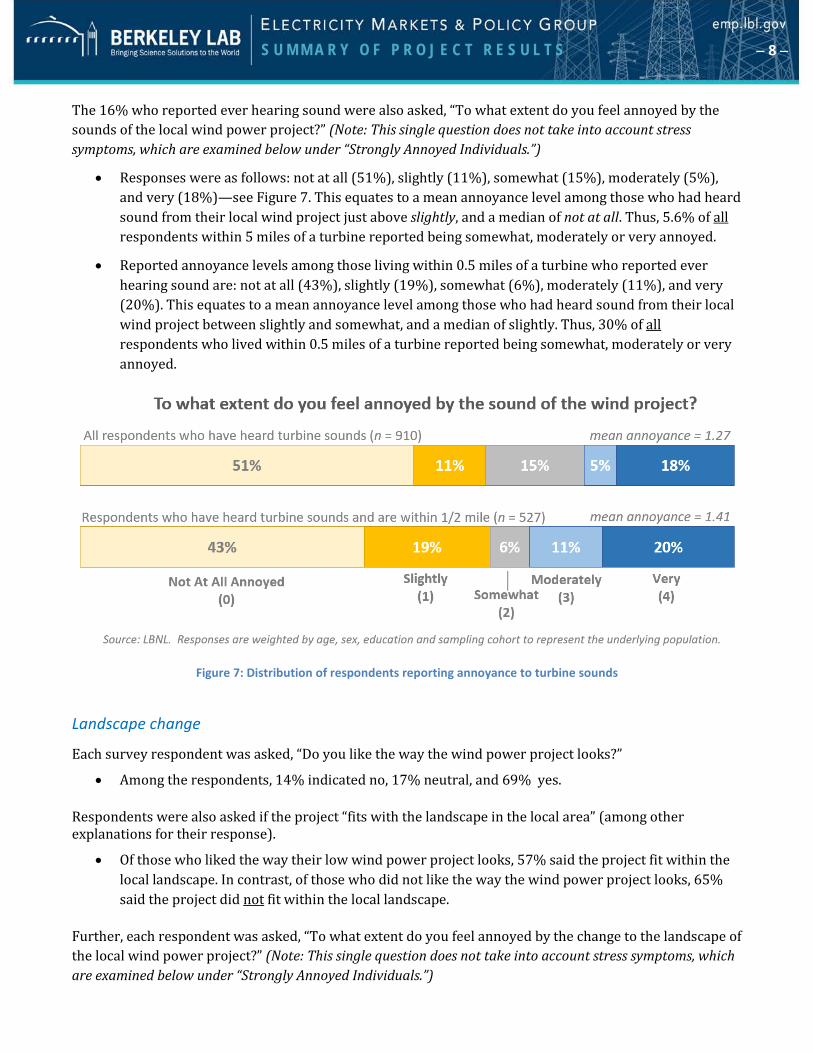
The 16% who reported ever hearing sound were also asked, “To what extent do you feel annoyed by the sounds of the local wind power project?” (Note: This single question does not take into account stress symptoms, which are examined below under “Strongly Annoyed Individuals.”)
• Responses were as follows: not at all (51%), slightly (11%), somewhat (15%), moderately (5%), and very (18%)—see Figure 7. This equates to a mean annoyance level among those who had heard sound from their local wind project just above slightly, and a median of not at all. Thus, 5.6% of all respondents within 5 miles of a turbine reported being somewhat, moderately or very annoyed.
• Reported annoyance levels among those living within 0.5 miles of a turbine who reported ever hearing sound are: not at all (43%), slightly (19%), somewhat (6%), moderately (11%), and very (20%). This equates to a mean annoyance level among those who had heard sound from their local wind project between slightly and somewhat, and a median of slightly. Thus, 30% of all respondents who lived within 0.5 miles of a turbine reported being somewhat, moderately or very annoyed.
Figure 7: Distribution of respondents reporting annoyance to turbine sounds
Landscape change
Each survey respondent was asked, “Do you like the way the wind power project looks?”
• Among the respondents, 14% indicated no, 17% neutral, and 69% yes. Respondents were also asked if the project “fits with the landscape in the local area” (among other explanations for their response).
• Of those who liked the way their low wind power project looks, 57% said the project fit within the local landscape. In contrast, of those who did not like the way the wind power project looks, 65% said the project did not fit within the local landscape.
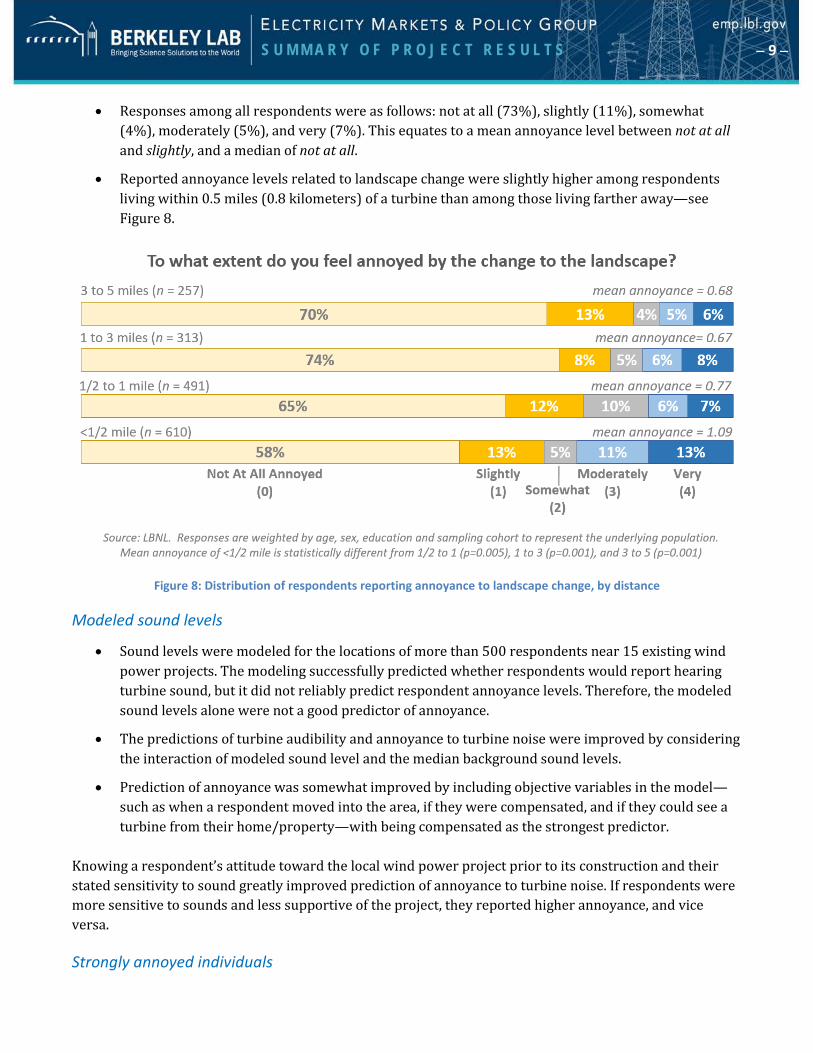
Further, each respondent was asked, “To what extent do you feel annoyed by the change to the landscape of the local wind power project?” (Note: This single question does not take into account stress symptoms, which are examined below under “Strongly Annoyed Individuals.”)
S U M M A R Y O F P R O J E C T R E S U L T S – 9 –
• Responses among all respondents were as follows: not at all (73%), slightly (11%), somewhat (4%), moderately (5%), and very (7%). This equates to a mean annoyance level between not at all and slightly, and a median of not at all.
• Reported annoyance levels related to landscape change were slightly higher among respondents living within 0.5 miles (0.8 kilometers) of a turbine than among those living farther away—see Figure 8.
Figure 8: Distribution of respondents reporting annoyance to landscape change, by distance
Modeled sound levels
• Sound levels were modeled for the locations of more than 500 respondents near 15 existing wind power projects. The modeling successfully predicted whether respondents would report hearing turbine sound, but it did not reliably predict respondent annoyance levels. Therefore, the modeled sound levels alone were not a good predictor of annoyance.
• The predictions of turbine audibility and annoyance to turbine noise were improved by considering the interaction of modeled sound level and the median background sound levels.
• Prediction of annoyance was somewhat improved by including objective variables in the model—such as when a respondent moved into the area, if they were compensated, and if they could see a turbine from their home/property—with being compensated as the strongest predictor.
Knowing a respondent’s attitude toward the local wind power project prior to its construction and their stated sensitivity to sound greatly improved prediction of annoyance to turbine noise. If respondents were more sensitive to sounds and less supportive of the project, they reported higher annoyance, and vice versa.
Strongly annoyed individuals

S U M M A R Y O F P R O J E C T R E S U L T S – 10 –
Individuals who reported being very, moderately, or somewhat annoyed and reported regular (at least monthly) health-related symptoms, which they attribute to turbines, were classified as “strongly annoyed” on an annoyance stress scale. Symptoms include “being in a bad mood,” “anger,” “lack of concentration,” “difficulty falling asleep,” and “otherwise not sleeping well.” For the statistics below, the sample was limited to those within 3 miles (4.8 kilometers) of a turbine, to conform to samples drawn from Europe, to which these data were compared. 7 (All figures above are not limited in this way).
• Of respondents living within 3 miles of a turbine, 2.3% qualified as strongly annoyed. When the results are broken down by reported source of annoyance, 1.1% of respondents living within 3 miles of a turbine were strongly annoyed because of sound, 1.5% because of landscape change, 1.2% because of lighting, and 0.2% because of shadow flicker—see Figure 9.
Figure 9: Percentage of respondents within 3 miles of a turbine who reported being strongly annoyed, by reason
• Compared with respondents who were not strongly annoyed, strongly annoyed respondents reported more negative attitudes toward wind projects, more annoyance with project planning processes, and perceptions that the planning process was less fair.
• Distance to the nearest turbine, A-weighted sound levels (dBA), and stated noise sensitivity are not shown to be correlated with being strongly annoyed.
Comparison between U.S. and European studies
Limiting U.S. respondents to those living within 3 miles (4.8 kilometers) of a turbine enables comparison between our U.S. study and three different European studies that included several identical questions.
• Similar mean levels of annoyance to sound were found in the U.S. and European studies.
• Compared with the European samples, the U.S. sample had slightly lower mean levels of annoyance to lighting, shadow flicker, and landscape change.
• The similarity between the U.S. and European results indicate similar reactions to turbines in different contexts and further add to the reliability of these findings.
7 The three European samples (Pohl et al. 2012, Pohl et al. 2018, Hübner and Löffler 2013) were concentrated within 3 miles (4.8 kilometers), thus limiting the U.S. sample to that distance is appropriate. The designs of the European studies differ from the design of the LBNL U.S. study. The European studies were not fully randomized (some included convenience samples), and they did not have the broad cross-sectional design employed in the LBNL study—that is, they were undertaken in a given European country or amounted to a case study of a particular wind power project.

S U M M A R Y O F P R O J E C T R E S U L T S – 11 –
Additional Information A Berkeley Lab 4-part webinar series, Understanding Wind Project Neighbors Through a National Survey of Attitudes, will be held every other Tuesday starting January 30, 2018 at 1 PM ET/10 AM PT. Dates and subjects are as follows: January 30th, 2018: “Overall Analysis of Attitudes of 1,700 Wind Power Project Neighbors” February 13th, 2018: “Wind Power Project Planning Process Fairness and Attitudes” February 27th, 2018: “Predicting Audibility Of and Annoyance To Wind Power Project Sounds Using Modeled Sound” March 13, 2018: “Comparing Strongly Annoyed Individuals with Symptoms near U.S. Turbines to Those in Surveyed European Communities” To register for the webinar series, to view abstracts and for more information, visit emp.lbl.gov/projects/wind-neighbor-survey. The survey data collected as part of this effort will be released in late 2018 to qualifying researchers. To receive notifications about further updates on this project, join our mailing list at emp.lbl.gov/mailing-list.
References of Papers Under This Project Rand, J. and Hoen, B. "Thirty Years of North American Wind Energy Acceptance Research: What Have We Learned?" Energy Research & Social Science, 29(July 2017), 2017, 135-148. Firestone, J., Hoen, B., Rand, J., Elliott, D., Hübner, G. and Pohl, J. "Reconsidering Barriers to Wind Power Projects: Community Engagement, Developer Transparency and Place." Journal of Environmental Policy & Planning, 2017, 1-17.

S U M M A R Y O F P R O J E C T R E S U L T S – 12 –
Other References noted Hübner, G. & Löffler, E. (2013). Wirkungen von Windkraftanlagen auf Anwohner in der Schweiz:
Einflussfaktoren und Empfehlungen. Institut für Psychologie der Martin-Luther-Universität Halle-Wittenberg, Halle (Saale).
Mai, T., Lantz, E., Mowers, M. and Wiser, R. H. (2017). The Value of Wind Technology Innovation: Implications for the U.S. Power System, Wind Industry, Electricity Consumers, and Environment. National Renewable Energy Laboratory. NREL/TP-6A20-70032.
Pohl, J., Hübner, G. & Mohs, A. (2012). “Acceptance and stress effects of aircraft obstruction markings of wind turbines.” Energy Policy, 50, 592−600.
Pohl, J., Gabriel, J. & Hübner, G. (2018). “Understanding stress effects of wind turbine noise ─ The integrated approach.” Energy Policy, 112, 119−128.
Wiser, R. and Bolinger, M. (2017). 2016 Wind Technologies Market Report. Lawrence Berkeley National Laboratory. Prepared for U.S. Department of Energy, Washington, DC. DOE/GO-102917-5033.
Wiser, R., Jenni, K., Seel, J., Baker, E., Hand, M., Lantz, E. and Smith, A. (2016). “Expert Elicitation Survey on Future Wind Energy costs.” Nature Energy, 1, 2016, 16135.
Disclaimer and Copyright Notice This document was prepared as an account of work sponsored by the United States Government. While this document is believed to contain correct information, neither the United States Government nor any agency thereof, nor The Regents of the University of California, nor any of their employees, makes any warranty, express or implied, or assumes any legal responsibility for the accuracy, completeness, or usefulness of any information, apparatus, product, or process disclosed, or represents that its use would not infringe privately owned rights. Reference herein to any specific commercial product, process, or service by its trade name, trademark, manufacturer, or otherwise, does not necessarily constitute or imply its endorsement, recommendation, or favoring by the United States Government or any agency thereof, or The Regents of the University of California. The views and opinions of authors expressed herein do not necessarily state or reflect those of the United States Government or any agency thereof, or The Regents of the University of California. Ernest Orlando Lawrence Berkeley National Laboratory is an equal opportunity employer.