Embed Size (px)
Citation preview

Community Attitudes to Wind Farms in NSW

Client Contacts
Dr Chris Briggs - State Coordinator, Renewable Energy Precincts
Polly Mitchell - Policy Officer, Climate Change, Air & Noise
NSW Department of Environment, Climate Change and Water
AMR Interactive Contacts
David Span - Research Director
Nina Mital - Group Account Director
Ogilvy House, 72 Christie Street, St Leonards, NSW 2065
Ph: 02 9020 6700
Email: [email protected]; [email protected]
Department of Environment, Climate Change and Water NSW
59-61 Goulburn Street Sydney 2000
PO Box A290 Sydney South 1232
Ph. 1300 361 967
DECCW 2010/947/ ISBN 978 1 74293 011 4
Project 3963 First published: 16 September 2010 Revised: 21 December 2010
© 2010 AMR Interactive
Disclaimer
This report was prepared by AMR Interactive in good faith exercising all due care and attention, but no representation or warranty, express or implied, is made as to the relevance, accuracy, completeness or fitness for purpose of this document in respect of any particular user’s circumstances. Users of this document should satisfy themselves concerning its application to, and where necessary seek expert advice in respect of, their situation. The views expressed within are not necessarily the views of the Department of Environment, Climate Change and Water NSW (DECCW) and may not represent DECCW policy.

Community Attitudes to Wind Farms in NSW
© 2010 AMR Interactive
Table of Contents
1.0 Executive summary ..........................................................................................7
2.0 Introduction .................................................................................................11
2.1 Background........................................................................................... 11
2.2 Research objectives ................................................................................ 13
3.0 Method........................................................................................................14
3.1 Residential survey .................................................................................. 14
3.2 Business survey ...................................................................................... 17
4.0 Results – Residential survey.............................................................................. 19
4.1 Demographic profile................................................................................ 19
4.2 Renewable energy .................................................................................. 23
4.3 Awareness and knowledge of wind farms....................................................... 26
4.4 Attitudes to wind power and wind farms ....................................................... 33
4.5 Support for wind farms ............................................................................ 38
4.6 Segmentation of supporters and opposers...................................................... 50
4.7 What is driving support for wind farms? – Residents.......................................... 53
4.8 What is driving support in each Precinct? ...................................................... 55
5.0 Precinct summaries........................................................................................56
5.1 Precinct overview................................................................................... 56
5.2 Precinct snapshots .................................................................................. 57
6.0 Results – Business survey .................................................................................64
6.1 Perceptions of local region........................................................................ 64
6.2 Renewable energy .................................................................................. 66
6.3 Awareness and knowledge about wind farms .................................................. 67
6.4 Attitudes to wind power and wind farms ....................................................... 71
6.5 Support and investment ........................................................................... 76
6.6 What is driving support for wind farms? – Businesses......................................... 81
7.0 Key findings and conclusions ............................................................................83
7.1 Familiarity with wind power ...................................................................... 83
7.2 Perceptions about wind power and its benefits and impacts ............................... 83
7.3 Level of support for wind farms.................................................................. 84
7.4 Driving support for wind farms ................................................................... 84
7.5 Segments ............................................................................................. 84
7.6 Precincts.............................................................................................. 85
7.7 Businesses in the Renewable Energy Precincts ................................................ 85
7.8 General conclusion ................................................................................. 85
8.0 Appendices ..................................................................................................86
8.1 Appendix A: Questionnaires ....................................................................... 86
8.2 Appendix B: Weighting ............................................................................101
8.3 Appendix C: Analysis ..............................................................................103

Community Attitudes to Wind Farms in NSW
© 2010 AMR Interactive
List of Tables
Table 1. Local Government Areas in the Renewable Energy Precincts............................ 14
Table 2. Example of table: Level of agreement that wind farms help increase tourism, by Precincts and regional control area ...................................................... 16
Table 3. Sampling of industries and groupings for analysis ......................................... 18
Table 4. Residency, location and size, by Precincts and regional control area ................. 19
Table 5. Ratings of aspects of local region, by Precincts and regional control area ........... 22
Table 6. Spontaneous awareness of clean energy sources, by Precincts and regional
control area....................................................................................... 23
Table 7. Spontaneous awareness of clean energy sources in Precincts, by gender and age .. 24
Table 8. Acceptable power sources for proposed power station, by Precincts and regional control area............................................................................ 25
Table 9. Acceptable power sources for proposed power station, by gender, age and area of residence....................................................................................... 25
Table 10. General awareness of wind farms, by Precinct and regional control area ............ 26
Table 11. Source of information about wind farms, by Precincts and regional control area (unprompted – multi-response) ............................................................... 29
Table 12. Perception of consultation about wind farms and adequacy of information, by Precincts and regional control area .......................................................... 30
Table 13. Information needs, by level of support/opposition to wind farms 1-2 km from residents, in the Precincts (unprompted - multi-response) .............................. 32
Table 14. Attitudes to wind power, by Precinct and regional control area ....................... 34
Table 15. Attitudes to wind farms in local region, by Precinct and regional control area...... 36
Table 16. Impact of wind farms on property values, visual appeal and noise, by Precinct and regional control area ...................................................................... 37
Table 17. Overall support for wind farms in the Precincts, by gender, age and area of residence, in the Renewable Energy Precincts ............................................. 43
Table 18. Relationship between support for wind farms 1-2 km from residence and visibility of an existing or planned wind farm from residence, across the Precincts .......................................................................................... 44
Table 19. Perceived benefits of wind farms by level of support/opposition to wind farms 1-2 km from residents, in the Renewable Energy Precincts (unprompted – multi-response ........................................................................................... 45
Table 20. Perceived concerns about wind farms, by level of support/opposition to wind farms 1-2 km from residents, in the Renewable Energy Precincts (unprompted – multi-response) .................................................................................. 46
Table 21. Segmentation of strong supporters and opposers in the Precincts ..................... 50
Table 22. Age profile of segments in the Precincts .................................................... 50
Table 23. Attitudinal dimensions for residents in the Precincts ..................................... 53
Table 24. Summary of the attitudes/perceptions in each precinct of greater importance in driving support and which are less favourably rated................................... 55

Community Attitudes to Wind Farms in NSW
© 2010 AMR Interactive
Table 25. Ratings of local region as a business manager, by business groupings ................. 65
Table 26. Spontaneous awareness of clean energy sources, by business groupings.............. 66
Table 27. Perception of power sources as acceptable, by business groupings .................... 66
Table 28. General awareness of wind farms, by business groupings................................ 67
Table 29. Source of information about wind farms, by business groupings (unprompted –
multi-response) .................................................................................. 68
Table 30. Consultation about potential wind farms and further information, by business groupings .......................................................................................... 69
Table 31. Information needs, by non-farming and farming industry groups (unprompted – multi-response) .................................................................................. 70
Table 32. Attitudes to wind power, by business groupings ........................................... 72
Table 33. Attitudes to wind farms in the region, by business groupings ........................... 74
Table 34. Impact of wind farms on business, property value visual appeal and noise, by business groupings ............................................................................... 75
Table 35. Overall support for wind farms, by business groupings ................................... 77
Table 36. Consideration of investment in wind farms and use of green energy, by non-farming businesses............................................................................... 78
Table 37. Approach or consideration on property, by farming businesses ......................... 78
Table 38. Benefits of wind farms to business, by support/opposition to wind farms being built 1-2 km from the business (unprompted – multi-response)......................... 79
Table 39. Concerns about wind farms to businesses, by support/opposition to a wind farm being built 1-2 km from business (unprompted – multi-response) ...................... 80
Table 40. Population distributions of residential survey by gender and age within Precinct .101
Table 41. Population distributions of residential survey by gender and education within Precinct...........................................................................................101
Table 42. Weighting of residential survey within the six Precincts ................................101
Table 43. Survey weights applied in the residential survey shown by gender and age within Precinct (before weighting by area) ................................................102
Table 44. Weighting of business survey by industry to approximate distribution across the Precincts .........................................................................................102
List of Figures
Figure 1. Global Cumulative installed capacity 1996-2008........................................... 11
Figure 2. Renewable Energy Precincts and location of approved and planned wind farms .... 12
Figure 3. Amount of time lived in area, by age group ................................................ 17
Figure 4. Amount of time lived in area, by Precincts and regional control area................. 20
Figure 5. Ratings of aspects of local region, in the Renewable Energy Precincts................ 21
Figure 6. Knowledge about wind farms, by Precincts and regional control area................. 27

Community Attitudes to Wind Farms in NSW
© 2010 AMR Interactive
Figure 7. Knowledge about wind farms, by gender, age and area of residence, in the Renewable Energy Precincts ................................................................... 28
Figure 8. Perception of consultation about wind farms and adequacy of information in the Precincts, by awareness in region and distance to nearest operating/planned wind farm ................................................................. 31
Figure 9. Attitudes to wind power in the Renewable Energy Precincts............................ 33
Figure 10. Attitudes to wind farms in local region, in the Renewable Energy Precincts ......... 35
Figure 11. Overall support for wind farms, in the Renewable Energy Precincts................... 38
Figure 12. Support for wind farms in NSW, by Precincts and regional control area .............. 39
Figure 13. Support for wind farms in local region, by Precincts and regional control area ..... 40
Figure 14. Support for wind farms 10 km from the residence, by Precincts and regional control area....................................................................................... 41
Figure 15. Support for wind farms 1-2 km from the residence, by Precincts and regional control area....................................................................................... 42
Figure 16. Support for wind farms 1-2 km from residence, by awareness in region and distance to nearest operating/planned wind farm, in the Renewable Energy Precincts .......................................................................................... 44
Figure 17. Positive ratings of questions on wind power, by segments across the Precincts ..... 51
Figure 18. Positive ratings of attitudes to wind farms, by segments across the Precincts ...... 52
Figure 19. Attitudinal and demographic drivers of support for wind farms across the six Precincts, showing the strength of relationship*........................................... 54
Figure 20. Driving support for wind farms in New England Tablelands: showing strength of importance of attitudes/perceptions and how favourably they were rated .......... 58
Figure 21. Driving support for wind farms in Upper Hunter: showing strength of importance of attitudes/perceptions and how favourably they were rated .......... 59
Figure 22. Driving support for wind farms in Central Tablelands: showing strength of importance of attitudes/perceptions and how favourably they were rated .......... 60
Figure 23. Driving support for wind farms in NSW/ACT Border Region: showing strength of importance of attitudes/perceptions and how favourably they were rated .......... 61
Figure 24. Driving support for wind farms in South Coast: showing strength of importance of attitudes/perceptions and how favourably they were rated ......................... 62
Figure 25. Driving support for wind farms in Cooma-Monaro: showing strength of importance of attitudes/perceptions and how favourably they were rated .......... 63
Figure 26. Perceptions of local region as a business manager, by businesses...................... 64
Figure 27. Attitudes to wind power, by businesses ..................................................... 71
Figure 28. Attitudes to wind farms in local region, by businesses ................................... 73
Figure 29. Overall support for wind farms, by businesses ............................................. 76
Figure 30. Drivers of support for wind farms, showing strength of importance and favourable rating of each measure*, by businesses ....................................... 82

Community Attitudes to Wind Farms in NSW
© 2010 AMR Interactive 7
1.0 Executive summary
Introduction
As part of its approach to reducing greenhouse gas emissions, the NSW Government has established
emissions reduction programs in a range of sectors. As outlined in the NSW State Plan, it has set targets to achieve 20% renewable energy consumption by 2020.
Six Renewable Energy Precincts have been established across NSW in areas with the best-known wind resources: New England Tablelands, Upper Hunter, Central Tablelands, NSW/ACT Border Region, South Coast and Cooma-Monaro. The Renewable Energy Precincts aim to prioritise and focus the delivery of the renewable energy projects.
NSW Department of Environment, Climate Change and Water commissioned AMR Interactive to undertake a study of the attitude of communities to wind farms and renewable energy across the six Renewable Energy Precincts.
The key objectives of the research were to:
1. Establish a baseline on community attitudes towards wind farms and renewable energy for purposes of evaluation; and
2. Provide results to inform the work of the Renewable Energy Precincts’ coordinators and advisory committees, and community debates.
The research surveyed 2022 residents aged 18 years or older across the six Renewable Energy Precincts and a control area in regional NSW. It also covered 300 businesses across the six precincts. The research was undertaken via telephone interviews over May and June 2010.
Key findings
Familiarity with wind power
Wind power was well established top-of-mind, with over half (59%) of residents of the Precincts naming it spontaneously as a clean energy source, second only to solar power. Residents were far less likely to be familiar with other clean energy sources such as water, gas and bioenergy, mentioned by less than a quarter (18%) of residents.
Wind power was also widely regarded as acceptable for power generation by over three quarters (81%) of the population, when residents were asked specifically. This was second only to solar power which was almost universally accepted (95%).
The high level of familiarity is also demonstrated by the fact that almost everyone (97%) in the Precincts, and the rest of regional NSW, had heard about wind farms or wind turbines to generate electricity, and over three quarters (81%) had seen a wind farm or wind turbine (which could be in person or in the media). A majority (68%) of residents of the Precincts reported they knew about wind farms currently operating in NSW. Awareness was much higher in NSW/ACT Border Region (95%), Central Tablelands (90%) and Cooma-Monaro (85%). By contrast, residents of New England Tablelands (38%) were the least likely to report awareness.
While awareness of wind farms being planned or under construction was limited to less than a third (28%) of residents of the Precincts overall, residents of Upper Hunter (54%), Cooma-Monaro (53%) and NSW/ACT Border Region (47%) were relatively more likely to be aware of planned wind farms.
It is worth noting that a majority of residents expressed interest in finding out more about aspects of wind farms. The most common issues mentioned were around noise, location of wind farms, impact on the environment and community and effectiveness of power generation.

Community Attitudes to Wind Farms in NSW
© 2010 AMR Interactive 8
A third (33%) of residents of the Precincts were aware of the NSW Government’s initiative for setting up Renewable Energy Precincts, although few overall (16%) considered that there had been adequate consultation. Awareness of the Government’s initiative was higher among residents who were aware of a wind farm operating or planned in their local region, especially if it was 5 kilometres (50%) away. A perception of adequate consultation also increased with greater awareness and closer proximity. A majority (60%) of residents aware of a wind farm operating or planned within 20 kilometres said that there had been adequate engagement.
Perceptions about wind power and its benefits and impacts
Residents widely acknowledged that wind power has lower greenhouse gas emissions than coal or gas and that NSW is well positioned with resources. There was, however, less understanding or greater uncertainty about efficiency and reliability of wind power, and about whether wind power was the cheapest renewable energy source.
There was also broad acknowledgement that wind farms would benefit the local community and can boost employment and the economy. Consistent with this, there was broad endorsement of more wind farms being built in the local region and of more active involvement of the local councils to encourage wind farms. Only about a third (32%) of residents, however, believed that wind farms would contribute to an increase in tourism.
About two thirds (69%) of residents did not perceive any health concerns, while on the issue of safety concerns opinion was more polarised. Residents were also divided in their views on impacts of wind farms on both property values and visual appeal of the area, and on concern about noise. Furthermore, the majority (62%) of residents did not perceive a negative impact on the environment, while opinion was divided on the issue of heritage values.
Level of support for wind farms
The large majority of residents across the Precincts indicated they would support wind farms being built both in NSW (85%) as well as in their local region (80%). The majority of residents of the Precincts were supportive of wind farms being built in the vicinity of their residence. Over three quarters (79%) supported wind farms being built 10 kilometres from their residence, and more than half (60%) supported them at 1-2 kilometres. Overall support at 1-2 kilometres tended to be lower in two of the Precincts: New England Tablelands (54%) and Upper Hunter (44%).
85
80
79
60
0 20 40 60 80 100
In NSW
In local region
10 km from residence
1-2 km from residence
% of residents
Total Support
Residents opposing wind farms being built 1-2 kilometres from their residence were much more likely than supporters to identify concerns about noise and the impact on the landscape, and much less likely to identify benefits of wind farms such as reducing pollution, and improving the community and economy. Notably, over two thirds (68%) of residents opposing wind farms at 1-2 kilometres still saw an overall benefit of wind farms to the local region.

Community Attitudes to Wind Farms in NSW
© 2010 AMR Interactive 9
What drives support for or opposition to wind farms 1-2 km from place of residence?
The relationship between the level of support/opposition for wind farms 1-2 kilometres from place of residence and a range of attitudinal, perceptual, demographic and geographic measures captured in the study was analysed. It was found that the most important drivers of support for wind farms were attitudinal:
• attitudes towards the economic and community benefits of wind farms;
• the perceived visual and noise impacts;
• other concerns about health, safety and heritage values; and
• perceptions of wind power relating to clean energy and its potential in NSW.
Proximity to wind farms was also found to be of some importance, while demographic characteristics such as Precinct, gender and age had relatively low influence on level of support.
Key attitudes driving support were benefit to the local community and concerns about noise.
Segmentation of supporters and opposers
Residents in the Precincts were segmented into three groups based on their support or opposition to wind farms (a) in NSW and (b) 1-2 kilometres from their residence.
1. Strong Supporters (60%), supporting wind farms both in NSW and at 1-2 kilometres, were more likely than the NSW-Only Supporters to see wind power as a feasible source of energy, and efficient/reliable. The Strong Supporters were more positive than the NSW-Only Supporters on all impacts and benefits of wind farms asked in the survey.
2. NSW-Only Supporters (27%), supporting wind farms in NSW but not at 1-2 kilometres rated moderately lower than the Strong Supporters on most attitude and perceptions. The strongest difference was in potential concern about noise, and this was the only feature on which the NSW-Only Supporters were as negative as the Opposers. There was little difference between the segments on awareness of wind power as a clean energy source and knowledge of wind farms.
3. Opposers (13%), not supporting wind farms either in NSW or at 1-2 kilometres, were very much less likely to consider wind power as an acceptable energy source, doubting its efficiency/reliability and much less accepting of the resources in NSW. The Opposers were also very much less positive about all the potential impacts and benefits of wind farms.
The segments also differed in their age profiles, most noticeable in a decrease in the incidence of those aged 65 years and over as support increased. About a third (32%) of Opposers were aged 65 years and over compared with less than a fifth (17%) of Strong Supporters. There was a corresponding increase in the incidence of those aged 18-29 years as support increased.
Businesses in the Renewable Energy Precincts
Businesses in the six Renewable Energy Precincts showed high levels of awareness and familiarity, and a positive outlook to wind power. These were very similar to the findings among residents.
Attitudes to wind power were also consistent with those seen among residents, except that businesses were less likely to regard wind power as cheaper and less likely to believe wind farms would boost employment in the local economy.
Among non-farming businesses, about a third (30%) anticipated positive effects on their business, while more than half (61%) believed there would be no impact. Few (8%) considered that there could be a negative impact or were undecided. Opinion was divided on visual impact of wind farms, impact on property values and concerns about noise. Farming businesses were more likely to

Community Attitudes to Wind Farms in NSW
© 2010 AMR Interactive 10
spontaneously express concern about the location of wind farms, and were more concerned about noise (58% having at least some concern compared with 35% of non-farming businesses). Nevertheless, over half (57%) of farming businesses would consider wind farms on their property.
The level of support for wind farms in the state, in the local region, 10 kilometres and 1-3 Kilometres from the business was widespread, and similar to that shown by residents.
88
83
82
60
0 20 40 60 80 100
In NSW
In local region
10 km from residence
1-2 km from residence
% of residents
Total Support
The strongest drivers of support for wind farms 1-2 kilometres from their business were found to be similar to those seen among residents, with noise concerns and benefit to the local community prominent.
Conclusion
The research indicates that there was substantial support and backing for wind farms in the state, in the local region and even up to 10 kilometres from the place of residence. Support reduced when considering wind farms closer to home, although a majority (60%) still supported wind farms at a distance of 1-2 kilometres from their residence.
While overall acceptability of wind power was high, a significant number of residents of the Precincts (30-40%) had concerns about noise, negative visual impact, negative impact on property prices, safety concerns and heritage values. In addition, proximity to a wind farm reduced the level of support.

Community Attitudes to Wind Farms in NSW
© 2010 AMR Interactive 11
2.0 Introduction
2.1 Background
Global trends in wind power and Australia’s position
Wind energy technology has matured over the last 15 years with improvements in power ratings, efficiency and reliability as well as generation costs falling significantly and moving closer to those of conventional energy sources. This makes wind energy a viable option, especially with the growing demand for renewable energy. Globally, wind power capacity has grown at an average rate of 30% over the last ten years and global installed capacity stood at 120 GW at the end of 2008 (Figure 1)
1.
Figure 1. Global Cumulative installed capacity 1996-2008
Source: Global Wind Energy Council
The United States is now the largest wind power market followed by Germany, Spain, China, India, Italy, France, UK, Denmark and Portugal who are the top ten wind energy producers in the world. In the United States, wind accounted for 42% of all new power generation capacity added in 2008
2.
Australia has some of the world’s best wind resources and in 2009 wind capacity increased by 31%. Currently, wind power generation stands at approximately 5 GWh of electricity annually.
3
The installed renewable energy capacity in Australia is 16% of total energy capacity. Of this total renewable energy capacity, wind energy accounts for 16%.
Currently there are 52 operating wind farms in Australia, with a total of 1,011 operating turbines. South Australia has the largest installed capacity with around 45 per cent of the nation’s total capacity, followed by Victoria (23%), Western Australia (12%), NSW (11%) and Tasmania (9%)
4.
Current state of play in NSW
As part of its emissions reduction strategy, the NSW Government has established emissions reduction programs in a range of sectors. As outlined in the NSW State plan, it has set targets to achieve 20% renewable energy consumption by 2020.
This is aligned with the expanded national renewable energy target (RET) of 20% by 2020 and the NSW Government is positioning the state to take advantage of the predicted increase in investment
1 Source: Global Wind Energy Council 2 Source: American Wind Energy Association: Wind Power Outlook 2009 3 Source: Clean Energy Council – Wind Power Fact Sheet 2010 4 Source: Clean Energy Council – Clean Energy Australia 2009

Community Attitudes to Wind Farms in NSW
© 2010 AMR Interactive 12
that is expected to accompany this. Initially it is expected that most of the renewable energy supply will be met by wind energy developments.
As part of the reforms introduced to attract new investment in renewable energy:
1. Projects with the capacity of 30 megawatts or more will be deemed 'critical infrastructure' and will benefit from waived development application fees until 30 June 2011, and a commitment to manage planning approvals within four months. Dedicated renewable energy staff will also be put in place to help drive regional initiatives.
2. Six Renewable Energy Precincts have been established across NSW in areas with the best-known wind resources: New England Tablelands, Upper Hunter, Central Tablelands, NSW/ACT Border Region, South Coast and Cooma-Monaro (Figure 2).
In all, 11 wind farms with a total of 972 turbines have been approved in NSW since June 2005.
Figure 2. Renewable Energy Precincts and location of approved and planned wind farms

Community Attitudes to Wind Farms in NSW
© 2010 AMR Interactive 13
2.2 Research objectives
The NSW Department of Environment, Climate Change and Water commissioned AMR Interactive to undertake a study of the attitude of communities to wind farms and renewable energy across the six Renewable Energy Precincts.
The key objectives of the research project were to:
1. Establish a baseline on community attitudes towards wind farms and renewable energy for purposes of evaluation; and
2. Provide results to inform the work of the Renewable Energy Precincts’ coordinators and advisory committees, and community debates.
These in turn would be used to evaluate the impact of the Renewable Energy Precincts initiative and inform the work of the Renewable Energy Precincts’ coordinators and advisory committees, and community debates. In assessing community attitudes, the research set out to cover:
• perceptions and preferences towards renewable energy and wind farms;
• awareness of currently operating or proposed wind farms in the residents; area; and
• attitudes about wind power including the impacts, advantages and disadvantages.
The research also aimed at identifying the relationship between key variables and overall acceptance of wind energy including:
• demographics (e.g., age and gender);
• proximity to proposed or currently operating wind farms, and
• type of area (e.g., township, rural residential or farming).

Community Attitudes to Wind Farms in NSW
© 2010 AMR Interactive 14
3.0 Method
3.1 Residential survey
Precincts and respondents
The survey covered the six Renewable Energy Precincts, along with an additional control area covering other regional areas of NSW (other than Broken Hill, where a wind farm is currently operating). The Local Government Areas in each Precinct are listed in Table 1. Postcodes were assigned to each Precinct on the basis that 85+% of the population in that postcode fell into the Precinct, based on concordance information published by the Australian Bureau of Statistics from 2006 census data.5 Households were sampled from a database of household telephone numbers.6 A minimum sample size of 286 respondents aged 18 years and over was set for each of the Precincts and the control area, and the final total survey sample size was 2022. Equal sample sizes were set in the Precincts to enable the same level of precision in the analysis of each.
Table 1. Local Government Areas in the Renewable Energy Precincts
Precinct Local Government Areas Share of Population
in the Precincts
P1 New England Tablelands
Armidale Dumaresq
Glen Innes Severn
Gunnedah
Guyra
Gwydir
Inverell
Liverpool Plains Moree Plains
Narrabri
Tamworth
Tenterfield
Uralla
Walcha
24%
P2 Upper Hunter Upper Hunter
Dungog
Warrumbungle 4%
P3 Central Tablelands
Bathurst
Blayney
Cabonne
Cowra
Lithgow
Mid-Western Regional
Oberon
Orange
Wellington
22%
P4 NSW/ACT Border Region
Boorowa
Cootamundra
Goulburn Mulwaree
Gundagai
Harden
Junee
Palerang
Tumut
Upper Lachlan
Weddin
Yass Valley
Young
15%
P5 South Coast Bega Valley
Eurobodalla
Kiama
Shoalhaven
Shellharbour
32%
P6 Cooma-Monaro Bombala
Cooma-Monaro
Snowy River
Tumbarumba
3%
5 2905.0.55.001 – ABS Postal Area Concordances, Aug 2006 6 The database is managed by Sample Pages (recommended by the Australian Market and Social Research organisation (AMSRO))

Community Attitudes to Wind Farms in NSW
© 2010 AMR Interactive 15
Questionnaire
The questionnaire for the survey was designed to cover a range of issues on awareness, knowledge and attitudes regarding wind power and wind farms. A draft of the questionnaire was pre-tested with 10 participants from the Precincts. The interviews involved a researcher administering the questionnaire individually to a participant, then probing the participant on a number of issues about the meaning and structure of questions.
The final questionnaire covered:
• demographic profile of respondents;
• ratings of the local area;
• awareness of renewable energy and acceptability of different power sources;
• general awareness and knowledge regarding wind farms and sources of information;
• attitudes to wind power and wind farms in NSW;
• attitudes to wind farms in the local region;
• perceived positive and negative impacts of wind farms; and
• the perceived adequacy of consultation and information about wind farms, and areas in which information would like to be received.
A copy of the questionnaire is included in Appendix A.
Implementation and analysis
The survey was administered by telephone during May-June 2010. Households in each area were randomly selected and an adult in each household was selected systematically for surveying. During the survey, age and gender quotas were set in each Precinct to ensure a sufficient spread of age groups in the sample for weighting and analysis. The distribution of in town/out of town households in each Precinct was based on the distribution of telephone numbers.
The sample in each Precinct and the control area was weighted to ABS 2006 census data by gender, age, and level of education (degree and no degree) (see Appendix B). Each Precinct was weighted to the overall population distribution across the Precincts, in order to report overall results.
In general, results are reported for the following groupings:
• the overall population across the six Precincts;
• the regional control area; and
• individually for the six Precincts.
In addition, the results were assessed by demographic groupings:
• gender;
• age group (18-29 years, 30-44 years, 45-64 year, 65+ years); and
• type of residence (in town, out of town: residential property or farming property).

Community Attitudes to Wind Farms in NSW
© 2010 AMR Interactive 16
Presentation of results
Results are shown as percentages. An example of a table of results is shown in Table 2. The table shows the percentage of residents agreeing with the statement. Results are shown weighted across the six Renewable Energy Precincts and for the Regional Control Area, followed by the results for each of the six individual Precincts. As an example, New England Tablelands, 4% ‘strongly agree’ and 27% ‘agree’. The ‘total agree’ is also shown, adding the two levels of agreement. When adding
two or more percentages in this way, there may be a rounding difference of ±1%. That is, the total may differ by 1% from the straight sum of the individual percentages. Where the full results for a question are shown, as in the example in Figure 3, the whole set may add up to 99% or 101%.
The unweighted number of respondents (n=###) in each Precinct/area answering the question is shown for reference. Results in charts show the percentage distribution horizontally in the bars.
Chi-squared tests of statistical significance have been used to explore differences between Precincts, and demographic groups for each question. A statistically significant result means that there are differences in the results between the groups being compared (e.g., between the Precincts, between males and females), so at least one of the groups can be considered as differing from the others. These differences are illustrated:
• in tables, by highlighting groups which have higher results and lower agreement compared to the other groups. So in Table 2 Central Tablelands and NSW/ACT Border Region have higher agreement, while Upper Hunter has higher disagreement; and
• in charts, using arrows to highlight groups which have higher (�) results and lower (�) results compared to the other groups. So in Figure 3 18-29 year olds have been highlighted as having lower knowledge, and 45-64 and 65+ year olds as having higher knowledge.
Information about these tests, as well as other analyses conducted, are included in Appendix C.
Table 2. Example of table: Level of agreement that wind farms help increase tourism, by Precincts and regional control area
Wind farms will help increase tourism
Renewable Energy
Precincts (n=1729)
Regional Control
Area (n=293)
New England
Tablelands (n=289)
Upper Hunter (n=286)
Central Tablelands
(n=290)
NSW/ACT Border Region (n=287)
South Coast
(n=291)
Cooma-Monaro (n=286)
% % % % % % % %
Agree 32 32 31 24 40 37 27 32
Disagree 55 56 55 63 49 50 60 59
Don’t know 13 12 14 13 11 12 13 10
Base: All respondents Statistically significant difference between groups: highlighting higher and lower agreement Q20. Please tell me to what extent you agree or disagree with each statement

Community Attitudes to Wind Farms in NSW
© 2010 AMR Interactive 17
Figure 3. Amount of time lived in area, by age group
6
14
17
16
37
42
46
41
45
38
34
33
9
5
2
8
3
1
1
3
0 20 40 60 80 100
18-29 (n=195)
30-44 (n=408)
45-64 (n=717)
65+ (n=409)
% of residents
A lot Moderate amount A little Only heard term Not heard
Base: Respondents in Precincts Statistically significant difference between groups: highlighting higher=�, lower=� knowledge Q11. Before this survey, how much did you know about wind farms?
3.2 Business survey
Respondents
The survey of the general community was supplemented by a survey of 300 businesses employing staff across the six Precincts. The distribution of businesses was consistent with the population of businesses across the Precincts.
The Agriculture industry makes up over a quarter (28%) of employing businesses across the Precincts.7 Farming is a distinct type of business for the topic of wind farms, as the wind farms are often placed on farming properties. Given this relationship, and the relatively large number of farming managers covered in the general residential survey, it was decided to focus on non-farming businesses in the supplementary survey of businesses. The results for the farming business from the community survey were then included in the analysis. Businesses were sampled from lists of business in the postcodes in the relevant Local Government Areas.
Questionnaire
The questionnaire for the businesses was based primarily on the questionnaire for the residential survey. Some additional questions were included on green energy, and perceived impact of wind farms on the business. A copy of the questionnaire is included in Appendix A.
Implementation and analysis
The survey was administered by telephone during May-June 2010. Quotas were set to ensure a reasonable profile of businesses by industry. The final sample was weighted by industry based on Australian Bureau of Statistics business statistics for the Precinct areas.7 (See Appendix C for details of the weighting.) The industries were grouped for analysis purposes, building to a sample size of at least 50 in each group (Table 3). The order of groupings presented in Table 3 appears in each table of results for the survey. Issues about presentation of results discussed for the residential survey also apply, including presentation of percentages, rounding of results, and tests of statistical significance (refer to Appendix B for more details on the analysis).
7 8165.0 - Counts of Australian Businesses
Age Group (years)
�
�
�

Community Attitudes to Wind Farms in NSW
© 2010 AMR Interactive 18
Comparisons have been made between the non-farming and farming sectors; and among the industry groupings. The same approach to highlighting differences in tables and charts as was described for the residential survey on pages 16-17 has been used for the business survey.
Table 3. Sampling of industries and groupings for analysis
Industry Grouping Industries Survey Sample
Weighted Distribution
Total Businesses 419 100%
Non-Farming Sector 289 75%
Industrial, Manufacturing, Transport Mining
Agriculture (non-farming)
Manufacturing
Construction
Transport and Storage
79 26%
Retail, Wholesale Wholesale Trade
Retail Trade
75 18%
Business Services Communication Services
Finance and Insurance
Property and Business Services
57 15%
Community, Personal, Hospitality Accommodation Cafes and Restaurants
Education
Health and Community Services
Cultural and Recreational Services
Personal and Other Services
78 16%
Farming Sector (primarily from the residential survey) 130 25%

Community Attitudes to Wind Farms in NSW
© 2010 AMR Interactive 19
4.0 Results – Residential survey
4.1 Demographic profile
Residence and tenure in the local area
Residents were asked about whether they lived in or out of town, and how long they had resided in the area
The majority of residents of each of the Precincts reported living in town (64%), with a third (36%) living out of town (Table 4). Overall, less than a quarter (21%) lived out of town on residential properties, and farming properties (15%). The profile of residents of the control area was very similar. The profile for the South Coast differed most with nearly half (46%) of residents reporting living out of town. Residents of the South Coast were the most likely to live on a residential property (39%) and the least likely to live on a farming property (7%). A quarter of residents of Cooma-Monaro (27%) and Upper Hunter (25%) lived on a farming property.
The majority of residents of the Precincts had lived in the local area for over 10 years (63%) (Figure 4). Residents of Cooma-Monaro were the most likely to have lived longest (74% over 10 years), while residents of NSW/ACT Border Region and of South Coast were less likely to be longer term residents (59% over 10 years).
Table 4. Residency, location and size, by Precincts and regional control area
Residence
Renewable Energy
Precincts (n=1729)
Regional Control Area
(n=293)
New England
Tablelands (n=289)
Upper Hunter (n=286)
Central Tablelands
(n=290)
NSW/ACT Border Region (n=287)
South Coast
(n=291)
Cooma-Monaro (n=286)
% % % % % % % %
In town 64 67 70 64 67 71 54 63
Out of town - residential
21 22 11 11 17 11 39 10
Out of town - farming
15 10 20 25 15 17 7 27
Base: All respondents Statistically significant difference between groups: highlighting higher and lower results Q3. Do you live in or out of town? Q3b. Is it a residential or farming property?

Community Attitudes to Wind Farms in NSW
© 2010 AMR Interactive 20
Figure 4. Amount of time lived in area, by Precincts and regional control area
6
5
4
4
5
7
8
4
15
17
17
14
19
13
11
10
17
22
13
14
12
21
22
12
21
20
19
21
24
16
23
22
42
37
48
47
41
43
36
52
0 20 40 60 80 100
Renewable Energy Precincts (n=1729)
Regional Control Area (n=293)
New England Tablelands (n=289)
Upper Hunter (n=286)
Central Tablelands (n=290)
NSW/ACT Border Region (n=287)
South Coast (n=291)
Cooma-Monaro (n=286)
% of residents
Less than 2 years 2 to 5 years A little 11 to 20 years More than 20 years
Base: All respondents Q4. How long have you lived in the area? Statistically significant difference between groups: highlighting higher=�, lower=� period
Precincts
�
�

Community Attitudes to Wind Farms in NSW
© 2010 AMR Interactive 21
Perceptions of the local region
Residents were asked to rate how well their local region performs on a number of socio-economic issues
Residents’ perceptions of their local region on a number of socio-economic issues are summarised in Figure 5. The best rated issues were the overall standard of living and the local environment. These were rated as good or excellent by the majority of residents in each Precinct (Table 5).
Access to services such as health and education, and the overall health of the local economy, were rated good or excellent by close to half of residents of each Precinct.
Local regions were rated least favourably on employment opportunities, with less than a quarter (22%) overall perceiving their local region as excellent or good. Residents of Central Tablelands however, were more likely than residents of the other Precincts to see overall health of the local economy (54%) employment opportunities (37%) and as at least good. Residents of South Coast were
the least likely to rate overall health of the local economy (31%) employment opportunities (11%) as good.
Figure 5. Ratings of aspects of local region, in the Renewable Energy Precincts
14
13
11
6
4
48
50
35
36
18
30
31
32
38
29
4
5
16
15
32
1
1
4
2
13
3
1
1
4
5
0 20 40 60 80 100
Local environment
The overall standard of living
Access to services such as health and education
The overall health of the local economy
Employment opportunities
% of residents
Excellent Good Average Poor Very poor Don't know
Base: Respondents in Precincts Q6. How would you rate your region on these issues?

Community Attitudes to Wind Farms in NSW
© 2010 AMR Interactive 22
Table 5. Ratings of aspects of local region, by Precincts and regional control area
REGIONAL NSW PRECINCT
Local region
Renewable Energy
Precincts (n=1729)
Regional Control
Area (n=293)
New England Tablelands
(n=289)
Upper Hunter (n=286)
Central Tablelands
(n=290)
NSW/ACT Border Region (n=287)
South Coast
(n=291)
Cooma-Monaro (n=286)
% % % % % % % %
The overall standard of living
Excellent/Good 63 61 62 58 72 63 59 57
Average/Poor 37 38 37 41 27 38 41 42
Don’t know 1 1 1 0 0 1 1 1
Local environment
Excellent/Good 62 59 62 64 59 61 62 59
Average/Poor 36 40 36 33 38 37 34 40
Don’t know 3 1 2 3 3 2 4 2
Access to services such as health and education
Excellent/Good 46 45 47 41 54 50 40 41
Average/Poor 53 54 52 58 45 50 58 57
Don’t know 1 2 2 0 0 0 2 1
The overall health of the local economy
Excellent/Good 41 35 46 39 54 40 31 37
Average/Poor 55 61 51 56 43 58 65 59
Don’t know 4 4 3 6 3 2 4 5
Employment opportunities
Excellent/Good 22 21 27 19 37 22 11 20
Average/Poor 73 73 69 77 59 75 84 75
Don’t know 5 6 3 4 5 3 6 5
Base: All respondents Statistically significant difference between groups: highlighting higher and lower positive ratings Q6. How would you rate your region on these issues?

Community Attitudes to Wind Farms in NSW
© 2010 AMR Interactive 23
4.2 Renewable energy
Spontaneous awareness of clean energy sources
Residents were asked to mention, unprompted, the clean energy sources they were aware of.
Solar power was spontaneously mentioned as a clean energy source by three quarters (74%) of residents across the Precincts (Table 6). Wind power was the next most mentioned, by over half (59%) of residents. Both of these forms of alternative energy were by far the most well known, compared to other forms of alternative energy that were mentioned.
In contrast, other clean energy sources were mentioned by no more than a quarter of residents: water/hydroelectric (18%), gas (14%), wave/tidal (12%), nuclear (10%), geothermal (8%), clean coal (6%) and bio-energy/bio-electric (5%). Even fewer (16%) were unable to name any clean energy sources spontaneously.
Wind power as a clean source of energy was more likely to be mentioned spontaneously by residents of Cooma-Monaro (70%) and Central Tablelands (68%). Residents of New England Tablelands (48%) were least likely to mention wind power (Table 6). In contrast, residents of Cooma-Monaro were the most likely to refer to water/hydroelectric power (34% compared with 15-22% in the other Precincts), which would be influenced by familiarity with the Snowy Mountains hydroelectric scheme.
Spontaneous awareness of wind power was much higher among those residing on farming properties (70%) compared with those living in town (57%) or out of town on residential properties (57%) (Table 7). Males were more likely than females to identify a number of types of clean energy, including both solar power (81% compared with 67%) and wind power (70% compared with 48%). Spontaneous awareness of wind power was highest among residents aged 30-44 years old (66%) and 45-64 years (66%) and lowest among those aged 65 years and older (43%).
Table 6. Spontaneous awareness of clean energy sources, by Precincts and regional control area
REGIONAL NSW PRECINCTS
Energy source
Renewable Energy
Precincts (n=1729)
Regional Control
Area (n=293)
New England
Tablelands (n=289)
Upper Hunter (n=286)
Central Tablelands
(n=290)
NSW/ACT Border Region (n=287)
South Coast
(n=291)
Cooma-Monaro (n=286)
% % % % % % % %
Sun or solar 74 77 74 73 76 75 71 77
Wind 59 57 48 67 68 63 56 70
Water or hydroelectric
18 22 15 15 22 19 17 34
Gas 14 21 17 15 14 15 12 13
Wave or tidal power
12 9 8 9 9 12 19 12
Nuclear 10 10 10 7 14 10 8 7
Geothermal 8 8 8 8 10 9 6 12
Clean coal 6 9 5 8 9 6 6 7
Bioenergy/ bioelectric
5 2 3 3 4 4 6 4
Other 4 5 3 4 4 4 4 6
Don't know 16 12 18 13 13 13 19 8
Base: All respondents Statistically significant difference between groups: highlighting higher and lower responses Q7. Which clean energy sources are you aware of (unprompted)?

Community Attitudes to Wind Farms in NSW
© 2010 AMR Interactive 24
Table 7. Spontaneous awareness of clean energy sources in Precincts, by gender and age
GENDER AGE GROUP RESIDENCE
Energy source
Male (n=849)
Female (n=880)
18-29 (n=195)
30-44 (n=408)
45-64 (n=717)
65+ (n=409)
In town
(n=1097)
Out -residential
(n=296)
Out- farming (n=336)
% % % % % % % % %
Sun or solar 81 67 70 77 79 65 72 75 81
Wind 70 48 52 66 66 43 57 57 70
Water or hydroelectric
23 14 27 18 17 15 18 18 19
Wave or tidal
18 7 9 12 15 11 14 16 14
Nuclear 14 6 8 8 11 11 12 13 14
Gas 13 16 14 12 14 18 9 10 12
Geothermal 11 5 6 9 11 5 7 9 14
Clean coal 8 4 4 7 7 7 6 7 7
Bioenergy/ bioelectric
6 4 6 4 5 3 4 6 6
Other 5 3 1 5 4 4 3 4 6
Don't know 9 22 22 13 12 22 17 16 10
Base: Respondents in Precincts Statistically significant difference between groups: highlighting higher and lower responses Q7. Which clean energy sources are you aware of (unprompted)?
Acceptable power sources
Residents were asked which of a given list of power sources were acceptable to them if a new power station was to be built in their local region.
Solar power was an almost universally acceptable power source (95%) for a new power station (Table 8). Wind power was the next most acceptable source, by over three quarters (81%) of residents overall.
A majority of residents were also accepting of water/hydroelectric (75%) and gas (69%) as power sources. Conventional coal and nuclear power were considered least acceptable, and no more than a third of residents would assent to a power station in their local region based on these (33% and 24% respectively).
There was little difference in acceptability of wind power between the Precincts, and no difference between the Precincts overall and the regional control area (Table 8). Residents of Cooma-Monaro were the most likely to find water/hydroelectric power an acceptable source. While conventional coal power stations were only acceptable to a third of residents, those in NSW/ACT Border Region (22%) and Cooma-Monaro (21%) were least likely to accept this source.
Wind power was equally well accepted by males and females in the Precincts, with acceptance tending to be lowest among residents aged 65 years and over (72%) (Table 9). Males, however, were more likely than females to find as acceptable conventional coal (37% compared with 28%) and nuclear power (35% compared with 12%). Acceptance of nuclear power increased with age (from 11% of residents aged 18-29 years to 34% of residents aged 65 years and over).

Community Attitudes to Wind Farms in NSW
© 2010 AMR Interactive 25
Table 8. Acceptable power sources for proposed power station, by Precincts and regional control area
REGIONAL NSW PRECINCTS
Energy source
Renewable Energy
Precincts (n=1729)
Regional Control
Area (n=293)
New England
Tablelands (n=289)
Upper Hunter (n=286)
Central Tablelands
(n=290)
NSW/ACT Border Region (n=287)
South Coast
(n=291)
Cooma-Monaro (n=286)
% % % % % % % %
Solar 95 96 94 96 93 96 96 94
Wind 81 81 76 79 84 87 79 81
Water or hydroelectric
75 79 71 71 73 76 78 89
Gas 69 74 72 73 69 74 65 65
Conventional
coal 33 27 42 41 37 22 27 21
Nuclear 24 30 22 25 28 23 22 27
Base: All respondents Statistically significant difference between groups: highlighting higher and lower responses Q8. Which power sources would you consider to be acceptable?
Table 9. Acceptable power sources for proposed power station, by gender, age and area of residence
GENDER AGE GROUP
Energy source Male
(n=849) Female (n=880)
18-29 (n=195)
30-44 (n=408)
45-64 (n=717)
65+ (n=409)
% % % % % %
Solar 93 97 96 98 95 90
Wind 82 80 86 85 81 72
Water or hydroelectric
79 71 80 73 74 76
Gas 73 66 66 70 68 73
Conventional coal
37 28 34 29 31 37
Nuclear 35 12 11 19 27 34
Base: Respondents in Precincts Statistically significant difference between groups: highlighting higher and lower responses Q8. Which power sources would you consider to be acceptable?

Community Attitudes to Wind Farms in NSW
© 2010 AMR Interactive 26
4.3 Awareness and knowledge of wind farms
General awareness
Residents were asked about their awareness of wind turbines/farms, including whether they had heard about them, had seen one, had been close enough to hear one operating, or were aware of farms currently operating or planned
There was almost universal awareness (97%) of wind farms in the Precincts with residents reporting they had heard about the use of wind farms, wind turbines or wind mills to generate electricity. Residents of South Coast were significantly less likely to have heard about wind farms than residents of other Precincts (Table 10).
Furthermore, over three quarters (81%) of residents reported they had seen a wind turbine or wind mill. Residents of New England Tablelands (60%) and Upper Hunter (76%) were relatively less likely to report having seen a wind turbine, in comparison with residents of other Precincts (85-95%).
Residents were also asked if they had been close enough to an operating wind turbine or wind farm to hear it operating. Overall, about a third (35%) of residents of the Precincts reported they had been close enough to hear a wind turbine (Table 10). There was considerable variation across the six Precincts; residents of Central Tablelands (45%) and NSW/ACT Border Region (45%) were the most likely to have been close enough to hear operation, followed by residents of South Coast (34%) and Cooma-Monaro (38%). By contrast, residents of New England Tablelands (21%) and Upper Hunter (32%) Precincts were least likely to have heard operation.
About two thirds (65%) of residents across the Precincts were aware of wind farms currently operating in NSW. Residents of NSW/ACT Border Region (95%) were the most likely to be aware, while residents of New England Tablelands (37%) were the least likely (Table 10). Awareness of currently operating and proposed/developing wind farms in NSW was significantly higher among residents of the six Precincts compared with residents of the regional control area, but the difference for currently operating wind farms was driven by the very high awareness in some of the key Precincts. Residents of Central Tablelands (22%) and South Coast (16%) were least likely to know of any wind farms under construction (Table 10).
Table 10. General awareness of wind farms, by Precinct and regional control area
REGIONAL NSW PRECINCT
Awareness
Renewable Energy
Precincts (n=1729)
Regional Control
Area (n=293)
New England
Tablelands (n=289)
Upper Hunter (n=286)
Central Tablelands
(n=290)
NSW/ACT Border Region (n=287)
South Coast
(n=291)
Cooma-Monaro (n=286)
% % % % % % % %
Heard about wind farms
97 98 96 99 99 100 95 99
Seen a wind farm/turbine
81 77 60 76 89 95 85 88
Been close enough to hear operating
35 33 21 32 45 45 34 38
Currently operating 68 40 38 58 90 95 61 85
Planned/ under construction
28 12 29 54 22 47 16 53
Base: All respondents Statistically significant difference between groups: highlighting higher and lower responses Q9. Have you heard about the use of wind farms or wind turbines or windmills to generate electricity? Q10a. Have you seen an actual wind turbines or windmill to generate electricity? Q28. Have you been close enough to an operating wind turbine or wind farm to hear it? Q14a. Are you aware of any wind farms currently operating in NSW? Q15a. Are you aware of any wind farms in NSW under construction of being proposed?

Community Attitudes to Wind Farms in NSW
© 2010 AMR Interactive 27
Overall knowledge
Residents were asked to self-report how much they knew about wind farms
Over half (56%) of the residents of the Precincts reported that they knew at least a moderate amount about wind farms (Figure 6). While there was no overall difference in reported knowledge between the Precincts and the regional control, there were some differences between the Precincts. Around half of the residents of New England Tablelands (45%) and South Coast (52%) reported at least a moderate level of knowledge, compared with over two thirds of residents of Central Tablelands (68%) and Cooma-Monaro (71%).
There were a number of differences in reported knowledge of wind farms among the demographic groups, although none were very strong (Figure 7). Males (64%) were somewhat more likely than females (50%) to report having at least a moderate amount of knowledge about wind farms. Residents aged 18-29 years were the least likely to report knowing at least a moderate amount (43% compared with 56-63% for the other age groups). Residents living on farms (63%) were also the most likely to report this level of knowledge.
Figure 6. Knowledge about wind farms, by Precincts and regional control area
14
10
9
15
17
17
13
21
42
43
36
40
51
47
39
50
37
40
45
41
30
31
39
25
5
5
7
4
2
5
7
3
2
2
3
3
1
0 20 40 60 80 100
Renewable Energy Precincts (n=1729)
Regional Control Area (n=293)
New England Tablelands (n=289)
Upper Hunter (n=286)
Central Tablelands (n=290)
NSW/ACT Border Region (n=287)
South Coast (n=291)
Cooma-Monaro (n=286)
% of residents
A lot Moderate amount A little Only heard term Not heard
Base: All respondents Statistically significant difference between Precincts: highlighting higher=�, lower=� knowledge Q11. Before this survey, how much did you know about wind farms?
Precincts
�
�
�
�

Community Attitudes to Wind Farms in NSW
© 2010 AMR Interactive 28
Figure 7. Knowledge about wind farms, by gender, age and area of residence, in the Renewable Energy Precincts
19
10
6
14
17
16
14
10
21
45
40
37
42
46
41
42
41
45
31
42
45
38
34
33
37
40
32
4
7
9
5
2
8
5
8
3
2
2
3
1
1
3
2
1
0 20 40 60 80 100
Male (n=849)
Female (n=880)
18-29 (n=195)
30-44 (n=408)
45-64 (n=717)
65+ (n=409)
In town (n=1097)
Out - residential (n=296)
Out - farming (n=334)
% of residents
A lot Moderate amount A little Only heard term Not heard
Base: Respondents in Precincts Statistically significant difference between groups: highlighting higher=�, lower=� knowledge Q11. Before this survey, how much did you know about wind farms?
Sources of information
Residents were asked to mention (unprompted) where they had heard or received information about wind farms
Half (48%) of all residents of the Precincts mentioned they had heard or received information about wind farms from television/radio (Table 11). Residents of New England Tablelands were more likely than the other Precincts to use TV/Radio as a source of information (58%), while residents of NSW/ACT Border Region were least likely to use this as a source of information (36%).
Local newspapers were quite influential in providing information about wind farms to residents of Upper Hunter (41%), while residents of New England Tablelands (17%) and South Coast (20%) were least likely to receive information through this source.
A quarter (25%) of NSW/ACT Border Region residents received their information about wind farms through word of mouth, which may reflect the operation of the wind farm near Goulburn. This result may also be related to the fact that those living in NSW/ACT Border Region are less isolated than those in other Precincts. Very few residents reported receiving any information about wind farms from local or state governments.
Gender
Age
Residence
�
�
�
�
�

Community Attitudes to Wind Farms in NSW
© 2010 AMR Interactive 29
Table 11. Source of information about wind farms, by Precincts and regional control area (unprompted – multi-response)
REGIONAL NSW PRECINCTS
Source
Renewable Energy
Precincts (n=1729)
Regional Control
Area (n=293)
New England
Tablelands (n=289)
Upper Hunter (n=286)
Central Tablelands
(n=290)
NSW/ACT Border Region (n=287)
South Coast
(n=291)
Cooma-Monaro (n=286)
% % % % % % % %
News and media
Television or radio (news/current affairs)
48 59 58 46 45 36 48 47
Local newspapers 24 19 17 41 27 34 20 36
State/national newspapers
18 20 17 16 19 15 19 17
Other media 2 1 1 1 3 0 3 1
Word of mouth and personal experience
Word of mouth 17 12 14 18 17 25 15 18
Seen/experienced operation
4 1 1 2 8 4 2 3
Interstate/overseas 1 3 2 1 1 1 2 2
Own research/studies 4 6 2 3 3 4 5 3
Groups
Local community groups or social clubs
4 2 3 6 5 5 3 7
Environment groups 2 1 2 3 3 2 2 4
Landscape Guardians 1 1 0 2 2 2 1 1
Local business groups 1 1 2 3 1 1 1 2
Government and companies
Wind farm developers 5 3 2 5 5 7 5 7
Energy companies 3 2 2 6 6 4 1 4
Local government 3 1 2 5 3 6 2 4
State Government 2 1 2 3 2 3 1 1
Other
Nowhere in particular 16 12 18 13 16 14 17 15
Heard nothing 3 1 3 0 3 2 4 2
Base: All respondents Statistically significant difference between groups: highlighting higher and lower responses Q29. From where have you heard or received any information about wind farms?

Community Attitudes to Wind Farms in NSW
© 2010 AMR Interactive 30
Consultation and further information
Residents were asked about their engagement with wind power regarding awareness of the government’s renewable energy initiative, whether they considered they had had adequate consultation about wind farms, and whether they had adequate information about wind farms
A third (33%) of all residents surveyed had heard about Government initiatives regarding renewable energy (Table 12). This was consistent across the Precincts between residents residing in and out of town. Perceptions were quite polarized in terms of adequate consultation from community groups regarding wind farms, and this brought down the overall rating for adequate consultation (16%).
Residents living in South Coast and New England Tablelands felt the least adequately consulted of all the Precincts (only 9% and 13% respectively felt adequately consulted). In contrast, about a third (29-30%) of residents of Upper Hunter, NSW/ACT Border Region and Cooma-Monaro felt they were adequately consulted by community groups.
About a third (34%) of residents felt they had adequate information regarding wind farms. Once again South Coast (9%) and New England Tablelands (13%) were significantly less likely to feel they had adequate information about wind farms of all Precincts.
Residents living out of town on a residential property were the least likely to feel they had adequate information regarding wind farms (11%), compared with those living in-town (17%) or on farming properties (20%). Among residents of farming properties, a small percentage (8%) reported having been approached by a developer. This incidence tended to be higher in Upper Hunter (15%), NSW/ACT Border Region (12%) and Upper Hunter (11%).
Table 12. Perception of consultation about wind farms and adequacy of information, by Precincts and regional control area
REGIONAL NSW PRECINCTS
Information/ consultation
Renewable Energy
Precincts (n=1729)
Regional Control
Area (n=293)
New England
Tablelands (n=289)
Upper Hunter (n=286)
Central Tablelands
(n=290)
NSW/ACT Border Region (n=287)
South Coast
(n=291)
Cooma-Monaro (n=286)
% % % % % % % %
Heard of renewable energy initiative
33 28 33 40 35 33 29 37
Adequate consultation
16 11 13 30 18 29 9 29
Adequate information
34 27 29 35 41 41 29 39
(n=334) (n=31) (n=58) (n=73) (n=47) (n=60) (n=23) (n=73)
Approached by a developer *
8 0 4 15 11 12 6 8
Base: All respondents *Residents living on farming properties only Statistically significant difference between groups: highlighting higher and lower responses Q30. Have you heard about the NSW government initiative for setting up Renewable Energy Precincts? Q33. Do you feel that there is adequate consultation about wind farms available in your local community? Q34a. Do you feel you have adequate information about wind farms?
Perceptions of adequacy of consultation and information were also assessed by overall awareness of currently operating and planned wind farms in the local region, and proximity of residents to wind farms (Figure 8). The small number of residents within 5 kilometres of operating/planned wind farms were the most likely (50%) to have heard about the Government initiatives for renewable energy, while those not aware of any operating/planned wind farms were the least likely (averaging 32%). Perception of adequate consultation was also much lower among residents who were unaware of any wind farms (averaging 13%), and was broadly highest for residents within 50 kilometres of the location, although still a minority. It should be noted, however, that adequacy of consultation was

Community Attitudes to Wind Farms in NSW
© 2010 AMR Interactive 31
much lower for the few residents up to 2 kilometres away from an existing wind farm. Similarly, perception of adequacy of information was lower among those not aware (averaging 28%), increasing with proximity from less than half (43%) when more than 50 kilometres away, up to close to two thirds of those at 5 kilometres (61%) and 6-19 kilometres (58%).
Figure 8. Perception of consultation about wind farms and adequacy of information in the Precincts, by awareness in region and distance to nearest operating/planned wind farm
50
39
38
39
35
25
0 20 40 60 80 100
Up to 5 km (n=42)
6-19 km (n=108)
20-49 km (n=238)
50+ km (n=295)
Aware in NSW only
(n=706)
Not aware in NSW
(n=340)
% of residents
Heard of renewable energy
initiative
AWARE OF WIND FARMS
OPERATING OR PLANNED
IN THE LOCAL REGION
NOT AWARE OF WIND FARMS OPERATING
OR PLANNED IN THE LOCAL REGION
Distance to nearest operating/ planned wind farm
36
45
38
25
16
9
0 20 40 60 80 100% of residents
Adequate consultation
61
55
51
42
31
22
0 20 40 60 80 100% of residents
Adequate information
Base: Respondents in Precincts Statistically significant difference between groups: highlighting higher=�, lower=� response Q30. Have you heard about the NSW government initiative for setting up Renewable Energy Precincts? Q33. Do you feel that there is adequate consultation about wind farms available in your local community? Q34a.Do you feel you have adequate information about wind farms?
�
�
�
�
�
�
�
�
� �
�
�

Community Attitudes to Wind Farms in NSW
© 2010 AMR Interactive 32
Further information
Residents were asked about what information they would like to find out about wind farms
The most common types of information needs were about effectiveness of power generation, personal impacts (with particular focus on noise levels) and effects on the community (Table 13).
There were minimal variations between those that supported wind farms and those that opposed them, and more than a third (41%) of residents across the six Precincts felt that they did not require additional information.
Table 13. Information needs, by level of support/opposition to wind farms 1-2 km from residents, in the Precincts (unprompted - multi-response)
Information* Total
(n=1729) %
Support (n=1053)
%
Oppose (n=589)
%
General information (e.g., brochures) 16 17 15
Personal Impact 16 16 15
Noise levels 14 14 14
Health and safety concerns 4 4 12
Other personal 5 5 5
Want information if they propose/put one here 3 3 3
Local/Community Implications 13 13 13
Location of wind farms 4 4 5
Environmental impact 4 4 5
Impact on local community 3 2 2
How many will be built 1 2 1
Effectiveness/how it works - power generation 15 16 14
Efficiency/how much energy is produced 7 8 6
Comparison with other powers source 3 3 4
Longevity/lifespan of equipment 1 1 2
No wind/what happens when there's no wind 1 1 1
Effectiveness - Logistics 9 9 8
Cost of project 4 5 4
Economics of venture/is it worth doing 4 4 4
None/nothing 41 42 43
Base: Respondents in Precincts Q34b. Are there any specific aspects of wind energy or wind farms that you would like more information on
(unprompted)? * Categories of responses are in bold – the percentages represent the nett of residents giving a response that falls into that category. The main sub-categories of responses are shown below each category.

Community Attitudes to Wind Farms in NSW
© 2010 AMR Interactive 33
4.4 Attitudes to wind power and wind farms
Attitudes to wind power
Residents were asked to rate their level of agreement with a number of statements about wind power
Almost all residents (95%) of the Precincts agreed that wind power was a clean source of energy (Figure 9). There was little absolute difference between the Precincts (ranging from 90 to 98% agreement) (Table 14).
A high proportion (90%) of Precinct residents believed that wind power has lower greenhouse gases than coal or gas emissions. Over three quarters (84%) of residents of the Precincts agreed that NSW has great potential/resources for wind power, which was marginally higher than in the regional control area (77%).
About two thirds (63%) of residents of the Precincts agreed that wind power was efficient and reliable, although residents of Upper Hunter were least likely to agree (52%). Only about half (49%)
of residents agreed that wind power was the cheapest renewable energy source, and this was influenced by a substantial incidence of uncertainty (36%).
There were no major demographic differences on these perceptions of wind power.
Figure 9. Attitudes to wind power in the Renewable Energy Precincts
39
37
23
11
11
51
58
60
52
38
3
2
7
14
14
1
1
1
2
1
7
3
9
21
36
0 20 40 60 80 100
Lower greenhouse gas emissions than coal or gas
Clean source of energy
NSW has great potential/resources for wind power
Efficient and reliable
Cheapest renewable energy source
% of residents
Strongly agree Agree Disagree Strongly disagree Don't know
Base: Respondents in Precincts Q12. Please tell me to what extent you agree or disagree with each statement

Community Attitudes to Wind Farms in NSW
© 2010 AMR Interactive 34
Table 14. Attitudes to wind power, by Precinct and regional control area
NSW REGIONAL PRECINCTS
Wind power
Renewable Energy
Precincts (n=1729)
Regional Control
Area (n=293)
New England
Tablelands (n=289)
Upper Hunter (n=286)
Central Tablelands
(n=290)
NSW/ACT Border Region (n=287)
South Coast
(n=291)
Cooma-Monaro (n=286)
% % % % % % % %
Clean source of energy
Agree 95 95 90 94 97 98 95 94
Disagree 3 2 4 5 2 2 2 4
Don’t know 3 4 6 1 1 1 3 2
Lower greenhouse gas emissions than coal or gas
Agree 90 92 87 89 90 94 91 88
Disagree 3 2 2 5 5 2 3 5
Don’t know 7 6 11 7 6 4 7 7
NSW has great potential/resources for wind power
Agree 84 77 79 80 86 86 85 83
Disagree 7 7 10 9 8 4 5 11
Don’t know 9 16 11 11 6 10 10 6
Efficient and reliable
Agree 63 67 59 52 66 65 66 64
Disagree 15 15 17 27 16 14 12 19
Don’t know 21 18 24 21 18 22 22 17
Cheapest renewable energy source
Agree 49 49 50 45 50 52 47 44
Disagree 15 14 13 22 16 15 14 21
Don’t know 36 37 36 33 35 33 39 35
Base: All respondents Statistically significant difference between groups: highlighting higher and lower agreement Q12. Please tell me to what extent you agree or disagree with each statement

Community Attitudes to Wind Farms in NSW
© 2010 AMR Interactive 35
Attitudes to wind farms in local region
Residents were asked to rate their level of agreement with a number of statements about wind farms in their local region
Overall, a majority of residents of the Precincts believed that their local council should encourage wind farms (76%), that they benefit the local community (76%) and that there should be more wind farms in their local region (71%) (Figure 10). They were more positive about wind farms benefiting the local community and boosting employment than about the likelihood that they will contribute to tourism. They were also more likely to agree that there were would be no health concerns associated with wind farms compared with safety concerns, on which agreement was more polarised.
It should be noted that the terms ‘health’ and ‘safety’ were well differentiated in the pre-survey qualitative interviews. ‘Health’ was seen as referring particularly to the issue of emissions from electric cables; and ‘safety’ was referring to accidents around the wind turbines. While noise was also raised as a potential issue, it was not in the context of the question on concerns about health. The ‘non-agree’ results for the specific questions about safety and health are best interpreted as a combination of unfamiliarity/lack of knowledge; a perception that there could be issues (also related to lack of specific knowledge); and for some people, a perception that there must be at
least some risk (e.g., teenagers mucking around). This is reinforced by the lack of specific concerns about health and safety being raised by residents who opposed wind farms (see Table 20).
Residents of Upper Hunter were least positive on several of the issues rated about wind farms in their local region, including that local councils should encourage wind farms, that wind farms would benefit the local community, that wind farms would boost employment, and about wind farms having a negative impact on the environment (Table 15).
Figure 10. Attitudes to wind farms in local region, in the Renewable Energy Precincts
21
19
16
16
13
12
9
8
4
55
52
61
53
54
50
43
43
28
12
13
12
14
18
23
29
28
47
4
6
3
2
4
6
2
6
9
2
5
3
2
3
3
2
5
3
5
6
6
13
9
7
15
10
10
0 20 40 60 80 100
Local council should encourage wind farms
More wind farms in local region
Benefit local community
No health concerns
Boost employment and local economy
No negative impact on local environment#
No safety concerns
Not affect on heritage values
Help increase tourism
% of residents
Strongly agree Agree Disagree Strongly disagree Depends Don't know
Base: Respondents in Precincts # This statement was asked as agreement with a “negative impact”. Results for agree and disagree have been reversed to present a consistent positioning with the other statements
Q20. Please tell me to what extent you agree or disagree with each statement

Community Attitudes to Wind Farms in NSW
© 2010 AMR Interactive 36
Table 15. Attitudes to wind farms in local region, by Precinct and regional control area
NSW REGIONAL PRECINCT
Feature of wind farms
Renewable Energy
Precincts (n=1729)
Regional Control
Area (n=293)
New England
Tablelands (n=289)
Upper Hunter (n=286)
Central Tablelands
(n=290)
NSW/ACT Border Region (n=287)
South Coast
(n=291)
Cooma-Monaro (n=286)
% % % % % % % %
Local council should encourage wind farms
Agree 76 74 73 67 76 78 78 74
Disagree 17 18 19 25 17 15 14 20
Don’t know 8 9 8 8 7 8 7 6
More wind farms in local region
Agree 71 70 67 62 76 70 71 72
Disagree 19 20 21 30 18 21 17 19
Don’t know 10 10 12 8 7 9 13 9
Benefit local community
Agree 76 78 74 67 77 79 77 73
Disagree 15 14 15 26 16 14 12 20
Don’t know 9 8 11 7 7 7 11 7
Wind farms would boost employment/economy
Agree 66 69 65 56 65 69 68 68
Disagree 22 18 22 30 26 20 19 19
Don’t know 12 14 13 15 9 11 13 13
No negative impact on local environment#
Agree 62 62 57 52 66 68 60 61
Disagree 29 28 29 39 29 24 29 31
Don’t know 10 10 14 10 5 8 11 8
Help increase tourism
Agree 32 32 31 24 40 37 27 32
Disagree 55 56 55 63 49 50 60 59
Don’t know 13 12 14 13 11 12 13 10
No health concerns
Agree 69 68 67 58 72 68 72 67
Disagree 16 14 16 25 15 18 14 17
Don’t know 15 19 17 17 13 14 15 15
No safety concerns
Agree 53 56 47 48 54 56 55 58
Disagree 31 27 38 35 31 30 25 28
Don’t know 16 17 15 17 15 14 20 14
No effect on heritage values
Agree 51 54 53 42 53 51 49 52
Disagree 34 30 31 39 34 38 34 34
Don’t know 15 16 16 19 13 11 17 14
Base: All respondents Statistically significant difference between groups: highlighting higher and lower agreement # This statement was asked as agreement with a “negative impact” - results for agree and disagree have been reversed to present a consistent positioning with the other statements
Q20. Please tell me to what extent you agree or disagree with each statement

Community Attitudes to Wind Farms in NSW
© 2010 AMR Interactive 37
Impact of wind farms on property values, visual impact and noise
Residents were asked to rate whether wind farms would have an impact on visual appeal and property values, and about their level of concern about noise
About half of residents of the Precincts considered that wind farms would have only a positive impact or no impact on property values (50%) and on visual impact (53%) (Table 16). Residents of Upper Hunter (48%) were the most likely to consider that wind farms would have a negative visual impact, while residents of NSW/ACT Border Region (34%) were the least likely.
Residents of the Precincts were also polarised in their concern about noise 1-2 kilometres from a wind farm. Residents of Upper Hunter were again more negative (52% some/great concern), while the least concern was expressed by residents of NSW/ACT Border Region (49% no/little concern) and Cooma-Monaro (48%).
Table 16. Impact of wind farms on property values, visual appeal and noise, by Precinct and regional control area
REGIONAL NSW PRECINCTS
Perceived impact
Renewable Energy
Precincts (n=1729)
Regional Control Area
(n=293)
New England
Tablelands (n=289)
Upper Hunter (n=286)
Central Tablelands
(n=290)
NSW/ACT Border Region (n=287)
South Coast
(n=291)
Cooma- Monaro (n=286)
% % % % % % % %
Impact on property values
Positive impact 20 20 24 18 18 20 20 25
No impact 30 27 24 23 30 33 33 31
Negative impact 35 39 37 42 37 31 35 30
Other response 15 15 15 17 15 17 13 14
Visual impact
Positive impact 25 22 21 18 29 28 23 24
No impact 28 24 31 26 27 33 26 30
Negative impact 41 45 40 48 41 34 43 37
Other response 7 9 8 8 3 6 8 9
Noise a concern if built 1-2 km away
No/little concern 42 44 38 38 42 49 43 48
Some/great concern 44 43 46 52 47 40 42 44
Depends/ Don’t know 14 12 15 9 11 12 16 9
Base: All respondents Statistically significant difference between groups: highlighting more positive and more negative results Q21. In your view, what impact would wind farms in your local region have on property values? Q22. In your view, what impact would wind farms have on the visual appeal of the surrounding area? Q27. In your view, to what extent would noise be a concern for you if a wind farm was 1-2 km away from your
residence?

Community Attitudes to Wind Farms in NSW
© 2010 AMR Interactive 38
4.5 Support for wind farms
Overview
Residents were asked whether they supported or opposed wind farms in NSW, in their local region, 10 km from their residence and 1-2 km from their residence
The large majority of residents across the Precincts indicated they would support wind farms being built both in NSW (85%) as well as in their local region (80%) (Figure 11). The results were very similar to the regional control.
Residents of the Precincts were also very supportive of wind farms being built in the vicinity of their residence. Over three quarters (79%) supported wind farms at 10 kilometres, suggesting that the ‘local region’ is seen as broadly equivalent to this distance. Support dropped substantially, although still held by the majority of residents (60%), when considering a wind farm being built 1-2 kilometres from their residence.
Residents opposing wind farms being built 1-2 kilometres from their residence were much more likely to raise concerns about noise and the impact on the landscape, than residents supporting wind farms (Table 19). Those opposing were also much less likely to suggest benefits of wind farms, such as reducing pollution and improving the community and economy (Table 18). Nevertheless, the majority of those opposing still offered an overall benefit of wind farms in the local region.
Figure 11. Overall support for wind farms, in the Renewable Energy Precincts
85
80
79
60
0 20 40 60 80 100
In NSW
In local region
10 km from residence
1-2 km from residence
% of residents
Total Support
Base: Respondents in Precincts Statistically significant difference between measures: highlighting lower=� Q13. Overall, to what extent do you support or oppose wind farms being built in NSW? Q17. Overall, to what extent do you support or oppose wind farms being built in your local region? Q25. Overall, to what extent do you support or oppose wind farms being built 10 km from your residence? Q24. Overall, to what extent do you support or oppose wind farms being built 1-2 km from your residence?
�

Community Attitudes to Wind Farms in NSW
© 2010 AMR Interactive 39
Support in NSW
The large majority (85%) of residents across the Precincts supported the building of wind farms in NSW (Figure 12). The level of support among residents of the control area was identical to that of the Precincts. Overall, only a small minority of residents opposed wind warms in NSW across the Precincts (9%) and the regional control area (8%).
The level of total support for wind farms in NSW was consistently high across the Precincts (79-89%). There were, however, differences in the level of strong support:
• residents of Central Tablelands (48% strongly support), NSW/Act Border Region (46%) and South Coast (42%) showed the strongest support; and
• residents of New England Tablelands (28% strongly support) and Upper Hunter (27%) showed the least strong support.
This pattern of differences was consistent with results on attitudes and perceptions of a number of issues in the study.
Figure 12. Support for wind farms in NSW, by Precincts and regional control area
40
40
28
27
48
46
42
37
45
45
54
52
40
43
42
47
7
4
10
7
6
5
5
5
2
4
2
6
3
3
2
4
6
7
6
8
3
4
8
7
0 20 40 60 80 100
Renewable Energy Precincts (n=1729)
Regional Control Area (n=293)
New England Tablelands (n=289)
Upper Hunter (n=286)
Central Tablelands (n=290)
NSW/ACT Border Region (n=287)
South Coast (n=291)
Cooma-Monaro (n=286)
% of residents
Strongly support Support Oppose Strongly oppose Depends/Don't know
Base: All respondents Statistically significant difference between Precincts: highlighting higher=�, lower=� support Q13. Overall, to what extent do you support or oppose wind farms being built in NSW?
Precincts
�
�
�
�

Community Attitudes to Wind Farms in NSW
© 2010 AMR Interactive 40
Support in local region
Over three quarters (80%) of residents of the Precincts supported wind farms being built in their local region, and a third (34%) were strongly supportive (Figure 13). Residents of Upper Hunter and New England Tablelands were again less supportive with only about a quarter (22% and 26% respectively) strongly supporting wind farms, compared with at least a third (33%-43%) in each of the other Precincts.
A small minority (15%) of residents overall opposed wind farms in their local region.
The overall level of support among residents of the control area (78%) was again very similar to that in the Precincts.
Figure 13. Support for wind farms in local region, by Precincts and regional control area
34
30
26
22
38
43
33
37
46
48
51
54
49
42
43
44
9
9
11
9
7
6
9
9
6
6
6
9
6
5
7
6
5
8
6
5
1
4
8
5
0 20 40 60 80 100
Renewable Energy Precincts (n=1729)
Regional Control Area (n=293)
New England Tablelands (n=289)
Upper Hunter (n=286)
Central Tablelands (n=290)
NSW/ACT Border Region (n=287)
South Coast (n=291)
Cooma-Monaro (n=286)
% of residents
Strongly support Support Oppose Strongly oppose Depends/Don't know
Base: All respondents Statistically significant difference between Precincts: highlighting higher=�, lower=� support Q17. Overall, to what extent do you support or oppose wind farms being built in your local region?
Precincts
�
�
�

Community Attitudes to Wind Farms in NSW
© 2010 AMR Interactive 41
Support for wind farm 10 km from residence
Support for wind farms being built 10 kilometres from their residence was almost as high as that for wind farms in the local region (Figure 14). Over three quarters (79%) of residents of the Precincts overall expressed support.8 While the results suggest some increase in concern by residents when considering the closer proximity, the overall reduction in support was minimal. Less than a quarter (17%) of residents opposed wind farms 10 kilometres from their residence.
The level of support among residents of the control area (81%) was again very similar to that in the Precincts.
Figure 14. Support for wind farms 10 km from the residence, by Precincts and regional control area
79
81
76
74
82
84
77
79
10
8
10
9
10
7
12
10
7
4
9
11
5
6
6
6
4
7
5
6
3
2
4
5
0 20 40 60 80 100
Renewable Energy Precincts (n=1729)
Regional Control Area (n=293)
New England Tablelands (n=289)
Upper Hunter (n=286)
Central Tablelands (n=290)
NSW/ACT Border Region (n=287)
South Coast (n=291)
Cooma-Monaro (n=286)
% of residents
Support Oppose Strongly oppose Depends/Don't Know
Base: All respondents Q25. Overall, to what extent do you support or oppose wind farms being built 10 km from your residence?
8 The question on the 10 kilometres proximity was a supplementary question asked of those who did not support a 1-2 kilometres proximity and which then produces a measure of overall support.
Pre
cin
cts

Community Attitudes to Wind Farms in NSW
© 2010 AMR Interactive 42
Support in the local area
A majority of residents (60%) in the Precincts supported wind farms 1-2 kilometres from their residence (Figure 15), however, a third (34%) were opposed to wind farms 1-2kilometres from their residence. In terms of the strength of support, strong support is limited to a small minority (11%), with almost half (48%) expressing support.
Residents of Upper Hunter (47%) and New England Tablelands (54%) again tended to be less supportive overall compared with the other Precincts (60-63% in the other Precincts).
The level of support among residents of the regional control area (63%) was similar to that in the Precincts overall.
Figure 15. Support for wind farms 1-2 km from the residence, by Precincts and regional control area
11
13
9
8
10
13
13
15
48
50
45
39
53
48
50
45
19
18
20
22
18
19
19
19
15
9
16
21
14
13
13
15
7
10
10
10
4
7
5
7
0 20 40 60 80 100
Renewable Energy Precincts (n=1729)
Regional Control Area (n=293)
New England Tablelands (n=289)
Upper Hunter (n=286)
Central Tablelands (n=290)
NSW/ACT Border Region (n=287)
South Coast (n=291)
Cooma-Monaro (n=286)
% of residents
Strongly support Support Oppose Strongly oppose Depends/Don't know/Don't care
Base: All respondents Q24. Overall, to what extent do you support or oppose wind farms being built 1-2 km from your residence?
Pre
cin
cts

Community Attitudes to Wind Farms in NSW
© 2010 AMR Interactive 43
Demographic differences in support
Males and females were equally supportive towards wind farms at the state level, regional level and in the vicinity of their residence (Table 17). Residents aged 65 years and over were less supportive compared with the other age groups, with residents aged 18-29 tending to be most supportive. There was a trend for support to be higher among more highly educated residents, holding degrees.
Support was further assessed based on awareness of wind farms operating/planned in the region and proximity to the location (Figure 17). There was a trend for support to be lowest among residents who were much closer to the location, specifically up to 5 kilometres. A stronger relationship with support occurred where the location of the nearest current or planned wind farm was visible from the residence. Among those who were aware of a current or planned wind farm in their local region, support was lower (43%) when the location was visible compared with when it was not visible (60%) (Table 18).
Residents living out of town were also asked if they would consider wind turbines on their property. About half (47%) of residents on farming properties in the Precincts said that they would consider having wind turbines on their property. By contrast, only about a quarter (23%) of residents on residential properties out of town would consider wind turbines on their property.
Table 17. Overall support for wind farms in the Precincts, by gender, age and area of residence, in the Renewable Energy Precincts
GENDER AGE GROUP EDUCATION
Support Male
(n=849) Female (n=880)
18-29 (n=195)
30-44 (n=408)
45-64 (n=717)
65+ (n=409)
Up to Year 12 (n=729)
Technical or Trade (n=357)
Diploma (n=206)
Degree (n=412)
% % % % % % % % % %
Wind farms in NSW
Support 83 87 89 86 86 79 85 83 87 91
Oppose 10 8 8 7 9 12 9 10 8 6
Other response 7 5 4 7 5 8 6 7 5 3
Wind farms in local region
Support 79 81 85 85 80 71 79 81 80 85
Oppose 15 15 13 10 16 21 16 16 12 11
Other response 5 5 3 4 5 8 5 3 8 4
Wind farms 10 km from the residence
Support 79 79 86 80 79 72 78 78 78 85
Oppose 18 16 10 18 17 22 18 19 16 13
Other response 3 5 3 2 5 5 4 3 6 2
Wind farms 1-2 km from the residence
Support 60 59 64 62 60 53 61 55 60 65
Oppose 34 33 31 32 32 41 32 40 31 29
Other response 6 8 4 7 8 7 7 4 9 6
Base: Respondents in Precincts Statistically significant difference between groups: highlighting higher and lower support Q13. Overall, to what extent do you support or oppose wind farms being built in NSW? Q17. Overall, to what extent do you support or oppose wind farms being built in your local region? Q24. Overall, to what extent do you support or oppose wind farms being built 1-2 km from your residence? Q25. Overall, to what extent do you support or oppose wind farms being built 10 km from your residence?

Community Attitudes to Wind Farms in NSW
© 2010 AMR Interactive 44
Figure 16. Support for wind farms 1-2 km from residence, by awareness in region and distance to nearest operating/planned wind farm, in the Renewable Energy Precincts
9
9
11
12
12
11
31
45
46
50
46
49
0 20 40 60 80 100
Up to 5 km (n=42)
6-19 km (n=108)
20-49 km (n=238)
50+ km (n=295)
Aware in NSW (not in Region) (n=706)
Not aware in NSW (n=340)
% of residents
Strongly support SupportAWARE OF WIND FARMS OPERATING OR
PLANNED IN THE LOCAL REGION
NOT AWARE OF WIND FARMS OPERATING OR
PLANNED IN THE LOCAL REGION
Distance to nearest
operating/planned
wind farm
Base: Respondents in the Precincts Q24. Overall, to what extent do you support or oppose wind farms being built 1-2 km from your residence?
Table 18. Relationship between support for wind farms 1-2 km from residence and visibility of an existing or planned wind farm from residence, across the Precincts
Current or planned wind farm
visible from property
Measure
Yes (n=73)
%
No (n=620)
%
Support 43 60
Total oppose 54 33
Don’t know 3 7
Base: Respondents in the Precincts reporting a wind farm operating or planned in their local region Statistically significant difference between groups: highlighting higher and lower Q24. Overall, to what extent do you support or oppose wind farms being built 1-2 km from your residence?

Community Attitudes to Wind Farms in NSW
© 2010 AMR Interactive 45
Perceived benefits of wind farms
Residents were asked, unprompted, what benefits wind farms would bring to the region
Residents proposed a number of different types of benefits that wind farms would bring to their local region (Table 19). The most common responses were about reducing pollution and being environmentally friendly, reduced costs to the consumer, and increased employment opportunities to the community. The results have been reported for those supporting and opposing wind farms built 1-2 kilometres from their residence. This question was chosen as it represented the best split in support/opposition for comparison.
About two thirds (68%) residents opposing wind farms 1-2 kilometres from their residence still identified a benefit of wind farms to the region, although they were less likely than those supporting wind farms.
Table 19. Perceived benefits of wind farms by level of support/opposition to wind farms 1-2 km from residents, in the Renewable Energy Precincts (unprompted – multi-response
Benefit* Support
(n=1053) %
Oppose (n=589)
%
Pollution 56 36
Reduces pollution/clean power/green/environmentally friendly 42 24
Alternative/renewable energy/provides a choice 10 8
Supplies power/helps maintain consistent/regular power supply 11 8
Reduces transmission from the grid 1 2
Costs 34 24
Cost effective/cheaper energy/bills 28 18
Cheaper source of power/cheaper to make 6 7
Economy/community 41 29
Increases employment opportunities 34 24
Help local community/economy 6 4
Benefits the local land owners 4 3
Encourages tourism/good for the region's image 5 2
Landscape/visual appeal 3 1
Aesthetic considerations 2 0
None/nothing 4 19
Don't know 7 13
Base: Respondents in Precincts Statistically significant difference between groups: highlighting higher and lower benefits
Q18. What if any benefits would wind farms bring to your local region?
* Categories of responses are in bold – the percentages represent the nett of residents giving a response that falls into that category. The main sub-categories of responses are shown below each category.

Community Attitudes to Wind Farms in NSW
© 2010 AMR Interactive 46
Perceived concerns about wind farms
Residents were asked, unprompted, what concerns they had about wind farms
Residents also mentioned a number of different types of concerns about wind farms in their local region (Table 20). The most common responses were about the impact on people, in particular about noise concerns and the location of the wind farms. Other common responses were about the impact of wind farms on the landscape. Less frequent responses were about concern over the effectiveness of the power generation and the impact on the environment.
The large majority of residents opposing a wind farm being built 1-2 kilometres from their residence raised a concern. In comparison, only about half of those supporting a wind farm did not identify any concerns. Concerns about health or safety were each nominated by only 3% of those opposing. So while a number of residents had not agreed that there were ‘no concerns’ about health (31%) and safety (48%) (Figure 10), it appears to be mainly a lack of knowledge rather than specific concerns.
Table 20. Perceived concerns about wind farms, by level of support/opposition to wind farms 1-2 km from residents, in the Renewable Energy Precincts (unprompted – multi-response)
Concern* Support
(n=1053) %
Oppose (n=589)
%
Impact on people 33 58
Noise concerns 17 40
Location concerns 17 23
Health concerns 1 3
Community relationship concerns 2 1
Concerns for landowners' rights 1 2
Potential for accidents 2 3
Impact on landscape 11 31
Aesthetics/look of it/ugly/take away from the view 9 27
Occupies large areas/spaces/limits potential of agricultural use 3 5
Concern over power generation/effectiveness 5 14
Suitability of the area for a wind farm/too hilly/little wind 2 6
Inefficient/uneconomical/not beneficial 1 6
Unreliable/dependent on weather-no wind no power 2 4
Operational problems 1 2
Impact on environment 6 11
Detrimental to wildlife 3 5
Detrimental to farm animals 1 2
Detrimental to the environment 2 5
Impact on economy/value 1 5
Limited employment opportunities/take jobs away 0 2
Concerns about property value 0 3
General attitude 4 5
Don't like/would not have it 0 2
Need more information/need to know more about it 4 3
None/nothing 44 13
Base: Respondents in Precincts Statistically significant difference between groups: highlighting higher and lower concerns Q19. What if any concerns would you have about wind farms in your local region? * Categories of responses are in bold – the percentages represent the nett of residents giving a response
that falls into that category. The main sub-categories of responses are shown below each category.

Community Attitudes to Wind Farms in NSW
© 2010 AMR Interactive 47
Examples of concerns and benefits by those supporting wind farms
Examples of concerns and benefits expressed by residents who strongly opposed wind farms 1-2 kilometres from their residence are presented below. The profile of the person is provided in each case.
Concern:
“I don't really have any concerns about them I know a lot of people do they worry about the noise and that it will affect the birds and the sheep. But I've seen birds and sheep near them and it doesn’t bother them. It is verging on being outdated technology already and my concern is if they build them and they become outdated whether they'll clean it and take it away or just leave it there.”
Benefits to local region:
“Well to starters it'd give the farmers who's land their going on a bit of income they'd also have to put access roads so that'd be a benefit to the community.”
Reasons for support or opposition:
“They gotta put it somewhere. I don't like the alternative of nuclear…I certainly wouldn't want gas on my land and like I said it would bring income to the farmer whose property it was on.”
Male, over 64 years old Lives out of town in the NSW/ACT Border areas precinct.
Supports wind farms 1-2 km from residence.
Concern:
“None.”
Benefits to local region:
“Construction…thereby employment. Maintenance would bring employment in the area. Economic benefits…if we can produce competitively more power from wind farms it can benefit the local economy.”
Reasons for support or opposition:
“It’s a clean form of energy. My only concern is the cost but that’s an economic issue but it’s a clean form and one we need to develop overtime. As we develop it then the cost of it will go down in the longer term. If it’s effective in the longer term then we should do it.”
Male, 45-55 years old Lives out of town in the NE Tablelands Precinct.
Supports wind farms at 1-2 km from residence.
Concern:
“Don’t agree that they're as efficient as they are made out to be. Reason being that in comparison with solar, the solar would be generating more power. I have a 2 kilowatt solar generator and even though it is cloudy it is still generating lots of power. We haven’t had any wind in the area for the past three days so it wouldn't be very useful in this instance. Overall, not as efficient as solar power. And higher maintenance.”
Benefits to local region:
“Initially employment whilst under construction. Farmers would benefit from the income of having them on their properties.”
Reasons for support or opposition:
“May not be my preference of energy. However if the government is supporting wind farms then it helps with reducing green house emissions I guess.”
Female, 30-44 years old Lives in town in the Cooma-Monaro precinct . Supports wind farms 1-2 km from residence.
Concern:
“No concerns no negatives except the construction”
Benefits to local region:
“Our power bills are through the roof. If they could reduce country energy bills. And reduce greenhouse emissions.”
Reasons for support or opposition:
“Just the fact not using fossil fuel for energy. Resources not limitless.”
Female, 55-65 years old Lives out of town in the Upper Hunter precinct . Supports wind farms 1-2 km from residence.

Community Attitudes to Wind Farms in NSW
© 2010 AMR Interactive 48
Examples of concerns and benefits by those opposing wind farms
Examples of concerns and benefits expressed by residents who strongly opposed wind farms 1-2 kilometres from their residence are presented below. The profile of the person is provided in each case.
Concern:
“That they take away the views and visibly distracting as well would be a concern to us.”
Benefits to local region:
“Employment and cheaper electricity as well.”
Reasons for support or opposition:
“It would be better if it was more isolated areas and not near residential areas.”
Male, 34-44 years old Lives out of town in the Central Tableland precinct.
Supports wind farms 1-2 km from residence.
Concern:
“Where they are going to put them, that's the thing. Plenty of national parks out there. No other concerns.”
Benefits to local region:
“Cheaper power. Nothing else that I know of."
Reasons for support or opposition:
“Cheaper power. Nothing else that I can think of.”
Male, 18-29 years old Lives in town in the South Coast precinct . Supports wind farms 1-2 km from residence.
Concern:
“Well the concern is that I think it brings about controversies in the country because some people benefit from it financially…those who have the wind turbines on their property. And the people that have to put up with the noise and the light. The light would be a big thing.”
Benefits to local region:
“Green power. and jobs.”
Reasons for support or opposition:
“Because it is green energy. I just think it's a pity that instead
of putting into rural areas that they don't put it along roads. This area here it is a nice area here. I don't have a problem with the one planned, but there are families that have lived in the area for generations and the suburbs will be lost. I'm from Holland and they have it along the roads. I wish they were on the Pacific Highway. Doesn't matter because there is a lot of noise there already.”
Female, 30-44 years old Lives in town in the NSW/ACT Border Region Precinct. Strongly opposes wind farms 1-2 km from residence,
but supports 10 km from residence.
Concerns:
“I’ve heard they can drive people crazy with the noise…the ones in Europe have. The structures… some people may not like on their property.”
Benefits to local region:
“It could be cheaper electricity for people.”
Reasons for support or opposition:
“Only what I hear about the noise they create.”
Male, 55-64 years old Lives out of town in New Eng. Tablelands Precinct.
Strongly opposes wind farms 1-2 km from residence,
also opposes 10km from residence.

Community Attitudes to Wind Farms in NSW
© 2010 AMR Interactive 49
Concern:
“Don't know enough to say.”
Benefits to local region:
“In the five to ten years negligible, there's so many coal mines in the area that I can't see it being a major influence in the area. In theory it's clean energy but so many people around here rely on the dirty energy for the income. Too many vested interests.”
Reasons for support or opposition:
“1-2 km is still in town, so they're not likely to put it in town, but there's plenty of ridges out of town to put them on... Not a problem except for the land owners…fine for me but don't know for them.”
Male, 18-29 years old Lives in town in the Upper Hunter Precinct.
Strongly opposes wind farms 1-2 km from residence, but supports 10km from residence.
Concern:
“We have a beautiful natural landscape and that it will destroy it. I also think that because wind is proving to be so inefficient if we build large scale wind farms the government is going to look ridiculous because it is not going to work and we have destroyed our beautiful landscape.”
Benefits to local region:
“None. I think the whole problem is that they think they will benefit and everybody knows that the wind is inefficient. When you often drive past Bungendore’s new winds farm you can see that often the turbines aren't working. I think what would be interesting is that if the government would provide the audit like in Bungendore wind farm and show us the benefit. I would rather want to see power be generated effectively and efficiently. Wind is not efficient.”
Reasons for support or opposition:
“No coal fired electricity is going to be shut down because of the wind farm and the strongest thing that in the rural community is the sense of the community. The way they have come in to propose their development has torn the community apart and I really resent that.”
Female, 30-44 years old Lives in town in the Cooma-Monaro Precinct.
Strongly opposes wind farms 1-2 km from residence, and also strongly opposes 10km from residence.
Concern:
“Wind farms are within 100 yards to where I live and they are too noisy. Don’t mind looking at them but its only the noise which is annoying.”
Benefits to local region:
“No benefits in particular.”
Reasons for support or opposition:
“They are only noisy when you’re living close to them.”
Female, over 64 years old Lives in town in the Central Tablelands precinct .
Strongly opposes wind farms 1-2 km from residence,
but supports 10km from residence.
Concern:
“Major concern with migrating bird population. Ugliness of what they look like. Noise. Change in general people don’t like change.”
Benefits to local region:
“Employment. Growing area so would be a greater source of electricity. Tourism area so could be a tourist attraction. Stick it up to the local coal industry"
Reasons for support or opposition:
“Close enough to town for people and tourists to go out there. As well as close enough for maintenance.”
Male, 18-29 years old Lives out of town in the Central Tablelands Precinct.
Opposes wind farms 1-2 km from residence,
but strongly supports 10km from residence.

Community Attitudes to Wind Farms in NSW
© 2010 AMR Interactive 50
4.6 Segmentation of supporters and opposers
Residents in the Precincts were divided into three groups based on the combination of their support or opposition to wind farms (a) in NSW, and (b) 1-2 kilometres from their residence. The majority (60%) were categorised as Strong Supporters being supportive in both NSW and at 1-2 kilometres (Table 21). About a quarter (27%) of residents were NSW-Only Supporters, while a small minority (13%) were categorised as Opposers, showing no support either in NSW or at 1-2 kilometres.
Table 21. Segmentation of strong supporters and opposers in the Precincts
Group Wind farms
in NSW
Wind farms 1-2 km from residence
Incidence*
1. Strong Supporters Support Support 60%
2. NSW-Only Supporters Support Oppose/Don’t know 27%
3. Opposers Oppose Oppose/Don’t know 13%
* A few residents (<3%) were undecided on both ratings of support. The incidence has been calculated without these residents.
Differences between the three segments are summarised in Figures 17 and 18. The Strong Supporters were more positive than the NSW-Only Supporters on most of the attitudes and perceptions, around the feasibility and efficiency of wind power and the impacts and benefits. The strongest difference was on potential concern about noise, on which the NSW-Only Supporters were as negative as the Opposers. Opposers were very much less positive on almost all the attitudes and perceptions.
The segments also differed in their age profile, most noticeable in a decrease in the incidence of those aged 65 years and over as support increased (Table 22). About a third (32%) of Opposers were aged 65 years and over compared with less than a fifth (17%) of Strong Supporters. There was a corresponding increase in the incidence of those aged 18-29 years as support increased.
Table 22. Age profile of segments in the Precincts
Age group
Strong Supporters
(n=978) %
NSW-Only Supporters
(n=479) %
Opposers (n=202)
%
18-29 20 13 9
30-44 26 24 29
45-64 37 37 30
65+ 17 26 32
Statistically significant difference between groups: highlighting age groups with specific higher and lower incidence

Community Attitudes to Wind Farms in NSW
© 2010 AMR Interactive 51
95
75
57
93
94
98
58
60
79
59
44
84
90
96
57
59
25
26
28
47
78
83
55
58
20 40 60 80 100
% of residents
Strong Supporters (n=978)
NSW-Only Supporters (n=479)
Opposers (n=202)
Figure 17. Positive ratings of questions on wind power, by segments across the Precincts
Wind power acceptable as a power source [Acceptable]
Wind power is efficient and reliable [Agree]
Wind power is the cheapest renewable energy source
[Agree]
NSW has great potential and abundant resources for wind
power [Agree]
Wind power has lower greenhouse gas emission than
coal or gas [Agree]
Wind power is a clean source of energy [Agree]
Knowledge of wind farms [A lot/moderate amount]
Aware of wind power as a clean energy source
[Unprompted]
The Strong Supporters were more likely than the NSW-Only Supporters to see wind power as a feasible source of energy, and efficient/reliable.
The Opposers were very significantly less likely to consider wind power as an acceptable energy source, doubting its efficiency/reliability and much less accepting of the resources in NSW.
There was little difference between the segments on awareness of wind power as a clean energy source and knowledge of wind farms.

Community Attitudes to Wind Farms in NSW
© 2010 AMR Interactive 52
60
92
67
94
64
65
44
82
92
78
73
62
20
59
40
70
40
41
21
60
71
61
56
48
14
2
11
10
11
10
6
34
16
25
24
22
0 20 40 60 80 100
% of residents
Strong Supporters (n=978)
NSW-Only Supporters (n=479)
Opposers (n=202)
Figure 18. Positive ratings of attitudes to wind farms, by segments across the Precincts
Noise a concern 1-2 km away [No/little concern]
There should be more wind farms built in your local
region [Agree]
Impact of wind farms on visual appeal
[Positive/No impact]
Local council should be more active encouraging wind
farms [Strongly agree]
Impact of wind farms on property values
[Positive/No impact]
Wind farms would not affect heritage values in your local
region [Agree]
Wind farms in your local region would help increase
tourism [Agree]
There would no health concerns associated with
wind farms [Agree]
Wind farms would benefit your local community [Agree]
Wind farms would boost employment and bring
money into the local economy [Agree]
Wind farms would have a negative impact on the local
environment [Disagree]
There would be no safety concerns associated with
wind farms [Agree]
The Strong Supporters were more positive than the NSW-Only Supporters on all impacts and benefits of wind farms asked in the survey. The strongest difference was in potential concern about noise. This was the only feature on which the NSW-Only Supporters were as negative as the Opposers. The Opposers were significantly less positive about all the potential impacts and benefits of wind farms. Compared to their other ratings, Opposers held slightly more positive attitudes about health and safety concerns, and impact on the local environment.

Community Attitudes to Wind Farms in NSW
© 2010 AMR Interactive 53
4.7 What is driving support for wind farms? – Residents
Modelling support for wind farms
The aim of the modelling was to understand what influences support or opposition to wind farms. The modelling identified issues that can be addressed to increase support. The modelling assessed how a range of attitudes and perceptions, as well as demographic and geographic features, influenced the level of support for wind farms at 1-2 kilometres.
The range of attitudes and perceptions collected in the study reduced to three key dimensions9 (Table 23). These dimensions encompassed:
• benefits and impacts of wind farms
• perceptions of wind power; and
• concerns about wind farms.
Table 23. Attitudinal dimensions for residents in the Precincts
Dimension Components
Effect on property values
Effect on visual appeal
Help increase tourism
Benefit your local community
Boost employment and bring money into the local economy
Concern about noise
Benefits/Impacts of wind farms
Negative impact on the local environment
Perceptions of wind power A clean source of energy
Lower greenhouse gas emission than coal or gas
NSW has great potential and resources for wind power
Efficient and reliable
Cheapest renewable energy source
No safety concerns
No health concerns
Concerns about wind farms
No effect on heritage values in your local region
The importance of each measure in driving support is shown in the model in Figure 19. The dimension about benefits/impacts of wind farms had by far the strongest influence on support. The other dimensions about perceptions of wind power and concerns about wind farms also had strong influences.
In addition to the dimensions, proximity to existing or planned wind farms was also of moderate importance driving support. Precinct, age, education, knowledge and gender had much weaker influence.
9 The reduction to three dimensions was conducted using principal component analysis (see Appendix C)

Community Attitudes to Wind Farms in NSW
© 2010 AMR Interactive 54
Figure 19. Attitudinal and demographic drivers of support for wind farms across the six Precincts, showing the strength of relationship*
9.3
3.4
3.4
2.4
1.5
1.5
1.5
1.4
1.3
Benefits/Impacts of wind farms [dimension]
Other concerns about wind farms [dimension]
Features of wind power [dimension]
Wind farm visible from residence
Precincts
Age group
Education
Knowledge of wind farms
Gender
Driver strength*
Sta
tis
tic
ally
s
ign
ific
an
t d
riv
ers
* The strength of each measure in the model is expressed as an odds ratio10, and the figure represents the greatest change in support moving between two levels of the variable
10 The strength is expressed as an odds ratio, measuring how agreement/nomination of the attitude changes moving from opposition to support for wind farms. See Appendix C for description of an odds ratio.

Community Attitudes to Wind Farms in NSW
© 2010 AMR Interactive 55
4.8 What is driving support in each Precinct?
Further analysis was conducted to look at how residents’ attitudes and perceptions about wind power and wind farms in each Precinct drives support for wind farms at 1-2 kilometres. The importance of each attitude/perception is based on the gap between supporters and opposers on how favourably each attitude/perception was rated. The greater the gap, the greater the importance of the measure. Table 24 summaries the attitudes and perceptions in each Precinct which are of greater importance in driving support and which are less favourably rated in the Precinct.
Table 24. Summary of the attitudes/perceptions in each precinct of greater importance in driving support and which are less favourably rated
PRECINCT
Attitudes/Perceptions New
England Tablelands
Upper Hunter
Central Tablelands
NSW/ACT Border Region
South Coast
Cooma- Monaro
Noise concern � �� � �� � ��
Effect on heritage values � � �
Impact on visual appeal � � � �
Impact on property values � � � �
Boost local economy �
Cheapest renewable energy �
Benefit to local community �
Impact on local environment �
Help increase tourism �
Safety concerns �
� = target measure �� = distinctly high importance
Concern about noise was one of the more important drivers in all Precincts, and was of distinctly high importance in three of the Precincts: Upper Hunter, NSW/ACT Border Region, and Cooma-Monaro.
Individual figures for each Precinct are presented in Section 5.2 Precinct Snapshots (Figures 18-23). Each figure shows the importance of each attitude and perception in driving support, and how favourably each one was rated by residents in the Precinct.

Community Attitudes to Wind Farms in NSW
© 2010 AMR Interactive 56
5.0 Precinct summaries
5.1 Precinct overview
A summary of the six Renewable Energy Precincts is presented. The first summary below includes
some general information about wind farm projects, demographics and overall support.
NSW/ACT BORDER REGION
WIND PROJECTS: Installed – 1 (Crookwell I with 8 turbines), Approved - 7 (Conroys Gap,
Capital, Taralga, Crookwell II, Cullerin Range, Gunning and
Gullen Range with a total of approximately 300 turbines), Under Assessment or proposed – 3
(Yass Valley, Gurrundah and Bannister with a total of over 200 turbines)
POPULATION: Approx 101,000 adults, accounting for 15% of
adult population across the
Renewable Energy Precincts
Survey: 71% in town, 29% out-of-
town
SUPPORT FOR WIND FARMS:
Average support for wind farms
within 1-2 km, above average for 10 km (+5%)
NEW ENGLAND TABLELANDS
WIND PROJECTS: Approved - 1 (Glen Innes with 27 turbines),
Under Assessment - 2 (Ben Lomond and Sapphire with approx.
250 turbines in total)
POPULATION: Approx 172,000 adults, accounting for 24% of
adult population across the Renewable Energy Precincts
Survey: 70% in town, 30% out-of-town
SUPPORT FOR WIND FARMS: Average support for wind farms within 10 km and 1-2 km
UPPER HUNTER
WIND PROJECTS: Approved - 1
(Kyoto Energy Park with up to 34 x
3MW wind turbines)
POPULATION: Approx 30,000
adults, accounting for 4% of adult population across the Renewable
Energy Precincts
Survey: 64% in town, 36% out-of-town
SUPPORT FOR WIND FARMS: Lower than average support for wind farms within 10 km (-5%) and
1-2 km (-10%)
CENTRAL TABLELANDS
WIND PROJECTS: Installed or Constructed – 2 (Hampton Wind Farm and Blayney with a
total of 17 turbines)
Approved - 1 (Black Springs
with 9 turbines)
Under Assessment – 1 (Flyers Creek with 40 turbines)
POPULATION: Approx 157,000 adults, accounting
for 22% of adult population
across the Renewable Energy Precincts
Survey: 67% in town, 33% out-of-town
SUPPORT FOR WIND FARMS: Higher than average support
for wind farms within 1-2 km
(+6% each), average for 10 km
COOMA-MONARO
WIND PROJECTS: Approved - 1 (Snowy Plains/ Berridale with 16 turbines), Under Assessment – 1 (Boco Rock with 125 turbines)
POPULATION: Approx 23,000 adults, accounting for 3% of adult population across the Renewable
Energy Precincts
Survey: 63% in town, 37% out-of-town
SUPPORT FOR WIND FARMS: Average support for
wind farms within 10 km and 1-2 km
SOUTH COAST
WIND PROJECTS: None
POPULATION: Approx 234,000 adults, accounting for 32% of adult population across the Renewable
Energy Precincts
Survey: 54% in town, 45% out-of-town
SUPPORT FOR WIND FARMS: Average support for
wind farms within 10 km and 1-2 km

Community Attitudes to Wind Farms in NSW
© 2010 AMR Interactive 57
5.2 Precinct snapshots
Overview
More detailed summaries of the six Precincts are presented below. These highlight issues where the
Precinct differs from the average of the six Precincts (by at least ±5%).
A figure is also presented for each Precinct showing the importance of attitudes and perceptions in driving support and how favourably each one was rated by residents in the Precinct (Figures 20-25). Each figure is shown as a quadrant formed in the following way:
• Vertical axis: This shows the importance of each attitude/perception in driving support. The importance is based on the gap between supporters and opposers on how favourably each attitude/perception was rated. The greater the gap, the greater the importance of the measure. A line has been drawn to split the measures into higher and lower importance.
• Horizontal axis: This shows how favourably each attitude/perception was rated, as a percentage of residents in the Precinct. The specific rating differs by the type of question. A line has been drawn at 60% (about the average across all measures) to split the attitudes/perceptions into being more or less favourably rated.
The attitudes and perceptions in the top left quadrant represent those which are of higher importance and which are less favourably rated by residents in the Precinct, as illustrated below. The top right quadrant in each figure represents attitudes and perceptions which are of higher importance in driving support and are being rated more favourably by residents.
Higher importance – less favourably rated
Higher importance – more favourably rated
Increasing importance �
More favourably rated �

Community Attitudes to Wind Farms in NSW
© 2010 AMR Interactive 58
New England Tablelands
Figure 20. Driving support for wind farms in New England Tablelands: showing strength of importance of attitudes/perceptions and how favourably they were rated
Effect on heritage valuesNoise concerns
Benefit local communityBoost local economy
Impact on property valuesAcceptable for power plant
Impact on local environment
Impact on visual appealHelp increase tourism
Efficient and reliable
Cheapest renewable energyHealth concernsSafety concerns
Great potential & resources
Knowledge
Clean source of energyLower greenhouse emission
Awareness of wind power
20% 30% 40% 50% 60% 70% 80% 90% 100%
Increasing
importance
More favourable rating
WIND PROJECTS: Approved - 1 (Glen Innes with 27 turbines). Under Assessment - 2 (Ben Lomond and Sapphire with approx. 250 turbines in total)
POPULATION: Approx 172,000 adults, accounting for 24% of adult population across the Renewable Energy Precincts; 70% in town and 30% out-of-town
SUPPORT FOR WIND FARMS: Average support for wind farms within 10 km and 1-2 km; ‘strong support’. Lower for wind farms at state level (-10%) and local region (-7%).
AWARENESS AND KNOWLEDGE
• Less likely to have seen a wind turbine (-22%)
• Less likely to have been within earshot (-15%)
• Less likely to feel knowledgeable about wind farms (-14%)
• Lower awareness of currently operating wind farms in NSW (-33%)
• Lower awareness of wind farms in local region (-22%)
• Lower awareness of wind farms being planned in NSW (-7%)
ATTITUDES AND CONCERNS
• Wind power is regarded as less acceptable (-5%); conventional coal plants more acceptable (+10%)
• Conventional coal fired power plants more acceptable (+9%)
• More likely to have safety concerns (+7%)
CONSULTATION AND FURTHER INFORMATION
• Less likely to believe there has been adequate consultation (-8%)
• Less likely to want further information (-7%)

Community Attitudes to Wind Farms in NSW
© 2010 AMR Interactive 59
Upper Hunter
Figure 21. Driving support for wind farms in Upper Hunter: showing strength of importance of attitudes/perceptions and how favourably they were rated
Noise concerns
Boost local economyImpact on property values
Impact on visual appealHealth concerns
Benefit local communityEfficient and reliable
Effect on heritage values
Safety concerns Impact on local environment
Acceptable for power plant
Cheapest renewable energy Great potential & resourcesHelp increase tourism
Clean source of energy
Lower greenhouse emission
Knowledge Awareness of wind power
20% 30% 40% 50% 60% 70% 80% 90% 100%
Increasing
importance
More favourable rating
WIND PROJECTS: Approved - 1 (Kyoto Energy Park with up to 34 x 3MW wind turbines) POPULATION: Approx 30,000 adults, accounting for 4% of adult population across the Renewable Energy Precincts; 64% in town and 36% out-of-town SUPPORT FOR WIND FARMS: Lower support for wind farms within 10 km (-5%) and 1-2 km (-10%). ‘Strong support’ lower for wind farms at state level (-11%) and at local regional level (-11%) AWARENESS AND KNOWLEDGE
• Less likely to have seen a wind turbine (-6%)
• Lower awareness of currently operating wind farms in NSW (-13%)
• Higher awareness of wind farms being planned in NSW (+17%)
• More likely to report location of current/planned wind farm visible (+9%) ATTITUDES AND CONCERNS
• Conventional coal fired power plants more acceptable (+9%)
• Less likely to believe wind energy is efficient and reliable (-10%)
• Less strong agreement wind has lower emissions or is clean (-9% each), or with potential in NSW (-6%)
• Less positive about economic benefits to local economy (-10%), or benefitting community (-8%)
• Less positive about safety (-5%)
• More negative about impacts on environment (-9%), heritage values (-8%), property values (-7%), visual appeal (-7%) and noise concerns (-7%)
CONSULTATION AND FURTHER INFORMATION
• More likely to have heard about the initiative for setting up renewable energy precincts (+6%)
• More likely to feel there has been adequate consultation (+10%)

Community Attitudes to Wind Farms in NSW
© 2010 AMR Interactive 60
Central Tablelands s
Figure 22. Driving support for wind farms in Central Tablelands: showing strength of importance of attitudes/perceptions and how favourably they were rated
Benefit local community
Noise concerns
Acceptable for power plantImpact on visual appeal Efficient and reliableHealth concerns
Impact on property values
Effect on heritage values
Safety concerns
Help increase tourismCheapest renewable energy Great potential & resources
Boost local economyImpact on local environment
Lower greenhouse emission
Awareness of wind power
Clean source of energy
Knowledge
20% 30% 40% 50% 60% 70% 80% 90% 100%
Increasing
importance
More favourable rating
WIND PROJECTS: Installed or Constructed – 2 (Hampton Wind Farm and Blayney with a total of 17 turbines). Approved - 1 (Black Springs with 9 turbines); Under Assessment – 1 (Flyers Creek with 40 turbines). POPULATION: Approx 157,000 adults, accounting for 22% of adult population across the Renewable Energy Precincts; 67% in town and 33% out-of-town. SUPPORT FOR WIND FARMS: Higher than average support for wind farms 1-2 km (+6%). Higher support at local regional level (+6%), and above average ‘strong support’ at state level (+10%). AWARENESS AND KNOWLEDGE
• More likely to have seen a wind turbine (+7%)
• More likely to have been within earshot (+10%)
• More likely to feel knowledgeable about wind farms (+9%)
• Higher awareness of currently operating wind farms in NSW (+19%)
• Higher awareness of wind farms in local region (23%)
• Lower awareness of wind farms being planned in NSW (-15%) ATTITUDES AND CONCERNS
• Interestingly conventional coal fired power plants are more acceptable than average (+6%)
• More likely to see no negative impact on environment (+5%)
• More likely to see benefits from tourism (+8%) CONSULTATION AND FURTHER INFORMATION
• More likely to want further information (+6%)

Community Attitudes to Wind Farms in NSW
© 2010 AMR Interactive 61
NSW/ACT Border Region
Figure 23. Driving support for wind farms in NSW/ACT Border Region: showing strength of importance of attitudes/perceptions and how favourably they were rated
Noise concerns
Impact on property values
Impact on visual appeal
Benefit local communityCheapest renewable energy Impact on local environment
Health concernsAcceptable for power plant
Boost local economySafety concernsEfficient and reliable
Effect on heritage valuesHelp increase tourism
Great potential & resources
Knowledge Clean source of energy
Lower greenhouse emissionAwareness of wind power
20% 30% 40% 50% 60% 70% 80% 90% 100%
Increasing
importance
More favourable rating
WIND PROJECTS: Installed – 1 (Crookwell I with 8 turbines); Approved - 7 (Conroys Gap, Capital, Taralga, Crookwell II, Cullerin Range, Gunning and Gullen Range with a total of approximately 300 turbines). Under Assessment or proposed – 3 (Yass Valley, Gurrundah and Bannister with a total of over 200 turbines). POPULATION: Approx 101,000 adults, accounting for 15% of adult population across the Renewable Energy Precincts; 71% in town and 29% out-of-town. SUPPORT FOR WIND FARMS: Average support for wind farms within 1-2 km, above average support at 10 km (+5%). Above average ‘strong support' at state level (+8%) and local regional level (+10%). AWARENESS AND KNOWLEDGE
• More likely to have seen a wind turbine (+13%)
• More likely to have been within earshot (+9%)
• Higher awareness of currently operating wind farms in NSW (+24%)
• Higher awareness of wind farms in local region (+22%)
• Higher awareness of wind farms being planned in NSW (+10%) ATTITUDES AND CONCERNS:
• Wind power is regarded as more acceptable (+6%)
• More likely to strongly consider having lower greenhouse gas emission than coal (+11%)
• More negative about visual impacts (-9%)
• Less likely to be concerned about noise (+6%)
• More likely to see benefits from tourism (+6%) CONSULTATION AND FURTHER INFORMATION
• More likely to feel there has been adequate consultation (+8%)
• More likely to want further information (+5%)

Community Attitudes to Wind Farms in NSW
© 2010 AMR Interactive 62
South Coast
Figure 24. Driving support for wind farms in South Coast: showing strength of importance of attitudes/perceptions and how favourably they were rated
Benefit local community
Effect on heritage values
Noise concernsImpact on visual appeal
Acceptable for power plant
Health concerns
Help increase tourismBoost local economy
Impact on property values
Impact on local environmentGreat potential & resources
Safety concernsEfficient and reliable
Lower greenhouse emission
Clean source of energyCheapest renewable energy
Awareness of wind powerKnowledge
20% 30% 40% 50% 60% 70% 80% 90% 100%
Increasing
importance
More favourable rating
WIND PROJECTS: None POPULATION: Approx 234,000 adults, accounting for 32% of adult population across the Renewable Energy Precincts, 54% in town, 45% out-of-town. SUPPORT FOR WIND FARMS: Average support for wind farms within 10 km and 1-2 km. Average support at state level and local regional level. AWARENESS AND KNOWLEDGE
• Less likely to feel knowledgeable about wind farms (-7%)
• Lower awareness of wind farms currently in operation in NSW (-11%)
• Lower awareness of wind farms in local region (-26%)
• Lower awareness of wind farms being planned in NSW (-20%) ATTITUDES AND CONCERNS
• Less likely to see benefits from tourism (-5%) CONSULTATION AND FURTHER INFORMATION
• Less likely to feel there has been adequate consultation (-13%)
• Less likely to want further information (-6%)

Community Attitudes to Wind Farms in NSW
© 2010 AMR Interactive 63
Cooma-Monaro
Figure 25. Driving support for wind farms in Cooma-Monaro: showing strength of importance of attitudes/perceptions and how favourably they were rated
Noise concerns
Impact on visual appeal Benefit local communityImpact on property values
Acceptable for power plantEffect on heritage valuesHealth concerns
Impact on local environmentSafety concerns
Cheapest renewable energy
Efficient and reliable
Help increase tourism Great potential & resourcesBoost local economy
Lower greenhouse emission
Clean source of energy
KnowledgeAwareness of wind power
20% 30% 40% 50% 60% 70% 80% 90% 100%
Increasing
importance
More favourable rating
WIND PROJECTS: Approved - 1 (Snowy Plains/ Berridale with 16 turbines). Under Assessment – 1 (Boco Rock with 125 turbines) POPULATION: Approx 23,000 adults, accounting for 3% of adult population across the Renewable Energy Precincts; 63% in town, 37% out-of-town. SUPPORT FOR WIND FARMS: Average support for wind farms within 10 km and 1-2 km. Average support at state level and local regional level. AWARENESS AND KNOWLEDGE
• More likely to have seen a wind turbine (+6%)
• More likely to feel knowledgeable about wind farms (+11%)
• Higher awareness of currently operating wind farms in NSW (+14%)
• Higher awareness of wind farms being planned in NSW (+16%) ATTITUDES AND CONCERNS
• Water/hydroelectric power is regarded as more acceptable (+12%), conventional coal-fired as less acceptable (-11%)
• Less likely to believe property values will be negatively affected (+5%) CONSULTATION AND FURTHER INFORMATION
• More likely to feel there has been adequate consultation (+8%)

Community Attitudes to Wind Farms in NSW
© 2010 AMR Interactive 64
6.0 Results – Business survey
6.1 Perceptions of local region
Businesses were asked to rate how well their local region performs on a number of socio-economic issues
Almost three quarters of businesses rated the local region as excellent/good the overall standard of living (63%) and the local environment (62%) (Figure 26). This rating reduced to less than half for health of the local economy (42%) and investment by business (36%). Employment opportunities (26%) and level of investment (16%) by government were rated least well.
Ratings of the local region were similar for both farming and non-farming businesses. The largest difference was in rating of employment opportunities (63% and 56% respectively for ratings of average or above) (Table 25).
There was little difference between the industry sub-groups, with Business Services rating the level of investment by business the highest (48% as excellent/good compared with 26-40%).
Figure 26. Perceptions of local region as a business manager, by businesses
63
62
42
36
27
17
30
23
32
36
30
25
6
8
22
20
32
39
1
3
3
2
8
15
4
2
7
3
4
0 20 40 60 80 100
The overall standard of living
Local environment
The overall health of the local economy
The level of investment by business*
Employment opportunities
The level of Investment by government*
% of businesses
Excellent/Good Average Poor Very poor Don't know
Base: All businesses * Not asked of farmers Q6. How would you rate your local region on these issues?

Community Attitudes to Wind Farms in NSW
© 2010 AMR Interactive 65
Table 25. Ratings of local region as a business manager, by business groupings
TOTAL NON-FARMING FARMING
Feature
Total Businesses
(n=419)
Non- Farming
Businesses (n=289)
Industrial, Manufacture,
Transport (n=79)
Retail, Wholesale
(n=75)
Business, Services (n=57)
Community, Personal, Hospitality
(n=78) Farming (n=130)
% % % % % % %
The overall standard of living
Excellent/Good 63 65 71 64 61 59 59
Average/Poor 36 35 29 35 38 41 40
Don’t know 1 1 0 1 2 0 0
Local environment
Excellent/Good 62 62 64 69 63 50 63
Average/Poor 34 34 30 28 35 48 34
Don’t know 4 4 6 3 2 3 4
The overall health of the local economy
Excellent/Good 42 42 45 41 42 37 42
Average/Poor 56 57 53 57 56 62 56
Don’t know 2 2 2 2 2 1 3
The level of investment by business
Excellent/Good - 36 40 26 48 31 -
Average/Poor - 57 50 72 52 56 -
Don’t know - 7 10 1 0 13 -
Employment opportunities
Excellent/Good 27 25 29 23 27 19 31
Average/Poor 70 73 69 75 72 78 63
Don’t know 3 2 2 2 2 3 5
The level of investment by government
Excellent/Good - 17 21 10 15 19 -
Average/Poor - 79 75 85 85 72 -
Don’t know - 4 4 5 0 8 -
Base: All businesses Statistically significant difference between groups: highlighting higher and lower ratings Q6. How would you rate your local region on these issues?

Community Attitudes to Wind Farms in NSW
© 2010 AMR Interactive 66
6.2 Renewable energy
Businesses were asked to mention, unprompted, the clean energy sources they were aware of. Businesses were asked which of a given list of power sources were acceptable to them if a new power station was to be built in their local region.
Solar power was the most recognised clean energy source by over three quarters (84%) of businesses (Table 26). Wind power was named by over two thirds (72%) of businesses, with farming businesses (85%) having the highest awareness.
When asked about the acceptability of different power sources for an electricity plant, solar power (95%) and wind power (83%) were again the most identified as acceptable (Table 27). Conventional coal power was only rated as acceptable by about a third of businesses. Wind power is well established among business managers as a clean energy source at top of mind, and as acceptable for new power stations.
Table 26. Spontaneous awareness of clean energy sources, by business groupings
TOTAL NON-FARMING FARMING
Energy source
Total Businesses
(n=419)
Non- Farming (n=289)
Industrial, Manufacture,
Transport (n=79)
Retail, Wholesale
(n=75)
Business Services (n=57)
Community, Personal, Hospitality
(n=78) Farming (n=130)
% % % % % % %
Sun or solar 84 80 80 83 90 67 97
Wind 72 68 68 64 71 67 85
Water/hydroelectric 23 22 21 24 23 21 24
Gas 16 17 17 19 16 17 11
Geothermal 13 11 11 4 15 14 20
Wave or tidal 13 10 5 9 17 13 22
Nuclear 11 9 12 8 2 11 17
Clean coal 9 9 7 9 7 14 8
Bioenergy/electric 5 3 3 6 0 3 10
Other 3 3 3 5 2 2 5
Don't know 7 9 11 5 3 16 1
Base: All businesses Statistically significant difference between groups: highlighting higher and lower awareness Q7. Which clean energy sources are you aware of (unprompted)?
Table 27. Perception of power sources as acceptable, by business groupings
TOTAL NON-FARMING FARMING
Power source
Total Businesses
(n=419)
Non- Farming (n=289)
Industrial, Manufacture,
Transport (n=79)
Retail, Wholesale
(n=75)
Business Services (n=57)
Community, Personal, Hospitality
(n=78) Farming (n=130)
% % % % % % %
Solar 95 95 95 94 98 95 94
Wind 83 84 80 82 93 84 82
Water/hydroelectric 78 78 74 84 80 78 77
Gas 70 73 73 67 80 74 62
Coal 36 35 39 35 27 35 40
Nuclear 32 35 30 42 42 28 25
Base: All businesses Q8. Which power sources would you consider to be acceptable?

Community Attitudes to Wind Farms in NSW
© 2010 AMR Interactive 67
6.3 Awareness and knowledge about wind farms
General awareness and knowledge
Businesses were asked about their awareness of wind turbines/farms, including whether they had heard about them, had seen one, had been close enough to hear one operating, and how much they knew about wind farms
Almost every business indicated awareness of wind farms for producing electricity (Table 28). A large majority (89%) had seen a wind farm or turbine. Close to half (43%) of businesses reported having been close enough to a wind farm to hear it operating, although this was lower among
farming businesses (32%) than non-farming businesses (47%).
About three quarters (78%) of businesses were aware of operating wind farms and almost half (44%) were aware of a wind farm being planned or under construction. Farming businesses (66%) were the most likely to be aware of wind farms being planned or under construction, and the retail/wholesale sector (39%) was least likely.
Over two thirds (71%) of businesses reported having a ‘lot’ or ‘moderate’ amount of knowledge about wind farms.
Table 28. General awareness of wind farms, by business groupings
TOTAL NON-FARMING FARMING
Awareness
Total Businesses
(n=419)
Non- Farming (n=289)
Industrial, Manufacture,
Transport (n=79)
Retail, Wholesale
(n=75)
Business Services (n=57)
Community, Personal, Hospitality
(n=78) Farming (n=130)
% % % % % % %
Heard about wind farms
100 100 99 100 100 100 100
Seen a wind farm
89 90 90 87 90 92 85
Heard wind farm operating
43 47 47 53 49 37 32
Knowledge of wind farms
A lot 19 19 16 22 21 17 19
A moderate amount
52 51 50 50 50 57 55
A little 27 30 27 23 25 23 27
Only heard name
3 4 1 5 1 3 3
Base: All businesses Statistically significant difference between groups: highlighting higher and lower awareness Q9. Have you heard about the use of wind farms or wind turbines or windmills to generate electricity? Q10a. Have you seen an actual wind turbines or windmill to generate electricity? Q28. Have you been close enough to an operating wind turbine or wind farm to hear it? Q15a. Are you aware of any wind farms in NSW under construction or being proposed?

Community Attitudes to Wind Farms in NSW
© 2010 AMR Interactive 68
Sources of information
Businesses were asked to mention, unprompted, where they had heard or received information about wind farms
The key source of information about wind farms was news and current affairs on television and radio (43%) (Table 29). Local newspapers (28%) and state/national newspapers (24%) were also commonly reported. A further common source was through word of mouth or experience of wind farms locally (21%). A range of other less frequent sources were suggested, including the business manager’s own research, as well as from wind farm developers, energy companies and community groups.
Table 29. Source of information about wind farms, by business groupings (unprompted – multi-response)
Source*
All Businesses
(n=419)
Non-Farming (n=289)
Farming (n=130)
% % %
News and media
Television or radio stations 43 40 51
Local newspapers 28 24 29
State/national newspapers 25 22 31
Other media 5 5 4
Personal Exposure, word of mouth, own research
Word of mouth / Seen operating locally 21 21 21
Own research/internet 11 13 4
Seen interstate/overseas 5 6 1
Government / Companies
Wind farm developers 8 8 9
Energy companies 3 4 2
Local Government 2 2 2
State Government 1 1 1
Local community and groups
Local community groups or social clubs 3 2 5
Environment groups 3 3 5
Landscape Guardians 3 2 4
Local business groups 1 1 2
Other
Nowhere in particular 7 5 12
Heard nothing 6 8 0
Base: All businesses Q29. From where have you heard or received any information about wind farms? (unpompted)

Community Attitudes to Wind Farms in NSW
© 2010 AMR Interactive 69
Consultation and further information
Businesses were asked about their engagement with wind power regarding awareness of the government’s renewable energy initiative, whether they considered they had had adequate consultation about wind farms, and whether they had adequate information about wind farms
Over a third (39%) of businesses reported having heard about the NSW Government’s initiative for setting up Renewable Energy Precincts (Table 30), higher than the result among residents of the Precincts. Less than a quarter (21%) of businesses, however, felt that they had received adequate consultation about wind farms, and more than a third (37%) considered that they had adequate information. These results set good baselines for measuring improvements in knowledge and consultation as more wind farms are built and promoted.
Table 30. Consultation about potential wind farms and further information, by business groupings
TOTAL NON-FARMING FARMING
Perception of activities
and information
Total Businesses
(n=419)
Non- Farming (n=289)
Industrial, Manufacture,
Transport (n=79)
Retail, Wholesale
(n=75)
Business Services (n=57)
Community, Personal, Hospitality
(n=78) Farming (n=130)
% % % % % % %
Heard about initiative for Renewable Energy Precincts
39 37 41 33 38 33 45
Adequate consultation about wind farms
21 20 18 26 21 16 24
Adequate information about wind farms
37 35 32 34 45 31 42
Base: All businesses Q30. Have you heard about the NSW government initiative for setting up Renewable Energy Precincts? Q33. Do you feel that there is adequate consultation about wind farms available in your local community? Q34a. Do you feel you have adequate information about wind farms?

Community Attitudes to Wind Farms in NSW
© 2010 AMR Interactive 70
The most common types of information needs mentioned by businesses were around the effectiveness of wind farms for power generation, the impacts on the community, including personal health, and personal impact including price of electricity (Table 31). Another common remark from businesses was about receiving general information about wind farms such as in a brochure.
Almost half (43%) of the businesses did not consider that they required any specific information on wind farms. There was little difference between farming and non-farming businesses.
Table 31. Information needs, by non-farming and farming industry groups (unprompted – multi-response)
Information*
Total Businesses
(n=419)
Non- Farming (n=289)
Farming (n=130)
% % %
General information (e.g., brochures) 17 19 12
Effectiveness/how it works - Power generation 17 15 23
Efficiency/how much energy is produced 7 5 12
Comparison with other powers source 3 3 5
Effectiveness – Logistics 9 9 12
Economics of venture/is is it worth doing 6 6 6
Cost of project 4 4 7
Local/community implications 15 15 17
Environmental impact 6 7 5
Location of wind farms 4 3 5
Impact on local community 3 3 4
Health impact 15 14 18
Noise levels 14 13 17
Health and safety concerns 5 5 5
Other personal impact 7 7 8
Want information if proposed nearby 2 2 1
Personal domestic installation/can I get my own 3 2 6
Price of electricity produced 1 2 1
None/nothing 41 44 38
Base: All businesses Q34b. Are there any specific aspects of wind energy or wind farms that you would like more information on?
(unprompted) * Categories of responses are in bold – the percentages represent the nett of residents giving a response that
falls into that category. The main sub-categories of responses are shown below each category.

Community Attitudes to Wind Farms in NSW
© 2010 AMR Interactive 71
6.4 Attitudes to wind power and wind farms
Attitudes to wind power
Businesses were asked to rate their level of agreement with a number of statements about wind power
A large majority of businesses agreed that wind power was a clean energy source (96% in total), had lower greenhouse gas emissions than coal or gas (90%), and that NSW has great potential for wind power (87%) (Figure 27). Agreement was lower for wind power being efficient and reliable (61%) and much lower for wind power being the cheapest renewable energy source (39%). The incidence of
‘don’t know’ responses for the latter was close to half (44%).
There was very little difference in these ratings between the industry groupings (Table 32). It would be expected that agreement with issues could be increased through promotional and educational activity about wind power. In addition, experience with wind farms in operation, information about the actual energy output of the farms, and real measures of savings in cost and pollution should also impact on these perceptions and understanding of wind power.
Figure 27. Attitudes to wind power, by businesses
34
29
24
9
5
56
67
63
52
33
2
2
6
17
16
1
0
1
1
2
7
2
7
21
44
0 20 40 60 80 100
Lower greenhouse emission than coal or gas
Is a clean source of energy
NSW has great potential & resources
Is efficient and reliable
Is the cheapest renewable energy source
% of businesses
Strongly agree Agree Disagre Strongly diasgree Don't know
Base: All businesses Q12. Please tell me to what extent you agree or disagree with each statement
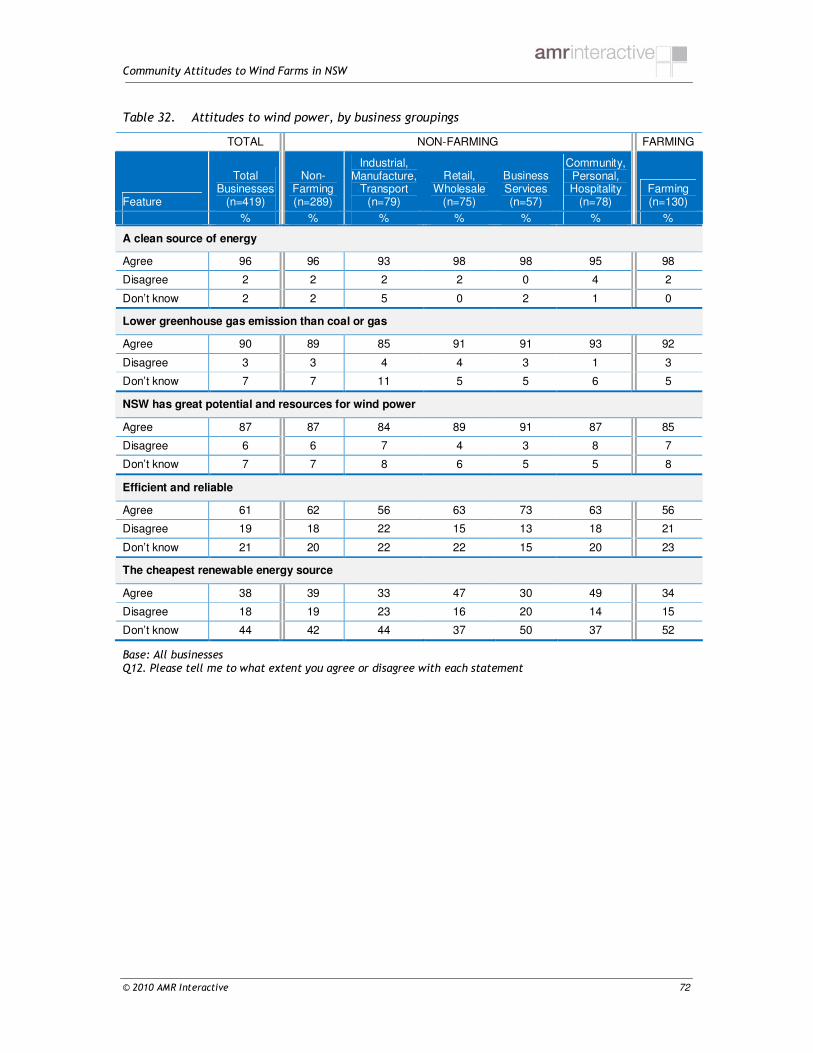
Community Attitudes to Wind Farms in NSW
© 2010 AMR Interactive 72
Table 32. Attitudes to wind power, by business groupings
TOTAL NON-FARMING FARMING
Feature
Total Businesses
(n=419)
Non- Farming (n=289)
Industrial, Manufacture,
Transport (n=79)
Retail, Wholesale
(n=75)
Business Services (n=57)
Community, Personal, Hospitality
(n=78) Farming (n=130)
% % % % % % %
A clean source of energy
Agree 96 96 93 98 98 95 98
Disagree 2 2 2 2 0 4 2
Don’t know 2 2 5 0 2 1 0
Lower greenhouse gas emission than coal or gas
Agree 90 89 85 91 91 93 92
Disagree 3 3 4 4 3 1 3
Don’t know 7 7 11 5 5 6 5
NSW has great potential and resources for wind power
Agree 87 87 84 89 91 87 85
Disagree 6 6 7 4 3 8 7
Don’t know 7 7 8 6 5 5 8
Efficient and reliable
Agree 61 62 56 63 73 63 56
Disagree 19 18 22 15 13 18 21
Don’t know 21 20 22 22 15 20 23
The cheapest renewable energy source
Agree 38 39 33 47 30 49 34
Disagree 18 19 23 16 20 14 15
Don’t know 44 42 44 37 50 37 52
Base: All businesses Q12. Please tell me to what extent you agree or disagree with each statement

Community Attitudes to Wind Farms in NSW
© 2010 AMR Interactive 73
Attitudes towards wind farms in the local region
Businesses were asked to rate their level of agreement with a number of statements about wind farms in their local region
About three quarters of businesses were supportive of more wind farms being built (73%) and that local council should be more active in encouraging wind farms (72%) (Figure 28).
A majority of businesses agreed that wind farms would benefit the local community (72%) and boost employment and money within the economy (58%) (Figure 28). Businesses were not so positive about an increase in tourism, with only about a quarter (24%) agreeing. The overall attitude that wind farms would help boost tourism was higher among residents (40%).
A majority of businesses did not have a concern about wind farms impacting on health (71%), the local environment (61% disagreeing with a negative impact), safety (58%) nor heritage values (51%).
There was little difference between the different business groupings (Table 33). While the results were relatively positive, there is clearly scope to reduce perceptions of concern and negative impact.
Figure 28. Attitudes to wind farms in local region, by businesses
21
15
19
13
10
9
11
10
3
52
57
54
58
52
49
47
41
21
17
16
15
15
25
26
24
34
55
3
3
5
1
4
3
4
2
8
6
9
8
13
10
13
15
13
13
0 20 40 60 80 100
Local council should encourage wind farms
Benefit your local community
More wind farms in local region
No health concerns associated
No negative impact on the local environment
No safety concerns associated
Boost employment and local economy
Not affect heritage values in your local region
Help increase tourism
% of businesses
Strongly agree Agree Disagree Strongly diasgree Don't know
Base: All businesses Q20. Extent to which you agree or disagree with statements about wind farms in your local region

Community Attitudes to Wind Farms in NSW
© 2010 AMR Interactive 74
Table 33. Attitudes to wind farms in the region, by business groupings
TOTAL NON FARMING FARMING
Wind farms in the local region
Total Businesses
(n=419)
Non- Farming (n=289)
Industrial, Manufacture,
Transport (n=79)
Retail, Wholesale
(n=75)
Business Services (n=57)
Community, Personal, Hospitality
(n=78) Farming (n=130)
% % % % % % %
Local council should take a more active role in encouraging wind farms
Agree 73 74 67 74 76 83 71
Disagree 20 19 26 21 12 12 24
Don’t know 6 7 7 5 12 5 5
Should be more wind farms built
Agree 72 74 65 77 81 81 66
Disagree 19 18 25 20 12 13 23
Don’t know 8 7 11 3 7 7 11
Benefit your local community
Agree 72 72 64 70 81 81 72
Disagree 19 19 26 21 12 9 19
Don’t know 9 9 10 9 7 9 9
Boost employment and bring money into the local economy
Agree 58 57 53 53 60 64 61
Disagree 28 28 31 36 20 23 26
Don’t know 15 15 16 11 20 13 13
Help increase tourism
Agree 24 26 16 32 25 36 19
Disagree 63 62 69 61 56 56 67
Don’t know 13 12 14 7 19 8 14
No health concerns
Agree 71 74 71 78 74 74 64
Disagree 16 14 14 16 14 11 24
Don’t know 13 13 15 7 12 15 13
No negative impact on the local environment
Agree 61 63 52 71 70 67 56
Disagree 28 28 33 24 21 27 30
Don’t know 10 9 15 4 9 5 14
No safety concerns
Agree 58 58 57 63 50 62 58
Disagree 29 28 29 26 38 20 30
Don’t know 13 14 15 11 11 18 12
No effect on heritage values
Agree 51 54 50 58 56 54 42
Disagree 36 34 38 35 31 28 45
Don’t know 13 12 12 7 14 18 13
Base: All businesses Q20. Extent to which you agree or disagree with statements about wind farms in your local region

Community Attitudes to Wind Farms in NSW
© 2010 AMR Interactive 75
Impact of wind farms on businesses, local region and surrounding areas
Businesses were asked to rate whether wind farms would impact on their business, on property values, and on visual appeal, and asked their level of concern about noise
The large majority (90%) of non-farming businesses did not consider that wind farms would have a negative impact on their business (Table 34). About a third (30%) considered the impact would be positive, although this was lower in the industrial/manufacturing/transport industry group (24% compared with 30-39%).
Perceptions of the impact on property values and visual appeal were not so strong, with only about half (52%) overall considering there would be only a positive or neutral impact. Farming businesses (65%), however, were more likely than non-farming businesses (48%) to take this position.
About half (51%) of businesses overall considered that noise would be of little concern, and this was greater among the non-farming businesses (54%) than the farming businesses (34%: asked in reference to where they lived). Over half (58%) of the farming businesses considered that noise would be of some or great concern.
Table 34. Impact of wind farms on business, property value visual appeal and noise, by business groupings
TOTAL NON-FARMING FARMING
Impact of wind farms
Total Businesses
(n=419)
Non- Farming (n=289)
Industrial, Manufacture,
Transport (n=79)
Retail, Wholesale
(n=75)
Business Services (n=57)
Community, Personal, Hospitality
(n=78) Farming (n=130)
% % % % % % %
Impact on your business*
A positive impact - 30 30 22 30 34 -
No impact - 61 61 68 60 59 -
Negative impact 5 5 5 8 3
Other response - 1 1 2 0 0 -
Impact on property values
A positive impact 16 14 15 9 14 19 21
No impact 36 34 35 36 33 30 43
Negative impact 36 40 41 44 38 37 24
Other response 12 12 10 11 15 14 12
Visual impact
A positive impact 17 17 10 12 20 30 19
No impact 35 33 40 34 32 24 40
Negative impact 40 42 43 48 35 41 34
Other response 8 8 7 6 13 6 7
Noise a concern if 1-2 km away
Total no/little concern 49 55 55 64 55 43 34
Some/great concern 41 35 35 27 35 42 58
Depends/Don’t know 10 11 10 8 10 15 7
Base: All businesses *Not asked of farming businesses Statistically significant difference between groups: highlighting more positive and more negative results Q17a. In your view, what impact would wind farms have on your business? Q21. In your view, what impact would wind farms in your local region have on property values? Q22. In your view, what impact would wind farms have on the visual appeal of the surrounding area? Q27. In your view, to what extent would noise be a concern for you if a wind farm was 1-2 kilometres away
from your business/property?

Community Attitudes to Wind Farms in NSW
© 2010 AMR Interactive 76
6.5 Support and investment
Support for wind farms
Businesses were asked whether they supported or opposed wind farms in NSW, in their local region, 10 km from their residence and 1-2 km from their residence
The total support by businesses for wind farms in NSW was marginally higher than by residents (88% compared to 79%) (Figure 29). In contrast, businesses in the industrial/manufacturing sector were the least positive with only about a quarter (27%) supporting.
Support for wind farms in the local region was only marginally lower (83%), and at a very similar
level for 10 kilometres from the business (82%) (Table 35). Support, however, dropped significantly when considering wind farms being built 1-2 kilometres of the business, although it was still a majority position (60%).
There was little difference in support between the industry groupings (Table 34).
Figure 29. Overall support for wind farms, by businesses
40
33
14
49
51
46
5
8
20
2
4
13
4
5
7
0 20 40 60 80 100
Wind farms in NSW
Wwind farms in local region
Wwind farms 1-2 kilometres from business
% of businesses
Strongly support Support Oppose Strongly oppose Depends/Don't know
Base: All businesses Statistically significant difference between groups: highlighting higher � and lower � support Q13. As a business manager, to what extent do you support or oppose wind farms being built in NSW? Q17. As a business manager, to what extent do you support or oppose wind farms being built in your local
region? Q24. Would you support or oppose a wind farm being built 1-2 kilometres from your business?
�
�
�

Community Attitudes to Wind Farms in NSW
© 2010 AMR Interactive 77
Table 35. Overall support for wind farms, by business groupings
TOTAL NON-FARMING FARMING
Support for wind farms
Total (n=419)
Non- Farming (n=289)
Industrial, Manufacture,
Transport (n=79)
Retail, Wholesale
(n=75)
Business Services (n=57)
Community,
Personal, Hospitality
(n=78) Farming (n=130)
% % % % % %
In NSW
Support 88 89 87 89 93 90 86
Oppose 7 6 5 9 5 7 10
Other response 4 4 8 1 2 3 3
In the local region
Support 83 83 77 86 86 86 84
Oppose 12 12 13 13 9 10 14
Other response 5 5 9 1 5 4 2
10 km from business
Support 82 84 78 84 90 87 77
Oppose 14 12 15 13 7 13 18
Other response 4 4 7 4 3 0 5
1-2 km from business
Support 60 61 54 62 69 64 56
Oppose 33 32 36 33 24 32 35
Other response 7 7 10 5 7 3 9
Base: All businesses Q13. As a business manager, to what extent do you support or oppose wind farms being built in NSW? Q17. As a business manager, to what extent do you support or oppose wind farms being built in your local
region? Q24. Would you support or oppose a wind farm being built 1-2 kilometres from your business? Q25. Would you support or oppose a wind farm being built 10 kilometres from your business?

Community Attitudes to Wind Farms in NSW
© 2010 AMR Interactive 78
Consideration of investment in wind farms and green energy
Non-farming businesses were asked whether they would consider investing in wind farms and about their use of green energy; and farming businesses were asked if they would consider having wind turbines on their property
A third (30%) of non-farming businesses reported that they would consider investing in wind farms (Table 36). A small minority (16%) reported currently using renewable energy, while more than a third (38%) of the businesses expressed interest in buying renewable energy.
Over half (57%) of farming businesses reported that they would consider putting turbines on their property (Table 37), giving a substantial base for development of wind farms in these regional areas. The sample sizes in each Precinct were too small for detailed assessment (although the incidence of farms is much lower on the South Coast).
Only a small minority (11%) of farming businesses reported having been approached by a wind farm developer.
Table 36. Consideration of investment in wind farms and use of green energy, by non-farming businesses
NON-FARMING
Statement
Non- Farming (n=289)
Industrial, Manufacture,
Transport (n=79)
Retail, Wholesale
(n=75)
Business Services (n=57)
Community, Personal, Hospitality
(n=78)
% % % % %
Business would consider investing in wind farms
30 32 31 30 27
Renewable energy
Use renewable energy 16 15 15 16 18
IF NOT USED (based on all) Interest in buying green energy
38 35 30 47 44
Base: Non-farming businesses Q37a. Would your business consider investing in wind farms in your local region? Q37b. Does your business use any renewable energy such as solar panels, or solar hot water; or does your
business buy green power? Q37c. Would your business be interested in buying green energy?
Table 37. Approach or consideration on property, by farming businesses
Involvement Farming (n=130)
%
Approached by a wind farm developer 11
Consider putting turbines on property 57
Base: Farming businesses Q35. Have you been approached by a wind farm developer at all? Q36. Would you consider having wind turbines on your property?

Community Attitudes to Wind Farms in NSW
© 2010 AMR Interactive 79
Perceived benefits of wind farms to the business
Businesses were asked, unprompted, what benefits wind farms would bring to the region
Recognition of benefits that wind farms would bring to the business was assessed by overall support/opposition of wind farms being built 1-2 kilometres from the business (Table 38). The main categories of benefits were around reduction in pollution, cost of electricity, and benefits to the economy/community.
Businesses that supported wind farms were more likely to identify all of these categories of benefits, compared with those opposing, and much more likely to mention a benefit overall.
Table 38. Benefits of wind farms to business, by support/opposition to wind farms being built 1-2 km from the business (unprompted – multi-response)
Benefit*
Total Businesses
(n=419) %
Support (n=244)
%
Oppose (n=145)
%
Pollution 29 36 18
Reduces pollution/clean power/environmentally friendly
22 28 12
Alternative/renewable energy/provides a choice 5 5 4
Supplies power/helps maintain regular power supply 7 7 7
Reduces transmission from the grid 2 2 2
Cost 24 28 19
Cost effective/cheaper energy/bills 17 19 14
Cheaper source of power/cheaper to make 8 10 5
Economy/Community 23 28 15
Increases employment opportunities 14 17 11
Help local community/economy 8 11 3
Benefits the local land owners/owners of land 4 6 2
Encourages tourism/good for the region's image 2 2 3
None/nothing 33 25 44
Base: All businesses Statistically significant difference between groups: highlighting higher and lower benefits Q18. What if any benefits would wind farms bring to your business/property (unprompted) * Categories of responses are in bold – the percentages represent the nett of residents giving a response that
falls into that category. The main sub-categories of responses are shown below each category.

Community Attitudes to Wind Farms in NSW
© 2010 AMR Interactive 80
Perceived concerns about wind farms to the business
Businesses were asked, unprompted, what concerns they had about wind farms in the region
The suggestion of concerns about wind farms in regard to the business was assessed by overall support/opposition to wind farms being built 1-2 kilometres from the business (Table 39). About two thirds of businesses that opposed wind farms raised a concern. In comparison, only about a quarter of businesses that supported wind farms raise a concern. The main categories of concerns were around the impact on people (including location and noise), impact on the landscape, and impact on the economy (particularly property values).
The suggestion of benefits of wind farms to the business were assessed by overall support/opposition to wind farms being built 1-2 kilometres from the business. The main categories of benefits were around reduction in pollution, cost of electricity and benefits to the economy/community.
Businesses that opposed wind farms were more likely to mention all of these categories of concerns, and much more likely to identify a concern overall.
Table 39. Concerns about wind farms to businesses, by support/opposition to a wind farm being built 1-2 km from business (unprompted – multi-response)
Concern*
Total Businesses
(n=419) %
Support (n=244)
%
Oppose (n=145)
%
Impact on people 26 17 39
Location concerns 13 9 20
Noise concerns 14 8 22
Health concerns 2 0 5
Impact on landscape 10 5 19
Aesthetics/look of it/ugly//take away view 8 4 15
Occupies large areas/spaces/limits potential of agricultural use 2 1 2
Impact on economy/value 5 2 11
Concerns about property value 3 0 9
Concern over power generation/effectiveness 6 4 8
Inefficient/uneconomical/not beneficial 2 1 4
Unreliable/dependent on weather 3 3 2
Concerns with maintenance/ decommissioning/removal 1 0 2
Impact on environment/ecosystem 4 1 5
Detrimental to the environment 2 1 3
None/nothing 58 72 37
Base: All businesses Statistically significant difference between groups: highlighting higher and lower concerns Q19. What if any concerns would have about wind farms in regards to your business (unprompted) * Categories of responses are in bold – the percentages represent the nett of residents giving a response that
falls into that category. The main sub-categories of responses are shown below each category.

Community Attitudes to Wind Farms in NSW
© 2010 AMR Interactive 81
6.6 What is driving support for wind farms? – Businesses
Further analysis was conducted to look at how businesses’ attitudes and perceptions about wind power and wind farms drives support for wind farms at 1-2 kilometres. The importance of each attitude/perception is based on the gap between supporters and opposers on how favourably each attitude/perception was rated. The greater the gap, the greater the importance of the measure.
The results are shown in Figure 30, in the form of a quadrant:
• Vertical axis: This shows the importance of each attitude/perception in driving support. The importance is based on the gap between supporters and opposers on how favourably each attitude/perception was rated. The greater the gap, the greater the importance of the measure. A line has been drawn to split the measures into higher and lower importance.
• Horizontal axis: This shows how favourably each attitude/perception was rated, as a percentage of businesses. The specific rating differs by the type of question. A line has been drawn at 60% (about the average across all measures) to split the attitudes/perceptions into being more or less favourably rated.
The attitudes and perceptions in the top left quadrant represent those which are of higher importance and which are less favourably rated by businesses:
• concern about noise;
• impact on visual appeal;
• boosting employment and money in the local economy;
• impact on property values; and
• safety concerns.
The top right quadrant in each figure represents attitudes and perceptions that are of higher importance as drivers and are rated more favourably. The two measures in this position are:
• benefit to the local community; and
• acceptability of wind power for a power plant.
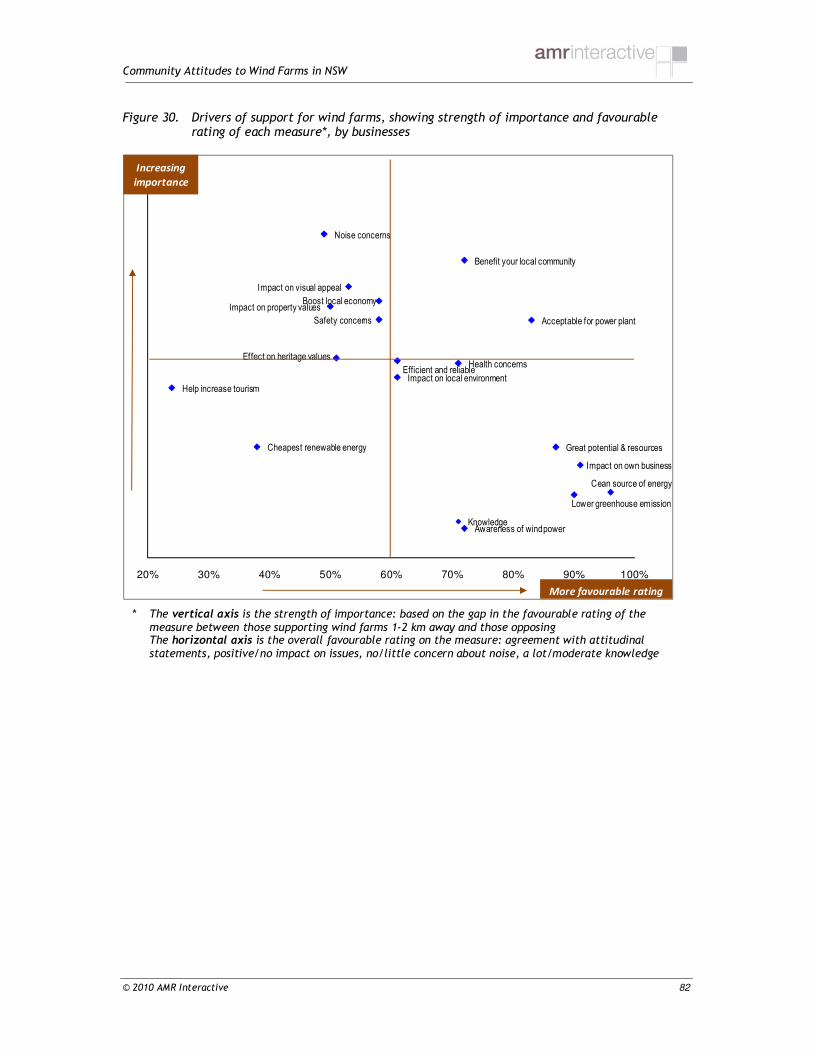
Community Attitudes to Wind Farms in NSW
© 2010 AMR Interactive 82
Figure 30. Drivers of support for wind farms, showing strength of importance and favourable rating of each measure*, by businesses
Noise concerns
Benefit your local community
Impact on visual appeal
Boost local economyImpact on property values
Safety concerns Acceptable for power plant
Effect on heritage values
Efficient and reliableHealth concerns
Impact on local environmentHelp increase tourism
Impact on own business
Cheapest renewable energy Great potential & resources
Cean source of energy
Lower greenhouse emission
KnowledgeAwareness of wind power
20% 30% 40% 50% 60% 70% 80% 90% 100%
Increasing
importance
More favourable rating
* The vertical axis is the strength of importance: based on the gap in the favourable rating of the measure between those supporting wind farms 1-2 km away and those opposing
The horizontal axis is the overall favourable rating on the measure: agreement with attitudinal statements, positive/no impact on issues, no/little concern about noise, a lot/moderate knowledge

Community Attitudes to Wind Farms in NSW
© 2010 AMR Interactive 83
7.0 Key findings and conclusions
7.1 Familiarity with wind power
• Wind power was well established top-of-mind, with more than half (59%) of residents of the Precincts mentioning it spontaneously as a clean energy source, second only to solar power. Residents were far less likely to be familiar with other clean energy sources such as water, gas and bioenergy, mentioned by less than a quarter (18%) of residents.
• Wind power was also widely regarded as acceptable for power generation, by over three quarters (81%) of the population, when residents were asked specifically. This was second only to solar power which was almost universally accepted.
• The high level of familiarity was also demonstrated by the fact that almost everyone (97%) in the Precincts, and the rest of regional NSW, had heard about wind farms or wind turbines to generate electricity, and over three quarters (81%) had seen a wind farm
(which could be in person or in the media). A majority (68%) of residents of the Precincts reported they knew about wind farms currently operating in NSW. Awareness was much higher in NSW/ACT Border Region (95%), Central Tablelands (90%) and Cooma-Monaro (85%). By contrast, residents of New England Tablelands (387%) were the least likely to report awareness.
• While awareness of wind farms being planned or under construction was limited to less than a third (28%) of residents of the Precincts overall, residents of Upper Hunter (54%), Cooma-Monaro (53%) and NSW/ACT Border Region (47%) were relatively more likely to be aware of planned wind farms.
• It is worth noting that a majority of residents considered that they did not have adequate information about wind farms, even in areas where awareness of operation of wind farms was higher. A majority of residents expressed interest in finding out more about specific aspects of wind farms, including issues around noise, location of wind farms, impact on the environment and community, and effectiveness of power generation.
• A third (33%) of residents of the Precincts were aware of the NSW Government’s initiative for setting up Renewable Energy Precincts, although few overall (16%) considered that there had been adequate consultation. Awareness of the Government’s initiative was higher among residents who were aware of wind farm operating or planned in their local region, especially if the location was 5 kilometres (50%) away. A perception
of adequate consultation also increased with greater awareness and closer proximity. A majority (60%) of residents aware of a wind farm operating or planned within 20 kilometres said that there had been adequate engagement.
7.2 Perceptions about wind power and its benefits and impacts
• Residents widely acknowledged that wind power has lower greenhouse gas emissions than coal or gas and that NSW is well positioned with resources. There was, however, less understanding or greater uncertainty about efficiency and reliability of wind power, and about whether wind power was the cheapest renewable energy source.
• There was also broad acknowledgement that wind farms would benefit the local community and can boost employment and the economy. Consistent with this, there is broad endorsement of more wind farms being built in the local region and more active
involvement of the local councils to encourage wind farms. Only about a third (32%) of residents, however, believed that wind farms would contribute to an increase in tourism.

Community Attitudes to Wind Farms in NSW
© 2010 AMR Interactive 84
• The majority (69%) of residents also did not perceive any health concerns, while on the issue of safety concerns, opinion was more polarised. Residents were also divided on their views on impacts of wind farms on both property values and visual appeal of the area, and on concern about noise. The majority (62%) of residents did not perceive a negative impact on the environment, while opinion was divided on the issue of heritage values.
7.3 Level of support for wind farms
• The large majority of residents across the Precincts indicated they would support wind farms being built both in NSW as well as in their local region. The majority of residents of the Precincts were supportive of wind farms being built in the vicinity of their residence. Over three quarters (79%) supported wind farms being built 10 kilometres from their residence, and more than half (60%) supported them 1-2 kilometres from their residence. Overall support at 1-2 kilometres tended to be lower in two of the Precincts: New England Tablelands (54%) and Upper Hunter (44%).
• Residents opposing wind farms being built 1-2 kilometres from their residence were much more likely than supporters to identify concerns about noise and the impact on the landscape, and much less likely to identify benefits of wind farms such as reducing pollution and improving the community and economy. Notably, over two thirds (68%) of residents opposing wind farms at 1-2 kilometres still saw an overall benefit of wind farms to the local region.
7.4 Driving support for wind farms
• The relationship between the level of support/opposition for wind farms 1-2 kilometres from place of residence, and a range of attitudinal, perceptual, demographic and geographic measures captured in the study was analysed. It was found that the most important drivers of support for wind farms were attitudinal:
• attitudes towards the economic and community benefits of wind farms;
• the perceived visual and noise impacts;
• concerns about health, safety and heritage values; and
• perception of wind power relating to clean energy source and its potential in NSW.
Proximity to wind farms was also found to be of some importance, while demographic characteristics such as Precinct, gender and age had relatively low influence on level of support.
7.5 Segments
Residents in the Precincts were divided into three groups based on the combination of their support or opposition to wind farms (a) in NSW, and (b) 1-2 kilometres from their residence. Those residents who supported wind farms across locations held much more positive attitudes and perceptions.
Those residents who only supported wind farms in NSW were less likely to see wind power as a feasible source of energy, and efficient and reliable; less likely to consider there would be a positive or neutral impact on a range of issues. The greatest difference, however, was potential concern about noise.
Those residents who did not support wind farms in either context were very much less likely to consider wind power as an acceptable energy source, doubting its efficiency/reliability and much less accepting of the resources in NSW. They were also very much more negative about all the impacts and benefits that might be associated with wind farms.

Community Attitudes to Wind Farms in NSW
© 2010 AMR Interactive 85
7.6 Precincts
Support for wind farms did not differ greatly between the Precincts. However, overall support in the region was marginally lower in New England Tablelands and Upper Hunter and marginally higher in Central Tablelands and NSW/ACT Border.
7.7 Businesses in the Renewable Energy Precincts
• Businesses in the six Renewable Energy Precincts showed high levels of awareness and familiarity, and a positive outlook to wind power. These were very similar to the findings among residents.
• Attitudes to wind power were also consistent with those seen among residents, except that businesses were less likely to regard wind power as cheaper and less likely to believe wind farms would boost employment in the local economy.
• Among non-farming businesses, about a third (30%) anticipated positive effects on their business, while more than half (61%) believed there would be no impact. Few (8%) considered that there could be a negative impact or were undecided. Opinion was divided on visual impact of wind farms, impact on property values and concerns about noise. Farming businesses were more likely to spontaneously express concern about the location of wind farms, and were more concerned about noise (58% having at least some concern compared with 35% of non-farming businesses). Nevertheless, over half (57%) of farming businesses would consider wind farms on their property.
• Opinion was equally divided on visual impact of wind farms, impact on property values and concerns about noise. Notably, farming related businesses were more concerned about noise.
• The level of support for wind farms in the state, in the local region, 10 kilometres from the business and 1-2 kilometres was widespread, and similar to that shown by residents.
• The strongest drivers of support for wind farms 1-2 kilometres from their business were found to be similar to those seen among residents, with noise concerns and benefit to the local community prominent.
7.8 General conclusion
• The research indicates there was strong support and backing for wind farms in NSW, in the local region, and at 10 kilometres from the place of residence. Closer to home, support reduced significantly, although a majority (60%) still supported wind farms at a distance of 1-2 kilometres.
• While overall acceptability of wind power was high, a significant number of residents of the Precincts, in the range of 30-40%, had some concern about noise, negative visual impact, negative impact on property prices, safety and heritage values. In addition, proximity to a wind farm reduced level of support.
• Even among supporters of wind farms, some groups were more concerned about the possibility of health and safety factors.

Community Attitudes to Wind Farms in NSW
© 2010 AMR Interactive 86
8.0 Appendices
8.1 Appendix A: Questionnaires
Residential survey
Section A – Initial Demographics
Q1. RECORD GENDER 1 Female 2 Male
Q2. Firstly, which of the following age groups do you fall into?
READ OUT – SINGLE RESPONSE 1 18-29 2 30-44 3 45-54 4 54-64 5 65+ 97 DO NOT READ OUT: Refused
Q3. (a) Do you live… READ OUT - SINGLE RESPONSE 1 In town 2 or out of town 97 DO NOT READ OUT: Refused IF IN TOWN GO TO Q4 (b) Is that a residential or farming property?
Would that be… 1 Small residential property 2 Medium to large residential property 3 Small farming property 4 Medium to large farming property 97 DO NOT READ OUT: Refused
Q4. And how long have you lived in the area? Would it be… READ OUT – SINGLE RESPONSE 1 Less than 2 years 2 2 to 5 years 3 6 to 10 years 4 11 to 20 years 5 More than 20 years 97 DO NOT READ OUT: Refused

Community Attitudes to Wind Farms in NSW
© 2010 AMR Interactive 87
Section B – Perceptions of Local Region
Q6. Next, I would like you to rate your local region on a number of issues. Please use a scale of Very Poor, Poor, Average, Good or Excellent. FIRST: Firstly, how would you rate your local region on… OTHER: And how would you rate your local region on… RANDOMISE 1 The overall standard of living 2 Employment opportunities 3 The level of Investment by government 4 The overall health of the local economy 5 Access to services such as health and education 6 Local environment 7 The level of investment by business SCALE – SINGLE RESPONSE GRID 1 Excellent 2 Good 3 Average 4 Poor 5 Very Poor 9 DO NOT READ OUT: Don’t know
Section C – Renewable Energy
Q7. The next few questions are about power generation and electricity. The demand for electricity is increasing. A number of clean energy sources are being discussed. Which clean energy sources are you aware of? PROBE: Any others?
DO NOT READ – MULTIPLE RESPONSE 1 Sun or solar power 2 Wind power 3 Water or hydroelectric power 4 Wave or tidal power 5 Nuclear power 6 Clean coal where the pollutants are buried 7 Gas 8 Bioenergy/Bioelectric 9 Geothermal 98 Other (specify) 99 Don’t know
Q8. Say a new power station was going to be built in your local region to provide power to the area. Which, if any, of the following power sources would you consider to be acceptable for this power station?
Firstly, would you find ….. acceptable or not? READ OUT And would you… RANDOMISE 1 Solar power 2 Wind power 3 Nuclear power 4 Clean coal where the pollutants are buried 5 conventional coal fired electricity plant 6 Gas 7 Water or Hydro Electric Power SCALE – SINGLE RESPONSE GRID 1 Acceptable 2 Not acceptable 99 Unsure

Community Attitudes to Wind Farms in NSW
© 2010 AMR Interactive 88
Section D – General Awareness and Knowledge about Wind Farms
Q9. I would like you now to think about wind power. Have you heard about the use of wind farms or wind turbines or windmills to generate electricity? DO NOT READ OUT 1 Yes 2 No GO TO Q11
Q10. a) Have you seen an actual wind turbine or wind mill used to generate electricity? 1 Yes GO TO Q11 2 No 9 Don’t know
Q11. Wind farms are a group of wind turbines usually situated on ridges and hills in rural areas. They are placed where wind flow is the greatest. The wind farm is connected to the power grid to supply electricity to homes and businesses. Before this survey, how much did you know about wind farms? Would you say you knew…
READ OUT – SINGLE RESPONSE 1 A lot about wind farms 2 A moderate amount about wind farms 3 A little about wind farms 4 Only heard the name 5 Have not heard of it before now 97 DO NOT READ OUT: Refused 99 DO NOT READ OUT: Can’t say/Don’t know
Q12. I’m now going to talk about electricity generated by wind power. I’ll read out a few statements. Please tell me to what extent you agree or disagree with each statement. Please use a scale of Strongly Agree, Agree, Disagree or Strongly Disagree. RANDOMISE 1 Wind power is efficient and reliable 2 Wind power has lower greenhouse gas emissions than coal or gas 3 Wind power is the cheapest renewable energy source 4 Wind power is a clean source of energy 5 NSW has great potential and resources for wind power SCALE – SINGLE RESPONSE GRID 1 Strongly agree 2 Agree 3 Disagree 4 Strongly disagree 99 DO NOT READ OUT: Don’t know
Section E – Wind Farms in NSW
Q13. I would now like you to think about wind farms in NSW. Overall, to what extent do you support or oppose wind farms being built in NSW. Would you…
READ OUT – SINGLE RESPONSE 1 Strongly support wind farms in NSW 2 Support 3 Oppose 4 Strongly oppose 4 Strongly oppose 5 DO NOT READ OUT: Don’t care either way 6 DO NOT READ OUT: Depends 99 DO NOT READ OUT: Don’t know
Q14. (a) Are you aware of any wind farms currently operating in NSW? 1 Yes 2 No

Community Attitudes to Wind Farms in NSW
© 2010 AMR Interactive 89
Q15. (a) Are you aware of any wind farms in NSW under construction or being proposed? 1 Yes 2 No
Section F – Wind Farms in the Local Area
Q17. Now I’d like you to think about your local region. Overall, to what extent do you support or oppose wind farms being built in your local region. Would you say you…
NOTE: IF RESPONDENTS ASKS WHAT LOCAL REGION MEANS, TELL THEM IT’S THE AREA IN WHICH THEY LIVE, GO TO SCHOOL, DO THEIR WEEKLY SHOPPING, SOCIALISE
READ OUT – SINGLE RESPONSE 1 Strongly support 2 Support 3 Oppose 4 Strongly oppose 5 DO NOT READ OUT: Don’t care either way 6 DO NOT READ OUT: Depends 99 DO NOT READ OUT: Don’t know
ALTERNATE ORDER – ADVANTAGES/DISADVANTAGES
Q18. What if any benefits would wind farms bring to your local region? PROBE: Any other benefits? RECORD VERBATIM RESPONSE
Q19. What if any concerns would you have about wind farms in your local region? PROBE: Any other concerns? RECORD VERBATIM RESPONSE
Q20. Now we’re going to talk about wind farms and your local region. I am going to read out some statements. Please tell me the extent to which you agree or disagree with each. Please use a scale of Strongly Agree, Agree, Disagree or Strongly Disagree. NOTE: IF RESPONDENT THINKS STATEMENTS ARE BEING REPEATED, EXPLAIN THIS IS ABOUT LOCAL REGION
AS OPPOSED TO NSW IN GENERAL READ OUT 1 Your local council should take a more active role in encouraging wind farms 2 There should be more wind farms built in your local region 3 Wind farms would boost employment and bring money into the local economy 5 Wind farms would have a negative impact on the local environment 6 Wind farms would benefit your local community 7 Wind farms in your local region would help increase tourism 8 Wind farms would not affect heritage values in your local region 9 There would be no safety concerns associated with wind farms 10 There would no health concerns associated with wind farms SCALE – SINGLE RESPONSE GRID 1 Strongly support 2 Support 3 Oppose 4 Strongly oppose 5 DO NOT READ OUT: Depends 99 DO NOT READ OUT: Don’t know
Q21. In your view, what impact would wind farms in your local region have on property values? Would they have… 1 A positive impact 2 A negative impact 3 or No impact 4 DO NOT READ OUT: Both 9 DO NOT READ OUT: Don’t know

Community Attitudes to Wind Farms in NSW
© 2010 AMR Interactive 90
Q22. In your view, what impact would wind farms have on the visual appeal of the surrounding area? Would it be… 1 A positive impact 2 A negative impact 3 or No impact 4 DO NOT READ OUT: Both 9 DO NOT READ OUT: Don’t know
IF Q14=1 OR Q15=1 (AWARE OF WIND FARMS) ASK
Q23. (a) You previously mentioned that you were aware of wind farms operating in NSW or being planned. Are any of these in your local region? 1 Yes 2 No GO TO Q24
(b) What is the name or location of the nearest wind farm, or planned wind farm, in your local region?
RECORD NAME________________________________________
(c) Is this wind farm…
READ OUT – SINGLE RESPONSE 1 Currently operating 2 under construction 3 or being planned 99 DO NOT READ OUT: Don’t know
(d) How close is this wind farm to your residence? Would it be… SINGLE RESPONSE - TRY TO GET AS KILOMETRES, OTHERWISE TIME
(e) IF (c)= 1: Is the wind farm visible from where you live? IF (c)=2/3: Will the wind farm be visible from where you live? ASK ALL
Q24. Wind farms are usually sited on ridges and hills in rural and coastal areas where wind flow is the greatest. Would you support or oppose a wind farm being built 1 to 2 kilometres from your residence? Would you… READ OUT – SINGLE RESPONSE 1 Strongly support 2 Support 3 Oppose 4 Strongly oppose 5 DO NOT READ OUT: Don’t care either way 6 DO NOT READ OUT: Depends 9 DO NOT READ OUT: Don’t know

Community Attitudes to Wind Farms in NSW
© 2010 AMR Interactive 91
IF OPPOSE OR DEPENDS/DON’T KNOW IN Q24 ASK Q25
Q25. Would you support or oppose a wind farm being built 10 kilometres from your residence? Would you… READ OUT – SINGLE RESPONSE 1 Strongly support 2 Support 3 Oppose 4 Strongly oppose 5 DO NOT READ OUT: Don’t care either way 6 DO NOT READ OUT: Depends 99 DO NOT READ OUT: Don’t know
Q26. IF SUPPORT: What are your main reasons behind your support? IF OTHER: What are your main reasons for not supporting?
RECORD VERBATIM RESPONSE
Q27. In your view, to what extent would noise be a concern for you if you were living 1-2 kilometres away from wind farms? Would it be: READ OUT 1 No concern 2 Of little concern 3 Of some concern 4 Of great concern 6 DO NOT READ OUT: Depends 99 DO NOT READ OUT: Don’t know
IF ANSWERED YES AT Q9, ASK Q28
Q28. And have you been close enough to an operating wind turbine or wind farm to hear it? 1 Yes 2 No 9 Don’t know
Q29. From where have you heard or received any information about wind farms? Any others? DO NOT READ OUT – MULTIPLE RESPONSE 1 Television or radio stations (news/current affairs) 2 Local newspapers 3 State/national newspapers 3 Local government 4 Local community groups or social clubs (e.g. Church, Rotary) 5 Local environment groups / Environment groups 5 Local business groups 6 Wind farm developers 7 Family/friends/word of mouth 8 State Government 9 Landscape Guardians 10 Energy companies 11 Nowhere in particular 96 Heard nothing 98 Other (specify)
Q30. Have you heard about the NSW government initiative for setting up renewable energy precincts? 1 Yes 2 No 9 Don’t know

Community Attitudes to Wind Farms in NSW
© 2010 AMR Interactive 92
Q33. Do you feel that there is adequate consultation about wind farms available in your local community? 1 Yes 2 No 9 Don’t know
Q34. (a) Do you feel you have adequate information about wind farms? 1 Yes 2 No 9 Don’t know
(b) Are there any specific aspects of wind energy or wind farms that you would like more information on?
RECORD VERBATIM RESPONSE
Q35. Have you been approached by a wind farm developer at all? 1 Yes 2 No 9 Don’t know IF OUT OF TOWN AT Q3a, ASK Q36
Q36. Would you consider having wind turbines on your property? 1 Yes 2 No 3 Unsure 9 Don’t know
Section G – Demographic Profile
Q38. And are you currently… READ OUT – SINGLE RESPONSE 1 Renting or leasing the home you live in 2 Have a mortgage which you are paying off for your home, 3 or fully own your home 97 DO NOT READ OUT: Refused
Q40. Which of the following best describes the highest education level you have reached?
READ OUT – SINGLE RESPONSE 1 Primary school only 2 Completed equivalent of Year 10, school certificate 3 Completed equivalent of Year 12, higher school certificate 4 Trade or technical qualification 5 Diploma 6 University degree 7 Post graduate 97 DO NOT READ OUT: Refused
Q41. Are you…
READ OUT – MULTIPLE RESPONSE 1 Working full time 2 Working part time 96 DO NOT READ OUT: None of these
Q42. Do you own or manage a business in your local region? 1 Yes 2 No 97 Refused

Community Attitudes to Wind Farms in NSW
© 2010 AMR Interactive 93
IF WORKING OR OWN/MANAGE A BUSINESS ASK Q43
Q43. IF OWN/MANAGE BUSINESS: What is the main industry of the business you manage. Is it… IF WORKING: What is the main industry of the business you work for. Is it… READ OUT – SINGLE RESPONSE 1 Farming or agriculture 2 Mining or resources 3 Building and construction 4 Professional or business services 5 Retail, from a shop front 6 Other retail 7 Wholesale 8 Government 98 or some other industry

Community Attitudes to Wind Farms in NSW
© 2010 AMR Interactive 94
Business questionnaire
Section A – Initial Demographics
Q3. Do you operate your business… READ OUT - SINGLE RESPONSE 1 Mainly from your home 2 An office or shop front 3 A farming property 4 or some other premise (specify) 97 DO NOT READ OUT: Refused
Q4. And how long has your business been operating in this area? Would it be… READ OUT – SINGLE RESPONSE 1 Less than 2 years 2 2 to 5 years 3 6 to 10 years 4 11 to 20 years 5 More than 20 years 97 DO NOT READ OUT: Refused
Section B – Perceptions of Local Region
Q6. Next, thinking of yourself as a business manager, I would like you to rate your local region on a number of issues. Please use a scale of Very Poor, Poor, Average, Good or Excellent. FIRST: Firstly, as a business manager, how would you rate your local region on… OTHER: And how would you rate your local region on… RANDOMISE 1 The overall standard of living 2 Employments opportunities 3 The level of Investment by government 4 The overall health of the local economy 6 Local environment 7 The level of investment by business SCALE – SINGLE RESPONSE GRID 1 Excellent 2 Good 3 Average 4 Poor 5 Very Poor 9 DO NOT READ OUT: Don’t know

Community Attitudes to Wind Farms in NSW
© 2010 AMR Interactive 95
Section C – Renewable Energy
Q7. The next few questions are about power generation and electricity. The demand for electricity is increasing. A number of clean energy sources are being discussed. Which clean energy sources are you aware of? PROBE: Any others?
DO NOT READ – MULTIPLE RESPONSE 1 Sun or solar power 2 Wind power 3 Water or hydroelectric power 4 Wave or tidal power 5 Nuclear power 6 Clean coal where the pollutants are buried 7 Gas 8 Bioenergy/Bioelectric 9 Geothermal 98 Other (specify) _____________ 99 Don’t know
Q8. Say a new power station was going to be built in your local region to provide power to the area. Which, if any, of the following power sources would you consider to be acceptable for this power station?
READ OUT LIST – GET RESPONSE BEFORE MOVING TO THE NEXT
Firstly, would you find ….. acceptable or not?
And would you…
– RANDOMISE 1 Solar power 2 Wind power 3 Nuclear power 5 conventional coal fired electricity plant 6 Gas 7 Water or Hydro Electric Power SCALE – SINGLE RESPONSE GRID 1 Acceptable 2 Not acceptable 99 Unsure
Section D – General Awareness and Knowledge about Wind Farms
Q9. I would like you now to think about wind power. Have you heard about the use of wind farms or wind turbines or windmills to generate electricity? DO NOT READ OUT 1 Yes 2 No GO TO Q11
Q10. a) Have you seen an actual wind turbine or wind mill used to generate electricity? 1 Yes 2 No 9 Don’t know

Community Attitudes to Wind Farms in NSW
© 2010 AMR Interactive 96
Q11. Wind farms are a group of wind turbines usually situated on ridges and hills in rural areas. They are placed where wind flow is the greatest. The wind farm is connected to the power grid to supply electricity to homes and businesses.
Before this survey, how much did you know about wind farms? Would you say you knew…
READ OUT – SINGLE RESPONSE 1 A lot about wind farms 2 A moderate amount about wind farms 3 A little about wind farms 4 Only heard the name 5 Have not heard of it before now 97 DO NOT READ OUT: Refused 99 DO NOT READ OUT: Can’t say/Don’t know
Q12 I’m now going to talk about electricity generated by wind power. I’ll read out a few statements. Please tell me to what extent you agree or disagree with each statement.
Please use a scale of Strongly Agree, Agree, Disagree or Strongly Disagree. RANDOMISE 1 Wind power is efficient and reliable 2 Wind power has lower greenhouse gas emissions than coal or gas 3 Wind power is the cheapest renewable energy source 4 Wind power is a clean source of energy 5 NSW has great potential and resources for wind power SCALE – SINGLE RESPONSE GRID 1 Strongly agree 2 Agree 3 Disagree 4 Strongly disagree 99 DO NOT READ OUT: Don’t know
Section E – Wind Farms in NSW
Q13. I would now like you to think about wind farms in NSW. As a business manager, to what extent do you support or oppose wind farms being built in NSW. Would you…
READ OUT – SINGLE RESPONSE 1 Strongly support wind farms in NSW 2 Support 3 Oppose 4 Strongly oppose 4 Strongly oppose 5 DO NOT READ OUT: Don’t care either way 6 DO NOT READ OUT: Depends 99 DO NOT READ OUT: Don’t know
Q14. (a) Are you aware of any wind farms currently operating in NSW? 1 Yes 2 No
Q15. (a) Are you aware of any wind farms in NSW under construction or being proposed? 1 Yes 2 No

Community Attitudes to Wind Farms in NSW
© 2010 AMR Interactive 97
Section F – Wind Farms in the Local Area
Q17. Now I’d like you to think about your local region. As a business manager, to what extent do you support or oppose wind farms being built in your local region. Would you say you…
NOTE: IF RESPONDENT ASKS WHAT LOCAL REGION MEANS, SAY IT’S THE AREA THAT THEIR BUSINESS OPERATES IN AND INTERACTS WITH THE COMMUNITY
READ OUT – SINGLE RESPONSE 1 Strongly support 2 Support 3 Oppose 4 Strongly oppose 5 DO NOT READ OUT: Don’t care either way 6 DO NOT READ OUT: Depends 99 DO NOT READ OUT: Don’t know
Q17a In your view, what impact would wind farms in your local region have on your business? Would they have… 1 A positive impact 2 A negative impact 3 or No impact 4 DO NOT READ OUT: Both 9 DO NOT READ OUT: Don’t know
ALTERNATE ORDER – ADVANTAGES/DISADVANTAGES
Q18. What if any benefits would wind farms bring to your business? PROBE: Any other benefits? RECORD VERBATIM RESPONSE
Q19. What if any concerns would you have about wind farms in regards to your business? PROBE: Any other concerns? RECORD VERBATIM RESPONSE
Q20. Now we’re going to talk about wind farms and your local region. I am going to read out some statements. Please tell me the extent to which you agree or disagree with each. Please use a scale of Strongly Agree, Agree, Disagree or Strongly Disagree. NOTE: IF RESPONDENT THINKS STATEMENTS ARE BEING REPEATED, EXPLAIN THIS IS ABOUT LOCAL REGION
AS OPPOSED TO NSW IN GENERAL READ OUT 1 Your local council should take a more active role in encouraging wind farms 2 There should be more wind farms built in your local region 3 Wind farms would boost employment and bring money into the local economy 5 Wind farms would have a negative impact on the local environment 6 Wind farms would benefit your local community 7 Wind farms in your local region would help increase tourism 8 Wind farms would not affect heritage values in your local region 9 There would be no safety concerns associated with wind farms 10 There would no health concerns associated with wind farms SCALE – SINGLE RESPONSE GRID 1 Strongly support 2 Support 3 Oppose 4 Strongly oppose 5 DO NOT READ OUT: Depends 99 DO NOT READ OUT: Don’t know

Community Attitudes to Wind Farms in NSW
© 2010 AMR Interactive 98
Q21. In your view, what impact would wind farms in your local region have on property values? Would they have… 1 A positive impact 2 A negative impact 3 or No impact 4 DO NOT READ OUT: Both 9 DO NOT READ OUT: Don’t know
Q24. Wind farms are usually sited on ridges and hills in rural and coastal areas where wind flow is the greatest. Would you support or oppose a wind farm being built 1 to 2 kilometres from your business? Would you… READ OUT – SINGLE RESPONSE 1 Strongly support 2 Support 3 Oppose 4 Strongly oppose 5 DO NOT READ OUT: Don’t care either way 6 DO NOT READ OUT: Depends 9 DO NOT READ OUT: Don’t know
IF OPPOSE OR DEPENDS/DON’T KNOW IN Q24 ASK Q25
Q25. Would you support or oppose a wind farm being built 10 kilometres from your business? Would you… READ OUT – SINGLE RESPONSE 1 Strongly support 2 Support 3 Oppose 4 Strongly oppose 5 DO NOT READ OUT: Don’t care either way 6 DO NOT READ OUT: Depends 99 DO NOT READ OUT: Don’t know
Q26. IF SUPPORT: What are your main reasons behind your support? IF OTHER: What are your main reasons for not supporting?
RECORD VERBATIM RESPONSE
Q27. In your view, to what extent would noise be a concern for you if a wind farm was 1-2 kilometres away from your business? Would it be: READ OUT 1 No concern 2 Of little concern 3 Of some concern 4 Of great concern 6 DO NOT READ OUT: Depends 99 DO NOT READ OUT: Don’t know

Community Attitudes to Wind Farms in NSW
© 2010 AMR Interactive 99
IF ANSWERED YES AT Q9, ASK Q28
Q28. And have you been close enough to an operating wind turbine or wind farm to hear it? 1 Yes 2 No 9 Don’t know
Q29. From where have you heard or received any information about wind farms? Any others? DO NOT READ OUT – MULTIPLE RESPONSE 1 Television or radio stations (news/current affairs) 2 Local newspapers 3 State/national newspapers 3 Local government 4 Local community groups or social clubs (e.g. Church, Rotary) 5 Local environment groups / Environment groups 5 Local business groups 6 Wind farm developers 7 Family/friends/word of mouth 8 State Government 9 Landscape Guardians 10 Energy companies 11 Nowhere in particular 96 Heard nothing 98 Other (specify)
Q30. Have you heard about the NSW government initiative for setting up renewable energy precincts? 1 Yes 2 No 9 Don’t know
Q33. Do you feel that there is adequate consultation about wind farms available in your local community? 1 Yes 2 No 9 Don’t know
Q34. (a) Do you feel you have adequate information about wind farms? 1 Yes 2 No 9 Don’t know
(b) Are there any specific aspects of wind energy or wind farms that you would like more information on?
RECORD VERBATIM RESPONSE IF A PROPERTY ASK Q35
Q35. Have you been approached by a wind farm developer at all? 1 Yes 2 No 9 Don’t know IF A PROPERTY ASK Q36

Community Attitudes to Wind Farms in NSW
© 2010 AMR Interactive 100
Q36. Would you consider having wind turbines on your property? 1 Yes 2 No 3 Unsure 9 Don’t know
Q37. (a) Would your business consider investing in wind farms in your local region? 1 Yes 2 No 9 Don’t know
(b) Does your business use any renewable energy such as solar panels, or solar hot water; or does your business buy green power? INTERVIEWER: IF ANY OF THE ABOVE MENTIONED OR AGREED TO, CODE AS YES. IF BIOENERGY,
THERMAL ENERGY OR HEAT PUMPS, OR WIND TURBINES MENTIONED, CODE AS YES 1 Yes 2 No 3 Don’t know
IF NO/DON’T KNOW AT (B)
(c) Would your business be interested in buying green energy? 1 Yes 2 No 3 Not sure 9 Don’t know
Section G – Demographic Profile
Q39. How many people does your business employ in your local region? Could you please give as the number of full time equivalents.
RECORD NUMBER – ALLOW 0, AND ONE DECIMAL ______________________
Q43. What is the main product, service or activity that your business provides?
RECORD VERBATIM RESPONSE

Community Attitudes to Wind Farms in NSW
© 2010 AMR Interactive 101
8.2 Appendix B: Weighting
Residential survey
The residential survey was weighted in two stages:
• firstly using two sets of variables within each Precinct/Area — age/gender (Table 40), and gender/education (Table 40); and
• secondly by population within the Precincts (Table 41), to give total results across the Precincts.
The final average weights by age and gender, within each Precinct, are shown in Table 42. (The weighting also took into account education).
Table 40. Population distributions of residential survey by gender and age within Precinct
Gender Age
New England
Tablelands Upper Hunter
Central Tablelands
NSW/ACT Border Region
South Coast
Cooma-Monaro
Control Area
% % % % % % %
Males 18-29 9.03 8.03 9.43 8.26 7.50 8.91 8.78
30-34 12.41 12.13 12.89 13.18 11.36 13.86 12.22
45-64 17.85 19.28 17.77 18.99 18.07 19.75 17.46
65+ 9.46 10.47 9.15 9.52 11.53 9.34 10.08
Females 18-29 9.05 7.42 8.99 7.49 7.27 7.21 8.60
30-34 13.16 12.92 13.34 13.31 12.46 13.41 13.05
45-64 17.58 18.07 17.32 18.26 18.80 17.46 17.67
65+ 11.45 11.66 11.10 10.99 13.01 10.07 12.14
Total 100.00 100.00 100.00 100.00 100.00 100.00 100.00
Table 41. Population distributions of residential survey by gender and education within Precinct
Gender Education
New England
Tablelands Upper Hunter
Central Tablelands
NSW/ACT Border Region
South Coast
Cooma-Monaro
Control Area
% % % % % % %
Males Non-Degree 91.37 93.52 91.38 90.30 91.12 90.40 91.64
Degree 8.63 6.48 8.62 9.70 8.88 9.60 8.36
Total 100.00 100.00 100.00 100.00 100.00 100.00 100.00
% % % % % % %
Females Non-Degree 88.08 89.47 87.79 86.93 89.48 86.78 89.25
Degree 11.92 10.53 12.21 13.07 10.52 13.22 10.75
Total 100.00 100.00 100.00 100.00 100.00 100.00 100.00
Table 42. Weighting of residential survey within the six Precincts
New England
Tablelands Upper Hunter
Central Tablelands
NSW/ACT Border Region
South Coast
Cooma-Monaro Total
Survey 16.8% 16.5% 16.8% 16.6% 16.8% 16.5% 100%
Population 23.5% 4.3% 21.4% 14.9% 32.7% 3.2% 100%
Weight 1.40 0.26 1.28 0.90 1.94 0.20 -

Community Attitudes to Wind Farms in NSW
© 2010 AMR Interactive 102
Table 43. Survey weights applied in the residential survey shown by gender and age within Precinct (before weighting by area)
Gender Age
New England
Tablelands Upper Hunter
Central Tablelands
NSW/ACT Border Region
South Coast
Cooma-Monaro
Control Area
% % % % % % %
Males 18-29 1.74 1.09 1.52 1.48 1.46 2.83 1.43
30-34 1.05 1.33 1.21 1.08 1.14 0.94 1.02
45-64 0.85 0.89 0.89 0.92 0.94 0.90 0.87
65+ 0.94 0.88 0.78 0.88 0.84 0.86 0.82
Females 18-29 1.45 1.52 1.13 1.34 1.51 1.29 1.33
30-34 1.00 1.06 1.14 1.09 0.98 1.20 1.27
45-64 0.88 0.91 0.93 0.89 0.77 0.85 0.84
65+ 0.92 0.90 0.85 0.88 1.31 0.85 1.05
Business survey
The sampling for the business survey was conducted across the Precincts. The results were weighted by industry to the approximate population of employing businesses in the area, based on ABS statistics (Table 44). In this case, the farming businesses from the residential survey were weighted to the large majority of the agriculture/forestry (25.0% out of the 28.3%).
No weights for the 300 businesses in this survey were greater than 1.8.
Table 44. Weighting of business survey by industry to approximate distribution across the Precincts
Industry Survey %
Population %
Weight
A Agriculture Forestry and Fishing 34.1 28.3 0.83
B Mining .2 0.3 1.26
C Manufacturing 5.3 4.3 0.82
E Construction 7.4 13.3 1.80
F Wholesale Trade 2.4 3.6 1.51
G Retail Trade 15.5 14.5 0.93
H Accommodation Cafes and Restaurants 7.6 6.4 0.84
I Transport and Storage 2.9 5.1 1.78
J Communication Services .7 1.1 1.54
K Finance and Insurance 1.7 1.7 1.02
L Property and Business Services 11.2 11.7 1.04
N Education 1.9 0.8 0.42
O Health and Community Services 4.1 4.6 1.13
P Cultural and Recreational Services 2.1 1.4 0.65
Q Personal and other Services 2.9 2.7 0.94

Community Attitudes to Wind Farms in NSW
© 2010 AMR Interactive 103
8.3 Appendix C: Analysis
Analysis techniques
A range of analyses were conducted, including tests of statistical significance. Results were assessed as statistically significant with a p value <.05. The analysis techniques included:
• Pearson Chi-squared tests were conducted to assess overall differences between sub-groups within different population groupings. These groups included the six Precincts, gender, age, residence and Business groupings. Where a significant overall difference was measured on a question, the standardised adjusted residuals were examined to identify which groups were contributing to the statistically significant result.
• Principal component analysis to reduce the attitudinal questions to underlying dimensions. The analysis was run with the survey weighted to the final population across the Precincts.
• Binomial logistic regression was used to build the model of support for wind farms, measuring the change in moving from not supporting to supporting wind farms. The regression was run with the survey weighted within each Precinct, to maintain the power of the analysis, and the Precinct variable included in the analysis. The
attitudinal dimensions, other attitudes, and demographic variables were included in the regression analysis. Several variables associated with proximity of residents to existing/planned wind farms were assessed, with the variable associated with visibility included in the final model. The final index reported for each variable is the maximum change in odds across the different levels of the variable. The indexes for the attitudinal dimensions were estimated from running the regression with a key variable from each dimension, and assessing the maximum change. The key output measure in binomial logistic regression is the odds ratio, or change in the odds. The odds of a result occurring is the probability of it occurring divided by the probability of it not occurring. So a result of 80% would have an odds of 80/(100-80)=4. This is the ratio of the odds of a result in one situation or condition (e.g., among males) compared to another (e.g., females). An odds ratio of 1 indicates that the result is equally likely in both situations. The index was the change in odds when moving from one level of a question or measure to another level. The greater the change in odds, the greater the impact.
• Drivers of support. The importance of attitudes and perceptions influencing support in each Precinct was based on a descriptive analysis of the gap between the ratings of those supporting wind farms and those opposing. The ranking of importance was based on the size of the gap.
Adjustment to sample sizes
Adjustments were made to the sample sizes based on the weighting, for conducting statistical tests:
• for comparisons between the six Precincts in the residential survey, 86% of the sample size; and
• for comparisons between the Precincts and the regional control in the residential survey, 60% of the sample size across the Precincts, and 86% of the regional control; and
• for the additional sample of businesses in the business survey, 91% of the sample size.