Embed Size (px)
Citation preview

Jacob Holm & Sønner Holding A/S
Interim Report Q4 2017
CVR-nr. 28 15 69 60

Table of content
Page
Management’s Review 2
Interim Report for Q4 2017 (Oct 1 - Dec 31, 2017) 3
Financial Review 4
General information 6
Consolidated income statement 7
Consolidated statement of comprehensive income 8
Consolidated balance sheet 9
Consolidated balance sheet 10
Consolidated statement of changes in equity 11
Consolidated statement of cash flows 12
Notes to the Interim Report 13
1

Management’s Review
Summary
Jacob Holm & Sønner Holding A/S and its subsidiaries (“Jacob Holm”, the “Company” or the “Group”) con
cluded its fourth quarter of the financial year 2017 with revenues of DKK 541 million and an EBITDA of DKK 40
million.
The continued devaluation of the USD against DKK and slightly lower volumes negatively impacted revenue
compared to the previous period. EBITDA margin negatively impacted by reducing inventory at generally lower
production volumes .
Forward-looking statementsThis report may be deemed to include forward-looking statements, such as statements that relate to the per
formance of Jacob Holm. Forward-looking statements are typically identified by words or phrases, such as
“about”, “believe”, “expect”, “plan”, “goal”, “target”, “strategy” and similar expressions orfuture or conditional
verbs such as “may”, “will”, “should”, “would”, and “could”. Forward-looking statements are Jacob Holm's
current estimates or expectations of future events or future results. Actual results could differ materially from
those indicated by these statements because the realization of those results is subject to many risks and uncer
tainties. All forward-looking statements included in this press release are based on information available at
the time of the release, and the Company assumes no obligation to update any forward-looking statements.
2

Interim Report for Q4 2017 (Oct 1 - Dec 31, 2017)
Jacob Holm reports for Q4 2017:
■ Revenues of DKK 541 million (-3.8% year-on-year)
■ EBITDA of DKK 48 million (-19.8% year-on-year)
■ Net loss of DKK 9 million (NA)
■ Net debt of DKK 858 million, compared with DKK 972 million at the end of Q3 2017
K e y figu res Q u a rte r e n d e d D e c 31, Y T D e n d e d D e c 30,
2 0 17 2 0 16 2 0 17 2 0 16
DKK 1,000 unaudited unaudited unaudited unaudited
Revenue 540.820 562.328 2.254.386 2.350.781EBITDA 39.940 49.799 164.534 204.405Net profit -8.899 15.807 -47.428 49.713
Cash flow from operating activities 23.442 56.741 36.627 256.701
Cash flow from investing activities -16.113 -33.011 -59.345 -73.835Cash flow from financing activities -46,495 -46,495 -46,495 -46,495
Net interest bearing debt 857.863 816.819
Total assets 1.652.985 1.799.316
This Interim Report for Q4 2017 has not been audited or reviewed.
Contact details:Finn Sch0ning,
Group VP Finance,
Tel: +41 61 270 23 00
3

Financial Review
Revenue
Revenue in Q4 2017 decreased by DKK 3 million or 1% to DKK 541 million compared with DKK 544 million in
Q3 2017. The continued weakening of the USD compared to DKK accounted for the main factor for lower con
solidated revenue. Furthermore, December revenue were impacted by the holiday and end-of-year cut-offs.
Operating expensesCost of goods sold in Q4 2017 totalled DKK 467 million representing 86% of revenue compared with DKK 459
million or 84% in Q3 2017. The increase in % was due to the inventory reduction at lower production volumes.
Other operating expenses amounted to DKK 34 million or 6% of revenue in Q4 2017 compared with DKK 38
million or 7% in Q2 2017.
Depreciation charges of DKK 31 million in Q4 2017 were stable compared to the previous quarter.
EBITDAThe Group delivered an EBITDA of DKK 40 million in Q4 2017 compared to DKK 48 million in Q3 2017, repre
senting a decrease in EBITDA margin of 1.4%.
Financial income and expensesThe Group's financial income and expenses related to borrowing costs for the bonds and other financing ar
rangements were DKK 10 million in Q4 2017 compared to DKK 11 million in Q3 2017.
TaxesThe Group reported a tax expense of DKK 3 million in Q4 2017, compared with a tax credit of DKK 7 million in
Q3 2017.
Net profitThe net profit was negative DKK 9 million in Q4 2017 compared with a net profit of DKK 2 million in Q3 2017.
EquityEquity decreased to DKK 351 million in Q4 2017 as a result of the net loss and the changes in exchange rates.
Net debtThe net debt at the end of Q4 2017 was DKK 858 million compared with DKK 872 million at the end of Q3 2017.
4
Management’s Statement on the Interim Report
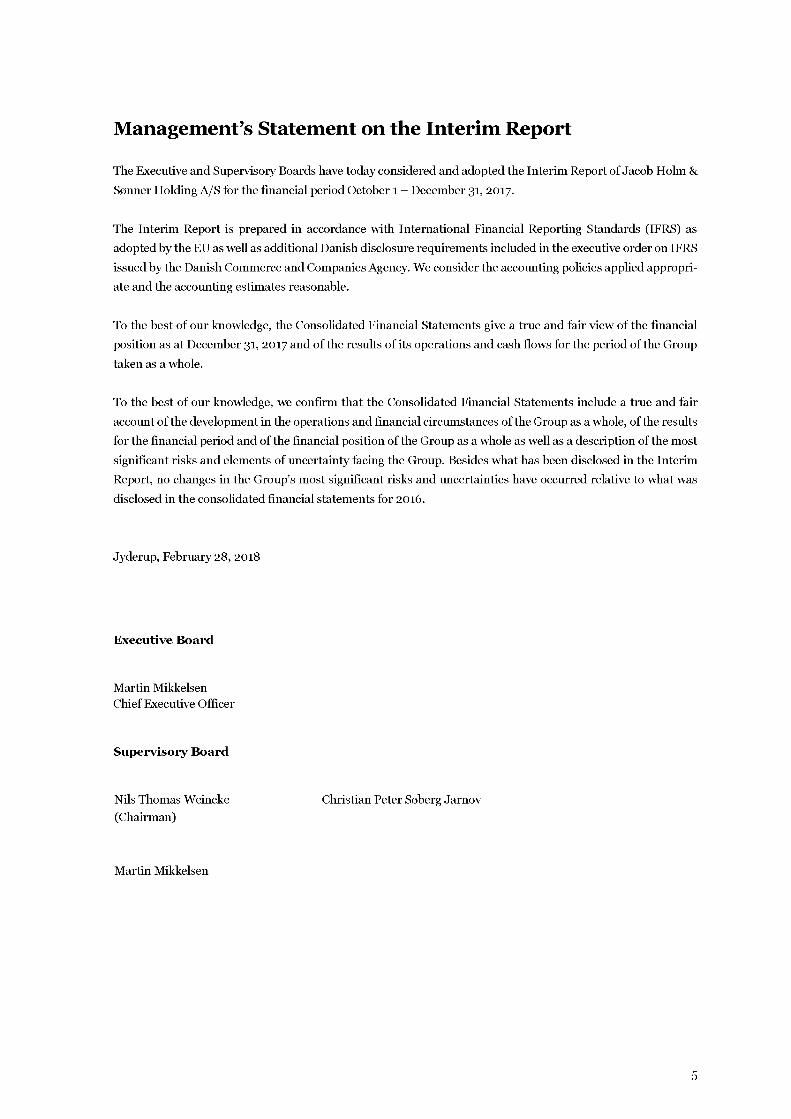
The Executive and Supervisory Boards have today considered and adopted the Interim Report of Jacob Holm &
Sønner Holding A/S for the financial period October 1 - December 31, 2017.
The Interim Report is prepared in accordance with International Financial Reporting Standards (IFRS) as
adopted by the EU as well as additional Danish disclosure requirements included in the executive order on IFRS
issued by the Danish Commerce and Companies Agency. We consider the accounting policies applied appropri
ate and the accounting estimates reasonable.
To the best of our knowledge, the Consolidated Financial Statements give a true and fair view of the financial
position as at December 31, 2017 and of the results of its operations and cash flows for the period of the Group
taken as a whole.
To the best of our knowledge, we confirm that the Consolidated Financial Statements include a true and fair
account of the development in the operations and financial circumstances of the Group as a whole, of the results
for the financial period and of the financial position of the Group as a whole as well as a description of the most
significant risks and elements of uncertainty facing the Group. Besides what has been disclosed in the Interim
Report, no changes in the Group's most significant risks and uncertainties have occurred relative to what was
disclosed in the consolidated financial statements for 2016.
Jyderup, February 28, 2018
Executive Board
Martin Mikkelsen Chief Executive Officer
Supervisory Board
Nils Thomas Weincke Christian Peter Søberg Jarnov(Chairman)
Martin Mikkelsen
5
General information
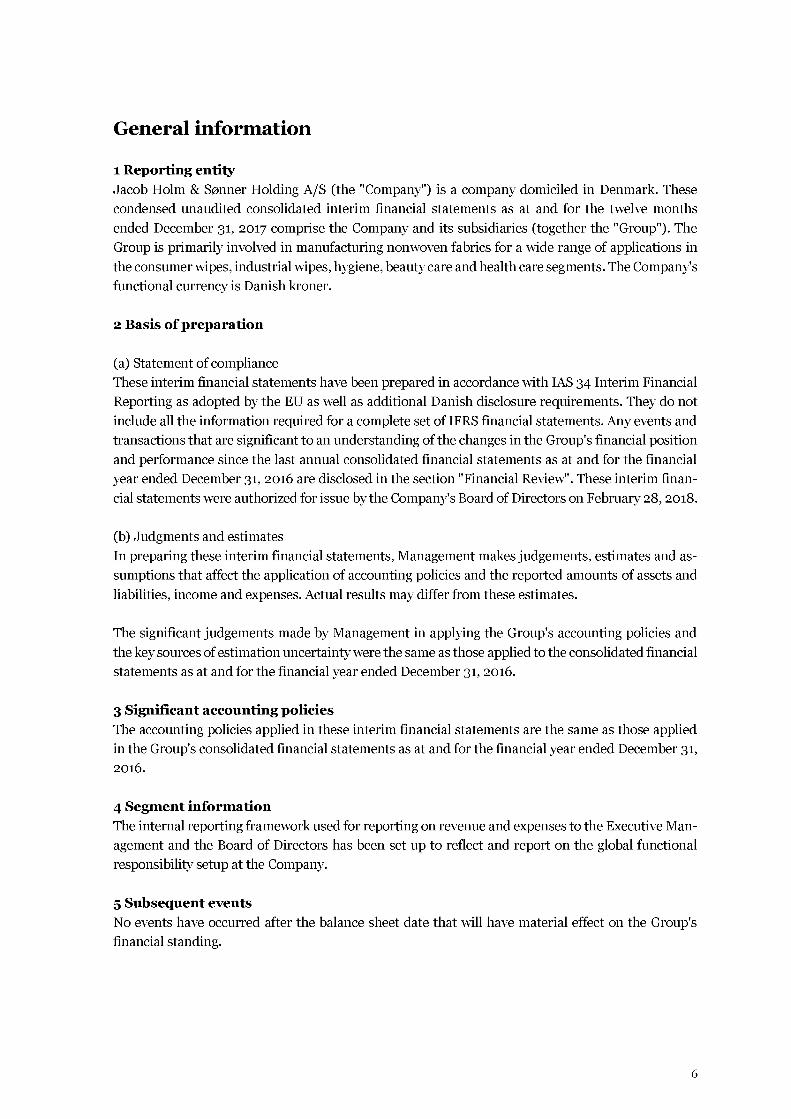
1 Reporting entityJacob Holm & Sønner Holding A/S (the "Company") is a company domiciled in Denmark. These condensed unaudited consolidated interim financial statements as at and for the twelve months ended December 31, 2017 comprise the Company and its subsidiaries (together the "Group"). The Group is primarily involved in manufacturing nonwoven fabrics for a wide range of applications in the consumer wipes, industrial wipes, hygiene, beauty care and health care segments. The Company's functional currency is Danish kroner.
2 Basis of preparation
(a) Statement of complianceThese interim financial statements have been prepared in accordance with IAS 34 Interim Financial Reporting as adopted by the EU as well as additional Danish disclosure requirements. They do not include all the information required for a complete set of IFRS financial statements. Any events and transactions that are significant to an understanding of the changes in the Group's financial position and performance since the last annual consolidated financial statements as at and for the financial year ended December 31, 2016 are disclosed in the section "Financial Review". These interim finan
cial statements were authorized for issue by the Company's Board of Directors on February 28, 2018.
(b) Judgments and estimatesIn preparing these interim financial statements, Management makes judgements, estimates and assumptions that affect the application of accounting policies and the reported amounts of assets and liabilities, income and expenses. Actual results may differ from these estimates.
The significant judgements made by Management in applying the Group's accounting policies and the key sources of estimation uncertainty were the same as those applied to the consolidated financial statements as at and for the financial year ended December 31, 2016.
3 Significant accounting policiesThe accounting policies applied in these interim financial statements are the same as those applied in the Group's consolidated financial statements as at and for the financial year ended December 31, 2016.
4 Segment informationThe internal reporting framework used for reporting on revenue and expenses to the Executive Management and the Board of Directors has been set up to reflect and report on the global functional responsibility setup at the Company.
5 Subsequent eventsNo events have occurred after the balance sheet date that will have material effect on the Group's financial standing.
6
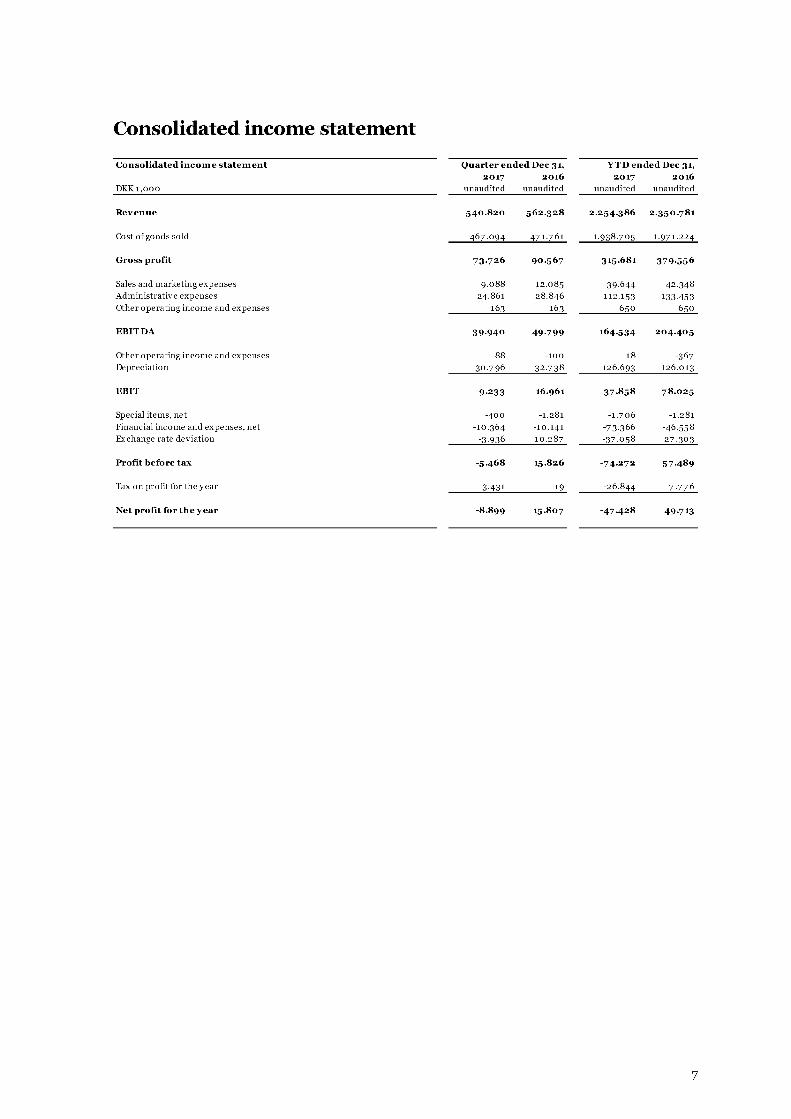
Consolidated income statement
C o n s o lid a te d in c o m e s ta te m e n t
D K K 1 ,0 0 0
Q u a rte r e n d e d D e c 31,
2 0 17 2 016
u n a u d it e d u n a u d it e d
Y T D e n d e d D ec 31,
2 0 17 2016
u n a u d it e d u n a u d it e d
R e v e n u e 5 4 0 .8 2 0 5 6 2 .3 2 8 2 .2 5 4 .3 8 6 2 .3 5 0 .7 8 1
C o s t o f g o o d s s o ld 4 6 7 0 9 4 471 .761 1 .9 3 8 .7 0 5 1 . 9 7 1 .2 2 4
G ro ss p ro fit 7 3 .7 2 6 9 0 .5 6 7 3 15.6 8 1 3 7 9 .5 5 6
S a le s a n d m a r k e t in g e x p e n s e s 9 .0 8 8 1 2 .0 8 5 39.644 42 .348
A d m in is t r a t i v e e x p e n s e s 2 4 .8 6 1 2 8 .8 4 6 1 1 2 .1 5 3 133.453
O t h e r o p e r a t in g in c o m e a n d e x p e n s e s 1 6 3 1 6 3 6 5 0 6 5 0
E B IT D A 3 9 .9 4 0 4 9 .7 9 9 16 4 .5 34 2 0 4 .4 0 5
O t h e r o p e r a t in g in c o m e a n d e x p e n s e s 8 8 -1 0 0 1 8 -367
D e p r e c ia t io n 3 0 .7 9 6 3 2 .7 3 8 1 2 6 .6 9 3 1 2 6 .0 1 3
E B IT 9.233 16.961 3 7 .8 5 8 7 8 .0 2 5
S p e c ia l it e m s , n e t -4 0 0 - 1 .2 8 1 - 1 .7 0 6 -1 .2 8 1
F in a n c ia l in c o m e a n d e x p e n s e s , n e t - 1 0 .3 6 4 - 1 0 .1 4 1 -73 .366 -46 .558
E x c h a n g e r a t e d e v ia t io n - 3 9 3 6 1 0 .2 8 7 - 3 7 .0 5 8 2 7 .3 0 3
P ro fit b e fo re ta x -5 .46 8 15.826 - 7 4 .2 7 2 5 7 .4 8 9
T a x o n p r o f i t f o r t h e y e a r 3 431 19 - 2 6 .8 4 4 7 .7 7 6
N e t p r o fit fo r th e y ear -8.899 15.8 0 7 - 4 7 .4 2 8 4 9 .713
7

Consolidated statement of comprehensive income
C o n so lid a te d s ta te m e n t o f c o m p r e h e n s iv e in c o m e
D K K 1 ,0 0 0
Q u a rte r e n d e d D ec 31,
2 0 17 2 016
u n a u d it e d u n a u d it e d
Y T D e n d e d D ec 31,
2 0 17 2 0 16
u n a u d it e d u n a u d it e d
N e t p r o fit fo r th e p e rio d -8.899 15.807 - 4 7 4 2 8 4 9 .713
O th e r c o m p r e h e n s iv e in c o m e
I t e m s t h a t m a y b e s u b s e q u e n t l y r e c la s s i f ie d t o in c o m e s t a t e m e n t
E x c h a n g e a d ju s tm e n t , f o r e ig n c o m p a n ie s - 1 0 .6 5 2 1 9 5 4 3 - 7 0 .1 6 5 10.495
T o t a l c o m p r e h e n s iv e in c o m e fo r t h e p e rio d -19 .5 5 2 3 5 .3 5 0 -117.5 9 4 6 0 .2 0 8
8

Consolidated balance sheet
C o n so lid a te d b a la n c e sh e e t D ec 31, D ec 3 1,20 17 2016
D K K 1 ,0 0 0 u n a u d it e d a u d it e d
A s se ts
I n ta n g ib le fix e d a ssets 118.827 138 .53 2
L a n d & B u ild in g s 2 2 7 .5 3 9 2 6 5 .1 7 8
P la n t a n d m a c h in e r y 5 9 6 .5 7 2 7 2 2 .0 4 4
O th e r f ix t u r e s a n d f it t in g s , t o o ls a n d e q u ip m e n t 1 3 8 7 0 15.342
P r o p e r t y , p la n t a n d e q u ip m e n t u n d e r c o n s t r u c t io n 2 5 .3 6 7 2 0 .8 0 5
P ro p e rty , p la n t a n d e q u ip m e n t 8 6 3.3 4 8 1.0 2 3 .3 7 0
O th e r r e c e i v a b l e s 3 4 4 3 2 .0 3 0
D e fe r r e d ta x a s s e t 15 594 1 3 .9 0 2
F in a n c ia l fix e d a sse ts 19.037 15.93 2
N o n -c u r r e n t a ssets 1.001.212 1.17 7 .8 3 3
I n v e n to r ie s 164 .30 0 17 7 .10 2
T r a d e r e c e i v a b l e s 298 .476 309 .713
R e c e i v a b le s d u e f r o m g r o u p c o m p a n ie s 0 0
C o r p o r a t e ta x 1.384 2 6 7
B o n d s a t f a ir v a lu e th r o u g h p r o f i t a n d lo s s 8 .479 9.515
O th e r r e c e i v a b l e s a n d p r e p a y m e n t s 4 8 .6 7 8 41.489
R e c e iv a b le s 3 5 7 .0 18 3 6 0 .9 8 4
C a s h a t b a n k a n d in h a n d 130 .456 83.397
C u r r e n t a ssets 6 5 1 .7 7 4 621.483
A s se ts 1.6 5 2 .9 8 5 1.79 9 .3 16
9

Consolidated balance sheet
C o n so lid a te d b a la n c e sh e e t D ec 31, D ec 3 1,20 17 2016
D K K 1 ,0 0 0 u n a u d it e d a u d it e d
E q u ity a n d lia b ilitie s
E q u ity 3 7 0 .4 8 5 4 9 3 .5 2 7
I n t e r e s t b e a r i n g l ia b i l i t ie s 8 6 7 .0 4 4 794 .791
P r o v is io n s f o r d e f e r r e d ta x 2 4 .1 9 8 4 6 .277
P r o v is io n s f o r o t h e r s t a f f o b l ig a t io n s 6 .5 1 2 6 .5 1 2
P r o v is io n s o t h e r 6 .3 0 0 7 .0 5 0
N o n -c u r r e n t lia b ilitie s 9 0 4 .0 5 4 8 5 4 .6 3 0
I n t e r e s t b e a r i n g l ia b i l i t ie s 0 0
C r e d it in s t i t u t io n s 1 1 7 .8 3 1 114.941
T r a d e p a y a b l e s 1 6 9 .0 1 3 1 8 8 .7 8 5
P a y a b le s , p la n t a n d m a c h i n e r y 1.923 6 .875
P a y a b le s d u e t o g r o u p c o m p a n ie s 0 7 .362
C o r p o r a t e ta x 15.949 1 8 .9 2 1
O t h e r p a y a b l e s 1 0 4 .9 8 9 114.277
C u r r e n t lia b ilitie s 4 0 9 .7 0 5 451.160
L ia b ilitie s 1.3 13 .75 8 1.3 0 5 .7 9 0
E q u ity a n d lia b ilitie s 1.684.243 1.79 9 .3 16
10

Consolidated statement of changes in equity
C o n s o lid a te d s t a te m e n t o f c h a n g e s in e q u ity
D K K 1 ,0 0 0
S h a re
c a p ita l
u n a u d i t e d
E x c h a n g e
adj.
u n a u d i t e d
R e ta in e d
e a r n in g s
u n a u d i t e d
T o t a l
u n a u d i t e d
E q u it y a t J a n u a r y 1, 2 0 1 7 1.0 0 0 8 7 .18 2 4 0 5 .3 4 5 4 9 3 5 2 7
C o m p r e h e n s i v e in c o m e f o r t h e p e r i o d 0 - 7 0 . 1 6 5 - 4 7 .4 2 8 - 117 .594
D i v id e n d s 0 0 - 2 5 .0 0 0 - 2 5 .0 0 0
E q u it y a t D e c e m b e r 31, 2 0 1 7 1.0 0 0 17 .0 16 3 3 2 .9 1 7 3 5 0 .9 3 3
E q u it y a t J a n u a r y 1, 2 0 16 1.0 0 0 7 6 .6 8 6 3 7 5 .6 3 2 4 5 3 .3 1 9
C o m p r e h e n s i v e in c o m e f o r t h e p e r i o d 0 10 .495 4 9 .713 6 0 .2 0 8
D i v id e n d s 0 0 - 2 0 .0 0 0 - 2 0 .0 0 0
E q u it y a t D e c e m b e r 31, 2 0 16 1.0 0 0 8 7 .18 2 4 0 5 .3 4 5 4 9 3 .5 2 7
Paid dividends per share in 2017 amounts to DKK 25 (DKK 20 in 2016).
11
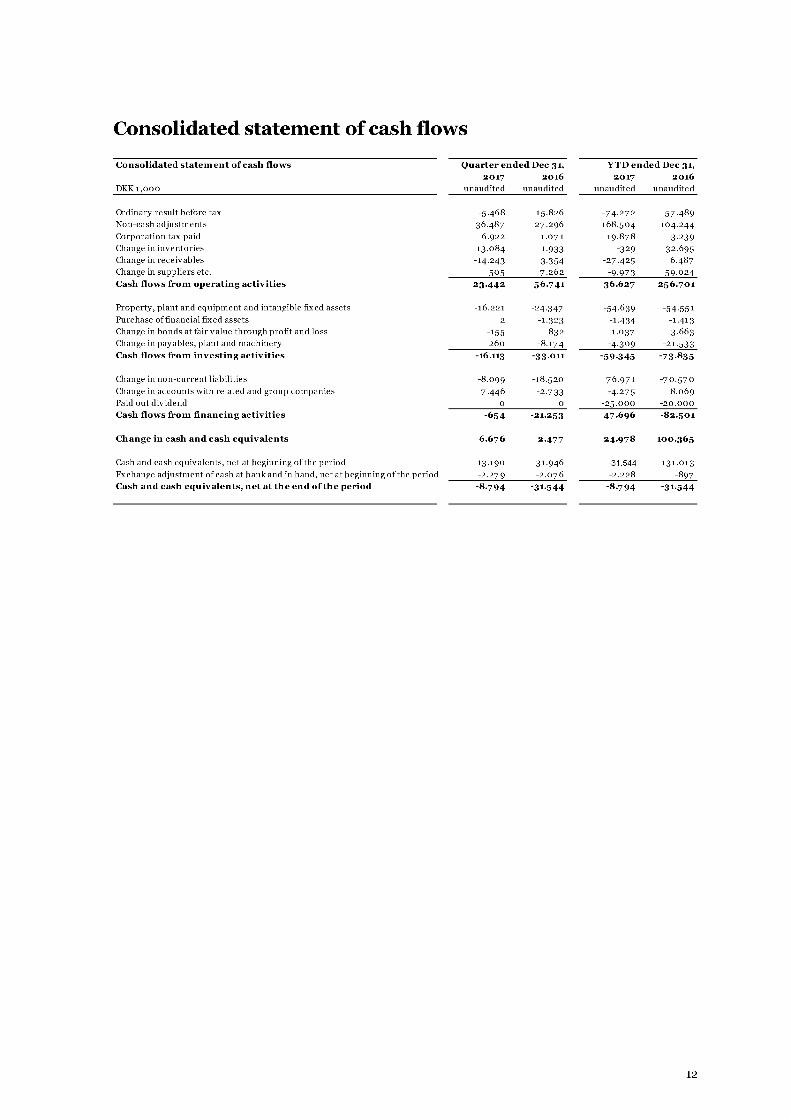
Consolidated statement of cash flows
C o n so lid a te d s ta te m e n t o f ca sh flo w s
D K K 1 ,0 0 0
Q u a rte r e n d e d D ec 31,
2 0 17 2016
u n a u d it e d u n a u d it e d
Y T D e n d e d D ec 31,
2 0 17 2016
u n a u d it e d u n a u d it e d
O r d in a r y r e s u l t b e f o r e ta x - 5 .4 6 8 1 5 .8 2 6 - 7 4 .2 7 2 5 7 .489
N o n - c a s h a d ju s tm e n t s 3 6 .4 8 7 2 7 .2 9 6 1 6 8 .5 0 4 104 .244
C o r p o r a t io n t a x p a id -6 .9 2 2 1 . 0 7 1 - 1 9 .8 7 8 -3.239
C h a n g e in in v e n t o r i e s 1 3 .0 8 4 1.933 -329 32.695
C h a n g e in r e c e i v a b l e s - 14.243 3.354 - 27 .425 6 .487
C h a n g e in s u p p l ie r s e tc . 5 0 5 7 .2 6 2 -9 .973 5 9 .024
C ash flo w s fro m o p e r a tin g a c tiv itie s 23 442 5 6 .7 4 1 3 6 .6 2 7 2 5 6 .7 0 1
P r o p e r t y , p la n t a n d e q u ip m e n t a n d in t a n g ib le f ix e d a s s e t s - 1 6 .2 2 1 - 24.347 -54.639 -54.551
P u r c h a s e o f f in a n c ia l f ix e d a s s e t s 2 - 1.323 - 1.434 - 1.413
C h a n g e in b o n d s a t f a ir v a l u e t h r o u g h p r o f i t a n d lo s s -155 8 3 2 1.037 3 .663
C h a n g e in p a y a b l e s , p la n t a n d m a c h in e r y 2 6 0 - 8.174 - 4 3 0 9 -21.533
C ash flo w s fro m in v e s tin g a c tiv itie s -16.113 -33 .0 11 -5 9 3 4 5 -7 3 .8 3 5
C h a n g e in n o n - c u r r e n t l i a b i l i t ie s -8 .0 99 - 1 8 .5 2 0 76 .971 -7 0 .5 7 0
C h a n g e in a c c o u n t s w it h r e la t e d a n d g r o u p c o m p a n ie s 7 .4 46 -2 .733 -4 .275 8 .0 6 9
P a id o u t d iv id e n d 0 0 - 2 5 .0 0 0 - 2 0 .0 0 0
C ash flo w s fro m fin a n c in g a c tiv itie s -6 5 4 -2 1.253 4 7.6 9 6 -8 2 .5 0 1
C h a n g e in ca sh a n d ca sh e q u iv a le n ts 6 .6 76 2 .4 7 7 2 4 .9 7 8 10 0 .3 6 5
C a s h a n d c a s h e q u iv a le n t s , n e t a t b e g in n in g o f t h e p e r io d - 1 3 .1 9 0 -31.946 -31.544 - 1 3 1 .0 1 3
E x c h a n g e a d ju s tm e n t o f c a s h a t b a n k a n d in h a n d , n e t a t b e g in n in g o f t h e p e r io d - 2 .2 7 9 - 2 .0 7 6 - 2 .2 2 8 -897
C ash a n d ca sh e q u iv a le n ts , n e t at th e e n d o f th e p e rio d -8 .7 9 4 -3 1.54 4 -8 .79 4 -3 1.5 4 4
12
Notes to the Interim Report
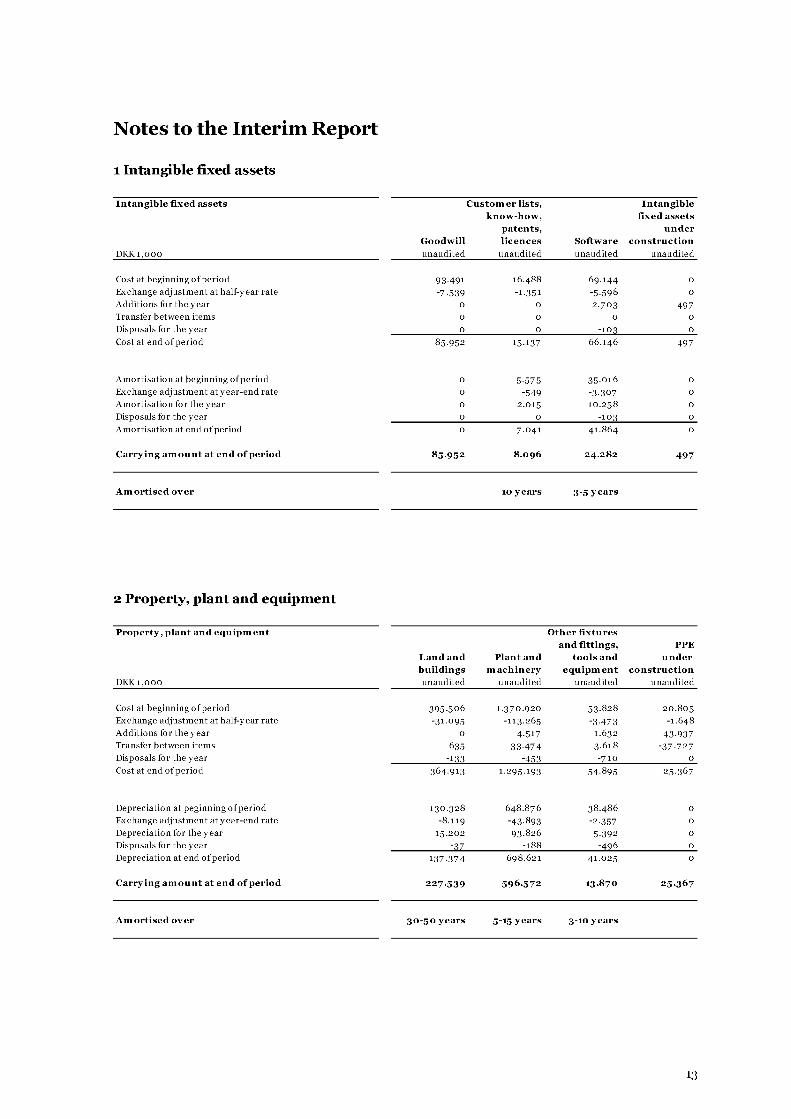
1 Intangible fixed assets
I n t a n g ib le f ix e d a s s e ts
D K K 1 , 0 0 0
G o o d w ill
u n a u d i t e d
C u s to m e r lis ts ,
k n o w -h o w ,
p a te n ts ,
l ic e n c e s
u n a u d i t e d
S o ftw a r e
u n a u d i t e d
I n t a n g ib le
f ix e d a s s e ts
u n d e r
c o n s t r u c t io n
u n a u d i t e d
C o s t a t b e g i n n i n g o f p e r i o d 93-491 1 6 - 4 8 8 69-144 0
E x c h a n g e a d j u s t m e n t a t h a l f - y e a r r a t e -7 -53 9 - 1-351 - 5 -598 0
A d d i t i o n s f o r t h e y e a r 0 0 2 -7 0 3 497
T r a n s f e r b e t w e e n i t e m s 0 0 0 0
D i s p o s a l s f o r t h e y e a r 0 0 - 1 0 3 0
C o s t a t e n d o f p e r i o d 8 5 - 9 5 2 15-137 6 6 - 1 4 6 497
A m o r t i s a t i o n a t b e g i n n i n g o f p e r i o d 0 5 -575 3 5 - 0 1 6 0
E x c h a n g e a d j u s t m e n t a t y e a r - e n d r a t e 0 -549 - 3 -307 0
A m o r t i s a t i o n f o r t h e y e a r 0 2 - 0 1 5 1 0 - 2 5 8 0
D i s p o s a l s f o r t h e y e a r 0 0 - 1 0 3 0
A m o r t i s a t i o n a t e n d o f p e r i o d 0 7 - 0 4 1 4 1 - 8 6 4 0
C a r r y in g a m o u n t a t e n d o f p e r io d 8 5 9 5 2 8 .0 9 6 2 4 .2 8 2 4 9 7
A m o r tis e d o v er 10 y e a r s 3 -5 y e a r s
2 Property, plant and equipment
P r o p e r ty , p la n t a n d e q u ip m e n t
D K K 1 , 0 0 0
L a n d a n d
b u ild in g s
u n a u d i t e d
P la n t a n d
m a c h in e r y
u n a u d i t e d
O t h e r f ix t u r e s
a n d fit t in g s ,
t o o ls a n d
e q u ip m e n t
u n a u d i t e d
P P E
u n d e r
c o n s t r u c t io n
u n a u d i t e d
C o s t a t b e g i n n i n g o f p e r i o d 3 9 5 -5 0 6 1 - 3 7 0 - 9 2 0 5 3 .8 2 8 2 0 - 8 0 5
E x c h a n g e a d j u s t m e n t a t h a l f - y e a r r a t e - 31-095 - 1 1 3 - 2 6 5 - 3 -47 3 - 1 - 6 4 8
A d d i t i o n s f o r t h e y e a r 0 4-517 1 .6 3 2 43-937
T r a n s f e r b e t w e e n i t e m s 635 3 3 -4 7 4 3 .6 1 8 - 3 7 -7 2 7
D i s p o s a l s f o r t h e y e a r -133 -453 - 7 1 0 0
C o s t a t e n d o f p e r i o d 364 -913 1 - 2 9 5 - 1 9 3 5 4 .8 9 5 25-367
D e p r e c i a t i o n a t p e g i n n i n g o f p e r i o d 1 3 0 - 3 2 8 6 4 8 - 8 7 6 3 8 - 4 8 6 0
E x c h a n g e a d j u s t m e n t a t y e a r - e n d r a t e - 8 - 1 1 9 - 43-893 - 2-357 0
D e p r e c i a t i o n f o r t h e y e a r 1 5 - 2 0 2 9 3 - 8 2 6 5-392 0
D i s p o s a l s f o r t h e y e a r -37 - 1 8 8 -4 9 6 0
D e p r e c i a t i o n a t e n d o f p e r i o d 1 3 7 -3 7 4 6 9 8 - 6 2 1 4 1 - 0 2 5 0
C a r r y in g a m o u n t a t e n d o f p e r io d 2 2 7 .5 3 9 5 9 6 .5 7 2 13 .8 7 0 2 5 .3 6 7
A m o r tis e d o v er 3 0 -5 0 y e a r s 5 -15 y e a r s 3 -10 y e a r s
13

3 Interest bearing liabilitiesInterest bearing liabilities is made up of the issued Bond and financing granted by credit institutions.
As at December 31, 2017 the split and maturity is as follows:
I n t e r e s t b e a r i n g l i a b i l i t i e s
D K K 1 , 0 0 0
2 0 1 8
u n a u d i t e d
2 0 1 9
u n a u d i t e d
2 0 2 0
u n a u d i t e d
2 0 2 1
u n a u d i t e d
T o t a l
u n a u d i t e d
B o n d 0 0 0 7 4 4 . 4 9 0 7 4 4 .4 9 0
C r e d i t i n s t i t u t i o n s 3 7 . 2 8 1 8 7 . 1 0 0 0 0 1 2 4 . 3 8 1
F i n a n c i n g c o s t s - 3 . 2 0 6 - 2 . 8 2 9 - 2 . 3 5 0 - 2 .9 3 8 - 1 1 . 3 2 3
3 4 0 7 5 8 4 . 2 7 1 - 2 . 3 5 0 741 .5 52 8 5 7 .5 4 8
(a) Bond
On March 31, 2017, the parent company issued a series of new bonds in the amount of EUR 100 million. The net
proceeds of the news bonds were used to refinance the bonds issued in 2014 and for general corporate purposes.
The redemption of the 2014 bonds including the call premium as well as the release of the remaining proceeds
from the escrow to the Group occurred on April 25, 2017. Between the settlement of the EUR bonds on March
31, 2017 and the redemption of the SEK bonds, the net proceeds were deposited on an escrow account and pre
sented in Cash at bank and in hand on the balance sheet. The interest coupon on the par value of the new bonds
payable and including, the issue date is three months EURIBOR plus a margin of 3.75% (subject to adjustment
in case of incurrence events).
The Bond matures in full on March 31, 2022. The Company may redeem the bond issue in whole or in part at
any time. The redemption price is:
Today to September 2019
September 2019 to March 2020
March 2020 to September 2020
September 2020 to March 2021
March 2021 to September 2021
From September 2021
102% of par value plus remaining interest payments until September 2019
discounted at 50 basis point over the comparable government bonds of the
Federal Republic of Germany.
102% of par value
101.50% of par value
101.25% of par value
100.75% of par value
100% of par value
The bonds are subject to a net debt / EBITDA ratio covenant testing in case of an Incurrence Event.
(b) Credit institutions
Credit institutions primarily includes term loans granted to the Plant in Asheville, United States. These term
loans are USD denominated and with variable interest.
The covenants comprise measurements on specific financial ratios, including solvency, EBITDA in relation to
fixed charges (interest, instalments, income tax, dividend and capital expenditure) and the cover of revolving
credit by working capital.
14

4 Segment informationThe Group's global functional responsibility is divided into four segments:
(1) The Jacob Holm Industries segment produces and sells non-woven roll-goods.
(2) The Sontara segment produces and sells non-woven in converted and roll-goods form.
(3) The TWIG segment sells non-woven by-products and provides internal converting services.
(4) The Headquarter segment consists of the Danish holding and management companies Jacob Holm & Søn
ner Holding A/S and Jacob Holm & Sønner A/S.
S e g m e n t in fo r m a tio n Y T D e n d e d D e c 31,
2 0 1 7 2 0 1 6
D K K 1 , 0 0 0 u n a u d i t e d u n a u d i t e d
R e v e n u e
J a c o b H o lm I n d u s t r i e s 9 5 2 .5 3 4 1 . 0 3 9 . 2 1 9
S o n t a r a 1 . 2 9 6 . 6 7 5 1 . 2 9 8 . 8 1 8
T W I G 5 5 .8 6 8 4 3 .6 6 0
H e a d q u a r t e r 2 . 1 6 4 2 . 8 1 1
E l i m i n a t io n s - 5 2 .8 5 4 -3 3 .7 2 8
G r o u p 2 .2 5 4 .3 8 6 2 .3 5 0 .7 8 1
E B T T D A
J a c o b H o lm I n d u s t r i e s 1 7 . 7 0 8 7 9 .3 0 7
S o n t a r a 143 .563 1 2 0 . 0 7 3
T W I G 5 .183 6 .4 3 6
H e a d q u a r t e r - 1 .9 2 0 - 1 . 4 1 1
E l i m i n a t io n s 0 0
G r o u p 16 4 .5 3 4 2 0 4 .4 0 5
5 Transactions with related partiesBesides intercompany transactions that have been eliminated in the Consolidated Income Statement, related
party transactions comprise purchases and sales of management services from and to the related company Jacob
Holm & Sons AG. Further, royalty fee charges are being made by Jacob Holm & Sons AG.
Purchases of management services amounts to DKK 30 million for the year-to-date whereas sales of manage
ment services amounted to DKK 6 million for the year-to-date.
Charges of royalty fees for the year-to-date amounts to DKK 38 million.
Further, the Consolidated Income Statement includes a financial expense of DKK 3 MM from guarantee fee
charges related to the Parent Company's guarantee regarding the bonds. The Parent Company is guaranteeing
the nominal value of the bonds.
The Group has charged management services in the amount of DKK 0.7 million to Dønnerup A/S for the year-
to-date. Dønnerup A/ S has charged rental expenses in the amount of DKK 0.7 million for the year-to-date.
15


![sønner - Skabelse.dk · fdgdf * sønner] blev folkeslagene spredt ud på Jorden i tiden efter vand"oden …«] Denne sortering efter Y-kromosomet (det mandlige kønskromosom) har](https://img.dokumen.tips/doc/110x75/60b06511c98a5b5f9b3d0dd5/snner-fdgdf-snner-blev-folkeslagene-spredt-ud-p-jorden-i-tiden-efter.jpg)