Embed Size (px)
Citation preview
Jacob Holm & Sønner Holding A/S
Interim Report Q2 2017 and Hi 2017
CVR-nr. 28 15 69 60
Table of content
Page
Management’s Review 2
Interim Report for Q2 2017 (Apr 1 - Jun 30, 2017) 3
Financial Review 4
General information 6
Consolidated income statement 7
Consolidated statement of comprehensive income 8
Consolidated balance sheet 9
Consolidated balance sheet 10
Consolidated statement of changes in equity 11
Consolidated statement of cash flows 12
Notes to the Interim Report 13
1

Management’s Review
Summary
Jacob Holm & Sønner Holding A/S and its subsidiaries (“Jacob Holm”, the “Company” or the “Group”) con
cluded its second quarter of the financial year 2017 with revenues of DKK 588 million and an EBITDA of DKK
46 million.
Increasing raw material prices were a key driver for the slightly higher topline, but among other factors also
caused an increase in net working capital and put pressure on operating margins due to the contractual lag in
passing through on sales prices for selected programs. However, this was compensated by a favorable product
mix and a solid operational performance in Q2 2017 leading to an increase in EBITDA margin vs. the previous
quarter.
Forward-looking statementsThis report may be deemed to include forward-looking statements, such as statements that relate to the per
formance of Jacob Holm. Forward-looking statements are typically identified by words or phrases, such as
“about”, “believe”, “expect”, “plan”, “goal”, “target”, “strategy” and similar expressions orfuture or conditional
verbs such as “may”, “will”, “should”, “would”, and “could”. Forward-looking statements are Jacob Holm's
current estimates or expectations of future events or future results. Actual results could differ materially from
those indicated by these statements because the realization of those results is subject to many risks and uncer
tainties. All forward-looking statements included in this press release are based on information available at
the time of the release, and the Company assumes no obligation to update any forward-looking statements.
2
Interim Report for Q2 2017 (Apr 1 - Jun 30, 2017)
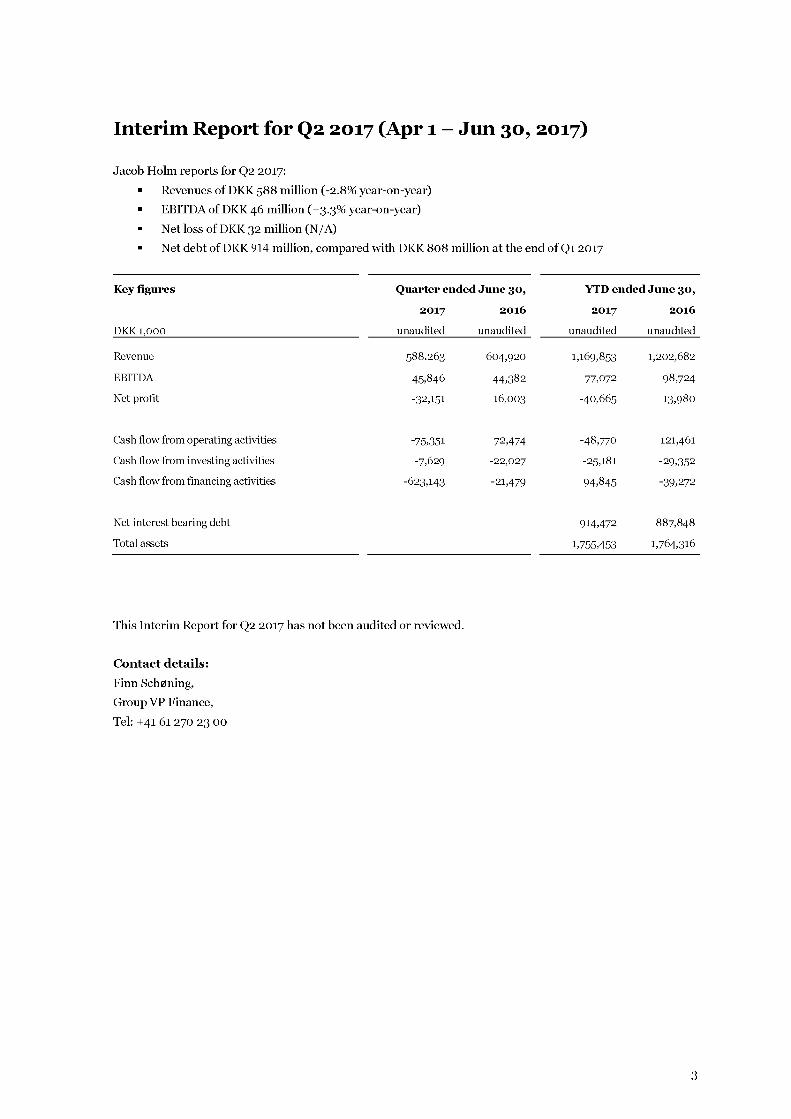
Jacob Holm reports for Q2 2017:
■ Revenues of DKK 588 million (-2.8% year-on-year)
■ EBITDA of DKK 46 million (+3.3% year-on-year)
■ Net loss of DKK 32 million (N/A)
■ Net debt of DKK 914 million, compared with DKK 808 million at the end of Q1 2017
K e y figu res Q u a rte r e n d e d J u n e 30 , Y T D e n d e d J u n e 30 ,
2 0 17 2 0 16 2 0 17 2 0 16
DKK 1,000 unaudited unaudited unaudited unaudited
Revenue 588.263 604,920 1,169,853 1,202,682
EBITDA 45,846 44,382 77,072 98,724
Net profit -32,151 16,003 -40,665 13,980
Cash flow from operating activities -75,351 72,474 -48,770 121,461
Cash flow from investing activities -7,629 -22,027 -25,181 -29,352
Cash flow from financing activities -623,143 -21,479 94,845 -39,272
Net interest bearing debt 914,472 887,848
Total assets 1,755,453 1,764,316
This Interim Report for Q2 2017 has not been audited or reviewed.
Contact details:
Finn Sch0ning,
Group VP Finance,
Tel: +41 61 270 23 00
3
Financial Review
Revenue
Revenue in Q2 2017 increased by DKK 6 million or 1% to DKK 588 million compared with DKK 582 million in
Q l 2017. The competitive situation in North America and Europe continued to be tight due to the unfavourable
supply demand balance in selected end markets.
Operating expensesCost of goods sold in Q2 2017 totalled DKK 501 million representing 85% of revenue compared with DKK 511
million or 88% in Q1 2017. The lower cost of goods sold were among others a result of improved operational
performance compared to the previous quarter.
Other operating expenses amounted to DKK 41 million or 7% of revenue in Q2 2017 compared with DKK 39
million or 7% in Q1 2017.
Depreciation charges of DKK 32 million in Q2 2017 were in line with the previous quarter.
EBITDA
The Group delivered an EBITDA of DKK 46 million in Q2 2017 compared to DKK 31 million in Q1 2017, repre
senting an increase in EBITDA margin of +3.4%.
Financial income and expenses
The Group's financial income and expenses related to borrowing costs for the bonds and other financing ar
rangements were DKK 41 million in Q2 2017 compared to DKK 11 million in Q1 2017. The increase in Q2 2017
was mainly related to the refinancing of the Bond.
TaxesThe Group reported a tax credit of DKK 14 million in Q2 2017, compared with a tax expense of DKK 5 million in
Q1 2017.
Net profit
The net loss was DKK 32 million in Q2 2017 compared with a net loss of DKK 8 million in Q1 2017.
EquityEquity decreased to DKK 394 million in Q2 2017 based on the negative result for the period, changes in exchange
rates and a DKK 25 million dividend to the Parent company.
Net debtThe net debt at the end of Q2 2017 was DKK 914 million compared with DKK 808 million at the end of Q1 2017.
The increase in net debt was driven by several factors, among others the call premium on the SEK bond, the
Bond refinancing costs, an increase in net working capital as well as the dividend distribution to the Parent
company.
4
Management’s Statement on the Interim Report
The Executive and Supervisory Boards have today considered and adopted the Interim Report of Jacob Holm &
Sønner Holding A/S for the financial period April 1 - June 30, 2017.
The Interim Report is prepared in accordance with International Financial Reporting Standards (IFRS) as
adopted by the EU as well as additional Danish disclosure requirements included in the executive order on IFRS
issued by the Danish Commerce and Companies Agency. We consider the accounting policies applied appropri
ate and the accounting estimates reasonable.
To the best of our knowledge, the Consolidated Financial Statements give a true and fair view of the financial
position as at June 30, 2017 and of the results of its operations and cash flows for the period of the Group taken
as a whole.
To the best of our knowledge, we confirm that the Consolidated Financial Statements include a true and fair
account of the development in the operations and financial circumstances of the Group as a whole, of the results
for the financial period and of the financial position of the Group as a whole as well as a description of the most
significant risks and elements of uncertainty facing the Group. Besides what has been disclosed in the Interim
Report, no changes in the Group's most significant risks and uncertainties have occurred relative to what was
disclosed in the consolidated financial statements for 2016.
Jyderup, August 24, 2017
Executive Board
Martin Mikkelsen Chief Executive Officer
Supervisory Board
Nils Thomas Weincke Christian Peter Søberg Jarnov(Chairman)
Martin Mikkelsen
5

General information
1 Reporting entityJacob Holm & Sønner Holding A/S (the "Company") is a company domiciled in Denmark. These condensed unaudited consolidated interim financial statements as at and for the six months ended June 30, 2017 comprise the Company and its subsidiaries (together the "Group"). The Group is primarily involved in manufacturing nonwoven fabrics for a wide range of applications in the consumer wipes, industrial wipes, hygiene, beauty care and health care segments. The Company's functional currency is Danish kroner.
2 Basis of preparation
(a) Statement of complianceThese interim financial statements have been prepared in accordance with IAS 34 Interim Financial Reporting as adopted by the EU as well as additional Danish disclosure requirements. They do not include all the information required for a complete set of IFRS financial statements. Any events and transactions that are significant to an understanding of the changes in the Group's financial position and performance since the last annual consolidated financial statements as at and for the financial year ended December 31, 2016 are disclosed in the section "Financial Review". These interim finan
cial statements were authorized for issue by the Company's Board of Directors on August 24, 2017.
(b) Judgments and estimatesIn preparing these interim financial statements, Management makes judgements, estimates and assumptions that affect the application of accounting policies and the reported amounts of assets and liabilities, income and expenses. Actual results may differ from these estimates.
The significant judgements made by Management in applying the Group's accounting policies and the key sources of estimation uncertainty were the same as those applied to the consolidated financial statements as at and for the financial year ended December 31, 2016.
3 Significant accounting policiesThe accounting policies applied in these interim financial statements are the same as those applied in the Group's consolidated financial statements as at and for the financial year ended December 31, 2016.
4 Segment informationThe internal reporting framework used for reporting on revenue and expenses to the Executive Management and the Board of Directors has been set up to reflect and report on the global functional responsibility setup at the Company.
5 Subsequent eventsNo events have occurred after the balance sheet date that will have material effect on the Group's financial standing.
6
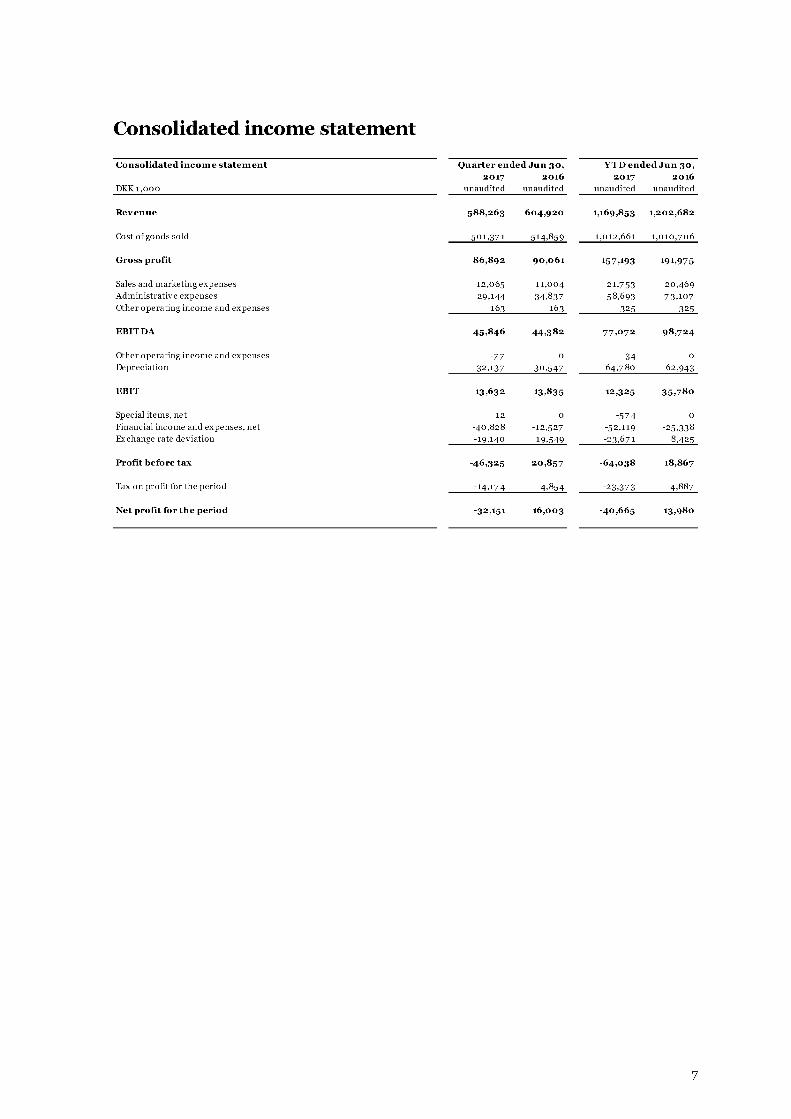
Consolidated income statement
Consolidated in com e statem ent
D K K 1 ,0 0 0
Quarter ended Jun 30, 2017 2016
u n a u d it e d u n a u d it e d
Y T D ended Jun 30, 2017 2016
u n a u d it e d u n a u d it e d
Revenue 588,263 604,920 1,169,853 1,202,682
C o s t o f g o o d s s o ld 5 0 1 , 3 7 1 514 ,859 1 ,0 1 2 ,6 6 1 1 , 0 1 0 , 7 0 6
Gross profit 86,892 90,061 157,193 191,975
S a le s a n d m a r k e t in g e x p e n s e s 1 2 ,0 6 5 1 1 ,0 0 4 21 ,7 5 3 2 0 ,4 6 9
A d m in is t r a t i v e e x p e n s e s 2 9 ,1 4 4 3 4 ,8 3 7 58 ,6 9 3 7 3 ,1 0 7O th e r o p e r a t in g in c o m e a n d e x p e n s e s 1 6 3 1 6 3 325 325
EBITDA 45,846 44,382 77,0 72 98,724
O th e r o p e r a t in g in c o m e a n d e x p e n s e s -77 0 34 0
D e p r e c ia t io n 32 ,137 3 0 ,5 4 7 6 4 ,7 8 0 62 ,943
EBIT 13,632 13,835 12,325 35,780
S p e c ia l it e m s , n e t 12 0 -5 7 4 0
F in a n c ia l in c o m e a n d e x p e n s e s , n e t - 4 0 ,8 2 8 - 1 2 ,5 2 7 - 5 2 ,1 1 9 -2 5 ,3 3 8E x c h a n g e r a t e d e v ia t io n - 1 9 ,1 4 0 19 ,549 - 2 3 ,6 7 1 8 ,425
Profit before tax -46,325 20,857 -64,038 18,867
T a x o n p r o f i t f o r t h e p e r io d - 14,174 4 ,8 5 4 -2 3 ,3 7 3 4 ,8 8 7
Net profit for the period -32,151 16,003 -40,665 13,980
7
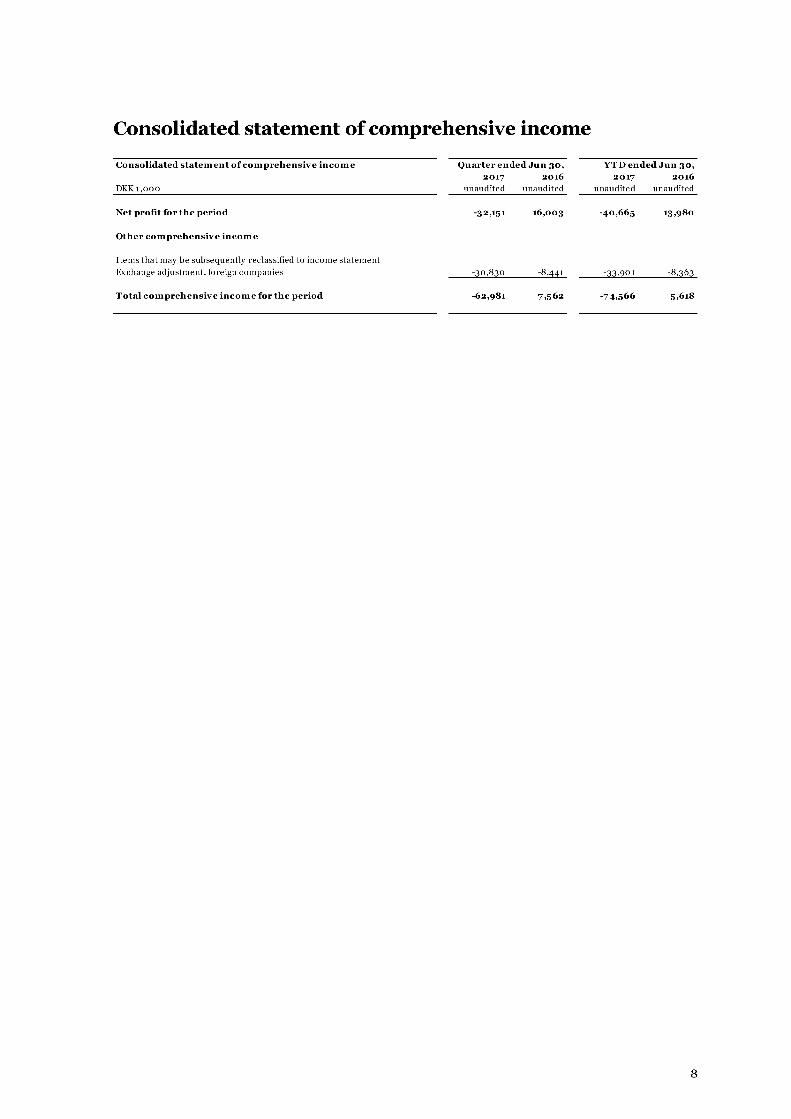
Consolidated statement of comprehensive income
Consolidated statem ent o f com prehensive in com e Q uarter ended Jun 30, Y T D ended Jun 30,
D K K 1 ,0 0 0
2017u n a u d it e d
2016u n a u d it e d
2017u n a u d it e d
2016u n a u d it e d
N et profit for the period -32,151 16,003 -40,665 13,980
O ther com prehensive incom e
I t e m s t h a t m a y b e s u b s e q u e n t l y r e c la s s i f ie d t o in c o m e s t a t e m e n t
E x c h a n g e a d ju s tm e n t , f o r e ig n c o m p a n ie s - 3 0 ,8 3 0 - 8 ,4 4 1 - 33 ,901 - 8 ,3 6 3
T ota l com prehensive in com e for the period -62,981 7,562 -74,566 5,618
8

Consolidated balance sheet
Consolidated balance sheet
D K K 1 ,0 0 0
Jun 30, 2017
u n a u d it e d
Dec 31, 2016
a u d it e d
Assets
Intangible fixed assets 129,806 138,532
L a n d & B u ild in g s 2 4 2 ,8 7 2 2 6 5 ,1 7 8
P la n t a n d m a c h in e r y 6 3 6 ,1 1 3 7 2 2 ,0 4 4O th e r f ix t u r e s a n d f it t in g s , t o o ls a n d e q u ip m e n t 1 5 ,6 2 1 15,342P r o p e r t y , p la n t a n d e q u ip m e n t u n d e r c o n s t r u c t io n 2 8 ,2 3 2 2 0 ,8 0 5
Property, plant and equipm ent 922,838 1,023,370
O th e r r e c e i v a b l e s 3 ,4 4 3 2 ,0 3 0
D e fe r r e d t a x a s s e t 2 4 ,7 7 6 1 3 ,9 0 2
Financial fixed assets 28,219 15,932
N on-current assets 1,080,863 1,177,833
Inventories 179,199 177,102
T r a d e r e c e i v a b l e s 3 2 7 ,8 0 1 3 0 9 ,7 1 3R e c e i v a b l e s d u e f r o m g r o u p c o m p a n ie s 8 6 0 0
C o r p o r a t e ta x 2 ,2 0 1 2 6 7
B o n d s a t f a ir v a l u e t h r o u g h p r o f i t a n d lo s s 8 ,2 4 3 9,515O th e r r e c e i v a b l e s a n d p r e p a y m e n t s 43 ,3 2 5 41 ,489R eceivables 382,431 360,984
C a s h a t b a n k a n d in h a n d 1 1 2 ,9 6 1 8 3 ,3 9 7
Current assets 674,591 621,483
Assets 1,755,453 1,799,316
9
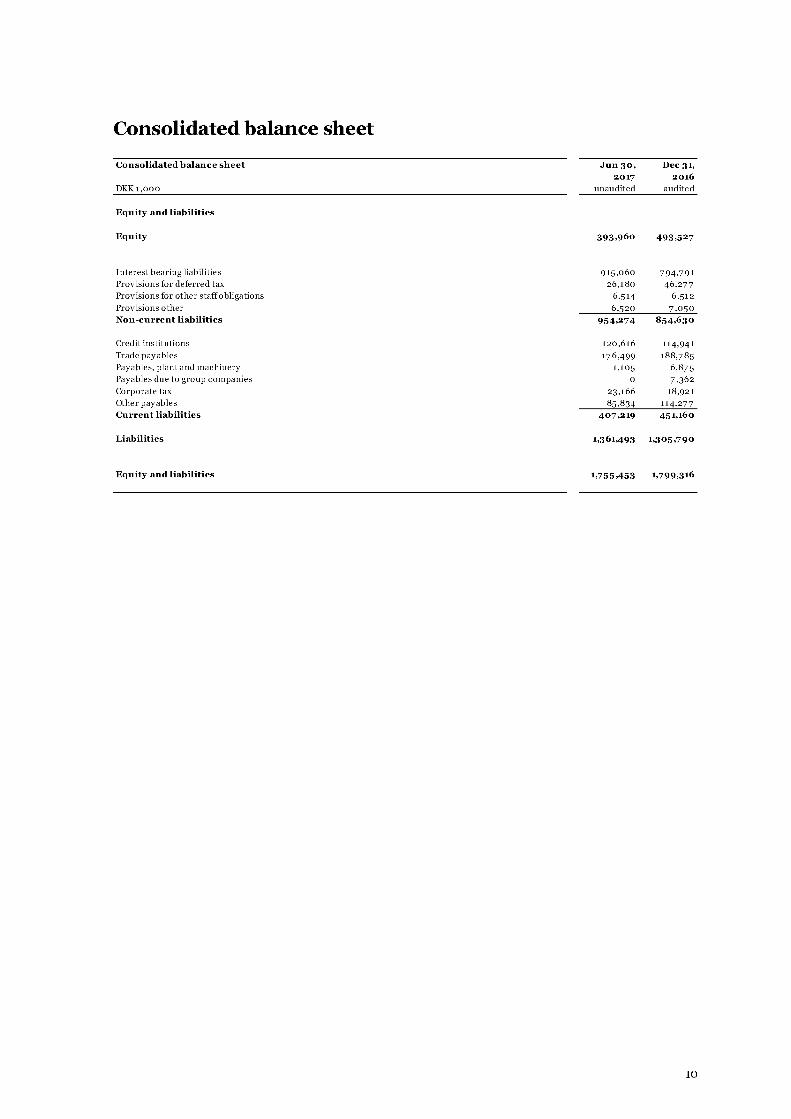
Consolidated balance sheet
Consolidated balance sheet Jun 30, Dec 3 1,2017 2016
D K K 1 ,0 0 0 u n a u d it e d a u d it e d
Equ ity and liabilities
Equity 393,960 493,527
I n t e r e s t b e a r i n g l ia b i l i t ie s 9 1 5 ,0 6 0 7 9 4 ,7 9 1P r o v is io n s f o r d e f e r r e d ta x 2 6 ,1 8 0 4 6 ,2 7 7P r o v is io n s f o r o t h e r s t a f f o b l ig a t io n s 6 ,5 1 4 6 ,5 1 2
P r o v is io n s o t h e r 6 ,5 2 0 7 ,0 5 0N on-current liabilities 954,274 854,630
C r e d it in s t i t u t io n s 1 2 0 ,6 1 6 114,941T r a d e p a y a b l e s 1 7 6 ,4 9 9 1 8 8 ,7 8 5
P a y a b le s , p la n t a n d m a c h i n e r y 1 ,1 0 5 6 ,8 7 5P a y a b le s d u e t o g r o u p c o m p a n ie s 0 7 ,3 6 2C o r p o r a t e ta x 2 3 ,1 6 6 1 8 ,9 2 1
O t h e r p a y a b l e s 8 5 ,8 3 4 114 ,277Current liabilities 407,219 451,160
Liabilities 1,361,493 1,305,790
E quity and liabilities 1,755,453 1,799,316
10

Consolidated statement of changes in equity
C on so lid ated sta te m e n t o f ch a n ges in e qu ity
D K K 1 ,0 0 0
Sharecapital
u n a u d i t e d
E xch a n geadj.
u n a u d i t e d
R etainedearningsu n a u d i t e d
T o ta lu n a u d i t e d
E qu ity at Jan uary 1, 2017 1,000 87,182 405,345 493,527
C o m p r e h e n s i v e in c o m e f o r t h e p e r i o d 0 - 3 3 ,9 0 1 - 4 0 ,6 6 5 - 7 4 ,5 6 6
D i v id e n d s 0 0 - 2 5 ,0 0 0 - 2 5 ,0 0 0
E qu ity at Ju ne 30, 2017 1,000 53,280 339,680 393,960
E qu ity at Jan uary 1, 2016 1,000 76,686 3 75,632 453,319
C o m p r e h e n s i v e in c o m e f o r t h e p e r i o d 0 1 0 ,4 9 5 4 9 ,7 1 3 6 0 ,2 0 8
D i v id e n d s 0 0 - 2 0 ,0 0 0 - 2 0 ,0 0 0
E qu ity at D ecem ber 31, 2016 1,000 87,182 405,345 493,527
11
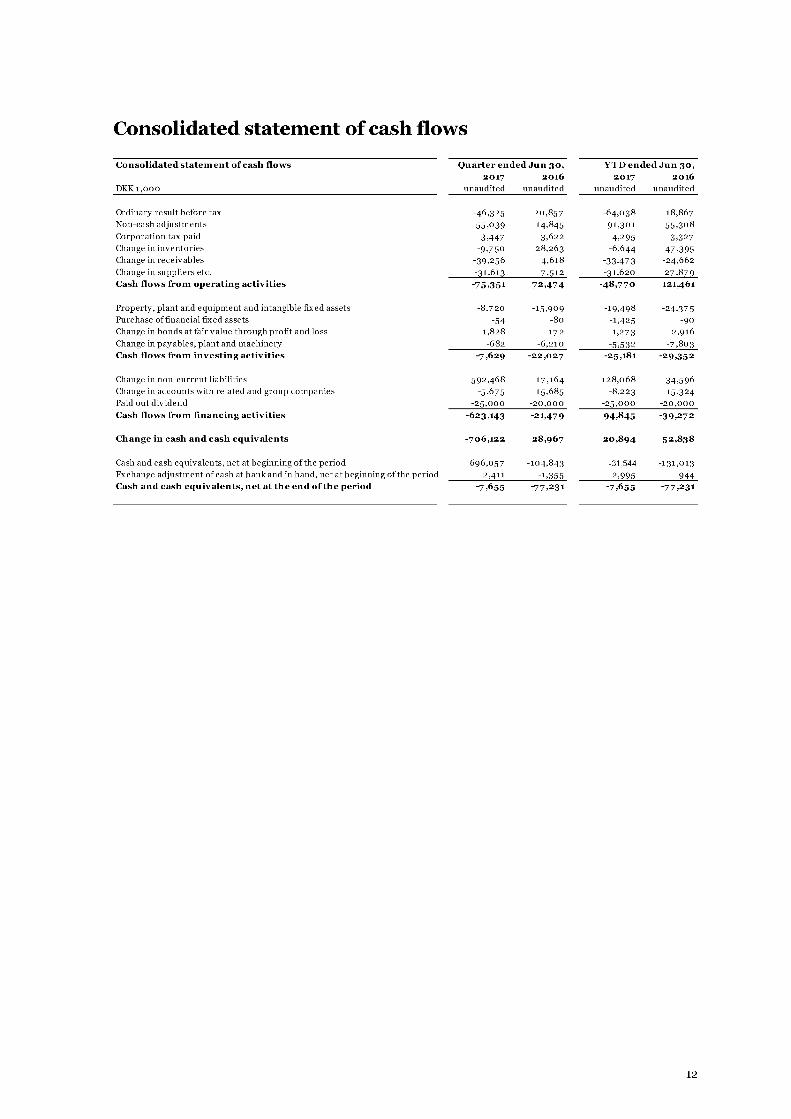
Consolidated statement of cash flows
Consolidated statem ent o f cash flows
D K K 1 ,0 0 0
Quarter ended Jun 30, 2017 2016
u n a u d it e d u n a u d it e d
Y T D ended Jun 30, 2017 2016
u n a u d it e d u n a u d it e d
O r d in a r y r e s u l t b e f o r e ta x - 4 6 ,3 2 5 2 0 ,8 5 7 - 6 4 ,0 3 8 1 8 ,8 6 7
N o n - c a s h a d ju s tm e n t s 5 5 ,0 3 9 14,845 9 1 ,3 0 1 5 5 ,3 0 8C o r p o r a t io n t a x p a id -3 ,4 4 7 - 3 ,6 2 2 - 4 ,295 -3 ,3 2 7C h a n g e in in v e n t o r i e s -9 ,7 5 0 2 8 ,2 6 3 - 6 ,6 4 4 4 7 ,3 9 5C h a n g e in r e c e i v a b le s - 3 9 ,2 5 6 4 ,6 1 8 -3 3 ,4 7 3 - 2 4 ,6 6 2
C h a n g e in s u p p l ie r s e tc . - 3 1 ,6 1 3 7 ,5 1 2 - 3 1 ,6 2 0 2 7 ,8 7 9
Cash flows from operating activities -75,351 72,474 -48,770 121,461
P r o p e r t y , p la n t a n d e q u ip m e n t a n d in t a n g ib le f ix e d a s s e t s - 8 ,7 2 0 - 1 5 ,9 0 9 - 19 ,498 - 2 4 ,3 7 5P u r c h a s e o f f in a n c ia l f ix e d a s s e t s -54 -8 0 - 1,425 -90C h a n g e in b o n d s a t f a ir v a l u e t h r o u g h p r o f i t a n d lo s s 1 ,8 2 8 1 7 2 1 ,273 2 ,9 1 6
C h a n g e in p a y a b l e s , p la n t a n d m a c h in e r y -6 8 2 - 6 ,2 1 0 - 5 ,5 3 2 -7 ,8 0 3Cash flows from in vestin g activities -7,629 -22,027 -25,181 -29,352
C h a n g e in n o n - c u r r e n t l ia b i l i t ie s -5 9 2 ,4 6 8 - 1 7 , 1 6 4 1 2 8 ,0 6 8 - 34 ,5 9 6C h a n g e in a c c o u n t s w it h r e la t e d a n d g r o u p c o m p a n ie s -5 ,6 7 5 1 5 ,6 8 5 - 8 ,2 2 3 15,324P a id o u t d iv id e n d - 2 5 ,0 0 0 - 2 0 ,0 0 0 - 2 5 ,0 0 0 - 2 0 ,0 0 0
Cash flows from financing activities -623,143 -21,479 94,845 -39,272
Change in cash and cash equiv alents -706,122 28,967 20,894 52,838
C a s h a n d c a s h e q u iv a l e n t s , n e t a t b e g in n in g o f t h e p e r io d 6 9 6 ,0 5 7 - 1 0 4 ,8 4 3 -31,544 - 1 3 1 ,0 1 3
E x c h a n g e a d ju s tm e n t o f c a s h a t b a n k a n d in h a n d , n e t a t b e g in n in g o f th e p e r io d 2 ,4 1 1 - 1,355 2 ,995 944Cash and cash equivalents, net at the end o f the period -7,655 -77,231 -7,655 -77,231
12

Notes to the Interim Report
1 Intangible fixed assets
In ta n g ib le fix e d assets
D K K 1 , 0 0 0
G o o d w ill
u n a u d i t e d
C u s to m e r lists,
k n o w -h o w ,
p a te n ts ,
lic e n c e s
u n a u d i t e d
So ftw are
u n a u d i t e d
I n t an g ib le
fix e d assets
u n d e r
c o n s tr u c tio n
u n a u d i t e d
C o s t a t J a n u a r y 1 9 3 , 4 9 1 1 6 ,4 8 8 6 9 ,1 4 4 0E x c h a n g e a d j u s t m e n t a t h a l f - y e a r r a t e - 1 , 6 1 5 -3 1 9 - 1 , 8 7 2 0
A d d i t i o n s f r o m b u s i n e s s c o m b i n a t i o n 0 0 0 0
A d d i t i o n s f o r t h e y e a r 0 0 3 6 0
T r a n s f e r b e t w e e n i t e m s 0 0 0 0
D i s p o s a l s f o r t h e y e a r 0 0 0 0
C o s t a t J u n e 3 0 9 1 , 8 7 6 1 6 , 1 6 9 6 7 , 3 0 8 0
A m o r t i s a t i o n a t J a n u a r y 1 0 5 ,5 7 5 3 5 , 0 1 6 0
E x c h a n g e a d j u s t m e n t a t y e a r - e n d r a t e 0 - 1 2 0 - 1 , 3 1 0 0
A m o r t i s a t i o n f o r t h e y e a r 0 1 , 2 1 5 5 ,1 7 1 0
D i s p o s a l s f o r t h e y e a r 0 0 0 0
A m o r t i s a t i o n a t J u n e 3 0 0 6 , 6 7 0 3 8 ,8 7 7 0
C a r r y in g a m o u n t at J u n e 30 91,876 9,499 28,431 0
A m o r tis e d o v e r 10 y e a rs 3-5 y e a rs
2 Property, plant and equipment
P r o p e r ty , p la n t an d e q u ip m e n t
D K K 1 , 0 0 0
L a n d an d
b u ild in g su n a u d i t e d
P lan t an d
m a c h in e r yu n a u d i t e d
O th e r fix tu re s
a n d fittin g s ,
to o ls an d
e q u ip m en tu n a u d i t e d
PPEu n d e r
c o n s tr u c tio nu n a u d i t e d
C o s t a t J a n u a r y 1 3 9 5 , 5 0 6 1 , 3 7 0 , 9 2 0 5 3 ,8 2 8 2 0 , 8 0 5
E x c h a n g e a d j u s t m e n t a t h a l f - y e a r r a t e - 1 9 , 5 5 4 - 7 1 , 2 5 8 - 2 ,1 5 9 - 1 , 0 3 6
A d d i t i o n s f o r t h e y e a r 5 2 1 ,3 7 3 2 5 1 1 7 ,4 6 7T r a n s f e r b e t w e e n i t e m s 0 5 ,3 9 6 3 ,6 0 8 - 9 ,0 0 4D i s p o s a l s f o r t h e y e a r 0 - 2 4 1 - 4 1 7 0
C o s t a t J u n e 3 0 3 7 6 ,0 0 4 1 , 3 0 6 , 1 9 0 5 5 , 1 1 1 2 8 ,2 3 2
A m o r t i s a t i o n a t J a n u a r y 1 1 3 0 , 3 2 8 6 4 8 ,8 7 6 3 8 ,4 8 6 0
E x c h a n g e a d j u s t m e n t a t y e a r - e n d r a t e - 4 ,9 6 5 - 2 6 ,5 3 2 - 1 ,4 1 7 0
D e p r e c i a t i o n f o r t h e y e a r 7 , 7 6 9 4 7 ,9 0 3 2 , 7 2 0 0
D i s p o s a l s f o r t h e y e a r 0 - 1 7 0 -2 9 9 0
D e p r e c i a t i o n a t J u n e 3 0 1 3 3 ,1 3 2 6 7 0 , 0 7 7 3 9 ,4 9 0 0
C a r r y in g am o u n t at J u n e 3 0 2 4 2 ,8 72 636,113 15,621 28,232
A m o r tis e d o v e r 3 0 -50 y e a rs 5-15 y e a rs 3-10 y e a rs
13
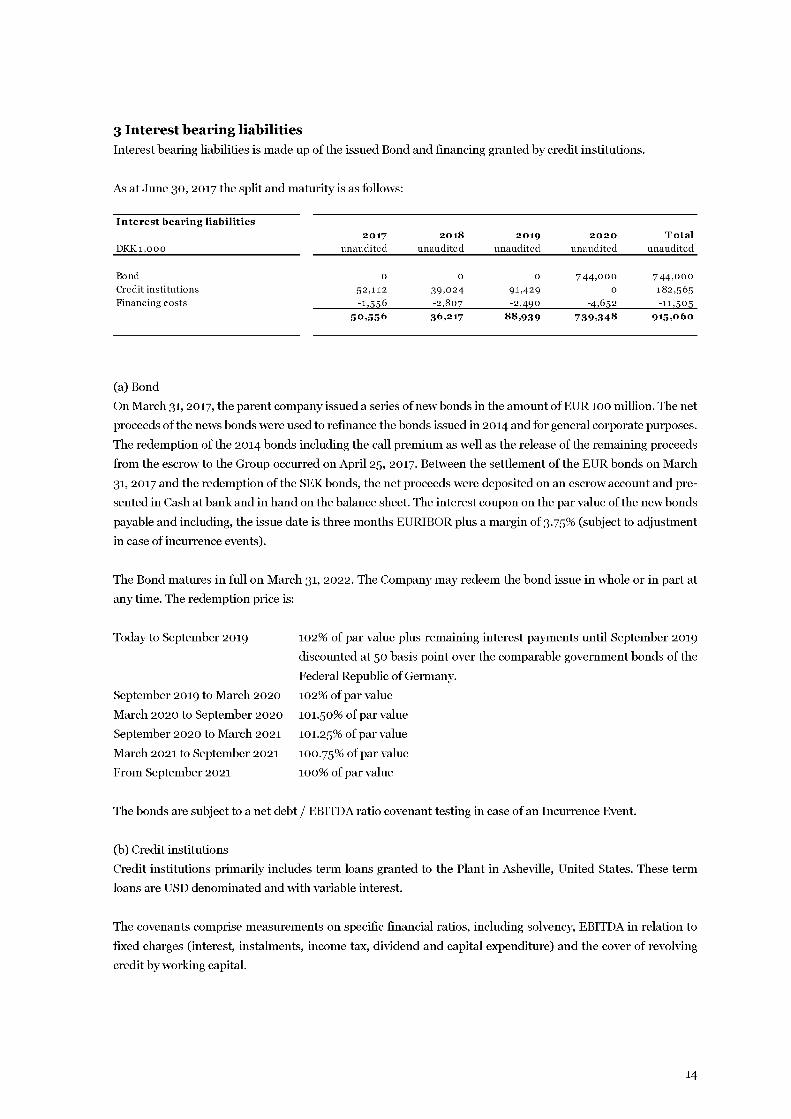
3 Interest bearing liabilitiesInterest bearing liabilities is made up of the issued Bond and financing granted by credit institutions.
As at June 30, 2017 the split and maturity is as follows:
I n t e r e s t b e a r in g lia b ilit ie s
D K K 1 , 0 0 0
2 0 17
u n a u d i t e d
20 18
u n a u d i t e d
20 19
u n a u d i t e d
2 0 2 0
u n a u d i t e d
T o t a l
u n a u d i t e d
B o n d 0 0 0 7 4 4 , 0 0 0 7 4 4 , 0 0 0
C r e d i t i n s t i t u t i o n s 5 2 , 1 1 2 3 9 , 0 2 4 9 1 ,4 2 9 0 1 8 2 , 5 6 5
F i n a n c i n g c o s t s - 1 , 5 5 6 - 2 , 8 0 7 - 2 , 4 9 0 - 4 ,6 5 2 - 1 1 , 5 0 5
5 0 ,5 5 6 3 6 ,2 17 8 8 ,93 9 7 3 9 ,3 4 8 9 15 ,0 6 0
(a) Bond
On March 31, 2017, the parent company issued a series of new bonds in the amount of EUR 100 million. The net
proceeds of the news bonds were used to refinance the bonds issued in 2014 and for general corporate purposes.
The redemption of the 2014 bonds including the call premium as well as the release of the remaining proceeds
from the escrow to the Group occurred on April 25, 2017. Between the settlement of the EUR bonds on March
31, 2017 and the redemption of the SEK bonds, the net proceeds were deposited on an escrow account and pre
sented in Cash at bank and in hand on the balance sheet. The interest coupon on the par value of the new bonds
payable and including, the issue date is three months EURIBOR plus a margin of 3.75% (subject to adjustment
in case of incurrence events).
The Bond matures in full on March 31, 2022. The Company may redeem the bond issue in whole or in part at
any time. The redemption price is:
Today to September 2019
September 2019 to March 2020
March 2020 to September 2020
September 2020 to March 2021
March 2021 to September 2021
From September 2021
102% of par value plus remaining interest payments until September 2019
discounted at 50 basis point over the comparable government bonds of the
Federal Republic of Germany.
102% of par value
101.50% of par value
101.25% of par value
100.75% of par value
100% of par value
The bonds are subject to a net debt / EBITDA ratio covenant testing in case of an Incurrence Event.
(b) Credit institutions
Credit institutions primarily includes term loans granted to the Plant in Asheville, United States. These term
loans are USD denominated and with variable interest.
The covenants comprise measurements on specific financial ratios, including solvency, EBITDA in relation to
fixed charges (interest, instalments, income tax, dividend and capital expenditure) and the cover of revolving
credit by working capital.
14

4 Segment informationThe Group's global functional responsibility is divided into four segments:
(1) The Jacob Holm Industries segment produces and sells non-woven roll-goods.
(2) The Sontara segment produces and sells non-woven in converted and roll-goods form.
(3) The TWIG segment sells non-woven by-products and provides internal converting services.
(4) The Headquarter segment consists of the Danish holding and management companies Jacob Holm & Søn
ner Holding A/S and Jacob Holm & Sønner A/S.
S egm en t in fo rm atio n
D K K 1 , 0 0 0
Y T D end ed Ju n 30, 20 17 2016
u n a u d i t e d u n a u d i t e d
R even u e
J a c o b H o lm I n d u s t r i e s 5 0 4 ,1 8 4 5 5 6 , 0 0 1
S o n t a r a 6 6 0 ,2 8 5 6 3 9 ,9 6 1T W I G 3 2 ,3 8 4 1 7 ,6 8 1
H e a d q u a r t e r 1 , 1 1 9 1 , 5 1 8
E l i m i n a t io n s - 2 8 , 1 1 9 - 1 2 ,4 7 9G roup 1,169,853 1,202,682
E B IT D A
J a c o b H o lm I n d u s t r i e s 6 ,5 9 3 4 7 ,6 9 2S o n t a r a 6 6 ,5 0 4 4 8 ,2 0 6
T W I G 5 ,2 7 5 4 ,0 9 7H e a d q u a r t e r - 1 , 3 0 1 - 1 , 2 7 1
E l i m i n a t io n s 0 0
G roup 7 7 ,0 7 2 9 8 ,724
5 Transactions with related partiesBesides intercompany transactions that have been eliminated in the Consolidated Income Statement, related
party transactions comprise purchases and sales of management services from and to the related company Jacob
Holm & Sons AG. Further, royalty fee charges are being made by Jacob Holm & Sons AG.
Purchases of management services amounts to DKK 17 million for the year-to-date whereas sales of manage
ment services amounted to DKK 3 million for the year-to-date.
Charges of royalty fees for the year-to-date amounts to DKK 20 million.
Further, the Consolidated Income Statement includes a financial expense of DKK 2 MM from guarantee fee
charges related to the Parent Company's guarantee regarding the bonds. The Parent Company is guaranteeing
the nominal value of the bonds.
The Group has charged management services in the amount of DKK 0.3 million to Dønnerup A/S for the year-
to-date. Dønnerup A/ S has charged rental expenses in the amount of DKK 0.3 million for the year-to-date.
15


![sønner - Skabelse.dk · fdgdf * sønner] blev folkeslagene spredt ud på Jorden i tiden efter vand"oden …«] Denne sortering efter Y-kromosomet (det mandlige kønskromosom) har](https://img.dokumen.tips/doc/110x75/60b06511c98a5b5f9b3d0dd5/snner-fdgdf-snner-blev-folkeslagene-spredt-ud-p-jorden-i-tiden-efter.jpg)