Embed Size (px)
Citation preview

Jack van der MerweCEO: Gautrain Management Agency / President UATP
06 October 2016
‘Unlocking the Economy with Public Transport’
A: The Global Environment we Operate in
Global Environment
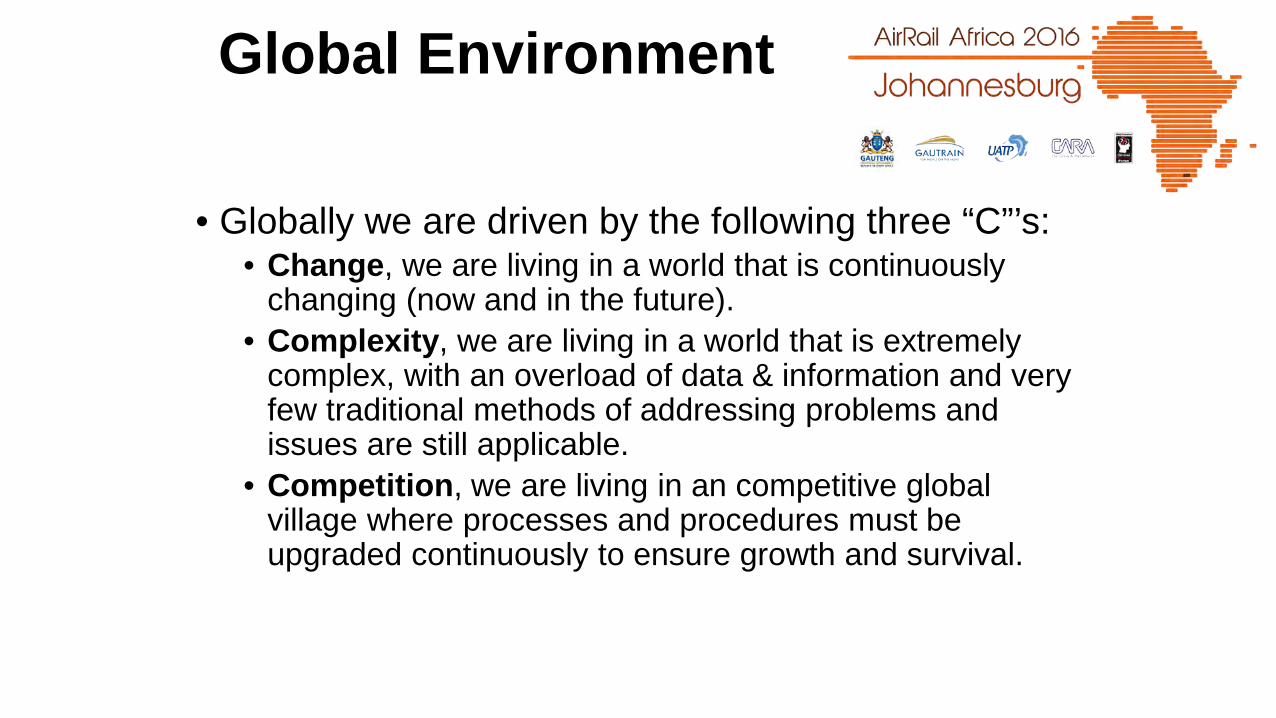
• Globally we are driven by the following three “C”’s:• Change, we are living in a world that is continuously
changing (now and in the future).• Complexity, we are living in a world that is extremely
complex, with an overload of data & information and very few traditional methods of addressing problems and issues are still applicable.
• Competition, we are living in an competitive global village where processes and procedures must be upgraded continuously to ensure growth and survival.

B: Future Cities(A case for Public Transport)

How Will Cities Look in 2025?
• By 2025, almost 60% of the world’s population will be living in urban areas
• Rapid urbanisation & economic development will increase the demand for the movement of people, goods & services
• Global trend is towards private vehicles as the preferred mode of transport
• 6.2 billion private motorised trips will be made every day in cities worldwide
• Gridlock, pollution, road traffic accidents & greater dependency on fossil fuels
• If left unchecked by 2025 worldwide transport related greenhouse gas emissions will be 25% higher than 2005 levels, this will:
• Put us firmly on the path towards potential catastrophic climate change
• Transport energy bills will skyrocket• Higher levels of energy consumption could pose a threat to global
energy security• Traffic congestion will bring cities worldwide to a standstill• Half a million people will be killed in road traffic accidents every year• Potentially catastrophic climate change
How Will Cities Look in 2025?
UITP
• International Association of Public Transport (UITP) is an international network for public transport authorities and operators, policy decision makers, scientific institutions, consultants, operators and the public transport support and service industry
• UITP brings together 3400 members (companies, firms of organisations) from 92 countries around the world
• (UATP is the Africa chapter of the UITP)
• UITP & the International Energy Agency developed an urban mobility scenario for 2025:
• 2009 World UITP Congress in Vienna:“Double the market share of public transport worldwide by 2025 (PTx2)”
• The effect of PTx2 will be:• Save 170 million tons of oil;• Reduce CO² equivalent by 550 million tons;• Reduce urban traffic fatalities by 15%;• Double the number of jobs in public transport operations;• Reduce the risk & obesity & heart diseases by 50% (walking, cycling & PT)
• In 2012, PTx2 was translated into a communication campaign called:
“Grow with public transport”
UITP
C: Long Term Transport Planning for Gauteng
(A case for Public Transport)

25-YEAR INTEGRATED TRANSPORT MASTER PLAN(ITMP25)
Best Practice in Public Transport -Africa for Africa: UATP Workshop 2015
22 October 2015

Transport Planning
Current –Status Quo
Predicted –Future State
Population Growth –(Number of workers)
Land-use Patterns –(Where will the People live)
Economic Growth –(type, location, labour requirements)
13 (GTIP5) & 10 (ITMP25) Major Interventions* or “do nothing”*
Enablers*** or “do nothing”
2012
2037
External Factors**

“The Cost of Doing Nothing”
• Analysis of the transport situation in 25-years’ time, shows that the consequences or “cost of doing nothing” will be severe, i.e. if current trends continue
• Vehicle population predicted to grow from 3.65 mil. to 6.57mil.• Peak hour person trips to grow from 2.2mil. to 3.9mil.• Weighted average peak hour road network speed will reduce from
48km/h to below 10km/h• Weighted public transport travel speed decline from 38km/h to
below 14km/h• Congestion nightmare, with the transport network, the economy
and the natural environment eventually choking• Major interventions and management of travel choices and
demand will be required to avoid this scenario
7%9%
30%53%
Base Year
9%
11%
31%
48%
2025 Demand on Base Year Network
39%
17%
22%
23%
2037 Demand on Base Year Network
0 - 20 km/h
20 - 40 km/h
40 - 60 km/h
> 60 km/h
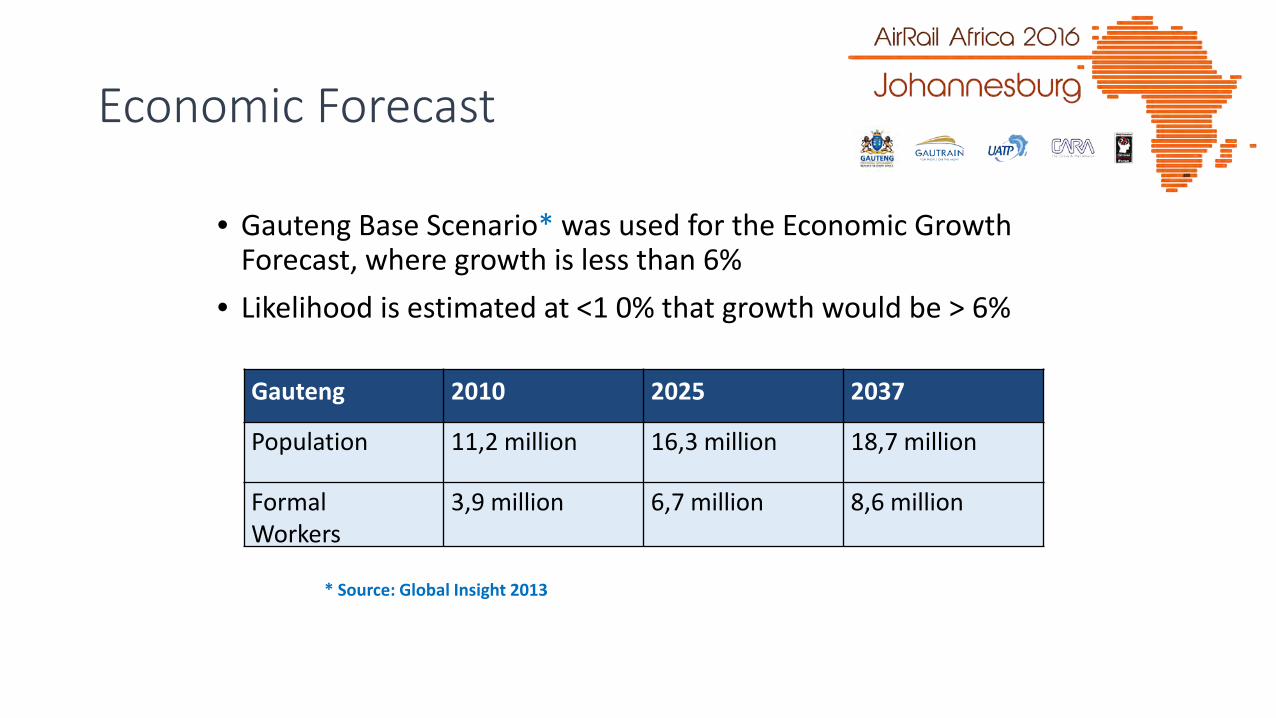
Economic Forecast
• Gauteng Base Scenario* was used for the Economic Growth Forecast, where growth is less than 6%
• Likelihood is estimated at <1 0% that growth would be > 6%
Gauteng 2010 2025 2037
Population 11,2 million 16,3 million 18,7 million
FormalWorkers
3,9 million 6,7 million 8,6 million
* Source: Global Insight 2013

Job Opportunities: Formal Workers

Key focus areas:
• Priority public transport corridors• Strategic modal transfer nodes and interchanges• Freight routes and logistics centres• Rail as the backbone of an integrated public transport system• Protection of future priority corridors, future road networks, passenger
and freight rail networks, and airports.
The plan further includes a vision to support and strengthen the Gauteng Global City Region. Geographical Information Systems and Intelligent Transport Systems form a practical basis for the plan.

Sustainable Transport
• Reduce travel:• Change travel patterns
• Regularity & extent of travel in peak periods, trip lengths, etc.
• Shift in modes:• Shift from: Motorised Non-motorised transport• Shift from: Private Public transport• Shift from Road Rail
• Technology:• Environmentally friendly technologies• Intelligent Transport Solutions (ITS)
D: Ekurhuleni Aerotropolis(A case for Public Transport)

WHAT IS AN
AEROTROPOLIS?

An Aerotropolis has an airport city at its core and is surrounded by clusters of industry-related enterprises that gain a competitive advantage by utilizing the synergistic capabilities of its respective location.
~ Dr. John Kasarda
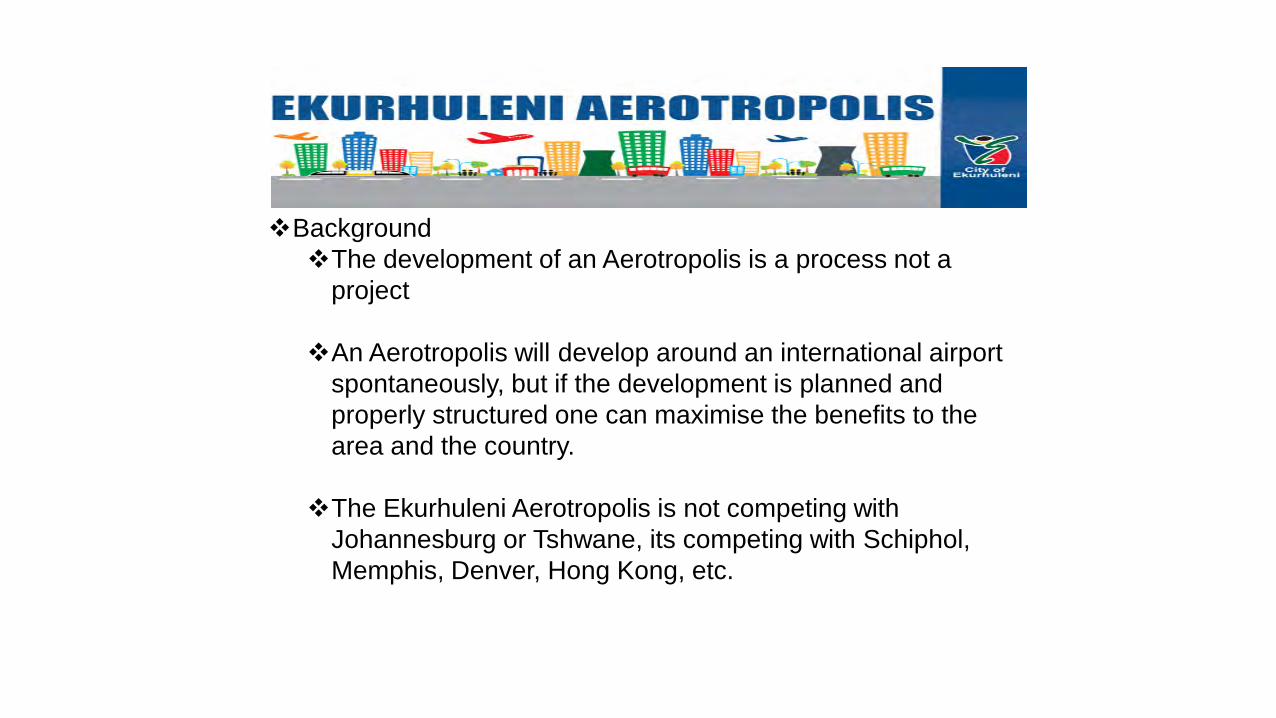
BackgroundThe development of an Aerotropolis is a process not a
project
An Aerotropolis will develop around an international airport spontaneously, but if the development is planned and properly structured one can maximise the benefits to the area and the country.
The Ekurhuleni Aerotropolis is not competing with Johannesburg or Tshwane, its competing with Schiphol, Memphis, Denver, Hong Kong, etc.
THE AEROTROPOLIS OPPORTUNITY

Produce and Export
Value Add
Import and Distribute
Transshipment
Service provider
CONNECTING THROUGH ECONOMIC FACILITATION
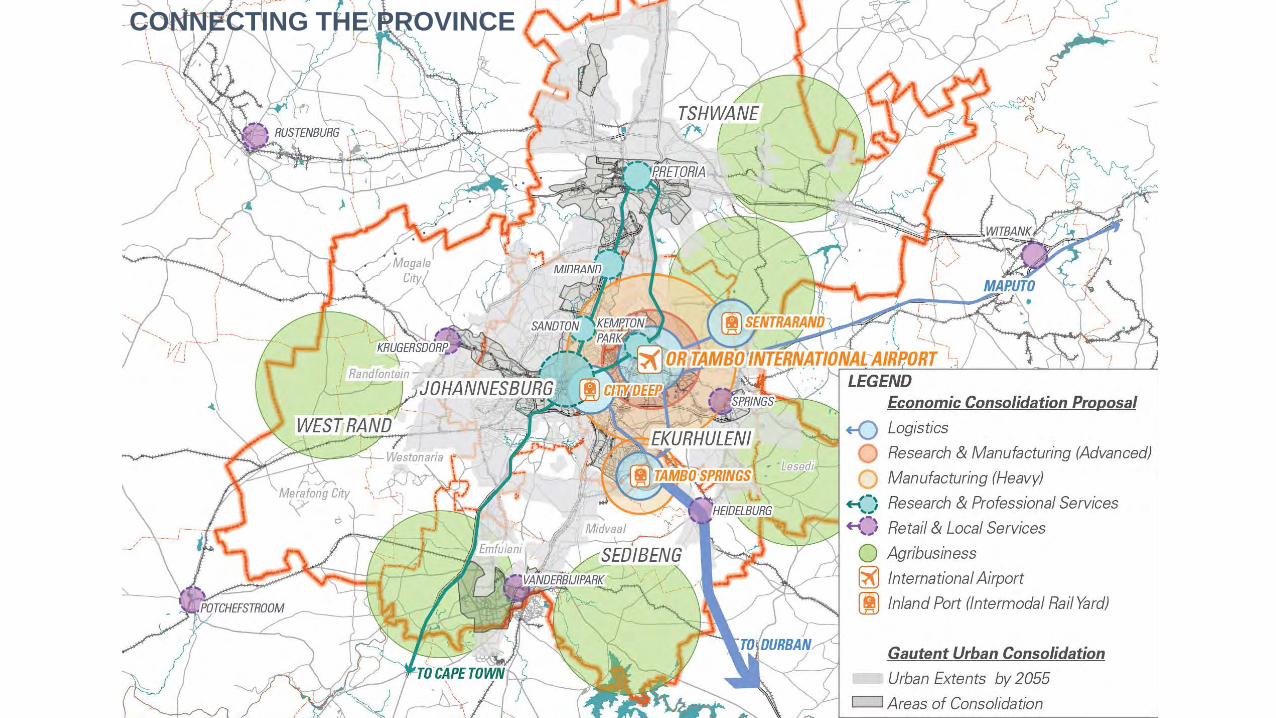
CONNECTING THE PROVINCE

CONNECTING SOUTH AFRICA TO ITS NEIGHBOURS
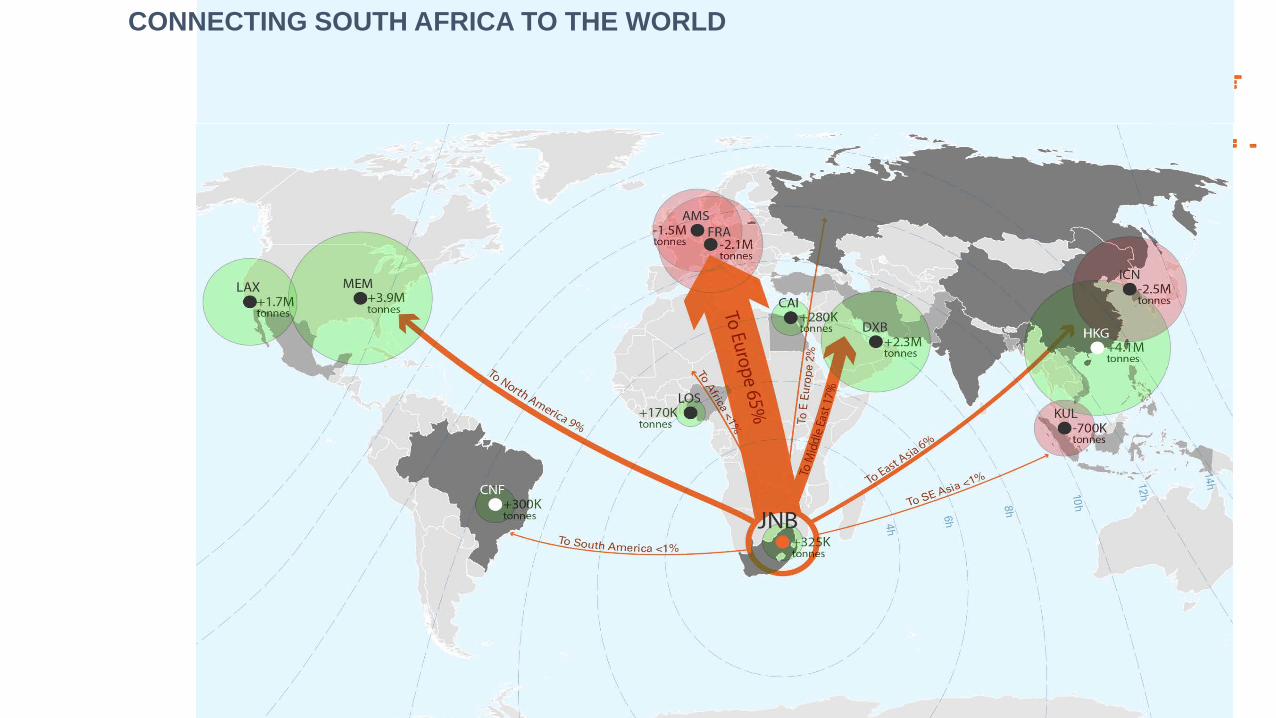
CONNECTING SOUTH AFRICA TO THE WORLD
ENABLING & CATALYST PROJECTS

ENABLING PROJECTS
• Four types of enabling projects:• Commercial Catalytic Projects;• Urban Regeneration Projects;• Economic Enabling Infrastructure Projects; and• Development (Mega) Projects.

Aerospace Manufacturing &
Aviation
Manufacturing and High Tech
Logistics & Distribution
Health & Life Sciences
Agri – Business & Food Processing
Natural Resources & Energy
Education & Skills Training
Tourism & Culture
Retail
Professional Services & Public
Admin
KEY ECONOMIC CLUSTERS
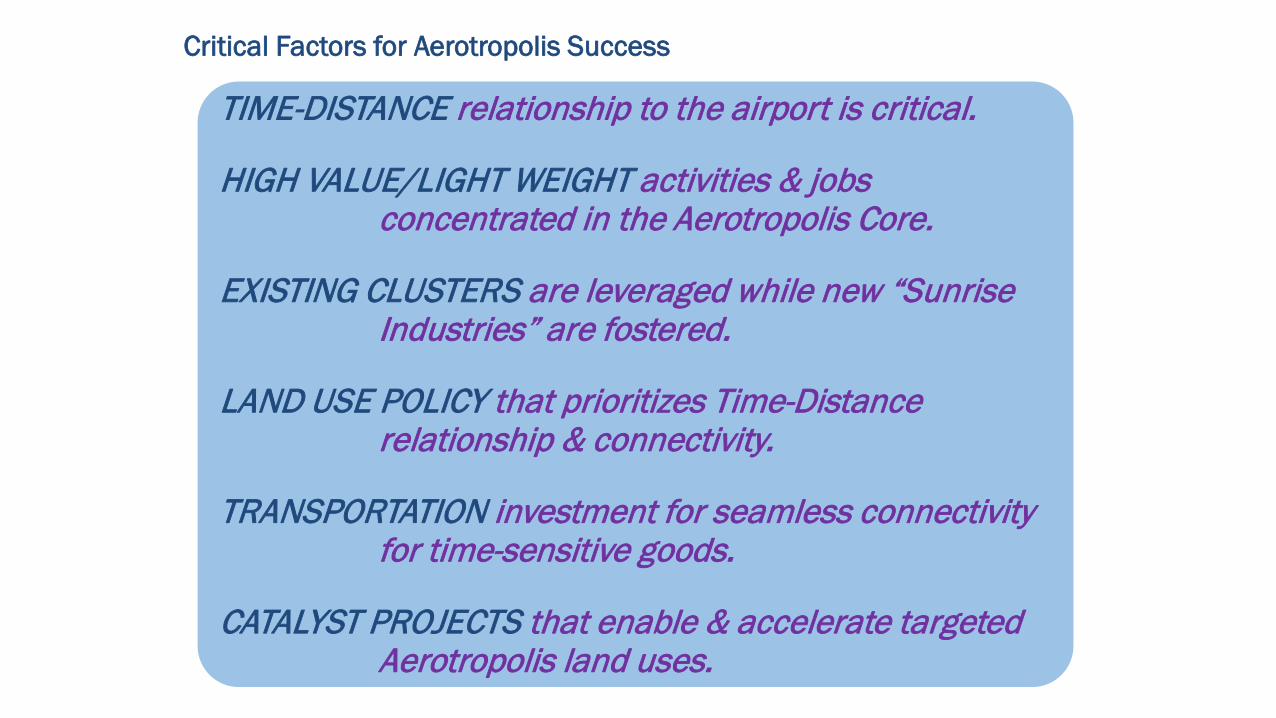
TIME-DISTANCE relationship to the airport is critical.
HIGH VALUE/LIGHT WEIGHT activities & jobs concentrated in the Aerotropolis Core.
EXISTING CLUSTERS are leveraged while new “Sunrise Industries” are fostered.
LAND USE POLICY that prioritizes Time-Distance relationship & connectivity.
TRANSPORTATION investment for seamless connectivity for time-sensitive goods.
CATALYST PROJECTS that enable & accelerate targeted Aerotropolis land uses.
Critical Factors for Aerotropolis Success

Employment Projection-Driven Land Demand Forecasting
Targeted Economic
Sectors Allocated into
Statistical Categories
Building Typology Statistics &
Densities & Site Coverage
20,868,890 m2
Gross Floor Area projected
AGRICULTUREAgri- Business & Food processing 100%
MININGNatural Resources 100%
MANUFACTURINGAerospace Manufacturing & Aviation 40%Manufacturing & High-Tech 60%
ELECTRICITYNatural Resources & Energy 100%
TRADERetail 75%Tourism & Culture 25%
TRANSPORTLogistics & Distribution 100%
FINANCEProfessional Services 90%Public Administration 10%
COMMUNITY SERVICESEducation & Skills Training 25%Health & Life Sciences 75%
2040Baseline
Employment Projection
2040Aerotropolis
Multiplier Scenarios
87.25 km2
land demand projected

AEROTROPOLIS ECONOMIC DEVELOPMENT WORK STREAM
AEROTROPOLIS LAND USE PLANNING WORK STREAM
ECONOMIC CLUSTER STRATEGY
TIME-DISTANCE STRATEGY
LAND USE ALLOCATION
CATALYST PROJECT STRATEGY

Drive-Time Distance by Economic Activity
VALUE-ADD
MANUFACTURINGADVANCED
MANUFACTURING
ICT REPAIR
RENEWABLE ENERGY
0 - 5 Minutes
5 -10 Minutes10 - 15 Minutes
15+ Minutes
FAST-CYCLE LOGISTICS
BIO - LIFE SCIENCES &
DIAGNOSTICS
AEROSPACE
AVIATION
BIO-LOGISTICS
RETAIL FULFILLMENT
SPORTS & RECREATION
ARTISAN TRAINING
LOGISTICS
PROFESSIONALSERVICES
AGRI-BUSINESS
RETAIL FULFILLMENT
R & D
EDUCATION & SKILLS TRAINING
TOURISM& CULTURE
R & D
INTEGRATOR / CEP
Education Skills & Training
Public Admin City
Aviation Industry College
TVET College
RetailTourism &
Culture
Heavy Equipment
AuctionSports City
Int’l Conference
Center
Outlet MallAuto-Mall of Africa
Hotel & Dining District
SA Trade Mart
Aerospace & Advanced
Manufacturing
Denel Aerospace
Manufacturing Hub
Recycling & Renewable Energy Hub
Human Settlements Factory-Built Housing Hub
Air Cargo Logistics &
DistributionBio-Life Sciences
ICT R&D
Value-Add Food
Processing Hub
Medical City Africa
Digital City Business
Park
Discovery R&D
Business Park
Air Cargo Logistics
Hub
Post Office e-commerce
Integrator
Temperature-Controlled Cold Chain
Village
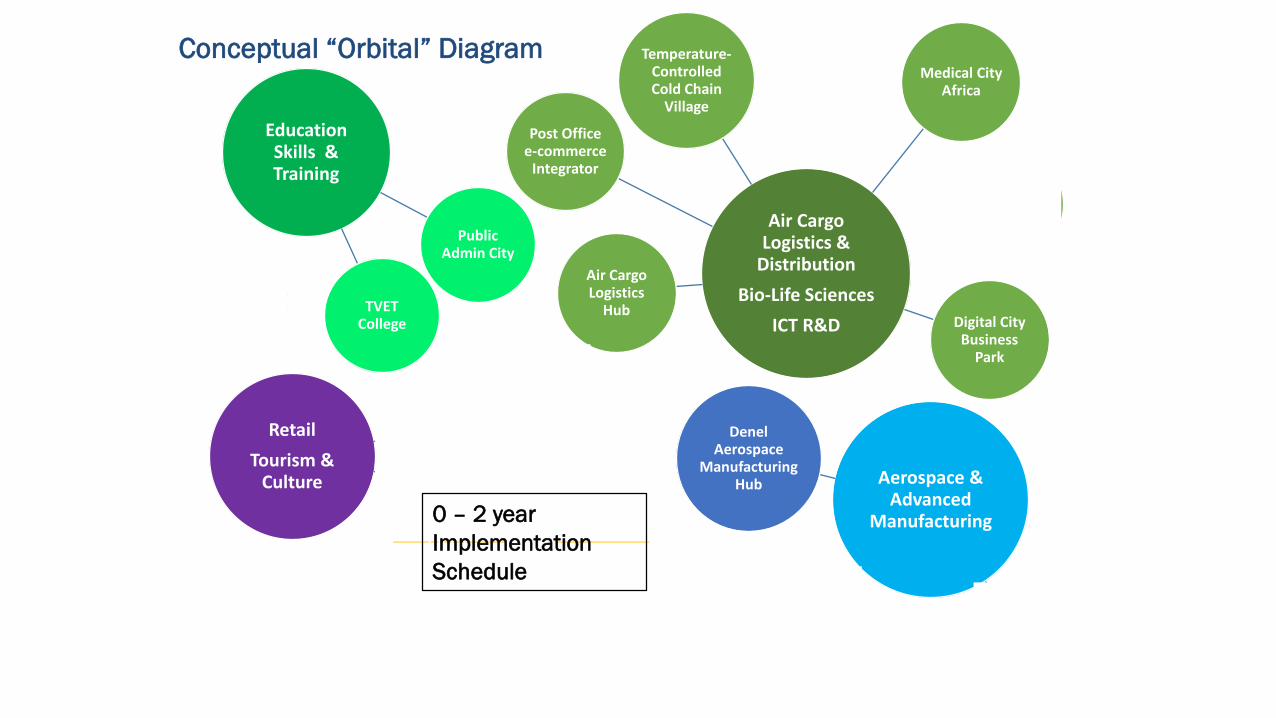
Conceptual “Orbital” Diagram
0 – 2 year ImplementationSchedule
Education Skills & Training
Public Admin City
Aviation Industry College
TVET College
RetailTourism &
Culture
Heavy Equipment
AuctionSports City
Int’l Conference
Center
Outlet MallAuto-Mall of Africa
Hotel & Dining District
SA Trade Mart
Aerospace & Advanced
Manufacturing
Denel Aerospace
Manufacturing Hub
Recycling & Renewable Energy Hub
Human Settlements Factory-Built Housing Hub
Air Cargo Logistics &
DistributionBio-Life Sciences
ICT R&D
Value-Add Food
Processing Hub
Medical City Africa
Digital City Business
Park
Discovery R&D
Business Park
Air Cargo Logistics
Hub
Post Office e-commerce
Integrator
Temperature-Controlled Cold Chain
Village
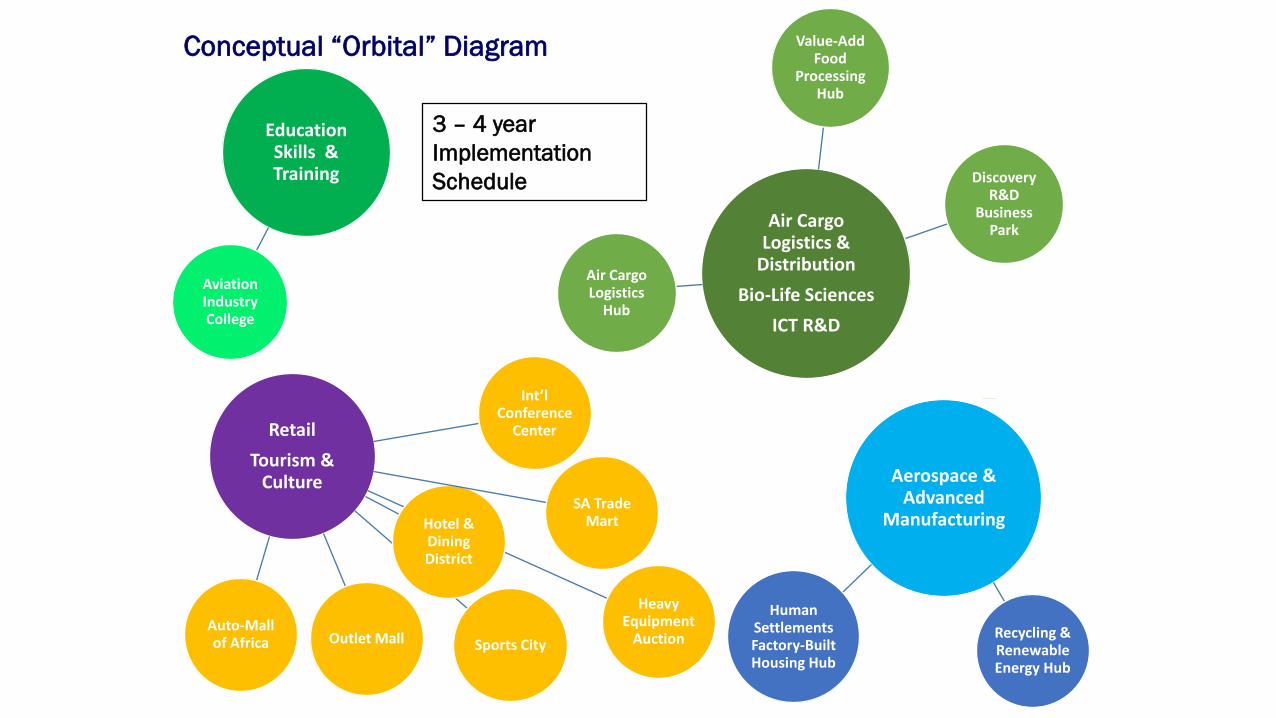
Conceptual “Orbital” Diagram
3 – 4 year ImplementationSchedule
Education Skills & Training
Public Admin City
Aviation Industry College
TVET College
RetailTourism &
Culture
Heavy Equipment
AuctionSports City
Int’l Conference
Center
Outlet MallAuto-Mall of Africa
Hotel & Dining District
SA Trade Mart
Aerospace & Advanced
Manufacturing
Denel Aerospace
Manufacturing Hub
Recycling & Renewable Energy Hub
Human Settlements Factory-Built Housing Hub
Air Cargo Logistics &
DistributionBio-Life Sciences
ICT R&D
Value-Add Food
Processing Hub
Medical City Africa
Digital City Business
Park
Discovery R&D
Business Park
Air Cargo Logistics
Hub
Post Office e-commerce
Integrator
Temperature-Controlled Cold Chain
Village
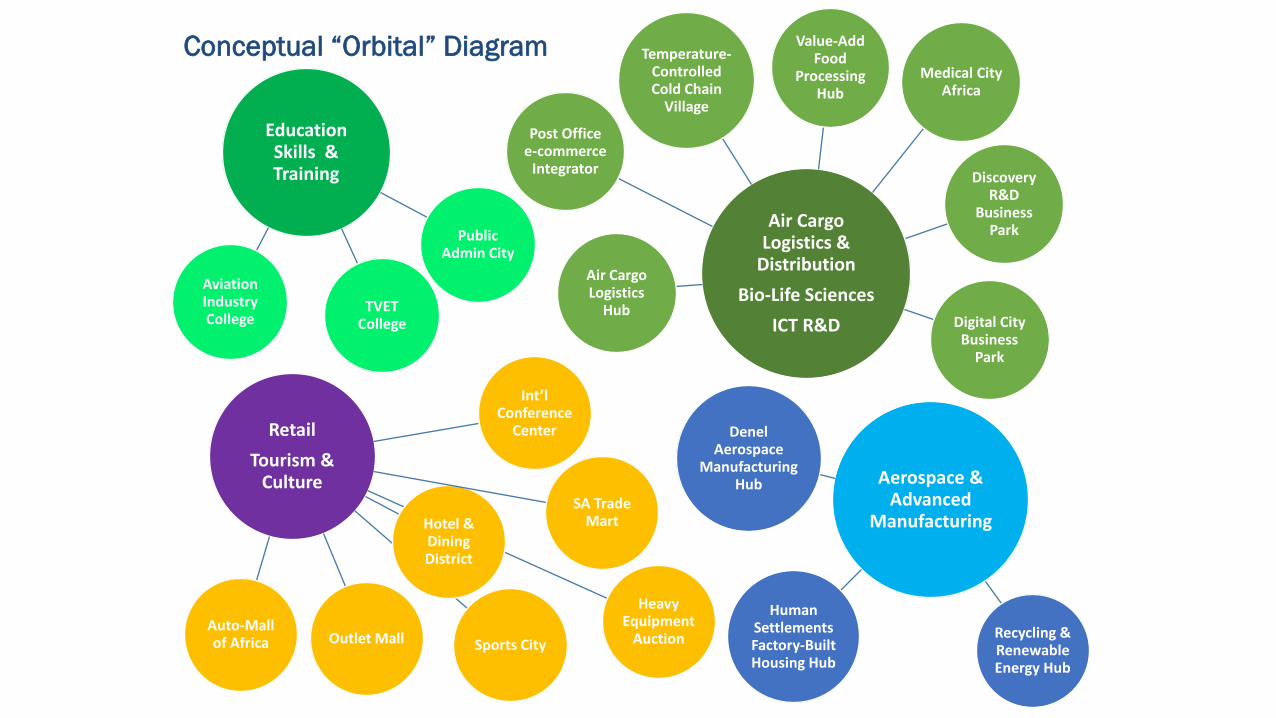
Conceptual “Orbital” Diagram
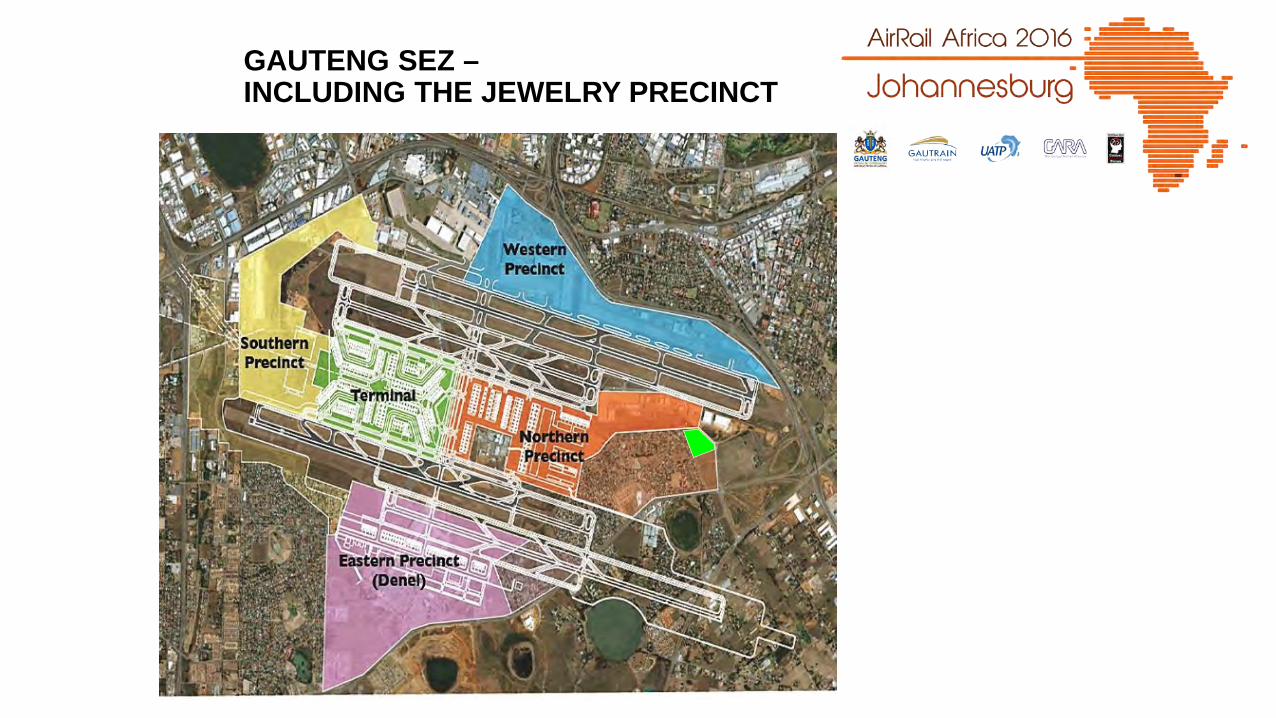
GAUTENG SEZ –INCLUDING THE JEWELRY PRECINCT

Advanced Manufacturing
3D Printing
Smart Textiles & Fabrics
Sunrise Industries
Opportunity: Foster a Nanotech manufacturing sectorthrough R&D-Commercialisation support, with afocus on the export of products by air.
Nanotechnology
Opportunity: Encourage the commercialisation of 3D Printingbreakthroughs for use in the Aerospace,advanced manufacturing, & mining sectors.
Opportunity: Support incorporation of Smart Fabrics into SAtextile sector through R&D and support for start-up advanced manufacturing businesses.

ICT
Big Data
Cloud-Based Computing
“Internet of Things”
Opportunity: Support R&D-Commercialisation of “Big Data”computing with a focus on Social and EconomicDevelopment applications in emerging markets.
Opportunity: Foster a low-cost mobile-computing environmentand R&D-Commercialisation ecosystem. PositionEkurhuleni as home for South Africa’s datacentres.
Opportunity: Position Ekurhuleni as the “Silicon Valley ofAfrica” for R&D-Commercialisation of internet-enabled devices for emerging markets.
Sunrise Industries
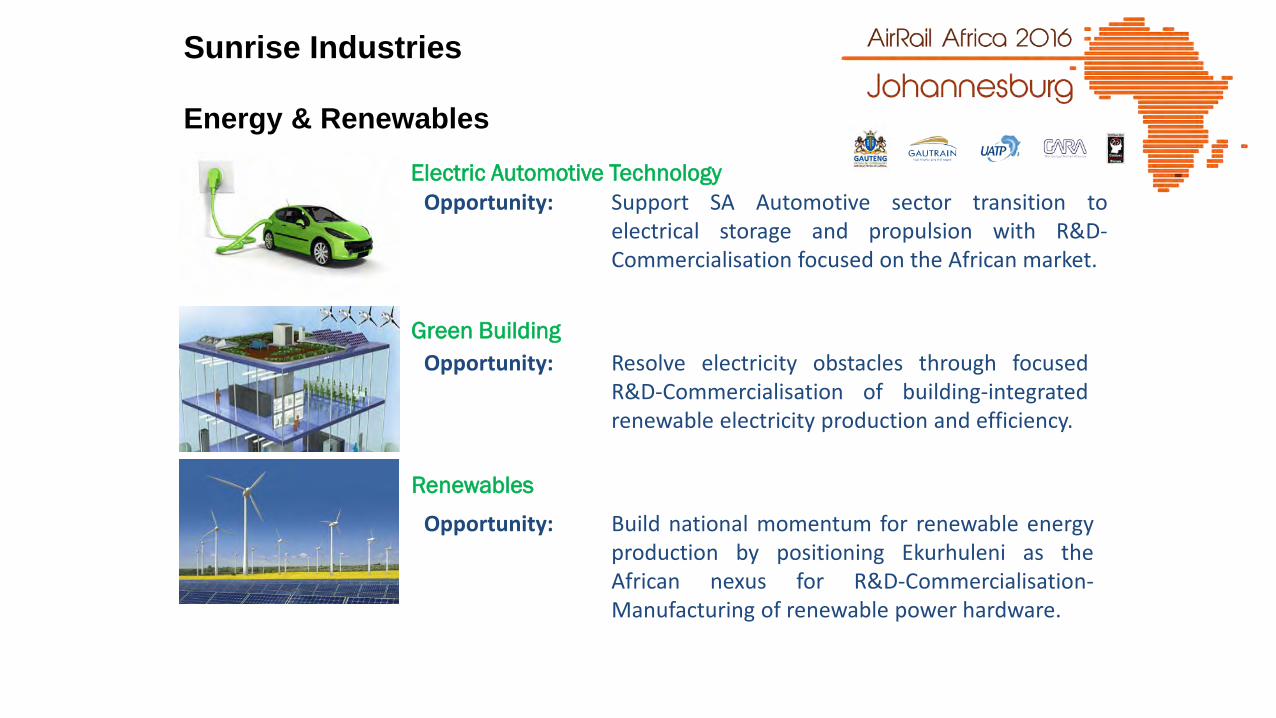
Energy & RenewablesElectric Automotive Technology
Green Building
Renewables
Opportunity: Support SA Automotive sector transition toelectrical storage and propulsion with R&D-Commercialisation focused on the African market.
Opportunity: Resolve electricity obstacles through focusedR&D-Commercialisation of building-integratedrenewable electricity production and efficiency.
Opportunity: Build national momentum for renewable energyproduction by positioning Ekurhuleni as theAfrican nexus for R&D-Commercialisation-Manufacturing of renewable power hardware.
Sunrise Industries

Life Sciences & HealthcarePersonalised Medicine
Innovative Agri-Business
Sunrise Industries
Opportunity: Support R&D-Commercialisation of individualisedgene therapy as part of positioning Ekurhuleni asthe Medical Tourism hub for Sub-Saharan Africa.
Opportunity: Leverage innovations in agronomy, cropsciences, and food processing to evolve the Agri-Business sector and create new export products.

ENABLING PROJECTS
• Urban Regeneration Projects:• Rhodesfield Master Plan;• Tembisa Urban Regeneration project;• Kempton Park Urban Regeneration Project; and• Germiston Precinct Urban Regeneration Project.
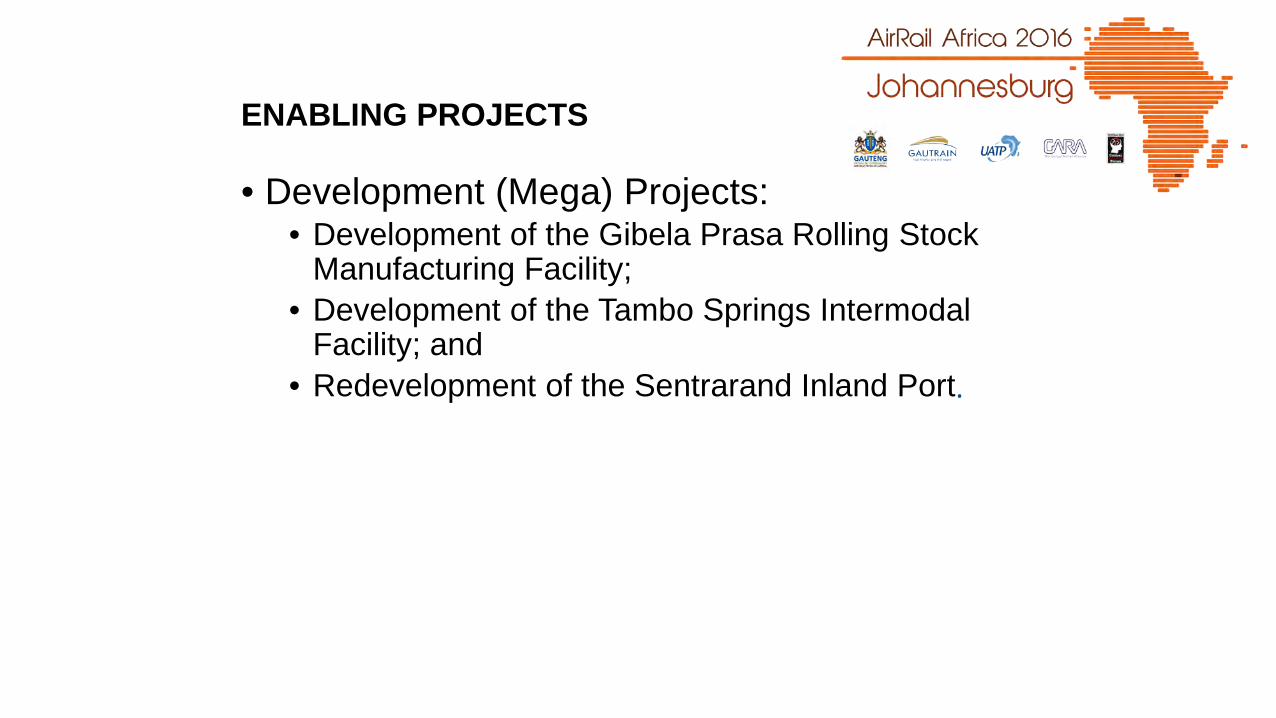
ENABLING PROJECTS
• Development (Mega) Projects:• Development of the Gibela Prasa Rolling Stock
Manufacturing Facility;• Development of the Tambo Springs Intermodal
Facility; and• Redevelopment of the Sentrarand Inland Port.
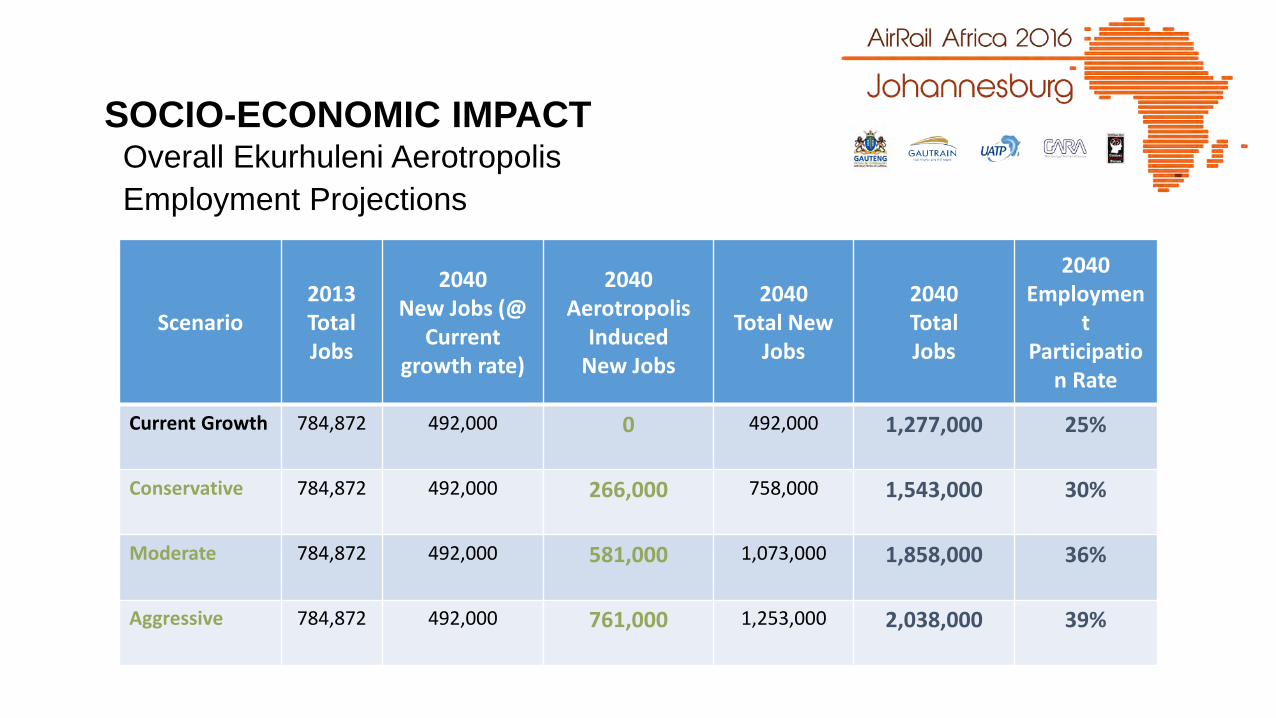
SOCIO-ECONOMIC IMPACTOverall Ekurhuleni Aerotropolis Employment Projections
+ ++ =
Scenario2013Total Jobs
2040New Jobs (@
Current growth rate)
2040 Aerotropolis
InducedNew Jobs
2040Total New
Jobs
2040TotalJobs
2040Employmen
t Participatio
n Rate
Current Growth 784,872 492,000 0 492,000 1,277,000 25%
Conservative 784,872 492,000 266,000 758,000 1,543,000 30%
Moderate 784,872 492,000 581,000 1,073,000 1,858,000 36%
Aggressive 784,872 492,000 761,000 1,253,000 2,038,000 39%

SOCIO-ECONOMIC IMPACTOverall Ekurhuleni Aerotropolis Employment Projections
784,872 784,872 784,872 784,872
492,000 492,000 492,000 492,000
266,000581,000 761,000
0
500000
1000000
1500000
2000000
2500000
Status Quo Conservative Moderate Aggressive
2013 Total Jobs 2040 Status Quo New Jobs 2040 Aerotropolis-Induced New Jobs
1,277,0001,543,000
1,858,0002,038,000

SOCIO-ECONOMIC IMPACTProject Socio-economic Effects
8,1 billion ZAR per annum*
Catalyst project effect on Gauteng GDP
(+0.67% annual contribution to the Gauteng GDP)*Estimated Gauteng GDP (current 2013 prices)

E: The Gautrain Rapid Rail Link Project(A case for Public Transport)

Implementation Process• Four pillars
• Political will & commitment• Viable project (base case design)
• Technical• Financial• Legal/Institutional
• Funding (for Infrastructure & Operations)• Government’s portion• Private Sector’s portion
• Community acceptance & buy-in• Socio-economic benefits• Power of expropriation
F: Objectives of the Gautrain Project

The Gautrain will promotePublic Transport
SMME & BBBEE DevelopmentTourism
Business development
The project stimulatesEconomic growth
Local & Foreign Investment New development
Job creation
Design toRestructure urban areasReduce travel distances,
time and costImprove city sustainability
Gautrain: More than Just Another Transport Project
G: PPP Requirements
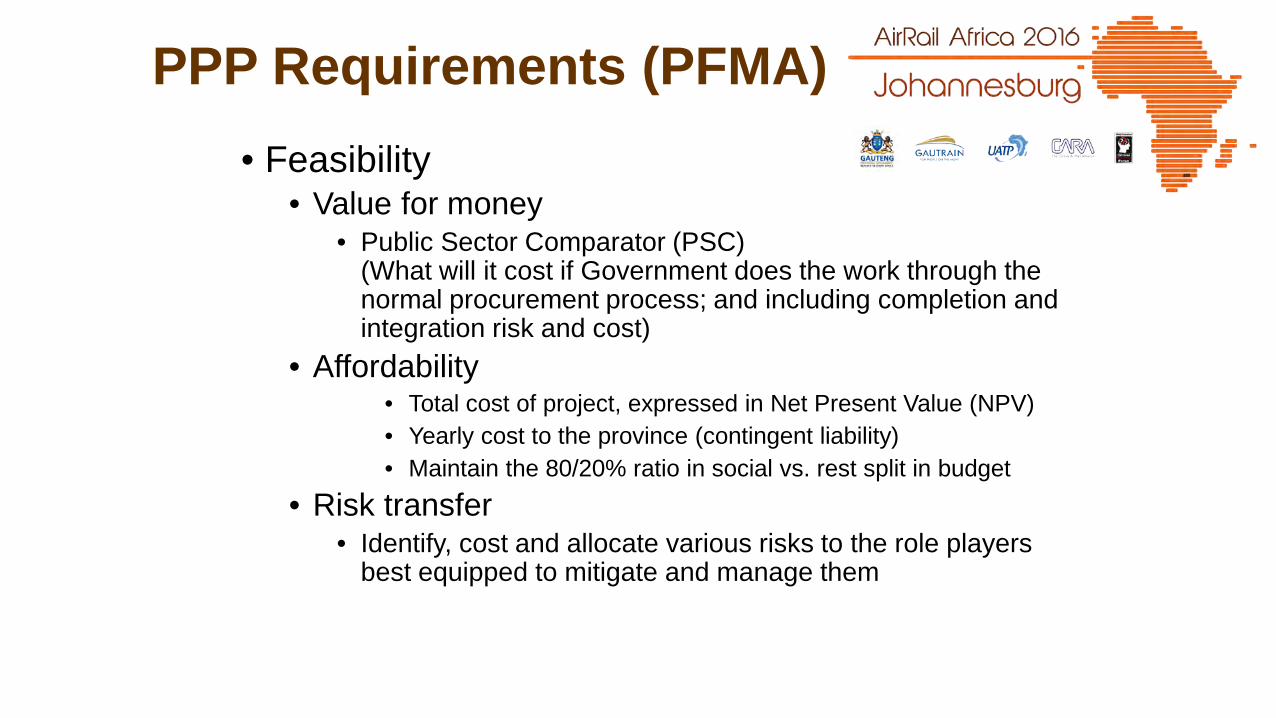
PPP Requirements (PFMA)• Feasibility
• Value for money • Public Sector Comparator (PSC)
(What will it cost if Government does the work through the normal procurement process; and including completion and integration risk and cost)
• Affordability• Total cost of project, expressed in Net Present Value (NPV)• Yearly cost to the province (contingent liability)• Maintain the 80/20% ratio in social vs. rest split in budget
• Risk transfer • Identify, cost and allocate various risks to the role players
best equipped to mitigate and manage them

PPP Advantages (1)• What each party brings to a PPP
Legislation
Subsidies &Guarantees
Land
Rights of wayLong term vision
Operation &Maintenance
Design &Build innovation
Capital
Access to the market
Financing
Users
Public
SectorConcession
(SPV)
Private
Sector
Revenue

PPP Advantages (2)• What each party gets from a PPP
Social function
PeopleMobility
Taxes
Economic development
Associatedbenefits
Environment protectionTime/cost savingService Quality
Concession
(SPV)
Private
Sector
Users
Public
Sector
Design & Construction Contract
OperationContract
Servicing of Debt
Incomes
Profit

H: Process sequence
Process Sequence
• Project identification & consultation• PPP Legislation, process & approval• Tender planning (RFQ, RFP )• Selection of Preferred & Reserve Bidder• Commercial negotiations & Financial Close• Construction• Operations & maintenance (concession period)• Handover

Parallel Processes
• Decision making & authorisation (Governance)• Legal processes (Litigation on content & process)• Continuous communication, consultation & public relations• Environmental (EIA) process • Third party involvement, co-operation and buy-in• Socio-economic Development (SED) requirements• External pressures• Land requirements (GTIA process)• Continuous funding – for multiple MTEF periods
I: The Deal
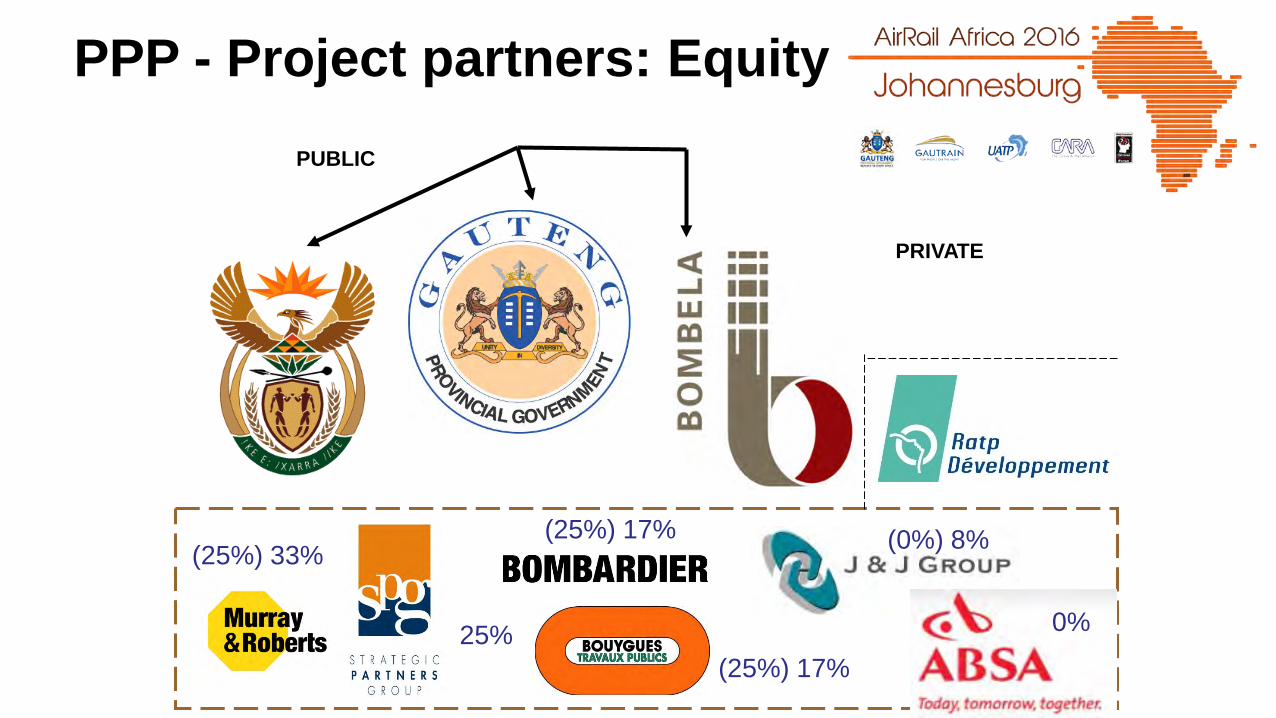
PPP - Project partners: EquityPUBLIC
PRIVATE
(25%) 33%
25%(25%) 17%
(25%) 17% (0%) 8%
0%
Concessionaire Bombela
Turnkey Contractor
Civil Contractor
E&M Contractor
E&MMaintainer
Operator
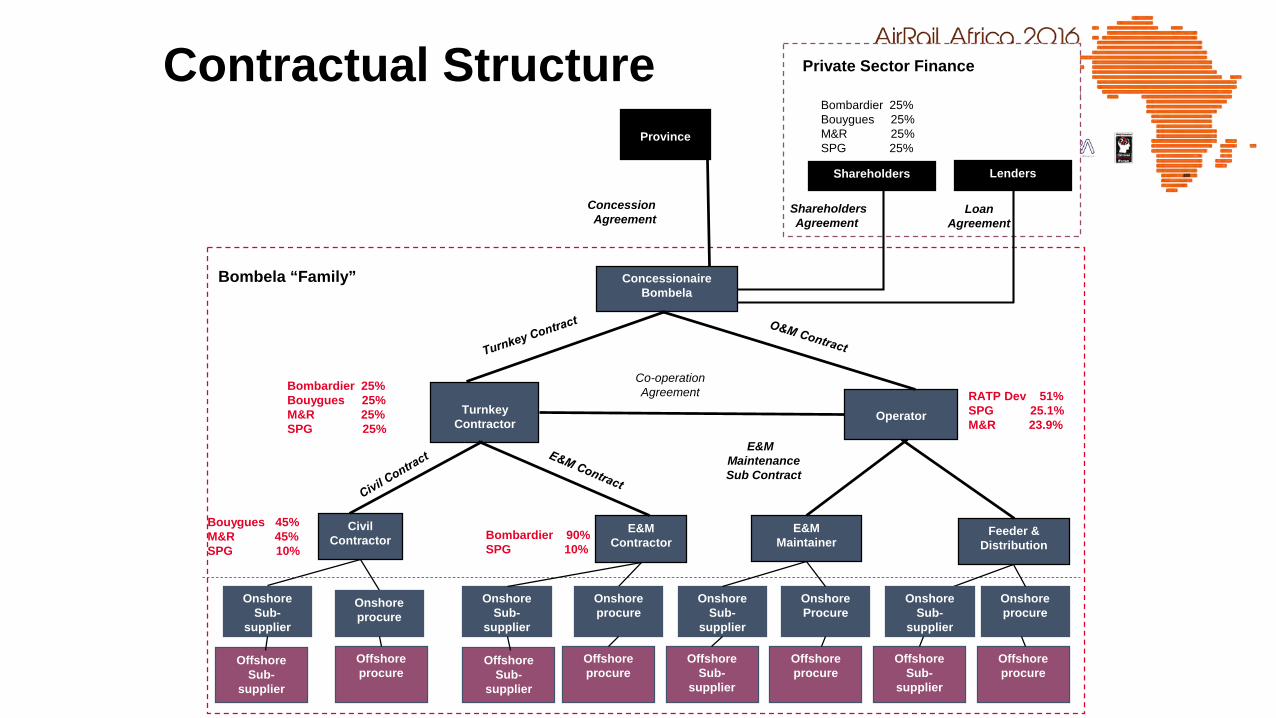
Contractual Structure
Lenders
Province
ShareholdersAgreement
LoanAgreement
Concession Agreement
E&M MaintenanceSub Contract
Bombardier 90%SPG 10%
RATP Dev 51%SPG 25.1%M&R 23.9%
Bombardier 25%Bouygues 25%M&R 25%SPG 25%
Private Sector Finance
Bombela “Family”
Onshore Sub-
supplier
OffshoreSub-
supplier
Bombardier 25%Bouygues 25%M&R 25%SPG 25%
Shareholders
Bouygues 45%M&R 45%SPG 10%
BombardierSPG
Onshore Sub-
supplier
OffshoreSub-
supplier
Onshore procure
Offshoreprocure
Feeder &Distribution
Co-operation Agreement
Onshore Sub-
supplier
Offshoreprocure
Offshoreprocure
OffshoreSub-
supplier
OffshoreSub-
supplier
Onshore procure
Onshore procure
Onshore Procure
Onshore Sub-
supplier
Offshoreprocure

Complex problems have simple, easy to understand, wrong answers.
No. 4 Grossman’s Misquote

J: Funding

Funding
• Gautrain has 5 sources of funding• DoRA (Division of Revenue Act) money from central
government via the Department of Transport (only for construction - CAPEX)
• MTEF (Medium Term Expenditure Framework) from Gauteng Provincial Government
• Private Sector Equity• Private Sector Borrowing• Provincial Borrowing

Project Financing
MTEF26.1%
DoRA44.2%
Equity1.8%
Private Debt9.5% Provincial
borrowing18.4%
K: Socio-Economic Development
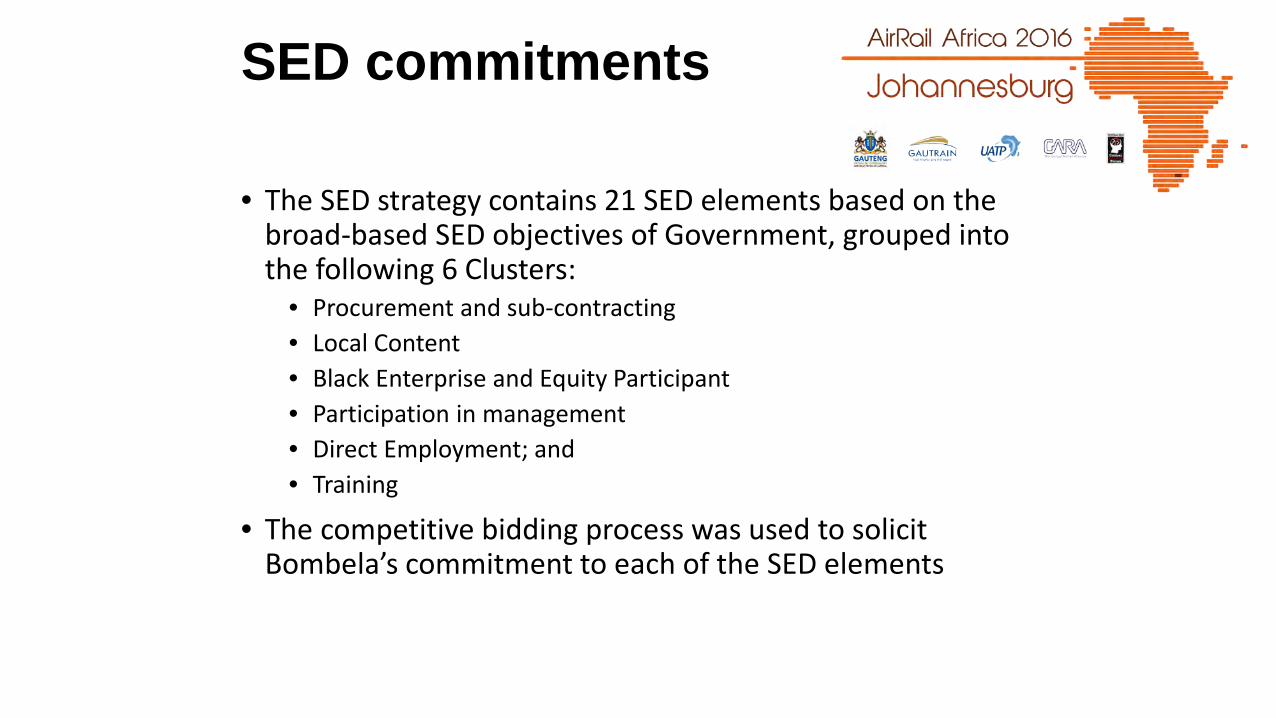
SED commitments
• The SED strategy contains 21 SED elements based on the broad-based SED objectives of Government, grouped into the following 6 Clusters:
• Procurement and sub-contracting• Local Content• Black Enterprise and Equity Participant• Participation in management• Direct Employment; and• Training
• The competitive bidding process was used to solicit Bombela’s commitment to each of the SED elements

166%
98%
117%
127%
225%
215%
411%
397%
266%
216%
124%
186%
176%
190%
180%
411%
197%
223%
179%
119%
100%
0% 50% 100% 150% 200% 250% 300% 350% 400% 450%
EEP08(b):Women Learners employed & mentored
EEP08(a): Women trained & mentored
EEP06:Expenditure on Human Resource Development
EEP05:People with Disabilities employed
EEP04:Women employed
EEP03:HDIs employed
EEP07:HDIs in Occupational Level C
EEP02:Women in Management Positions
EEP01:HDIs in Management Positions
SED13:Procurement from, or Sub-contracting to SPG
SED12:Expenditure by SPG on Plant & and Equipment
SED11:HDI staff seconded by SPG
SED10:Procurement of RSA Plant & Equipment
SED09:Procurement of RSA Materials
SED08:Employment of Local People
SED06:Procurement & sub-contracting to SMMEs
SED05:Procurement & sub-contracting to New BEE
SED04:Sub-contracting to BEE
SED03:Procurement from BEEs/ Black Persons
SED02:Shares held by Black Women
SED01:Shares held by BEEs/ Black Persons
Verified % Compliance

L: Gautrain Operations
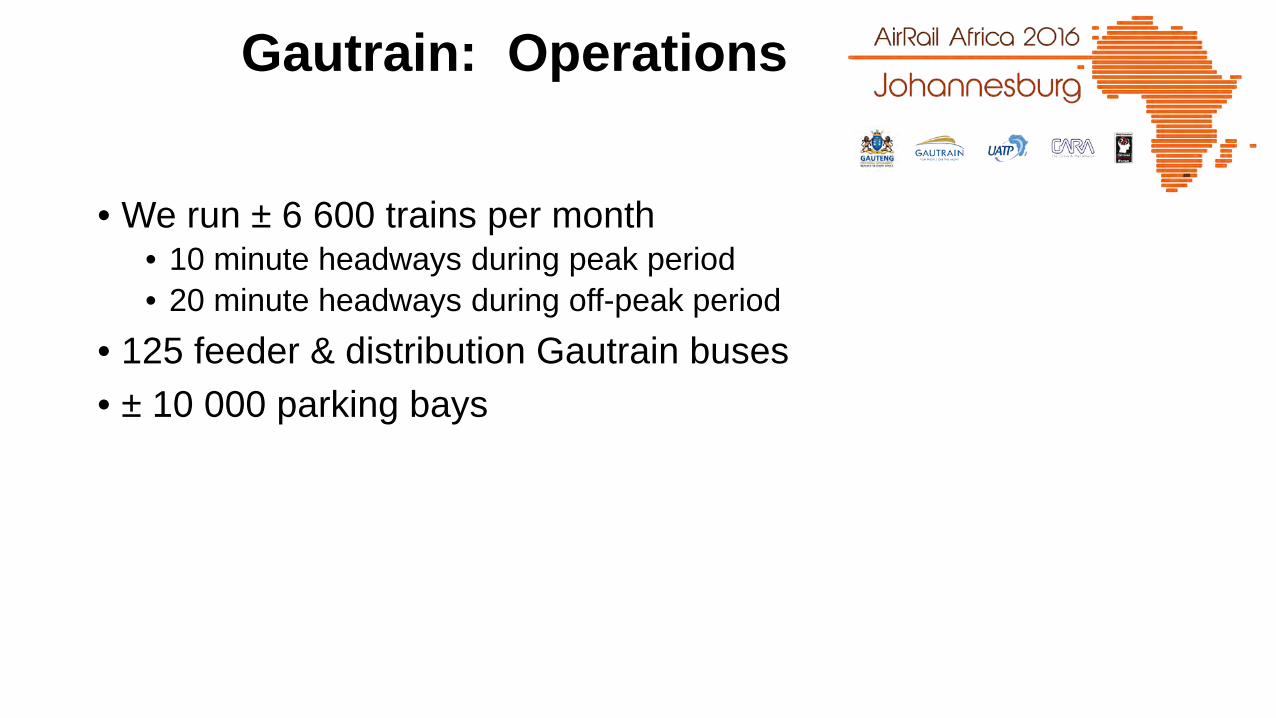
Gautrain: Operations
• We run ± 6 600 trains per month• 10 minute headways during peak period• 20 minute headways during off-peak period
• 125 feeder & distribution Gautrain buses• ± 10 000 parking bays
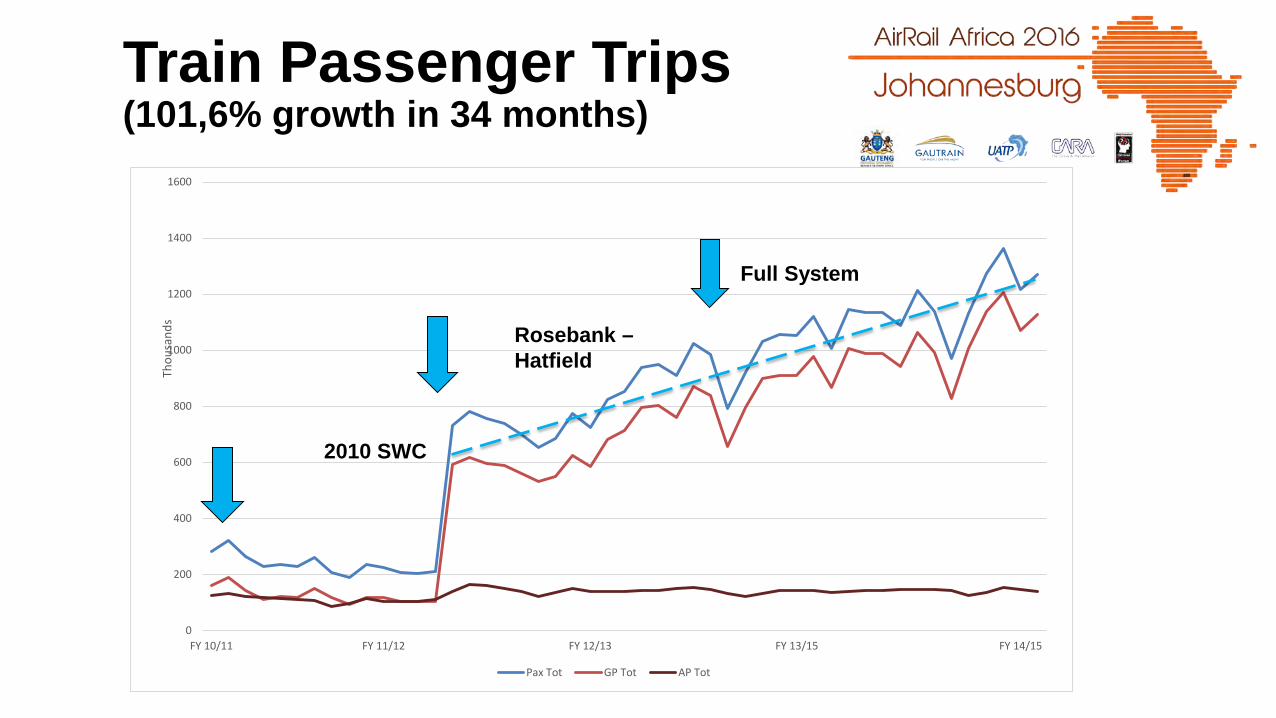
Train Passenger Trips(101,6% growth in 34 months)
Full System
Rosebank -Hatfield
2010 SWC
0
200
400
600
800
1000
1200
1400
1600
FY 10/11 FY 11/12 FY 12/13 FY 13/15 FY 14/15
Thou
sand
s
Pax Tot GP Tot AP Tot
2010 SWC
Rosebank –Hatfield
Full System
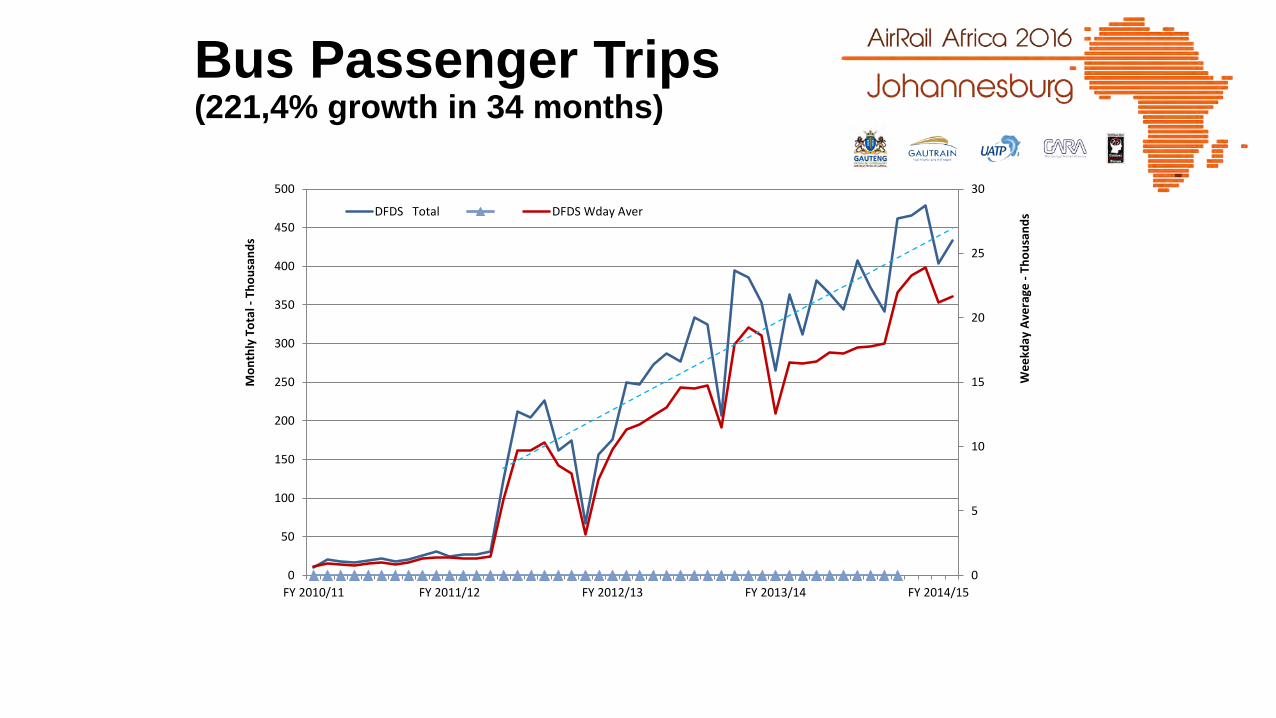
Bus Passenger Trips(221,4% growth in 34 months)
0
5
10
15
20
25
30
0
50
100
150
200
250
300
350
400
450
500
FY 2010/11 FY 2011/12 FY 2012/13 FY 2013/14 FY 2014/15
Wee
kday
Ave
rage
-Th
ousa
nds
Mon
thly
Tot
al -
Thou
sand
s
DFDS Total DFDS Wday Aver

Train Service Levels• Train operational performance in the review period
was above its respective norms of 98.5% and 94%TRAIN SERVICE AVAILABILTY / PUNCTUALITY
Q3 (FY 2013/14) Q4 (FY 2013/14) Q1 (FY 2014/15)
Oct Nov Dec Jan Feb Mar** Apr MaySCHEDULED TRIPS 6661 6301 5953 6424 5946 6389 6103 6305
ACTUAL TRIPS 6639 6263 5921 6413 5930 6353 6090 6303TRIPS CANCELLED 18 31 25 9 14 35 16 2
EARLY STARTS 4 7 7 2 2 1 4 0LATE ARRIVALS 86 57 59 88 89 84 64 65
SERVICE AVAILABILITY* 99.61% 99.29% 99.34% 99.80% 99.70% 99.42% 99.72% 99.97%AVAILABILITY NORM 98.50% 98.50% 98.50% 98.50% 98.50% 98.50% 98.50% 98.50%
SERVICE PUNCTUALITY 98.64% 98.98% 98.89% 98.60% 98.47% 98.66% 98.88% 98.97%PUNCTUALITY NORM 94.00% 94.00% 94.00% 94.00% 94.00% 94.00% 94.00% 94.00%
* Early Starts ( > 190 seconds) not regarded as "available"
Note - Punctuality: Actual Trains operated ≤ 180 seconds at arrival Terminal Station (Destination Station)

M: Gautrain Extensions

HATFIELDPRETORIA
CENTURION
MIDRAND
SANDTON
MARLBORO
PARK
WESTGATE
ROSEBANK
Ultimately four Services:
RED: North – South ServiceBLUE: Naledi – Mamelodi ServiceGREEN: Honeydew – Boksburg ServicePURPLE: Sandton – ORTIA Service
MAMELODI
TSHWANE EAST
IRENE
SUNNINGHILL
FOURWAYS
ROODEPOORT
NALEDI
COSMO
RUIMSIG
BLUE HILLS
SAMRAND
LAKEVIEWRHODESFIELD
BOKSBURG
RANDBURGHONEYDEW
EAST RAND MALL
OR TAMBO
LANSERIA

Environmental Assessment

117
• CoT • 6 new stations
• Incl Samrand
• EMM• 3 new stations
• Incl Rhodesfield 2
• CoJ• 10 new stations
• Incl Modderfontein, Sandton 2
19 New Stations

SANDTON
MARLBORO
MIDRAND
CENTURION
HATFIELD
Metrorail
ROSEBANK
PARK
PRETORIA
RHODESFIELD
O.R. TAMBO
SAMRAND
IRENE
TSHWANE EAST
HAZELDEAN
MAMELODI
OLIEVENHOUTSBOSCH
SUNNINGHILL
FOURWAYS
COSMO
LITTLE FALLS
ROODEPOORT
JABULANI
RANDBURG
LANSERIA
EAST RAND MALL
BOKSBURG
SANDTON 2
LEGEND
North – South Commuter East – West Commuter
Airport
MODDERFONTEIN
Train Operations
N: Closure

The Seven Stages of a PPP Project
• Enthusiasm• Promises & Programmes• Disillusionment• Panic• Hunt for the guilty• Punishment of the innocent• Reward for those who had nothing to do with it

Whatever it is that hits the fan -will not be evenly distributed.
No. 2 Law of Probable Dispersal
Thank You
“The philosophers have only interpreted the world, the point
however is to change it”Karl Marx
“The Future is not for the faint hearted.”
R Reagan