Embed Size (px)
Citation preview

© OCR 2016 J383/02 Turn over QN 601/8310/X T10026/03
GCSE (9–1) Geography A (Geographical Themes) J383/02 The World Around Us Sample Resource Booklet
Time allowed: 1 hour
INFORMATION FOR CANDIDATES
The questions tell you which resources you need to use. This document consists of 8 pages. Any blank pages are indicated.
INSTRUCTION TO EXAMS OFFICER/INVIGILATOR Do not send this Resource Booklet for marking, it should be retained in the centre or
recycled. Please contact OCR Copyright should you wish to re-use this document.
CONTENTS OF RESOURCE BOOKLET Fig. 1 – Part of a polar marine ecosystem Fig. 2 – Human Development Index (HDI) scores for countries of the world Fig. 3 – Predicted urban population change from 2000 to 2050 Fig. 4 – A line graph showing climate changes between the years 1000 and 1900 Fig. 5 – An Artist’s impression of global warming Fig. 6 – Consequences of climate change
SPECIMEN

2
© OCR 2016 J383/02
BLANK PAGE
SPECIMEN

3
© OCR 2016 J383/02 Turn over
Fig. 1 – Part of a polar marine ecosystem
SPECIMEN
4
© OCR 2016 J383/02
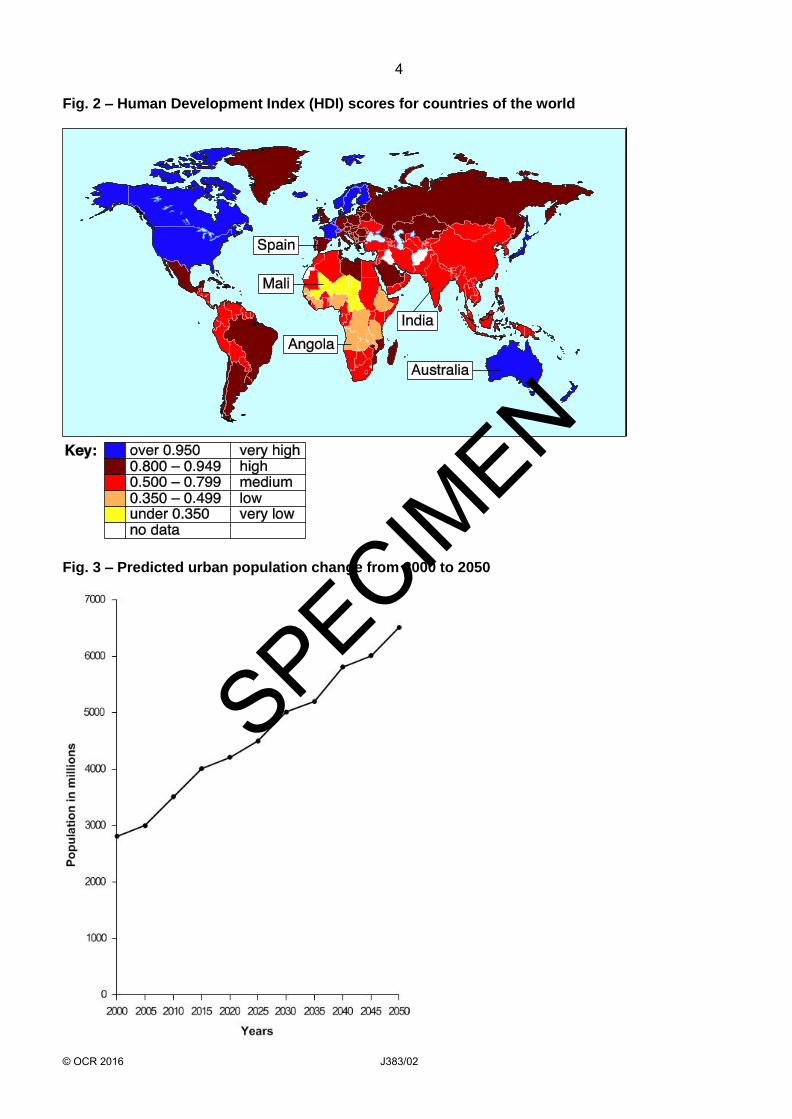
Fig. 2 – Human Development Index (HDI) scores for countries of the world
Fig. 3 – Predicted urban population change from 2000 to 2050
SPECIMEN
5
© OCR 2016 J383/02
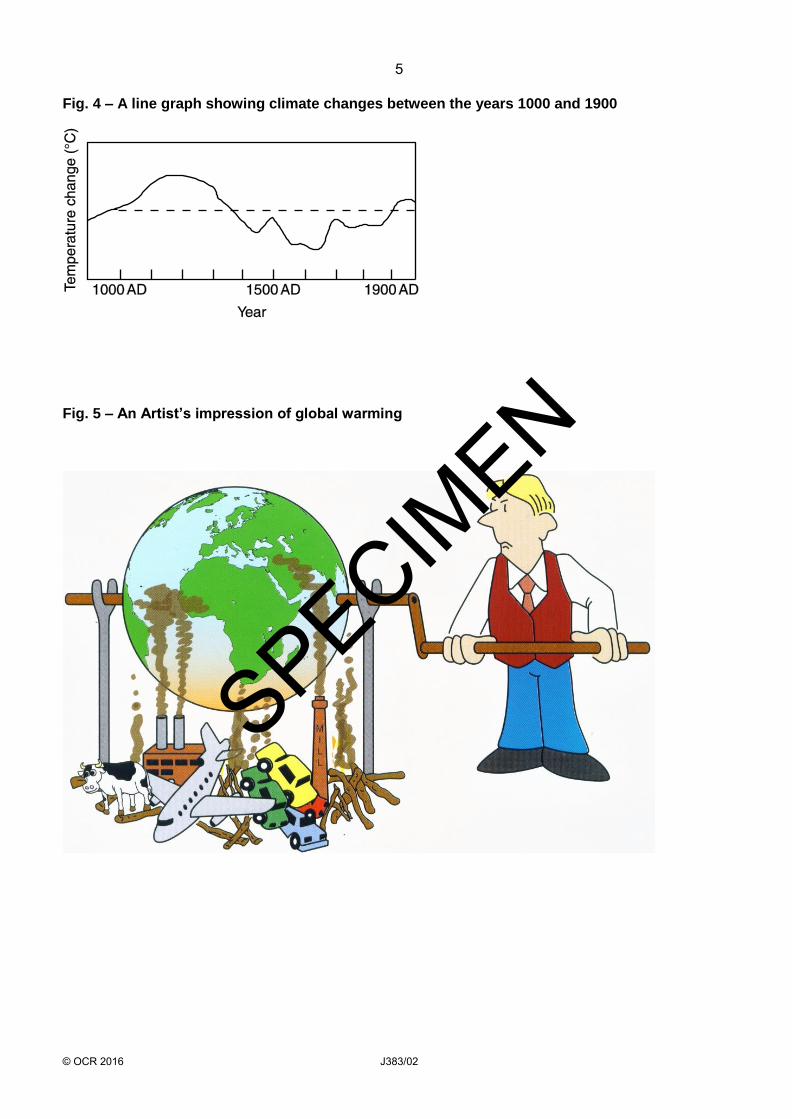
Fig. 4 – A line graph showing climate changes between the years 1000 and 1900
Fig. 5 – An Artist’s impression of global warming
SPECIMEN

6
© OCR 2016 J383/02 Turn over
Fig. 6 – Consequences of climate change
SPECIMEN

7
© OCR 2016 J383/02
BLANK PAGE
SPECIMEN

8
© OCR 2016 J383/02
BLANK PAGE
Copyright Information:
Fig. 5: © 1992-2015 Andrew B. Singer, reproduced by kind permission of Andrew Singer, www.andysinger.com Fig. 6: Permission to reproduce all copyright material has been applied for. In some cases, efforts to contact copyright-holders have been
unsuccessful and OCR will be happy to rectify any omissions of acknowledgements in future papers if notified. OCR is committed to seeking permission to reproduce all third-party content that it uses in the assessment materials. OCR has attempted to
identify and contact all copyright holders whose work is used in this paper. To avoid the issue of disclosure of answer-related information to
candidates, all copyright acknowledgements are reproduced in the OCR Copyright Acknowledgements booklet. This is produced for each
series of examinations and is freely available to download from our public website (www.ocr.org.uk) after the live examination series.
If OCR has unwittingly failed to correctly acknowledge or clear any third-party content in this assessment material, OCR will be happy to correct
its mistake at the earliest possible opportunity.
For queries or further information please contact the Copyright Team, First Floor, 9 Hills Road, Cambridge CB2 1GE.
OCR is part of the Cambridge Assessment Group; Cambridge Assessment is the brand name of University of Cambridge Local Examinations
Syndicate (UCLES), which is itself a department of the University of Cambridge.
SPECIMEN

© OCR 2016 J383/02 Turn over QN 601/8310/X T10026/03
GCSE (9–1) Geography A (Geographical Themes) J383/02 The World Around Us Sample Question Paper
Date – Morning/Afternoon Time allowed: 1 hour
You must have: • the Resource Booklet
You may use: • a ruler (cm/mm) • a piece of string • a scientific or graphical calculator
* 0 0 0 0 0 0 *
First name
Last name
Centre
number Candidate
number
INSTRUCTIONS • Use black ink. You may use an HB pencil for graphs and diagrams. • Complete the boxes above with your name, centre number and candidate
number. • Answer all the questions. • Write your answer to each question in the space provided. If additional space
is required, you should use the lined page(s) at the end of this booklet. The question number(s) must be clearly shown.
• Do not write in the barcodes. • The separate Resource Booklet will be found inside this document.
INFORMATION • The total mark for this paper is 60. • The marks for each question are shown in brackets [ ]. • Quality of extended responses will be assessed in questions marked with an
asterisk (*). • Spelling, punctuation and grammar and the use of specialist terminology
(SPaG) will be assessed in questions marked with a pencil ( ). • This document consists of 12 pages.
SPECIMEN

2
© OCR 2016 J383/02 Turn over
Answer all the questions. Ecosystems of the Planet
1 Use Fig. 1 in the separate Resource Booklet.
(a) Study Fig. 1, a diagram showing part of a polar marine ecosystem.
(i) Describe how the cod, seal and polar bear shown in Fig. 1 are connected in this ecosystem.
…………………………………………………………………………………………………… …………………………………………………………………………………………………… …………………………………………………………………………………………………… ……………………………………………………………………………………………………
[2]
(ii) Which of the following is a biotic component in the polar marine ecosystem shown in Fig. 1?
A carbon dioxide B phytoplankton C seafloor D sun’s energy Write the correct letter in the box.
[1]
(b) Describe the climate found in tropical savannah grassland ecosystems.
…………………………………………………………………………………………………………... …………………………………………………………………………………………………………... …………………………………………………………………………………………………………... …………………………………………………………………………………………………………... …………………………………………………………………………………………………………... …………………………………………………………………………………………………………...
[3]
SPECIMEN

3
© OCR 2016 J383/02 Turn over
(c) The Amazon Rainforest in Brazil experiences deforestation. Between 2012 and 2013 6 000 km2 of rainforest was cleared. In two Brazilian states there was a combined total of 2 400 km2 of rainforest cleared between 2012 and 2013.
Calculate the percentage of rainforest cleared in the two states out of the total rainforest lost between 2012 and 2013.
…………………………………………………………………………………………………………... …………………………………………………………………………………………………………...
[1]
(d) Explain how nutrients are recycled in the tropical rainforest.
…………………………………………………………………………………………………………... …………………………………………………………………………………………………………... …………………………………………………………………………………………………………... …………………………………………………………………………………………………………... …………………………………………………………………………………………………………... …………………………………………………………………………………………………………... …………………………………………………………………………………………………………... …………………………………………………………………………………………………………...
[4]
SPECIMEN

4
© OCR 2016 J383/02 Turn over
(e)* ‘Tropical rainforests experience greater threats to their biodiversity than coral reefs.’
To what extent do you agree with this statement?
…………………………………………………………………………………………………………... …………………………………………………………………………………………………………... …………………………………………………………………………………………………………... …………………………………………………………………………………………………………... …………………………………………………………………………………………………………... …………………………………………………………………………………………………………... …………………………………………………………………………………………………………... …………………………………………………………………………………………………………... …………………………………………………………………………………………………………... …………………………………………………………………………………………………………... …………………………………………………………………………………………………………... …………………………………………………………………………………………………………... …………………………………………………………………………………………………………... …………………………………………………………………………………………………………... …………………………………………………………………………………………………………... …………………………………………………………………………………………………………...
[8]
SPECIMEN
5
© OCR 2016 J383/02 Turn over
People of the Planet 2 Study Fig. 2 in the separate Resource Booklet, which shows Human Development Index (HDI)
scores for countries of the world.
(a) (i) Which of the following development indicators is used as part of the HDI calculation?
A Birth rate per 1000 people per year B Infant mortality rate C Internet users D Life expectancy at birth Write the correct letter in the box.
[1]
(ii) Using Fig. 2, describe the pattern of HDI scores for countries of the world.
…………………………………………………………………………………………………… …………………………………………………………………………………………………… …………………………………………………………………………………………………… …………………………………………………………………………………………………… …………………………………………………………………………………………………… ……………………………………………………………………………………………………
[3]
(b) (i) Using Fig. 3, calculate the percentage increase of the predicted urban population between 2015 and 2050.
……………………………………………………………………………………………………
[1]
(ii) There are a number of push and pull factors that cause rapid urbanisation in low-income developing countries (LIDCs).
Explain how two push factors cause rapid urbanisation in LIDCs.
…………………………………………………………………………………………………… …………………………………………………………………………………………………… …………………………………………………………………………………………………… …………………………………………………………………………………………………… ……………………………………………………………………………………………………
SPECIMEN

6
© OCR 2016 J383/02 Turn over
…………………………………………………………………………………………………… …………………………………………………………………………………………………… ……………………………………………………………………………………………………
[4]
(c)* Examine how far migration influences the growth and character of cities in LIDCs or EDCs.
Use case study knowledge in your answer.
…………………………………………………………………………………………………………... …………………………………………………………………………………………………………... …………………………………………………………………………………………………………... …………………………………………………………………………………………………………... …………………………………………………………………………………………………………... …………………………………………………………………………………………………………... …………………………………………………………………………………………………………... …………………………………………………………………………………………………………... …………………………………………………………………………………………………………... …………………………………………………………………………………………………………... …………………………………………………………………………………………………………... …………………………………………………………………………………………………………... …………………………………………………………………………………………………………... …………………………………………………………………………………………………………... …………………………………………………………………………………………………………... …………………………………………………………………………………………………………...
[12]
Spelling, punctuation and grammar and the use of specialist terminology [3]
SPECIMEN
7
© OCR 2016 J383/02
Environmental threats to our Planet 3 Study Figs 4, 5 and 6 in the separate Resource Booklet.
(a) Study Fig. 4, a line graph showing climate changes between the years 1000 and 1900.
Which of these years was in the medieval warm period?
A 1200 B 1500 C 1700 D 1900 Write the correct letter in the box.
[1]
(b) Study Fig. 5, a cartoon showing an artist’s impression of global warming.
Using evidence from Fig. 5, explain how human activity creates the enhanced greenhouse effect.
…………………………………………………………………………………………………………... …………………………………………………………………………………………………………... …………………………………………………………………………………………………………... …………………………………………………………………………………………………………... …………………………………………………………………………………………………………... …………………………………………………………………………………………………………... …………………………………………………………………………………………………………... …………………………………………………………………………………………………………...
[4]
(c) Study Fig. 6, a map showing the consequences of climate change split into three categories (physical, biological and human)
Using Fig. 6, state which category has been affected most by the consequences of climate change. Give a reason for your answer.
…………………………………………………………………………………………………………... …………………………………………………………………………………………………………... …………………………………………………………………………………………………………... …………………………………………………………………………………………………………...
[2]
SPECIMEN

8
© OCR 2016 J383/02
Graph to show the number of tropical storms globally
(d) Using the graph above, make a prediction for the number of tropical storms globally in 2015.
…………………………………………………………………………………………………………... [1]
(e) Explain the distribution of tropical storms and whether this has changed over time.
…………………………………………………………………………………………………………... …………………………………………………………………………………………………………... …………………………………………………………………………………………………………... …………………………………………………………………………………………………………... …………………………………………………………………………………………………………... …………………………………………………………………………………………………………...
[3]
SPECIMEN

9
© OCR 2016 J383/02
(f) CASE STUDY – Drought caused by El Niño/La Niña
Drought studied: …………………………………………………………………………………….
Explain how El Niño/La Niña leads to drought in your case study area
…………………………………………………………………………………………………………... …………………………………………………………………………………………………………... …………………………………………………………………………………………………………... …………………………………………………………………………………………………………... …………………………………………………………………………………………………………... …………………………………………………………………………………………………………... …………………………………………………………………………………………………………... …………………………………………………………………………………………………………... …………………………………………………………………………………………………………... …………………………………………………………………………………………………………... …………………………………………………………………………………………………………... …………………………………………………………………………………………………………...
[6]
SPECIMEN

10
© OCR 2016 J383/02
ADDITIONAL ANSWER SPACE
If you use this lined space to complete the answer to any question(s), the question number(s) must be clearly shown.
…………………………………………………………………………………………………………………………
…………………………………………………………………………………………………………………………
…………………………………………………………………………………………………………………………
…………………………………………………………………………………………………………………………
…………………………………………………………………………………………………………………………
…………………………………………………………………………………………………………………………
…………………………………………………………………………………………………………………………
…………………………………………………………………………………………………………………………
…………………………………………………………………………………………………………………………
…………………………………………………………………………………………………………………………
…………………………………………………………………………………………………………………………
…………………………………………………………………………………………………………………………
…………………………………………………………………………………………………………………………
…………………………………………………………………………………………………………………………
…………………………………………………………………………………………………………………………
…………………………………………………………………………………………………………………………
…………………………………………………………………………………………………………………………
…………………………………………………………………………………………………………………………
…………………………………………………………………………………………………………………………
…………………………………………………………………………………………………………………………
…………………………………………………………………………………………………………………………
…………………………………………………………………………………………………………………………
…………………………………………………………………………………………………………………………
…………………………………………………………………………………………………………………………
…………………………………………………………………………………………………………………………
…………………………………………………………………………………………………………………………
…………………………………………………………………………………………………………………………
SPECIMEN

11
© OCR 2016 J383/02
…………………………………………………………………………………………………………………………
…………………………………………………………………………………………………………………………
…………………………………………………………………………………………………………………………
…………………………………………………………………………………………………………………………
…………………………………………………………………………………………………………………………
…………………………………………………………………………………………………………………………
…………………………………………………………………………………………………………………………
…………………………………………………………………………………………………………………………
…………………………………………………………………………………………………………………………
…………………………………………………………………………………………………………………………
…………………………………………………………………………………………………………………………
…………………………………………………………………………………………………………………………
…………………………………………………………………………………………………………………………
…………………………………………………………………………………………………………………………
…………………………………………………………………………………………………………………………
…………………………………………………………………………………………………………………………
…………………………………………………………………………………………………………………………
…………………………………………………………………………………………………………………………
…………………………………………………………………………………………………………………………
…………………………………………………………………………………………………………………………
…………………………………………………………………………………………………………………………
…………………………………………………………………………………………………………………………
…………………………………………………………………………………………………………………………
…………………………………………………………………………………………………………………………
…………………………………………………………………………………………………………………………
…………………………………………………………………………………………………………………………
…………………………………………………………………………………………………………………………
…………………………………………………………………………………………………………………………
…………………………………………………………………………………………………………………………
SPECIMEN

12
© OCR 2016 J383/02
BLANK PAGE
Copyright Information:
OCR is committed to seeking permission to reproduce all third-party content that it uses in the assessment materials. OCR has attempted to identify and contact all copyright holders whose work is used in this paper. To avoid the issue of disclosure of answer-related information to candidates, all copyright acknowledgements are reproduced in the OCR Copyright Acknowledgements booklet. This is produced for each series of examinations and is freely available to download from our public website (www.ocr.org.uk) after the live examination series.
If OCR has unwittingly failed to correctly acknowledge or clear any third-party content in this assessment material, OCR will be happy to correct its mistake at the earliest possible opportunity.
For queries or further information please contact the Copyright Team, First Floor, 9 Hills Road, Cambridge CB2 1GE.
OCR is part of the Cambridge Assessment Group; Cambridge Assessment is the brand name of University of Cambridge Local Examinations Syndicate (UCLES), which is itself a department of the University of Cambridge.
SPECIMEN

T10026/02
…day June 20XX – Morning/Afternoon GCSE (9–1) Geography A (Geographical Themes)
J383/02 The World Around Us SAMPLE MARK SCHEME Duration: 1 hour
MAXIMUM MARK 60
This document consists of 20 pages
SPECIMEN

J383/02 Mark Scheme June 20xx
2
MARKING INSTRUCTIONS
PREPARATION FOR MARKING
SCORIS
1. Make sure that you have accessed and completed the relevant training packages for on-screen marking: scoris assessor Online Training; OCR Essential Guide to Marking.
2. Make sure that you have read and understood the mark scheme and the question paper for this unit. These are posted on the RM Cambridge
Assessment Support Portal http://www.rm.com/support/ca 3. Log-in to scoris and mark the required number of practice responses (“scripts”) and the required number of standardisation responses.
YOU MUST MARK 10 PRACTICE AND 10 STANDARDISATION RESPONSES BEFORE YOU CAN BE APPROVED TO MARK LIVE SCRIPTS.
TRADITIONAL
Before the Standardisation meeting you must mark at least 10 scripts from several centres. For this preliminary marking you should use pencil and follow the mark scheme. Bring these marked scripts to the meeting. MARKING
1. Mark strictly to the mark scheme. 2. Marks awarded must relate directly to the marking criteria. 3. The schedule of dates is very important. It is essential that you meet the scoris 50% and 100% (traditional 50% Batch 1 and 100% Batch 2)
deadlines. If you experience problems, you must contact your Team Leader (Supervisor) without delay. 4. If you are in any doubt about applying the mark scheme, consult your Team Leader by telephone, email or via the scoris messaging system.
SPECIMEN

J383/02 Mark Scheme June 20xx
3
5. Work crossed out: a. where a candidate crosses out an answer and provides an alternative response, the crossed out response is not marked and gains no
marks b. if a candidate crosses out an answer to a whole question and makes no second attempt, and if the inclusion of the answer does not
cause a rubric infringement, the assessor should attempt to mark the crossed out answer and award marks appropriately. 6. Always check the pages (and additional objects if present) at the end of the response in case any answers have been continued there. If the
candidate has continued an answer there then add a tick to confirm that the work has been seen. 7. There is a NR (No Response) option. Award NR (No Response)
- if there is nothing written at all in the answer space - OR if there is a comment which does not in any way relate to the question (e.g. ‘can’t do’, ‘don’t know’) - OR if there is a mark (e.g. a dash, a question mark) which isn’t an attempt at the question. Note: Award 0 marks – for an attempt that earns no credit (including copying out the question).
8. The scoris comments box is used by your Team Leader to explain the marking of the practice responses. Please refer to these comments when checking your practice responses. Do not use the comments box for any other reason. If you have any questions or comments for your Team Leader, use telephone, email or the scoris messaging system.
9. Assistant Examiners will send a brief report on the performance of candidates to their Team Leader (Supervisor) via email by the end of the marking period. The report should contain notes on particular strengths displayed as well as common errors or weaknesses. Constructive criticism of the question paper/mark scheme is also appreciated.
SPECIMEN

J383/02 Mark Scheme June 20xx
4
10. Annotations
Annotation Meaning
SPECIMEN

J383/02 Mark Scheme June 20xx
5
11. Subject-specific Marking Instructions
INTRODUCTION Your first task as an Examiner is to become thoroughly familiar with the material on which the examination depends. This material includes: the specification, especially the assessment objectives the question paper and its rubrics the mark scheme.
You should ensure that you have copies of these materials. You should ensure also that you are familiar with the administrative procedures related to the marking process. These are set out in the OCR booklet Instructions for Examiners. If you are examining for the first time, please read carefully Appendix 5 Introduction to Script Marking: Notes for New Examiners. Please ask for help or guidance whenever you need it. Your first point of contact is your Team Leader.
SPECIMEN

J383/02 Mark Scheme June 20xx
6
USING THE MARK SCHEME
Please study this Mark Scheme carefully. The Mark Scheme is an integral part of the process that begins with the setting of the question paper and ends with the awarding of grades. Question papers and Mark Schemes are developed in association with each other so that issues of differentiation and positive achievement can be addressed from the very start.
This Mark Scheme is a working document; it is not exhaustive; it does not provide ‘correct’ answers. The Mark Scheme can only provide ‘best
guesses’ about how the question will work out, and it is subject to revision after we have looked at a wide range of scripts.
The Examiners’ Standardisation Meeting will ensure that the Mark Scheme covers the range of candidates’ responses to the questions, and that all Examiners understand and apply the Mark Scheme in the same way. The Mark Scheme will be discussed and amended at the meeting, and administrative procedures will be confirmed. Co-ordination scripts will be issued at the meeting to exemplify aspects of candidates’ responses and
achievements; the co-ordination scripts then become part of this Mark Scheme.
Before the Standardisation Meeting, you should read and mark in pencil a number of scripts, in order to gain an impression of the range of responses and achievement that may be expected.
In your marking, you will encounter valid responses which are not covered by the Mark Scheme: these responses must be credited. You will encounter answers which fall outside the ‘target range’ of Bands for the paper which you are marking. Please mark these answers according to the marking criteria.
Please read carefully all the scripts in your allocation and make every effort to look positively for achievement throughout the ability range. Always be prepared to use the full range of marks.
SPECIMEN
J383/02 Mark Scheme June 20xx
7
LEVELS OF RESPONSE QUESTIONS: The indicative content indicates the expected parameters for candidates’ answers, but be prepared to recognise and credit unexpected approaches where they show relevance. Using ‘best-fit’, decide first which set of level descriptors best describes the overall quality of the answer. Once the level is located, adjust the mark concentrating on features of the answer which make it stronger or weaker following the guidelines for refinement. Highest mark: If clear evidence of all the qualities in the level descriptors is shown, the HIGHEST Mark should be awarded. Lowest mark: If the answer shows the candidate to be borderline (i.e. they have achieved all the qualities of the levels below and show limited evidence of meeting the criteria of the level in question) the LOWEST mark should be awarded. Middle mark: This mark should be used for candidates who are secure in the level. They are not ‘borderline’ but they have only achieved some of the qualities in the level descriptors. Be prepared to use the full range of marks. Do not reserve (e.g.) highest level marks ‘in case’ something turns up of a quality you have not yet
seen. If an answer gives clear evidence of the qualities described in the level descriptors, reward appropriately.
SPECIMEN

J383/02 Mark Scheme June 20xx
8
AO1 AO2 AO3
Comprehensive A range of detailed and accurate knowledge that is fully relevant to the question.
A range of detailed and accurate understanding that is fully relevant to the question.
Detailed and accurate interpretation through the application of relevant knowledge and understanding. Detailed and accurate analysis through the application of relevant knowledge and understanding. Detailed and substantiated evaluation through the application of relevant knowledge and understanding. Detailed and substantiated judgement through the application of relevant knowledge and understanding.
Thorough A range of accurate knowledge that is relevant to the question.
A range of accurate understanding that is relevant to the question.
Accurate interpretation through the application of relevant knowledge and understanding. Accurate analysis through the application of relevant knowledge and understanding. Supported evaluation through the application of relevant knowledge and understanding. Supported judgement through the application of relevant knowledge and understanding.
Reasonable Some knowledge that is relevant to the question.
Some understanding that is relevant to the question.
Some accuracy in interpretation through the application of some relevant knowledge and understanding. Some accuracy in analysis through the application of some relevant knowledge and understanding. Partially supported evaluation through the application of some relevant knowledge and understanding. Partially supported judgement through the application of some relevant knowledge and understanding.
Basic Limited knowledge that is relevant to the topic or question.
Limited understanding that is relevant to the topic or question.
Limited accuracy in interpretation through lack of application of relevant knowledge and understanding. Limited accuracy in analysis through lack of application of relevant knowledge and understanding. Un-supported evaluation through lack of application of knowledge and understanding. Un-supported judgement through lack of application of knowledge and understanding.
SPECIMEN

J383/02 Mark Scheme June 20xx
9
Question Answer Marks Guidance
1 (a) (i) seal will eat the cod () polar bear will eat the seal () or connected by the food chain/web () + example ()
2 2 x 1 () 1 mark for each valid description
(ii) B: Phytoplankton () 1 () (b) Extremely low rainfall November – March ()
Heavy rains July – Sept () High temperatures particularly March – October () Highest temperatures before heavy rains () Coolest period just after heavy rains ()
3 3 x 1 () 1 mark for each valid description Answer must focus on tropical savannah grasslands and not temperate grasslands
(c) 40% () 1 () (d) Leaves fall from trees and decay on rainforest floor due to
warm moist conditions () Fungi and bacteria decompose organic matter which forms humus () Nutrients enter the rainforest soil and they are dissolved by rain () Nutrients taken up by shallow tree and plant roots helping rapid growth ()
4 4 x 1 mark for each valid explanation point of how nutrients are recycled in the tropical rainforest () Must focus on trees/leaves for (re)cycling within the tropical rainforest
(e)*
Level 3 (6–8 marks) An answer at this level demonstrates thorough understanding of threats to biodiversity in tropical rainforests and coral reefs (AO2) and reasonable analysis in comparing the threats to biodiversity between tropical rainforests and coral reefs (AO3). There will be a thorough judgement of the extent to which the statement is agreed with (AO3). This will be shown by including well-developed ideas both about the threats to the biodiversity of tropical rainforests and coral reefs and how far the threats are greater in tropical rainforests. There is a well-developed line of reasoning which is clear and logically structured. The information presented is relevant and substantiated.
8 Answer will be marked using 3 levels: Indicative content Threat(s) must focus on biodiversity and could include: Tourism, farming, population increase, pollution, mining, climate change, sedimentation, overfishing, habitat loss, resource consumption and environmental degradation. A comparison of the threats to biodiversity in tropical rainforests and coral reefs could include similarities (tourism, farming, pollution) and differences (climate change, sedimentation, overfishing) A judgement of the threats to biodiversity could include rates and severity of changes to biodiversity.
SPECIMEN

J383/02 Mark Scheme June 20xx
10
Question Answer Marks Guidance
Level 2 (3–5 marks) An answer at this level demonstrates reasonable understanding of threats to biodiversity in tropical rainforests and coral reefs (AO2) and basic analysis in comparing the threats to biodiversity between tropical rainforests and coral reefs (AO3). There will be a reasonable judgement of the extent to which the statement is agreed with (AO3). This will be shown by including developed ideas about the threats to the biodiversity of tropical rainforests and coral reefs and how far the threats are greater in tropical rainforests. There is a line of reasoning presented with some structure. The information presented is in the most-part relevant and supported by some evidence. Level 1 (1–2 marks) An answer at this level demonstrates basic understanding of threats to biodiversity in tropical rainforests and coral reefs (AO2) with a basic judgement of the extent to which the statement is agreed with (AO3).There will be no analysis in comparing the threats to biodiversity between tropical rainforests and coral reefs (AO3). This will be shown by including simple ideas about the threats to the biodiversity of tropical rainforests and coral reefs and how far the threats are greater in tropical rainforests. The information is basic and communicated in an unstructured way. The information is supported by limited evidence and the relationship to the evidence may not be
Examples of well-developed ideas: The threats to biodiversity in tropical rainforests are greater than those to coral reefs, with over half of the world’s tropical rainforest having been lost whilst the figure for coral reefs is nearer to 40%. The scale of the mining, logging and farming in tropical rainforests creates a permanent impact due to habitat loss, leading to biodiversity loss. The threats to biodiversity in coral reefs can be just as important as for tropical rainforests as they can still cause permanent change and species extinction, such as through coral bleaching. Threats to biodiversity in tropical rainforests are better documented and so this may give the impression that they are greater, whereas we are learning more about coral reefs. Examples of developed ideas: The threats to biodiversity in tropical rainforests are greater than those to coral reefs. Mining and logging in tropical rainforests cause habitats to be destroyed, leading to a loss of plants and animals. The threats to biodiversity in coral reefs can be just as important as for tropical rainforests as they can still cause permanent change. We know more about the threats to tropical rainforests and so this may give the impression that they are greater. Examples of simple ideas: Rainforests are being cut down for people to farm this can kill plants and animals. Rainforests have lots of plants and animals that need looking after as they could end up dying forever. People like going swimming in coral reefs and sometimes they touch the coral and this could kill it.
SPECIMEN

J383/02 Mark Scheme June 20xx
11
Question Answer Marks Guidance
clear. 0 marks No response or no response worthy of credit.
SPECIMEN
J383/02 Mark Scheme June 20xx
12
Question Answer Marks Guidance
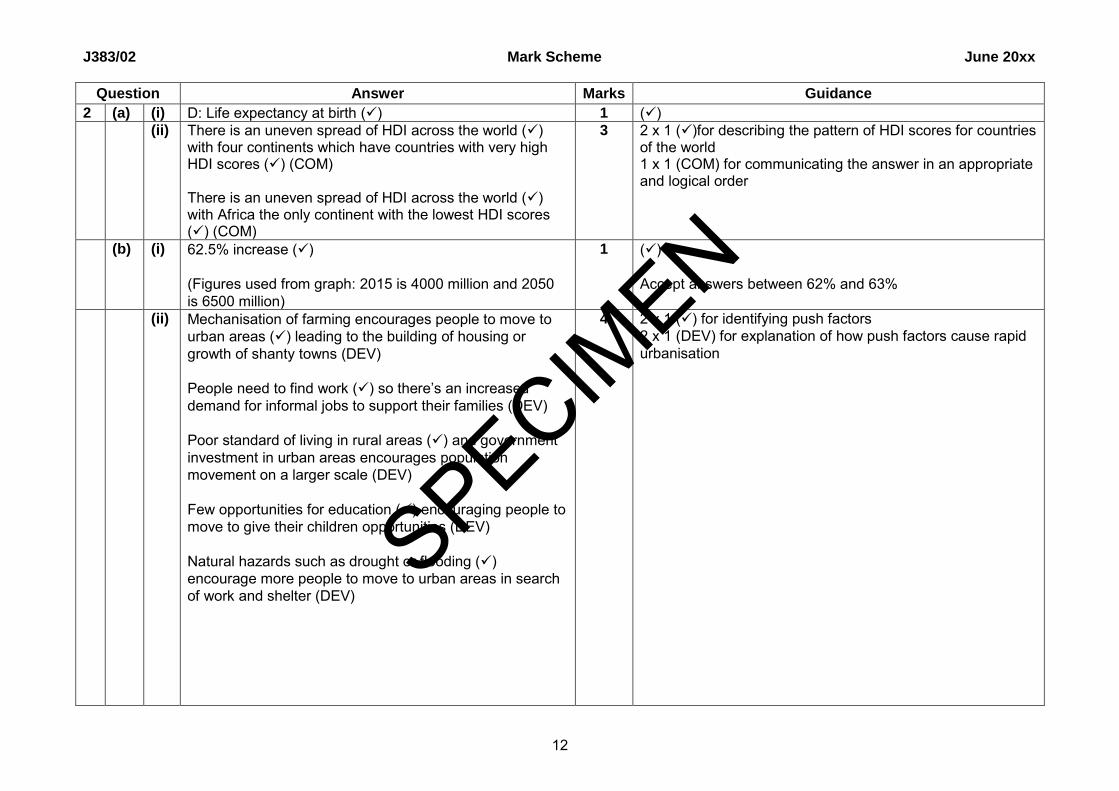
2 (a) (i) D: Life expectancy at birth () 1 () (ii) There is an uneven spread of HDI across the world ()
with four continents which have countries with very high HDI scores () (COM) There is an uneven spread of HDI across the world () with Africa the only continent with the lowest HDI scores () (COM)
3 2 x 1 ()for describing the pattern of HDI scores for countries of the world 1 x 1 (COM) for communicating the answer in an appropriate and logical order
(b) (i) 62.5% increase () (Figures used from graph: 2015 is 4000 million and 2050 is 6500 million)
1 () Accept answers between 62% and 63%
(ii) Mechanisation of farming encourages people to move to urban areas () leading to the building of housing or growth of shanty towns (DEV) People need to find work () so there’s an increased
demand for informal jobs to support their families (DEV) Poor standard of living in rural areas () and government investment in urban areas encourages population movement on a larger scale (DEV) Few opportunities for education () encouraging people to move to give their children opportunities (DEV) Natural hazards such as drought or flooding () encourage more people to move to urban areas in search of work and shelter (DEV)
4 2 x 1 () for identifying push factors 2 x 1 (DEV) for explanation of how push factors cause rapid urbanisation
SPECIMEN

J383/02 Mark Scheme June 20xx
13
Question Answer Marks Guidance
(c)*
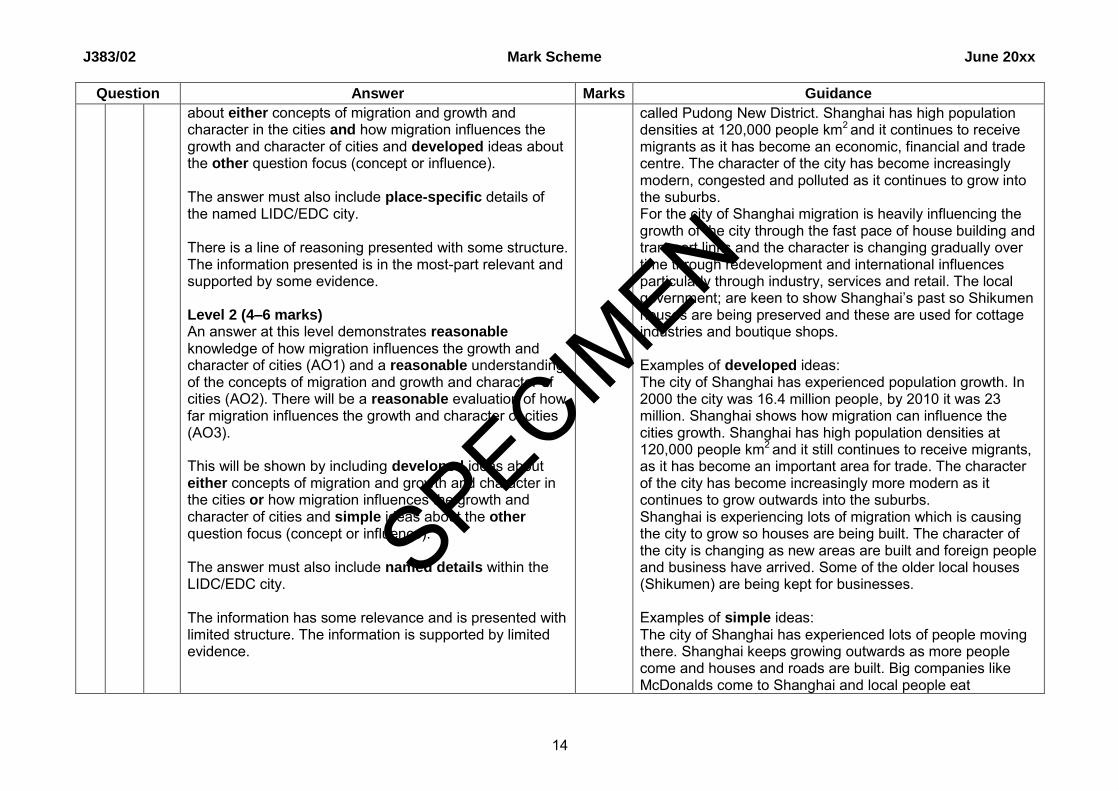
Case Study: a major LIDC or EDC city Level 4 (10–12 marks) An answer at this level demonstrates comprehensive knowledge of how migration influences the growth and character of cities (AO1) and a comprehensive understanding of the concepts of migration and growth and character of cities (AO2). There will be a comprehensive evaluation of how far migration influences the growth and character of cities (AO3). This will be shown by including well-developed ideas about the concepts of migration and growth and character in the cities and how migration influences the growth and character of cities. The answer must also include place-specific details for the named LIDC/EDC city. There is a well-developed line of reasoning which is clear and logically structured. The information presented is relevant and substantiated. Level 3 (7–9 marks) An answer at this level demonstrates thorough knowledge of how migration influences the growth and character of cities (AO1) and a thorough understanding of the concepts of migration and growth and character of cities (AO2). There will be a thorough evaluation of how far migration influences the growth and character of cities (AO3). This will be shown by including well-developed ideas
12
Case study will be marked using 4 levels: Indicative content Concept of migration can include international (immigration) as well as internal movements of people from within the country. Influence of migration could refer to rural to urban, urban to urban, or international migration. The influence of migration on the city’s growth and character could include:
Changes to the cities growth such as increased demand for housing, infrastructure investment and building as well as demand for services.
Impacts on the character of the city through architecture, housing, inequalities, consumerism and gentrification.
Globalisation of jobs, services and leisure activities Increased evidence of traffic congestion, pollution,
increased commuting and waste generated Impacts on the character of the city through
languages spoken, cultural activities and types of food
These ideas will depend upon the named major city chosen. Examples of well-developed ideas: The city of Shanghai has experienced significant population growth. In 2000 the city was 16.4 million people, by 2010 it was 23 million. Shanghai shows how high rates of internal and international migration can influence the cities growth. It has continued to grow and covers approximately 2,500sq miles, expanding east of the river in the 1990s, this area is
SPECIMEN
J383/02 Mark Scheme June 20xx
14
Question Answer Marks Guidance
about either concepts of migration and growth and character in the cities and how migration influences the growth and character of cities and developed ideas about the other question focus (concept or influence). The answer must also include place-specific details of the named LIDC/EDC city. There is a line of reasoning presented with some structure. The information presented is in the most-part relevant and supported by some evidence. Level 2 (4–6 marks) An answer at this level demonstrates reasonable knowledge of how migration influences the growth and character of cities (AO1) and a reasonable understanding of the concepts of migration and growth and character of cities (AO2). There will be a reasonable evaluation of how far migration influences the growth and character of cities (AO3). This will be shown by including developed ideas about either concepts of migration and growth and character in the cities or how migration influences the growth and character of cities and simple ideas about the other question focus (concept or influence). The answer must also include named details within the LIDC/EDC city. The information has some relevance and is presented with limited structure. The information is supported by limited evidence.
called Pudong New District. Shanghai has high population densities at 120,000 people km2 and it continues to receive migrants as it has become an economic, financial and trade centre. The character of the city has become increasingly modern, congested and polluted as it continues to grow into the suburbs. For the city of Shanghai migration is heavily influencing the growth of the city through the fast pace of house building and transport links and the character is changing gradually over time through redevelopment and international influences particularly through industry, services and retail. The local government; are keen to show Shanghai’s past so Shikumen houses are being preserved and these are used for cottage industries and boutique shops. Examples of developed ideas: The city of Shanghai has experienced population growth. In 2000 the city was 16.4 million people, by 2010 it was 23 million. Shanghai shows how migration can influence the cities growth. Shanghai has high population densities at 120,000 people km2 and it still continues to receive migrants, as it has become an important area for trade. The character of the city has become increasingly more modern as it continues to grow outwards into the suburbs. Shanghai is experiencing lots of migration which is causing the city to grow so houses are being built. The character of the city is changing as new areas are built and foreign people and business have arrived. Some of the older local houses (Shikumen) are being kept for businesses. Examples of simple ideas: The city of Shanghai has experienced lots of people moving there. Shanghai keeps growing outwards as more people come and houses and roads are built. Big companies like McDonalds come to Shanghai and local people eat
SPECIMEN

J383/02 Mark Scheme June 20xx
15
Question Answer Marks Guidance
Level 1 (1–3 marks) An answer at this level demonstrates basic knowledge of how migration influences the growth and character of cities (AO1) and a basic understanding of the concepts of migration and growth and character of cities (AO2). There will be a basic evaluation of how far migration influences the growth and character of cities (AO3). This will be shown by including simple ideas about either concepts of migration and growth and character in the cities or how migration influences the growth and character of cities. No developed points are made. The answer must also include a named area city within the LIDC/EDC. No developed points are made. The information is basic and communicated in an unstructured way. The information is supported by limited evidence and the relationship to the evidence may not be clear. 0 marks No response or no response worthy of credit.
differently. As there are lots of people now there are also lots of cars and this causes congestion on the roads and bad pollution in the air. The city keeps getting bigger with more people and they need to live somewhere. Also these people need jobs so there are new types of jobs. Some really old areas are looked after so people can see the past.
Spelling, punctuation and grammar and use of specialist terminology (SPaG) are assessed using the separate marking grid in Appendix 1.
3 SPECIMEN
J383/02 Mark Scheme June 20xx
16
Question Answer Marks Guidance
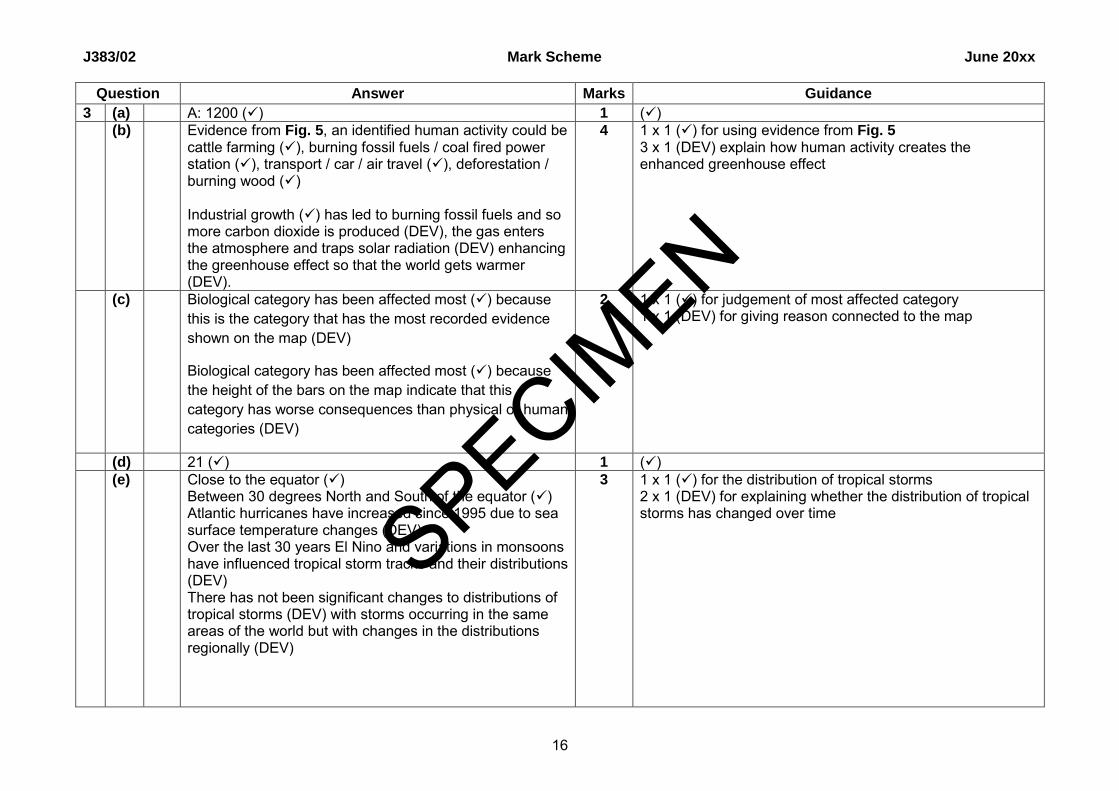
3 (a) A: 1200 () 1 () (b) Evidence from Fig. 5, an identified human activity could be
cattle farming (), burning fossil fuels / coal fired power station (), transport / car / air travel (), deforestation / burning wood () Industrial growth () has led to burning fossil fuels and so more carbon dioxide is produced (DEV), the gas enters the atmosphere and traps solar radiation (DEV) enhancing the greenhouse effect so that the world gets warmer (DEV).
4 1 x 1 () for using evidence from Fig. 5 3 x 1 (DEV) explain how human activity creates the enhanced greenhouse effect
(c) Biological category has been affected most () because this is the category that has the most recorded evidence shown on the map (DEV)
Biological category has been affected most () because the height of the bars on the map indicate that this category has worse consequences than physical or human categories (DEV)
2 1 x 1 () for judgement of most affected category 1 x 1 (DEV) for giving reason connected to the map
(d) 21 () 1 () (e) Close to the equator ()
Between 30 degrees North and South of the equator () Atlantic hurricanes have increased since 1995 due to sea surface temperature changes (DEV) Over the last 30 years El Nino and variations in monsoons have influenced tropical storm tracks and their distributions (DEV) There has not been significant changes to distributions of tropical storms (DEV) with storms occurring in the same areas of the world but with changes in the distributions regionally (DEV)
3 1 x 1 () for the distribution of tropical storms 2 x 1 (DEV) for explaining whether the distribution of tropical storms has changed over time SPECIMEN
J383/02 Mark Scheme June 20xx
17
Question Answer Marks Guidance
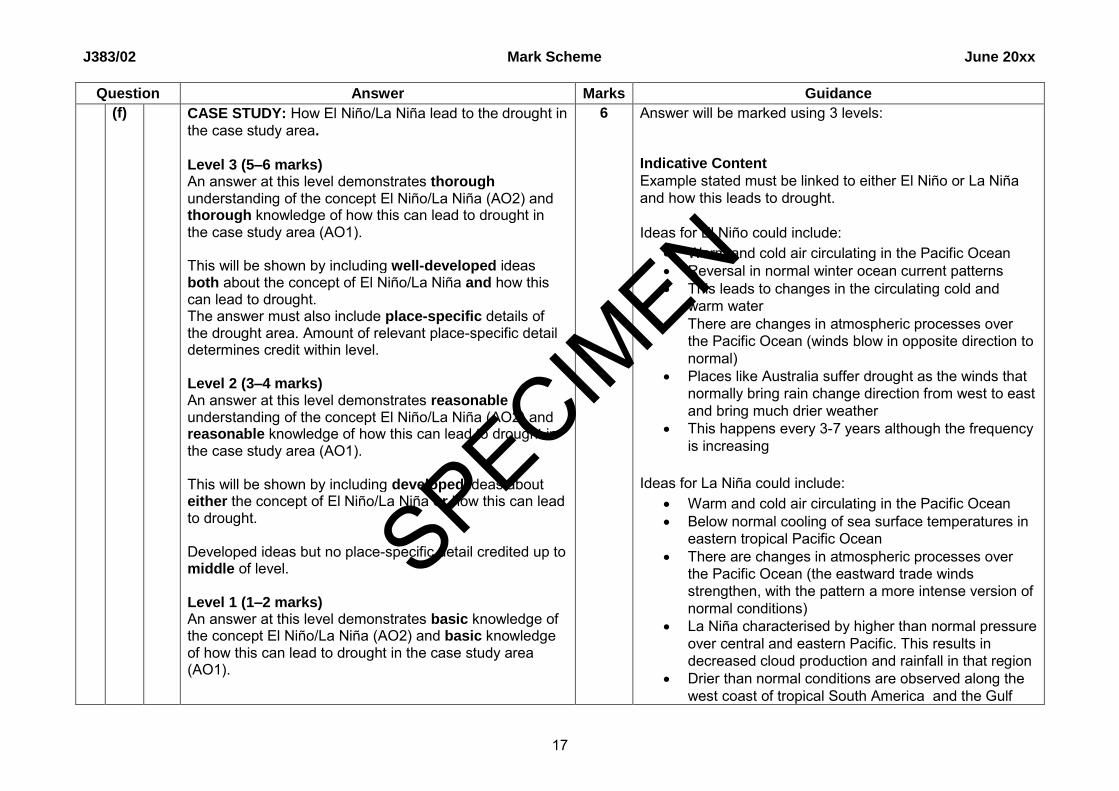
(f)
CASE STUDY: How El Niño/La Niña lead to the drought in the case study area.
Level 3 (5–6 marks) An answer at this level demonstrates thorough understanding of the concept El Niño/La Niña (AO2) and thorough knowledge of how this can lead to drought in the case study area (AO1). This will be shown by including well-developed ideas both about the concept of El Niño/La Niña and how this can lead to drought. The answer must also include place-specific details of the drought area. Amount of relevant place-specific detail determines credit within level. Level 2 (3–4 marks) An answer at this level demonstrates reasonable understanding of the concept El Niño/La Niña (AO2) and reasonable knowledge of how this can lead to drought in the case study area (AO1). This will be shown by including developed ideas about either the concept of El Niño/La Niña or how this can lead to drought. Developed ideas but no place-specific detail credited up to middle of level. Level 1 (1–2 marks) An answer at this level demonstrates basic knowledge of the concept El Niño/La Niña (AO2) and basic knowledge of how this can lead to drought in the case study area (AO1).
6 Answer will be marked using 3 levels: Indicative Content
Example stated must be linked to either El Niño or La Niña and how this leads to drought. Ideas for El Niño could include:
Warm and cold air circulating in the Pacific Ocean Reversal in normal winter ocean current patterns This leads to changes in the circulating cold and
warm water There are changes in atmospheric processes over
the Pacific Ocean (winds blow in opposite direction to normal)
Places like Australia suffer drought as the winds that normally bring rain change direction from west to east and bring much drier weather
This happens every 3-7 years although the frequency is increasing
Ideas for La Niña could include: Warm and cold air circulating in the Pacific Ocean Below normal cooling of sea surface temperatures in
eastern tropical Pacific Ocean There are changes in atmospheric processes over
the Pacific Ocean (the eastward trade winds strengthen, with the pattern a more intense version of normal conditions)
La Niña characterised by higher than normal pressure over central and eastern Pacific. This results in decreased cloud production and rainfall in that region
Drier than normal conditions are observed along the west coast of tropical South America and the Gulf
SPECIMEN

J383/02 Mark Scheme June 20xx
18
Question Answer Marks Guidance
This will be shown by including simple ideas about the concept of El Niño/La Niña or how this can lead to drought. Simple ideas or appropriate named example only credited at bottom of level. 0 marks No response or no response worthy of credit.
Coast of the United States, which can lead to drought Example of well-developed ideas: Australia is influenced by El Niño once every 5–7 years, although this is becoming more frequent. El Niño caused drought from 2005-2007. The trade winds usually blow east to west but El Niño caused them to blow the opposite way and so by the time they reach the east coast they are very dry and bring drought conditions to areas like New South Wales. Example of developed ideas: Australia is influenced by El Niño once every 5–7 years, this caused drought from 2005-2007. The winds usually blow east to west but El Niño caused them to blow the opposite way. By the time they reach the east coast they are very dry and bring drought conditions to the south east.
Examples of simple ideas: Australia is very dry once every 5–7 years, this is happening more. There was no rain between 2005 and 2007. The winds changed direction and didn’t bring rain so the east
coast was very dry.
SPECIMEN

J383/02 Mark Scheme June 20xx
19
APPENDIX 1
Spelling, punctuation and grammar and the use of specialist terminology (SPaG) assessment grid*
High performance 3 marks
Learners spell and punctuate with consistent accuracy Learners use rules of grammar with effective control of meaning overall Learners use a wide range of specialist terms as appropriate
Intermediate performance 2 marks
Learners spell and punctuate with considerable accuracy Learners use rules of grammar with general control of meaning overall Learners use a good range of specialist terms as appropriate
Threshold performance 1 mark
Learners spell and punctuate with reasonable accuracy Learners use rules of grammar with some control of meaning and any errors do not significantly hinder overall Learners use a limited range of specialist terms as appropriate
0 marks
The learner writes nothing The learner’s response does not relate to the question The learner’s achievement in SPaG does not reach the threshold performance level, for example errors in spelling, punctuation and
grammar severely hinder meaning
SPECIMEN
J383/02 Mark Scheme June 20xx
20
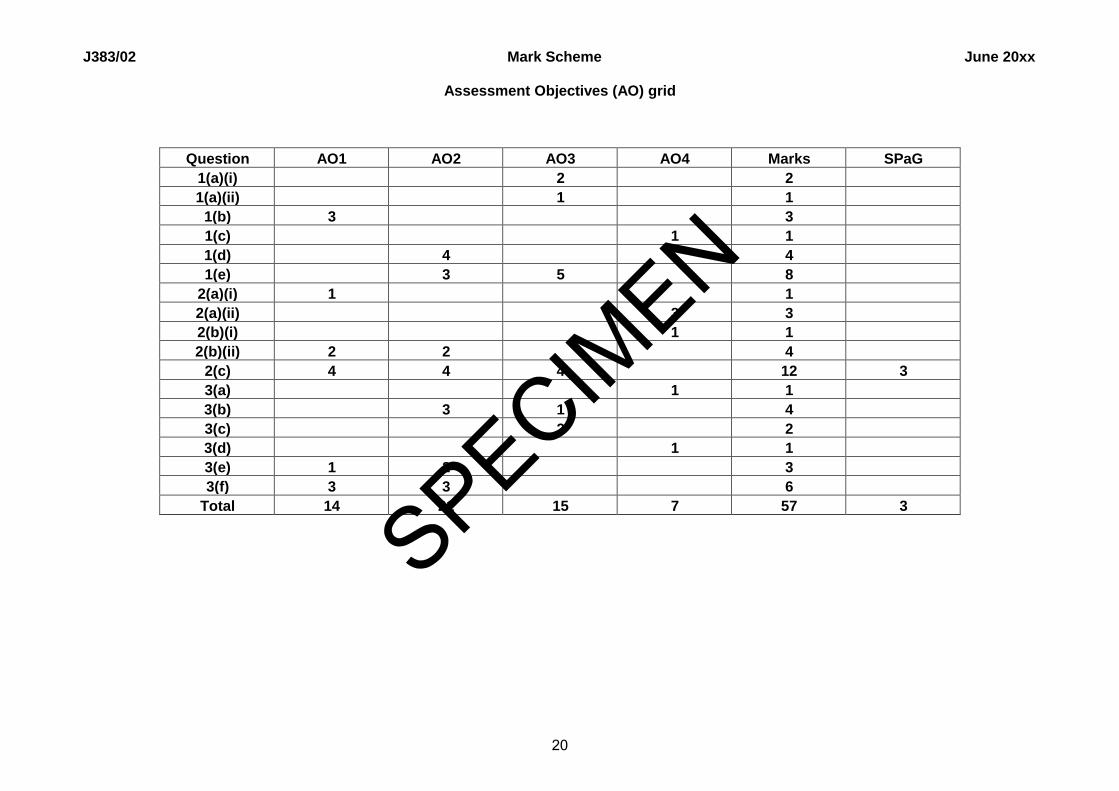
Assessment Objectives (AO) grid
Question AO1 AO2 AO3 AO4 Marks SPaG
1(a)(i) 2 2
1(a)(ii) 1 1
1(b) 3 3
1(c) 1 1
1(d) 4 4
1(e) 3 5 8
2(a)(i) 1 1
2(a)(ii) 3 3
2(b)(i) 1 1
2(b)(ii) 2 2 4
2(c) 4 4 4 12 3
3(a) 1 1
3(b) 3 1 4
3(c) 2 2
3(d) 1 1
3(e) 1 2 3
3(f) 3 3 6
Total 14 21 15 7 57 3
SPECIMEN


![[aviation] - [Squadron-Signal] - [Walk Around n°02] - A6_Walkaround](https://img.dokumen.tips/doc/110x75/551ae0734a795911038b4b8d/aviation-squadron-signal-walk-around-n02-a6walkaround.jpg)

![[Walk Around n°02] - Grumman a-6 Intruder](https://img.dokumen.tips/doc/110x75/5571f21a49795947648c2929/walk-around-n02-grumman-a-6-intruder.jpg)


