Embed Size (px)
Citation preview
iv
INVESTIGATING THE PERFORMANCE OF OKRA - NATURAL MUCILAGECOMPOUNDS AS FLOW IMPROVER IN PIPELINES CARRYING
LIQUID – SOLID SOLUTION
MOHD AZIMIE BIN AHMAD
Thesis submitted in fulfilment of requirementsfor the award of degree of
Master of Engineering in Chemical Engineering
Faculty of Chemical and Natural Resources EngineeringUNIVERSITI MALAYSIA PAHANG
DECEMBER 2012
vi
ABSTRACT
During the transportation of liquids through pipelines, most of the pumping power will belost or dissipated due to the turbulent mode these liquid are transported within. The additionof viscoelastic polymeric additives to the main flow inside the pipeline was one of thecommon solutions for such problem. Most of these additives (polymers) are artificial andnot environmentally friendly and it can cause dramatic changes in the apparent physicalproperties of the transported liquid. The present work introduces a new soluble andenvironmentally friendly drag reducing agent extracted from the okra pods. Also, thepresent work introduces two, new insoluble drag reducing agents from natural resources(paddy husk and coconut meat husk). In order to achieve the objectives of this study, anexperimental rig consists of different pipe diameters at 0.0127, 0.025 and 0.038 m internaldiameter (ID) and section length at 0.5, 1.0, 1.5 and 2.0 m of galvanized iron pipes wasbuilt as closed loop circulation system. The particle size of suspended fibers (500 and 800µm) was prepared using Fritsch Sieve Analysis System technique to enhance thecontribution of the findings. The concentrations for suspended fibers are 100, 300 and 500ppm and okra mucilage concentration at 100, 300, 500, 700 and 1000 ppm. From the dragreduction analysis, the okra-natural mucilage achieved 71 % drag reduction operated at Reequal to 11788 in pipe size equal to 0.0127 m ID at 1.5 m testing length, at 1000 ppmconcentration and based on this results, okra-natural mucilage was marked as an efficientdrag reducing agent compared to the suspended fibers. Besides, the suspended fibers namedpaddy husk fibers shows excellent performance as drag reducer which the maximum dragreduction achieved is 32 % operated at Re equal to 35363, particle size at 500 µm,concentration at 500 ppm while coconut meat fibers capable to reduce the drag up to 42 %operated at Re equal to 35363, at the same concentration and particle size of paddy huskfibers. These results take place in pipe diameter of 0.025 m and at 1 m testing length. Thecombination of okra-natural mucilage at 1000 ppm with paddy husk and coconut meatfibers at the optimum condition (particle size 500 µm, concentration 500 ppm) haveproduce the 60% and 43% drag reduction at Re equal to 11788 for coconut meat fibers andRe equal to 35363 for coconut meat husk in pipe size equal to 0.0127 m ID at 1.5 m testinglength. The highest drag reduction percentage achieved in this research is 71% whichmeans about 71% of power saving could be achieved. The formation of long carbon chainin natural polymers and interaction of fibers suspension among themselves in turbulentflow were identified as sources of drag reduction to occur. The statistical drag reductioncorrelation was modelled with experimental data using STATISTICA software. As aconclusion, new environmentally friendly drag reducing agents were successfullyintroduced to replace the existing additives used commercially and its effectiveness wasproven in improving the flow.
vii
ABSTRAK
Semasa bendalir diangkut di dalam sistem perpaipan, kebanyakan tenaga mengepam akanhilang kerana gelora apabila bendalir mengalir. Penambahan bahan polimerik elastik kedalam bendalir mengalir menjadi amalan biasa. Kebanyakan polimer ini tidak mesra alamdan semulajadi dan boleh mengubah sifat fizikal bendalir. Kajian semasa inimengetengahkan satu bahan terlarut dan mesra alam terbaru diekstrak dari buah okra.Kajian ini juga memperkenalkan dua bahan tidak terlarut baru dari sumber semulajadi(hampas padi dan isi kelapa). Bagi mencapai objektif utama kajian ini,sebuah sistemrangkaian paip galvani tertutup didirikan terdiri dari tiga saiz paip yang berbeza iaitu pada0.0127, 0.025 and 0.038 m diameter dalam (ID) pada panjang paip terdiri dari 0.5, 1.0, 1.5dan 2.0 meter. Bagi memastikan saiz partikulat yang tepat (500 and 800 µm), teknik ayakanautomatik menggunakan “Fritsch Sieve Analysis System” telah dijalankan. Kepekatanbahan terampai digunakan adalah 100, 300 dan 500 ppm manakala untuk lendir okrakepekatan bahan adalah 100, 300, 500, 700 dan 1000 ppm. Dari keputusan analisispengurangan seretan bendalir okra semulajadi berjaya mengurangkan seretan sehingga 71%pada Re nombor bendalir bersamaan 11788 pada paip saiz 0.0127 meter diameter dalamdan panjang paip pada 1.5 meter pada kepekatan 1000 ppm, bendalir okra semulajadi jelasadalah DRA yang paling efisien dibandingkan dengan bahan uji yang lain. Di samping itufiber yang terampai dikenali sebagai hampas padi menunjukkan prestasi bagimengurangkan seretan dalam paip. Pengurangan maksimum seretan dicatatkan 32% padaketika Re bersamaan 35363, saiz partikulat 500 µm, kepekatan 500 ppm dan juga serbuk isikelapa turut berpotensi mengurangkan seretan sehingg 42 % pada Re bersamaan 35363pada kepekatan dan saiz partikulat sama dengan ujikaji hampas padi. Kedua –duakeputusan ini direkodkan pada paip saiz 0.025 meter dan panjang paip pada 1 meter. Hasilcsmpuran antara bendalir okra semulajadi pada kepekatan optimum 1000 ppm denganserbuk hampas padi dan isi kelapa (500 µm, 500 ppm) telah memperolehi keputusanpengurangan seretan sebanyak 60 % pada Re 11788, 43 % pada Re 35363 pada paip saiz0.0127 meter diameter dalam dan panjang paip pada 1.5 meter. Peratus penguranganseretan yang tertinggi adalah 71% bermaksud sebanyak 71% penjimatan tenaga dapatdijana. Pembentukan rantaian molekul kimia bagi bahan polimer semulajadi okra dan jugainteraksi antara fiber di dalam paip telah dikenal pasti sebagai punca pengurangan seretan.Kolerasi statistik pengurangan seretan telah dimodelkan menggunakan perisian“STATISTICA” dengan data-data dari eksperimen. Kesimpulannya, ejen-ejenmengurangkan seretan yang baru dan mesra alam telah berjaya diperkenalkan untukmenggantikan bahan tambah yang sedia ada dan digunakan secara komersil disampingkeberkesanannya untuk meningkatkan aliran telah dibuktikan melalui eksperimen ini.
viii
TABLE OF CONTENTS
Page
SUPERVISOR’S DECLARATION ii
STUDENT’S DECLARATION iii
DEDICATION iv
ACKNOWLEDGEMENTS v
ABSTRACT vi
ABSTRAK vii
TABLE OF CONTENTS viii
LIST OF TABLES xiii
LIST OF FIGURES xiv
LIST OF SYMBOLS xix
LIST OF ABBREVIATIONS xx
CHAPTER 1 INTRODUCTION
1.1 Background 1
1.2 Problem Statement 2
1.3 Research Objectives 3
1.4 Scopes of Research 4
1.5 Thesis Outline 5
ix
CHAPTER 2 LITERATURE REVIEW
2.1 Introduction 6
2.2 Liquids Flow In Pipelines 7
2.3 Energy Dissipation In Pipelines 9
2.4 Turbulent Eddies 10
2.5 Drag Reduction 12
2.6 Viscoelasticity 14
2.7 Drag Reducing Agents 15
2.7.1 Polymeric Drag Reducing Agents 15
2.7.2 Surfactant Drag Reducing Agents 19
2.7.3 Drag reduction with Fiber Particles 24
2.8 Drag Reduction Mechanism 29
2.8.1 Lumley Theory 29
2.8.2 Hinch Theory 30
2.8.3 Landahl Theory 31
2.8.4 Yo – Yo Theory 32
2.8.5 De Gennes Theory 32
2.8.6 Bewersdorff Theory 33
2.9 Commercial Applications 34
CHAPTER 3 METHODOLOGY
3.1 Introduction 37
3.2 Liquid Circulation System 38
3.3 Materials Investigated 44
3.3.1 Okra-Natural mucilage 44
3.3.2 Paddy Husk Fiber 49
3.3.3 Coconut Meat Fiber 52
x
3.4 Transported Liquid 54
3.5 Solution Preparation 54
3.6 Experimental Variables 55
3.7 Experimental Procedure 56
3.8 Experimental Calculations 60
CHAPTER 4 RESULTS AND DISCUSSION
4.1 Circulation System Verification 624.2 Drag Reduction Ability of Natural Mucilage 64
4.2.1 Effects of Re Numbers on Percentage of Drag Reduction 64
4.2.2 Effects of Addition Concentrations on Percentage ofDrag Reduction
68
4.2.3 Effect of Pipe Diameter to Percentage of DragReduction
71
4.2.4 Effects of Pipe Length on the Percentage of DragReduction
73
4.3 Drag Reduction Ability of Suspended Fibers 76
4.3.1 Effect of Reynolds Number (Re) on Percentage of Drag
Reduction (%Dr) of Paddy Husk and Coconut Meat
Husk
76
4.3.2 Effects of Additive Concentrations on Percentage of Drag
Reduction of Paddy Husk and Coconut Meat Husk
82
4.3.3 Effects of Fiber Sizes on Percentage of Drag Reduction
of Paddy Husk and Coconut Meat Husk
87
4.4 Comparison of Drag Reduction Performance 92
4.5 Numerical Model (Correlation by Statistica) 100
4.6 Mechanism 107
xi
CHAPTER 5 CONCLUSION AND RECOMMENDATIONS
5.1 Drag Reducing Agent (DRA) Performance 109
5.2 Recommendations 110
REFERENCES 111
APPENDICES
A1 Weight and concentration of okra-natural mucilage for experiment 116
A2 Weight and concentration of fiber suspension for experiment 117
A3 Weight and concentration of fibers and okra-natural mucilagemixture
118
B1 Back view of experimental rig 119
B2 Isometric view of experimental rig 120
C1 Pressure drop reading and experimental system verification forpipe scale (L/D) equal to 118
121
C2 Pressure drop reading and experimental system verification forpipe scale (L/D) equal to 60
123
C3 Pressure drop reading and experimental system verification forpipe scale (L/D) equal to 39
125
D1 Pressure drop obtained using okra-natural mucilage 127
D2 Drag reduction percentage obtained using okra-natural mucilage 128
E1 Pressure drop obtained using paddy husk fibers 130
E2 Drag reduction percentage obtained using paddy husk fibers 131
F1 Pressure drop obtained using coconut meat fibers 132
F2 Drag reduction percentage obtained using coconut meat fibers 133
G1 Drag reduction percentage obtained using mixture solution(paddy husk + okra-natural mucilage)
134
G2 Drag reduction percentage obtained using mixture solution(coconut meat husk + okra-natural mucilage)
135
H1 Drag reduction percentage comparison of okra-natural mucilage,paddy husk, coconut meat husk and mixture solution at pipediameter equal to 0.0127 m and testing section length at 1.5 m
136
H2 Drag reduction percentage comparison of okra-natural mucilage,paddy husk, coconut meat husk and mixture solution at pipediameter equal to 0.025 m and testing section length at 1.0 m
137
xii
H3 Drag reduction percentage comparison of okra-natural mucilage,paddy husk, coconut meat husk and mixture solution at pipediameter equal to 0.025 m and testing section length at 1.5 m
138
H4 Drag reduction percentage comparison of okra-natural mucilage,paddy husk, coconut meat husk and mixture solution at pipediameter equal to 0.038 m and testing section length at 1.5 m
139
I1 Steps for statistical correlation estimation 140
J1 List of publications and achievements 144
xiii
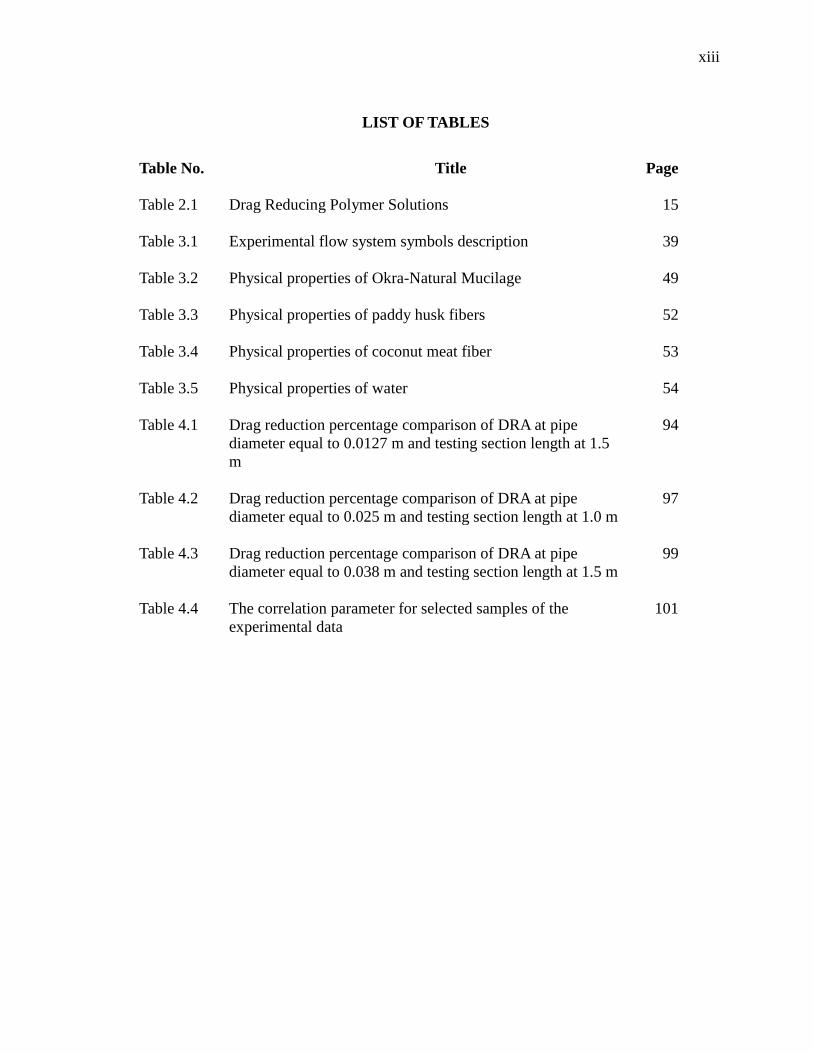
LIST OF TABLES
Table No. Title Page
Table 2.1 Drag Reducing Polymer Solutions 15
Table 3.1 Experimental flow system symbols description 39
Table 3.2 Physical properties of Okra-Natural Mucilage 49
Table 3.3 Physical properties of paddy husk fibers 52
Table 3.4 Physical properties of coconut meat fiber 53
Table 3.5 Physical properties of water 54
Table 4.1 Drag reduction percentage comparison of DRA at pipediameter equal to 0.0127 m and testing section length at 1.5m
94
Table 4.2 Drag reduction percentage comparison of DRA at pipediameter equal to 0.025 m and testing section length at 1.0 m
97
Table 4.3 Drag reduction percentage comparison of DRA at pipediameter equal to 0.038 m and testing section length at 1.5 m
99
Table 4.4 The correlation parameter for selected samples of theexperimental data
101
xiv
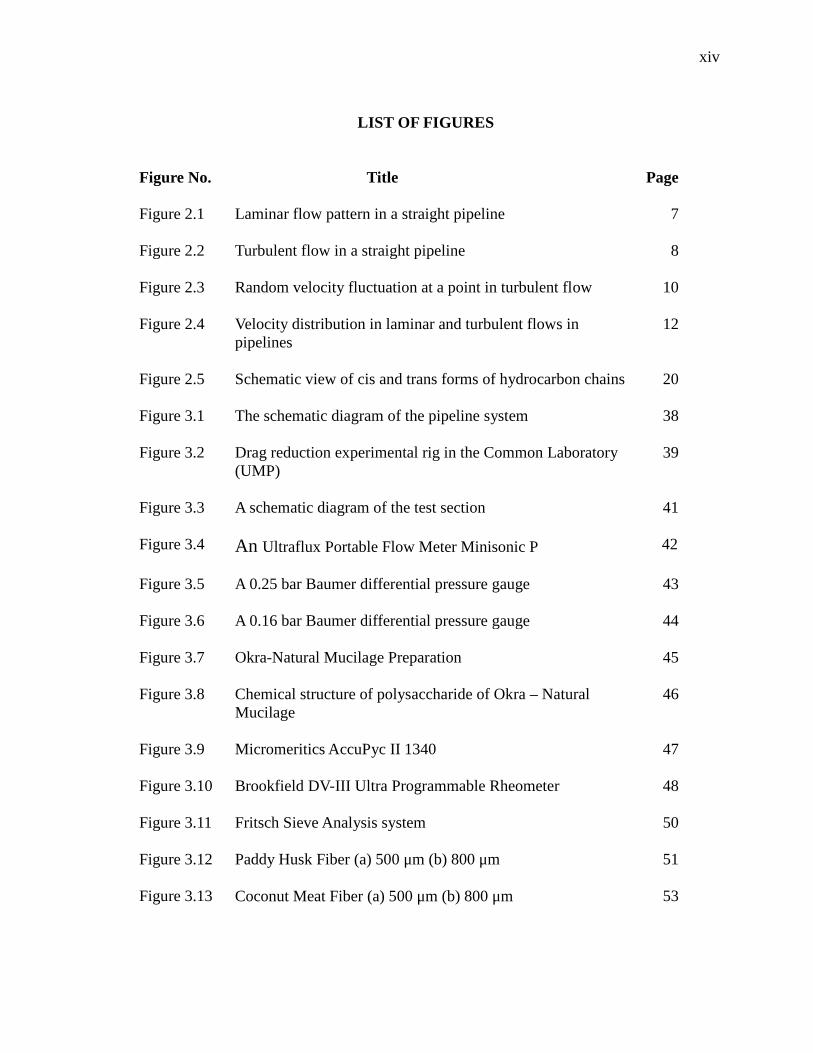
LIST OF FIGURES
Figure No. Title Page
Figure 2.1 Laminar flow pattern in a straight pipeline 7
Figure 2.2 Turbulent flow in a straight pipeline 8
Figure 2.3 Random velocity fluctuation at a point in turbulent flow 10
Figure 2.4 Velocity distribution in laminar and turbulent flows inpipelines
12
Figure 2.5 Schematic view of cis and trans forms of hydrocarbon chains 20
Figure 3.1 The schematic diagram of the pipeline system 38
Figure 3.2 Drag reduction experimental rig in the Common Laboratory(UMP)
39
Figure 3.3 A schematic diagram of the test section 41
Figure 3.4 An Ultraflux Portable Flow Meter Minisonic P 42
Figure 3.5 A 0.25 bar Baumer differential pressure gauge 43
Figure 3.6 A 0.16 bar Baumer differential pressure gauge 44
Figure 3.7 Okra-Natural Mucilage Preparation 45
Figure 3.8 Chemical structure of polysaccharide of Okra – NaturalMucilage
46
Figure 3.9 Micromeritics AccuPyc II 1340 47
Figure 3.10 Brookfield DV-III Ultra Programmable Rheometer 48
Figure 3.11 Fritsch Sieve Analysis system 50
Figure 3.12 Paddy Husk Fiber (a) 500 μm (b) 800 μm 51
Figure 3.13 Coconut Meat Fiber (a) 500 μm (b) 800 μm 53
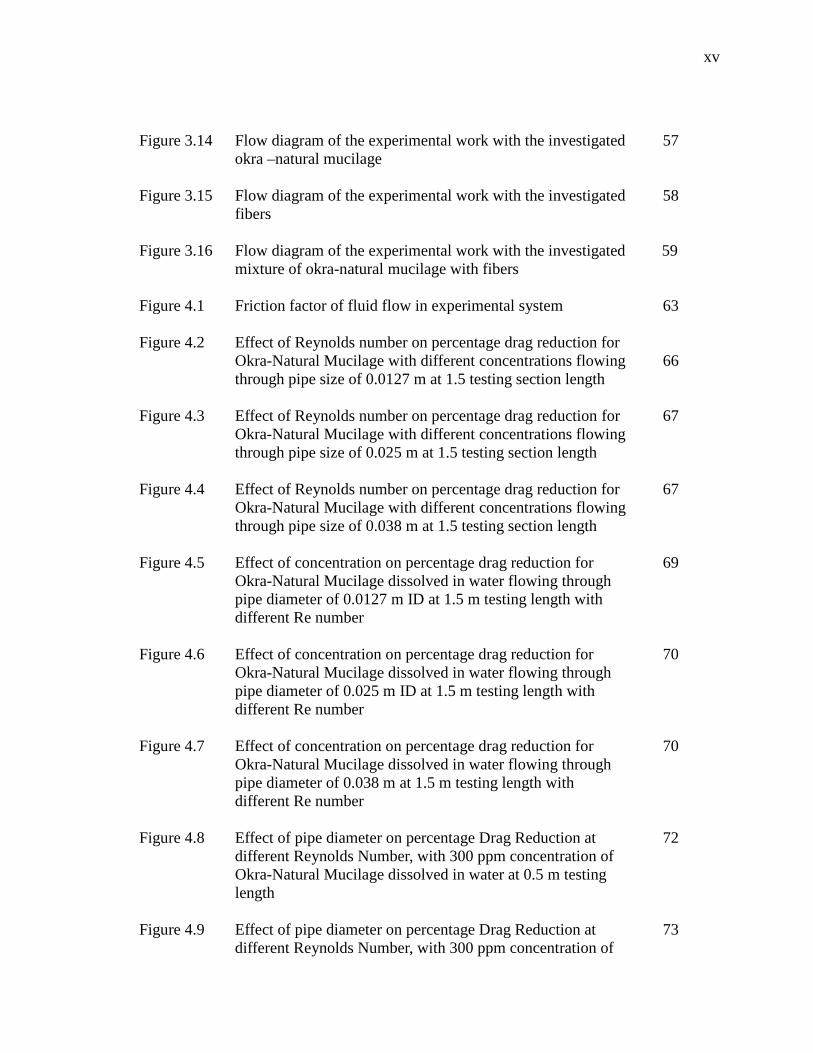
xv
Figure 3.14 Flow diagram of the experimental work with the investigatedokra –natural mucilage
57
Figure 3.15 Flow diagram of the experimental work with the investigatedfibers
58
Figure 3.16 Flow diagram of the experimental work with the investigatedmixture of okra-natural mucilage with fibers
59
Figure 4.1 Friction factor of fluid flow in experimental system 63
Figure 4.2 Effect of Reynolds number on percentage drag reduction forOkra-Natural Mucilage with different concentrations flowingthrough pipe size of 0.0127 m at 1.5 testing section length
66
Figure 4.3 Effect of Reynolds number on percentage drag reduction forOkra-Natural Mucilage with different concentrations flowingthrough pipe size of 0.025 m at 1.5 testing section length
67
Figure 4.4 Effect of Reynolds number on percentage drag reduction forOkra-Natural Mucilage with different concentrations flowingthrough pipe size of 0.038 m at 1.5 testing section length
67
Figure 4.5 Effect of concentration on percentage drag reduction forOkra-Natural Mucilage dissolved in water flowing throughpipe diameter of 0.0127 m ID at 1.5 m testing length withdifferent Re number
69
Figure 4.6 Effect of concentration on percentage drag reduction forOkra-Natural Mucilage dissolved in water flowing throughpipe diameter of 0.025 m ID at 1.5 m testing length withdifferent Re number
70
Figure 4.7 Effect of concentration on percentage drag reduction forOkra-Natural Mucilage dissolved in water flowing throughpipe diameter of 0.038 m at 1.5 m testing length withdifferent Re number
70
Figure 4.8 Effect of pipe diameter on percentage Drag Reduction atdifferent Reynolds Number, with 300 ppm concentration ofOkra-Natural Mucilage dissolved in water at 0.5 m testinglength
72
Figure 4.9 Effect of pipe diameter on percentage Drag Reduction atdifferent Reynolds Number, with 300 ppm concentration of
73
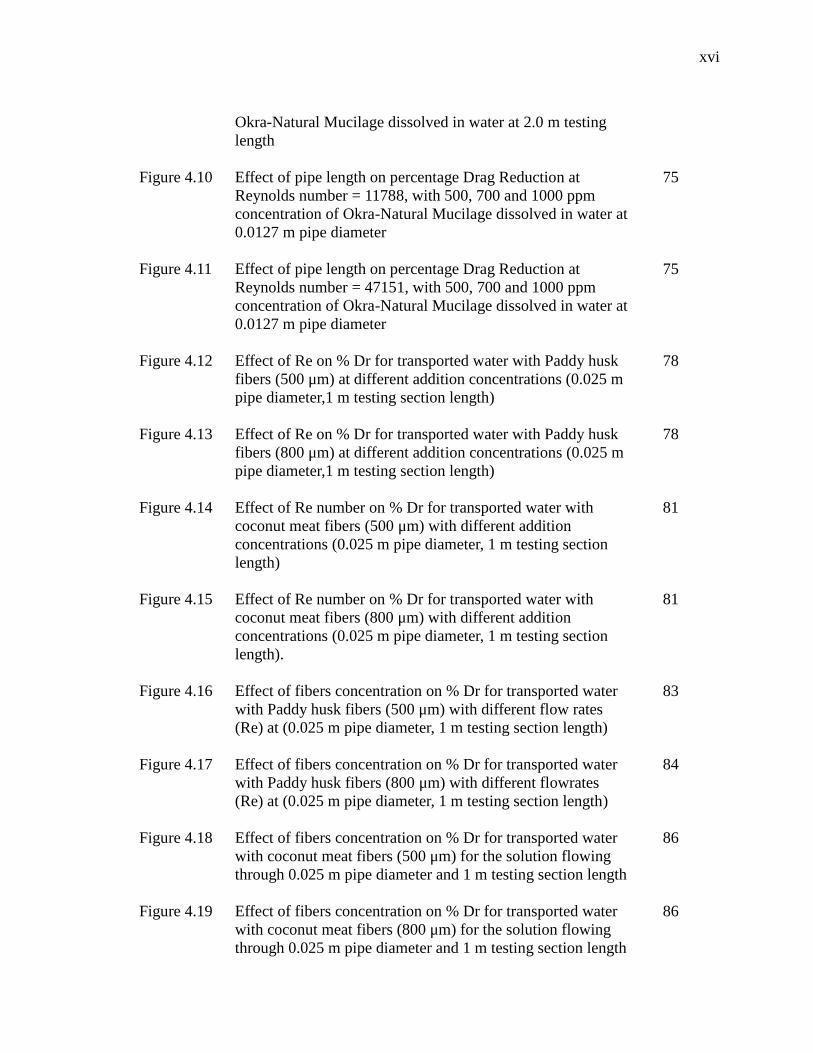
xvi
Okra-Natural Mucilage dissolved in water at 2.0 m testinglength
Figure 4.10 Effect of pipe length on percentage Drag Reduction atReynolds number = 11788, with 500, 700 and 1000 ppmconcentration of Okra-Natural Mucilage dissolved in water at0.0127 m pipe diameter
75
Figure 4.11 Effect of pipe length on percentage Drag Reduction atReynolds number = 47151, with 500, 700 and 1000 ppmconcentration of Okra-Natural Mucilage dissolved in water at0.0127 m pipe diameter
75
Figure 4.12 Effect of Re on % Dr for transported water with Paddy huskfibers (500 μm) at different addition concentrations (0.025 mpipe diameter,1 m testing section length)
78
Figure 4.13 Effect of Re on % Dr for transported water with Paddy huskfibers (800 μm) at different addition concentrations (0.025 mpipe diameter,1 m testing section length)
78
Figure 4.14 Effect of Re number on % Dr for transported water withcoconut meat fibers (500 μm) with different additionconcentrations (0.025 m pipe diameter, 1 m testing sectionlength)
81
Figure 4.15 Effect of Re number on % Dr for transported water withcoconut meat fibers (800 μm) with different additionconcentrations (0.025 m pipe diameter, 1 m testing sectionlength).
81
Figure 4.16 Effect of fibers concentration on % Dr for transported waterwith Paddy husk fibers (500 μm) with different flow rates(Re) at (0.025 m pipe diameter, 1 m testing section length)
83
Figure 4.17 Effect of fibers concentration on % Dr for transported waterwith Paddy husk fibers (800 μm) with different flowrates(Re) at (0.025 m pipe diameter, 1 m testing section length)
84
Figure 4.18 Effect of fibers concentration on % Dr for transported waterwith coconut meat fibers (500 μm) for the solution flowingthrough 0.025 m pipe diameter and 1 m testing section length
86
Figure 4.19 Effect of fibers concentration on % Dr for transported waterwith coconut meat fibers (800 μm) for the solution flowingthrough 0.025 m pipe diameter and 1 m testing section length
86
xvii
Figure 4.20 Effect of the particle diameter (500 and 800 μm) on the % Drfor transported water with paddy husk fibers with different Reat 500 ppm using (0.0127 m pipe diameter, 1 m testingsection length)
88
Figure 4.21 Effect of the particle diameter (500 and 800 μm) on the % Drfor transported water with paddy husk fibers with different Reat 500 ppm using (0.025 m pipe diameter, 1 m testing sectionlength)
88
Figure 4.22 Effect of the particle diameter (500 and 800 μm) on the % Drfor transported water with paddy husk fibers with different Reat 500 ppm using (0.038 m pipe diameter, 1 m testing sectionlength)
89
Figure 4.23 Effect of the particle diameter (500 and 800 μm) on the % Drfor transported water with coconut meat fibers with differentRe at 500 ppm using (0.0127 m pipe diameter, 1 m testingsection length)
90
Figure 4.24 Effect of the particle diameter (500 and 800 μm) on the % Drfor transported water with coconut meat fibers with differentRe at 500 ppm using (0.025 m pipe diameter, 1 m testingsection length).
91
Figure 4.25 Effect of the particle diameter (500 and 800 μm) on the % Drfor transported water with coconut meat fibers with differentRe at 500 ppm using (0.038 m pipe diameter, 1 m testingsection length)
91
Figure 4.26 Drag reduction performance by multiple drag reducing agentin pipe diameter equal to 0.0127 m and testing section lengthat 1.5 m
94
Figure 4.27 Drag reduction performance by multiple drag reducing agentin pipe diameter equal to 0.025 m and testing section lengthat 1 m.
97
Figure 4.28 Drag reduction performance by multiple drag reducing agentin pipe diameter equal to 0.038 m and testing section lengthat 1.5 m
99
Figure 4.29 Predicted versus observed values for the 100 ppm okra-natural mucilage flowing through 0.0127 m I.D pipe diameterand 1.0 m testing section length
102
xviii
Figure 4.30 versus observed values for the 700 ppm okra- naturalmucilage flowing through 0.025 m I.D pipe diameter and 1.5m testing section length
102
Figure 4.31 Predicted versus observed values for the 100 ppm okra-natural mucilage flowing through 0.0381 m I.D pipe diameterand 1.5 m testing section length
103
Figure 4.32 Predicted versus observed values for the 300 ppm okra-natural mucilage flowing through 0.0381 m I.D pipe diameterand 1.5 m testing section length
103
Figure 4.33 Predicted versus observed values for the 500 ppm okra-natural mucilage flowing through 0.0381 m I.D pipe diameterand 1.5 m testing section length
104
Figure 4.34 Predicted versus observed values for the 1000 ppm okra-natural mucilage flowing through 0.0254 m I.D pipe diameterand 1.5 m testing section length
104
Figure 4.35 Predicted versus observed values for the 100 ppm of 500 µmpaddy husk fiber flowing through 0.0381 m I.D pipe diameterand 0.5 m testing section length
105
Figure 4.36 Predicted versus observed values for the 300 ppm of 500 µmpaddy husk fiber flowing through 0.0127 m I.D pipe diameterand 1.5 m testing section length
105
Figure 4.37 Predicted versus observed values for the 100 ppm of 500 µmcoconut meat fibers flowing through 0.0381 m I.D pipediameter and 1.5 m testing section length
106
xix
LIST OF SYMBOLS
ar constant
b constant
%Dr Percentage of drag reduction
A Pipe cross section area (m2)
C Concentration (ppm)
f Friction factor
L Length (m)
Q Volumetric flow rate (m3.s-1)
v Average velocity (m.s-1)
ΔP Pressure drop (Bar)
µ Viscosity (kg.m-1.s-1)
Ρ Density (kg.m-3)
ppm part per million
D Diameter
Re Reynold number
xx
LIST OF ABBREVIATIONS
DR Drag Reduction
DRA Drag Reduction Agent
PAA Poly(Acrylic) Acid
PEO Poly(Ethylene Oxide)
MW Molecular Weight
DRP Drag Reducing Polymer
PNVF Poly(N-Ninylformamide)
PDRA Polymer Drag Reducing Agent
CTAB Cetryltrimethylammonium Bromide
ODEAO Oleyldihydroxyethylamineoxide
TTAB n-tetradecyltrimethylammoniumbromide
SANS Small – Angle – Neutron - Scattering
TME Trimethylolethane
SDS Sodium Dodecyl Sulfate
CTAC hexadecyltrimethylammonium chloride
NaSal sodium salicylate
APG Alkyl Polyglucoside
SIS Shear-Induced Structure
PTEN PT Exspan Nusantara
CHAPTER 1
INTRODUCTION
1.1 BACKGROUND
Installations of supporting pumping stations along the piping network have been the
existing method used to overcome the pumping power dissipation during the transportation
of liquids, gases and multi-phase systems. Such solution did overcome the existing
problem, but in the same time, it adds a new problem to the industrial application such as
the cost of operation, maintenance and the shutdown of the whole pipelines when any
problem in any of the supporting pumping stations occur. Another more practical solution
was needed.
Since the early forties of the past century, it was discovered that the addition of
minute amounts of additives such as polymers, surfactants or rigid flexible particles can
result in important drag reduction effects in many types of flows. This was considered the
best available solution for the pumping power dissipation in pipelines. Artificial polymeric
additives were the most famous drag reducing agents (DRA) introduced to the industry due
to its high viscoelastic properties.
2
Natural polymers were introduced rarely by few authors and they were not applied
seriously in any industrial application. Even though the drag reduction phenomena have
been extensively documented, the exact physical mechanisms are still not clearly
understood.
In the present work, natural and biodegradable DRA driven from natural polymer
extracted from okra and suspended fibers that produced from paddy husk and coconut meat
husk are introduced. All materials were chosen because of commercially feasible and
environment friendly compared to the other types of DRA that are mostly artificial. An
experimental rig was built to investigate the performance of these DRA towards the
parameters that have clear effects toward drag reduction performance..
1.2 PROBLEM STATEMENT
Fluids are part of almost every engineering system such as power plants, jet
engines, air conditioner, heat exchanger and pipelines flow. In designing such systems, the
amount of energy required to drive fluid must necessarily be taken into consideration. This
driving power encountered dissipation cause by turbulent flows. This drastic decrease in
flow efficiency upon transition to turbulence is known as turbulent drag due to velocity
difference between the laminar sub layer and the core of the turbulent flow system, eddies
are formed resulting the turbulence due to large inertia force compared to viscous force.
During the transportation of liquids through pipelines, energy is absorbed from the
main flow by eddies to complete its shape while continue growing up with more swirling
movement. This phenomenon will lead to losses in the pumping power. Besides of the
installation of pump station, common practice is applied by the addition of commercial
soluble chemicals to enhance the flow inside the pipelines. The viscoelastic properties of
the chemicals are interfered with the turbulent structures on the pipeline wall and suppress
it and that will improve the flow inside pipelines.
3
Synthetic drag reducing agents are designed to be soluble in the transported media.
All these polymers are toxic, not environmentally friendly and not biodegradable and that
raise a serious problem with the modern industrial regulations. This is why a biodegradable
and environmentally friendly additive is needed.
The solubility in the transported media condition for any additive to be classified as
drag reducing agent is considered as one of the major problems facing this industry. And
that also led to increase the cost of these additives. Suspended solids drag reducing agents
can be considered as a solution for such problem because it is insoluble in aqueous or
hydrocarbon Medias and can act efficiently as flow improver. There is a need to introduce a
new novel drag reducer agent that can improve the flow into the pipelines without changing
any properties of product.
1.3 RESEARCH OBJECTIVES
The aims of this investigation are:
1. To investigate the drag reduction performance of two suspended solid drag
reducing agents.
2. To investigate the performance of the okra-natural Mucilage on improving
the flow in pipelines.
3. To investigate the effect of the okra-natural solution effect on the drag
reduction performance of selected solid additives (paddy husk and coconut meat
husk).
4
1.4 SCOPES OF RESEARCH
The scopes of this research are described below:
(i) Using two types of suspended fibers which are paddy husk fiber and coconut
meat fiber. These suspended solids have different properties such as density.
(ii) Using natural polymer as drag reducing agent which are okra mucilage. The
purpose of choosing the additive is the viscoelastic effect that reduce drag,
cheap resources also it is natural material that biodegradable so that
environmental effect towards it usage can easily contained.
(iii) Using three different suspended solid concentrations during investigation
which are 100, 300 and 500 ppm.
(iv) Using two different particle sizes for suspended solids investigated which
are 500 and 800 µm.
(v) Using five different addition concentrations for the polymer additive effect
towards drag reduction from okra mucilage which the concentrations are
100, 300, 500, 700 and 1000 ppm.
(vi) The effect of galvanized pipe scale (L/D) was investigated by applying three
different pipe diameters, which are 0.0127, 0.025 and 0.038 m inside
diameter (ID) with four different testing sections lengths start from 0.5, 1.0,
1.5 and 2.0 m.
(vii) Using six different solution flow rates represented by the Reynolds number
(Re) that apply water as transporting fluid in pipes.
5
1.5 THESIS OUTLINE
This thesis is divided into five chapters, including the current one which presents
the background of research, problem statement, research objectives, scope of study and
thesis outline. Chapter 2 presents the literature survey that was done at the earlier stage of
the study such as drag reduction technology, types of drag reduction and the application of
drag reduction. Chapter 3 presents the research methodology for this study including the
system that has been used and the experimental equipments. Chapter 4 presents the
experimental results and the analysis with appropriate discussion. Finally, Chapter 5
consists the summary of works and contributions made in this thesis. It also included with
the future works that can be further from this field.
CHAPTER 2
LITERATURE REVIEW
Literature review of the existing research and studies in the drag reduction field
will be summarised in this chapter, also the types of flow which is laminar and turbulent
as an introduction to study the phenomena of drag reduction in turbulent flow. Later,
discussion on the types of drag reduction agents from surfactants, suspended fibers and
polymers, also the mechanism and theory of the drag reduction and the last part is the
commercial application in the drag reduction field.
2.1 INTRODUCTION
Transportation of liquid in pipeline is exposed to a friction force from the pipe
wall that reduces the pressure required to transfer the flow from one station to another
station. Currently, industries require installing supporting pumping station in order to
maintain the flow rate of transported liquid. Installation and maintenance of the pump
station will increase the cost of the transportation. In order to solve this problem,
different types of drag reducing agents are introduced as a solution for the pumping
power dissipation problem.
The key changes to the application of the DRA is that the understanding of the
mechanism of drag reduction and the turbulent structure. There are several types of
DRA such as polymer, surfactant and suspended fiber that have received considerable
attention. The behaviour and physical properties of each of DRA make it unique from
each others. The brief description of various drag reduction mechanism is given in the
following section.
7
2.2 LIQUIDS FLOW IN PIPELINES
Liquid flow is categorised into two types of flow regime which known as
laminar flow and turbulent flow. It is important to know the type of liquid flow in order
to design an operation involving liquid circulation system. Each flow has its own
characteristics and thus possesses different drag effects. The factors that determines
which types of flow is present is the ratio of inertia forces to viscous forces within the
fluid, expressed by the non-dimensional Reynolds number (Re) as shown in Equation
(2.1) below:
DV ..
Re (2.1)
Where ρ is the density of fluid, v is the velocity of fluid, D is the diameter of pipe
and µ is the viscosity of fluid (Lim, 2009).
As conclusion, liquid flow can be either laminar or turbulent.
(i) Laminar flow
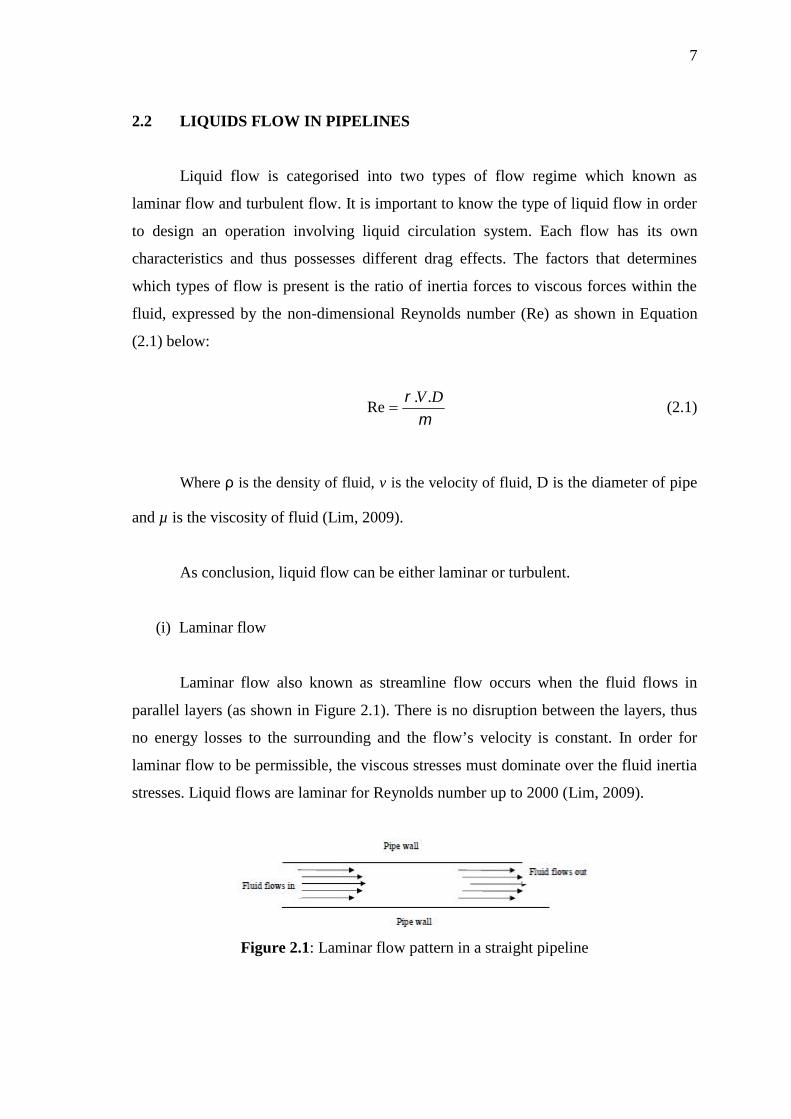
Laminar flow also known as streamline flow occurs when the fluid flows in
parallel layers (as shown in Figure 2.1). There is no disruption between the layers, thus
no energy losses to the surrounding and the flow’s velocity is constant. In order for
laminar flow to be permissible, the viscous stresses must dominate over the fluid inertia
stresses. Liquid flows are laminar for Reynolds number up to 2000 (Lim, 2009).
Figure 2.1: Laminar flow pattern in a straight pipeline
8
(ii) Turbulent flow
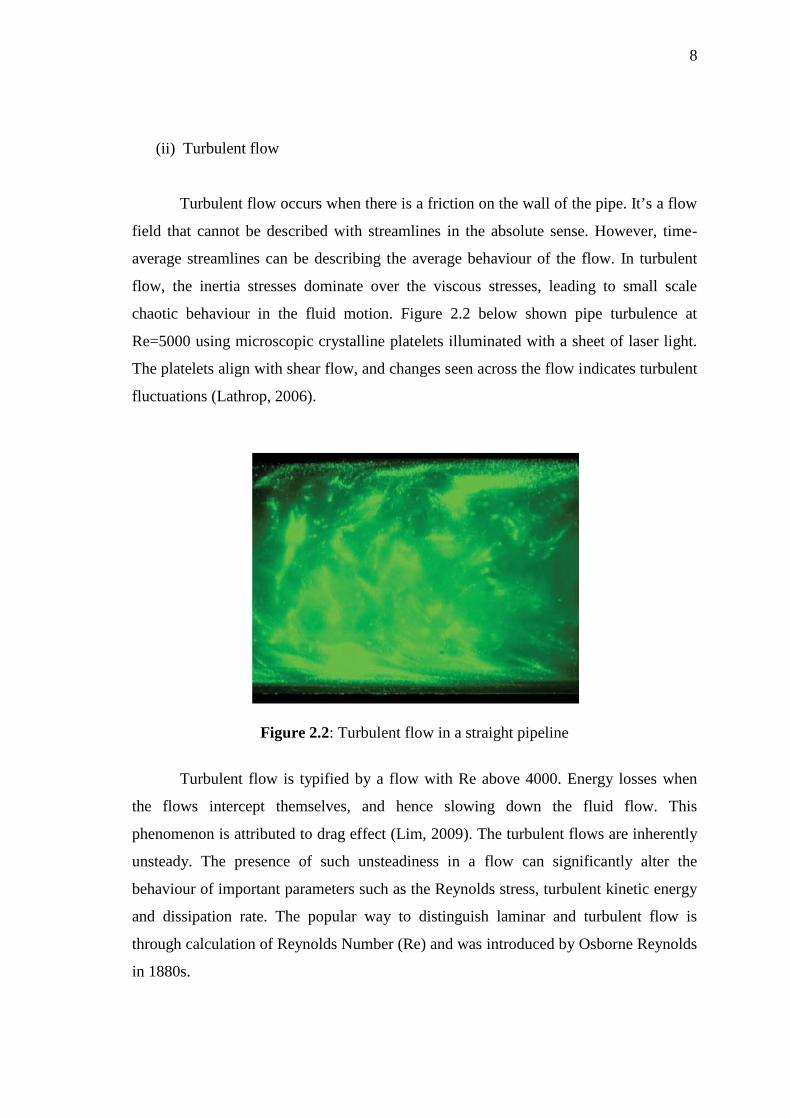
Turbulent flow occurs when there is a friction on the wall of the pipe. It’s a flow
field that cannot be described with streamlines in the absolute sense. However, time-
average streamlines can be describing the average behaviour of the flow. In turbulent
flow, the inertia stresses dominate over the viscous stresses, leading to small scale
chaotic behaviour in the fluid motion. Figure 2.2 below shown pipe turbulence at
Re=5000 using microscopic crystalline platelets illuminated with a sheet of laser light.
The platelets align with shear flow, and changes seen across the flow indicates turbulent
fluctuations (Lathrop, 2006).
Figure 2.2: Turbulent flow in a straight pipeline
Turbulent flow is typified by a flow with Re above 4000. Energy losses when
the flows intercept themselves, and hence slowing down the fluid flow. This
phenomenon is attributed to drag effect (Lim, 2009). The turbulent flows are inherently
unsteady. The presence of such unsteadiness in a flow can significantly alter the
behaviour of important parameters such as the Reynolds stress, turbulent kinetic energy
and dissipation rate. The popular way to distinguish laminar and turbulent flow is
through calculation of Reynolds Number (Re) and was introduced by Osborne Reynolds
in 1880s.