Embed Size (px)
Citation preview

ITECH1005/5005- ASSIGNMENTBusiness Information SystemsSchool of Science, Information Technology and Engineering
Teaching Period 1 2012Weight: 25%
Due date: Refer to Course Description
All students are required to submit this assignment via Moodle prior to the due date/time. You should also be prepared to demonstrate progress on your assignment toyour tutor during tutorials.
This assignment is consisted of two projects: A and B. You need to useMicrosoft Excel for the tasks in ‘Project A’ and Microsoft Access DBMS for ‘Project B’.
Project A. Sales Tracking and Customer Relations Analyses
Aims
To analyse a set of data, and write a brief report (in Excel), identifying and explaining your insights into the operation of “Smith Distribution Company”.
Learning Objectives
In the process of this assessment task you will: learn to plan, schedule and execute project tasks with a view to improve your
personal productivity; gain an understanding of some typical issues related to the operation of a
small/medium size business; use the functionality of Microsoft Excel 2007/2010 to manipulate the sales and
marketing data, analyse it and visualise it in tabular and chart form; and write a brief report of your business observations and recommendations.
Introduction
Smith Distribution specializes in distributing fresh produce to local restaurants in Ballarat area. The company currently sells 12 different products through the efforts of three sales representatives to 10 restaurants. The company’s founder, Bob Smith, like all small businesses, is always interested in finding ways to increase revenues and decrease expenses.
Bob has recently hired you as his new skilled business analyst. He is eager to hear your thoughts and ideas on how to improve the business and help the company.He would
1
ITECH1005/5005- ASSIGNMENTBusiness Information SystemsSchool of Science, Information Technology and Engineering
like to make severalrecommendations to the management on how to improve the company’s performance,especially in relation to the following business objectives:
• acquiring the best-selling stock;• improving the sales strategy; and,• building strong lasting relationships with its customers
Bob has provided you with the last year sales information in the“Smith_Data.xlsx” file. The data needs to be analyzed and visualized to help observations related to the business operation and its shortcomings. Based on your observations, you are asked to make severalrecommendations on how to improve the company’s performance.
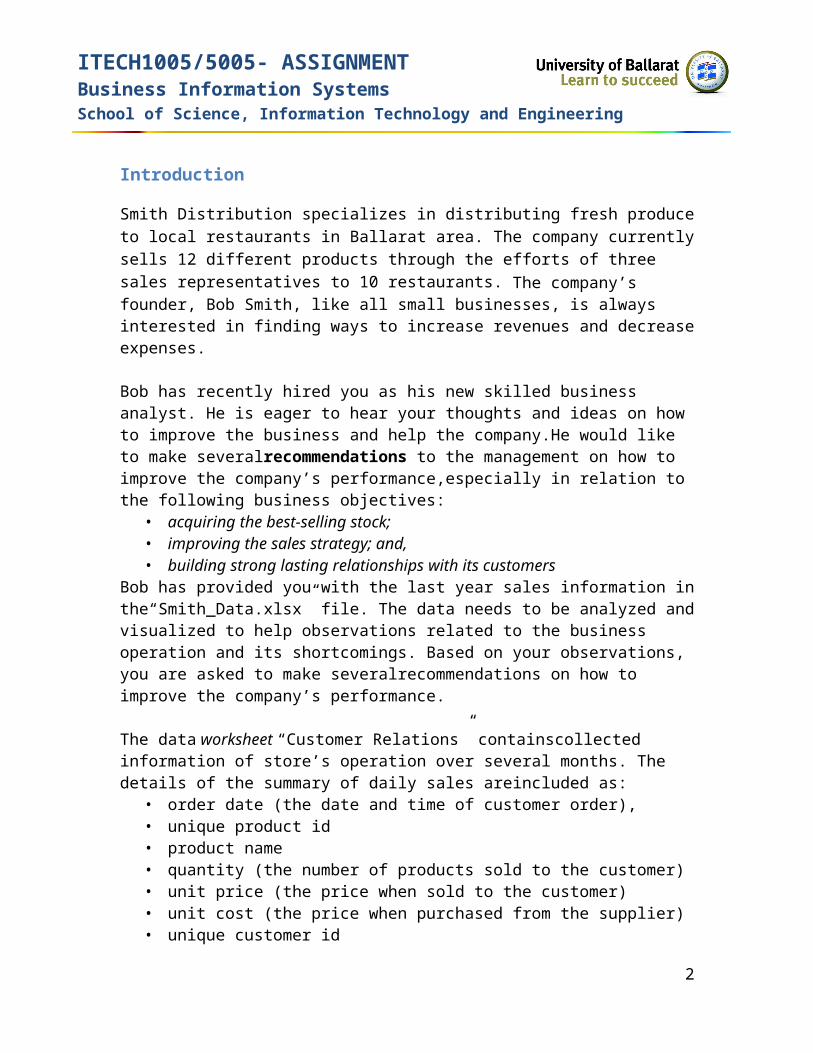
The data worksheet “Customer Relations” containscollected information of store’s operation over several months. The details of the summary of daily sales areincluded as:
• order date (the date and time of customer order), • unique product id• product name• quantity (the number of products sold to the customer)• unit price (the price when sold to the customer)• unit cost (the price when purchased from the supplier)• unique customer id• customer (the name of customer’s business) • SalesRep(the name of sales representatives).
Thisdata worksheet contains all the necessary data for your assignment. However, you need to make sure the records included in the worksheet are not faulty or inaccurate(e.g. missing data)to avoid errors in calculations.
A1. Bob needs to have a summary report that should include the following: a. total sales for all of the product sold by each sales rep.b. total profit made from all of the product sold by each sales rep.c. total number of times customers were served by each sales rep.d. total number of products sold by each sales rep.e. total commission payable to each sales rep. (Each sales rep receives 10%
commission based on the total profits made by him/her).• The report table needs to be sorted by commission in descending order.
f. total of all the sales, profits and commissions made by all the sales repsg. average of all the sales, profits and commissions made by all the sales reps
Use the “Tracking Sales” worksheet template to provide Bob with this report.
2
ITECH1005/5005- ASSIGNMENTBusiness Information SystemsSchool of Science, Information Technology and Engineering
A2. Bob also asks you to make observations to help him withthe following important questions (Take the time to consider why you think these questions are of particular interest to him). a. Who is Bob’s best customer by total sales?b. Who is Bob’s worst customer by total sales?c. Who is Bob’s best customer by total profit?d. Who is Bob’s worst customer by total profit?e. What is Bob’s best-selling product by total sales?f. What is Bob’s worst-selling product by total sales?g. What is Bob’s best-selling product by total profit?h. What is Bob’s worst-selling product by total profit?i. Who is Bob’s best sales representative by total profit?j. Who is Bob’s worst sales representative by total profit?
Use the “Observation” worksheet template to provide Bob with this report.Bob has also asked you to provide him with instructions of how you have accomplished these tasks. (Include the functions, options and the formula you’ve used).
Project A. Deliverables
Your final report will be produced in the form of an Excel workbook. You need to use your Student number for the name of this workbook. The mainpurpose of your final report is to analyse the collected information in the form of tables and charts, toobserve and report the main characteristics of the analysed data, and finally to providebrief recommendations to the store management on what can be done to improve someaspects of their store operation.“Smith_Data.xlsx” must be usedas a template of the deliverable workbook in developingyour report.
The template has the following RESULTS worksheets:1. Introduction whichidentifies the project name, date of submission, the author of
the report (you), and the colour formatting used in the workbook.o You need to replace {colour} with your own choice for the following:
Input boxes in {colour} Output boxes in {colour} Given data in {colour} Answers in {colour}
3
ITECH5005 Students Only:k. What is the best sales representative’s best-selling product (by total profit)?l. Who is the best sales representative’s best customer (by total profit)?m. What is the best sales representative’s worst-selling product (by total profit)?n. Who is the best sales representative’s worst customer (by total profit)?

ITECH1005/5005- ASSIGNMENTBusiness Information SystemsSchool of Science, Information Technology and Engineering
2. Customer Relations which should be used to calculate Total Sales, Total Cost, and Profit columns
3. Tracking Sales whichshould include the required calculations as indicated in Section A1. 4. Customer Relations Solution which should include a table which answer the questions
posed by Bob Smith in Section A2,by using pivot table.5. Observationswhich should include your reflections derived from and linked (via formulas)
to the data provided in the “Customer Relations” worksheet. These include a number of clearly labelled (or numbered)charts which highlight and report the most important characteristics of the presented data.o Each observation (or their set) should explicitly relate to one of the 10 to 14
questions provided to you in section A2. In this Report you need to use MS-Excel formulas and functionsinstead of Pivot table tool. (make sure your results using formulas and functions here are the same as the ones in the “Customer Relations Solution” using pivot table)
6. Recommendations which should include:o accurately identifyingyou as the author of your brief report. o your recommendations regarding Products, Customers and Sale Reps. o your recommendations for resolving any data redundancy issues observed in
the “Customer Relations” worksheet.o your recommendation regarding what other data should be collected to
improve decision makingo your recommendation regarding record keeping to improve the quality of data
collection. This should include creating Drop Down Lists for Data validation for
Customer and SalesRep columns in the “Customer Relations” worksheet.
o Note: All recommendations must be clearly justified. Ensure that your recommendations address the company’s objectives, and
that they are clearly linked to your observations.Some Hints
There are numerous Microsoft Excel facilities and functionsthat may be useful in this project. While planning your workbook, and especially the observations, you may wish to reviewthe tutorials on the related topics (e.g. Excel functions, absolute and relative cell referencing,formatting, chartings andmanaging large worksheets, as well as, on the analysis of Excel data and drawingrecommendations).
4

ITECH1005/5005- ASSIGNMENTBusiness Information SystemsSchool of Science, Information Technology and Engineering
There is no ‘ideal’ or ‘best’ way of doing this project.You’ll be assessed on your insight of the data, on your ability to make observations by analysing (with formulas) and visualising (with charts) your data, and your ability to link your observations to business issues.
Charting of data: The business options are linked to a number of questions posed by Bob in section A2. Your role is to answer these specific questions andto support your answers with your data analysis as presented in the appropriate tablesand charts (see a sampleobservation in the “Observation” and a sample recommendation in the “Recommendation”worksheets.
5

ITECH1005/5005- ASSIGNMENTBusiness Information SystemsSchool of Science, Information Technology and Engineering
Project B. Daily Invoice
Foothills Animal Hospital is a full-service small animal veterinary hospital specializing in routine medical care, vaccinations, laboratory testing, and surgery. The hospital has experienced tremendous growth over the past six months due to customer referrals. While Foothills Animal Hospital has typically kept its daily service records in a workbook format, it feels the need to expand its reporting capabilities to develop a relational database as a more functional structure.
1. Foothills Animal Hospital needs help developing a database, specifically to:a. create a customer table—name, address, phone, and date of entrance.b. create a pet table—pet name, type of animal, breed, gender, color,
neutered/spayed, weight, and comments.c. create a medications table—medication code, name of medication, and cost of
medication.d. create a visit table—details of treatments performed, medications dispensed,
and date of the visit.
The following business rules have been identified:
A customer can have many pets but must have at least one. A pet must be assigned to one and only one customer. A pet can have one or more treatments per visit but must have at least one. A pet can have one or more medications but need not have any.
The entities and primary keys for the database have been identified in Figure 1.
Figure 1. Entity Names and Primary Keys
6

ITECH1005/5005- ASSIGNMENTBusiness Information SystemsSchool of Science, Information Technology and Engineering
Foothills Animal Hospital organizes its treatments using the codes displayed in .
Figure 2. Treatment Codes, Treatments, and Price Descriptions
Figure 3 displays a sample daily invoice report that the Foothills Animal Hospital accountants have requested.
Project B. Deliverables
You need to Use the Microsoft Access DBMS for this project. You are asked to complete the following tasks:
a. Develop an entity-relationship diagram for your tables.b. Create a database and your tables using Microsoft Access.
o You need to use your Student number for the name of yourdatabase.c. Create a customer table, a pet table,a medications table, anda visit tabled. Use the data in and Figure 3 to populate your tables. Your report need to
include at least 5 customers and 5 pets.e. Create a basic report similar to the one displayed in Figure 3.
7

ITECH1005/5005- ASSIGNMENTBusiness Information SystemsSchool of Science, Information Technology and Engineering
Figure 3. Foothills Animal Hospital Daily Invoice Report
8

ITECH1005/5005- ASSIGNMENTBusiness Information SystemsSchool of Science, Information Technology and Engineering
Assignment Submission
Your assignment needs to be submitted as a zip file electronically through Moodle as well asa CD or USB (make sure to collect them back, after marks are released). Submission should consist of:
An Excel file including the reports required in project A. A document including
o an analysis of the problem in project B and any assumptionsmade o entity-relationship diagram o Brief operating instructions for users
An Accessdatabase file including the tasks required in project B.You are also required to provide a printed copy of all database tables, spreadsheets, and word documents. These need to include your assignment coversheet.
Assignment Assessment
The questions posed to you in this assignment range from easy, through medium to challenging. However, it is expected that all students will succeed in all the tasks. Some of the tasks are very similar to those covered in tutorials and the associated exercises. Some of the challenging tasks may rely on insight that requires self-directed study (e.g. using help facilitiesin Excel and Access to explore in depth some of the topics covered in the tutorials).
This assignment is worth 25% of total marks and will be marked on:
your demonstrated understanding of the problems; completeness of your tasks; exploration of the features in MS-Office; quality of the final product
Assignment checkpoints: During your lab classes in weeks 5 to 11 you may be asked by your tutors to show evidence of your consistent work on your assignment. In particular, weeks7 and 9are assigned as twocheckpoints. It is expected that at the first checkpoint, you will have answered majority of the questions in Project A and made your preliminary observations and recommendation.
At the second checkpoint, it is expected that you will have made your preliminary analysesand answered majority of the tasks in Project B.Failure to meet these checkpoint requirements will affect your performance and may adversely impact on your final mark.
9

ITECH1005/5005- ASSIGNMENTBusiness Information SystemsSchool of Science, Information Technology and Engineering
Student name: Student ID:
Project A Requirements MarkIntroduction Worksheetincludes project name, date of submission, the author of the report (you), and the colour formatting used in the workbook.
Formatting is based on student color selections for Input, Output, Given data and Answers cells
4*0.5
1
Customer Relations Worksheetcalculating Total Sales, Total Cost, Profit 1* 3
Tracking Sales Worksheeta. total sales for all of the product sold by each sales rep.b. total profit made from all of the product sold by each sales rep.c. total number of customers served by each sales rep.d. total number of products sold by each sales rep.e. total commission payable to each sales rep.
Using Absolute value for 10% commission The report table sorted by commission in descending order.
f. total of all the sales, profits and commissions made by all the sales repsg. average of all the sales, profits and commissions made by all the sales reps
222221111
Customer Relations Solution Worksheetk. Who is Bob’s best customer by total sales?l. Who is Bob’s worst customer by total sales?m. Who is Bob’s best customer by total profit?n. Who is Bob’s worst customer by total profit?o. What is Bob’s best-selling product by total sales?p. What is Bob’s worst-selling product by total sales?q. What is Bob’s best-selling product by total profit?r. What is Bob’s worst-selling product by total profit?s. Who is Bob’s best sales representative by total profit?t. Who is Bob’s worst sales representative by total profit?
2222222222
ITECH5005 Students Only:u. What is the best sales representative’s best-selling product (by total profit)?v. Who is the best sales representative’s best customer (by total profit)?w. What is the best sales representative’s worst-selling product (by total profit)?x. Who is the best sales representative’s worst customer (by total profit)?
3222
Observation Worksheet Using tables with formulas and chartsa. Who is Bob’s best customer by total sales?b. Who is Bob’s worst customer by total sales?c. Who is Bob’s best customer by total profit?d. Who is Bob’s worst customer by total profit?e. What is Bob’s best-selling product by total sales?f. What is Bob’s worst-selling product by total sales?
333333
10

ITECH1005/5005- ASSIGNMENTBusiness Information SystemsSchool of Science, Information Technology and Engineering
g. What is Bob’s best-selling product by total profit?h. What is Bob’s worst-selling product by total profit?i. Who is Bob’s best sales representative by total profit?j. Who is Bob’s worst sales representative by total profit?
3333
ITECH5005 Students Only:
k. What is the best sales representative’s best-selling product (by total profit)?l. Who is the best sales representative’s best customer (by total profit)?m. What is the best sales representative’s worst-selling product (by total profit)?n. Who is the best sales representative’s worst customer (by total profit)?
4444
7. Recommendationso accurately identifying student
recommendations need to be clearly justified, address the company’s objectives, and are clearly linked to students observations: recommendations regarding
o Productso Customers o Sale Reps.
recommendations for resolving any data redundancy issues with o customero product
recommendation about what other data should be collected to improve decision making
recommendation about record keeping to improve the quality of data. creating Drop Down Lists for Customer and SalesRep columns
1
222
22
22
2 * 2Project B Requirementsa. Develop an entity-relationship diagram for your tables.b. Create a database using Microsoft Access.c. Creating tables
o creating a customer tableo creating a pet tableo creating a medications tableo creating a visit table
d. populating tables with appropriate data (at least 5 customers and 5 pets).e. create a basic report similar to the one displayed in Figure 3
51
3333
4 * 2.56
Observed Submission requirements 2Late submission (deduction 10% per day)Total marks ITECH5005 students 150Total marksTECH1005 students 125Contribution to unit mark (out of 20%) 25%
Comments:
11