Embed Size (px)
Citation preview

ISSUES TO ADDRESS...• Transforming one phase into another takes time.
• How does the rate of transformation depend on time and T?
1
• How can we slow down the transformation so that we can engineering non-equilibrium structures?• Are the mechanical properties of non-equilibrium structures better?
Fe
(Austenite)
Eutectoid transformation
C FCC
Fe3C (cementite)
(ferrite)
+(BCC)
CHAPTER 11:PHASE TRANSFORMATIONS

2
• Fraction transformed depends on time.
fraction transformed time
y1 e ktn
Avrami Eqn.
• Transformation rate depends on T.
1 10 102 1040
50
100 135°
C11
9°C
113°
C10
2°C
88°C
43°Cy (%)
log (t) min
Ex: recrystallization of Cu
r 1t0.5
Ae Q /RT
activation energy
• r often small: equil not possible!
Adapted from Fig. 10.1, Callister 6e.
Adapted from Fig. 10.2, Callister 6e. (Fig. 10.2 adapted from B.F. Decker and D. Harker, "Recrystallization in Rolled Copper", Trans AIME, 188, 1950, p. 888.)
y
log (t)
Fixed T
0
0.5
1
t0.5
FRACTION OF TRANSFORMATION

33
• Can make it occur at: ...727ºC (cool it slowly) ...below 727ºC (“undercool” it!)
• Eutectoid transf. (Fe-C System):
ferrite
1600
1400
1200
1000
800
600
4000 1 2 3 4 5 6 6
.7
L
austenite
+L
+Fe3C
Fe3C cementite+Fe3C
+
L+Fe3C
(Fe) Co, wt% C
Eutectoid:
0.7
7
727°C
T(°C)
T
0.0
22
Fe3C0.77wt%C
0.022wt%C6.7wt%C
Undercooling by T: Ttransf. < 727ºC
Equil. cooling: Ttransf. = 727ºC
Adapted from Fig. 9.21,Callister 6e. (Fig. 9.21 adapted from Binary Alloy Phase Diagrams, 2nd ed., Vol. 1, T.B. Massalski (Ed.-in-Chief), ASM International, Materials Park, OH, 1990.)
TRANSFORMATIONS & UNDERCOOLING
4
pearlite growth direction
Austenite () grain boundary
cementite (Fe3C)
ferrite ()
Diffusive flow of C needed
• Growth of pearlite from austenite:
• Reaction rate increases with T.
Adapted from Fig. 9.13, Callister 6e.
Adapted from Fig. 10.3, Callister 6e.
EUTECTOID TRANSFORMATION RATE ~ T
675°C (T smaller)
1 10 102 103time (s)
0
50
100
y (
% p
earl
ite)
0
50
100
600°C (T larger)
650°C
% a
ust
enit
e

5
• Reaction rate is a result of nucleation and growth of crystals.
• Examples:
% Pearlite
0
50
100
Nucleation regime
Growth regime
log (time)t50
Nucleation rate increases w/ T
Growth rate increases w/ T
Nucleation rate high
T just below TE T moderately below TE T way below TENucleation rate low
Growth rate high
pearlite colony
Nucleation rate med Growth rate med. Growth rate low
Adapted fromFig. 10.1, Callister 6e.
NUCLEATION AND GROWTH

6
• Fe-C system, Co = 0.77wt%C• Transformation at T = 675C.
Adapted from Fig. 10.4,Callister 6e. (Fig. 10.4 adapted from H. Boyer (Ed.) Atlas of Isothermal Transformation and Cooling Transformation Diagrams, American Society for Metals, 1977, p. 369.)
ISOTHERMALTRANSFORMATION DIAGRAMS
400
500
600
700
1 10 102 103 104 105
0%pearlite
100%
50%
Austenite (stable) TE (727°C)Austenite (unstable)
Pearlite
T(°C)
100
50
01 102 104
T=675°C
y,
% t
ransf
orm
ed
time (s)
time (s)
isothermal transformation at 675°C
7
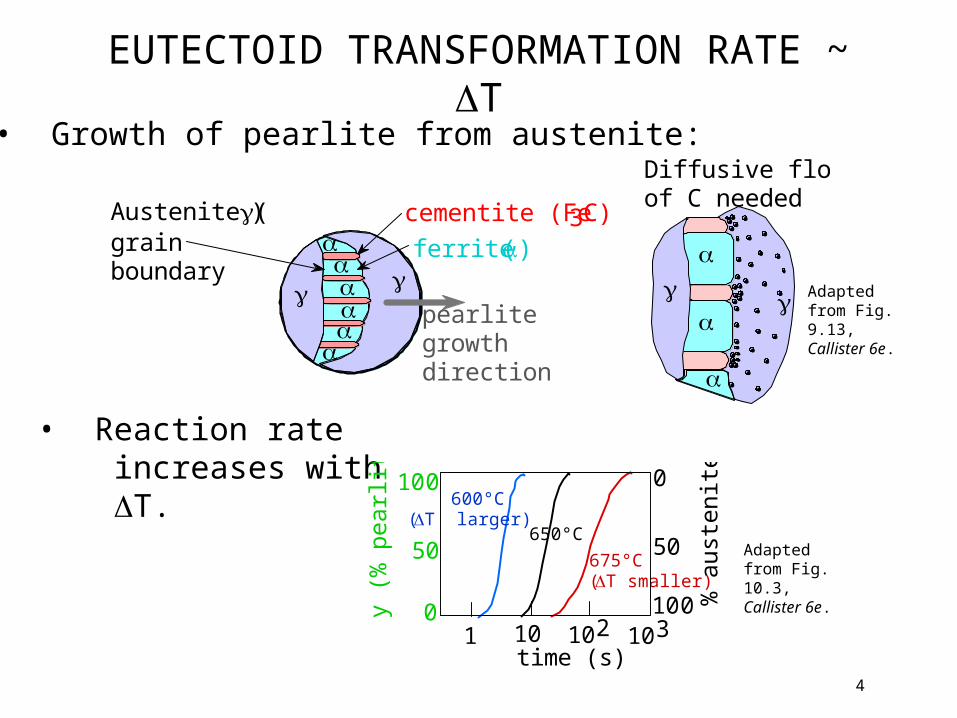
• Eutectoid composition, Co = 0.77wt%C• Begin at T > 727C• Rapidly cool to 625C and hold isothermally.
Adapted from Fig. 10.5,Callister 6e. (Fig. 10.5 adapted from H. Boyer (Ed.) Atlas of Isothermal Transformation and Cooling Transformation Diagrams, American Society for Metals, 1997, p. 28.)
EX: COOLING HISTORY Fe-C SYSTEM
1 10 102 103 104 105 time (s)
500
600
700
T(°C)
Austenite (stable)
Pearlite
0%pearlite
100%
50%
TE (727°C)

8
10m
- Smaller T: colonies are larger
- Larger T: colonies are smaller
• Ttransf just below TE --Larger T: diffusion is faster --Pearlite is coarser.
Two cases:• Ttransf well below TE --Smaller T: diffusion is slower --Pearlite is finer.
Adapted from Fig. 10.6 (a) and (b),Callister 6e. (Fig. 10.6 from R.M. Ralls et al., An Introduction to Materials Science and Engineering, p. 361, John Wiley and Sons, Inc., New York, 1976.)
PEARLITE MORPHOLOGY
9
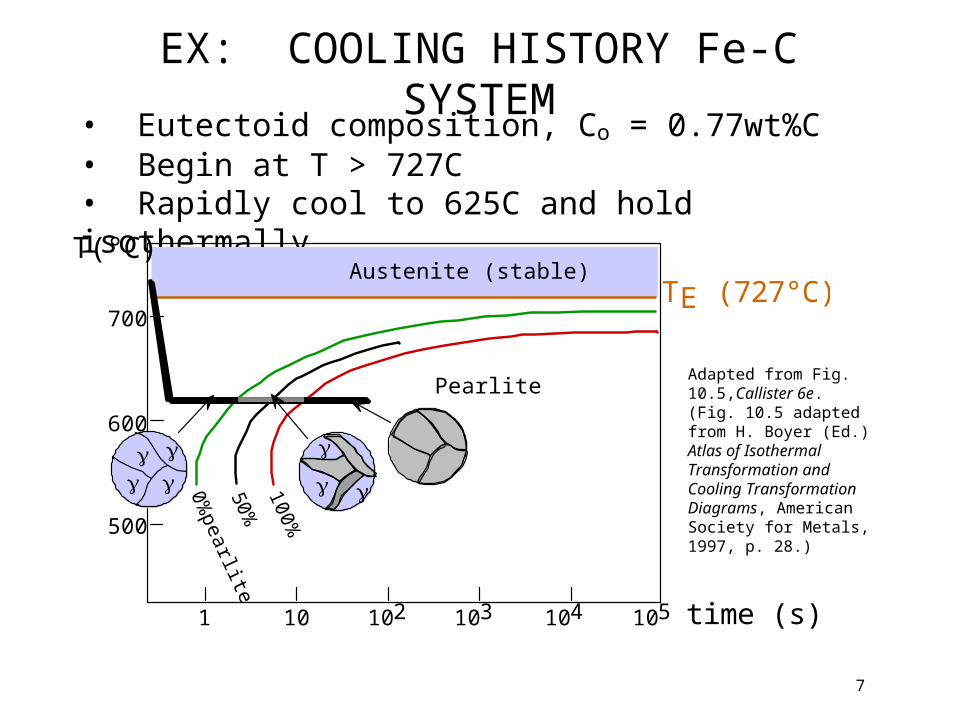
Bainite reaction rate:
rbainitee Q /RT
• Bainite: -- lathes (strips) with long rods of Fe3C --diffusion controlled.• Isothermal Transf. Diagram
Adapted from Fig. 10.9,Callister 6e.(Fig. 10.9 adapted from H. Boyer (Ed.) Atlas of Isothermal Transformation and Cooling Transformation Diagrams, American Society for Metals, 1997, p. 28.)
(Adapted from Fig. 10.8, Callister, 6e. (Fig. 10.8 from Metals Handbook, 8th ed.,Vol. 8, Metallography, Structures, and Phase Diagrams, American Society for Metals, Materials Park, OH, 1973.)
Fe3C
(cementite)
5 m
(ferrite)
NON-EQUIL TRANSFORMATION PRODUCTS: Fe-C
10 103 105
time (s)10-1
400
600
800
T(°C)Austenite (stable)
200
P
B
TE
0%
100%
50%
100% bainite
pearlite/bainite boundary100% pearlite
A
A

10
60 m
(ferrite)
Fe3C
(cementite)
• Spheroidite: -- crystals with spherical Fe3C --diffusion dependent. --heat bainite or pearlite for long times --reduces interfacial area (driving force)• Isothermal Transf. Diagram
Adapted from Fig. 10.9,Callister 6e.(Fig. 10.9 adapted from H. Boyer (Ed.) Atlas of Isothermal Transformation and Cooling Transformation Diagrams, American Society for Metals, 1997, p. 28.)
(Adapted from Fig. 10.10, Callister, 6e. (Fig. 10.10 copyright United States Steel Corporation, 1971.)
OTHER PRODUCTS: Fe-C SYSTEM (1)
10 103 105time (s)10-1
400
600
800
T(°C)Austenite (stable)
200
P
B
TE
0%
100%
50%
A
A
Spheroidite100% spheroidite
100% spheroidite

11
• Martensite: --(FCC) to Martensite (BCT)
Adapted from Fig. 10.13, Callister 6e.
(Adapted from Fig. 10.12, Callister, 6e. (Fig. 10.12 courtesy United States Steel Corporation.)
• Isothermal Transf. Diagram
xx x
xx
xpotential C atom sites
Fe atom sites
(involves single atom jumps)
time (s)10 103 10510-1
400
600
800
T(°C)Austenite (stable)
200
P
B
TE
0%
100%50%
A
A
S
M + AM + A
M + A
0%50%90%
Martentite needlesAustenite
60
m
• to M transformation.. -- is rapid! -- % transf. depends on T only.
(Adapted from Fig. 10.11, Callister, 6e.
OTHER PRODUCTS: Fe-C SYSTEM (2)

12
Adapted from Fig. 10.15, Callister 6e.
COOLING EX: Fe-C SYSTEM (1)• Co = Ceutectoid• Three histories...
time (s)10 103 10510-1
400
600
800
T(°C)Austenite (stable)
200
P
B
0%
100%50%
A
S
M + AM + AM + A
0%50%90%
100% Bainite
A
100%A 100%B
Case I
Rapid cool to:
350°C
250°C
650°C
Hold for:
104s
102s
20s
Rapid cool to:
Troom
Troom
400°C
Hold for:
104s
102s
103s
Rapid cool to:
Troom
Troom
Troom

• Co = Ceutectoid• Three histories...
time (s)10 103 10510-1
400
600
800
T(°C)Austenite (stable)
200
P
B
0% 100%50%
A
S
M + AM + AM + A
0%50%90%
M + trace of A
A
100%A
Case II
Rapid cool to:
350°C
250°C
650°C
Hold for:
104s
102s
20s
Rapid cool to:
Troom
Troom
400°C
Hold for:
104s
102s
103s
Rapid cool to:
Troom
Troom
Troom
13
Adapted from Fig. 10.15, Callister 6e.
COOLING EX: Fe-C SYSTEM (2)

14
Adapted from Fig. 10.15, Callister 6e.
COOLING EX: Fe-C SYSTEM (3)Rapid cool to:
350°C
250°C
650°C
Hold for:
104s
102s
20s
Rapid cool to:
Troom
Troom
400°C
Hold for:
104s
102s
103s
Rapid cool to:
Troom
Troom
Troom
• Co = Ceutectoid• Three histories...
time (s)10 103 10510-1
400
600
800T(°C)
Austenite (stable)
200
P
B
0%
100%50%
A
S
M + AM + AM + A
0%50%90%
50%P, 50%B
A
50%P, 50%A
50%P, 50%A
100%A
50%P, 50%B
Case III

15
Adapted from Fig. 10.20, Callister 6e. (Fig. 10.20 based on data from Metals Handbook: Heat Treating, Vol. 4, 9th ed., V. Masseria (Managing Ed.), American Society for Metals, 1981, p. 9.)
Adapted from Fig. 9.27,Callister6e. (Fig. 9.27 courtesy Republic Steel Corporation.)
Adapted from Fig. 9.30,Callister 6e. (Fig. 9.30 copyright 1971 by United States Steel Corporation.)
MECHANICAL PROP: Fe-C SYSTEM (1)
• Effect of wt%C
• More wt%C: TS and YS increase, %EL decreases.wt%C
0 0.5 10
50
100%EL
Impact
energ
y (
Izod,
ft-lb)
0
40
80
300
500
700
900
1100YS(MPa)TS(MPa)
wt%C0 0.5 1
hardness
0.7
7
0.7
7
Co>0.77wt%C Hypereutectoid
Co<0.77wt%C Hypoeutectoid
Pearlite (med)ferrite (soft)
Pearlite (med)Cementite
Hypo HyperHypo Hyper
(hard)
16
Adapted from Fig. 10.21, Callister 6e. (Fig. 10.21 based on data from Metals Handbook: Heat Treating, Vol. 4, 9th ed., V. Masseria (Managing Ed.), American Society for Metals, 1981, pp. 9 and 17.)
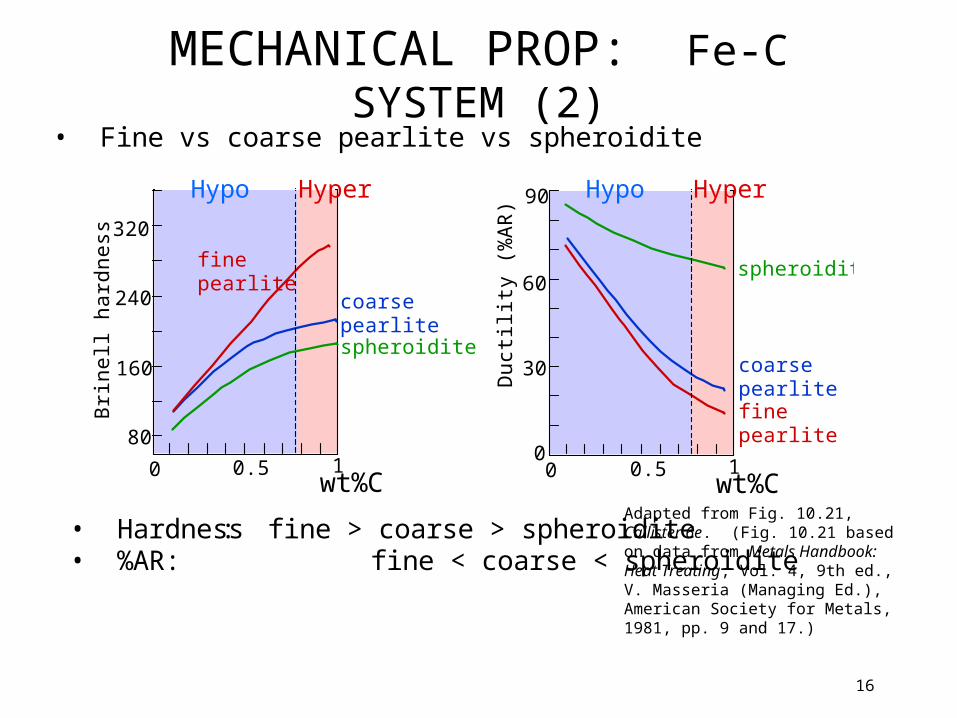
MECHANICAL PROP: Fe-C SYSTEM (2)
• Fine vs coarse pearlite vs spheroidite
• Hardness: fine > coarse > spheroidite • %AR: fine < coarse < spheroidite
80
160
240
320
wt%C0 0.5 1
Bri
nell
hard
ness
fine pearlite
coarse pearlitespheroidite
0
30
60
90
wt%C0 0.5 1
Duct
ility
(%
AR
)
fine pearlite
coarse pearlite
spheroidite
Hypo Hyper Hypo Hyper

17
• Fine Pearlite vs Martensite:
• Hardness: fine pearlite << martensite.
Adapted from Fig. 10.23, Callister 6e. (Fig. 10.23 adapted from Edgar C. Bain, Functions of the Alloying Elements in Steel, American Society for Metals, 1939, p. 36; and R.A. Grange, C.R. Hribal, and L.F. Porter, Metall. Trans. A, Vol. 8A, p. 1776.)
MECHANICAL PROP: Fe-C SYSTEM (3)
0
200
wt%C0 0.5 1
400
600
Bri
nell
hard
ness
martensite
fine pearlite
Hypo Hyper

18
• reduces brittleness of martensite,• reduces internal stress caused by quenching.
Adapted from Fig. 10.24, Callister 6e. (Fig. 10.24 copyright by United States Steel Corporation, 1971.)
Adapted from Fig. 10.25, Callister 6e. (Fig. 10.25 adapted from Fig. furnished courtesy of Republic Steel Corporation.)
TEMPERING MARTENSITE
• decreases TS, YS but increases %AR
YS(MPa)TS(MPa)
800
1000
1200
1400
1600
1800
304050
60
200 400 600Tempering T (°C)
%AR
TS
YS
%AR
9
m
• produces extremely small Fe3C particles surrounded by

19
Austenite ()
Bainite ( + Fe3C plates/needles)
Pearlite ( + Fe3C layers + a proeutectoid phase)
Martensite (BCT phase diffusionless
transformation)
Tempered Martensite ( + very fine
Fe3C particles)
slow cool
moderate cool
rapid quench
reheat
Str
ength
Duct
ilit
yMartensite
T Martensite bainite
fine pearlite coarse pearlite
spheroidite
General Trends
Adapted from Fig. 10.27, Callister 6e.
SUMMARY: PROCESSING OPTIONS
20
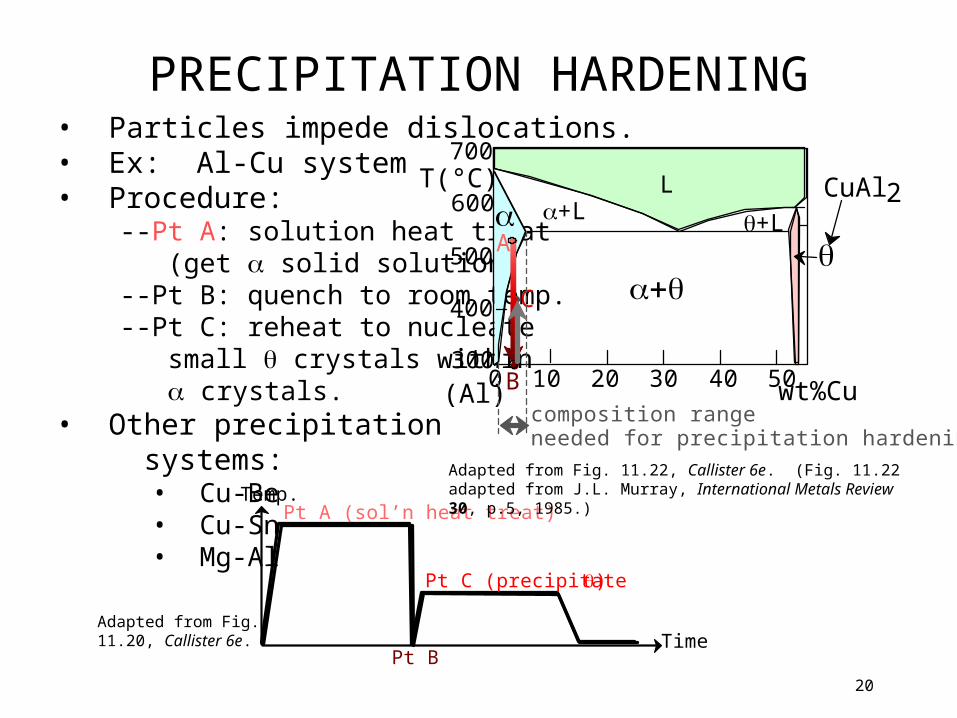
• Particles impede dislocations.• Ex: Al-Cu system• Procedure: --Pt A: solution heat treat (get solid solution) --Pt B: quench to room temp. --Pt C: reheat to nucleate small crystals within crystals.• Other precipitation systems: • Cu-Be • Cu-Sn • Mg-Al
Pt A (sol’n heat treat)
Pt B
Pt C (precipitate )
Temp.
Time
Adapted from Fig. 11.22, Callister 6e. (Fig. 11.22 adapted from J.L. Murray, International Metals Review 30, p.5, 1985.)
Adapted from Fig. 11.20, Callister 6e.
PRECIPITATION HARDENING
300
400
500
600
700
0 10 20 30 40 50wt%Cu(Al)
L+L
+L
T(°C)
A
B
C
composition range needed for precipitation hardening
CuAl2
21
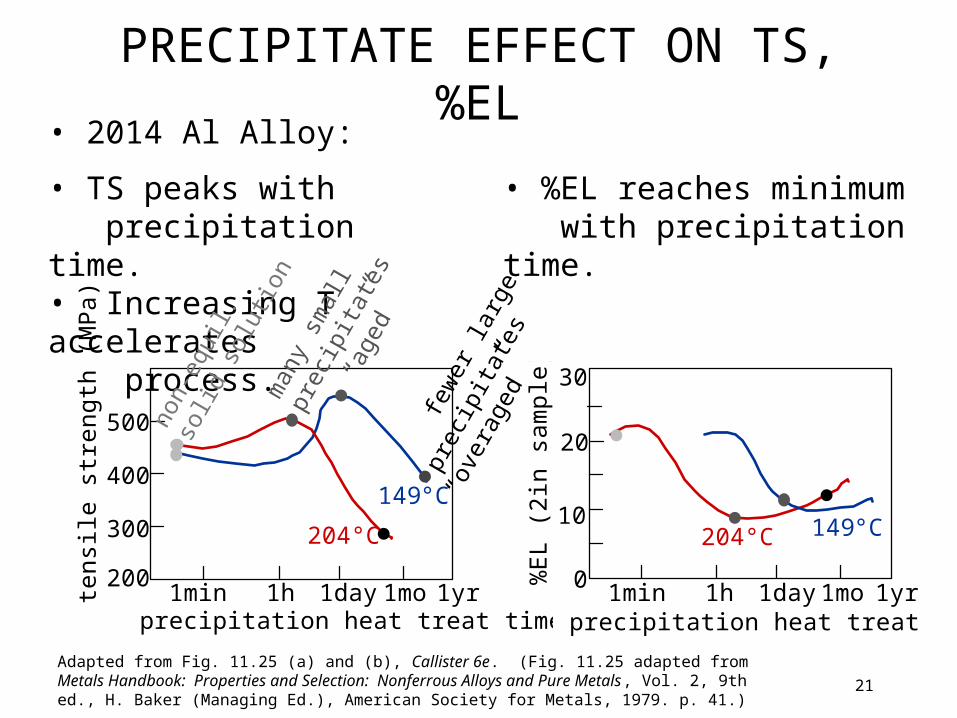
• 2014 Al Alloy:
• TS peaks with precipitation time.• Increasing T accelerates process.
• %EL reaches minimum with precipitation time.
Adapted from Fig. 11.25 (a) and (b), Callister 6e. (Fig. 11.25 adapted from Metals Handbook: Properties and Selection: Nonferrous Alloys and Pure Metals, Vol. 2, 9th ed., H. Baker (Managing Ed.), American Society for Metals, 1979. p. 41.)
PRECIPITATE EFFECT ON TS, %EL
precipitation heat treat time (h)
tensi
le s
trength
(M
Pa)
300
400
500
2001min 1h 1day 1mo1yr
204°C
149°C
non-
equi
l. so
lid s
olut
ion
man
y sm
all
prec
ipita
tes
“ag
ed”
fe
wer
larg
e
pre
cipi
tate
s
“ove
rage
d”%
EL
(2in
sam
ple
)10
20
30
0 1min 1h 1day 1mo1yr
204°C 149°C
precipitation heat treat time (h)

22
• Peak-aged --avg. particle size = 64b --closer spaced particles efficiently stop dislocations.
Simulation courtesyof Volker Mohles,Institut für Materialphysik der Universitåt, Münster, Germany (http://www.uni-munster.de/physik/MP/mohles/). Used with permission.
SIMULATION: DISLOCATION MOTION PEAK AGED MATERIAL
Click on image tobegin simulation

23
• Over-aged --avg. particle size = 361b --more widely spaced particles not as effective.
Simulation courtesyof Volker Mohles,Institut für Materialphysik der Universitåt, Münster, Germany (http://www.uni-munster.de/physik/MP/mohles/). Used with permission.
SIMULATION: DISLOCATION MOTION
OVERAGED MATERIAL
Click on image tobegin simulation

24
• Hard precipitates are difficult to shear. Ex: Ceramics in metals (SiC in Iron or Aluminum).
Large shear stress needed to move dislocation toward precipitate and shear it.
Side View
Top View
Slipped part of slip plane
Unslipped part of slip plane
S
Dislocation “advances” but precipitates act as “pinning” sites with spacing S.
precipitate
• Result: y ~
1S
STRENGTHENING STRATEGY 3: PRECIPITATION STRENGTHENING

25
• View onto slip plane of Nimonic PE16• Precipitate volume fraction: 10%• Average precipitate size: 64 b (b = 1 atomic slip distance)
Simulation courtesy of Volker Mohles, Institut für Materialphysik der Universitåt, Münster, Germany (http://www.uni-munster.de/physik/MP/mohles/). Used with permission.
SIMULATION:PRECIPITATION STRENGTHENING

26
• Internal wing structure on Boeing 767
• Aluminum is strengthened with precipitates formed by alloying.
Adapted from Fig. 11.24, Callister 6e. (Fig. 11.24 is courtesy of G.H. Narayanan and A.G. Miller, Boeing Commercial Airplane Company.)
Adapted from Fig. 11.0, Callister 5e. (Fig. 11.0 is courtesy of G.H. Narayanan and A.G. Miller, Boeing Commercial Airplane Company.)
1.5m
APPLICATION:PRECIPITATION STRENGTHENING

Reading:
Core Problems:
Self-help Problems:
0
ANNOUNCEMENTS