Embed Size (px)
Citation preview
GWSP Issues in Global Water System Research
www.gwsp.org
Global Assessments: Bridging Scales and Linking to Policy
Report on the joint TIAS-GWSP workshop held at the University of Maryland University College, Adelphi, USA, 10 and 11 May 2007
No
2
GWSP Issues in Global Water System Research
�
IMPRINT
Publisher:
The Global Water System Project
International Project Office
Walter-Flex-Str. 3
D-53113 Bonn
Germany
The Global Water System Project (GWSP) is a joint
project of the Earth System Science Partnership (ESSP)
consisting of four Global Environmental Change
Programmes: the International Geosphere-Biosphere
Pro-gramme (IGBP), the International Human
Dimensions Programme (IHDP), the World Climate
Research Programme (WCRP), and DIVERSITAS,
an international programme of biodiversity science.
The overarching question of the GWSP concerns how
human actions are changing the global water system
and what are the environmental and socio-economic
feedbacks arising from the anthropogenic changes in
the global water system.
Contact:
GWSP IPO
Phone: + 49 228 73 6188
Fax: + 49 228 7360834
Email: [email protected]
http://www.gwsp.org
Linguistic Editor: Robin Leslie
Design: Karina Waedt, Grafik & Design, Bonn,
Germany
Layout: Katharina Moraht
Printers: BGo Media GmbH & Co. KG, Bonn,
Germany
Issues in Global Water System Research is a report
series designed to review and record scientific know-
ledge about the global water system, and to stimulate
discussion amongst researchers, practitioners and
decision makers in this field. The papers undergo
reviews arranged by the Global Water System Project,
but do not present final research results and should
be considered as works in progress.
Global Assessment: Bridging Scales and Linking to Policy
3
GWSPIssues in Global Water System Research
Global Assessments: Bridging Scales and Linking to Policy
Report on the joint TIAS-GWSP workshop held at the University of Maryland University College, Adelphi, USA, 10 and 11 May 2007
No
2
Please cite as: Van Bers, C., Petry, D. & Pahl-Wostl, C. (eds.), 2007. Global Assessments: Bridging Scales and Linking to Policy. Report on the joint TIAS-GWSP workshop held at the University of Maryland University College, Adelphi, USA, 10 and 11 May 2007. GWSP Issues in Global Water System Research, No.2. GWSP IPO, Bonn. Available at: www.gwsp.org
Report editors: Caroline van Bers, Daniel Petry and Claudia Pahl-Wostl
Report date: October 2007
The international workshop of The Integrated Assessment Society (www.tias-web.info) and the Global Water System Project was co-sponsored by the United Nations Environment Programme (www.unep.org), the European Commission funded projects Harmoni-CA (Harmonised Modelling Tools for Integrated Basin Management, www.harmoni-ca.info) and NeWater (New Approaches to Adaptive Water Management under Uncertainty www.newater.info)

GWSP Issues in Global Water System Research
�
Table of Contents
Introduction ...................................................................................................................................................6Claudia Pahl-Wostl
A Year of Global AssessmentsA year of global assessments related to the environment ........................................................................... 8Jan Bakkes
The fourth Global Environment Outlook (GEO-4) assessment ................................................................13Munyaradzi Chenje
Expectations of assessments: North American policy perspective ............................................................ 18Geoffrey D. Dabelko
Global assessments: expectations of policy makers .................................................................................. 20Angela Cropper
Scenarios of the 4th Global Environment OutlookThe development of the GEO-4 scenarios and their basic storylines ...................................................... 24Dale. S. Rothman
Messages from global modeling of the GEO-4 scenarios ........................................................................ 30Joseph Alcamo, Kerstin Verzano and Tim aus der Beek
Food security and other aspects of human well-being in the GEO-4 scenarios ......................................32Claudia Ringler and Siwa Msangi
The Role of Land Use in Integrated Water ManagementThe global challenge of water for food: key findings from the Comprehensive Assessment of Water Management in Agriculture ....................................................................................38Johan Rockström
Future cropland in Africa: the outlook for green and blue water fluxes ...............................................40Joseph Alcamo, Martina Weiss, Rüdiger Schaldach, Frank Voss, and Liang You
Green water in the global water system — LPJml simulation of water fluxes and productivities ...................... 42Holger Hoff
Simulation of crop water relations on large scales with high spatial resolutions ................................... 44Junguo Liu, Hong Yang and Alexander Zehnder
Impact Assessment and Decision Support: Linking Policies to Land Use Change and Sustainability IndicatorsSustainability Impact Assessment of land use at the regional scale ........................................................ 50Karen Tscherning et al.
Sustainability Impact Assessment Tools (SIAT): modeling the impacts of land-use-related policies ....54Stefan Sieber et al.
Scales in coastal land use: policy and individual decision-making (an economic perspective) ..................61Tatiana Filatova and Anne van der Veen
Global Assessment: Bridging Scales and Linking to Policy
�
Linking Impacts and Adaption Modeling of Climate Change to the Policy ProcessUpscaling adaptation studies to inform policy at the global level ............................................................68Ian Burton, Thea Dickinson and Yvonne Howard
Climate change adaptation, mitigation and sustainable development: integration options for policy .......................................................................................................................75Livia Bizikova
Integrated adaptation modeling of climate change: a municipal case study in Ontario, Canada ......... 79James MacLellan and Adam Fenech
Climate change “adaptation through learning”: using past and future climate extremes’ science for policy- and decision-making ..................................................................................................................83Adam Fenech and Anthony Liu
Use of Geographic Information Systems in assessing climate change impacts and adaptation modeling .................................................................................................................................... 88Robin Bing Rong and Adam Fenech
Global Change Impacts on Water and Food Security – Economic AnalysesThe impact of climate variability and climate change on water and food outcomes: a framework for analysis ............................................................................................................................92Claudia Ringler
An integrated modeling approach for water and food projections under climate change: analytical framework and results for the Limpopo Basin and beyond ....................................... 97Tingju Zhu and Ximing Cai
From basin to pixel: high resolution cereal water productivity on a global scale ....................................99Liangzhi You and Tingju Zhu
Assessing the incremental benefits and costs of coping with development pressure and climate change: a South African case study ...........................................................................................................100John M.Callaway and Molly E. Hellmuth
Representation of the Human Dimension in Global Water Assessment – Current State and Major Challenges for Methodological InnovationsRepresentation of the human dimension in global water assessments: current state and major challenges for methodological innovations .............................................................................................. 102Claudia Pahl-Wostl
The multiscale integrated Earth Systems model (MIMES): the dynamics, modeling and valuation of ecosystem services .................................................................................................................104Roelof Boumans and Robert Costanza
Putting uncertainty into context: implications of model purpose in dealing with uncertainty ..................... 108Marcela Brugnach and Claudia Pahl-Wostl
Conclusions and outlook .............................................................................................................................116Jan Bakkes, Claudia Pahl-Wostl, Daniel Petry, and Caroline van Bers
Workshop Programme ...................................................................................................... 118
List of Participants ............................................................................................................. 120
GWSP Issues in Global Water System Research
�
Introduction
Claudia Pahl-Wostl
Institute for Environmental Systems Research, University of Osnabrück, Germany
President, The Integrated Assessment Society & Scientific Steering Committee, Global Water System Project
On May 10th and 11th 2007, a workshop was held in Adelphi, Maryland to share and consolidate new
research ideas and foster future co-operations in the area of global environmental assessments.
The event was co-hosted by The Integrated Assessment Society (TIAS), the Global Water System
Project (GWSP) with support from the United Nations Environment Programme, the European projects
“Harmoni-CA” and “NeWater”. The organisers were very pleased to have the participation of leading
scholars and research groups in thise field, as well as of experts from UN organisations and programmes,
governmental and non-governmental organisations, foundations, and private sector industriesindustry. A
major goal of the meeting was to strengthen the interconnections between the social and natural sciences
and between science and policy. The event also lived up to the spirit of the recently renewed agreement
between Europe and USA to promote cooperation in environmental research. The event was held back-to-
back with the International Water Association’s WATERMATEX 2007: the 7th International Symposium
on Systems Analysis and Integrated Assessment in Water Management. A joint IWA, TIAS and GWSP
workshop was held on May 9th where presentations and discussions focussed on “Uncertainty and Models
in Policy Processes for Water Management”. For a summary of the proceedings of this day see http://www.
tias.uni-osnabrueck.de/publications/TIAS_newsletter2007-8pdf.
The organisers were very pleased about the participation of leading scholars and research groups in this
field, as well as experts from UN organisations and programmes, governmental and non-governmental
organisations, foundations, and industry. The theme of global assessments encompasses a broad range of
analyses. Hence, the topics presented and discussed addressed current progress in global environmental
assessments, not only in general, but also with respect to climate change and adaptation, water resources,
land use, agriculture and food security and the links between these. However, crosscutting themes that
dominated the presentations and ensuing discussions were
the preparation of policy-relevant assessments,
the representation of phenomena across scales, with the regional-global connection being a particularly
important issue, and
the methodological improvements especially of tools for policy and decision making.
The discussion of methodologies and tools included the use of scenario techniques, the consideration of
uncertainty in modeling as well as the transfer of skills for end users.
The workshop also provided an opportunity for UNEP and IISD to formally launch the Global
Environment Outlook Resource Book. The book is a synthesis of the work of leading assessment and
capacity building practitioners from around the world to help organisations design and run effective
integrated environmental assessment programs at ecosystem, regional and national levels. The document
may be downloaded from the UNEP and IISD websites (ww.unep.org and www.iisd.org).
In this publication, we present extended abstracts of the workshop presentations as a way of summarising
current developments in topics related to global environmental assessments. (The full presentations as
well as several accompanying papers may be downloaded from the TIAS website: www.tias-web.info).
Some important insights emerged from the sessions and are summarised in a concluding chapter to this
report.
•
•
•
Global Assessment: Bridging Scales and Linking to Policy
�
A Year of Global Assessments
GWSP Issues in Global Water System Research
�
A year of global assessments related to the environment
Jan Bakkes
Netherlands Environmental Assessment Agency MNP, Bilthoven, the Netherlands
Introduction
Four worldwide environment-related assessments are currently being prepared. They are scheduled
for release by different organizations from the autumn of 2007 through to early 2008. The
assessments are large or very large exercises and they all focus 25 years or more into the future.
This publication contains extended abstracts by Munyaradzi Chenje, Angela Cropper, Dale Rothman,
Joseph Alcamo and Claudia Ringler; they document two of the TIAS–GWSP Global Assessment workshop
sessions� that analysed what can be expected from the aforesaid assessments in terms of content and
policy significance. However, the first assessment has yet to be published and some are still in the middle
of the analysis phase. This explains why this article can offer nothing firmer than expectations.
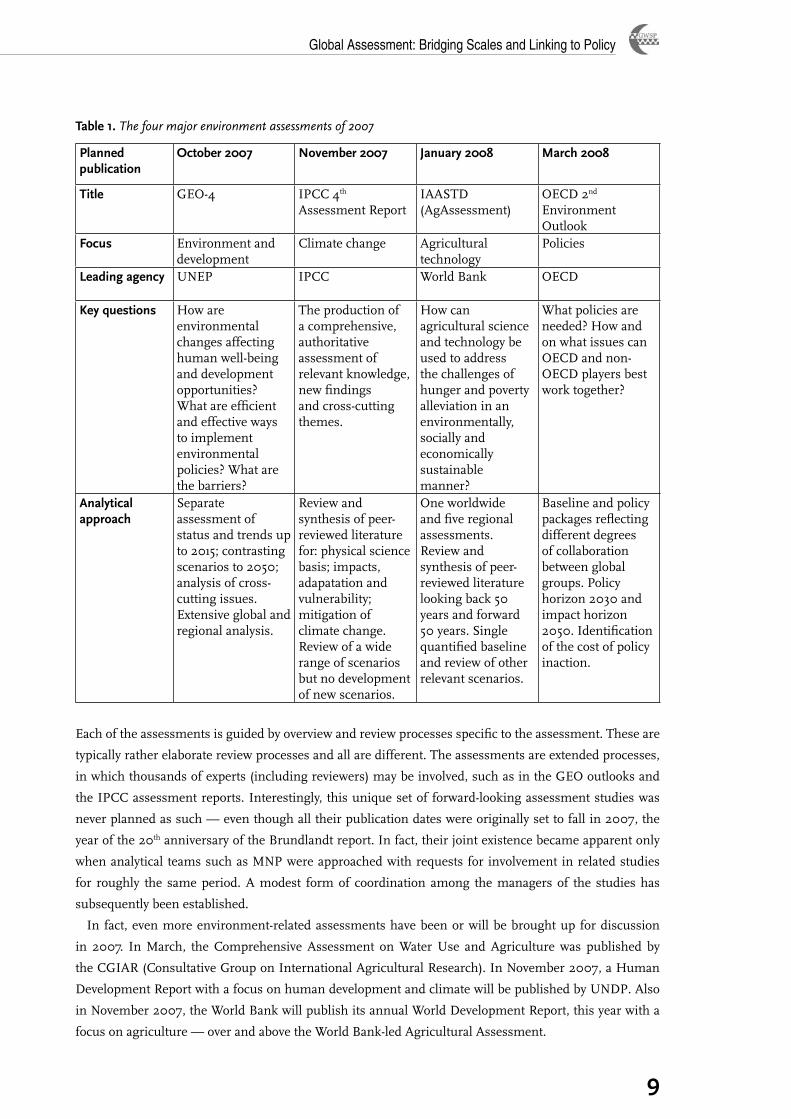
OverviewThe United Nations Environment Programme (UNEP), the World Bank (together with other organizations),
the Intergovernmental Panel on Climate Change (IPCC) and the Organisation for Economic Co-operation
and Development (OECD) lead the four assessments (Table 1). Each of the assessments has either a specific
focus (such as agriculture or climate) or a specific entry point (such as collaboration between current
high-income countries and emerging players). The four assessments could well function collectively as a
unique, broad package:
The Global Environment Outlook, led by UNEP, is traditionally most concerned with the relationship
between global issues and the world regions. The fourth edition of this Outlook (GEO-4), to be
published in October 2007, will focus on environment for development, with as a subtheme, the
impact of environmental change on human well-being.
The Fourth Assessment Report of the IPCC obviously addresses climate. The Synthesis Report of this
assesment, to appear in mid-November 2007, will focus on new findings and cross-cutting themes.
These include key vulnerabilities, integration of adaptation and mitigation, sustainable development,
water, technology, uncertainties and risk and regional matters.
The Agricultural Assessment (i.e. the International Assessment of Agricultural Science and Technology
for Development [IAASTD]) is the first of its kind. It will address the question of how agricultural
science and technology can be used to address the challenges of hunger and poverty alleviation in an
environmentally, socially and economically sustainable manner. It is led by the World Bank, while
FAO, UNEP, WHO, UNESCO and the GEF are co-sponsors.
The OECD Environment Outlook focuses on policy analysis. The key question is “what policies are
needed to tackle environmental challenges in the next decades?” In particular, it asks on what issues,
and how, OECD and emerging global players can best work together.
1 Additionally, Robert Watson’s presentation on the International Assessment of Agricultural Science and Technology for Development given at the TIAS–GWSP workshop can be downloaded from http://tias-web.info/
•
•
•
•
Global Assessment: Bridging Scales and Linking to Policy
�
Table �. The four major environment assessments of 2007
Planned publication
October �00� November �00� January �00� March �00�
Title GEO-4 IPCC 4th Assessment Report
IAASTD (AgAssessment)
OECD 2nd Environment Outlook
Focus Environment and development
Climate change Agricultural technology
Policies
Leading agency UNEP IPCC World Bank OECD
Key questions How are environmental changes affecting human well-being and development opportunities? What are efficient and effective ways to implement environmental policies? What are the barriers?
The production of a comprehensive, authoritative assessment of relevant knowledge, new findings and cross-cutting themes.
How can agricultural science and technology be used to address the challenges of hunger and poverty alleviation in an environmentally, socially and economically sustainable manner?
What policies are needed? How and on what issues can OECD and non-OECD players best work together?
Analytical approach
Separate assessment of status and trends up to 2015; contrasting scenarios to 2050; analysis of cross-cutting issues. Extensive global and regional analysis.
Review and synthesis of peer-reviewed literature for: physical science basis; impacts, adapatation and vulnerability; mitigation of climate change. Review of a wide range of scenarios but no development of new scenarios.
One worldwide and five regional assessments. Review and synthesis of peer-reviewed literature looking back 50 years and forward 50 years. Single quantified baseline and review of other relevant scenarios.
Baseline and policy packages reflecting different degrees of collaboration between global groups. Policy horizon 2030 and impact horizon 2050. Identification of the cost of policy inaction.
Each of the assessments is guided by overview and review processes specific to the assessment. These are
typically rather elaborate review processes and all are different. The assessments are extended processes,
in which thousands of experts (including reviewers) may be involved, such as in the GEO outlooks and
the IPCC assessment reports. Interestingly, this unique set of forward-looking assessment studies was
never planned as such — even though all their publication dates were originally set to fall in 2007, the
year of the 20th anniversary of the Brundlandt report. In fact, their joint existence became apparent only
when analytical teams such as MNP were approached with requests for involvement in related studies
for roughly the same period. A modest form of coordination among the managers of the studies has
subsequently been established.
In fact, even more environment-related assessments have been or will be brought up for discussion
in 2007. In March, the Comprehensive Assessment on Water Use and Agriculture was published by
the CGIAR (Consultative Group on International Agricultural Research). In November 2007, a Human
Development Report with a focus on human development and climate will be published by UNDP. Also
in November 2007, the World Bank will publish its annual World Development Report, this year with a
focus on agriculture — over and above the World Bank-led Agricultural Assessment.
GWSP Issues in Global Water System Research
�0
If this multitude of environment-related studies does not reflect a grand coordinated scheme by
international organizations, what does it then reflect? Perhaps it is indicative of mainstreaming on a large
scale, with various bodies judging, independently, that at this point in time resources in their organizations
should be spent on better environmental information.
Some expectations and questions under investigationThe IPCC Synthesis Report will be based on the IPCC Working Group reports released during the first
half of 2007. Moreover, its outline has been agreed to, so it is not too difficult to guess its contents.
Working Group I, on science, has expressed “very high confidence” that the global average net effect
of human action since 1750 has been one of global warming. Its report schematized the various effects
involved in radiative forcing with neat confidence tags for each of them. Working Group II, on impacts,
painted a fuller, more serious picture of the impacts of climate change, while asserting that especially low-
income countries would be affected by the consequences of climate change. It was able to differentiate the
impacts according to the timing and degree of temperature increase. Working Group III, on mitigation
policies, provided in a way the good news by assessing available technologies and identifying the mitigation
potential in many economic sectors, for example, construction.
The Global Environment Outlook-4 of UNEP provides an overview of key global and regional
environmental challenges, discussed around thematic areas of land, water air and biodiversity. It highlights
the negative impacts of environmental changes on development and human well being and highlights the
need to have a broader view of global change, going beyond climate change. The combination of global
and regional analysis provides an opportunity to analyze the consequences of global trends on regions, for
example through vulnerability assessments – highlighting the export and import of vulnerability between
industrialized and developing countries. The policy analysis in GEO-4 emphasizes the need for more
integrated environmental policies as well as opportunities for mainstreaming environment and bringing
it to the core of decision-making. To realize longer term developmental and environmental objectives
several policies to make the transitions towards more sustainable development are identified.
The OECD Environment Outlook is based on a classical baseline projection, contrasted with policy
variants. The baseline assumes no new policies. Unsurprisingly, it shows worldwide environmental
problems to be on the increase. The emission of global air pollutants remains roughly constant, but is
shifting towards non-OECD countries. In combination with urbanization and ageing, this means more
premature deaths annually from urban air pollution. Climate change unfolds at an approximately constant
rate of temperature change, towards and beyond 2030. Terrestrial biodiversity continues its steep decline,
especially in grasslands. The human-induced nitrogen cycle keeps expanding and impacts various media.
In particular, next to agriculture and emission of nitrogen oxides to the air, an important factor is that the
expansion and improvement of urban wastewater treatment is hardly able to keep up with the expansion
of sewerage connections. Water stress increases markedly outside OECD countries, requiring enhanced
management to prevent negative impacts.
At the time of writing, policy analyses for the OECD Environment Outlook were ongoing. In all likelihood,
they will indicate the need for globalization in terms of environmental policy to complement globalization
in terms of economic policy. Examples are climate stabilization, biodiversity in relation to agriculture,
water treatment to complement MDG-style sanitation targets, and fisheries.
The Agricultural Assessment will, of course, provide projections for the challenge of nutritional safety
in the next 25 to 50 years, with demand for food doubling and changing — at the same time that other
Global Assessment: Bridging Scales and Linking to Policy
��
claims on land and water are increasing. In addition, climate will be characterized by increasing variability
and more extreme events. Since the 1960s, some global success has been achieved in food production;
however, farmers in the world’s poorest countries are still not benefiting from yield increases. Agriculture
must grow faster in most low-income countries if the Millennium Development Goals are to be achieved.
But there will be less water and arable land and increasing potential for land conflicts. Moreover, a price
has been paid for past progress in terms of genetic, species and ecosystem degradation.
The IAASTD context is also one of accelerating crop biotechnology breakthroughs, public concerns over
transgenic crops, issues of intellectual property rights, increasing non-traditional agricultural products
such as agropharmaceuticals and the growing role of information technology in agriculture. Targeted
investments in agricultural science and technology can yield enormous benefits, but it remains to be
seen if current public and private sector research activities will be adequate and effective. Public research
funding, especially funding relevant to developing countries, has been irregular and has not increased with
time. Running through all of these issues is evidence of the widely different perspectives on globalization
among those concerned.
Issues for comparison among the assessments As soon as they have been released by spring 2008, with a bit of luck and goodwill, the four assessments
can serve as an uniquely rich and comprehensive body of information for each of the original audiences.
Time horizons, regional resolution and the analytical groups and tools involved may not be identical, but
they do appear largely comparable.
While the designs of the four studies should lead to assessments that are complementary, there are
important cross-cutting or overlapping issues. Biofuels are an issue that will figure in all four of the
reports. On such issues, it will be interesting to compare the four assessments. This applies not only to
a comparison of quantitative findings, for example the biodiversity impact of first-generation biofuels,
but also to the policy messages that the assessments derive from these findings. For example on balance,
considering that first generation biofuels come with problems, is it or is it not advisable to promote them
straight away, in order to build up structures and routines that will help second generation biofuels off
the ground later?
Such issues for comparison could include:
Energy, air pollution, climate change
level of action required on climate change;
the future of coal use;
role of various technology clusters in mitigation of climate change;
health impacts of air pollution in newly industrializing regions;
transboundary aspects of air pollution, including hemispheric transport.
Land, trade, terrestrial biodiversity
agricultural land-use changes over the next decades;
environmental consequences of further liberalization of agricultural production and trade;
GMOs: policies, realistic expectations;
production, trade and use of biofuels;
water and agriculture: problems, efficiency gains and actions required.
1.
•
•
•
•
•
1.
•
•
•
•
•

GWSP Issues in Global Water System Research
��
Political globalization
cooperation between significant players internationally;
problems in and associated with realizing the MDGs;
the future role of development cooperation.
Production, consumption, resource extraction
fisheries: type of action required;
aquaculture: impacts, action;
meat consumption as a driver of environmental pressures: any policies conceivable?
1.
•
•
•
1.
•
•
•
Global Assessment: Bridging Scales and Linking to Policy
��
The fourth Global Environment Outlook (GEO-4) assessment
Munyaradzi Chenje Global Environment Outlook Section, Division of Early Warning and Assessment, UNEP, Nairobi, Kenya
Introduction
The Global Environment Outlook (GEO) is the flagship of UNEP’s integrated environmental
assessment and reporting programme. Adhering to the core mandate of UNEP, the report series
aims to keep under review the state and trends of the world’s environment, identify emerging
issues that require international attention and provide guidance for policy-making, action planning and
resource allocation.
The GEO’s primary target audience is UNEP’s Governing Bodies and policy advisors in relevant
government ministries. The assessment also reaches out to other UN organizations, IGOs, NGOs, civil
society, scientific communities, media, the private sector and the general public. GEO is both a process
and series of reports supporting early warning and building capacity at global and subglobal levels. The
GEO also disseminates information, raises awareness and provides options for action.
The Fourth Global Environment OutlookThe fourth assessment – Global Environment Outlook: environment for development (GEO-4) – makes
sustainable development central to the analyses, notably on issues dealing with intra- and intergenerational
equity. The analyses include the need and usefulness of the valuation of environmental goods and
services and the role of such services to enhance human well-being, minimize human vulnerability to
environmental change and promote development. The GEO-4 temporal baseline is 1987, the year when
the World Commission on Environment and Development (WCED) published its seminal report Our
Common Future. GEO-4 will be published in October 2007.
The year 2007 is a major milestone in terms of sustainable development; efforts have been made to
address various environmental challenges from local to global levels. The year marks:
Twenty years since the launch of Our common future, which defined sustainable development as a
blueprint to address humanity’s environmental challenges.
Twenty years since the UNEP Governing Council adopted the Environmental Perspective to the Year
2000 and Beyond, to implement the major findings of the WCED and set the world on a sustainable
development path.
Fifteen years since the World Summit on Environment and Development or the Rio Earth Summit,
which adopted Agenda 21, providing the foundation on which to build intra- and intergenerational
equity.
Five years since the World Summit on Sustainable Development (WSSD) in 2002 that adopted the
Johannesburg Plan of Implementation.
The year 2007 is also the half-way point to the implementation of some of the internationally recognized
development targets, including the Millennium Development Goals (MDGs). These and other issues are
analysed in the report.
The GEO-4 assessment report is a result of structured and elaborate consultations. GEO-4 has ten
chapters divided into six sections which provide an overview of global, social and economic trends,
•
•
•
•
GWSP Issues in Global Water System Research
��
the state-and-trends of the global and regional environment over the past two decades and the human
dimensions of such change. It highlights the interlinkages as well as the challenges and opportunities
which the environment provides for human well-being; it also provides an outlook for the future and
policy options to address present and emerging environmental issues.
The objectives of the assessment include the following actions:
Assessing interlinkages between major environmental challenges and their consequences for policy
and technology response options and trade-offs; assessing opportunities for technology and policy
interventions for both mitigating and adapting to environmental change.
Assessing challenges and opportunities by focusing on certain key cross-cutting issues and how
environmental degradation can impede progress, with a focus on vulnerable groups, species,
ecosystems and locations.
Presenting a global and subglobal outlook, including short-term (up to 2015) and medium-term (up
to 2050) scenarios for the major societal pathways and their consequences for the environment and
society.
Assessing the environment for human well-being and prosperity, focusing on the state of knowledge
on the effectiveness of various approaches to overarching environmental policies.
Partnerships The GEO-4 assessment combines the widely regarded, bottom-up participatory GEO process with elements
from the well-proven scientific assessment processes such as the Millennium Ecosystem Assessment.
The GEO assessment has been successful over the past decade due to its strong network of collaborating
centres (CCs) spread across the globe. About 40 CCs are involved in the current GEO assessment; each
brings different expertise, ranging from thematic to policy analysis. The assessment aims consistently at
a good regional and gender balance.
For each of its ten chapters, the GEO-4 assessment has an expert working group to research, draft,
revise and finalize the chapter. The ten groups are comprised of between 15 to 20 individuals: scientists,
representatives from GEO CCs, experts nominated by governments, policy practitioners, representatives
of UN organizations and GEO Fellows. The experts were nominated on their scientific merit or policy
expertise. UNEP has assigned a staff member to each group as a chapter coordinator. The expert groups
are led by two or three coordinating lead authors in close collaboration with the UNEP chapter coordinator.
Members of the chapter expert groups are lead authors for the chapters, and specific contributions are
made by other specialists (contributing authors).
Twenty chapter review editors were identified to review whether comments have been taken into account
adequately in the revised drafts.
Government nomineesOne of the recommendations of the Intergovernmental and Multi-stakeholder Consultation on the Design
and Scope of the GEO-4 (Nairobi, February 2005) was to strengthen the involvement and engagement of
expertise present in various countries in the GEO process. In response, UNEP requested governments
to nominate experts to participate in GEO-4. A total of 157 nominees covering a wide range of thematic,
technical or policy expertise were nominated by 48 governments. Some of the nominees participate in
expert working groups — all have been invited to the review process.
•
•
•
•

Global Assessment: Bridging Scales and Linking to Policy
��
High-level Consultative GroupThe High-level Consultative Group on GEO-4 consists of 15 high-profile individuals from policy, science,
business and civil society backgrounds. It provides guidance on the intergovernmental components of
the GEO assessment and ensures a niche for the assessment in the context of other global environmental
assessment processes.
Capacity Building Working GroupA Capacity Building Working Group supports, advises and guides GEO capacity-building activities.
Capacity building has been at the heart of the GEO process since its inception in 1995. Capacity building
has been achieved through the active participation of developing country experts in GEO-4 as well as
hands-on support to governments to produce subglobal reports; it is supported by:
Development and promotion of the use of integrated assessment tools and methodologies, a GEO-4
modular resource book.
Training events and workshops.
Networking and partnerships.
GEO fellowships awarded to students/scholars to work with the GEO process.
Outreach Working GroupA Outreach Working Group (OWG), with specialists from the fields of marketing and communication,
science, education and technology, has been formed to support and advise UNEP in its outreach and
engagement activities. The key to ensuring that GEO-4 findings are policy-relevant and legitimate is to
strengthen the interaction between science and policy-making. A well-functioning interaction helps define
policy challenges and opportunities as well as research priorities. Building strong ownership of the report
and its findings by involving the media and private sector as well as connecting to global networks is the
role of Outreach and Engagement.
GEO-4 conceptual frameworkThe GEO-4 assessment uses the drivers–pressures–state–impacts–responses (DPSIR) framework in
analysing the interaction between environmental change over the past two decades as well as in presenting
the four scenarios in Chapter 9.
Human well-being and ecosystem services are core concepts in the analysis. However the GEO-4 broadens
its assessment from focusing exclusively on ecosystems to cover the entire environment and interaction
with society. The framework attempts to reflect the key components of the complex and multidimensional,
spatial and temporal chain of cause-and-effect that characterizes the interactions between society and
environment. The GEO-4 framework is generic and flexible and recognizes that a specific thematic and
geographic focus may require a specific and customized framework.
The GEO-4 conceptual framework, therefore, contributes to society’s enhanced understanding of the
links between the environment and development, human well-being and vulnerability to environmental
change. The framework places, together with the environment, the social issues and economic sectors
in the “impacts” category rather than just exclusively in the “drivers” or “pressures” categories (Figure 1).
The characteristics of the components of the GEO-4 analytical framework are explained in greater detail
hereunder.
•
•
•
•
GWSP Issues in Global Water System Research
��
DriversDrivers are sometimes referred to as indirect or underlying drivers or driving forces. They refer to
fundamental processes in society, which drive activities with a direct impact on the environment.
Key drivers include: population demographics; consumption and production patterns; scientific and
technological innovation; economic demand, markets and trade; distribution patterns; institutional and
socio-political frameworks and value systems. The characteristics and importance of each driver differ
substantially from one region to another, within regions and within and between nations. For example,
in the area of population dynamics, most developing countries are still facing population growth while
developed countries are faced with a stagnant and ageing populations.
Pressures Key pressures include: Emissions of substances which may take the form of pollutants or waste; external
inputs such as fertilizers, chemicals and irrigation; land use; resource extraction; and modification and
movement of organisms. Human interventions may be directed towards causing a desired environmental
change such as land use, or they may be intentional or unintentional by-products of other human activities,
for example, pollution. The characteristics and importance of each pressure may vary from one region
to another, but are often a combination of pressures that lead to environmental change. For example,
climate change is a result of emission of different greenhouse gases, deforestation and land-use practices.
Furthermore, the ability to create and transfer environmental pressures onto the environment of other
societies varies from one region to another. Affluent societies with high level of production, consumption
and trade tend to contribute more towards global and transboundary environmental pressures than the
less affluent societies who interact in more direct fashion with the environment in which they live.
State-and-trendsEnvironmental state also includes trends, which often refer to environmental change. This change may be
natural, human-induced or both. Examples of natural processes include solar radiation, extreme natural
events, pollination and erosion. Key forms of human-induced environmental change include climate
change, desertification and land degradation, biodiversity loss and air and water pollution.
Different forms of natural or human-induced changes interact. One form of change, for example climate
change, will inevitably lead to ecosystem change, which may result in desertification or biodiversity
loss. Different forms of environmental change can re-inforce or neutralize each other. For example, a
temperature increase due to climate change can, in Europe, partly be offset by changes in ocean currents
triggered by climate change. However the complexity of the physical, chemical and biological systems
constituting the environment makes it hard to predict environmental change, especially when it is subject
to multiple pressures. The state of the environment and its resilience to change varies greatly within and
among regions due to different climatic and ecological conditions.
Impacts The environment is directly or indirectly impacted by socio-economic sectors, contributing to change
(either negative or positive) in human well-being and in the capacity/ability to cope with environmental
changes. Impacts, be they on human well-being, the socio-economic sectors or environmental services,
are highly dependent on the characteristics of the drivers and therefore vary markedly between developing
and developed regions.

Global Assessment: Bridging Scales and Linking to Policy
��
5
E N V I R O N M E N T
Glo
bal
Loca
l
Reg
ional
TTII MM
EE::
11 9988
7722
0000
77 ––22
0011 55
(( sshh
oo rrtt
tt eerr mm
))22
0055 00
(( mmee dd
ii uumm
tt eerr mm
))(( ll
oo nngg
tt eerr mm
))
P —
PR
ES
SU
RE
S:
Hum
an in
terv
entio
ns in
the
envi
ronm
ent:
-Lan
du
se
- Res
ourc
e ex
trac
tion
- E
xter
nal
inpu
ts (f
erti
lizer
s,
chem
ical
s, ir
riga
tion
) -E
mis
sion
s (p
ollu
tan
ts a
nd
was
te)
- Mod
ific
atio
n a
nd
mov
emen
t of
org
anis
ms
Nat
ural
pro
cess
es:
- Sol
ar r
adia
tion
- Vol
cano
es
- Ear
thqu
akes
S —
ST
AT
E-a
nd-
tren
ds:
Nat
ural
cap
ital:
atm
osph
ere,
lan
d, w
ater
an
d bi
odiv
ersi
ty
Envi
ronm
enta
l im
pact
s an
d ch
ange
:- C
limat
e ch
ange
and
dep
letio
n of
the
stra
tosp
heri
c oz
one
laye
r
- Bio
dive
rsity
cha
nge
- Pol
lutio
n, d
egra
datio
n an
d/or
dep
letio
n of
air
, wat
er, m
iner
als
and
land
(incl
udin
gde
sert
ific
atio
n)
D —
DR
IVE
RS
:
Mat
eria
l, H
uman
and
Soc
ial C
apita
l
Hum
an d
evel
opm
ent:
-Pop
ulat
ion
dem
ogra
phic
s-E
cono
mic
pro
cess
es (
con
sum
ptio
n,
prod
uct
ion
, mar
kets
an
d tr
ade)
-S
cien
tific
and
tech
nolo
gica
l inn
ovat
ion
-Dis
trib
utio
n pa
tter
n pr
oces
ses
(in
ter-
an
d in
trag
ener
atio
nal
) - C
ultu
ral,
soci
al, p
oliti
cal a
nd in
stitu
tiona
l(i
ncl
udin
g pr
odu
ctio
n a
nd
serv
ice
sect
ors)
pr
oces
ses
R —
RE
SP
ON
SE
S
to e
nvi
ron
men
tal
chal
len
ges:
Form
al a
nd in
form
al a
dapt
atio
n to
and
m
itiga
tion
of, e
nvir
onm
enta
l cha
nge
(incl
udin
g re
stor
atio
n) b
y al
teri
ng
hum
an a
ctiv
ity a
nd d
evel
opm
ent
patt
erns
with
in a
nd b
etw
een
the
D,P
and
I bo
xes
i.e. t
hrou
gh:s
cien
ce a
nd
tech
nolo
gy, p
olic
y, la
w a
nd
inst
itutio
ns.
I —
IM
PA
CT
S
Cha
nge
in h
uman
wel
l-bei
ngbr
oadl
y de
fin
ed a
s h
uman
free
dom
s of
cho
ice
and
acti
ons,
i.e.
to a
chie
ve:
-sec
urity
- b
asic
mat
eria
l nee
ds
- goo
d he
alth
- g
ood
soci
al r
elat
ions
w
hic
h m
ay r
esul
t in
hu
man
de
velo
pmen
t or
pove
rty,
ineq
uity
an
d hu
man
vul
nera
bilit
y.
D
emog
raph
ic, s
ocia
l
(ins
titut
iona
l) an
d m
ater
ial
fact
ors
dete
rmin
ing
hum
an
w
ell-b
eing
Envi
ronm
enta
l fac
tors
det
erm
inin
g hu
man
wel
l-bei
ng-E
colo
gica
l ser
vice
s su
ch a
s P
rovi
sion
ing
serv
ices
(con
sum
ptiv
e us
e), C
ultu
ral s
ervi
ces
(non
-co
nsu
mpt
ive
use
),
Reg
ula
tin
g se
rvic
es a
nd
Su
ppor
tin
g se
rvic
es (i
ndi
rect
use
) -N
on-e
cosy
stem
nat
ural
res
ourc
esi.e
. hyd
roca
rbon
s, m
iner
als
and
ren
ewab
le e
ner
gy
-Str
ess
i.e. d
isea
ses,
pes
ts, r
adia
tion
an
d h
azar
ds
FIG
UR
E 1
HU
MA
N S
OC
IET
Y
Figure � The GEO-4 framework
Responses Responses address the issues of vulnerability of both people and the environment and provide opportunities
for enhancing human well-being. Responses are at various levels: For example, environmental laws and
institutions at the national level, and multilateral environmental agreements and institutions at the regional
and global levels. The capacity to mitigate or adapt to environmental change differs among and within
regions; capacity building is therefore a major and overarching component of the response components
seen from a global perspective. The GEO-4 framework (Figure 1) has been used in the analyses of issues
in all the ten chapters, both explicitly and implicitly. Its utility is in integrating the analyses to better
reflect the cause-and-effect, and ultimately society’s response in addressing the environmental challenges
it faces.
GWSP Issues in Global Water System Research
��
Expectations of assessments: North American policy perspective
Geoffrey D. Dabelko
Environmental Change and Security Program, Woodrow Wilson International Center for Scholars, Washington, DC, USA
Currently there is real political momentum on this basket of issues in North America. These
assessments have been a key to opening the policy window of opportunity. We need the assessments
to serve the further purpose of building real action on top of the attention momentum. Attention
is only the first step.
Climate change as the hook for all the assessments To maximize dissemination, digestion and usage of the assessments, it is probably politically wise to find a
way to use climate change as the hook for all the assessments. Climate can be used as a point of entry into
policy debates; however the challenge for some is not to have all other issues overshadowed by climate.
There are other North American hooks. The agriculture assessment of the World Bank and collaborators
has a tremendous window of opportunity presented by the 2007 Farm Bill in the United States Congress.
Working with people who understand how the Bill works is a golden opportunity to make the report a
critical input into legislation that will be a primary vehicle for advancing agricultural reform in the United
States and by extension the world through WTO negotiations.
Assessments and new scientific evidence are not the only drivers for creating this momentum. Moreover
the role assessments play in creating policy attention should not be overdetermined. In the United States,
compelling scientific work, Hurricane Katrina and its aftermath, “An Inconvenient Truth” (the motion
picture), state and city level action, faith-based communities, the change in majorities of Congress, high
gasoline prices and even retired military officers have underscored that climate change is a concern for
the country. The bottom line is that the assessments we are discussing are coming out at a good time to
heighten awareness.
Practical suggestions to maximize impact in policy circlesHere are a few practical suggestions to take advantage of the high quality of the assessments and the
windows of opportunity in North America.
To be effective, much more time, resources and attention will have to be given to outreach and
dissemination to the public, media, practitioners and policy audiences. This strategy is part of every
assessment’s agenda to some degree, but there is much more room for tailoring and reaching new
audiences.
Finishing the assessments is just the first step, further have to follow:
More funding and a longer time frame are needed. The publication of the report is only the beginning
of the strategy. There are too many examples of previous assessment donors who have failed to provide
sufficient funds to really present the case to multiple audiences in multiple formats.
Extra time must be taken to tailor presentations of the assessments for all audiences:
National governments are critical but the agenda must be extended further — beyond cursory
briefings in Washington.
•
•
›
Global Assessment: Bridging Scales and Linking to Policy
��
In the United States, climate change action is most dynamic at the state, local and regional levels
while many of the assessments are using regional and even more local audiences.
Key advocacy players to be briefed are the private sector and the faith-based community. If we want
policy-makers, especially the elected ones, to pay more attention, convincing results of this work
need to be disseminated to these different audiences.
A focus on diversity in governmentToo often assessments have been pegged to just environmental ministries. At times these ministries ask
and pay for the assessments. But the results need to be broadcast more widely than ministerial reports per
se. The interest and the scientific capacity to best interpret the results may reside in these ministries but
the action in policy and budget terms is often in other branches of government.
This is a problem for large conferences as well as assessments (such as UN forums like the Commission
on Sustainable Development [CSD]).
These assessments cannot be merely presented to environment ministers at the Governing Council for
UNEP, or OECD environmental ministers’ meetings.
There are opportunities to link to the World Bank and OECD’s economic concerns.
UNEP’s regional Africa Environment Outlook 2 has effectively fed into larger political and economic
regional processes.
We need more of these connections in the production of the report and to place finance, health, foreign
and development ministers and regional political bodies centre stage as key target audiences.
Politicization of scienceThere is a need to address the politicization of science on the one hand and the assumption by some in the
scientific world that convincing evidence will on its own generate action on the other.
We must recognize the different roles of science policy across national contexts.
Politicization of climate science in particular under the current United States administration is a real
concern.
This politicization raises the importance of formal and informal scientific collaborations with science
communicators and advocacy communities.
An important issue is briefing multiple components of national governments — legislative as well as
executive in the United States for example which is not a parliamentary system.
These are new and sometimes uncomfortable roles for scientists and modelers who are used to only
dealing with counterparts at environment ministries.
›
›
•
•
•
•
•
•
•
•
•
GWSP Issues in Global Water System Research
�0
Global assessments: expectations of policy makers
Angela Cropper,
The Cropper Foundation, Trinidad & Tobago, W.I.
This article concerns expectations of policy-makers of all of the four environment-related
assessments being launched in less than 12 months. This is a very difficult assignment at the
global level, especially as the assessments are still ongoing, or are just being released and because
this morning’s presentations were not available beforehand.
Thus it has been a daunting task to know what to select for commentary and to speculate about policy-
makers’ expectations in the very short time of ten minutes. It is assumed that policy-makers have a similar
dilemma: When assessments are increasingly comprehensive — even for a single one — the issues
become more overwhelming and more interlinked and thus there is greater difficulty in knowing where
to intervene in policy terms; unless the authors of the assessments provide guidance in doing so, which
may in turn take authors beyond the boundaries of assessments, strictly speaking.
Just as technical advisors, policy analysts or policy-makers are likely to be stampeded when four or more
assessments hit their desks in less than 12-months, so this analysis will have to be considered in the same
context.
At a general level, it is presumed that policy-makers would expect that each Assessment would:
Increase and improve the evidence base for the policy responses identified.
Show how the problems have changed over time: How they have increased/decreased, changed their
manifestation and impacts, or how they might have been affected by previous policies.
Have a political role to energize people and systems, to catalyse action among policy-makers and the
public.
Enhance the public sector’s capacity to evaluate and select various interventions that would address the
specific issue or need, while contributing to general sustainability objectives.
On Agricultural Assessment and GEO-4, some more general comments are provided hereunder.
Agricultural Assessment (AA)It is presumed that the AA will offer advice to policy-makers on:
food security prospects by region/country (perhaps this is done in the regional assessments);
the relative value and trade-offs of traditional agricultural knowledge versus GMO and transgenic
technology in meeting food needs;
the likely impacts of climate change on agricultural prospects in various locations, and the scope for
intervention given the uncertainty about precise impacts;
the significance of projected water scarcity for agricultural and environmental security;
how unequal access to science and technology impacts on the need for all societies to have increased
food production and security;
how trade liberalization negatively impacts on agriculture through the driving forces of competitivity,
taste and demand;
how agriculture is embedded in various environmental issues and how to unravel this to pinpoint
interventions.
•
•
•
•
•
•
•
•
•
•
•
Global Assessment: Bridging Scales and Linking to Policy
��
GEO-4This is understood to be an “assessment of assessments”. Accordingly, it should advise policy-makers
about:
Consistency/inconsistency across assessments.
Different messages and the reasons or special situations to which they might apply.
The synthesis that these assessments make according to themes/issues; according to regions, for
example:
How do the issues of climate change, food security and environmental sustainability come together
with regard to biofuels?
How can they deal with the competition for land for producing biofuels (which would contribute
to climate goals), for producing food to achieve food security, and the setting aside of areas for the
maintenance of biodiversity?
How to manage competition for water use for human activities and for maintenance of the integrity
of aquatic ecosystems?
Interlinkages among the findings: spatial, temporal, governance levels.
Compelling arguments and illustrations of how and what policy interventions lead to desirable
outcomes: Perhaps this is done in the scenarios?
Process (a process chart?) of how to intervene in complex syndromes.
Indications of the cost of policy inaction or delay.
The scope and indicative content for GEO-4 were set out by the UNEP Governing Council. It was supposed
to assess progress since the Brundtland Report. It will be recalled that the Brundtland Report elaborated
the concept of Environment and Development as symbiotic — two sides of the same coin. Now it can be
seen that GEO-4 has been titled “Environment for Development”. This is unfortunate. It appears to be the
opposite of what the Brundtland Commission worked hard to overcome — the notion that the resources
of the Environment exist primarily for fuelling Development. Was this not the prevalent conception and
practice before Brundtland?
The conceptual framework used for the GEO-4 is highly complex — seemingly too complex — and it
obfuscates the basic relationships about which the policy-maker is being advised.
Surely twenty years after Brundtland and fifteen years after the Earth Summit, the “key messages to
decision-makers” would avoid the old generic formulations which are difficult to translate into precise
policy interventions for specific situations which the policy maker faces? More technical summaries are
warranted and possible at this stage, given the technical content within the assessment, for example:
GEO-4’s sustainability scenarios show that investments in Health and Education contribute to
sustainability, but over a long time frame (the lag time is longer compared to investments simply to
increase GDP).
The incremental value of such investments is greater in developing than in developed countries, for
obvious reasons.
The graphs show that rates of negative changes decrease over a long time frame given appropriate
policy interventions.
Should GEO-4 not illustrate what policy measures might account for what outcomes in relation to the
Millennium Development Goals?
•
•
•
›
›
›
•
•
•
•
•
•
•
•

GWSP Issues in Global Water System Research
��
Throughout the presentation of GEO-4 environment and development are intertwined, but in a somewhat
antithetical way, not symbiotically. The GEO-4 should help to move the policy-maker further away from
the former and closer to the latter. Especially as twenty years after Brundtland, we have made changes at
the margin, but the core approaches to economic development remain unchanged.
It appears that it is much easier to conduct these assessments than to take the actions they require, or to
influence the appropriate actions to be taken. To be fair to the policy-maker, that person has many pressing
needs which, unless these assessments are instrumental in overcoming them, will continue for a long
time. Among these pressing needs are what I call the “how to” needs:
How to overcome the silos of public administration systems which persist in sectoral arrangements
and responsibilities for what are intricately interwoven issues?
How to identify, assess and make the inevitable trade-offs?
How to weigh and evaluate the various options for solutions?
How to reduce or eliminate the political risk of taking tough action?
How to trace the impacts of previous efforts?
How to verify what is happening as a result of poverty eradication efforts?
How to achieve economic growth and industrialization without environmental damage?
The range and number of trade-offs, the opportunities for synergy and the lag time for impacts from
policy interventions increase complexity for decision-makers. This complexity should not be ignored. In
my opinion, they need to be presented with more ideas and assessments of the “how to’s”.
At an even more general level, I believe we should ask other questions of these assessments:
Do they address the needs of both developed and developing countries?
Do they help to dislodge GDP and GDP per capita as the paramount measure of development?
Do they explore scenarios based on increasing inequality?
What would spur the urgent policies and actions required?
How to move environmental policy from the periphery to the core of decision-making (according to
GEO-4 this is a key message)?
How does international cooperation need to improve in order to make the policies required possible?
Finally I would like to emphasize four main dilemmas for the policy-maker:
How to deal with complexity: interlinkages, trade-offs and time lags?
How to overcome or attenuate the constraints of the sectoral organization of public administration
systems?
How to reduce the political risk of policies that are indicated?
How will international cooperation make the policies required possible?
•
•
•
•
•
•
•
•
•
•
•
•
•
1.
2.
3.
4.
Global Assessment: Bridging Scales and Linking to Policy
��
Scenarios of the 4th Global Environment Outlook
GWSP Issues in Global Water System Research
��
The development of the GEO-4 scenarios and their basic storylines
Dale. S. Rothman
International Institute for Sustainable Development, Canada
Introduction
The Global Environment Outlook (GEO) process of UNEP, currently in its fourth version, has
refined and updated four scenarios for the future that had been developed in GEO-3. The scenarios
consider the impact of various societal efforts to deal with interlinked problems of environment
and development. This presentation will review the overall objectives of the exercise and the development
of the scenarios as well as introduce the basic scenario storylines. Specific results from the scenario
exercise will be provided in the presentations by Alcamo and Ringler.
Objectives of the outlook component of GEO-4During the GEO-4 regional consultations in autumn 2004, a strong preference was expressed by
participants to retain the basic characteristics of the scenarios, rather than to restart the process. Thus, the
scenarios presented here should be seen as revised and updated versions of those from GEO-3, both in
terms of the narratives and the quantification (see UNEP/RIVM 2004). Still, they have been influenced by
more recent scenario exercises, both those that drew directly from GEO-3, e.g. regional studies in Africa
(UNEP 2006) and Latin America (UNEP 2004), and those that only marginally considered the scenarios
presented in GEO-3, most notably the global and subglobal scenarios developed as part of the Millennium
Ecosystem Assessment (MA 2005; Lebel et al. 2005).
UNEP also solicited recommendations from scenario experts around the world with regard to how the
GEO-4 scenarios could be best improved and, at the same time, further the general area of environmental
scenario development. Among the suggestions were to:
Improve the global–regional and regional–regional links.
Extend the time horizon of the scenarios from 2032 to 2050.
Improve and extend the quantitative aspects of the scenarios.
Extend the use of the scenarios for analysis of options for action.
Improve the communicability of the scenarios.
Explore specific feedback loops between drivers and between outcomes and drivers within the
scenarios.
These were underpinned by the general suggestion to make the global scenarios less top-down by
increasing regional participation from the outset. As a result the chapter development was designed to
bring about strong two-way interactions between regional and global experts, along with countless other
experts from around the world, on both the narrative and quantitative aspects of the scenarios.
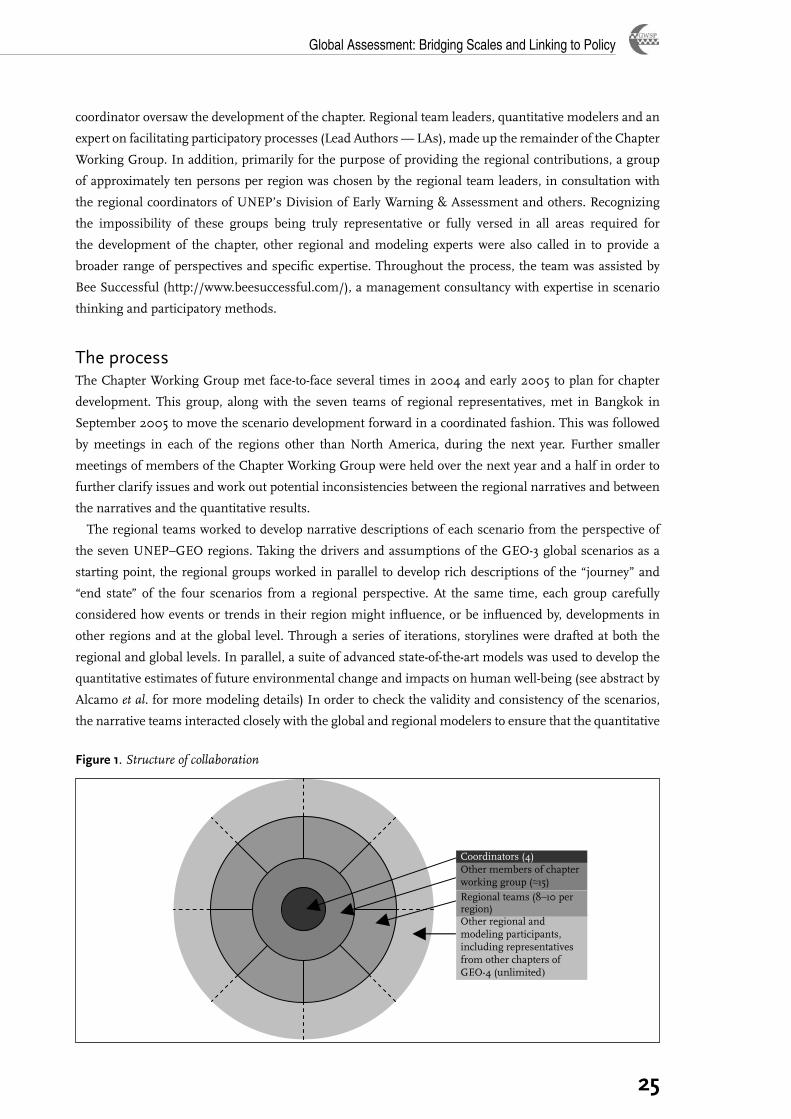
The contributorsThe structure of collaboration followed in developing the chapter was intended to allow for an organized
means of contribution from a large group of participants and to provide as many people as possible with
ownership of the process and its outcomes. The three Coordinating Lead Authors (CLAs) and chapter
•
•
•
•
•
•
Global Assessment: Bridging Scales and Linking to Policy
��
coordinator oversaw the development of the chapter. Regional team leaders, quantitative modelers and an
expert on facilitating participatory processes (Lead Authors — LAs), made up the remainder of the Chapter
Working Group. In addition, primarily for the purpose of providing the regional contributions, a group
of approximately ten persons per region was chosen by the regional team leaders, in consultation with
the regional coordinators of UNEP’s Division of Early Warning & Assessment and others. Recognizing
the impossibility of these groups being truly representative or fully versed in all areas required for
the development of the chapter, other regional and modeling experts were also called in to provide a
broader range of perspectives and specific expertise. Throughout the process, the team was assisted by
Bee Successful (http://www.beesuccessful.com/), a management consultancy with expertise in scenario
thinking and participatory methods.
The processThe Chapter Working Group met face-to-face several times in 2004 and early 2005 to plan for chapter
development. This group, along with the seven teams of regional representatives, met in Bangkok in
September 2005 to move the scenario development forward in a coordinated fashion. This was followed
by meetings in each of the regions other than North America, during the next year. Further smaller
meetings of members of the Chapter Working Group were held over the next year and a half in order to
further clarify issues and work out potential inconsistencies between the regional narratives and between
the narratives and the quantitative results.
The regional teams worked to develop narrative descriptions of each scenario from the perspective of
the seven UNEP–GEO regions. Taking the drivers and assumptions of the GEO-3 global scenarios as a
starting point, the regional groups worked in parallel to develop rich descriptions of the “journey” and
“end state” of the four scenarios from a regional perspective. At the same time, each group carefully
considered how events or trends in their region might influence, or be influenced by, developments in
other regions and at the global level. Through a series of iterations, storylines were drafted at both the
regional and global levels. In parallel, a suite of advanced state-of-the-art models was used to develop the
quantitative estimates of future environmental change and impacts on human well-being (see abstract by
Alcamo et al. for more modeling details) In order to check the validity and consistency of the scenarios,
the narrative teams interacted closely with the global and regional modelers to ensure that the quantitative
5
Figure 1. Structure of collaboration
Table 1. Chapter outline Introduction Fundamental assumptions behind the scenarios Snapshots of four futures
Markets First Policy First Security First Sustainability First
Implications of the scenarios Demographic and economic change Atmosphere LandWater BiodiversityHuman well-being and vulnerability
Key messages from the regions AfricaAsia and the Pacific EuropeLatin America and the Caribbean North America West Asia Polar regions
Risks and opportunities of the future Global change — turning points and thresholdsInterlinkages
Conclusions
Other regional and modeling participants, including representatives from other chapters of GEO-4 (unlimited)
Regional teams (8–10 per region)
Other members of chapter working group ( 15)
Coordinators (4)
Figure �. Structure of collaboration
GWSP Issues in Global Water System Research
��
and qualitative components of the scenarios complemented and re-inforced each other (see Figure 2).
Furthermore, the scenarios were critically reviewed by experts in particular areas, e.g. energy, many of
whom were contributors to other chapters of this report.
A concerted effort was made throughout this process to build regional capacity with respect to scenario
development, as well as to make the resulting regional material a central part of the global storylines. In
particular, special attention was given to the regional priority issues identified early in the GEO-4 process.
These have been tracked through the scenarios.
We feel that we have made several advances in the area of global scenario development. At the same
time, we acknowledge some shortcomings in our efforts, which remain common in almost all similar
exercises; therefore, we feel it is important that the scenarios be read with certain caveats in mind.
Among the advances are:
Advances in general methodology
The scenarios, especially for the period 2030–2050, have been developed as an interlinked set of
regional and global stories.
Increased emphasis on regional aspects.
Improved links to other components of the overall assessment (GEO-4).
Advances in quantification
Because it includes integrated economic, demographic and socio-political components, the
inclusion of the International Futures model has made it possible to explore policy interventions
and certain impacts on human well-being more explicitly than in previous environmental scenario
exercises.
The inclusion of the IMPACT, GLOBIO3 and improved EcoOcean model allows us to better address
issues related to agriculture, biodiversity and marine fisheries
A few of the key caveats are:
We held certain key assumptions constant across the scenarios
No “magic” technological breakthroughs, e.g. clean fusion, dramatic extension of life expectancy.
Availability of natural resources, e.g. oil and gas, in the mid-range of current estimates.
Level of environmental robustness, e.g. climate sensitivity, in the mid-range of current estimates.
Significant challenges remain in including quantitatively much of the feedback from environmental
change to socio-economic developments
We have looked at a few of them, but have not had time to undertake further rounds of model
iteration.
Thus, as with all of the scenario exercises we are aware of, most of the quantitative information
related to human well-being presented does not fully reflect the impacts of environmental change.
The level of iteration between the narratives and the numbers was lower than desired
Thus, we have not fully resolved all inconsistencies between the narratives and numbers.
The structure of the chapter and the basic storylinesTable 1 presents the basic outline of the chapter. This reflects the desire to link the scenarios to the
other chapters in the overall volume, as well as to provide an opportunity for each region to present key
highlights.
•
›
›
›
•
›
›
•
›
›
›
•
›
›
•
›
Global Assessment: Bridging Scales and Linking to Policy
��
Table 2 summarizes the key assumptions behind each of the scenarios. At their core, the scenarios explore
the implications for the environment and human well-being of alternative assumptions about who is making
the key decisions, i.e. the dominant actors; how these decisions are made, i.e. the dominant approaches to
governance; and why certain decisions are made, i.e. the dominant priorities. These assumptions, along
with those made about key system relationships, such as the precise sensitivity of the climate system
to increased concentrations of greenhouse gases, or the exact effect of a reduction of crop yields on the
health of some groups, underpin the developments in the key drivers, which ultimately determine the
implications of the scenario in terms of environmental changes and their impacts on human well-being.
In the GEO-4 conceptual framework, the key drivers of environmental change include: institutional and
socio-political frameworks, population demographics, economic demand, markets and trade, scientific
and technological innovation and value systems. This list is much the same as that used in GEO-3, as well
as in the Millennium Ecosystem Assessment (Nelson 2005) and other recent scenario activities.
Figure 2 provides another glimpse into the nature of the scenarios. It illustrates the strength of the
investments targeted to the set of opportunities for reducing vulnerability in human–environment systems
and improving human well-being presented elsewhere in GEO-4. Other than for trade, technology and
resource access, investments are assumed to be lower in Markets First than in either Policy First or
Sustainability First. Sustainability First is distinguished from Policy First by the added emphasis placed
Introduction
Fundamental assumptions behind the scenarios
Snapshots of four futuresMarkets FirstPolicy FirstSecurity FirstSustainability First
Implications of the scenariosDemographic and economic changeAtmosphereLandWaterBiodiversityHuman well-being and vulnerability
Key messages from the regionsAfricaAsia and the PacificEuropeLatin America and the CaribbeanNorth AmericaWest AsiaPolar regions
Risks and opportunities of the futureGlobal change — turning points and thresholdsInterlinkages
Conclusions
Table �. Chapter outline

GWSP Issues in Global Water System Research
��
Table �. Scenario summaries
7
Markets First
The private sector, with active government support, pursues maximum economic growth as the best path to improve the environment and human well-being. Lip service is paid to the ideals of the Brundtland Commission, Agenda 21 and other major policy decisions on sustainable development, focusing more on the sustainability of markets rather than the human–environment system. Technology fixes to environmental challenges are emphasized at the expense of other policy interventions and some tried-and-tested solutions.
Policy First
Government, with active private and civic sector support, initiates and implements strong policies to improve the environment and human well-being, while still emphasizing economic development. Some measures aimed at promoting sustainable development are introduced, but the tensions between environment and economic policies are biased towards social and economic considerations. Still, it does bring the idealism of the Brundtland Commission to overhauling the environmental policy process at different levels, including efforts to implement the outcomes of the Rio Earth Summit, WSSD, and the Millennium Summit. The emphasis is on more top-down approaches, due in part to desires to make rapid progress on key targets.
Security First
Government and the private sector compete for control in efforts to improve, or at least maintain, human well-being for mainly the rich and powerful in society. Security First, which could also be described as Me First because of its focus on a minority — rich, national and regional actors— emphasizes, sustainable development only in the context of maximizing access and use of the environment to those in and/or having power. Contrary to the Brundtland doctrine of interconnected crises, responses under Security First re-inforce the silos of management and the UN role is viewed with suspicion, particularly by some rich and powerful segments of society.
Sustainability First
Government, civil society and the private sector work collaboratively to improve the environment and human well-being, with a strong emphasis on equity. Equal weight is given to environmental and socio-economic policies and accountability, transparency and legitimacy are stressed across all actors. It brings the idealism of the Brundtland Commission to overhauling the environmental policy process at different levels, including strong efforts to implement the outcomes of the Rio Earth Summit, WSSD and the Millennium Summit. Emphasis is placed on developing effective public–private sector partnerships not only in the context of projects but also governance, ensuring that stakeholders across the spectrum of the environment-development discourse provide strategic input in policy-making and implementation. There is acknowledgement that these processes take time and that their impacts are likely to be more long term than short term.
Global Assessment: Bridging Scales and Linking to Policy
��
on equity and shared governance, particularly at the local level. Not surprisingly, the overall level of
investments in these opportunities is assumed to be the lowest in Security First, although this does not
rule out significant efforts by particular groups.
Together, these assumptions highlight the general character of the scenarios. As is the case for most
scenarios, these four are caricatures in that the real future will include elements of all four and many
others. Differences will certainly exist across regions and over time in any given future, just as they do
today.
References
Lebel. L., Thongbai, P. & Kok, K. 2005. Sub-global assessments. In Millennium assessment ecosystems and human well-being: multi-scale assessments: findings of the sub-global assessments working group. Washington DC, Island Press.
Millenium Ecosystem Assessment (MA). 2005. Ecosystems and human well-being: scenarios: findings of the scenarios working group of the Millennium Ecosystem Assessment working group. Washington DC, Island Press.
UNEP/RIVM. 2004. The GEO-3 Scenarios 2002–2032: Quantification and analysis of environmental impacts. In UNEP/DEWA/RS.03-4 and RIVM 402001022, ed. Potting &Bakkes.
UNEP. 2004. GEO Latin America and the Caribbean environment outlook 2003. Nairobi, UNEP.
UNEP. 2006. Africa environment outlook 2: our environment, our wealth. Nairobi, UNEP.
Figure �. Strength of investments in opportunities for reducing vulnerability in human-environment systems and
improving human well-being
8
Figure 2. Strength of investments in opportunities for reducing vulnerability in human-environment systems and improving human well-being
0
4
Integrating governance across levels and sectors
Promoting free and fairer trade
Improving health
Building institutions for equityBuilding and bridging
knowledge to enhance coping capacity
Building a culture of responsibility
Building capacity for implementation
Investing in technology for adaptation
Resolving conflict through environmental cooperation
Markets First Policy First Security First Sustainability First
Securing access to and maintaining natural resource assets
Strengthening local rights
GWSP Issues in Global Water System Research
�0
Messages from global modeling of the GEO-4 scenarios
Joseph Alcamo, Kerstin Verzano and Tim aus der Beek Center for Environmental Systems Research, University of Kassel, Germany
The United Nations Environment Programme periodically publishes an assessment of the global
environment. In the latest assessment, Global Environment Outlook Number 4 (GEO-4), a suite of
linked global models is used to make quantitative estimates of the developments of environmental
indicators up to 2050 under driving forces of change (Figure 1). A set of four scenarios was investigated that
covered a wide range of assumptions about future population, economic activity and other socio-economic
factors. For a range of indicators, the rate of global environmental change slows or even reverses towards
the middle of the century. In all scenarios, the rates of cropland expansion and forest loss steadily decline
over the scenario period. The rate of increase of water withdrawals eventually decreases in three out of
four scenarios. Some scenarios also show a slackening in the tempo of species loss, greenhouse gas build-
up and temperature increase. The slowing of these global indicators is due to the expected completion of
the demographic transition, the saturation of material consumption and technological advances.
Why is this deceleration important? Because it gives us hope that human society and nature can
more successfully catch up with the pace of change and adjust to it before experiencing many negative
consequences. If the pace of change slows, then countries have a better chance to keep pace with the
building of new and necessary water or wastewater treatment plants; natural ecosystems have more time
to migrate, while conservation policies have a better chance to catch up with the rate of species loss.
But the scenario analysis also indicates that, despite a possible slowing of global environmental change,
the peak rate of change differs strongly among scenarios. Differing rates of change also lead to very
IMPACTW orld food production
WaterGAPW orld wa te r resources
W ater availability
Storylines • M arke ts F irs t Security F irs t Po licy F irs t Susta inability F irs t
Model Inputs• Demographic • Economic• Technological
E lectricity dem and
C lim ate change
L ivestock IMAGE 2 G lobal Land use change
… Energy production
… C lim ate change
International Futures
W orld socio -econom ic system
EcoSimR egional m arine
fisheries
F ish C onsum ption
Agricultural a rea &production
Irriga ted a rea & e fficiency
Model Outputs•Socio-economic indicators •Food production•Land use change•Water use•Water availability•Terrestrial biodiversity•State of marine resourcesGloBio
G lobal Terrestria l B iodive rsity
C lim a te change
Land use change
G loba l E nv ironm enta l O utlook 4Global Modeling Exercise
Figure 1. Suite of models used in UNEP’s global modeling exercise. Also indicated are the main categories of
information exchanged between the models
Global Assessment: Bridging Scales and Linking to Policy
��
different end-points for the scenarios. Under one scenario, 13 percent of all original species is lost between
2000 and 2050 whereas under another only 8 percent is lost. The atmospheric CO2 concentration in 2050
is over 560 ppm under one scenario and about 475 ppm under another. The higher the rate of change
and end-point of the scenarios, the greater the risk that thresholds in the earth system will be exceeded in
coming decades resulting in sudden, abrupt, or accelerating changes. For example, the scenarios showed
that the fastest rate of increase in fish catches is also accompanied by a significant decline in marine
biodiversity, leading to a higher risk of fishery collapse by the mid-century. These results raise a basic
question: Which point will be reached first — a tempo of environmental change slow enough for society
and nature to adapt to, or levels of change that exceed key thresholds of the earth system?
Acknowledgements: The following colleagues made important contributions to the GEO-4 global modeling
exercise: Jackie Alder, Villy Christensen, Bas Eickhout, Yasuaki Hijioka, Barry Hughes, Lera Miles, Rajesh
Nair, Claudia Ringler and Dale Rothman.
GWSP Issues in Global Water System Research
��
Food security and other aspects of human well-being in the GEO-4 scenarios
Claudia Ringler and Siwa Msangi
International Food Policy Research Institute (IFPRI), Washington, DC, USA
Introduction
UNEP’s Global Environment Outlook (GEO), currently in its fourth version, has refined and
updated four scenarios for the future that had been developed in GEO-3. The scenarios consider
the impact of various societal efforts to deal with interlinked problems of environment and
development. They include:
Markets First, in which the private sector, with active government support, pursues maximum economic
growth, trusting this to be the best path towards the improvement of the environment and general
human well-being.
Policy First, where the government sector, with active private- and civic-sector support, implements
strong policies intended to improve the environment and general human well-being, while still
emphasizing economic development.
Security First, where the government sector and certain private-sector actors compete for control in
efforts to improve, or at least maintain, human well-being for select, more powerful, groups.
Sustainability First, where the civic, government and private sectors work collaboratively to improve the
environment and general human well-being, with a strong emphasis on equity.
These scenarios were developed both qualitatively and quantitatively up to 2050. A suite of advanced
state-of-the-art models has been used to develop the quantitative estimates of future environmental
change and impacts on human well-being. IFPRI’s International Model for Policy Analysis of Agricultural
Commodities and Trade (IMPACT) was used to quantitatively analyse the future of the food sector under
these four alternative scenarios.
Results for the food sectorOverall, food production increases in all four scenarios, driven by both population and economic growth.
During 2000 to 2050 cereal demand grows most rapidly under the Policy First and Markets First scenarios
as a result of increased focus on economic development and the provision of complementary services
and investments by the public and private sectors. In Security First, food production barely keeps up with
population growth after 2020 and the beginnings of a decline are seen around 2040. By 2050 there is
more than a 30 percent difference in per capita food availability between Security First and Sustainability
First. Much of future cereal demand increases is driven by rapid increases in meat demand, particularly in
the Asia (ASAP) region (Figure 1). Again, most of the growth occurs under Policy First, followed by Markets
First.
However, despite the very rapid increases in meat demand under Policy First, the developing world will
not be able to catch up to the consumption levels experienced in North America or Europe, even by 2050.
For example, Africa’s meat consumption levels, projected at 29 kg/cap by 2050 would still be less than
half of Europe’s and less than one-third of North America’s consumption levels today.
•
•
•
•
Global Assessment: Bridging Scales and Linking to Policy
��
Figure �. Meat demand projections for 2050, GEO-4 scenarios
One important question for both human well-being and environmental sustainability relates to the way
food will be produced in the future: While extensive, low-input food production would reduce the need for
agricultural chemicals and large additional diversions of precious freshwater resources, large-scale
extensification would threaten remaining forested lands, particularly in Latin America and Sub-Saharan
Africa. In other regions, such as Asia, little additional land could be made available if future food production
focuses on low-input agriculture rather than intensification.
Projections indicate that under all four scenarios, food production growth will primarily come from
yield increases, with more food produced on only slightly larger areas. Most of the area expansion will
be confined to Latin America and Sub-Saharan Africa, while Asia is expected to see some contraction in
agricultural areas. However, given that yield growth of major staple crops has slowed in the last several
decades as a result of already high levels of intensification and declining investments in agricultural
research and extension, gaps between food supply and demand are expected to increase in the coming
decades in most developing countries.
These gaps are further widened by increased resource scarcity as a result of climate change, and growing
demands for non-food uses of agricultural land, including for biofuel.
Figure 2 presents projections for net cereal trade for the four GEO-4 scenarios. Under Markets First, the
increased demand for food, freer trade, the phasing out of agricultural subsidies, as well as technological
advances contribute to rapidly increasing trade in cereals with North America and Europe exporting more
food to developing countries that face increasing difficulties in meeting domestic demands. Under Security
First, on the other hand, the continuation and extension of trade barriers limit the movement of goods
across borders. As a result, overall trade in agricultural commodities slows down considerably.
GWSP Issues in Global Water System Research
��
Figure �. Net trade in cereals, 2000 and projected 2050, GEO-4 scenarios
-200-150-100
-500
50100150200250
AFR WAS EUR LAC NAM ASAP
mill
ion
tonn
es
2000 MktF PolF SecF SusF
Dampened food demand combined with trade restrictions result in reduced calorie availability in poor
countries. Reduced calorie availability together with complementary services, such as education, access to
clean water and health are important indicators for future levels of childhood malnutrition. The impact of
these factors can be clearly seen in Figure 3 for the Security First scenario, which shows increased numbers
of malnourished children up to 2050. On the other hand, economic growth coupled with increased equity
and investments in social services contribute to rapid declines in childhood malnutrition up to 2050
under Sustainability First.
Figure �. Impacts on childhood malnutrition, 2000, and projected 2025 and 2050 GEO-4 scenarios
0
50
100
150
200
250
MktF PolF SecF SusF
mill
ion
child
ren
2000 2025 2050
Global Assessment: Bridging Scales and Linking to Policy
��
ConclusionsWhat do the scenarios indicate with respect to food outcomes and human well-being?
To a certain degree, the scenarios exhibit greater or lesser levels of certain aspects of human well-being
by design. Markets and Sustainability First assume a greater emphasis on individuals’ freedom to make
choices and take action, whereas Policy First focuses more on government actions; Security First caters to
elites. At the same time, the full picture of human well-being can only be seen by considering the detailed
developments within the scenarios. For most regions and subregions, there are fairly consistent patterns
of improvements with Security First at the lower end, and Policy and Sustainability First at the other end.
For most environmental outcomes, the sequence places Sustainability First as the scenario with the best
outcomes; but these results must be weighed against improvements in other indicators.
Most importantly, under all four scenarios, childhood malnutrition levels remain unacceptably high;
even in the “best” scenario — from a food perspective — inequality in access to high-value foods is
expected to remain highly skewed even by 2050. Thus, special efforts are required to ensure that all
people gain greater access to more affordable food, particularly in a world of growing scarcity. While major
achievements have been made in the past decades of relative abundance and rapid economic growth,
adequate levels, variety and quality of food remain out of reach for 800 million people. The coming
decades, which will be characterized by greater resource scarcity and rapidly growing demand, will make
it much more difficult to reduce the number of food-insecure people. Therefore changes in policies and
investments cannot wait till tomorrow.

GWSP Issues in Global Water System Research
��
Global Assessment: Bridging Scales and Linking to Policy
��
The Role of Land Use in Integrated Water Management
GWSP Issues in Global Water System Research
��
The global challenge of water for food: key findings from the Comprehensive Assessment of Water Management in Agriculture
Johan Rockström
Stockholm Environment Insitute & Stockholm Resilience Centre, Sweden
No economic sector consumes so much freshwater as agriculture. Currently an estimated 70
percent of the global withdrawals of freshwater from rivers, lakes and groundwater, so-called
“blue” water, is used for agriculture. Several river basins around the world have closed, i.e. they
no longer reach the sea. The demand for more water for food grows rapidly under the pressure of two
forces — population pressure and economic growth. An adequate human diet requires approximately 1 300
m3/cap/year, a volume that increases with improved welfare due to the increase in animal-based calories
(which consume more than five times the water volumes required to produce an equivalent amount of
vegetarian food). With 850 million people currently malnourished in the world, rapidly changing (to more
water-consuming) diets in regions undergoing economic growth and a population growth of another 2.5
to 3 billion people over the coming 50 years, the pressure on the planet’s finite freshwater resources is
daunting. Moreover, the pressure is essentially concentrated on developing countries where these socio-
economic forces are concentrated. They are predominantly located in tropical regions where freshwater
resources are subject to larger extremes than in temperate regions (there is more often too little or too
much water) and where evaporative demand is three to four times higher.
With these issues as a starting point, the Comprehensive Assessment of Water Management in
Agriculture (CA), a global assessment that has gathered almost 1 000 scientists over five years, set out to
analyse the options available to meet future growing freshwater demands in agriculture with a minimum
of trade-offs with ecosystems and societies. The CA assessed the potential of improving all aspects of
agricultural water management, including irrigation, rainfed agriculture, aquaculture, crop and livestock
systems, with a strong emphasis on building resilience and identifying investments in water management
that contribute to sustainability.
One of the fundamental contributions of the CA, and the focus of this presentation, is the need for
a widened integrated approach to agricultural water management. The conventional water resource
management approach — of developing blue water resources for irrigation purposes (through dams,
diversions etc.) — urgently needs to be complemented by a concerted focus on water management in
rainfed agriculture, which depends primarily on “green” water resources, i.e. soil moisture in the root zone,
generated by rainfall infiltration and returning to the atmosphere as evaporation and transpiration flows.
A rationale for a green water focus is presented in Figure 1. This shows the CA estimates of current global
volumes of freshwater consumed to produce food (numbers in km3/year) and the relative importance of
green water (in rainfed agriculture) and blue water (in irrigation systems) to generate the agricultural
outputs.
Figure 1 shows that rainfed agriculture is vastly predominant in Sub-Saharan Africa and rainfall supplies
most of the water for agriculture in South and Southeast Asia; these are the three global hot-spot regions
in terms of future increased water needs for agriculture.
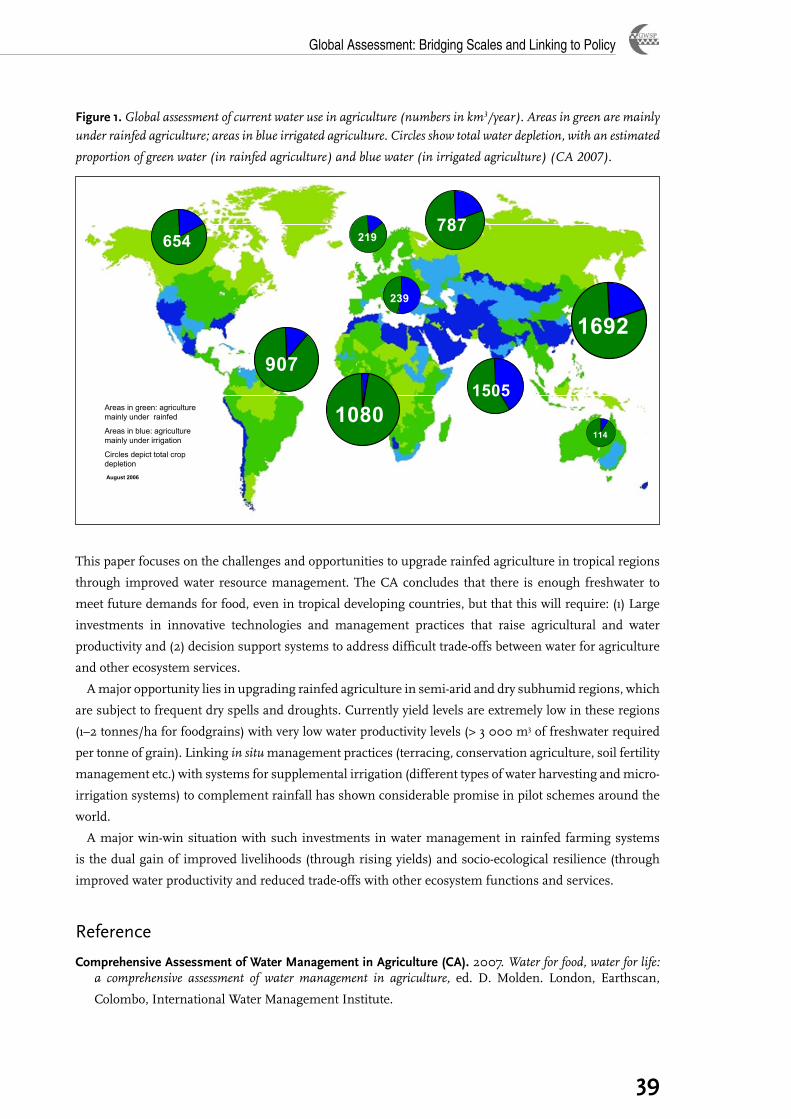
Global Assessment: Bridging Scales and Linking to Policy
��
Figure �. Global assessment of current water use in agriculture (numbers in km3/year). Areas in green are mainly
under rainfed agriculture; areas in blue irrigated agriculture. Circles show total water depletion, with an estimated
proportion of green water (in rainfed agriculture) and blue water (in irrigated agriculture) (CA 2007).
This paper focuses on the challenges and opportunities to upgrade rainfed agriculture in tropical regions
through improved water resource management. The CA concludes that there is enough freshwater to
meet future demands for food, even in tropical developing countries, but that this will require: (1) Large
investments in innovative technologies and management practices that raise agricultural and water
productivity and (2) decision support systems to address difficult trade-offs between water for agriculture
and other ecosystem services.
A major opportunity lies in upgrading rainfed agriculture in semi-arid and dry subhumid regions, which
are subject to frequent dry spells and droughts. Currently yield levels are extremely low in these regions
(1–2 tonnes/ha for foodgrains) with very low water productivity levels (> 3 000 m3 of freshwater required
per tonne of grain). Linking in situ management practices (terracing, conservation agriculture, soil fertility
management etc.) with systems for supplemental irrigation (different types of water harvesting and micro-
irrigation systems) to complement rainfall has shown considerable promise in pilot schemes around the
world.
A major win-win situation with such investments in water management in rainfed farming systems
is the dual gain of improved livelihoods (through rising yields) and socio-ecological resilience (through
improved water productivity and reduced trade-offs with other ecosystem functions and services.
Reference
Comprehensive Assessment of Water Management in Agriculture (CA). 2007. Water for food, water for life: a comprehensive assessment of water management in agriculture, ed. D. Molden. London, Earthscan,
Colombo, International Water Management Institute.
Figure 1 shows that rainfed agriculture is vastly predominant in Sub-Saharan Africa and rainfall supplies most of the water for agriculture in South and Southeast Asia; these are the three global hot-spot regions in terms of future increased water needs for agriculture.
Figure 1. Global assessment of current water use in agriculture (numbers in km3/year). Areas in green are mainly under rainfed agriculture; areas in blue irrigated agriculture. Circles show total water depletion, with an estimated proportion of green water (in rainfed agriculture) and blue water (in irrigated agriculture) (CA 2007).
This paper focuses on the challenges and opportunities to upgrade rainfed agriculture in tropical regions through improved water resource management. The CA concludes that there is enough freshwater to meet future demands for food, even in tropical developing countries, but that this will require: (1) Large investments in innovative technologies and management practices that raise agricultural and water productivity and (2) decision support systems to address difficult trade-offs between water for agriculture and other ecosystem services.
A major opportunity lies in upgrading rainfed agriculture in semi-arid and dry subhumid regions, which are subject to frequent dry spells and droughts. Currently yield levels are extremely low in these regions (1–2 tonnes/ha for foodgrains) with very low water productivity levels (> 3 000 m3 of freshwater required per tonne of grain). Linking in situmanagement practices (terracing, conservation agriculture, soil fertility management etc.) with systems for supplemental irrigation (different types of water harvesting and micro-irrigation systems) to complement rainfall has shown considerable promise in pilot schemes around the world.
A major win-win situation with such investments in water management in rainfed farming systems is the dual gain of improved livelihoods (through rising yields) and socio-ecological
August 2006
114
654
1080
239
787
1505
1692907
219
Areas in green: agriculture mainly under rainfed
Areas in blue: agriculture mainly under irrigation
Circles depict total crop depletion August 2006
114
654
1080
239
787
1505
1692907
219
Areas in green: agriculture mainly under rainfed
Areas in blue: agriculture mainly under irrigation
Circles depict total crop depletion
GWSP Issues in Global Water System Research
�0
Future cropland in Africa: the outlook for green and blue water fluxes
Joseph Alcamoa, Martina Weissa, Rüdiger Schaldacha, Frank Vossa, and Liang Youb
aCenter for Environmental Systems Research, University of Kassel, GermanybInternational Food Policy Research Institute (IFPRI), Washington, DC, USA
The research community has established for a long time that the cycling of water on earth is closely
coupled with land cover characteristics and changes. But only recently have researchers begun to
estimate the interactions between water and land on the continental scale. Understanding these
interactions is important to policy-making because it provides new insight into the adequacy of available
water for future food production and conversely, about the impact of future agricultural areas on regional
water availability.
This paper presents model-based estimates of the effect of long-term changes in land use and cover
in Africa on the flux of water evaporated and transpired from cropland (“green” water fluxes) versus the
amount of water abstracted from water systems for irrigation (“blue” water fluxes). Estimates of current
green and blue water fluxes were computed for a base case (year 2000) and for 2050 under the “Policy
First” scenario of the GEO-4 of the United Nations Environment Programme.
A set of three coupled models was used for this analysis (Figure 1): Changes in future food production
in Africa were computed by the International Model for Policy Analysis of Agricultural Commodities and
Trade (IMPACT) based on assumed demographic and economic developments and by taking world food
trade into account. Changes in food production drive changes in land use and cover; they were computed
by the LandSHIFT model. Under the Policy First scenario, the continental coverage of cropland increases
from 7.5 to 12.3 percent between 2000 and 2050. The change in blue and green water fluxes was computed
by the WaterGAP model based on future changes in land use and cover. (Climate change was not taken
into account in these simulations so that the relationship between changing land use/cover and water
fluxes could be identified.)
For the base case (2000), evapotranspiration from Africa’s cropland (green water flux) was estimated to
be about 1 100 km3/year. By comparison the abstraction of surface water and groundwater for irrigating
crops (blue water flux) amounts to about 140 km3/year. These figures change substantially under future
conditions. According to the Policy First scenario, by 2050 the evapotranspiration from cropland increases
by 60 percent while irrigation abstraction increases by 14 percent.
To sum up, the water transpired or evaporated annually from Africa’s cropland (green water) is currently
about eight times greater than the volume of water used in liquid form to irrigate crops (blue water). By
2050, under the scenario investigated, the volume of evapotranspiration from cropland could become
eleven times greater than the volume of water abstracted for irrigation. These results suggest that it is
highly worthwhile to look for opportunities to reduce the water evaporated or transpired from cropland
(or conversely to increase the “water productivity” of cropland) because the volume of evapotranspiration
is much larger than the volume of water used for irrigation.
But the expansion of cropland leads to other important changes in water fluxes. It is estimated that new
cropland developed in Africa between 2000 and 2050 will have an evapotranspiration rate of around 660
km3/year, whereas the “natural” land it replaces has a much larger evapotranspiration rate (nearly 1 100
km3/year). (The higher rate is explained by the fact that cropland replaces large areas of moist tropical

Global Assessment: Bridging Scales and Linking to Policy
��
vegetation with a relatively high transpiration rate.) As the sum of evaporation and transpiration will be
much lower over the new cropland, major changes in local hydrology and water availability should also
be expected.
Figure �. Set of models used for integrated analysis of blue and green water fluxes in Africa
Integrated Analysis of Blue and Green Water Fluxes in Africa
LandSHIFT Model
A llocation o f ra in fed c rop land
A llocation o f irriga ted c rop land
WaterGAPModel
E vapotransp ira tion R a in fed C rop land“G reen W ater”
E vapotransp ira tion Irriga ted C rop land“G reen W ater”
W ater W ithdrawals Irriga ted C rop land“B lue W ater”
E vapotransp ira tion N atura l vegeta tion“G reen W ater”
D riv ing Forces o fC hang ing C rop land(per country, 2000 and 2050)• C rop production• T ota l a rea o f irriga ted land
IMPACT Model
G E O -4 assum ptions(IFS M odel)• popu la tion , • econom ic grow th ,• techno log ica l change.
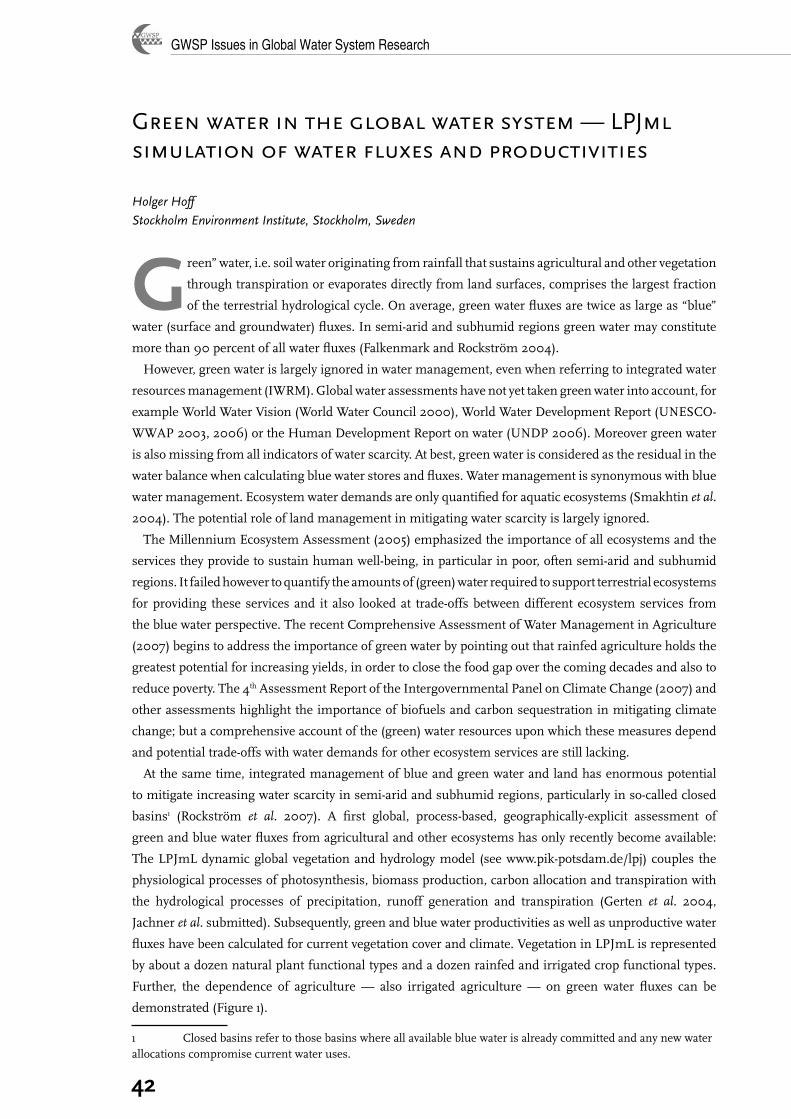
GWSP Issues in Global Water System Research
��
Green water in the global water system — LPJml simulation of water fluxes and productivities
Holger Hoff
Stockholm Environment Institute, Stockholm, Sweden
Green” water, i.e. soil water originating from rainfall that sustains agricultural and other vegetation
through transpiration or evaporates directly from land surfaces, comprises the largest fraction
of the terrestrial hydrological cycle. On average, green water fluxes are twice as large as “blue”
water (surface and groundwater) fluxes. In semi-arid and subhumid regions green water may constitute
more than 90 percent of all water fluxes (Falkenmark and Rockström 2004).
However, green water is largely ignored in water management, even when referring to integrated water
resources management (IWRM). Global water assessments have not yet taken green water into account, for
example World Water Vision (World Water Council 2000), World Water Development Report (UNESCO-
WWAP 2003, 2006) or the Human Development Report on water (UNDP 2006). Moreover green water
is also missing from all indicators of water scarcity. At best, green water is considered as the residual in the
water balance when calculating blue water stores and fluxes. Water management is synonymous with blue
water management. Ecosystem water demands are only quantified for aquatic ecosystems (Smakhtin et al.
2004). The potential role of land management in mitigating water scarcity is largely ignored.
The Millennium Ecosystem Assessment (2005) emphasized the importance of all ecosystems and the
services they provide to sustain human well-being, in particular in poor, often semi-arid and subhumid
regions. It failed however to quantify the amounts of (green) water required to support terrestrial ecosystems
for providing these services and it also looked at trade-offs between different ecosystem services from
the blue water perspective. The recent Comprehensive Assessment of Water Management in Agriculture
(2007) begins to address the importance of green water by pointing out that rainfed agriculture holds the
greatest potential for increasing yields, in order to close the food gap over the coming decades and also to
reduce poverty. The 4th Assessment Report of the Intergovernmental Panel on Climate Change (2007) and
other assessments highlight the importance of biofuels and carbon sequestration in mitigating climate
change; but a comprehensive account of the (green) water resources upon which these measures depend
and potential trade-offs with water demands for other ecosystem services are still lacking.
At the same time, integrated management of blue and green water and land has enormous potential
to mitigate increasing water scarcity in semi-arid and subhumid regions, particularly in so-called closed
basins1 (Rockström et al. 2007). A first global, process-based, geographically-explicit assessment of
green and blue water fluxes from agricultural and other ecosystems has only recently become available:
The LPJmL dynamic global vegetation and hydrology model (see www.pik-potsdam.de/lpj) couples the
physiological processes of photosynthesis, biomass production, carbon allocation and transpiration with
the hydrological processes of precipitation, runoff generation and transpiration (Gerten et al. 2004,
Jachner et al. submitted). Subsequently, green and blue water productivities as well as unproductive water
fluxes have been calculated for current vegetation cover and climate. Vegetation in LPJmL is represented
by about a dozen natural plant functional types and a dozen rainfed and irrigated crop functional types.
Further, the dependence of agriculture — also irrigated agriculture — on green water fluxes can be
demonstrated (Figure 1).
1 Closed basins refer to those basins where all available blue water is already committed and any new water allocations compromise current water uses.
Global Assessment: Bridging Scales and Linking to Policy
��
Figure �. Fraction of green water in total agricultural water fluxes per 0.5° grid cell, the remainder being blue
water (Jachner et al. submitted)
Next, different scenarios of land use, for example reflecting increasing food or biofuel production and
climate change will be tested for their hydrological consequences.
Ultimately, this will yield a better understanding of the trade-offs between different land and water
management interventions in terms of water and carbon fluxes and storage across scales.
Also from the global assessment of green and blue water availability and uses, a new water scarcity index
will be derived that better reflects the real water situation, i.e. green-water dependence of agriculture,
ecosystems and livelihoods.
ReferencesFalkenmark, M. & Rockström, J. 2004. Balancing water for humans and nature, the new approach in
ecohydrology. London, Earthscan.
Gerten, D., Schaphoff, S., Haberlandt, H., Lucht, W. & Sitch, S. 2004. Terrestrial vegetation and water balance - hydrological evaluation of a dynamic global vegetation model, Journal of Hydrology, 286(1–4): 249–270.
Jachner, S. & Gerten, D. Submitted. Global water use in rainfed and irrigated agriculture. Water Resources Research.
Rockström, J., Lannerstad, M. & Falkenmark, M. 2007. Assessing the water challenge of a new green revolution in developing countries. PNAS, 104(15): 6253–6260.
Smakhtin, V., Revenga, C. & Döll, P. 2004. A pilot global assessment of environmental water requirements and scarcity. Water International, 29(3): 307–317.
United Nations Development Programme (UNDP). 2006. Human Development Report 2006. Water scarcity: power, poverty and the global water crisis. New York, UNDP, UK, Houndmills and New York, Palgrave Macmillan.
UNESCO-WWAP (World Water Assessment Programme). 2003. Water for people, water for life. The United Nations World Water Development Report. Paris, UNESCO, New York, Berghahn Books.
UNESCO–WWAP (World Water Assessment Programme). 2006. Water a shared responsibility. The United Nations World Water Development Report 2. Paris, UNESCO, New York, Berghahn Books.
World Water Council. 2000. World Water Vision: making water everybody’s business, by W.J. Cosgrove & F. Rijsberman. London, Earthscan.
GWSP Issues in Global Water System Research
��
Simulation of crop water relations on large scales with high spatial resolutions
Junguo Liua, Hong Yanga and Alexander Zehnderb
aSwiss Federal Institute of Aquatic Science and Technology (Eawag), Duebendorf, SwitzerlandbBoard of the Swiss Federal Institutes of Technology, ETH-Zentrum, Zurich, Switzerland
The agriculture sector is faced by considerable challenges to produce more crops with less available water
due to competition from other sectors. A GIS-based EPIC model (GEPIC) has been developed to analyse
crop water relations on different scales with flexible spatial resolutions. The model was used to simulate
the crop water productivity of winter wheat in China on a spatial resolution of five arc-minutes. Attention
was paid to the impact of the reduction of irrigation supply on wheat production in the North China Plain.
The GEPIC model was also applied to simulate consumptive water use for the production of 17 major
crops on a global scale. These studies showed that the GEPIC model is a practical tool for crop water
relation analysis; the results provide useful information regarding the impact of water management on
food production.
Keywords: GEPIC, crop water productivity, consumptive water use
Introduction
Demographic developments require an increase in global food production, resulting in larger
agricultural water uses unless there are significant improvements in agricultural water
management. On the other hand, with water scarcity escalating in many parts of the world,
agricultural water has been continuously transferred to highly valued domestic and industrial sectors
(Rosegrant and Ringler 2000). The higher water demand and lower agricultural water availability will
challenge future agricultural production and require more crop production per drop of water consumption.
A flexible tool is needed to analyse crop water relations on different scales. Particularly with regard to
ongoing globalization and rising interdependence among countries, there is a growing need to support
water and food policies and decision-making at global and national levels. A systematic model to analyse
crop water relations on large scales with high spatial resolutions would be very useful.
In this context, a GIS-based EPIC model (GEPIC) has been developed by the Swiss Federal Institute of
Aquatic Science and Technology (Eawag) (Liu et al. 2007). This paper presents the development of the
GEPIC model and its application on two scales: the national scale using China as an example and the
global scale.
GEPIC: a GIS-based EPIC model for crop water studiesGEPIC is designed to simulate the spatial and temporal dynamics of the major processes of the soil–crop–
atmosphere management system (Liu et al. 2007). The core of the GEPIC model is a widely applied and
well-calibrated Environmental Policy Integrated Climate (EPIC) model, which uses a daily time step to
simulate the processes of weather, hydrology, crop growth, nutrient cycling, tillage, plant environmental
control and agronomics (Williams et al. 1989). The EPIC model is integrated with a GIS using a loose
coupling approach. This approach relies on the transfer of data files between a simulation model and the
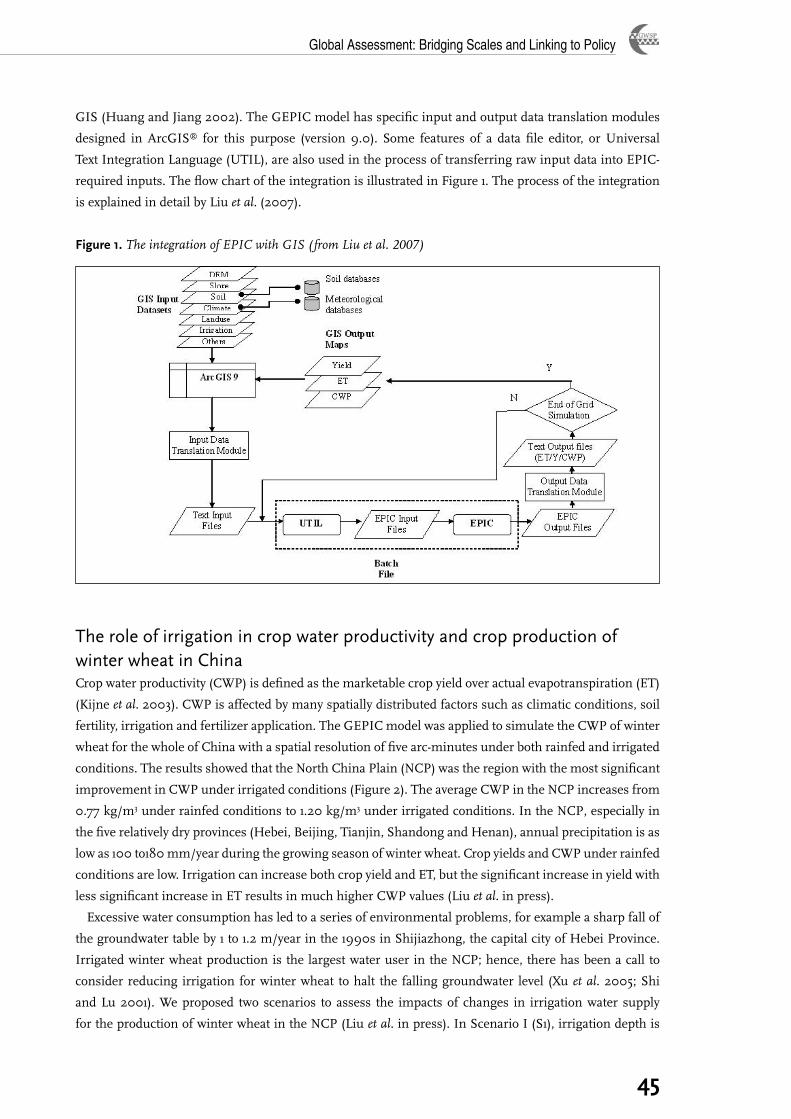
Global Assessment: Bridging Scales and Linking to Policy
��
GIS (Huang and Jiang 2002). The GEPIC model has specific input and output data translation modules
designed in ArcGIS® for this purpose (version 9.0). Some features of a data file editor, or Universal
Text Integration Language (UTIL), are also used in the process of transferring raw input data into EPIC-
required inputs. The flow chart of the integration is illustrated in Figure 1. The process of the integration
is explained in detail by Liu et al. (2007).
Figure �. The integration of EPIC with GIS (from Liu et al. 2007)
The role of irrigation in crop water productivity and crop production of winter wheat in ChinaCrop water productivity (CWP) is defined as the marketable crop yield over actual evapotranspiration (ET)
(Kijne et al. 2003). CWP is affected by many spatially distributed factors such as climatic conditions, soil
fertility, irrigation and fertilizer application. The GEPIC model was applied to simulate the CWP of winter
wheat for the whole of China with a spatial resolution of five arc-minutes under both rainfed and irrigated
conditions. The results showed that the North China Plain (NCP) was the region with the most significant
improvement in CWP under irrigated conditions (Figure 2). The average CWP in the NCP increases from
0.77 kg/m3 under rainfed conditions to 1.20 kg/m3 under irrigated conditions. In the NCP, especially in
the five relatively dry provinces (Hebei, Beijing, Tianjin, Shandong and Henan), annual precipitation is as
low as 100 to180 mm/year during the growing season of winter wheat. Crop yields and CWP under rainfed
conditions are low. Irrigation can increase both crop yield and ET, but the significant increase in yield with
less significant increase in ET results in much higher CWP values (Liu et al. in press).
Excessive water consumption has led to a series of environmental problems, for example a sharp fall of
the groundwater table by 1 to 1.2 m/year in the 1990s in Shijiazhong, the capital city of Hebei Province.
Irrigated winter wheat production is the largest water user in the NCP; hence, there has been a call to
consider reducing irrigation for winter wheat to halt the falling groundwater level (Xu et al. 2005; Shi
and Lu 2001). We proposed two scenarios to assess the impacts of changes in irrigation water supply
for the production of winter wheat in the NCP (Liu et al. in press). In Scenario I (S1), irrigation depth is
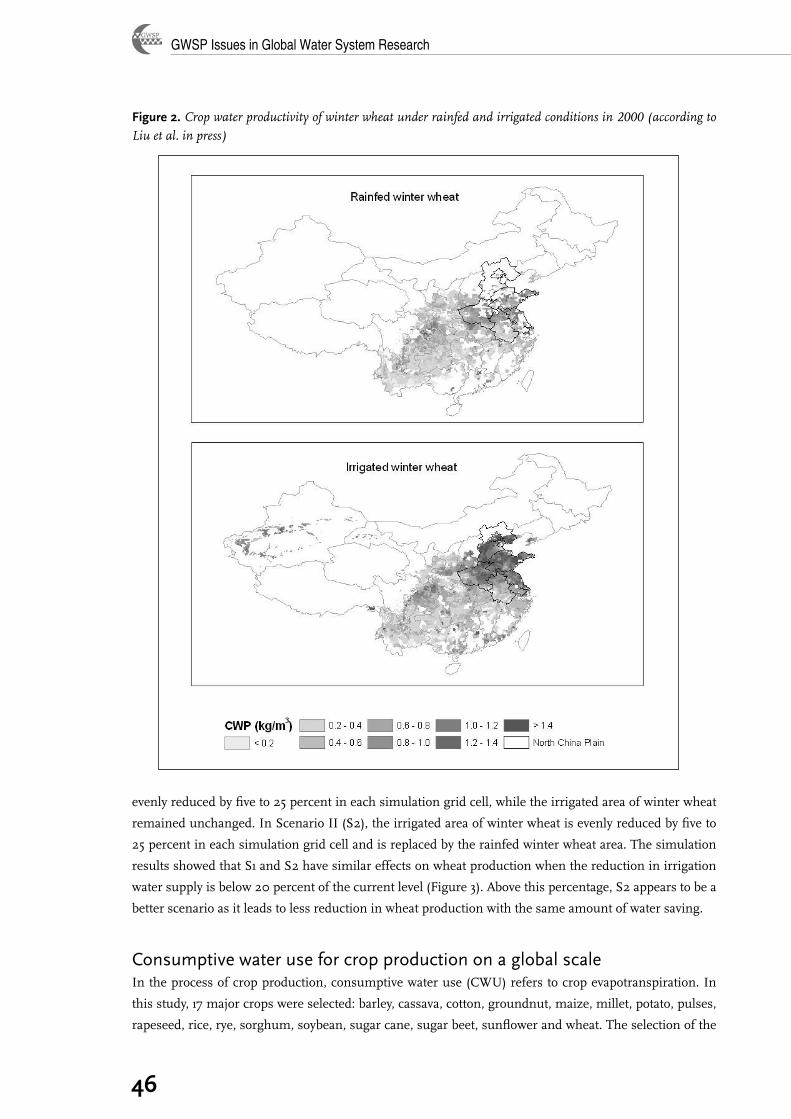
GWSP Issues in Global Water System Research
��
evenly reduced by five to 25 percent in each simulation grid cell, while the irrigated area of winter wheat
remained unchanged. In Scenario II (S2), the irrigated area of winter wheat is evenly reduced by five to
25 percent in each simulation grid cell and is replaced by the rainfed winter wheat area. The simulation
results showed that S1 and S2 have similar effects on wheat production when the reduction in irrigation
water supply is below 20 percent of the current level (Figure 3). Above this percentage, S2 appears to be a
better scenario as it leads to less reduction in wheat production with the same amount of water saving.
Consumptive water use for crop production on a global scaleIn the process of crop production, consumptive water use (CWU) refers to crop evapotranspiration. In
this study, 17 major crops were selected: barley, cassava, cotton, groundnut, maize, millet, potato, pulses,
rapeseed, rice, rye, sorghum, soybean, sugar cane, sugar beet, sunflower and wheat. The selection of the
Figure �. Crop water productivity of winter wheat under rainfed and irrigated conditions in 2000 (according to
Liu et al. in press)

Global Assessment: Bridging Scales and Linking to Policy
��
crops was based on their importance and the availability of high resolution crop distribution maps. The
maps were obtained from Leff et al. (2004) and indicate the portion of each crop in individual grid cells
with a spatial resolution of 30 arc-minutes.
Figure �. Spatial distribution of CWU for crop production (average over 1998–2002) (from Liu et al.
submitted)
CWU was simulated on a global scale with a spatial resolution of 30 arc-minutes. Five steps were involved
in the calculation of CWU in each grid cell. First, the yield and CWP of each crop were simulated. Second,
Figure �. Relation between reduction in irrigation and reduction in wheat production in the NCP (according to
Liu et al. in press)
GWSP Issues in Global Water System Research
��
the production of each crop was calculated by multiplying simulated crop yield with crop area. Third,
simulated production of each crop was adjusted by considering a crop- and country-specific coefficient,
which was equal to the ratio of the statistical national crop production to the total simulated crop production
within a specific country. Fourth, the CWU of each crop was calculated by dividing the adjusted production
by CWP. Finally, the total CWU was the sum of the CWU of all studied crops. Details of the calculation
process are described in Liu et al. (submitted).
The global annual CWU is estimated to be 3 651 km3/year for the period 1998 to 2002. Of the global
CWU, two-thirds is attributed to cereal crops. Wheat and rice account for more than one-third of the
global CWU. The highest CWU per grid cell (e.g. > 300 million m3/year) was found in most parts of India,
in the river basins of the Yellow, Huai, Hai and Yangtze rivers in China, in large parts of Europe, in the
Mississippi River Basin in North America, some parts of the Paraña and Sao Francisco river basins in
South America and some parts of the Murray–Darling River Basin in Australia (Figure 4). These regions
mainly contain grid cells with a high fraction of arable lands and permanent crops (Leff et al. 2004).
ConclusionThe GEPIC model provides a practical tool to analyse crop water relations on national and global scales.
The China study demonstrated the role of irrigation in increasing CWP and the impact of reducing
irrigation on regional wheat production in the North China Plain. The information is useful for decision-
makers to formulate appropriate water policies by considering the possible impacts on food production.
The second case study provides an in-depth analysis on global consumptive water use and can contribute
to global assessment on water uses.
ReferencesHuang, B. & Jiang, B. 2002. AVTOP: a full integration of TOPMODEL into GIS. Environmental Modelling
& Software, 17(3): 261–268.
Kijne, J.W., Barker, R. & Molden, D. 2003. Water productivity in agriculture: limits and opportunities for improvement. Wallingford, UK, CABI Publishing.
Leff, B., Ramankutty, N. & Foley, J.A. 2004. Geographic distribution of major crops across the world. Global Biogeochemical Cycles, 18: GB1009.
Liu, J., Williams, J.R., Zehnder, A.J.B. & Yang, H. 2007a. GEPIC — modelling wheat yield and crop water productivity with high resolution on a global scale. Agricultural Systems, 94(2): 478–493.
Liu, J., Wiberg, D., Zehnder, A.J.B. & Yang, H. In press. Modelling the role of irrigation in winter wheat yield, crop water productivity, and production in China. Irrigation Science, doi:10.1007/s00271-007-0069-9.
Liu, J., Zehnder, A.J.B. & Yang, H. Submitted. Global consumptive water use for crop production: the importance of green water and virtual water. Water Resources Research.
Rosegrant, M.W. & Ringler, C. 2000. Impact on food security and rural development of transferring water out of agriculture. Water Policy, 1(6): 567–586.
Shi, Y. & Lu, L. Eds. 2001. China agricultural water demand and water-saving and efficient agriculture. Beijing, China WaterPower Press.
Williams, J.R., Jones, C.A., Kiniry, J.R. & Spanel, D.A. 1989. The EPIC crop growth model. Transactions of the ASAE, 32: 497–511.
Xu, Y., Mo, X., Cai, Y. & Li, X. 2005. Analysis on groundwater table drawdown by land use and the quest for sustainable water use in the Hebei Plain in China. Agricultural Water Management, 75(1): 38–53.
Global Assessment: Bridging Scales and Linking to Policy
��
Impact Assessment and Decision Support:
Linking Policies to Land Use Change and Sustainability
Indicators
GWSP Issues in Global Water System Research
�0
Sustainability Impact Assessment of land use at the regional scale
Karen Tscherning�, a, Katharina Helminga, Stefan Siebera, Bettina Königa, Hubert Wiggeringa, Tom Kuhlmanb, Hans van Meijlb, Dirk M. Wascherc, Marta Perez-Sobac, Paul Tabbushd, Oliver Dillye, and Hanne Bachf aLeibniz-Centre for Agricultural Landscape Research (ZALF), Müncheberg, Germany, bAgricultural Economics Research Institute (LEI), the Netherlands, cAlterra, Wageningen, the Netherlands, dForestry Commission Research Agency, Alice Holt, UK, eBrandenburg Technical University, Cottbus, Germany, fNational Environmental Research Institute, Copenhagen, Denmark
The principle of multifunctionality simultaneously considers a variety of social, economic and
environmental goods and services related to land use. It is thus a key to the sustainable development
of land and rural areas. Land-use policies seek to support the economic competitiveness and
sustainable development of rural areas. For efficient Impact Assessment, policy-makers require tools
for assessment of potential policy impacts on a wide range of sustainability issues across European
regions. The European Union-funded integrated project SENSOR develops ex-ante Sustainability Impact
Assessment Tools (SIAT) to support decision-making on policies related to multifunctional land use in
European regions. SENSOR directly responds to the European sustainability objectives as applied to land
use and rural development.
Project objectives, scientific and policy contextSustainability Impact Assessment seeks to identify the possible economic, environmental and social
effects of a policy option and its consequences with respect to sustainable development before and during
its implementation. This is manifested in the Commissions Communication on Impact Assessment (EC
2002) which introduced an internal process of impact assessment for major policy proposals in all policy
areas. The Integrated Impact Assessment process (EC 2005) streamlines, substitutes and integrates all
existing single sector assessments, including Sustainability Impact Assessment.
The two main drivers behind the impact assessment procedure of the European Commission are the
EU Sustainable Development Strategy, which focuses on the assessment of policy impacts on economic,
social and environmental dimensions (including trade-offs), and the better regulation agenda that declares
initiatives to promote effective and efficient regulation, in part to also fulfil the Lisbon objectives of a
competitive European economy (Franz and Kirkpatrick 2006).
SENSOR integrates three key assessment streams: (1) A European-wide, indicator-based driving
force and impact analysis of land-use policy scenarios; (2) region-specific problem, risk and threshold
assessment, making use of spatial reference systems and participatory processes; and (3) case study-based,
exemplary sensitive area studies in mountains, islands, coastal zones and postindustrialized areas using
detailed information on specific sustainability issues (Helming et al. 2006). Data management systems
and institutional analysis approaches complement these assessment streams.
SENSOR provides protocols for the assessment of policy options affecting land use at the regional scale
(NUTS2/3) for European member states and is based on existing pan-European data. The assessment
results are incorporated into SIAT with a modular structure to allow for different combinations of
applications regarding land-use sectors or sustainability issues and ranging from purely indicator-driven,
1 Corresponding author
Global Assessment: Bridging Scales and Linking to Policy
��
top-down impact assessment to fully participatory approaches of sustainability target identification and
risk assessment.
SENSOR considers policy instruments that affect land use in relation to six economic sectors:
agriculture; forestry; tourism; nature conservation; transport and energy infrastructure. The list of
regional sustainability issues addressed includes spatially explicit environmental functions (abiotic and
biotic resources including soil, water, air, biodiversity), societal functions (social welfare, gender equity
and migration, cultural heritage, recreation, aesthetic issues) and economic functions (employment,
growth). Externality valuation and analysis of the inter-relating effects of different land-use sectors are
also included.
European land-use scenarios and impact assessmentThis project component deals with a European scale analysis of future scenarios for general socio-economic
trends and specific land-use policies. These scenarios are translated into possible land-use changes, of
which the impact on sustainability issues is analysed with indicator-based methods. The objectives are:
To develop methods to analyse the performance of policy scenarios on land-use change and their
outcome on sustainability issues for European regions.
To test these methods using a series of baseline and policy scenarios.
To provide protocols for future policy analysis and integration of methods into SIAT.
Three scientific tasks have a prominent position: Firstly, the integration of macroeconomic and
sectoral modeling in the framework from scenarios to land-use projections; secondly, the inclusion of
multifunctional aspects of land use and management in the analyses and projections; and thirdly, the use
of these projections to forecast impacts on social, economic and environmental indicators.
The analysis consists of three steps: (1) scenario development of land-use driving forces, (2) model-
based translation of driving force scenarios into land-use scenarios and (3) impact assessment of land-use
changes on sustainability issues.
Regional sustainability problems, risks and thresholdsRegional dimensions of sustainability are assessed through indicator-based impact assessments by
developing and making use of a Spatial Regional Reference Framework (SRRF). The framework provides
both scientists and stakeholders with region-specific information on rurality, urban structure, socio-
economic profiles and landscape characteristic information for each of the EU’s administrative units (475
so-called NUTS-X regions, a spatially homogenized combination of NUTS 2 and 3 regions) and for 30
relatively homogeneous clusters of these regions. The assessment of thresholds and risks for regional
impact issues is to be based on the identification and regional specific analysis of environmental and socio-
economic “land-use functions”. As politically established targets and scientifically supported thresholds
are rather limited, the research explores various techniques for assessing different degrees of risk for
regional sustainability in relation to land-use functions and other criteria. This assessment will result
in the identification of Sustainability Problem Regions, namely such European regions where existing
thresholds are expected to be passed. Researchers develop and improve their methodologies in about
eight concrete (preselected) Test Regions, in which the threshold and risks assessment is going to be re-
evaluated and verified with the help of stakeholders.
•
•
•
GWSP Issues in Global Water System Research
��
SIAT integration and end user toolsIntegrated Sustainability Impact Assessment is an iterative process, in which insights from scientists and
stakeholder communities are communicated to decision-makers (Tamborra 2002). Current quantitative
impact assessment tools focus mainly on economic analysis at the macrolevel. For environmental
issues, system models on different aggregation scales with various details have been developed. The
comprehensive integration of approaches from both socio-economic and environmental sciences
remains a research priority (Werner and Zander 2002). A major gap exists between macroeconomic and
equilibrium models of the land-use sectors on the one hand and mechanistic (“systems”) modeling of
ecological and social processes on the other (Tamborra 2002). The main objective of SIAT is to close the
described research gap by consolidating existing models and tools at the level of European decision-makers
to a methodologically sound and feasible knowledge-based meta-model. SIAT overcomes the divergence
between high aggregation levels based on European data sets and specific results on high resolution, while
it integrates existing models and harmonizes so far fragmented results. Sieber et al.’s abstract in this issue
provides a detailed description of SIAT.
Integrated data managementMany environmental data sets have been collected over the past few decades and are already available at
many sites around Europe. However, exploring the data and performing analysis to discover associations
between spatial patterns and environmental phenomena are difficult. Typical problems are related to data
stored at different locations, heterogeneous formats and systems and different data policies with regard to
free access to the data. The general situation on spatial information in Europe is one of fragmentation of
data sets and sources, gaps in availability and a general lack of harmonization between data sets at different
geographical scales. Based on the INSPIRE Implementing Rules Drafting foundation, an overall frame
for the data infrastructure including Web-based catalogue services enabling SENSOR partners to discover
and download appropriate data for their work was designed. Georeferenced statistical (tabular) data allow
for a direct link to SIAT. A GIS-based data management system for SENSOR has been developed. This
system is composed of three main components: (1) the meta-data reporting system, (2) the search and
discovery system (a clearinghouse mechanism) and (3) a data warehouse.
Sustainability issues in sensitive regionsA European survey will provide the geographic identification and an overview on environmental, economic
and social issues in sensitive regions. In addition, a set of case study areas will be selected and data
and information gathered for testing SIAT and involving stakeholders for valuating determined impacts.
Sensitive regions currently under focus are (1) postindustrial zones, (2) mountainous areas, (3) islands
and (4) coastal zones. Information from sensitive regions and case study areas allows for identification
of both common and specific key problems of sustainability and related impact issues. Further, it will
provide an in-depth analysis of relevant information and expert knowledge on key social, environmental
and economic issues in case study areas.
Participatory processes and institutional analysisSustainability issues and the institutional role of SIAT have been analysed to make recommendations for
SIAT design. Additionally the SIAT prototype will be tested in real world contexts. Here, “society” is fully
Global Assessment: Bridging Scales and Linking to Policy
��
integrated into the science of assessment of the sustainability of multifunctional landscapes. The main
task is to supply social science expertise including stakeholder analysis, institutional analysis, deliberative
processes and quantitative and qualitative social research.
ConclusionsSENSOR is a four-year project designed to develop Sustainability Impact Assessment Tools (SIAT) for
land use in European regions. This article provides an overview of the analytical design of the project and
on the first results. Future activities will have to show how sectoral land-use analyses are integrated with
landscape functional assessments into a comprehensive multifunctional assessment system that provides
robust projections on the sustainability impacts of policy-driven land-use scenarios for European regions.
Updated information is regularly available at the project’s Web site www.sensor-ip.eu.
ReferencesEuropean Commission. 2002. Communication from the Commission on Impact Assessment. COM (2002)276
final. Brussels.
European Commission. 2005. Impact assessment guidelines. SEC(2005)791 final. Brussels.
Franz, J. & Kirkpatrick, C. 2007. Integrating sustainable development into European policymaking: The role of impact assessments. J. of Environmental Assessment Policy and Management, 9 (2):1–20.
Helming, K., Tscherning, K., Kuhlman, T., Wascher, D., Perez-Soba, M., Sieber, S., Bach, H., Dilly, O. & Tabbush, P. 2006. Sustainability impact assessment of multifunctional land use. SENSOR 1st Annual Report, Public Part. SENSOR report series No. 1/2006. Eberswalde, Germany, ZALF. 30 pp.
Tamborra, M. Ed. 2002. Socio-economic tools for sustainability impact assessment – the contribution of EU research to sustainable development. Luxembourg, Office for Official Publications of the European Communities.
Werner, A. & Zander, P. 2002. Models assessing the impact of land-use change in rural areas on development of environmental threats and their use for agricultural policies. In L. Ryszkowski, ed. Landscape ecology in agro-ecosystems management, pp. 277–297. Boca Raton, CRC Press. 366 pp.
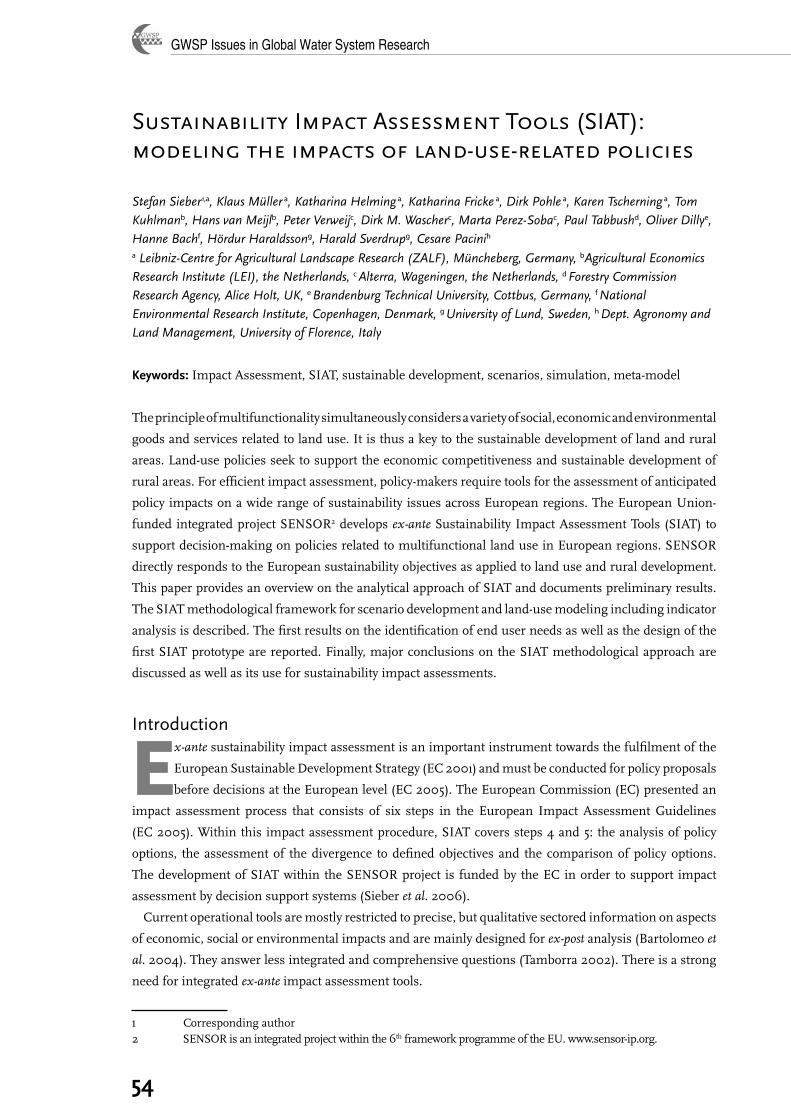
GWSP Issues in Global Water System Research
��
Sustainability Impact Assessment Tools (SIAT): modeling the impacts of land-use-related policies
Stefan Sieber�,a, Klaus Müller a, Katharina Helming a, Katharina Fricke a, Dirk Pohle a, Karen Tscherning a, Tom Kuhlmanb, Hans van Meijlb, Peter Verweijc, Dirk M. Wascherc, Marta Perez-Sobac, Paul Tabbushd, Oliver Dillye, Hanne Bachf, Hördur Haraldssong, Harald Sverdrupg, Cesare Pacinih a Leibniz-Centre for Agricultural Landscape Research (ZALF), Müncheberg, Germany, bAgricultural Economics Research Institute (LEI), the Netherlands, c Alterra, Wageningen, the Netherlands, d Forestry Commission Research Agency, Alice Holt, UK, e Brandenburg Technical University, Cottbus, Germany, f National Environmental Research Institute, Copenhagen, Denmark, g University of Lund, Sweden, h Dept. Agronomy and Land Management, University of Florence, Italy
Keywords: Impact Assessment, SIAT, sustainable development, scenarios, simulation, meta-model
The principle of multifunctionality simultaneously considers a variety of social, economic and environmental
goods and services related to land use. It is thus a key to the sustainable development of land and rural
areas. Land-use policies seek to support the economic competitiveness and sustainable development of
rural areas. For efficient impact assessment, policy-makers require tools for the assessment of anticipated
policy impacts on a wide range of sustainability issues across European regions. The European Union-
funded integrated project SENSOR2 develops ex-ante Sustainability Impact Assessment Tools (SIAT) to
support decision-making on policies related to multifunctional land use in European regions. SENSOR
directly responds to the European sustainability objectives as applied to land use and rural development.
This paper provides an overview on the analytical approach of SIAT and documents preliminary results.
The SIAT methodological framework for scenario development and land-use modeling including indicator
analysis is described. The first results on the identification of end user needs as well as the design of the
first SIAT prototype are reported. Finally, major conclusions on the SIAT methodological approach are
discussed as well as its use for sustainability impact assessments.
Introduction
Ex-ante sustainability impact assessment is an important instrument towards the fulfilment of the
European Sustainable Development Strategy (EC 2001) and must be conducted for policy proposals
before decisions at the European level (EC 2005). The European Commission (EC) presented an
impact assessment process that consists of six steps in the European Impact Assessment Guidelines
(EC 2005). Within this impact assessment procedure, SIAT covers steps 4 and 5: the analysis of policy
options, the assessment of the divergence to defined objectives and the comparison of policy options.
The development of SIAT within the SENSOR project is funded by the EC in order to support impact
assessment by decision support systems (Sieber et al. 2006).
Current operational tools are mostly restricted to precise, but qualitative sectored information on aspects
of economic, social or environmental impacts and are mainly designed for ex-post analysis (Bartolomeo et
al. 2004). They answer less integrated and comprehensive questions (Tamborra 2002). There is a strong
need for integrated ex-ante impact assessment tools.
1 Corresponding author2 SENSOR is an integrated project within the 6th framework programme of the EU. www.sensor-ip.org.
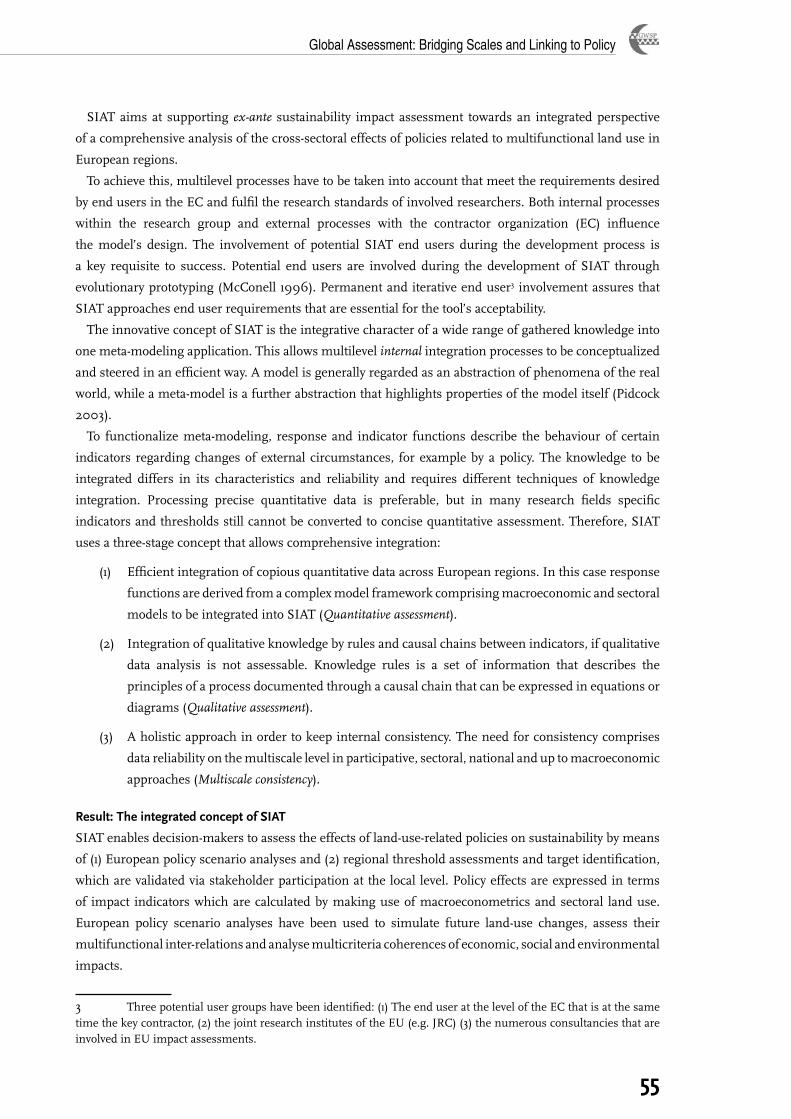
Global Assessment: Bridging Scales and Linking to Policy
��
SIAT aims at supporting ex-ante sustainability impact assessment towards an integrated perspective
of a comprehensive analysis of the cross-sectoral effects of policies related to multifunctional land use in
European regions.
To achieve this, multilevel processes have to be taken into account that meet the requirements desired
by end users in the EC and fulfil the research standards of involved researchers. Both internal processes
within the research group and external processes with the contractor organization (EC) influence
the model’s design. The involvement of potential SIAT end users during the development process is
a key requisite to success. Potential end users are involved during the development of SIAT through
evolutionary prototyping (McConell 1996). Permanent and iterative end user3 involvement assures that
SIAT approaches end user requirements that are essential for the tool’s acceptability.
The innovative concept of SIAT is the integrative character of a wide range of gathered knowledge into
one meta-modeling application. This allows multilevel internal integration processes to be conceptualized
and steered in an efficient way. A model is generally regarded as an abstraction of phenomena of the real
world, while a meta-model is a further abstraction that highlights properties of the model itself (Pidcock
2003).
To functionalize meta-modeling, response and indicator functions describe the behaviour of certain
indicators regarding changes of external circumstances, for example by a policy. The knowledge to be
integrated differs in its characteristics and reliability and requires different techniques of knowledge
integration. Processing precise quantitative data is preferable, but in many research fields specific
indicators and thresholds still cannot be converted to concise quantitative assessment. Therefore, SIAT
uses a three-stage concept that allows comprehensive integration:
(1) Efficient integration of copious quantitative data across European regions. In this case response
functions are derived from a complex model framework comprising macroeconomic and sectoral
models to be integrated into SIAT (Quantitative assessment).
(2) Integration of qualitative knowledge by rules and causal chains between indicators, if qualitative
data analysis is not assessable. Knowledge rules is a set of information that describes the
principles of a process documented through a causal chain that can be expressed in equations or
diagrams (Qualitative assessment).
(3) A holistic approach in order to keep internal consistency. The need for consistency comprises
data reliability on the multiscale level in participative, sectoral, national and up to macroeconomic
approaches (Multiscale consistency).
Result: The integrated concept of SIAT
SIAT enables decision-makers to assess the effects of land-use-related policies on sustainability by means
of (1) European policy scenario analyses and (2) regional threshold assessments and target identification,
which are validated via stakeholder participation at the local level. Policy effects are expressed in terms
of impact indicators which are calculated by making use of macroeconometrics and sectoral land use.
European policy scenario analyses have been used to simulate future land-use changes, assess their
multifunctional inter-relations and analyse multicriteria coherences of economic, social and environmental
impacts.
3 Three potential user groups have been identified: (1) The end user at the level of the EC that is at the same time the key contractor, (2) the joint research institutes of the EU (e.g. JRC) (3) the numerous consultancies that are involved in EU impact assessments.
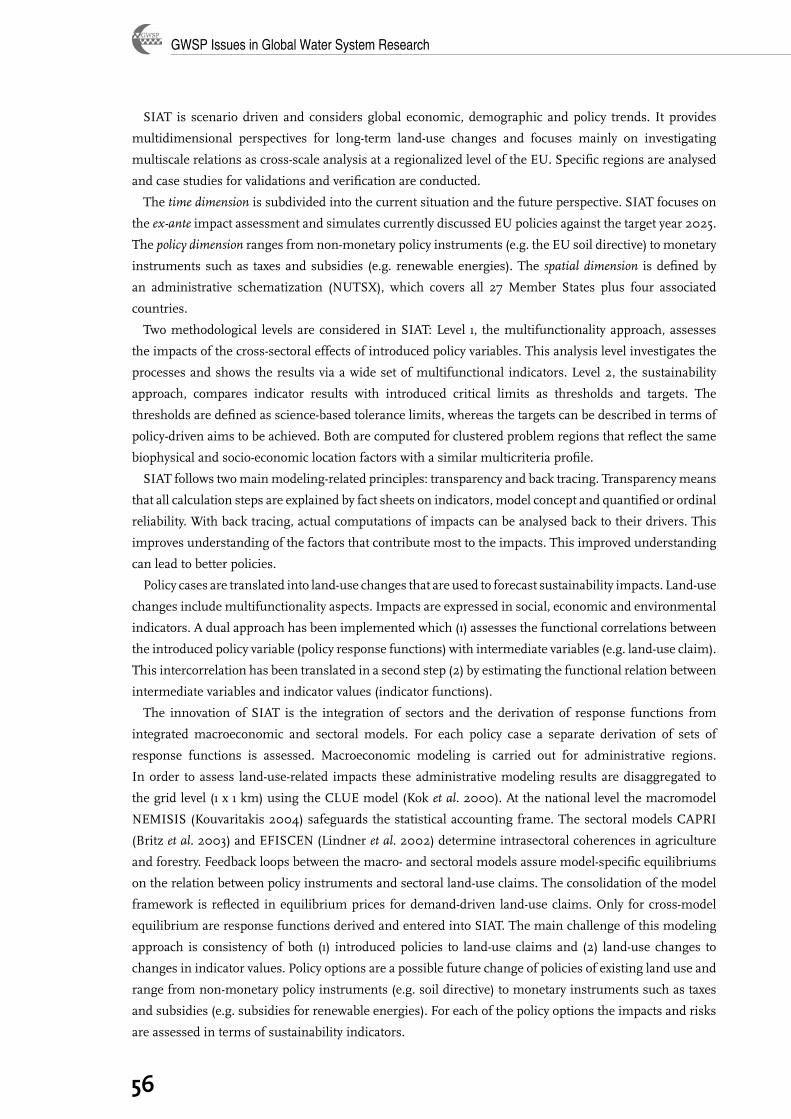
GWSP Issues in Global Water System Research
��
SIAT is scenario driven and considers global economic, demographic and policy trends. It provides
multidimensional perspectives for long-term land-use changes and focuses mainly on investigating
multiscale relations as cross-scale analysis at a regionalized level of the EU. Specific regions are analysed
and case studies for validations and verification are conducted.
The time dimension is subdivided into the current situation and the future perspective. SIAT focuses on
the ex-ante impact assessment and simulates currently discussed EU policies against the target year 2025.
The policy dimension ranges from non-monetary policy instruments (e.g. the EU soil directive) to monetary
instruments such as taxes and subsidies (e.g. renewable energies). The spatial dimension is defined by
an administrative schematization (NUTSX), which covers all 27 Member States plus four associated
countries.
Two methodological levels are considered in SIAT: Level 1, the multifunctionality approach, assesses
the impacts of the cross-sectoral effects of introduced policy variables. This analysis level investigates the
processes and shows the results via a wide set of multifunctional indicators. Level 2, the sustainability
approach, compares indicator results with introduced critical limits as thresholds and targets. The
thresholds are defined as science-based tolerance limits, whereas the targets can be described in terms of
policy-driven aims to be achieved. Both are computed for clustered problem regions that reflect the same
biophysical and socio-economic location factors with a similar multicriteria profile.
SIAT follows two main modeling-related principles: transparency and back tracing. Transparency means
that all calculation steps are explained by fact sheets on indicators, model concept and quantified or ordinal
reliability. With back tracing, actual computations of impacts can be analysed back to their drivers. This
improves understanding of the factors that contribute most to the impacts. This improved understanding
can lead to better policies.
Policy cases are translated into land-use changes that are used to forecast sustainability impacts. Land-use
changes include multifunctionality aspects. Impacts are expressed in social, economic and environmental
indicators. A dual approach has been implemented which (1) assesses the functional correlations between
the introduced policy variable (policy response functions) with intermediate variables (e.g. land-use claim).
This intercorrelation has been translated in a second step (2) by estimating the functional relation between
intermediate variables and indicator values (indicator functions).
The innovation of SIAT is the integration of sectors and the derivation of response functions from
integrated macroeconomic and sectoral models. For each policy case a separate derivation of sets of
response functions is assessed. Macroeconomic modeling is carried out for administrative regions.
In order to assess land-use-related impacts these administrative modeling results are disaggregated to
the grid level (1 x 1 km) using the CLUE model (Kok et al. 2000). At the national level the macromodel
NEMISIS (Kouvaritakis 2004) safeguards the statistical accounting frame. The sectoral models CAPRI
(Britz et al. 2003) and EFISCEN (Lindner et al. 2002) determine intrasectoral coherences in agriculture
and forestry. Feedback loops between the macro- and sectoral models assure model-specific equilibriums
on the relation between policy instruments and sectoral land-use claims. The consolidation of the model
framework is reflected in equilibrium prices for demand-driven land-use claims. Only for cross-model
equilibrium are response functions derived and entered into SIAT. The main challenge of this modeling
approach is consistency of both (1) introduced policies to land-use claims and (2) land-use changes to
changes in indicator values. Policy options are a possible future change of policies of existing land use and
range from non-monetary policy instruments (e.g. soil directive) to monetary instruments such as taxes
and subsidies (e.g. subsidies for renewable energies). For each of the policy options the impacts and risks
are assessed in terms of sustainability indicators.
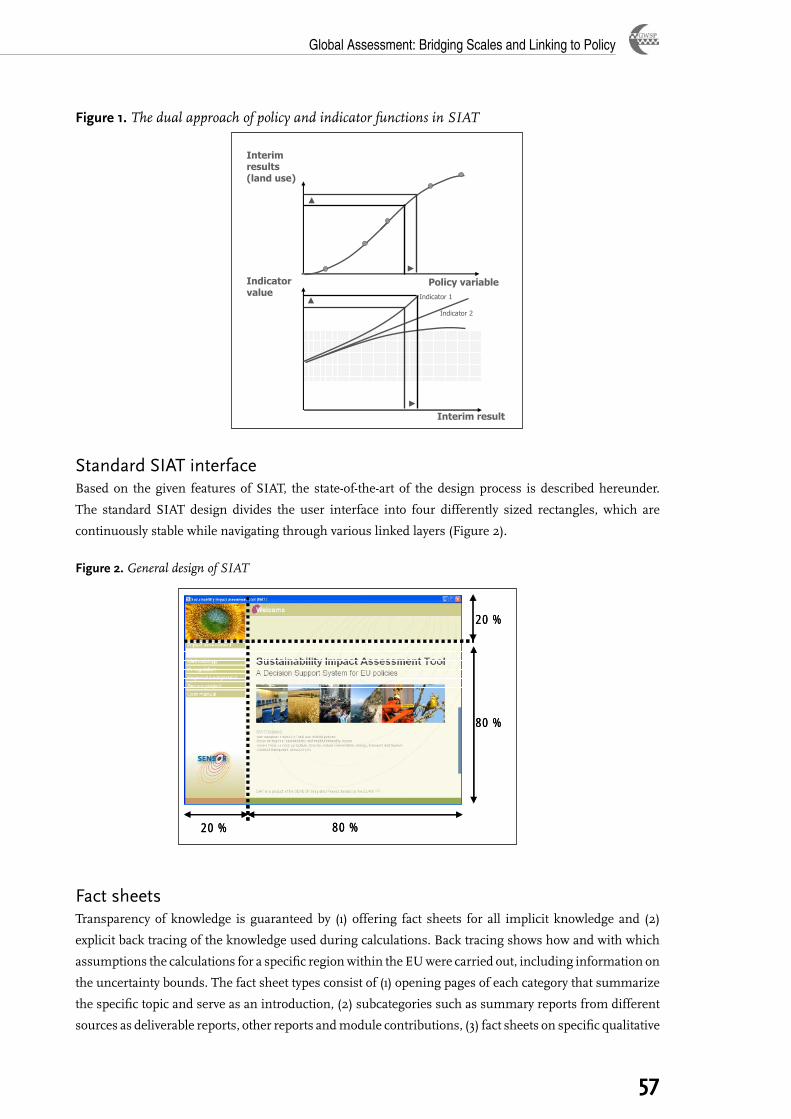
Global Assessment: Bridging Scales and Linking to Policy
��
Standard SIAT interfaceBased on the given features of SIAT, the state-of-the-art of the design process is described hereunder.
The standard SIAT design divides the user interface into four differently sized rectangles, which are
continuously stable while navigating through various linked layers (Figure 2).
Figure �. General design of SIAT
Fact sheetsTransparency of knowledge is guaranteed by (1) offering fact sheets for all implicit knowledge and (2)
explicit back tracing of the knowledge used during calculations. Back tracing shows how and with which
assumptions the calculations for a specific region within the EU were carried out, including information on
the uncertainty bounds. The fact sheet types consist of (1) opening pages of each category that summarize
the specific topic and serve as an introduction, (2) subcategories such as summary reports from different
sources as deliverable reports, other reports and module contributions, (3) fact sheets on specific qualitative
loops between the macro- and sectoral models assure model-specific equilibriums on the relation between policy instruments and sectoral land-use claims. The consolidation of the model framework is reflected in equilibrium prices for demand-driven land-use claims. Only for cross-model equilibrium are response functions derived and entered into SIAT.
Interim result
Indicator value
Interim results (land use)
Policy variableIndicator 1
Indicator 2
Figure 1. The dual approach of policy and indicator functions in SIAT
The main challenge of this modeling approach is consistency of both (1) introduced policies to land-use claims and (2) land-use changes to changes in indicator values.
Policy options are a possible future change of policies of existing land use and range from non-monetary policy instruments (e.g. soil directive) to monetary instruments such as taxes and subsidies (e.g. subsidies for renewable energies). For each of the policy options the impacts and risks are assessed in terms of sustainability indicators.
Standard SIAT interface
Based on the given features of SIAT, the state-of-the-art of the design process is described hereunder. The standard SIAT design divides the user interface into four differently sized rectangles, which are continuously stable while navigating through various linked layers:
20 % 80 %
80 %
20 %
20 % 80 %
80 %
20 %
Figure 2. General design of SIAT
Fact sheets
Figure �. The dual approach of policy and indicator functions in SIAT
20 % 80 %
80 %
20 %
20 % 80 %
80 %
20 %
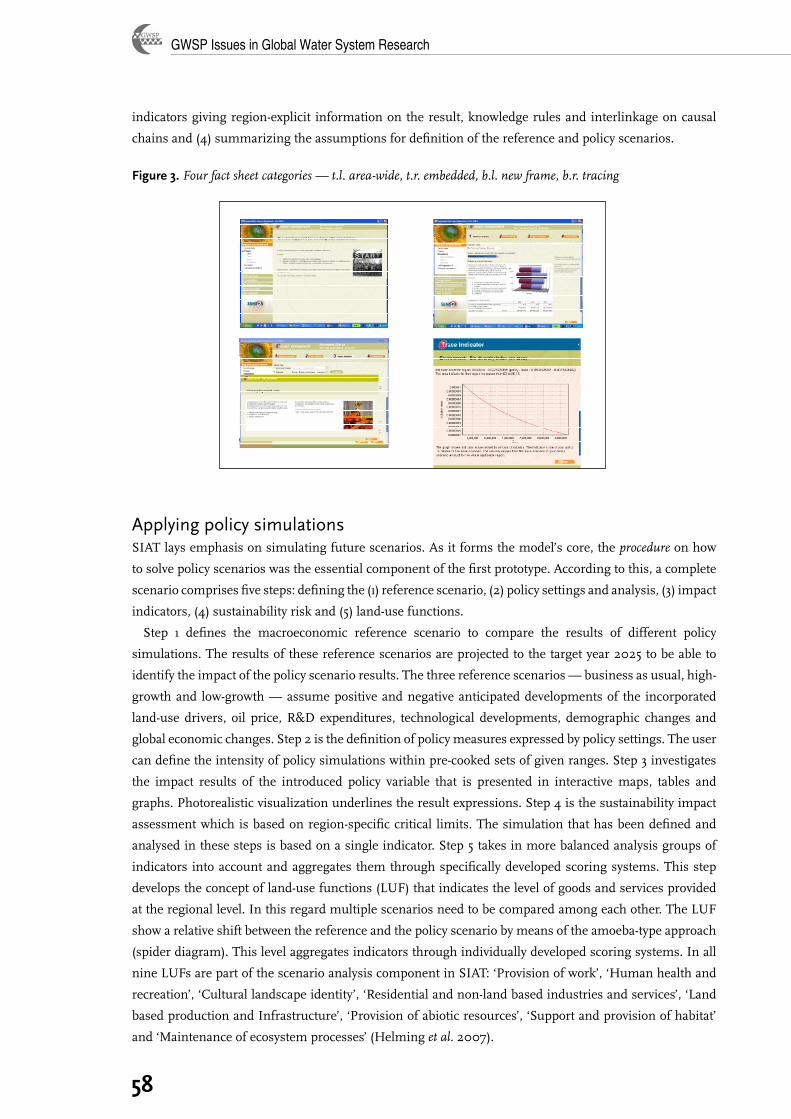
GWSP Issues in Global Water System Research
��
indicators giving region-explicit information on the result, knowledge rules and interlinkage on causal
chains and (4) summarizing the assumptions for definition of the reference and policy scenarios.
Figure �. Four fact sheet categories — t.l. area-wide, t.r. embedded, b.l. new frame, b.r. tracing
Applying policy simulationsSIAT lays emphasis on simulating future scenarios. As it forms the model’s core, the procedure on how
to solve policy scenarios was the essential component of the first prototype. According to this, a complete
scenario comprises five steps: defining the (1) reference scenario, (2) policy settings and analysis, (3) impact
indicators, (4) sustainability risk and (5) land-use functions.
Step 1 defines the macroeconomic reference scenario to compare the results of different policy
simulations. The results of these reference scenarios are projected to the target year 2025 to be able to
identify the impact of the policy scenario results. The three reference scenarios — business as usual, high-
growth and low-growth — assume positive and negative anticipated developments of the incorporated
land-use drivers, oil price, R&D expenditures, technological developments, demographic changes and
global economic changes. Step 2 is the definition of policy measures expressed by policy settings. The user
can define the intensity of policy simulations within pre-cooked sets of given ranges. Step 3 investigates
the impact results of the introduced policy variable that is presented in interactive maps, tables and
graphs. Photorealistic visualization underlines the result expressions. Step 4 is the sustainability impact
assessment which is based on region-specific critical limits. The simulation that has been defined and
analysed in these steps is based on a single indicator. Step 5 takes in more balanced analysis groups of
indicators into account and aggregates them through specifically developed scoring systems. This step
develops the concept of land-use functions (LUF) that indicates the level of goods and services provided
at the regional level. In this regard multiple scenarios need to be compared among each other. The LUF
show a relative shift between the reference and the policy scenario by means of the amoeba-type approach
(spider diagram). This level aggregates indicators through individually developed scoring systems. In all
nine LUFs are part of the scenario analysis component in SIAT: ‘Provision of work’, ‘Human health and
recreation’, ‘Cultural landscape identity’, ‘Residential and non-land based industries and services’, ‘Land
based production and Infrastructure’, ‘Provision of abiotic resources’, ‘Support and provision of habitat’
and ‘Maintenance of ecosystem processes’ (Helming et al. 2007).
Global Assessment: Bridging Scales and Linking to Policy
��
Conclusions The important aspects and influences discussed in this article concern the process of developing the
Sustainability Impact Assessment Tool (SIAT). Ex-ante sustainability impact assessment is gaining
importance for an integrated cross-sectoral view, which consists of overarching perspectives of policy
impacts at multiscale and indicator levels. SIAT provides an operational meta-model that is scenario
driven and considers global economic, demographic and policy trends for multidimensional perspectives
at the level of long-term land-use changes. The principle of multifunctional land use can guide sustainable
land management and the policy development processes of simultaneous observation of social, economic
and environmental functions.
The meta-model concept generates specific needs for knowledge integration, which facilitates non-
standard technical solution finding. The combination of qualitative and quantitative integration techniques
allows covering a maximal number of methodologically different indicators in simultaneous observation.
In the case of qualitative indicators less accuracy, but consistent results at the regional level is added value.
However, conceptual and data consistency between impact assessment issues, land-use functions (LUFs)
and relevant indicators has to be ensured at the multiscale level, at the macroeconomic level of a top-down
perspective as well as from regional, participative and bottom-up views.
As a first overall evaluation it can be concluded that integrated meta-modeling is a feasible concept to
conduct comprehensive sustainability impact assessments. The methodological strength of SIAT is the
high integration level of methods combining qualitative and quantitative model and indicator methods,
which leads to a broad interdisciplinary analytical view at the multiscale level across six sectors. On the
appropriateness of SIAT as a model approach for impact assessments, the end user will have to decide.
ReferencesBartolomeo, M., Giugni, P., Hertin, J., Jacob, K., Rennings, K., Volkery, A., Wilkinson, D. & Zanoni, D. 2004.
Approaches to impact assessment in six OECD countries and at the European Commission. IQ-Tools Project report, WP1A.
Britz, W., Perez, I. & Wieck, C. 2003. Mid-term review proposal impact analysis with the CAPRI modelling system. In Mid-term review of the common agricultural policy. July 2002 Proposals Impact Analyses, European Commission, Directorate-General for Agriculture.
Cairol, D., Coudel, E., Barthélémy, D., Caron, P., Cudlinova, E., Zander, P., Renting, H., Sumelius, J. & Knickel, K.H. 2005. Multifunctionality of agriculture and rural areas: from trade negotiations to contributing to sustainable development. New challenges for research. Summary of main results from the MULTAGRI project. 23 pp. www.multagri.net.
European Commission. 2001. A sustainable Europe for a better world: A European Union strategy for sustainable development. COM(2001)264final.
European Commission. 2005. Impact assessment guidelines. SEC791.
Helming K, Sieber S, Tscherning, K, König, B, Müller K, Wiggering H, Kuhlmann T, Wascher D, Perez-Soba M, Tabbush, P, Dilly, O. & Bach H. 2007. Land use functionality as a frame for impact assessment. In Kni-erim A, Nagel UJ, Schäfer C (eds) Managing Economic, Social and Biological Transformations. Margraf Publishers. 33-44.
Kok, K. & Veldkamp, A. 2000. Using the CLUE framework to model changes in land use on multiple scales, Tools for land use analysis on different scales. Dordrecht, Kluwer Academic Publishers. pp. 35–63.
Kouvaritakis, N. & Zachariadis, T. 2004. New Econometric Model for Environment and Strategies Implementation for Sustainable Development (NEMESIS): The environmental module. Final report, National Technical University of Athens, Greece.
GWSP Issues in Global Water System Research
�0
Lindner, M., Sohngen, B., Joyce, L.A., Price, D.T., Bernier, P.Y. & Karjalainen, T. 2002. Integrated forestry assessments for climate change impacts. Forest Ecology Management, 162, 117–136.
McConell, S. 1996. Rapid development. Microsoft.
Pidcock, W. 2003. What are the differences between a vocabulary, a taxonomy, a thesaurus, an ontology, and a meta-model? http://www.metamodel.com/article.php?story=20030115211223271, (30.10.2006).
Sieber, S, Helming, K., Müller, K. & Verweij, P. 2006. SIAT (SUSTAINABLE IMPACT ASSESSMENT TOOL) — spatial EU wide modeling of land-use related policies based on new rural typologies. Conference paper on the IPTS-expert workshop “The Diversity of Rural Areas in the Enlarged EU: Characterisation, Typology and Modelling”, Seville, Spain.
Tamborra, M. 2002. Socio-economic tools for sustainability impact assessment — the contribution of EU research to sustainable development. Energy, environment and sustainable development, EUR 20437.1. Office for Official Publications of the European Communities, Luxembourg.
Winsemius, P. 1986. Beschouwingen over milieumanagement, Gast in eigen huis, (Dutch: Guest in One’s Own House). Alphen aan den Rijn, Samson H.D. Tjeenk Willink.
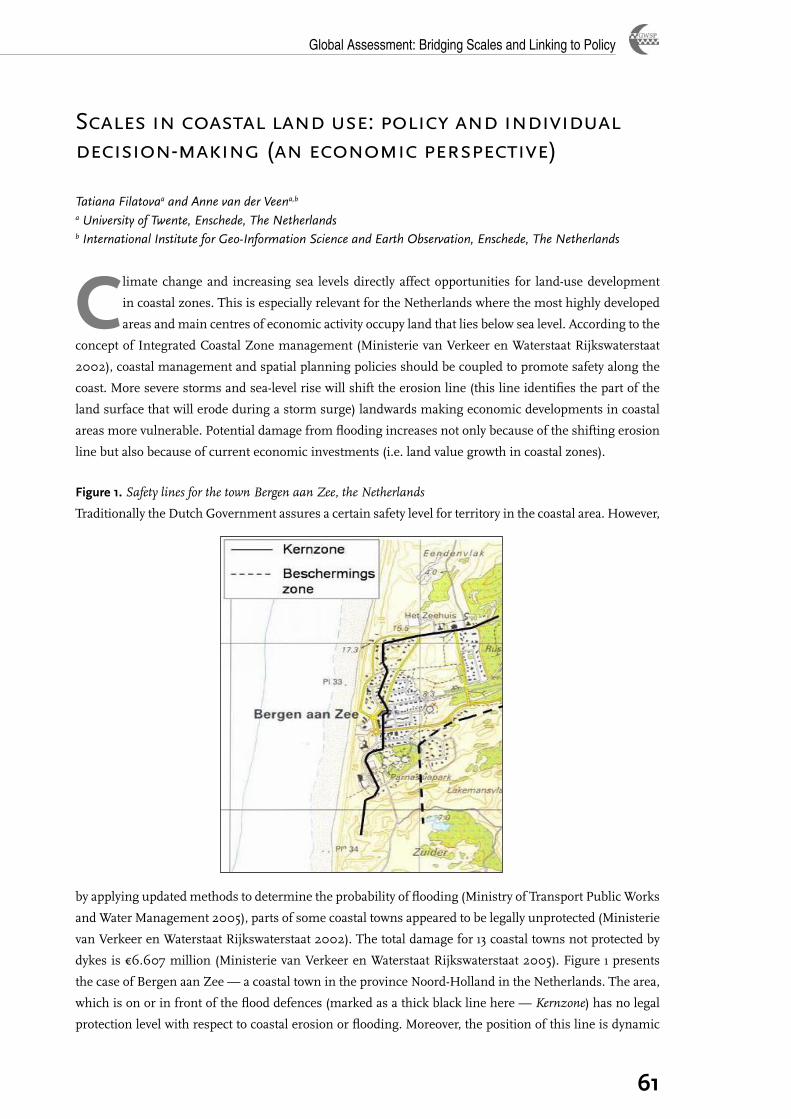
Global Assessment: Bridging Scales and Linking to Policy
��
Scales in coastal land use: policy and individual decision-making (an economic perspective)
Tatiana Filatovaa and Anne van der Veena,b
a University of Twente, Enschede, The Netherlands b International Institute for Geo-Information Science and Earth Observation, Enschede, The Netherlands
Climate change and increasing sea levels directly affect opportunities for land-use development
in coastal zones. This is especially relevant for the Netherlands where the most highly developed
areas and main centres of economic activity occupy land that lies below sea level. According to the
concept of Integrated Coastal Zone management (Ministerie van Verkeer en Waterstaat Rijkswaterstaat
2002), coastal management and spatial planning policies should be coupled to promote safety along the
coast. More severe storms and sea-level rise will shift the erosion line (this line identifies the part of the
land surface that will erode during a storm surge) landwards making economic developments in coastal
areas more vulnerable. Potential damage from flooding increases not only because of the shifting erosion
line but also because of current economic investments (i.e. land value growth in coastal zones).
Figure �. Safety lines for the town Bergen aan Zee, the Netherlands
Traditionally the Dutch Government assures a certain safety level for territory in the coastal area. However,
by applying updated methods to determine the probability of flooding (Ministry of Transport Public Works
and Water Management 2005), parts of some coastal towns appeared to be legally unprotected (Ministerie
van Verkeer en Waterstaat Rijkswaterstaat 2002). The total damage for 13 coastal towns not protected by
dykes is €6.607 million (Ministerie van Verkeer en Waterstaat Rijkswaterstaat 2005). Figure 1 presents
the case of Bergen aan Zee — a coastal town in the province Noord-Holland in the Netherlands. The area,
which is on or in front of the flood defences (marked as a thick black line here — Kernzone) has no legal
protection level with respect to coastal erosion or flooding. Moreover, the position of this line is dynamic
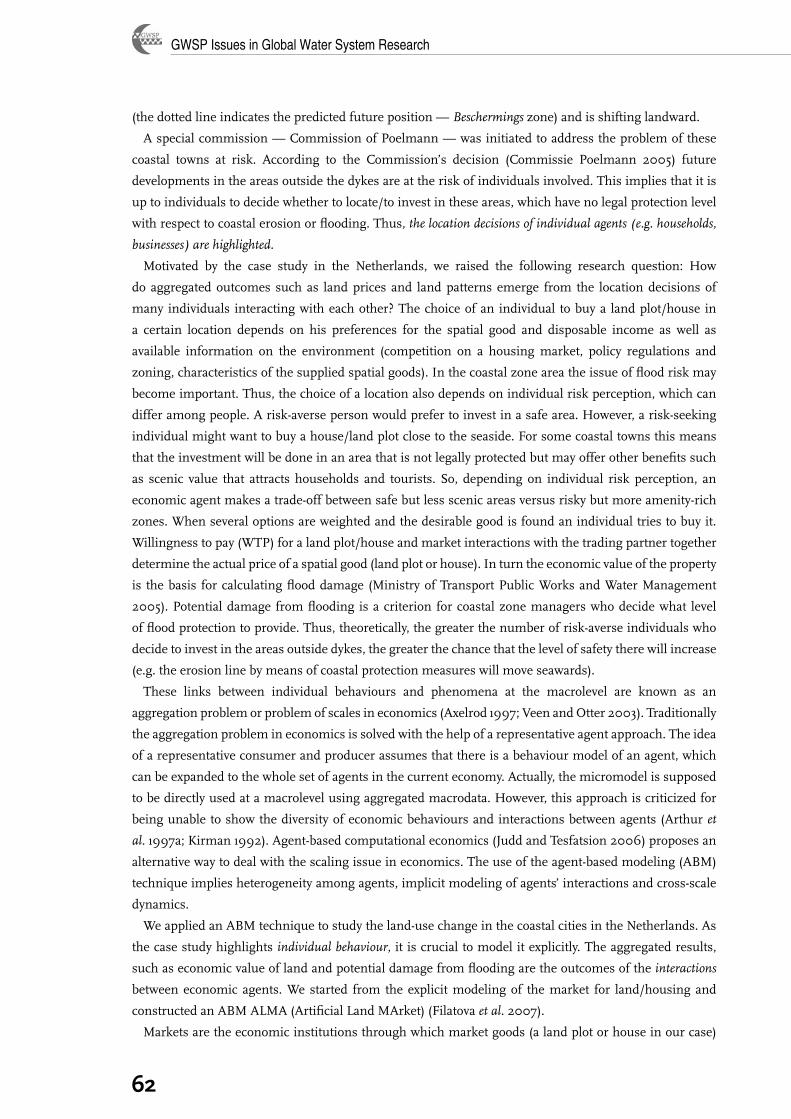
GWSP Issues in Global Water System Research
��
(the dotted line indicates the predicted future position — Beschermings zone) and is shifting landward.
A special commission — Commission of Poelmann — was initiated to address the problem of these
coastal towns at risk. According to the Commission’s decision (Commissie Poelmann 2005) future
developments in the areas outside the dykes are at the risk of individuals involved. This implies that it is
up to individuals to decide whether to locate/to invest in these areas, which have no legal protection level
with respect to coastal erosion or flooding. Thus, the location decisions of individual agents (e.g. households,
businesses) are highlighted.
Motivated by the case study in the Netherlands, we raised the following research question: How
do aggregated outcomes such as land prices and land patterns emerge from the location decisions of
many individuals interacting with each other? The choice of an individual to buy a land plot/house in
a certain location depends on his preferences for the spatial good and disposable income as well as
available information on the environment (competition on a housing market, policy regulations and
zoning, characteristics of the supplied spatial goods). In the coastal zone area the issue of flood risk may
become important. Thus, the choice of a location also depends on individual risk perception, which can
differ among people. A risk-averse person would prefer to invest in a safe area. However, a risk-seeking
individual might want to buy a house/land plot close to the seaside. For some coastal towns this means
that the investment will be done in an area that is not legally protected but may offer other benefits such
as scenic value that attracts households and tourists. So, depending on individual risk perception, an
economic agent makes a trade-off between safe but less scenic areas versus risky but more amenity-rich
zones. When several options are weighted and the desirable good is found an individual tries to buy it.
Willingness to pay (WTP) for a land plot/house and market interactions with the trading partner together
determine the actual price of a spatial good (land plot or house). In turn the economic value of the property
is the basis for calculating flood damage (Ministry of Transport Public Works and Water Management
2005). Potential damage from flooding is a criterion for coastal zone managers who decide what level
of flood protection to provide. Thus, theoretically, the greater the number of risk-averse individuals who
decide to invest in the areas outside dykes, the greater the chance that the level of safety there will increase
(e.g. the erosion line by means of coastal protection measures will move seawards).
These links between individual behaviours and phenomena at the macrolevel are known as an
aggregation problem or problem of scales in economics (Axelrod 1997; Veen and Otter 2003). Traditionally
the aggregation problem in economics is solved with the help of a representative agent approach. The idea
of a representative consumer and producer assumes that there is a behaviour model of an agent, which
can be expanded to the whole set of agents in the current economy. Actually, the micromodel is supposed
to be directly used at a macrolevel using aggregated macrodata. However, this approach is criticized for
being unable to show the diversity of economic behaviours and interactions between agents (Arthur et
al. 1997a; Kirman 1992). Agent-based computational economics (Judd and Tesfatsion 2006) proposes an
alternative way to deal with the scaling issue in economics. The use of the agent-based modeling (ABM)
technique implies heterogeneity among agents, implicit modeling of agents’ interactions and cross-scale
dynamics.
We applied an ABM technique to study the land-use change in the coastal cities in the Netherlands. As
the case study highlights individual behaviour, it is crucial to model it explicitly. The aggregated results,
such as economic value of land and potential damage from flooding are the outcomes of the interactions
between economic agents. We started from the explicit modeling of the market for land/housing and
constructed an ABM ALMA (Artificial Land MArket) (Filatova et al. 2007).
Markets are the economic institutions through which market goods (a land plot or house in our case)

Global Assessment: Bridging Scales and Linking to Policy
��
are allocated and prices are determined. ABM has been successfully used in modeling economic markets
from the bottom upwards since the mid-1990s (Arthur et al. 1997b; Gode and Sunder 1993). There are
several examples of modeling land markets with ABM discussed in Polhill et al. (forthcoming). The ALMA
model differs from the works of others because it implies the direct modeling of price formation and market
transactions. In comparison to other land-use models, which are usually only demand-driven (White and
Engelen 2000), the land-market ABM that we present considers both the demand and supply side of the
market. The scheme in Figure 2 represents the concept of the model.
The location choices of agents are based on their preferences expressed in the form of utility function
),( EDUU = . Spatial good (house/land) is characterized by the distance (D) from the central business
district (CBD) and availability of environmental amenities (E, such as a seaside view). The choice of location
is constrained by the available budget RdTY += )( , where Y is a disposable budget for a spatial good,
T(d) are transport cost to the CBD and R is price for land the person can afford.
Figure �. Conceptual scheme of the land market
Based on land characteristics and their own preferences, buyers and sellers of spatial goods form their
WTP and willingness to accept (WTA). The bid and ask price is a function of WTP/WTA and the situation
on the market (relative number of buyers and sellers). The agents negotiate with potential traders over
the transaction price. If negotiation is successful, then the market transaction takes place. The current
transaction prices on land influence decisions over prices in the next time periods. Moreover, if a land
parcel is transferred to a specific land use, the altered land use feeds back into the spatial neighbourhood,
e.g. the density of the area and availability of open space changes when a land/house in the neighbourhood
is sold, or the socio-economic characteristics of the neighbourhood change when land is occupied by a
new owner.
The ALMA ABM is written in NetLogo 3.1.4. The events follow the sequence as showed in Figure 3. At
this stage we model the land market only for the urban area. The behaviour of households looking for
houses (demand side) and the ones who want to move (relocating agents – supply side in Figure 2) is
modeled. Our main aim at the moment is to be able to include theoretical foundations of spatial economics
into a spatially explicit framework. We decided to show some traditional research tasks modeled with our
artificial land market model, which spatial economists usually investigate. Perception of risk of flooding is
not included in the location choice at the moment; however, the model can be easily extended.
If we run the ALMA model with sellers whose asking price is equal to the agricultural land rent we get the
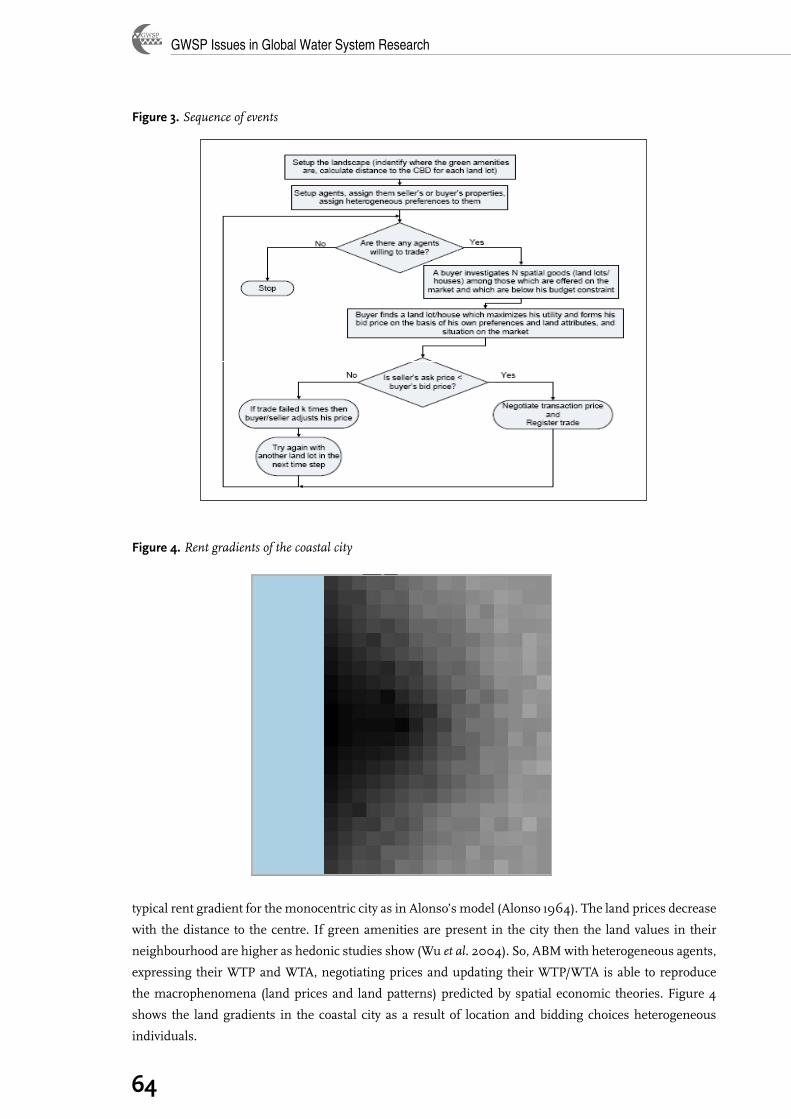
GWSP Issues in Global Water System Research
��
Figure �. Sequence of events
Figure �. Rent gradients of the coastal city
typical rent gradient for the monocentric city as in Alonso’s model (Alonso 1964). The land prices decrease
with the distance to the centre. If green amenities are present in the city then the land values in their
neighbourhood are higher as hedonic studies show (Wu et al. 2004). So, ABM with heterogeneous agents,
expressing their WTP and WTA, negotiating prices and updating their WTP/WTA is able to reproduce
the macrophenomena (land prices and land patterns) predicted by spatial economic theories. Figure 4
shows the land gradients in the coastal city as a result of location and bidding choices heterogeneous
individuals.
Global Assessment: Bridging Scales and Linking to Policy
��
The city center is in the middle and sea is presented by the plain blue area at the left. The main difference
with the standard representative agents framework is that we are able to derive land rent gradients
with heterogeneous agents and diverse land attributes. Our next step is to include risk perception in the
behavioural function of economic agents and study how agents sort themselves among municipalities
providing a lower/greater safety level, the difference among land prices in safe and vulnerable areas and
how land prices change with changes in people’s risk perception.
Acknowledgements: Funding from the NWO-ALW (LOICZ-NL) project 014.27.012 is gratefully
acknowledged. The authors are indebted to Dr. D. Parker and Dr. J. Mulder for discussions and valuable
advice.
ReferencesAlonso, W. 1964. Location and land use. Cambridge, MA, Harvard University Press.
Arthur, W.B., Durlauf, S.N. & Lane, D. 1997a. The economy as an evolving complex system II. Santa Fe Institute Studies in the Science of Complexity, Vol. XXVII. Addison-Wesley.
Arthur, W.B. et al. 1997b. Asset pricing under endogenous expectations in an artificial stock market. In The economy as an evolving complex system II. SFI Studies in the Science of Complexity, Vol. XXVII, ed. W.B. Arthur, S.N. Durlauf, & D.A. Lane. Westview Press. pp. 15–44.
Axelrod, R. 1997. The complexity of cooperation: agent-based models of competition and collaboration. Princeton, New Jersey, Princeton University Press.
Commissie Poelmann. 2005. Advies van de Commissie Bescherming en Ontwikkeling van Buitendijks gebied in Kustplaatsen. Haarlem, Netherlands.
Filatova, T., Parker, D.C., & van der Veen, A. 2007. Agent-based land markets: heterogeneous agents, land prices and urban land use change in Proceedings of the 4th Conference of the European Social Simulation Association (ESSA’07), Toulouse, France
Gode, D. & Sunder, S. 1993. Allocative efficiency of markets with zero-intelligence traders: market as a partial substitute for individual rationality. The Journal of Political Economy, 101(1): 119–137.
Judd, K.L. & Tesfatsion, L. 2006. Handbook of computational economics. Volume II: agent-based computational economics. Elsevier B.V.
Kirman, A.P. 1992. Whom or what does the representative individual represent? Journal of Economic Perspectives, 6(2): 117–136.
Ministerie van Verkeer en Waterstaat Rijkswaterstaat. 2002. Towards an integrated coastal zone policy – policy agenda for the coast. The Hague, Direct Dutch Publications BV.
Ministerie van Verkeer en Waterstaat Rijkswaterstaat. 2005. Risicobeheersing in kustplaatsen. Den Haag.
Ministry of Transport Public Works and Water Management. 2005. Flood risks and safety in the Netherlands (Floris). Floris study — interim report. Delft, Ministry of Transport, Public Works and Water Management.
Polhill, J.G., Parker, D.C. & Gotts, N.M. Forthcoming. Effects of land markets on competition between innovators and imitators in land use: results from FEARLUS-ELMM. In Social simulation technologies: advances and new discoveries, ed. C. Hernandez, K. Troitzsch & B. Edmonds.
Veen, A.v.d. & Otter, H. 2003. Scales in economic theory. In Scaling in integrated assessment, ed. J. Rotmans & D.S. Rothman. Lisse, Swets & Zeitlinger. pp. 125–138.
White, R. & Engelen, G. 2000. High-resolution integrated modelling of the spatial dynamics of urban and regional systems. Computers, Environment and Urban Systems, 24: 383–400.
Wu, J., Adams, R.M. & Plantinga, A.J. 2004. Amenities in an urban equilibrium model: residential development in Portland, Oregon. Land Economics, 80(1): 19–32.

GWSP Issues in Global Water System Research
��
Global Assessment: Bridging Scales and Linking to Policy
��
Linking Impacts and Adaption Modeling of Climate Change
to the Policy Process
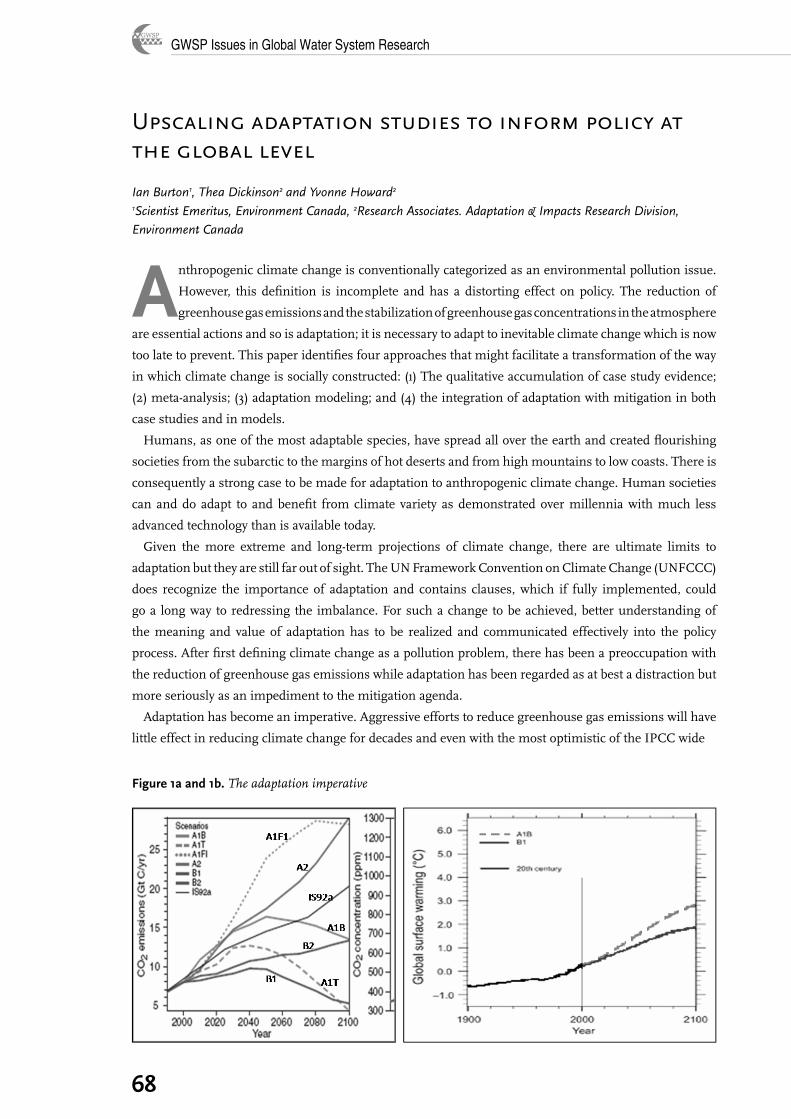
GWSP Issues in Global Water System Research
��
Upscaling adaptation studies to inform policy at the global level
Ian Burton�, Thea Dickinson2 and Yvonne Howard2
�Scientist Emeritus, Environment Canada, 2Research Associates. Adaptation & Impacts Research Division, Environment Canada
Anthropogenic climate change is conventionally categorized as an environmental pollution issue.
However, this defi nition is incomplete and has a distorting effect on policy. The reduction of
greenhouse gas emissions and the stabilization of greenhouse gas concentrations in the atmosphere
are essential actions and so is adaptation; it is necessary to adapt to inevitable climate change which is now
too late to prevent. This paper identifi es four approaches that might facilitate a transformation of the way
in which climate change is socially constructed: (1) The qualitative accumulation of case study evidence;
(2) meta-analysis; (3) adaptation modeling; and (4) the integration of adaptation with mitigation in both
case studies and in models.
Humans, as one of the most adaptable species, have spread all over the earth and created fl ourishing
societies from the subarctic to the margins of hot deserts and from high mountains to low coasts. There is
consequently a strong case to be made for adaptation to anthropogenic climate change. Human societies
can and do adapt to and benefi t from climate variety as demonstrated over millennia with much less
advanced technology than is available today.
Given the more extreme and long-term projections of climate change, there are ultimate limits to
adaptation but they are still far out of sight. The UN Framework Convention on Climate Change (UNFCCC)
does recognize the importance of adaptation and contains clauses, which if fully implemented, could
go a long way to redressing the imbalance. For such a change to be achieved, better understanding of
the meaning and value of adaptation has to be realized and communicated effectively into the policy
process. After fi rst defi ning climate change as a pollution problem, there has been a preoccupation with
the reduction of greenhouse gas emissions while adaptation has been regarded as at best a distraction but
more seriously as an impediment to the mitigation agenda.
Adaptation has become an imperative. Aggressive efforts to reduce greenhouse gas emissions will have
little effect in reducing climate change for decades and even with the most optimistic of the IPCC wide
Figure �a and �b. The adaptation imperative

Global Assessment: Bridging Scales and Linking to Policy
��
SRES scenarios, global mean surface temperature will continue to rise to the end of the century and
beyond (Figure 1a and 1b). However, adaptation still requires a single metric similar to mitigation which
is simply measured in atmospheric greenhouse gas concentrations. There is also a need to explore and
promote improvements in “upscaling”, which refers to either: adding value to, or increasing the size of the
adaptation knowledge base, and scientifically or technically moving from local or regional level adaptation
to global level adaptation.
The traditional approach of drawing upon the vast number and diversity of specific impact and adaptation
case studies in such a way that adaptation can be presented alongside mitigation as an essential part of
a mixed portfolio of responses to climate change has met with modest success. Individual studies can
provide valuable insight into the possibilities of adaptation and the actual adoption process in particular
places, but the insights are not easily cumulated into generic conclusions that can inform the wider policy
process.
The Canadian Second National Assessment of Impacts and Adaptation is nearing completion (Natural
Resources Canada 2007); it has helped in providing a list of ten examples presented in summary form in
Table 1a and 1b. The selection illustrates the wide variety of spontaneous adaptation activities now underway
and shows the wide range of localities and sectors in which they are found (Howard forthcoming). Such a
broadly accessible database of examples of adaptation might provide useful examples that could encourage
the wider adoption and diffusion of adaptation to climate change.
The United Kingdom Climate Impacts Program (UKCIP), based in Oxford, England, has attempted
the formation of such a compilation with its “Adaptation Action” database (UKCIP 2006). This online,
searchable database is comprised of adaptation case studies from around the United Kingdom. The
examples are cross-categorized by region, sector and adaptation type, and by 17 April 2007 249 examples
had been listed. While the site is maintained by staff, there is an interactive feature that allows any user
from outside the UKCIP to submit ideas and text to be included as a case study. This tool provides a
platform for the identification of climate change measures that are spread across sectors and governed
by a wide array of administrative bodies. It facilitates the categorization of spontaneous and planned
adaptation; as the database grows in scope, it may well help to identify the early adapters in the country.
A second example is drawn from the international level, specifically the recently completed Assessment
of Impacts and Adaptations to Climate Change (AIACC) project funded by the Global Environment
Facility (GEF), implemented by the United Nations Environment Programme and executed by the global
change SysTem for Analysis, Research, and Training (START) Secretariat in Washington and the Third
World Academy of Sciences (TWAS) in Trieste. A collective effort to synthesize the findings with respect
to adaptation generated a common list of nine lessons: (1) Adapt now!; (2) create the necessary conditions
to enable adaptation; (3) integrate adaptation with development; (4) increase awareness and knowledge;
(5) strengthen institutions; (6) protect natural resources; (7) provide financial assistance; (8) involve those
at risk; (9) use place-specific strategies. Notwithstanding the previous eight conclusions, adaptation needs
to be based on recognition of the individual circumstances of each place.
A meta-analysis is a study that statistically synthesizes similar data in order to quantitatively be able to
pool and analyse the results. It requires the same methodology and procedural structure in order to be
accurate. The meta-analysis of adaptation has the potential to scientifically upscale adaptation by taking
preliminary or local studies and upscaling them to comprehensive or global studies. These could then
be used to formulate generic relationships while helping to inform public policy and setting national
and international standards. In theory it would be useful to apply this approach to adaptation to climate
change. In practice, however, the abundance of adaptation case studies in the literature covers such a wide
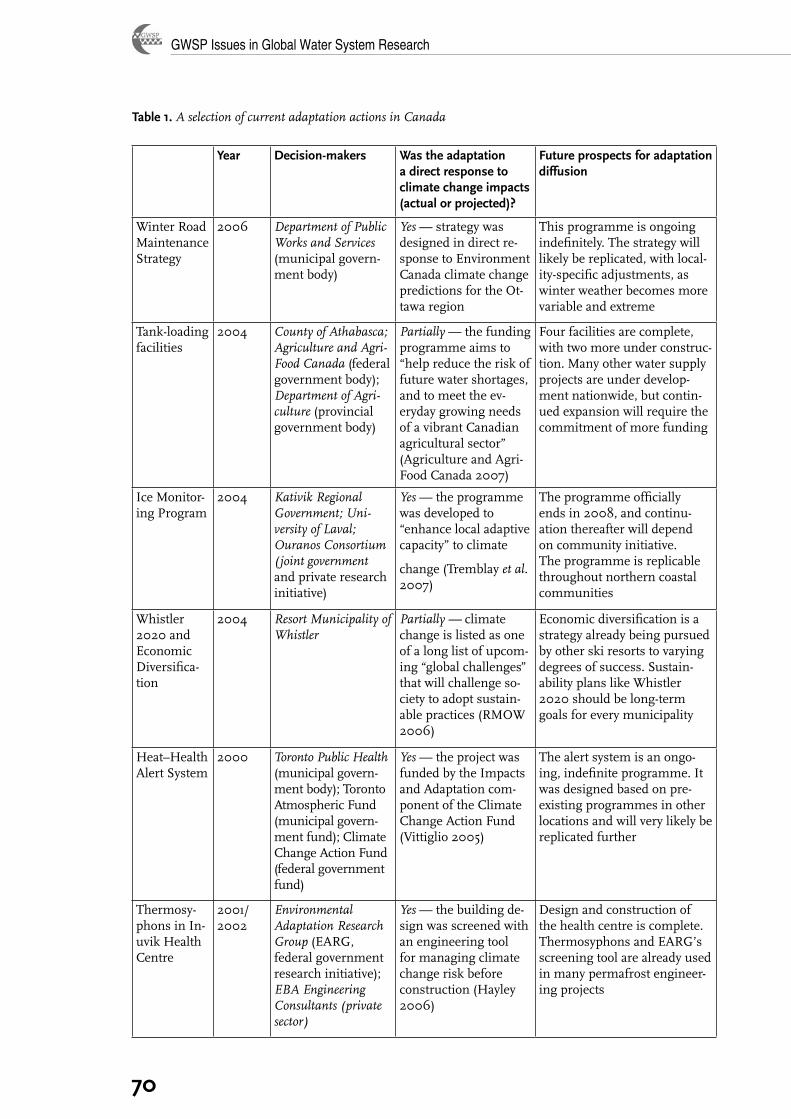
GWSP Issues in Global Water System Research
�0
Table �. A selection of current adaptation actions in Canada
Year Decision-makers Was the adaptation a direct response to climate change impacts (actual or projected)?
Future prospects for adaptation diffusion
Winter Road Maintenance Strategy
2006 Department of Public Works and Services (municipal govern-ment body)
Yes — strategy was designed in direct re-sponse to Environment Canada climate change predictions for the Ot-tawa region
This programme is ongoing indefinitely. The strategy will likely be replicated, with local-ity-specific adjustments, as winter weather becomes more variable and extreme
Tank-loading facilities
2004 County of Athabasca; Agriculture and Agri-Food Canada (federal government body); Department of Agri-culture (provincial government body)
Partially — the funding programme aims to “help reduce the risk of future water shortages, and to meet the ev-eryday growing needs of a vibrant Canadian agricultural sector” (Agriculture and Agri-Food Canada 2007)
Four facilities are complete, with two more under construc-tion. Many other water supply projects are under develop-ment nationwide, but contin-ued expansion will require the commitment of more funding
Ice Monitor-ing Program
2004 Kativik Regional Government; Uni-versity of Laval; Ouranos Consortium (joint government and private research initiative)
Yes — the programme was developed to “enhance local adaptive capacity” to climate
change (Tremblay et al. 2007)
The programme officially ends in 2008, and continu-ation thereafter will depend on community initiative. The programme is replicable throughout northern coastal communities
Whistler 2020 and Economic Diversifica-tion
2004 Resort Municipality of Whistler
Partially — climate change is listed as one of a long list of upcom-ing “global challenges” that will challenge so-ciety to adopt sustain-able practices (RMOW 2006)
Economic diversification is a strategy already being pursued by other ski resorts to varying degrees of success. Sustain-ability plans like Whistler 2020 should be long-term goals for every municipality
Heat–Health Alert System
2000 Toronto Public Health (municipal govern-ment body); Toronto Atmospheric Fund (municipal govern-ment fund); Climate Change Action Fund (federal government fund)
Yes — the project was funded by the Impacts and Adaptation com-ponent of the Climate Change Action Fund (Vittiglio 2005)
The alert system is an ongo-ing, indefinite programme. It was designed based on pre-existing programmes in other locations and will very likely be replicated further
Thermosy-phons in In-uvik Health Centre
2001/ 2002
Environmental Adaptation Research Group (EARG, federal government research initiative); EBA Engineering Consultants (private sector)
Yes — the building de-sign was screened with an engineering tool for managing climate change risk before construction (Hayley 2006)
Design and construction of the health centre is complete. Thermosyphons and EARG’s screening tool are already used in many permafrost engineer-ing projects
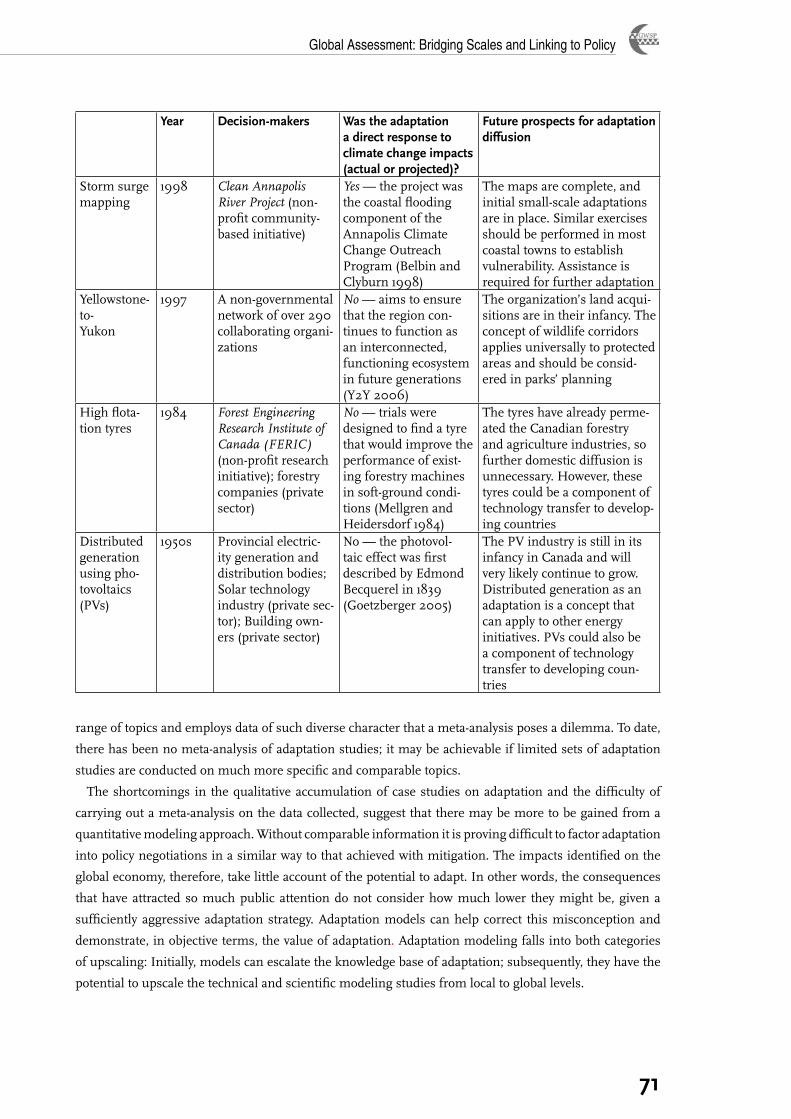
Global Assessment: Bridging Scales and Linking to Policy
��
Year Decision-makers Was the adaptation a direct response to climate change impacts (actual or projected)?
Future prospects for adaptation diffusion
Storm surge mapping
1998 Clean Annapolis River Project (non-profit community-based initiative)
Yes — the project was the coastal flooding component of the Annapolis Climate Change Outreach Program (Belbin and Clyburn 1998)
The maps are complete, and initial small-scale adaptations are in place. Similar exercises should be performed in most coastal towns to establish vulnerability. Assistance is required for further adaptation
Yellowstone-to- Yukon
1997 A non-governmental network of over 290 collaborating organi-zations
No — aims to ensure that the region con-tinues to function as an interconnected, functioning ecosystem in future generations (Y2Y 2006)
The organization’s land acqui-sitions are in their infancy. The concept of wildlife corridors applies universally to protected areas and should be consid-ered in parks’ planning
High flota-tion tyres
1984 Forest Engineering Research Institute of Canada (FERIC) (non-profit research initiative); forestry companies (private sector)
No — trials were designed to find a tyre that would improve the performance of exist-ing forestry machines in soft-ground condi-tions (Mellgren and Heidersdorf 1984)
The tyres have already perme-ated the Canadian forestry and agriculture industries, so further domestic diffusion is unnecessary. However, these tyres could be a component of technology transfer to develop-ing countries
Distributed generation using pho-tovoltaics (PVs)
1950s Provincial electric-ity generation and distribution bodies; Solar technology industry (private sec-tor); Building own-ers (private sector)
No — the photovol-taic effect was first described by Edmond Becquerel in 1839 (Goetzberger 2005)
The PV industry is still in its infancy in Canada and will very likely continue to grow. Distributed generation as an adaptation is a concept that can apply to other energy initiatives. PVs could also be a component of technology transfer to developing coun-tries
range of topics and employs data of such diverse character that a meta-analysis poses a dilemma. To date,
there has been no meta-analysis of adaptation studies; it may be achievable if limited sets of adaptation
studies are conducted on much more specific and comparable topics.
The shortcomings in the qualitative accumulation of case studies on adaptation and the difficulty of
carrying out a meta-analysis on the data collected, suggest that there may be more to be gained from a
quantitative modeling approach. Without comparable information it is proving difficult to factor adaptation
into policy negotiations in a similar way to that achieved with mitigation. The impacts identified on the
global economy, therefore, take little account of the potential to adapt. In other words, the consequences
that have attracted so much public attention do not consider how much lower they might be, given a
sufficiently aggressive adaptation strategy. Adaptation models can help correct this misconception and
demonstrate, in objective terms, the value of adaptation. Adaptation modeling falls into both categories
of upscaling: Initially, models can escalate the knowledge base of adaptation; subsequently, they have the
potential to upscale the technical and scientific modeling studies from local to global levels.

GWSP Issues in Global Water System Research
��
To illustrate the use of adaptation models, in Hope et al. (1993), the PAGE model was used to assess the
value of policies relating to climate change. The output demonstrated that mitigation is not suffi cient as a
stand-alone measure. Aggressive adaptation is required. A second model, AD-DICE, led to the conclusion
that choosing an agenda that focuses solely on adaptation has higher utility than a purely mitigation-
focused agenda. Adaptation was therefore more cost effective. The model also was able to show that the
net benefi ts of mitigation up to 2050 are negative. The fi ndings from the model support the statement that
applying only adaptation is more benefi cial than applying mitigation per se, confi rming the importance of
adaptation as a control option in combating climate change up until 2100, when mitigation subsequently
reduces damages (de Bruin, 2007).
What is the economic cost of not adapting? Recent publications (de Bruin et al. 2007) have used
adaptation modeling to highlight the ability of adaptation to decrease the negative impacts of climate
change in the next 50 years; along with allowing for benefi cial opportunities in new sectors and the
preservation of markets that without adaptation would be detrimentally impacted by climate change.
Currently, adaptation models are still in the initial discovery stages, mainly relying on theoretical data and
assumptions which for greater practical application should be shifted to usage of empirical data. There
are also several types of adaptation models (Dickinson forthcoming) that lack a common metric. This may
never be completely resolved because adaptation options to climate change are so diverse; however, there
may be some arguments in favour of using monetary units as the common metric in adaptation models.
However, for adaptation modeling to truly reach its potential it will require translation to those outside the
modeling community.
An approach to upscaling that is dependent on the success of either modeling, or case study analysis
(or both) is the integration of adaptation with mitigation studies; this approach provides added value to
adaptation. The idea is simply that closer integration of adaptation with mitigation might make the case
for a combined strategy or portfolio more acceptable in the policy process and negotiations than the two
taken separately. The idea is suggested thematically in Figure 2 where the fl ow of benefi ts over time from
mitigation and adaptation is compared. Although the exact plot of the curves is not agreed it is accepted
that adaptation measures can yield net benefi ts in the short term and that mitigation benefi ts will be
delayed.
Figure �. Short-term adaptation benefi ts and longer term mitigation benefi ts

Global Assessment: Bridging Scales and Linking to Policy
��
Adaptation is recognized as an important part of the climate change policy agenda, but it has received less
attention and support than mitigation for a variety of reasons related to the social construction of climate
change as an environmental pollution issue. It is suggested that if this situation is to be changed and a
more balanced portfolio developed some improvements are needed in adaptation research. Reliance upon
the qualitative accumulation of case study evidence is not sufficient by itself to bring about the required
redress. This does not mean that such studies should be abandoned. Detailed local studies involving
stakeholders and those at risk are an essential component of adaptation. In addition to the strengthening
of place-based adaptation research, three other options previously outlined have been considered that lead
to the following six conclusions and recommendations: (1) Improve local place-based studies of adaptation
by making them more widely available as examples for demonstration purposes. This could be achieved
by the creation of a publicly accessible Web-based database, classified by region, by sector and by type
of adaptation. (2) Assemble sets of case studies that are sufficiently similar in topic, focus and method
to investigate and develop the possibilities of meta-analysis. Where feasible, carry out one or more pilot
meta-analyses of adaptation. (3) Further, develop adaptation modeling, using stand-alone adaptation,
especially examining the adaptation process and also adaptation in integrated assessment models. (4)
Develop a set of joint case studies of adaptation and mitigation in the same locality in the context of
sustainable development; organize this as a programme on an international level. (5) Consider how these
four approaches to adaptation studies might be developed in concert and explore the possibilities for
synergy and mutual benefit. (6) Translation and communication of adaptation research results to those
outside the research community, and especially into the policy process.
ReferencesAgriculture & Agri-Food Canada. 2007. National water supply expansion program. Retrieved April 12, 2007,
from http://www.agr.gc.ca/env/index_e.php? section= h2o& page=h2o.
Belbin, J. & Clyburn, D. 1998. Tidal Surge Project. The coastal flooding component of the Annapolis Climate Change Outreach Project for the Clean Annapolis River Project (CARP). Retrieved April 11, 2007, from http://www.env.gov.nl.ca/env/Env/municipalities/carp.pdf.
de Bruin, K.C., Dellink, R.B. & Tol., R.S.J. 2007. AD-DICE: an implementation of adaptation in the DICE model. FNU Working Papers 126, Hamburg University and Centre for Marine and Atmospheric Science, Hamburg, Germany.
Dickinson, T. Forthcoming. Adaptation modeling.
Goetzberger, A. 2005. Crystalline silicon solar cells. A presentation to the workshop on Physics for Renewable Energy, Italy, Oct. 17–29, 2005.
Hayley, D. 2006. Rationalizing climate change for design of new structures on permafrost. Presentation from Natural Resources Canada Speaker Series. Ottawa, Ontario, Nov. 24, 2006.
Hope, C., Anderson, J. & Wenman, P. 1993. Policy analysis of the greenhouse effect: an application of the PAGE model. Energy Policy, 21(2): 327–338.
Howard, Y. Forthcoming. Adaptation case studies.
Mellgren, P. & Heidersdorf, E. 1984. The use of high flotation tires for skidding in wet and/or steep terrain. Technical Report No. 57. Pointe Claire, QC, Forest Engineering Research Institute of Canada.
Natural Resources Canada. 2007. Climate Change Impacts and Adaptation Program. From impacts to adaptation: Canada in a changing climate 2007. Retrieved 1 August 2007 from http://adaptation.nrcan.gc.ca/assess_e.php.
Resort Municipality of Whistler (RMOW). 2006. Whistler 2020: moving toward a sustainable future. Whistler 2020s Vision Document, 2nd edition.
GWSP Issues in Global Water System Research
��
Tremblay, M., Furgal, C., Larrivée, C., Annanack, T., Tookalook, P., Qiisik, M. et al. 2007. Climate change in Northern Québec: adaptation strategies from community-based research. Unpublished manuscript (provided by M. Tremblay on March 31, 2007).
United Kingdom Climate Impacts Program (UKCIP). 2006. Adaptation actions. Retrieved 1 May 2007, from http://www.ukcip.org.uk/resources/tools/database.asp.
Vittiglio, M. 2005. Toronto’s heat-health alert system and response plan to protect vulnerable populations. Presentation from the program’s coordinating manager. Retrieved 30 July 2007 from http://cleanairpartnership.org/climate/cc_toronto_heat_island_system.pdf.
Yellowstone to Yukon (Y2Y). 2006. Yellowstone to Yukon Conservation Initiative. Retrieved 30 April 2007 from http://www.y2y.net/.
Global Assessment: Bridging Scales and Linking to Policy
��
Climate change adaptation, mitigation and sustainable development: integration options for policy
Livia Bizikova
Adaptation & Impacts Research Division (AIRD), Environment Canada and
The W. Maurice Young Center for Applied Ethics, Vancouver, BC, Canada
Linkages between climate change and sustainable development
Recent climate change-related events including hurricanes, droughts and floods that have caused
much concern have alerted the public and policy-makers not only to consider climate change
impacts and needs for adaptation and mitigation, but also, in many cases, to question the current
notion of development. This realization recognizes that climate change and development interact in a
circular fashion (Downing 2003). Climate change vulnerability and impacts will influence prospects
for development, and in turn, alternative development paths will not only determine greenhouse gas
emissions that affect future climate change, but also influence future capacity to adapt and to mitigate
climate change (Downing 2003; Dang et al. 2003; Wilbanks 2003).
Currently, there are two distinctive approaches to climate change and sustainable development linkages;
one addresses climate change policies within broader efforts towards sustainability and the other is
focused on ensuring principles of sustainable development within climate change policies (Cohen et al.
1998; Swart et al. 2003; Robinson et al. 2006). Furthermore, research efforts and experiences on the
ground recognize a need for both adaptation and mitigation responses, increasingly in a way that supports
long-term development. During the evolution of these responses, differences including temporal and
spatial scales, distribution of costs and benefits and differences among the decision-makers involved
in adopting these measures were identified (Klein et al. 2005). However, there is currently growing
interest in exploring linkages between adaptation and mitigation to increase the effectiveness of allocated
resources and actual policies by accounting for local and regional conditions where the actual impacts are
encountered, capacities are built and responses are implemented (Wilbanks 2005; Dang et al. 2003).
Linkages between climate change and sustainable development are recognized at the international
level; since the IPCC Third Assessment Report was published in 2001, there has been a growing body of
literature addressing this topic (Cohen et al. 1998; Swart et al. 2003; Wilbanks 2005). The IPCC Fourth
Assessment Report addresses these linkages as cross-cutting themes integrating them into and across
Working Group II and III reports (IPCC 2005). In the Working Group II report, IPCC (2007) stresses a
limited knowledge about climate change adaptation; mitigation linkages with sustainable development
have significant methodological shortcomings to promote such integrated approaches.
Methodological approachDespite increasing attention among researchers, there is still a dearth of policies and case studies that
can provide examples of operationalizing this concept (Swart et al. 2003; Wilbanks 2005, IPCC 2007).
To identify challenges and opportunities for such policy-relevant studies, this paper brings together both
researchers and practitioners working in a diversity of fields to evaluate viewpoints derived from their
needs as producers and users of research and case study results. This paper is largely based on practical
GWSP Issues in Global Water System Research
��
experiences gained through brainstorming sessions conducted prior to developing multistakeholder
projects aiming for case studies particularly in local contexts. In terms of linkages between climate change
adaptation and mitigation within sustainable development, the question of greatest relevance is how to
connect these domains operating on different scales and involving a diversity of values and institutional
frameworks in a way that would lead to actual policies. We see three central research questions important
to improving our understanding of capacities to promote integrated responses to climate change in the
context of sustainable development:
When addressing linkages between adaptation and mitigation, from which perspective, climate change or
sustainable development, should the local study be approached?
What are the synergies and trade-offs between adaptation and mitigation measures, including institution-
al, economic, social and decision-making determinants, in such a study?
Can adaptation and mitigation synergies linked to development priorities be designed in a policy-relevant
manner that can be addressed within existing institutional frameworks?
This paper demonstrates that there is a considerable interest from both the researchers’ and practitioners’
communities in exploring synergies between adaptation and mitigation when the focus is on addressing
local sustainable development challenges that frame responses to climate changes and create opportunities
to involve local-specific value-based participatory approaches. Furthermore, it presents opportunities
identified by the practitioners for incorporating climate change adaptation and mitigation responses into
development decisions to promote actions in addressing pressing local challenges.
Researchers’ and practitioners’ views on opportunities for studies targeting climate change and sustainable developmentBased on dialogue with both researchers and practitioners, climate change was perceived as one of the
important issues on the path towards sustainable development. It was stressed that local development
decisions including infrastructure, urban development and changes in land use play a key role in tackling
impacts and reducing greenhouse gas emissions. Similar to Gupta and Van Asselt (2006), approaching
climate change as an important question within the development planning process was preferred by
both groups of participants. From the practitioners’ perspective, this understanding was motivated by
a desire to promote long-term responses that could not be sustained without challenging current local
development paradigms in the regional, national and global contexts.
From a practical perspective, participants in local development decisions identified a strong focus on
economics with less emphasis on environmental and social issues as well as a need to implement a
balanced approach in local development. However, aiming for such an approach and simultaneously
embodying climate change responses into the development context without providing a strong local focus
may block actual actions due to complexity and uncertainty within both issues. Local planning documents
promoting sustainable development were proposed by practitioners as a way of creating a baseline for
envisioning future sustainable development priorities and including assessments of climate change
impacts, capacities and responses. Both practitioners and researchers agreed that to be effective in linking
climate change and sustainability, local development issues would need to be identified in a way that
would envision sustainable futures within the context of these local issues. Thus, although sustainable
development can be seen as a concept that is too complex to be operationalized, the urgency of addressing
local development issues can bring local practitioners and researchers together with a focus on moving
towards on-the-ground planning questions.
1.
2.
3.
Global Assessment: Bridging Scales and Linking to Policy
��
How do climate change responses and linkages interact within the development context?In general, initiatives solely focused on climate change will probably fail due to small risks/benefits in
areas with lower levels of vulnerability. In contrast, promoting sustainable solutions to local problems has
many direct benefits with climate change co-benefits. Therefore, a balanced perspective needs to be applied
without: (a) Undermining the potency of climate change as a catalyst for broader attention to sustainable
development issues; (b) ignoring that the interaction of climate change could play a significant role in
exaggerating socio-economic and environmental stresses; and (c) reducing attention to those situations
that are clearly vulnerable to climate change in the particular local context (Wilbanks 2003; O’Brien and
Leichenko 2000).
The practitioners were aware that local as well as regional and national priorities on social, political,
institutional and economic issues interact with and have an important influence on vulnerability, capacities
and prospects for adaptation and mitigation to climate change. Based on the experiences of involved
practitioners, within local development issues, selecting adaptation responses and creating linkages with
a variety of mitigation options require obtaining information about impacts and identifying society’s
preferences and capacities to implement the identified responses. The practitioners articulated that there
is insufficient information about the impacts of climate change on resource availability at the appropriate
scale that is relevant to the local decision-making context. Therefore there is a need for an estimation of
the biophysical impacts of climate change at the local level.
Despite the realities of short-term political cycles, decisions involving reforestation, infrastructure
development, land-use change and urban development must be made under the consideration of impacts
spanning many decades. Many of these decisions are made by practitioners, planners, business leaders and
engineers that need not necessarily be limited by the short-term focus of the political agenda. Practitioners
were aware that if development is not considered to occur over longer time scales, then those decisions
could make society and future generations vulnerable to the impacts of advancing climate change. It could
lock them into certain development patterns that could also constrain options for adaptation and responses
to mitigation policies imposed by higher levels of governance. Consequently, participants proposed long-
term thinking about development priorities that could provide sufficiently long time horizons to account
for climate change impacts.
Practitioners also emphasized the importance of linking the selection of potential responses to climate
change to development priorities in the particular local situation. However, options defined at the
national level and examples applied in other parts of the world can provide a guideline to identify specific
adaptation and mitigation options. It was interesting to note that practitioners and researchers argued to
upscale adaptation and at the same time, to be more locally specific in mitigation. Precisely, mitigation
was identified as a local action that needs to bridge local development priorities, public preferences and
anticipated local climate change impacts. In the case of adaptation, both practitioners and researchers
argued for a national or even international adaptation framework or inventory of adaptation opportunities
to guide local efforts and to pressure governments to proceed with adaptation in a focused manner.
ConclusionDespite significant research efforts in climate change and its linkages to development, there will be no
improvement in development processes if local communities are not ready to address the challenges
and make use of collaborative initiatives. Researchers and practitioners expressed interest in conducting

GWSP Issues in Global Water System Research
��
studies focused on climate change adaptation, mitigation and sustainable development. This was
mainly due to the practical needs encountered by practitioners in pursing their planning decisions
and to the interests of researchers in conducting problem-based integrated assessments that promote
interdisciplinary research and can address concerns on the ground through stakeholder participation.
Regional, national and international forums need to promote the outcomes of these studies to foster
knowledge and information exchange and therefore help to strengthen local community efforts to move
towards sustainable development and address climate change.
ReferencesCohen, S., Demeritt, D., Robinson, J. & Rothman, D. 1998. Climate change and sustainable development:
towards dialogue. Global Environmental Change, 8(4): 341–371.
Dang, H.H., Michaelowa, A. & Tuan, D.D. 2003. Synergy of adaptation and mitigation strategies in the context of sustainable development: the case of Vietnam. Climate Policy, 3(supplement 1): S81–S96.
Downing, T.E. 2003. Special supplement on climate change and sustainable development — editorial. Climate Policy, 3(supplement 1): S3–S8.
Gupta, J. & van Asselt, H. 2006. Helping operationalise Article 2: A transdisciplinary methodological tool for evaluating when climate change is dangerous. Global Environmental Change, 16(1): 83–94.
IPCC �00�. Report of the joint IPCC WG II & III expert meeting on the integration of adaptation, mitigation and sustainable development into the 4th IPCC Assessment Report. St Denis, Reunion Island, France, 16–18 February 2005.
IPCC Working Group �. 2007. Climate change 2007: impacts, adaptation and vulnerability. Summary for policymakers, approved 6 April 2007.
Robinson, J., Bradley M., Busby, P., Conor, D., Murray, A., Sampson, B. & Soper, W. 2006. Climate change and sustainable development: realizing the opportunity. Ambio, 35(1): 2–9.
O’Brien, K. & Leichenko, R. 2000. Double exposure: assessing the impacts of climate change within the context of economic globalization. Global Environmental Change, 10(3): 221–232.
Swart, R., Robinson, J. & Cohen, S. 2003. Climate change and sustainable development: expanding the options. Climate Policy, 3(supplement1): S19–S40.
Wilbanks, T.J. 2003. Integrating climate change and sustainable development in a place-based context. Climate Policy, 3(supplement1): S147–S154.
Wilbanks, T.J. 2005. Issues in developing a capacity for integrated analysis of mitigation and adaptation. Environmental Science & Policy, 8(6): 541–547.
Global Assessment: Bridging Scales and Linking to Policy
��
Integrated adaptation modeling of climate change: a municipal case study in Ontario, Canada
James MacLellan and Adam Fenech
Environment Canada, Toronto, Ontario, Canada
Keywords: climate change, adaptation, integrated modeling, municipalities, Halton, Canada
The Adaptation and Impacts Research Division (AIRD) of Environment Canada has developed
or has access to many models, tools, methods and techniques for analysing the implications of
various climate change-related policy options on socio-economic and ecological systems. Most of
these models/tools have been employed in an ad hoc fashion as dictated by the specific and immediate
needs of the stakeholders, decision-makers and researchers. The purpose of the project discussed here
is to bring these tools together in an integrated fashion so as to improve the overall decision-making
capacity of planners and decision-makers within various domains. This presentation reviews the initial
methodological considerations of developing an integrated adaptation, mitigation, sustainable development
(AMSD) decision support system (DSS) that will then be used/tested within a specific urban setting (the
case study).
Given the overwhelming evidence chronicled by the Intergovernmental Panel on Climate Change’s
(IPCC) fourth assessment, there no longer appears to be any significant doubt regarding the existence of
climate change, or its potential for dramatically impacting human society. The only questions remaining
concern the form and character of human response in the face of changing weather patterns (i.e. increasing
global temperatures, sea levels, tropical storms, droughts, peak wind intensities, precipitation, humidity
etc.) and their associated impacts (i.e. higher incidence of death and serious illness due to temperature
rises and associated pollution affects; shifting species distributions; pests and associated diseases such as
the West Nile virus, tick-borne encephalitis, Lyme disease, Dengue fever, etc.).
Assessing the nature of these interconnected impacts and preparing appropriate human responses is
a challenging task given the large uncertainties involved and the chequered history of environmental
management. Nevertheless, many adaptation options, strategies and frameworks exist which hold
great potential for reducing human vulnerability. In combination with mitigation measures, adaptive
options range from the purely technological, to the managerial and political. Unfortunately, the effective
implementation/utilization of such techniques appears to lag behind their development. As such, a
case study framework has been adopted to encourage proactive, cost-effective and sustainable adaptive
responses to climate change at the local level, while facilitating analysis of logistical and methodological
issues surrounding the integration of various stand-alone models.
The Canadian Regional Municipality of Halton in the province of Ontario will be the testing ground for
the tools and concepts developed by AIRD. Halton region is currently experiencing tremendous urban/
suburban growth (the greatest growth rates in Canada), although it still retains large expanses of rural
landscape (including a UNESCO World Heritage site). Balancing these two, often conflicting development
components, is a tremendous challenge for Halton, as for other cities and towns around the world. Globally,
urban environments will be the centres of greatest human population growth over the coming decades,
increasing the already dramatic effect they have upon the natural environment (i.e. ecological footprint).
Climate change will exacerbate these effects in a myriad of interconnected ways, requiring a wide array of

GWSP Issues in Global Water System Research
�0
tools/techniques that are applicable over a range of settings, yet are capable of being tailored to the specific
needs of a given region.
In our case, we propose a conceptual, agency-centred framework (Agent ENvironment [AEN]), within
which major modeling systems, techniques and information are to be structured. Such an approach
seems necessary given the inherent complexity of this “wicked” planning environment (i.e. a planning
environment with no correct formulations; numerous stakeholders; no stopping rules to determine
problem solution; no criteria to judge the “goodness” of decisions; no ability to test decisions except by
execution; and no enumerable or exhaustible and describable set of possible solutions). This systems
approach will be used heuristically to help the comprehension of complex environmental phenomena
(social or natural) by providing scaffolding upon which system components can be ordered, related and
integrated to produce a DSS for AMSD.
To illustrate the AEN, first consider the simplest imaginable system composed of an agent and its
natural or social environment (Figure 1a). An agent senses its environment through various sensors and
then directly responds to its perceptions with actuators. Though simple, such feedback systems can be
quite effective under a wide variety of conditions. Planning systems on the other hand, possess a feed
forward element which bases action upon generated representations of future environmental conditions.
To represent this more complicated system, a metaphoric separation of the agent and its environment is
presented in Figure 1b. Here, the agent is external to the environment and “planning” occurs outside the
agent within a larger, socio-historical context. The first part of this planning framework is composed of
environmental information that is collected and classified, from which patterns and relationships (models)
are determined.
This process may be structurally represented by two basic elements: Descriptive Data, which are any
data describing past environments including social/cultural conditions and Predictive Models, which are
any models that attempt to describe a future state of the environment (social or natural). Data inventories
represent the essential starting point for an AMSD DSS. Knowledge begins with data, from which
inferences of relationships among elements are formed. These inferred relationships represent Predictive
Models, which are capable of describing possible environmental states given alternate state conditions.
The relationship between data and models is not unidirectional (i.e. Descriptive Data to Predicative
Models), instead output from Predictive Models influences the type of Descriptive Data collected and used
for validation and future inference. Output is even used as input, although at some point validation is
required with empirical data (Descriptive Data).
Figure �a and �b. Simple (1a) and complex (1b) Agent Environment (AEN)
1a 1b
Global Assessment: Bridging Scales and Linking to Policy
��
The third component in Figure 1b, the Vetting Systems, represents the process which we use to examine
future possibilities. Output from Predictive Models describes possible futures and our influence over them.
In an ideal sense, there is an infinite spectrum of possibilities of which only an exceedingly small fraction
may be represented. This small fraction may nevertheless be incredibly large and must be analysed to
reveal feasible, valued, system states. This search process can use various biological, economic, political,
or algorithmic techniques. Through data/model combinations and search protocols, we ignore feasibilities
that are of little value to us (temporally adjusted) or those that cannot be represented. By formalizing this
overall vetting process, we tie values to choices more directly.
Once a desired future state is identified, a strategy must be devised for attaining it. Given the sought
state and the existing state, the task is to find the difference between the two and a corresponding process
that will erase that difference. Typically the form and structure of Predictive Models makes this intuitively
obvious; nevertheless, when models are of a more abstract nature, a prescriptive plan must be devised.
However identifying this plan or Prescription is not the same as implementing it: The strategy itself may
not be realizable; the relationship between means and ends may reveal more appropriate means or ends;
externalities not accounted for by the Predictive Models may appear; or individuals within institutional
agents, responsible for implementation, may not have undertaken their tasks. Therefore, as part of a
continuously evolving system, all elements of the management process are monitored, evaluated and
improved.
One shortcoming of the AEN conceptual framework is that it suggests humans seek only well-defined
goals in their relationship with the environment. It is instead useful to think of the AEN diagrams as
existing along a number of dimensions. The first dimension expands Figure 1b by considering time:
Figure 1b does not represent one sequential series of events, but is a process which evolves through the
inclusion of monitoring and continuous improvement. In this case, the choice of environmental goals
may be perceived as regulative in the sense that we may never attain certain goals (i.e. ideals regarding
adaptive capacity) but should seek them as a means of constantly improving our relationship with the
environment. The second dimension stretches across planning methodologies: Imagine Figure 1a at one
end of a continuum and Figure 1b at the other. In the first system, a feedback method is employed to adapt
to the environment and in the second a feed forward method. In reality we use both systems to respond
to climate change.
Given this AEN framework, we can provide a rough brushstroke of how we might structure and integrate
various AIRD tools and techniques for our Halton case study. At the core of all AIRD methods/techniques/
approaches are the Global Climate Models (Predictive Models) that various international agencies, including
Canada, have developed to examine the effects of increased carbon dioxide upon longer term climatic
patterns. Global Climate Models (GCMs) use mathematical relationships to simulate the functioning of
the global climate system. Ultimately these models are derived from primary data (Descriptive Data) of
past climatic patterns, from which mathematical relationships have been derived. Local detail (e.g. for the
Halton region over the next 50 years) is captured through the nesting of Regional Climate Models within
GCMs, or through a process called downscaling. Downscaling techniques are generally based on GCM
output and localized historic weather data (Descriptive Data). Additional local data are used to validate the
downscaled models, which then provide a series of climate change scenarios upon which subordinate
models may project impacts and determine adaptation strategies.
In most cases, the outputs from climate models will act as input to other environmental models, such
as hydrological models, productivity models, successional models, hazard models, energy models and
demographic models. For example, AIRD has produced a number of tools/products that deals specifically
GWSP Issues in Global Water System Research
��
with natural hazards, providing guidance on potential impacts such as extreme heat and cold, drought,
extreme rainfall, fog, hail, heavy snow, blizzards, lightning, hurricanes, ice storms, tornadoes, wind storms,
smog, UV radiation and acid rain. Projecting future trends in terms of natural hazards may facilitate
adaptation planning in terms of health care infrastructure, for instance. In this case, decision-makers can
determine the level of preparedness they are willing to accept (Vetting) and the associated infrastructure
this entails (Prescriptions).
Other examples of AIRD models include the REAM (Regional Energy Adaptation Mitigation model), which
is a suite of energy models including a provincial level (i.e. electric power grid) optimization model which
examines long-term, energy mix decisions, as constrained by environmental factors. The Environmental
Services Performance-research (ESP-r) model simulates energy consumption at the building scale and
is currently being used to assess the thermal performance of green roofs. All such models project the
future impacts of climate scenarios and provide various strategies for ameliorating these impacts. The
actual vetting process takes these possibilities and identifies favoured options; inevitably this requires
the participation of stakeholders as well as policy- and decision-makers. Currently, an AMSD framework
is being developed that explicitly deals with vetting by engaging stakeholders from the initial stages of
planning, through policy development, implementation and monitoring.
Ultimately, AEN is unabashedly simplistic in its representation of a very complex interplay between
researchers, policy-makers, decision-makers, stakeholders and the environment. As such, important
nuances of the AMSD approach may be lost if the subsequently created DSS does not consider a more
comprehensive, meta-planning processes. To avoid this, we have chosen to embed AEN in the Mainstreaming
approach of MacIver (2005).
Mainstreaming represents a continuous, iterative dialogue between stakeholders/decision-makers and
AIRD researchers to ensure information, tools and techniques created through research and development:
(1) are open to a diversity of information, opinions and ideas that informs and inspires effective solutions;
2) are of relevance to users; and 3) are adopted by users, stakeholders, and decision-makers in a way that
increases adaptive capacity. Ultimately, AEN is simply one part of this larger framework.
ReferenceMacIver, D. 2005. Mainstreaming adaptation and impacts science into solutions. In A. Fenech, D. MacIver,
H. Auld, Y. Yin & R. Bing Rong, eds, Climate change: building adaptive capacity. Toronto, Environment Canada
Global Assessment: Bridging Scales and Linking to Policy
��
Climate change “adaptation through learning”: using past and future climate extremes’ science for policy- and decision-making
Adam Fenecha and Anthony LiuaEnvironment Canada, Toronto, Ontario, Canada
Keywords: climate, climate change, adaptation, extremes, learning, Biosphere Reserves
Climate can be thought of as an average of the weather over a period of years or decades. It describes
the characteristic weather conditions to be expected in a region at a given time of year, based on
long-term experience. By international convention, weather observations are commonly averaged
over a period of 30 years to produce the statistics that describe the climate “normals” (see Phillips and
McCulloch 1972; Gates 1975; Watson 1974; Janz and Storr 1977; Wahl et al. 1987; Auld et al. 1990). These
averages are helpful for providing “average” temperatures and precipitation, or when comparing one
location to another, but they do not provide the necessary information to assist communities in planning
for climate change adaptation.
For example, the Canadian Biosphere Reserves Association (CBRA) Climate Change Initiative (CCI)
was designed to present climate change information to Biosphere Reserve communities to allow local
organizations to understand climate change and adapt to potential impacts. In this context, Hamilton et al.
(2001) examined instrumental climate records from Biosphere Reserves across Canada including Waterton
Lakes, Riding Mountain, Niagara Escarpment, Long Point and Kejimkujik (a candidate Biosphere Reserve
that was designated as the Southwest Nova Biosphere Reserve in 2001). Annual average temperature and
precipitation series were generated from daily temperature and precipitation values. Long-term trends
were identified over the period of the instrumental record leading to the following results.
In general, data from the interval 1900 to 1998 showed cooler temperatures in the 1920s, warming from
the early 1940s into the early 1950s, cooling into the 1970s and subsequent warming. At many stations,
1998 was the warmest in the instrumental record. Twentieth century warming was shown as approximately
1° Celsius in the Riding Mountain area and 0.6° Celsius at Long Point, Niagara Escarpment and Waterton
Lakes. There has been a slight cooling in the Kejimkujik area over the past half century. Precipitation data
showed increasing trends in the Kejimkujik, Long Point, Niagara Escarpment and Waterton Lakes areas
with no long-term trend in the Riding Mountain area.
Managers at the Biosphere Reserves in Canada were perplexed when presented with this data and
information. How, they asked, was such information on climate normals and trends supposed to assist
them in preparing for future climate change, and the necessary adaptations that might follow? This paper
presents how the needs of environmental managers at Canada’s Biosphere Reserves have dictated the
development of an approach to community-based adaptation strategies to climate change that we call
Adaptation through learning: Using past and future climate extremes’ science for policy- and decision-making.
Informal discussions were conducted with environmental managers at Biosphere Reserves in Canada
and China — the persons responsible for local agriculture, local tourism, park management, or biodiversity
conservation. The question was asked: “How do you make preparations about the threats from future
climate (climate change)?” Most viewed the threat of climate change, or their own vulnerability, as being
due to climate extremes — extreme hot, cold, wet and dry conditions. They also felt that they had good
GWSP Issues in Global Water System Research
��
experience with extreme weather over the past decades and that they could learn from how they had
adapted in the past (if reminded of specific years). The unknown was when and how often extreme
weather was going to occur. The author leaves the answer to “when” to the Farmer’s Almanac, but there
is some science available to provide guidance on answering the question of “how often.” It was clear from
the discussions that communities such as Biosphere Reserves need climate information on extremes of
climate so that they can determine how they have adapted in the past to these extremes and how best to
plan for them in the future.
An index of climate extremes summarizes and presents a complex set of multivariate and multidimensional
climate changes so that the results can be easily understood and used in policy decisions made by non-
specialists in the field. Many have developed their own indices of climate extremes (see Karl et al. 1999
for the World Meteorological Organization’s [WMO] Commission on Climatology Indices [CCl]; European
Climate Assessment 2006; Stardex 2006). Totalling over 400 indices, yet for the application of climate
extremes’s indices to Canada and other Nordic regions, the author has considered Gachon (2005) who
identified 18 indices for extreme temperature and precipitation for Canadian regions.
Gachon considered four criteria in choosing indices: (1) The indices must represent Nordic climate
conditions such as those found in Canada; (2) the indices must be relevant to climate change impact
studies; (3) extreme indices are relatively moderate (e.g. using 10th and 90th percentiles as opposed to the
5th and 95th); (4) indices are adapted to the main characteristics of climate conditions at the regional scale.
Gachon (2005) concludes that 18 indices “provide a good mix of information — precipitation indices
characterize the frequency, intensity, length of dry spells, magnitude and occurrence of wet extremes
while temperature indices refer to variability, season lengths and cold and warm extremes in terms of
magnitude, occurrence and duration”. These indices provide climate information as “easily understood
and used in policy decisions made by nonspecialists in the field”.
The Gachon Indices of Climate Extremes (GICE), used to present to communities across temperate
regions on understanding climate changes, are based on the two most common meteorological
observations — temperature and precipitation. For the indices to be useful in understanding extremes,
observations of maximum and minimum temperatures as well as precipitation should be available on a
daily basis, with a record length of at least 30 years of data. Basic climate observations of temperature and
precipitation are taken around the world using common methodologies and standards established by the
World Meteorological Organization (WMO) (see WMO 1983). Temperature and precipitation observations
are recorded across Canada by automatic weather stations and volunteer climate observers.
Our present understanding of the climate system and how it is likely to respond to increasing
concentrations of greenhouse gases in the atmosphere would be impossible without the use of global
climate models (GCMs). GCMs are powerful computer programmes that use physical processes to
replicate, as accurately as possible, the functioning of the global climate system (Environment Canada
2002). Detailed projections of local climate impacts cannot be made with modest resolution GCMs.
Climate impact studies usually require detailed information on present and future climate with high
resolution and accuracy. In most cases, detailed information is needed with spatial resolutions of the order
of 100 km or less, and with high accuracy concerning the tails of statistical distributions (in particular the
frequency and intensity of rare events).
A method often used to refine results from global models is to nest a regional climate model (RCM)
within a GCM. In addition, a number of methodologies have been developed for deriving more detailed
regional and site scenarios of climate change for impact studies. These downscaling techniques are
generally based on GCM output and have been designed to bridge the gap between the information
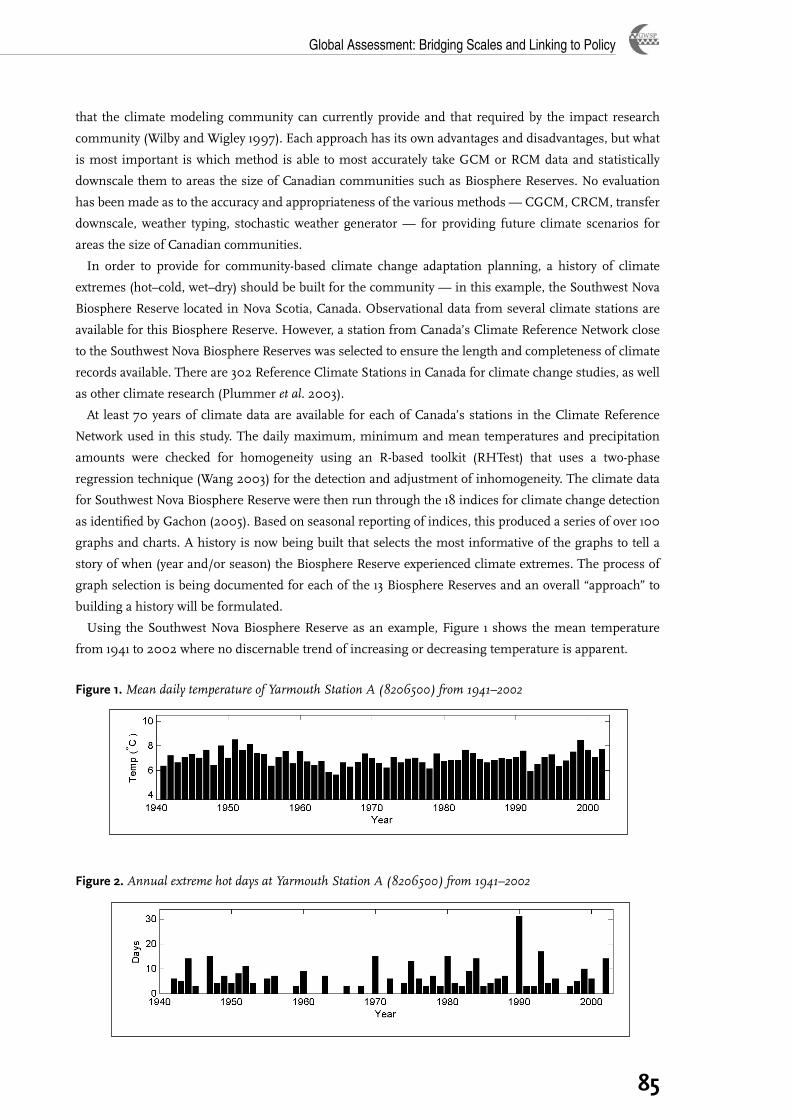
Global Assessment: Bridging Scales and Linking to Policy
��
that the climate modeling community can currently provide and that required by the impact research
community (Wilby and Wigley 1997). Each approach has its own advantages and disadvantages, but what
is most important is which method is able to most accurately take GCM or RCM data and statistically
downscale them to areas the size of Canadian communities such as Biosphere Reserves. No evaluation
has been made as to the accuracy and appropriateness of the various methods — CGCM, CRCM, transfer
downscale, weather typing, stochastic weather generator — for providing future climate scenarios for
areas the size of Canadian communities.
In order to provide for community-based climate change adaptation planning, a history of climate
extremes (hot–cold, wet–dry) should be built for the community — in this example, the Southwest Nova
Biosphere Reserve located in Nova Scotia, Canada. Observational data from several climate stations are
available for this Biosphere Reserve. However, a station from Canada’s Climate Reference Network close
to the Southwest Nova Biosphere Reserves was selected to ensure the length and completeness of climate
records available. There are 302 Reference Climate Stations in Canada for climate change studies, as well
as other climate research (Plummer et al. 2003).
At least 70 years of climate data are available for each of Canada’s stations in the Climate Reference
Network used in this study. The daily maximum, minimum and mean temperatures and precipitation
amounts were checked for homogeneity using an R-based toolkit (RHTest) that uses a two-phase
regression technique (Wang 2003) for the detection and adjustment of inhomogeneity. The climate data
for Southwest Nova Biosphere Reserve were then run through the 18 indices for climate change detection
as identified by Gachon (2005). Based on seasonal reporting of indices, this produced a series of over 100
graphs and charts. A history is now being built that selects the most informative of the graphs to tell a
story of when (year and/or season) the Biosphere Reserve experienced climate extremes. The process of
graph selection is being documented for each of the 13 Biosphere Reserves and an overall “approach” to
building a history will be formulated.
Using the Southwest Nova Biosphere Reserve as an example, Figure 1 shows the mean temperature
from 1941 to 2002 where no discernable trend of increasing or decreasing temperature is apparent.
Figure �. Mean daily temperature of Yarmouth Station A (8206500) from 1941–2002
Figure �. Annual extreme hot days at Yarmouth Station A (8206500) from 1941–2002
4
Network close to the Southwest Nova Biosphere Reserves was selected to ensure the length and completeness of climate records available. There are 302 Reference Climate Stations in Canada for climate change studies, as well as other climate research (Plummer et al. 2003).
At least 70 years of climate data are available for each of Canada’s stations in the Climate Reference Network used in this study. The daily maximum, minimum and mean temperatures and precipitation amounts were checked for homogeneity using an R-based toolkit (RHTest) that uses a two-phase regression technique (Wang 2003) for the detection and adjustment of inhomogeneity. The climate data for Southwest Nova Biosphere Reserve were then run through the �8 indices for climate change detection as identified by Gachon (2005). Based on seasonal reporting of indices, this produced a series of over �00 graphs and charts. A history is now being built that selects the most informative of the graphs to tell a story of when (year and/or season) the Biosphere Reserve experienced climate extremes. The process of graph selection is being documented for each of the �3 Biosphere Reserves and an overall “approach” to building a history will be formulated.
Using the Southwest Nova Biosphere Reserve as an example, Figure � shows the mean temperature from �94� to 2002 where no discernable trend of increasing or decreasing temperature is apparent.
Figure 1. Mean daily temperature of Yarmouth Station A (8206500) from 1941–2002
Examining extremes, however, provides an opportunity to focus on particular years. Figure 2 shows the extreme hot days (three consecutive days where maximum temperature is greater than the daily normal maximum temperature plus 3° Celsius) at Southwest Nova Biosphere Reserve. It is obvious that �990 was a year of extreme hot days doubling any other year prior or following.
Figure 2. Annual extreme hot days at Yarmouth Station A (8206500) from 1941–2002
5
By showing communities how climate has changed in the past, it can be asked how they have adapted to these changes. In this example, the past climate highlights a year of extreme hot days just �5 years ago within the memory of many Biosphere Reserve managers. This extreme year may have required intervention from Biosphere Reserve managers to save agricultural crops, preserve endangered species habitat, or to ensure the quality of groundwater. This knowledge, taken together with scenarios of future climate change showing similar extreme hot or dry years (i.e. changed return periods), can identify some adaptation measures that might be taken to ensure that an adaptation infrastructure is in place, or that alternative management of the biosphere reserve occurs. In other words, what lessons did the community learn from the last event that can be drawn on with advanced knowledge about the future to minimize the negative impacts and maximize the benefits from climate change?
Conclusions
Human communities, such as those in Biosphere Reserves, cannot gain much direction for future climate change adaptation planning using common methods of climate data presentation such as “climate normals” or “climate averages.” What is needed, and asked for by the community, is information on climate extremes, how these have been dealt with by the community in the past and the expected frequency and increase in magnitudes expected to be dealt with in the future. This paper has presented an approach to feeding these needs; what the author titles “Adaptation Through Learning”. Adaptation Through Learning can be described as providing communities with information on past and future extremes of climate so that they can determine how they themselves have adapted in the past to these extremes and how best to plan for them in the future. The tools available from climatologists for this approach include the Gachon Indices of Climate Extremes (GICE) to provide results from climate changes over time that can be easily understood and used in policy decisions made by non-specialists in the field; observational climate data on temperature and precipitation from automated and volunteer weather stations to feed the indices for past climate; and climate data on temperature and precipitation from models of future climate scenarios, including Global Climate Models, Regional Climate Models and several downscaling techniques for understanding future climate extremes.
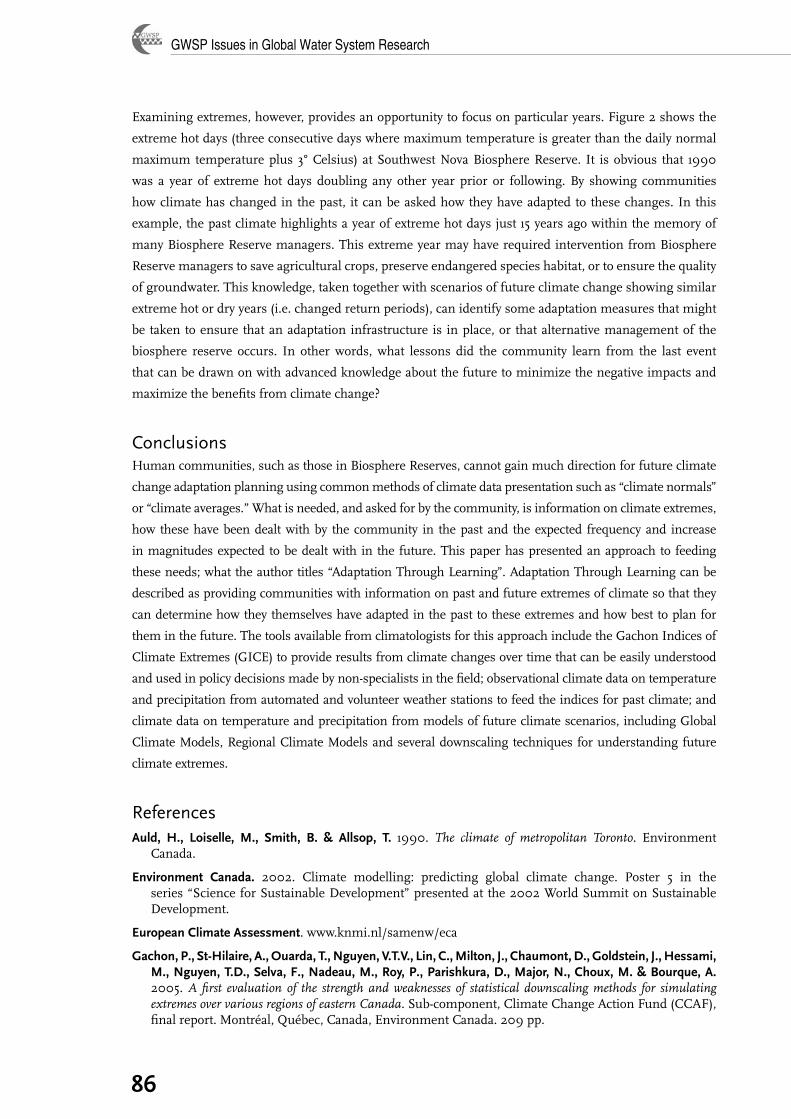
GWSP Issues in Global Water System Research
��
Examining extremes, however, provides an opportunity to focus on particular years. Figure 2 shows the
extreme hot days (three consecutive days where maximum temperature is greater than the daily normal
maximum temperature plus 3° Celsius) at Southwest Nova Biosphere Reserve. It is obvious that 1990
was a year of extreme hot days doubling any other year prior or following. By showing communities
how climate has changed in the past, it can be asked how they have adapted to these changes. In this
example, the past climate highlights a year of extreme hot days just 15 years ago within the memory of
many Biosphere Reserve managers. This extreme year may have required intervention from Biosphere
Reserve managers to save agricultural crops, preserve endangered species habitat, or to ensure the quality
of groundwater. This knowledge, taken together with scenarios of future climate change showing similar
extreme hot or dry years (i.e. changed return periods), can identify some adaptation measures that might
be taken to ensure that an adaptation infrastructure is in place, or that alternative management of the
biosphere reserve occurs. In other words, what lessons did the community learn from the last event
that can be drawn on with advanced knowledge about the future to minimize the negative impacts and
maximize the benefits from climate change?
ConclusionsHuman communities, such as those in Biosphere Reserves, cannot gain much direction for future climate
change adaptation planning using common methods of climate data presentation such as “climate normals”
or “climate averages.” What is needed, and asked for by the community, is information on climate extremes,
how these have been dealt with by the community in the past and the expected frequency and increase
in magnitudes expected to be dealt with in the future. This paper has presented an approach to feeding
these needs; what the author titles “Adaptation Through Learning”. Adaptation Through Learning can be
described as providing communities with information on past and future extremes of climate so that they
can determine how they themselves have adapted in the past to these extremes and how best to plan for
them in the future. The tools available from climatologists for this approach include the Gachon Indices of
Climate Extremes (GICE) to provide results from climate changes over time that can be easily understood
and used in policy decisions made by non-specialists in the field; observational climate data on temperature
and precipitation from automated and volunteer weather stations to feed the indices for past climate; and
climate data on temperature and precipitation from models of future climate scenarios, including Global
Climate Models, Regional Climate Models and several downscaling techniques for understanding future
climate extremes.
ReferencesAuld, H., Loiselle, M., Smith, B. & Allsop, T. 1990. The climate of metropolitan Toronto. Environment
Canada.
Environment Canada. 2002. Climate modelling: predicting global climate change. Poster 5 in the series “Science for Sustainable Development” presented at the 2002 World Summit on Sustainable Development.
European Climate Assessment. www.knmi.nl/samenw/eca
Gachon, P., St-Hilaire, A., Ouarda, T., Nguyen, V.T.V., Lin, C., Milton, J., Chaumont, D., Goldstein, J., Hessami, M., Nguyen, T.D., Selva, F., Nadeau, M., Roy, P., Parishkura, D., Major, N., Choux, M. & Bourque, A. 2005. A first evaluation of the strength and weaknesses of statistical downscaling methods for simulating extremes over various regions of eastern Canada. Sub-component, Climate Change Action Fund (CCAF), final report. Montréal, Québec, Canada, Environment Canada. 209 pp.
Global Assessment: Bridging Scales and Linking to Policy
��
Gates, A. 1975. The tourism and outdoor recreation climate of the maritime provinces. Publications in Applied Meteorology, REC-3-73, Atmospheric Environment Service, Dept of the Environment, Toronto, Canada. 133 pp.
Hamilton, J.P., Whitelaw, G.S. & Fenech, A. 2001. Mean annual temperature and total annual precipitation trends at Canadian Biosphere Reserves. Environmental Monitoring and Assessment, 67(1/2): 239–275.
Janz, B. & Storr. D. 1977. The climate of the contiguous mountain parks. Environment Canada.
Karl, T.R., Nicholls, N. & Ghazi, A. 1999. CLIVAR/GCOS/WMO workshop on indices and indicators for climate extremes: workshop summary. Climatic Change, 42(1): 3–7.
Phillips, D. & McCulloch, J. 1972. The climate of the Great Lakes Basin. Environment Canada.
Plummer, N., Collins, D., Della-Marta, P., Allsop, T., Durocher, Y., Yucyk, T., Helm, R., Helfert, M., Heino, R., Rudel, E., Stasney, P., Zahumensky, I. & Zhou, S. 2003. Progress of automatic weather stations in meeting the needs of climate. Presented at 3a Conferencia Internacional sobre Experiencias con Estaciones Meteologicas Automaticas.
Stardex. www.cru.uea.ac.uk/projects/stardex
Wahl, H., Fraser, D., Harvey, R. & Maxwell, J. 1987. Climate of Yukon. Environment Canada.
Wang, X.L. 2003. Comments on “Detection of undocumented changepoints: A revision of the two-phase regression model”. Journal of Climate, 16(20): 3383–3385.
Watson, W. 1974. The climate of Kejimkujik National Park. Environment Canada.
Wilby, R.L. & Wigley, T.M.L. 1997. Downscaling general circulation model output: a review of methods and limitations. Progress in Physical Geography 21, 530–548.
WMO (World Meteorological Organization). 1983. Guide to climatological practices, 2nd Edition. WMO 100. Geneva, Switzerland.
GWSP Issues in Global Water System Research
��
Use of Geographic Information Systems in assessing climate change impacts and adaptation modeling
Robin Bing Rong and Adam Fenech
Adaptation and Impacts Research Division, Environment Canada, Toronto, Ontario, Canada
Introduction
The climate change research community faces considerable challenges. These include not only
integrating complex physical processes into weather forecast and climate system models but also
understanding the interactions between climate, environment and society as well as integrating
social and environmental information with weather and climate data. In addition, in order to make climate-
related policy decisions in the context of human infrastructure, it is critical to make atmospheric science
usable and data accessible to a wide community of users, including researchers, educators, practitioners
and policy-makers.
A Geographic Information System (GIS) is a computerized marriage between a graphic representation
and a textual description of a geographic location (Anderson and Associates 2007). A GIS provides the
decision-maker with a logical and graphic representation of geographically-referenced information. Over
the past decade, GIS has been used for data integration, analysis and decision-making in many societal
sectors and academic disciplines. GIS allows for interdisciplinary efforts to foster collaborative science,
spatial data interoperability and knowledge sharing on climate change impacts and adaptation studies.
WEBGIS is a GIS distributed across a computer network to integrate, disseminate and communicate
geographic information visually on the Internet (Horanont et al. 2007). In performing GIS analysis tasks,
this service is similar to the client-server architecture of the Web.
GIS can be used as an analysis and an infrastructure tool in assessing climate change impacts and for
adaptation research; moreover it can be used to address the broader issues of spatial data management,
interoperability and geoinformatics research in climate change studies. In this paper, the framework of
the Web- and GIS-based Climate Change Impact and Adaptation Integrated Assessment Tool (CCIAT)
is presented. This three-tier system framework is based on the J2EE technologies and includes different
Web services that link climate model outputs to feed into impact models. A database server was set up to
support various applications and online access to decision-support tools. Overall, WEBGIS is a significant
integration technology when used for assessing climate change impacts and adaptation research.
Development of the CCIAT in the WEBGIS frameworkTo address questions on global climate change, especially those related to economic and environmental
impacts, integrated assessment models (IAMS) are quite often applied in impact assessments and adaptation
studies. IAMs seek to combine knowledge from multiple disciplines in formal integrated representations,
inform policy-making, structure knowledge and prioritize key uncertainties; they also encompass advanced
knowledge of broad system linkages and feedback, particularly between socio-economic and biophysical
processes. This calls for better integration of information developed by atmospheric and geographic
communities. GIS can play an important role in a comprehensive assessment of climate change impacts,
in addition to providing a framework for planning and policy decisions. A Web-based GIS will provide
Global Assessment: Bridging Scales and Linking to Policy
��
online access to climate scenario data and socio-economic information. It can work as an integrator to
combine data, impact models and adaptation options into a one-stop solution.
While infrastructure is desired and needed for ready access to data and the resulting maps via WEBGIS
(i.e. linking data to data), it is argued that data must also be linked to models for better exploration of new
relations between observables, refinement of numerical simulations and the quantitative evaluation of
scientific hypotheses. For widespread data access, WEBGIS is therefore only a preliminary current step
rather than a final solution. Better support for analysis, modeling and decision support within or connected
to WEBGIS should move users beyond the “data-to-data” mode towards “data-to-models” and “data-to-
interpretation”. The new development of a Web-enabled GIS server and database engine technology has
made the “data-to-interpretation” mode possible.
WEBGIS has been developed in order to utilize generic outputs from climate models (global and
regional) and apply them to assess specific responses required by different sectors to adapt to and capitalize
on the opportunities presented by climate change and increased climate variability. MapServer from the
University of Minnesota was chosen to work as the backbone for CCIAT. MapServer is an Open Source
development environment for building spatially-enabled Internet applications; it excels at rendering
spatial data (maps, images and vector data) for the Web. To better support the open source community, a
Linux/Java coding environment was established.
CCIAT currently includes a WEBGIS infrastructure with four Web services provided by a GIS tool and
associated databases.
From scenarios to adaptation — a GIS data translator
Currently, climate change scenario data reside in the atmospheric science domain (binary or spreadsheet
formats). There is a need for better integration of datasets to address climate change issues, particularly
for adaptation, mitigation and sustainable development at the practitioner level. A set of GIS tools has
been proposed and is under development to help convert atmospheric data into a plain usable format.
This provides a bridge between atmospheric, geographic, ecological as well as other more spatially-based
sciences and natural resource management and planning communities. It provides another modeling
variable for examining future climate conditions when coupled with traditional environmental, socio-
economic and demographic GIS data. Model simulations will be available to anyone interested in viewing
and analysing them in a more interdisciplinary way through GIS.
Model building through the GIS server: an impact model (CERES)
Analysis of climate impacts, adaptation and vulnerability involves a set of activities designed to identify
the effects of climate variability and change, to evaluate and communicate uncertainties and to examine
possible adaptive responses. Methods for analysis of impacts, adaptation and vulnerability have evolved
over the past decade and many methods and tools are now available for use in specific sectors, at different
scales of analysis and in contrasting environmental and socio-economic contexts. Most assessments of
the impacts of future climate change are based on the results of impact models. The Crop Environment
Resource Synthesis (CERES) crop simulation models (Ritchie et al. 1998) were applied in the C5 project and
validated in previous studies. Two crop simulation models (CERES — wheat and corn) (Erda et al. 2005)
developed by the Chinese Academy of Agricultural Science (CAAS) were both packed with Web service
and XML technology. As the three-tier architecture enables any Web client to access a fully functional
GIS server (e.g. ESRI ARCGIS) models can be further tuned via the model builder modules available
GWSP Issues in Global Water System Research
�0
in commercial GIS packages. All model parameters and inputs can be managed centrally via a database
interface.
Web-based Adaptation Decision Support System
The decision tools that are most relevant for climate-change adaptation are cost–benefit analysis, cost
effectiveness analysis, multicriteria analysis and risk–benefit analysis (UNFCCC 1997). Multicriteria
options’ evaluation (MCOE) of adaptation measures has long been adopted as the major approach to
identify desirable adaptation measures for decision-makers to alleviate the vulnerabilities associated with
climate change. In the policy evaluation process for adaptation, multistakeholder consultation (MSC) and
MCOE can provide mechanisms to relate impact information to decision-making that requires subjective
judgement and interpretation.
A Web-based Adaptation Decision Support System (WADSS) is being developed based on MSC
and MCOE. WADSS is a small tool to provide an effective means for measuring the effects of a given
adaptation option against a number of sustainability indicators. This adaptation tool will be useful for
regional planners to select effective adaptation options to reduce climate risks. In particular, WADSS
can assist users in identifying desirable adaptation options or policies that can be incorporated into a
regional management strategy while supporting regional sustainable development. Such a tool will
improve the integrated assessment capacity of regional managers or planners to identify the economic
and environmental impacts of adaptation decisions that may reduce climate vulnerability. A user friendly
interface was designed for the adaptation tool to facilitate data transfer between users, a set of models and
the GIS.
Results/discussionThis preliminary paper demonstrates how the integration of climate scenario data and impact models
with WEBGIS can provide an easy-to-use tool to assess and disseminate atmospheric sciences, models
and outputs. This work contributes to the development of spatial decision support tools that can generate
useful information for policy-makers and resource management in light of potential climate impacts.
Advanced IAM is needed to address future environmental problems and it should include integrating the
sciences, knowledge and our understanding of the future.
ReferencesAnderson and Associates. 2007. http://www.andassoc.com/services/gis/
Erda, L., Wei, X., Hui, J., Yinlong, X., Yue, L., Liping, B. & Liyong, X. 2005. Climate change impacts on crop yield and quality with CO
2 fertilization in China. Phil. Trans. R. Soc. Lond. Ser. B Biol. Sci.,
360(1463): 2149–2154.
Horanont, T., Tripathi, N.K., Raghavan, V. & Santitamnont, P. 2007. A comparative assessment of internet GIS server systems. http://www.gisdevelopment.net/technology/gis/techgi071.htm.
Ritchie, J.T., Singh, U., Godwin, D.C. & Bowen, W.T. 1998. Cereal growth, development and yield. In Understanding options for agricultural production, ed. G.Y. Tsuji, G. Hoogenboom & P. K. Thornton, pp. 79–99. Dordrecht, Kluwer Academic Publishers.
United Nations Framework Convention on Climate Change (UNFCCC). 1997. Progress report: development and transfer of technologies. Subsidiary Body for Scientific and Technological Advice. Seventh Session. Bonn, Germany, 20–29 October 1997.

Global Assessment: Bridging Scales and Linking to Policy
��
Global Change Impacts on Water and Food Security –
Economic Analyses
GWSP Issues in Global Water System Research
��
The impact of climate variability and climate change on water and food outcomes: a framework for analysis
Claudia Ringler
International Food Policy Research Institute (IFPRI), Washington DC, USA
Introduction
Over the coming decades, global change will impact on food and water security in significant,
but also highly uncertain ways. There are strong indications that developing countries will bear
the brunt of adverse consequences from global change, particularly climate change. This is
largely because poverty levels are still high in these countries and the capacity to adapt to global change
is concomitantly weakest. Further, the largest impacts from global change will be on rural areas in
developing countries where major direct and indirect sources of employment and income — agricultural
production — are particularly vulnerable to global change processes. The agriculture sector is the largest
consumer of water resources and variability in water supply is a major factor influencing welfare and
health in poor areas. With water scarcity and extreme weather events—both droughts and floods—expected
to increase under climate change, water security in rural areas and agriculture is expected to decline
significantly. Moreover, urban areas will also increasingly draw water from irrigated agriculture to meet
sharply growing demands, increasing rural scarcity.
Consequently there is a need to better understand the impacts of global change (climate, demography,
technology) on agriculture and natural resources in developing countries and to develop adaptive capacity to
respond to these impacts; moreover there is a need to develop informed and effective adaptation measures
and investment options that can be taken now to alleviate the adverse impacts of global change.
Framework for analysisWhile food and water security is significantly determined by actions taken at the local or national scale
— for example, IFPRI’s work on water and food security or Strzepek et al. (1994) and Yates and Strzepek
(1998) in Egypt — there are also important global factors that affect security at the local level, such as
world food trade, global climate and climate change as well as competition for water generated by the world
economy (Rosegrant et al. 2002). Analyses at the global level (only) have been carried out by Frohberg et al.
(1990), Fischer et al. (1988) and Rosenzweig and Parry (1994). The development of policies that enhance
food and water security at the local level and support mitigation adaptation to global change requires an
understanding of the interaction of local, basin-scale, national and global factors. Regional and national
economic, environmental and institutional policies, in turn, have upward impacts on global conditions in
addition to downward impacts on the local and basin scale.
Thus, analysis of mitigation and adaptation strategies for increased food and water security must take
into account the relevant hydrologic, agronomic, economic, social and environmental processes at the
(1) global and regional, (2) national, (3) basin and (4) local levels (Figure 1). This follows the paradigm of
“strategic cyclical scaling” of Root and Schneider (1995), which incorporates both large- and small-scale
research studies to improve the understanding of complex environmental systems and allow more reliable
projections of the ecological, economic and social consequences of global change.
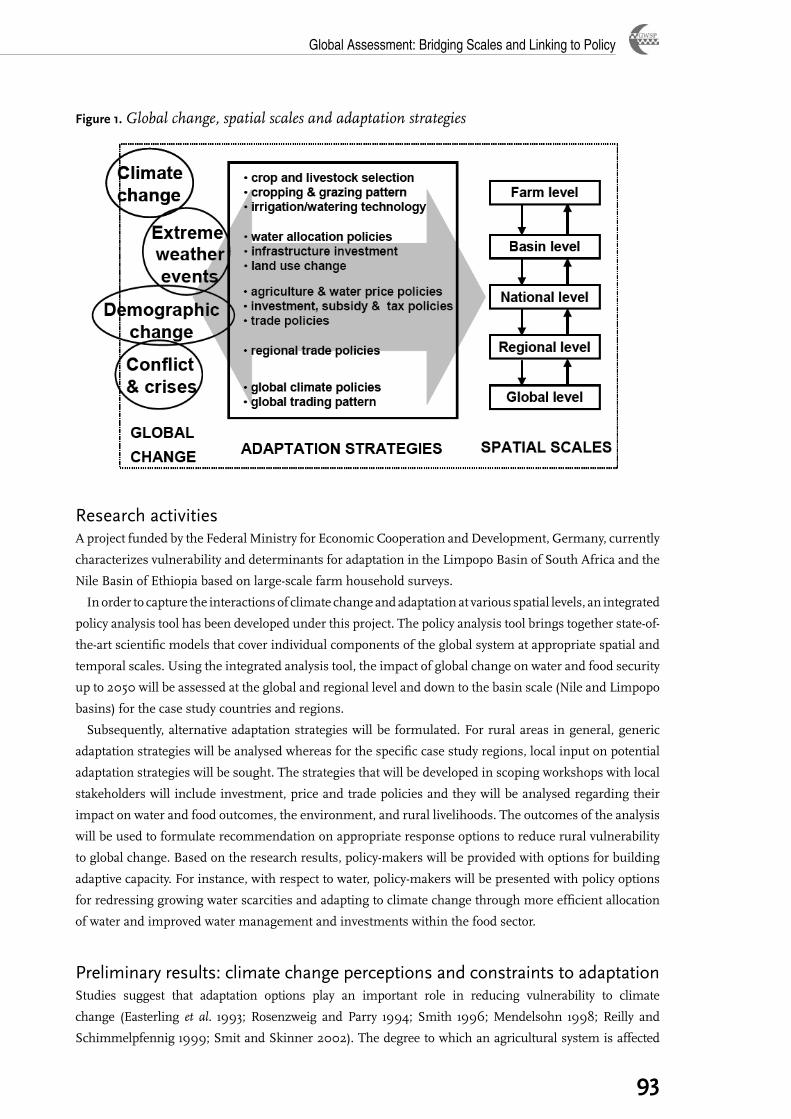
Global Assessment: Bridging Scales and Linking to Policy
��
Figure �. Global change, spatial scales and adaptation strategies
Research activities A project funded by the Federal Ministry for Economic Cooperation and Development, Germany, currently
characterizes vulnerability and determinants for adaptation in the Limpopo Basin of South Africa and the
Nile Basin of Ethiopia based on large-scale farm household surveys.
In order to capture the interactions of climate change and adaptation at various spatial levels, an integrated
policy analysis tool has been developed under this project. The policy analysis tool brings together state-of-
the-art scientific models that cover individual components of the global system at appropriate spatial and
temporal scales. Using the integrated analysis tool, the impact of global change on water and food security
up to 2050 will be assessed at the global and regional level and down to the basin scale (Nile and Limpopo
basins) for the case study countries and regions.
Subsequently, alternative adaptation strategies will be formulated. For rural areas in general, generic
adaptation strategies will be analysed whereas for the specific case study regions, local input on potential
adaptation strategies will be sought. The strategies that will be developed in scoping workshops with local
stakeholders will include investment, price and trade policies and they will be analysed regarding their
impact on water and food outcomes, the environment, and rural livelihoods. The outcomes of the analysis
will be used to formulate recommendation on appropriate response options to reduce rural vulnerability
to global change. Based on the research results, policy-makers will be provided with options for building
adaptive capacity. For instance, with respect to water, policy-makers will be presented with policy options
for redressing growing water scarcities and adapting to climate change through more efficient allocation
of water and improved water management and investments within the food sector.
Preliminary results: climate change perceptions and constraints to adaptationStudies suggest that adaptation options play an important role in reducing vulnerability to climate
change (Easterling et al. 1993; Rosenzweig and Parry 1994; Smith 1996; Mendelsohn 1998; Reilly and
Schimmelpfennig 1999; Smit and Skinner 2002). The degree to which an agricultural system is affected
GWSP Issues in Global Water System Research
��
by climate change depends on its adaptive capacity. Hence adaptive capacity is the ability of a system to
adjust to climate change (including climate variability and extremes) to minimize potential damages, to
take advantage of opportunities, or to cope with the consequences (IPCC 2001). Thus the adaptive capacity
of a system or society describes its ability to modify its characteristics or behaviour so as to cope better with
changes generated by external conditions, including climate change.
Research on climate change–agriculture interactions has evolved from a top-down to a bottom-up
approach. The top-down approach focuses on the impacts of climate change scenarios and identifies
potential adaptation practices to these scenarios. The bottom-up approach, on the other hand, focuses
on the existing socio-economic environment and assesses the vulnerability of those affected by climate
change. In this approach, adaptation strategies are processes involving several aspects including the socio-
economic and policy environments, producers’ perceptions and elements of decision-making (Bryant et al.
2000; Wall and Smit 2005; Belliveau et al. 2006).
The approach here uses the bottom-up approach to investigate adaptation to climate change at the farm
level, including farmers’ perceptions regarding long-term climate change and primary adaptation strategies
and constraints to adaptation at the farm level.
Perceptions of long-term climate changeThe Limpopo Basin in South Africa is a semi-arid region that experiences a high degree of climate
variability as well as long-term changes in climate over the past few decades. More than 91 percent of the
survey respondents perceived an increase in temperature levels. Similarly about 90 percent of the farmers
stated that precipitation has decreased in the past 20 years.
The Ethiopian survey was conducted in the Nile Basin. Here, only 53 percent of the farmers perceived
an increase in temperature over the past 20 years. In addition, 75 percent of the respondents perceived
long-term changes in rainfall — 61 percent of whom felt that the number of rainy days had declined. To
respond to these changes in climate over the last 20 years, farmers have resorted to different adaptation
strategies to mitigate some of the negative impacts of climate change.
Adaptation mechanisms at the farm level About half of the farmers who observed long-term changes in rainfall patterns did not adjust their farming
practices. Among those who did adjust, around 9 percent engaged in irrigation (both increased irrigation
and new schemes); 4 percent used different crops and 3 percent shifted their planting dates to match the
delay in rainfall.
Although most farmers perceived increases in temperature in the Limpopo Basin, only 42 percent of the
respondents made adjustments to their farming practices.
In Ethiopia, the most popular adaptation measures against decreased precipitation were soil conservation
techniques (31 percent) and changing crop varieties (11 percent) (Table 1). Responses to long-term increases in
temperature included afforestation and trees for shading as well as changes in crops and crop varieties. The
adaptation strategies that the farmers resort to are thus different for rainfall and temperature changes.
Constraints to adaptationOnly 9 percent of the farmers cited no barriers to adaptation in the Limpopo Basin. Lack of credit was the
main factor inhibiting adaptation for most climate change response options.. Other obstacles included no
Global Assessment: Bridging Scales and Linking to Policy
��
access to water, no property rights and lack of market access. The picture in Ethiopia is somewhat different,
as lack of information and knowledge was cited most often as the factor that prevented farmers from adapting
to long-term changes in temperature and rainfall. Lack of access to credit ranked second for most adaptation
options, and lack of labor or land were ranked third for most adaptation options.
Table �. Adaptation to long-term change in precipitation and temperature based on household surveys
ConclusionsThe development of adaptive capacity to reduce the adverse impacts of global change in rural areas of
developing countries requires analysis at various spatial scales. At the farm level, use of natural resources
impacts upon the global water cycle; at the same time, humans (for example, through changes in cropping
patterns), animals and plants undertake autonomous adaptations or adjustments to global change. At
the basin level, basin authorities influence both land and water allocation; they carry out conscious or
purposeful adaptations to global change, which are tactical or strategic adaptations to anticipate or respond
to climate change or other global change scenarios. At the national level, governments and authorities
impact on ecosystem system services and human well-being; they also carry out strategic adaptations,
including changes in price, trade and investment policies to anticipate or respond to global change. At
the regional level, regional trading institutions intend to mitigate global change impacts through changes
in trading regimes, regional transportation and communication policies. There are also important global
factors that affect water and food security at the local level, such as world food trade and competition for
water generated by the world economy.
Results from local-level analysis have shown that while farmers in both Ethiopia and South Africa are
acutely aware of long-term changes in temperature and precipitation and the potential adverse impacts
on food production and livelihoods, only about half have adjusted their practices to address the impacts
of climate change.
The main barriers cited by respondents in South Africa and Ethiopia are lack of credit and lack of
information respectively. Climate change adaptation strategies at the national level for agriculture and water
Adaptation to long-term changes in rainfall (%)Limpopo Nile
Nothing 49.2 42Soil conservation 31.1Change crop or variety 4.4 11.1Different planting dates 3 4.5Irrigate more 6.5Water harvesting/irrigation 2.7 5.8
Adaptation to long-term changes in temperature (%)Limpopo Nile
Nothing 57.6 56.8Change crop or variety 11.2 20Change land area 3Irrigate more 3.3Trees for shading/afforestation 13.3Change planting date 2.4Soil conservation 2.9
Source: Results from IFRPI–CEEPA and IFPRI–EDRI household surveys.
GWSP Issues in Global Water System Research
��
may therefore include several components such as enhancing water storage, providing irrigation facilities
and using improved crop varieties. However, effective policy must also address market imperfections such
as access to information, credit and markets in order to reach small-scale subsistence farmers.
ReferencesBelliveau, S., Bradshaw, B., Smit, B., Reid, S., Ramsey, D., Tarleton, M. & Sawyer, B. 2006. Farm-level
adaptation to multiple risks: climate change and other concerns. Occasional Paper No. 27. University of Guelph, Canada.
Bryant, R.C., Smit, B., Brklacich, M., Johnston, R.T., Smithers, J., Chiotti, Q. & Singh, B. 2000. Adaptation in Canadian agriculture to climatic variability and change. Climatic Change 45: 181–201.
Easterling, W.E., Crosson, P.R., Rosenberg, N.J. McKenney, M.S., Katz, L.A. & Lemon, K.M. 1993. Agricultural impacts of and responses to climate change in the Missouri-Iowa-Nebraska Region. Climatic Change, 24(1-2): 23–62.
Fischer,G., Frohberg, K., Keyzer, M.A., & Parikh., K.S. 1988. Linked national models — a tool for international food policy analysis. Kluwer Academic Publishers.
Frohberg, K., Fischer, G. & Parikh, K.S.1990. Would developing countries benefit from agricultural trade liberalization in OECD countries? Working Paper, Indira Gandhi Institute of Development Research, Mumbai, India.
IPCC (Intergovernmental Panel on Climate Change). 2001. Third assessment report: climate change 2001. Geneva, Switzerland, IPCC; Cambridge, UK, Cambridge University Press.
Mendelsohn, R. 1998. Climate-change damages. In Economics and policy issues in climate change, ed W.D. Nordhaus. Washington, DC, Resources for the Future.
Reilly, J. & Schimmelpfennig, D. 1999. Agricultural Impact Assessment, vulnerability and the scope for adaptation. Climatic Change, 43: 745–788.
Root, T.L. & Schneider, S.H. 1995. Ecology and climate: Research strategies and implications. Science, 269(5222): 334–341.
Rosegrant, M.W., Cai, X. & Cline, S. 2002. World water and food to 2025: dealing with scarcity. Washington, DC, IFPRI.
Rosenzweig, C. & Parry, M.L. 1994. Potential impact of climate change on world food supply. Nature, 367: 133–138.
Smit, B. & Skinner, M.W. 2002. Adaptations options in agriculture to climate change: A typology. Mitigation and Adaptation Strategies for Global Change, 7: 85–114.
Smith, J.B. 1996. Using a decision matrix to assess climate change adaptation. In Adapting to climate change: An international perspective, ed J.B. Smith, N. Bhatti, G. Menzhulin, R. Benioff, M.I. Budyko, M. Campos, B. Jallow & F. Rijsberman. New York, Springer.
Strzepek, K.M., Onyeji, S.C., Saleh, M. & Yates, D. 1994. An assessment of integrated climate change impact on Egypt. IIASA Working Paper WP-94-048. Laxenburg, IIASA.
Wall, E. & Smit, B. 2005. Climate change adaptation in light of sustainable agriculture. Journal of Sustainable Agriculture, 27(1): 113–123.
Yates, D.N. & Strzepek, K. 1998. An assessment of integrated climate change impacts on the agricultural economy of Egypt. Climatic Change, 38(3): 261–287.
Global Assessment: Bridging Scales and Linking to Policy
��
An integrated modeling approach for water and food projections under climate change: analytical framework and results for the Limpopo Basin and beyond
Tingju Zhua and Ximing Caib
aInternational Food Policy Research Institute, Washington, DC, USAbDepartment of Civil and Environmental Engineering, University of Illinois, USA
Increasing evidence indicates that global climate change is already underway and its impacts are likely
to be more serious in the future, even under the most optimistic mitigation scenarios. The impact of
climate change on water and food systems is projected to be significant, with important implications
for future water and food security (IPCC 2007). In particular, Africa will be the region where the climate
change burden is likely to be the heaviest. As part of a comprehensive evaluation of climate change impact
on water and food security for Africa, this analysis shows the impact of climate change on water resources
in the Limpopo River Basin that encompasses four countries — Botswana, Mozambique, South Africa and
Zimbabwe. A newly developed entropy-based downscaling model (Laurent and Cai 2007) generated regional
climate change scenarios that combined ensemble AOGCM projections for 2050 and regional historical
climate variability. The downscaled climate scenarios were then analysed with a macroscale hydrology model
to simulate effective precipitation for crop growth, evapotranspiration and runoff for 2050 under climate
change impact. For the four countries within the Limpopo Basin, by 2050 precipitation will decrease by
ten percent to 30 percent, evapotranspiration will decrease by ten percent to 25 percent and runoff will
decrease by 35 percent to 65 percent. Analysis was also conducted for each of the four countries. Zimbabwe
is predicted to experience the severest runoff reduction, while precipitation decline will be highest in
Mozambique. Botswana will have a modest change in rainfall and runoff. Besides water resource impact
assessment, a generic integrated water and food modeling framework is also discussed for climate change
impact assessment and adaptation analysis, which is potentially applicable to the water and food security
analysis in Africa.
ReferencesInternational Panel on Climate Change (IPCC). 2007. Climate change 2007: climate change impacts, adaptation
and vulnerability — summary for policy makers. Available at: http://www.ipcc.ch/SPM6avr07.pdf
Laurent, R. & Cai, X. 2007. Uncertainty quantification for global climate models using the maximum entropy method. Climatic Change, 82: 411–435.
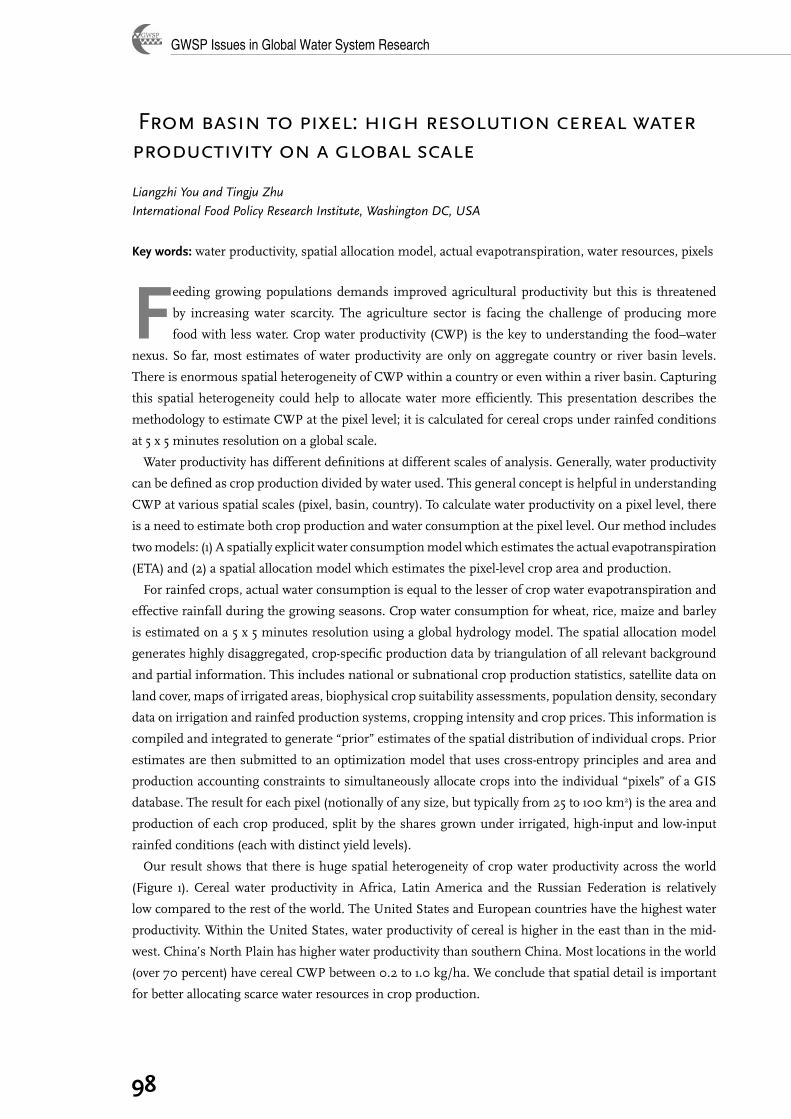
GWSP Issues in Global Water System Research
��
From basin to pixel: high resolution cereal water productivity on a global scale
Liangzhi You and Tingju Zhu
International Food Policy Research Institute, Washington DC, USA
Key words: water productivity, spatial allocation model, actual evapotranspiration, water resources, pixels
Feeding growing populations demands improved agricultural productivity but this is threatened
by increasing water scarcity. The agriculture sector is facing the challenge of producing more
food with less water. Crop water productivity (CWP) is the key to understanding the food–water
nexus. So far, most estimates of water productivity are only on aggregate country or river basin levels.
There is enormous spatial heterogeneity of CWP within a country or even within a river basin. Capturing
this spatial heterogeneity could help to allocate water more efficiently. This presentation describes the
methodology to estimate CWP at the pixel level; it is calculated for cereal crops under rainfed conditions
at 5 x 5 minutes resolution on a global scale.
Water productivity has different definitions at different scales of analysis. Generally, water productivity
can be defined as crop production divided by water used. This general concept is helpful in understanding
CWP at various spatial scales (pixel, basin, country). To calculate water productivity on a pixel level, there
is a need to estimate both crop production and water consumption at the pixel level. Our method includes
two models: (1) A spatially explicit water consumption model which estimates the actual evapotranspiration
(ETA) and (2) a spatial allocation model which estimates the pixel-level crop area and production.
For rainfed crops, actual water consumption is equal to the lesser of crop water evapotranspiration and
effective rainfall during the growing seasons. Crop water consumption for wheat, rice, maize and barley
is estimated on a 5 x 5 minutes resolution using a global hydrology model. The spatial allocation model
generates highly disaggregated, crop-specific production data by triangulation of all relevant background
and partial information. This includes national or subnational crop production statistics, satellite data on
land cover, maps of irrigated areas, biophysical crop suitability assessments, population density, secondary
data on irrigation and rainfed production systems, cropping intensity and crop prices. This information is
compiled and integrated to generate “prior” estimates of the spatial distribution of individual crops. Prior
estimates are then submitted to an optimization model that uses cross-entropy principles and area and
production accounting constraints to simultaneously allocate crops into the individual “pixels” of a GIS
database. The result for each pixel (notionally of any size, but typically from 25 to 100 km2) is the area and
production of each crop produced, split by the shares grown under irrigated, high-input and low-input
rainfed conditions (each with distinct yield levels).
Our result shows that there is huge spatial heterogeneity of crop water productivity across the world
(Figure 1). Cereal water productivity in Africa, Latin America and the Russian Federation is relatively
low compared to the rest of the world. The United States and European countries have the highest water
productivity. Within the United States, water productivity of cereal is higher in the east than in the mid-
west. China’s North Plain has higher water productivity than southern China. Most locations in the world
(over 70 percent) have cereal CWP between 0.2 to 1.0 kg/ha. We conclude that spatial detail is important
for better allocating scarce water resources in crop production.
Global Assessment: Bridging Scales and Linking to Policy
��
Figure � Global map of crop water productivity of rainfed cereal (2000)
and area and production accounting constraints to simultaneously allocate crops into the individual “pixels” of a GIS database. The result for each pixel (notionally of any size, but typically from 25 to 100 km2) is the area and production of each crop produced, split by the shares grown under irrigated, high-input and low-input rainfed conditions (each with distinct yield levels).
Our result shows that there is huge spatial heterogeneity of crop water productivity across the world (Figure 1). Cereal water productivity in Africa, Latin America and the Russian Federation is relatively low compared to the rest of the world. The United States and European countries have the highest water productivity. Within the United States, water productivity of cereal is higher in the east than in the mid-west. China’s North Plain has higher water productivity than southern China. Most locations in the world (over 70 percent) have cereal CWP between 0.2 to 1.0 kg/ha. We conclude that spatial detail is important for better allocating scarce water resources in crop production.
Figure 1 Global map of crop water productivity of rainfed cereal (2000)
GWSP Issues in Global Water System Research
�00
Assessing the incremental benefits and costs of coping with development pressure and climate change: a South African case study
John M.Callawaya and Molly E. Hellmuthb
aRisø National Laboratory, Technical University of Denmark, Roskilde, DenmarkbThe International Research Institute for Climate and Society, Columbia University, New York, USA
There are two key elements to adaptation to climate change and climate variability that must be
captured in the framework used to decide between alternative strategies for adaptation. The first
is that information about climate change contains variation due to both known and unknown
sources that, in turn, gives rise to risk (that can be characterized in quantitative terms) and uncertainty
(that cannot be characterized in quantitative terms). The more uncertain climate change is, the harder it
is to plan for. This uncertainty gives rise to a second important element of adaptation to climate change,
namely: The “regrets” that are experienced when planning for climate change in the present (ex ante)
based on one set of climate expectations that later on (ex post) turns out to be “wrong”. In this case, the
planned adaptation decision is also “wrong” because it is not optimal for the climate that actually occurs,
ex post. These regrets can be translated into economic opportunity costs, based on the losses that society
incurs by not making the best ex ante choice. In situations where the range of possible climate changes
that could occur becomes very broad (or very uncertain), then the decision-making framework needs to be
changed so that the robustness of adaptation decisions over a wide range of climates is more important
(i.e. has lower economic regrets) than making a decision that is optimal for one or a small number of
climate states.
This decision-making framework is being applied in the Western Cape of South Africa, where a large
dam is being built in the Berg River to reduce the competition for water between urban and agricultural
users. Water resource planning in the region in general does not take into account climate change due
to uncertainties in current climate projections. The Berg River Dynamic Spatial Equilibrium Model
(BRDSEM), a dynamic, multiregional, non-linear programming model, was applied to estimate the
incremental benefits and costs of coping with development pressure and climate change with and without
long-term adaptation measures. Two adaptation measures were considered: Building the Berg River Dam
(“storage first”) and replacing the existing regulatory framework for allocating water in the basin with
a system of efficient water markets (“markets first”). The results indicated that Cape Town is currently
poorly adapted to the current level of development, while both the markets first and storage first policies
are true “no regrets” options, resulting in net benefits. However, the markets first strategy results in
society experiencing 1.84 billion rand lower regrets cost compared to the storage first strategy. There are
four main conclusions: (1) Adjusting to development, first, can reduce climate change damages, even if
no action is taken to adjust to climate change specifically; (2) that this climate benefit can be even greater
than the subsequent net benefits of specifically adjusting to climate change by increasing storage capacity;
(3) the regrets costs of the markets first strategy point towards planning for climate change (even though it
might not happen); (4) however, the regrets cost for the storage first strategy pointed to low costs for both
action and inaction to cope with climate change.
Global Assessment: Bridging Scales and Linking to Policy
�0�
Representation of the Human Dimension in Global Water Assessments – Current State and Major Challenges for
Methodological Innovations
GWSP Issues in Global Water System Research
�0�
Representation of the human dimension in global water assessments: current state and major challenges for methodological innovations
Claudia Pahl-Wostl
Institute of Environmental Systems Research, University of Osnabrück, Germany
Global water assessments are traditionally in the domain of the physical sciences. However, there
is an increasing need for an integration of human dimensions into such assessments. What
does this imply? The questions posed most often are: What are the globally relevant changes
to water systems caused by human activities and, vice versa, what are the globally relevant impacts of
changing water systems on human well-being?
These questions address two major aspects of the human dimension namely: human activities as major
driving forces of environmental change and human activities as affected by environmental change and
dependent on the services provided by natural resources. There are further aspects that are often neglected
but understanding them is crucial: human perceptions and valuations of the encompassing world and
human decision-making.
We hold subjective perceptions of the physical and social environment we live in. Subjective perceptions
affect how and what kind of meaning is attributed to new information, e.g. about a change in the state of
the environment. This implies that more than one legitimate and plausible interpretation of a problem
situation may exist, in particular when the knowledge base is incomplete and uncertain. Actors differ as
well in their preferences and values. While some place high importance on the state of the environment,
others give most weight to economic considerations. Any attempt to reduce such differences to monetary
cost–benefit analyses is doomed to failure because it does not do justice to the complexity of the social
learning processes that need to be taken into consideration.
Understanding decision-making is of key importance with the advent of more complex understanding
of global and multilevel governance frameworks. Decisions are affected by uncertainty in knowledge.
Whereas water management has a strong tradition in dealing with quantifiable environmental uncertainties
(e.g. variability in water flow) it has little experience in taking into account non-linear processes (e.g.
breakdown of ecosystem function upon crossing thresholds) and uncertainties in human behaviour (e.g.
unexpected change in behaviour upon the introduction of new regulations leading to opposite effects). It
has often been overlooked that processes during the phase preceding a final decision situation determine
the framing of the decision context and the options that are taken into consideration in any decision on
water resource management issues. This implies that water assessments should in particular support the
process of policy development and implementation.
The Global Water System Project aims at making major contributions to global water assessments
by developing a sound interdisciplinary science base to better understand the global water system and
inform policy about present and emerging challenges. How can this ambitious goal be achieved? It will
be important but mostly insufficient to develop a new generation of global water models where processes
linked to human activities are better represented. From a scientific perspective it would do no justice to the
complexity and richness of social processes to reduce them to model parameters only. All aspects of the
human dimension would not be captured. From the policy perspective one can question if such models
will have a real policy impact. What is needed is to embed the development of models and the integrated
Global Assessment: Bridging Scales and Linking to Policy
�0�
knowledge base directly into policy processes. This builds the necessary communication interface and
space for mutual learning between science and policy and offers at the same time the possibility to learn
more about the dynamics of policy processes, about the social construction of an issue in the policy domain
and the role of scientific information in such processes.
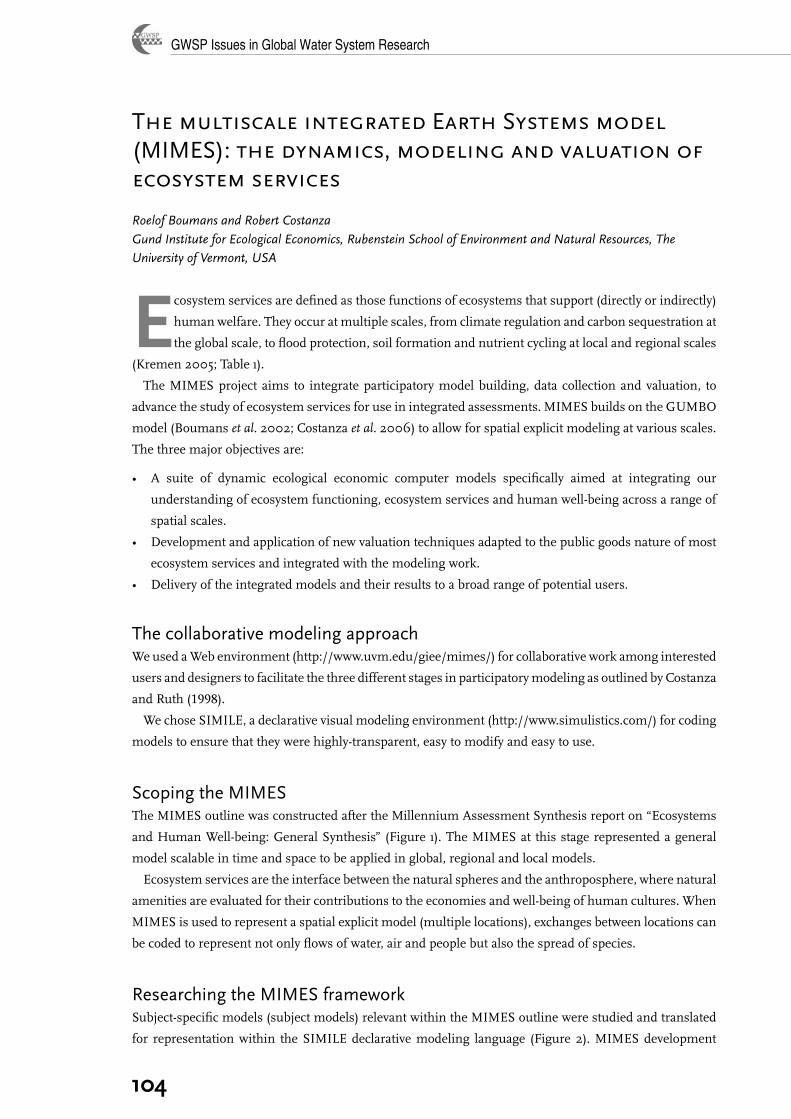
GWSP Issues in Global Water System Research
�0�
The multiscale integrated Earth Systems model (MIMES): the dynamics, modeling and valuation of ecosystem services
Roelof Boumans and Robert Costanza
Gund Institute for Ecological Economics, Rubenstein School of Environment and Natural Resources, The University of Vermont, USA
Ecosystem services are defined as those functions of ecosystems that support (directly or indirectly)
human welfare. They occur at multiple scales, from climate regulation and carbon sequestration at
the global scale, to flood protection, soil formation and nutrient cycling at local and regional scales
(Kremen 2005; Table 1).
The MIMES project aims to integrate participatory model building, data collection and valuation, to
advance the study of ecosystem services for use in integrated assessments. MIMES builds on the GUMBO
model (Boumans et al. 2002; Costanza et al. 2006) to allow for spatial explicit modeling at various scales.
The three major objectives are:
A suite of dynamic ecological economic computer models specifically aimed at integrating our
understanding of ecosystem functioning, ecosystem services and human well-being across a range of
spatial scales.
Development and application of new valuation techniques adapted to the public goods nature of most
ecosystem services and integrated with the modeling work.
Delivery of the integrated models and their results to a broad range of potential users.
The collaborative modeling approachWe used a Web environment (http://www.uvm.edu/giee/mimes/) for collaborative work among interested
users and designers to facilitate the three different stages in participatory modeling as outlined by Costanza
and Ruth (�998).
We chose SIMILE, a declarative visual modeling environment (http://www.simulistics.com/) for coding
models to ensure that they were highly-transparent, easy to modify and easy to use.
Scoping the MIMESThe MIMES outline was constructed after the Millennium Assessment Synthesis report on “Ecosystems
and Human Well-being: General Synthesis” (Figure 1). The MIMES at this stage represented a general
model scalable in time and space to be applied in global, regional and local models.
Ecosystem services are the interface between the natural spheres and the anthroposphere, where natural
amenities are evaluated for their contributions to the economies and well-being of human cultures. When
MIMES is used to represent a spatial explicit model (multiple locations), exchanges between locations can
be coded to represent not only flows of water, air and people but also the spread of species.
Researching the MIMES frameworkSubject-specific models (subject models) relevant within the MIMES outline were studied and translated
for representation within the SIMILE declarative modeling language (Figure 2). MIMES development
•
•
•

Global Assessment: Bridging Scales and Linking to Policy
�0�
requires an “interaction matrix” to link outputs and inputs among the subject models. This matrix is a
dynamic feature within MIMES development for developers of subject models to interact with modelers
of other parts in the model (asking for model input and providing model output when asked).
Table �. Ecosystem services classified according to spatial characteristics
Omni-directional, Global (does not depend on proximity)Carbon sequestration
Carbon storage Existence of “nature”
Omni-directional, Local (depends on proximity)Storm protectionWaste treatment Pollination
Directional flow related: flow from point of production to point of useWater supplyWater regulation/flood protectionNutrient regulation
In situ: point of useSediment regulationRangeland for livestockNitrogen mineralization for agricultural. productionSoil formation
Raw materialsNon-timber forest products
User movement flow related: attraction of people to unique natural featuresAesthetic/recreation potential
Figure �. General outline of the MIMES model: The multiscale integrated Earth Systems model
MIMES applications and scenariosMIMES will be further developed to be applied to case studies (Table 2). Projects are underway to create
global implementation (Figure 3), to simulate land-use changes within watersheds in the Amazon, the
Soil formation Raw materials Non-timber forest productsUser movement flow related: attraction of people to unique natural features Aesthetic/recreation potential
The collaborative modeling approach
We used a Web environment (http://www.uvm.edu/giee/mimes/) for collaborative work among interested users and designers to facilitate the three different stages in participatory modeling as outlined by Costanza and Ruth (1998). We chose SIMILE, a declarative visual modeling environment (http://www.simulistics.com/) for coding models to ensure that they were highly-transparent, easy to modify and easy to use.
Scoping the MIMES
The MIMES outline was constructed after the Millennium Assessment Synthesis report on “Ecosystems and Human Well-being: General Synthesis” (Figure 1). The MIMES at this stage represented a general model scalable in time and space to be applied in global, regional and local models.
Figure 1. General outline of the MIMES model: The multiscale integrated Earth Systems model
Ecosystem services are the interface between the natural spheres and the anthroposphere, where natural amenities are evaluated for their contributions to the economies and well-being of human cultures. When MIMES is used to represent a spatial explicit model
Locations Biosphere
Earth Surfaces
Nutrient Cycling
Hydrosphere Lithosphere Atmosphere
Anthroposphere
Cultures
Bio- diversity
Ecosystem Services
Waterby
Reservoir
Geological Carbon
Ores
Earth Energy
Gases
ExchangesBetween Locations
Social Capital
Human Capital
Economy
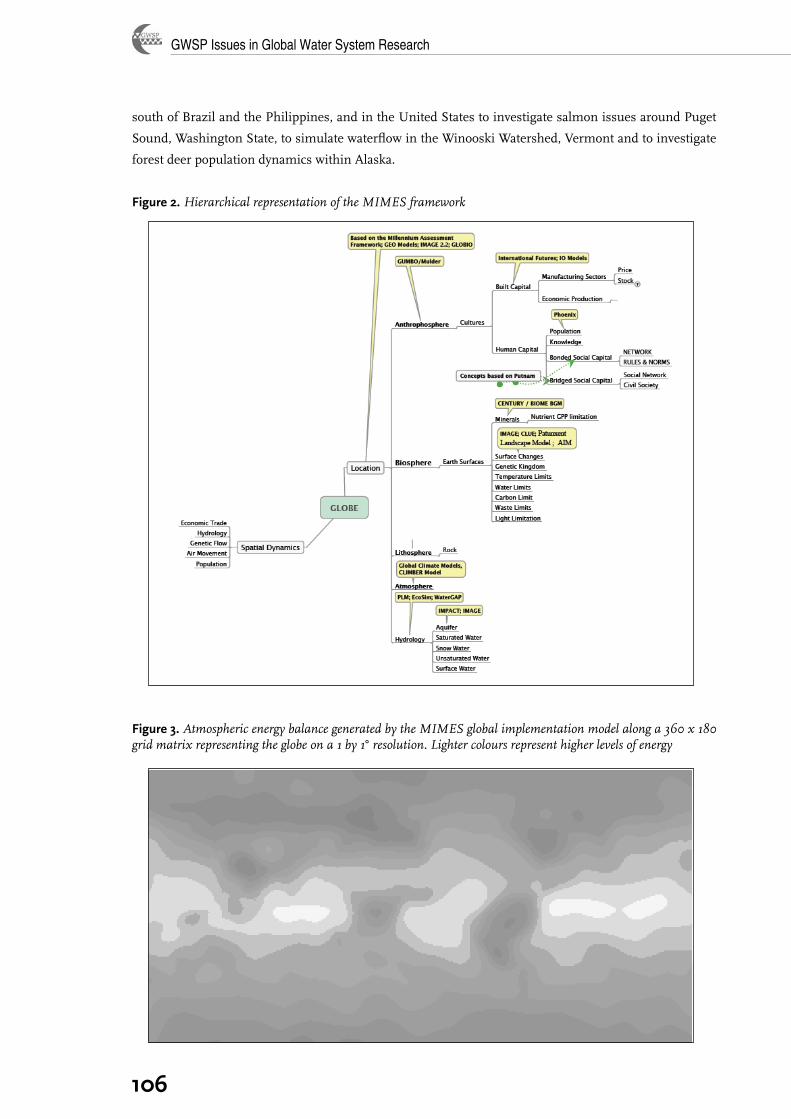
GWSP Issues in Global Water System Research
�0�
south of Brazil and the Philippines, and in the United States to investigate salmon issues around Puget
Sound, Washington State, to simulate waterflow in the Winooski Watershed, Vermont and to investigate
forest deer population dynamics within Alaska.
Figure �. Hierarchical representation of the MIMES framework
Figure �. Atmospheric energy balance generated by the MIMES global implementation model along a 360 x 180 grid matrix representing the globe on a 1 by 1° resolution. Lighter colours represent higher levels of energy
(multiple locations), exchanges between locations can be coded to represent not only flows of water, air and people but also the spread of species.
Researching the MIMES framework Subject-specific models (subject models) relevant within the MIMES outline were studied and translated for representation within the SIMILE declarative modeling language (Figure 2). MIMES development requires an “interaction matrix” to link outputs and inputs among the subject models. This matrix is a dynamic feature within MIMES development for developers of subject models to interact with modelers of other parts in the model (asking for model input and providing model output when asked).
Figure 2. Hierarchical representation of the MIMES framework
MIMES applications and scenarios
MIMES will be further developed to be applied to case studies (Table 2). Projects are underway to create global implementation (Figure 3), to simulate land-use changes within watersheds in the Amazon, the south of Brazil and the Philippines, and in the United States to investigate salmon issues around Puget Sound, Washington State, to simulate waterflow in the Winooski Watershed, Vermont and to investigate forest deer population dynamics within Alaska. Table 2. Institutions involved in the development of MIMES
Universities
Brazil University of Sao Paulo, UNICAMP Germany Helmholtz CER Netherlands Wageningen University Philippines Palawan State University United States Boston University, Florida Institute of Technology,
Kansas University, Michigan State University, Stanford University, University of Denver,
University of Vermont Governmental organizations:
Brazil Embrapa United
States National Center for Atmospheric Research, USDA
Forest Service NGOs
Conservation International Conservation Strategy Fund ,Brazil Earth Economics International Institute for Sustainable Development
Software developers Simulistics STELLA Software Systems
Figure 3. Atmospheric energy balance generated by the MIMES global implementation model along a 360 x 180 grid matrix representing the globe on a 1 by 1° resolution. Lighter colours represent higher levels of energy
References
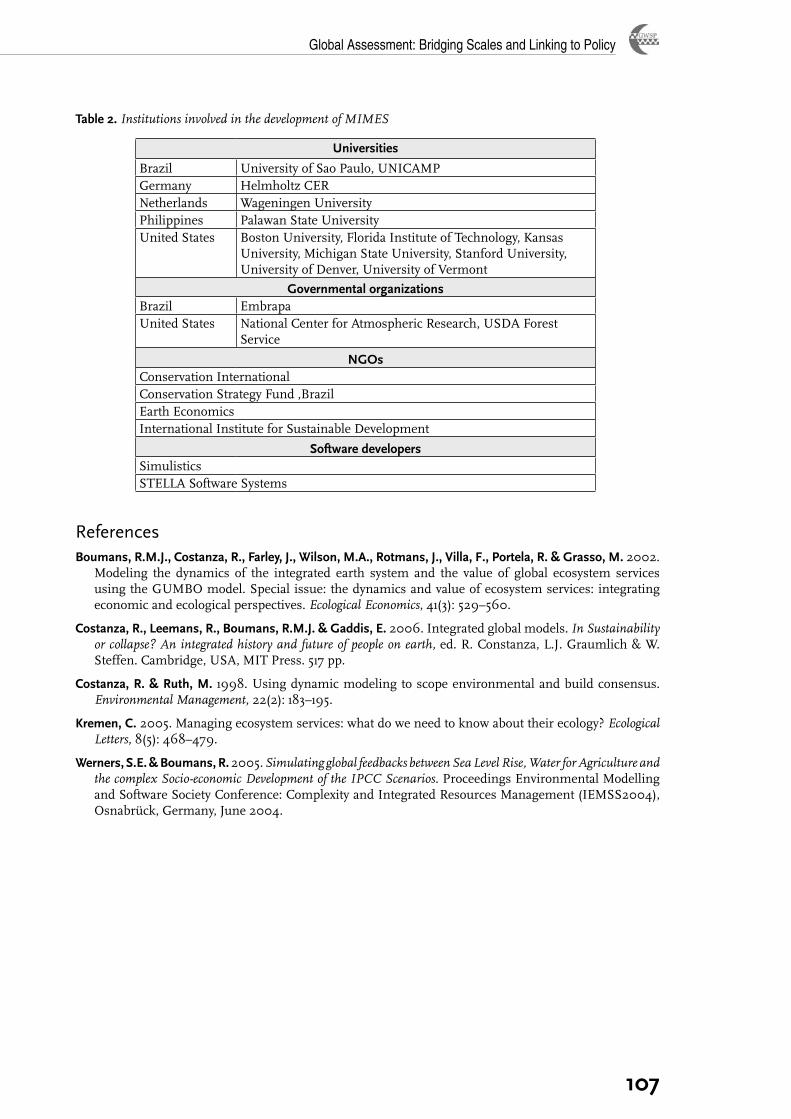
Global Assessment: Bridging Scales and Linking to Policy
�0�
Table �. Institutions involved in the development of MIMES
ReferencesBoumans, R.M.J., Costanza, R., Farley, J., Wilson, M.A., Rotmans, J., Villa, F., Portela, R. & Grasso, M. 2002.
Modeling the dynamics of the integrated earth system and the value of global ecosystem services using the GUMBO model. Special issue: the dynamics and value of ecosystem services: integrating economic and ecological perspectives. Ecological Economics, 41(3): 529–560.
Costanza, R., Leemans, R., Boumans, R.M.J. & Gaddis, E. 2006. Integrated global models. In Sustainability or collapse? An integrated history and future of people on earth, ed. R. Constanza, L.J. Graumlich & W. Steffen. Cambridge, USA, MIT Press. 517 pp.
Costanza, R. & Ruth, M. 1998. Using dynamic modeling to scope environmental and build consensus. Environmental Management, 22(2): 183–195.
Kremen, C. 2005. Managing ecosystem services: what do we need to know about their ecology? Ecological Letters, 8(5): 468–479.
Werners, S.E. & Boumans, R. 2005. Simulating global feedbacks between Sea Level Rise, Water for Agriculture and the complex Socio-economic Development of the IPCC Scenarios. Proceedings Environmental Modelling and Software Society Conference: Complexity and Integrated Resources Management (IEMSS2004), Osnabrück, Germany, June 2004.
Universities
Brazil University of Sao Paulo, UNICAMPGermany Helmholtz CERNetherlands Wageningen UniversityPhilippines Palawan State UniversityUnited States Boston University, Florida Institute of Technology, Kansas
University, Michigan State University, Stanford University, University of Denver, University of Vermont
Governmental organizationsBrazil EmbrapaUnited States National Center for Atmospheric Research, USDA Forest
Service
NGOsConservation InternationalConservation Strategy Fund ,BrazilEarth EconomicsInternational Institute for Sustainable Development
Software developersSimulisticsSTELLA Software Systems
GWSP Issues in Global Water System Research
�0�
Putting uncertainty into context: implications of model purpose in dealing with uncertainty
Marcela Brugnach and Claudia Pahl-Wostl
Institute for Environmental Systems Research, University of Osnabrück, Germany
Introduction
Despite the long history of development and use of models in policy-making, there is still poor
integration between modeling and the decision process (Brugnach et al. 2007; Saunders-Newton
and Scott 2001; Parson 1997). Generally speaking, policy-makers do not understand models and
modellers do not understand policy processes. Commonly, models are thought of as predictive devices
that can be used as a surrogate of a real system, providing information that can help policy-makers in
taking decisions (e.g. prediction of the impact of global climate change, Cameron et al. 2000). In this view,
the efficacy of a model depends on how well it can approximate reality and how much confidence policy-
makers can have in its results. Thus, uncertainty becomes a critical constraint for decision-making and as
such it ought to be eliminated or reduced as much as possible.
However, even though predictive models can be used to convey scientific argumentation that can aid
decision-making, these models fall short in supporting a policy process (Parson 1997; Gunderson et al.
1995). Generally, policy-makers have to deal with controversial situations with conflicting interests on
the problem domain, where the different opinions and perspectives have to be integrated in a solution.
In particular, but not only in the presence of a contested knowledge base, more than one legitimate and
plausible interpretation of a situation and potential future development may exist.
It has to be questioned, what can the role of models be in such processes? We believe that models
can also be conceived of as tools that not only assist in identifying best options, but in addition focus on
negotiation, learning and communication, which constitute the basis for policy-making. Doing so not
only changes the way in which models are built and used, but also how uncertainties are considered and
the meaning they have for modeling and policy-making processes. In this context, uncertainties become
useful to identify commonalities and differences in views and highlight points of conflict, opening room
for discussion and space for negotiation among different interest parties.
In this paper we explore and discuss the relationship between models and policy-making, how models
can be used and how uncertainty should be treated depending on the purpose models are supposed to
serve. To this end, we identify four major modeling purposes that are important for understanding and
managing complex environmental systems: prediction, exploratory analysis, communication and learning.
Each of these purposes highlights different system characteristics, role of uncertainty, the properties of
the model and its validation. Here, we specifically focus on the role uncertainties play in models and
investigate the implications of the different purposes in dealing with this matter. Using these concepts,
we present a set of strategies that can guide the development and use of models in support of the policy-
making process.
The policy-making processFigure 1 illustrates the different phases of an iterative policy and managing cycle. In the first phase, problem
definition, the often ill-defined and controversial problem situation in the current management system
is identified and structured as an integrated process. The second phase, participatory policy formulation,
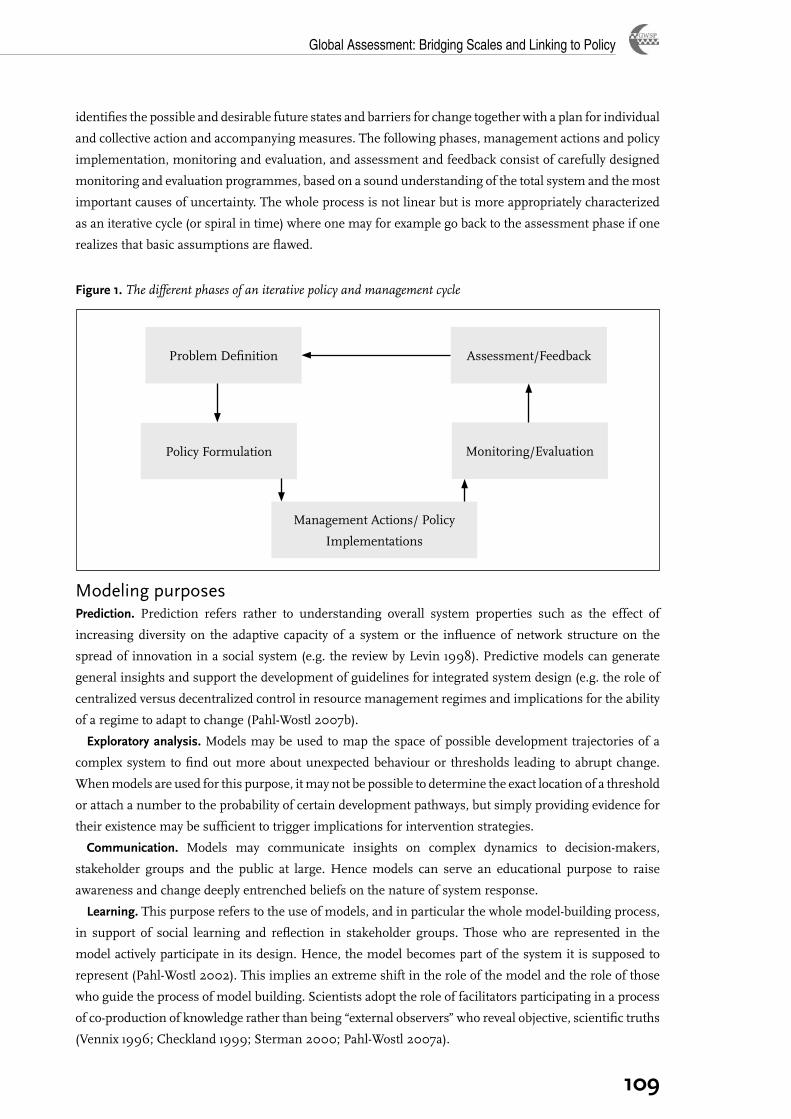
Global Assessment: Bridging Scales and Linking to Policy
�0�
identifies the possible and desirable future states and barriers for change together with a plan for individual
and collective action and accompanying measures. The following phases, management actions and policy
implementation, monitoring and evaluation, and assessment and feedback consist of carefully designed
monitoring and evaluation programmes, based on a sound understanding of the total system and the most
important causes of uncertainty. The whole process is not linear but is more appropriately characterized
as an iterative cycle (or spiral in time) where one may for example go back to the assessment phase if one
realizes that basic assumptions are flawed.
Figure �. The different phases of an iterative policy and management cycle
Modeling purposesPrediction. Prediction refers rather to understanding overall system properties such as the effect of
increasing diversity on the adaptive capacity of a system or the influence of network structure on the
spread of innovation in a social system (e.g. the review by Levin 1998). Predictive models can generate
general insights and support the development of guidelines for integrated system design (e.g. the role of
centralized versus decentralized control in resource management regimes and implications for the ability
of a regime to adapt to change (Pahl-Wostl 2007b).
Exploratory analysis. Models may be used to map the space of possible development trajectories of a
complex system to find out more about unexpected behaviour or thresholds leading to abrupt change.
When models are used for this purpose, it may not be possible to determine the exact location of a threshold
or attach a number to the probability of certain development pathways, but simply providing evidence for
their existence may be sufficient to trigger implications for intervention strategies.
Communication. Models may communicate insights on complex dynamics to decision-makers,
stakeholder groups and the public at large. Hence models can serve an educational purpose to raise
awareness and change deeply entrenched beliefs on the nature of system response.
Learning. This purpose refers to the use of models, and in particular the whole model-building process,
in support of social learning and reflection in stakeholder groups. Those who are represented in the
model actively participate in its design. Hence, the model becomes part of the system it is supposed to
represent (Pahl-Wostl 2002). This implies an extreme shift in the role of the model and the role of those
who guide the process of model building. Scientists adopt the role of facilitators participating in a process
of co-production of knowledge rather than being “external observers” who reveal objective, scientific truths
(Vennix 1996; Checkland 1999; Sterman 2000; Pahl-Wostl 2007a).
Problem Definition
Policy Formulation
Assessment/Feedback
Monitoring/Evaluation
Management Actions/ Policy
Implementations
GWSP Issues in Global Water System Research
��0
Coping with uncertainty depending on model purpose Uncertainties are an intrinsic and, for the most part, irreducible component of the modeling activity.
Here, we investigate for different modeling purposes how uncertainty should be addressed and included
in the overall process of model development and application.
Prediction. When models are used for prediction, they are expected to capture the essential characteristics
of the system to be modelled and to generate behaviour that mimics it. Thus, predictive models become
devices that can be used as a surrogate of a real system. To this end, models should closely match the system
modelled, requiring the consideration of all the uncertainties that can prevent this goal, either by reducing,
eliminating or explicitly considering their effect in the model. In models used for prediction, uncertainties
in data stemming from measurement errors and the possibility of having different model structures are
of key importance. Each activity aims at reducing and communicating the effects of uncertainty in model
predictions to derive the boundaries within which model results are valid.
Exploratory analysis. When models are used for exploratory analysis, their emphasis is not so much in
mimicking reality as on learning about general patterns of system behaviour. These models are expected
to convey alternative views of the system and to be used to explore the diversity of behaviour different
options can trigger. Thus, these models do not aim at predicting as accurately as possible a system’s future
states, but at uncovering in particular unexpected properties of the modelled system. Models used for
exploratory analysis can also be meaningful when the knowledge base is very weak. Here, uncertainties do
not necessarily need to be eliminated, but used for identifying different alternative scenarios that can be
explored. Ignorance can be a source for creative thought. Beliefs and values shape world views, which can
be the base for the development of coherent, internally consistent scenarios of the future.
Communication. Models used for communication purposes should be able to capture, in a simplified
way, the most important characteristics of the system modelled. However, communicating insight about
systems dynamics also means communicating about the uncertainties associated with these dynamics.
This implies that these models must convey and illustrate the characteristics of the real system as well as
the deficiencies in knowledge, interpretation and diversity of opinions about it. Here, uncertainties play an
important role in highlighting where the gaps in knowledge and understanding reside.
Learning. When used for participatory learning purposes, the differences between model and modeling
process dissolve. Models and modeling are used in a group of actors to bring together their different
viewpoints and opinions about a particular problem. Thus, the model becomes the vehicle to engage
individuals in a dialogue to develop a solution. During this process, uncertainties become central in
identifying the commonalities and differences in views and points of conflict. Knowledge elicitation
techniques and participatory model-building approaches can be used to make explicit mental models and
frames (Hare and Pahl-Wostl 2002; Vennix 1996).
The different purposes are not mutually exclusive when models are used in dealing with understanding
and managing environmental problems. However, it is a real challenge and the responsibility of the
modeller to make explicit and eventually combine different purposes in a scientifically credible and
transparent way.
Models and the policy and managing processModels are used in policy and management processes for different purposes embracing the whole range
from prediction, exploratory analysis and communication to learning. In the initial phase of definition
of the current problem situation, models are mainly used in the communication and learning mode. An
Global Assessment: Bridging Scales and Linking to Policy
���
appropriate method is participatory model development where simulation models are developed based on
combining scientific analyses and cognitive maps elicited from stakeholders participating in the model-
building process (Pahl-Wostl and Hare 2004). The model development process supports the framing
and reframing of the problem and thus facilitates social learning (Dewulf et al. 2005). Collective action
and resolution of conflicts require people to recognize their interdependence and their differences, and
to learn to deal with them constructively. Different stakeholder groups need to learn and increase their
awareness of their biophysical environment and of the complexity of social interactions. The learning
process can be supported by models used in the predictive mode. Models may provide evidence for cause–
effect relationships such as the role of fertilizing practices on nutrient leaching into groundwater and
uncertainties in the underlying knowledge base. Embedding such a modeling approach in a stakeholder
process is supposed to increase the likelihood that model results are accepted and that the quality of the
deliberations is improved. This implies, for example, that uncertainties are not used by different groups to
promote their individual interests and to dismiss results contradicting their point of view.
In the second phase of the policy and management cycle, during the analysis of possible and desirable
future states, models are mainly used for exploratory analysis, communication and learning (Van der
Heijden 1996; 2000; Pahl-Wostl in press). In an initial creative phase, uncertainties and ignorance
should be seen as a resource to explore a wide range of future scenarios. In a second phase the space of
scenarios should be constrained by what is deemed to be possible (Pahl-Wostl 2002). Here the predictive
capacity of models plays again a more important role. High uncertainties are in general associated with
the possibility of evaluating the characteristics of future states, and in particular, in understanding the
nature of processes of change. As a system metaphor one can state that adaptive management favours
the paradigm of complex adaptive systems, which implies that change is an evolutionary process in a
changing fitness landscape, rather than an optimization to achieve a well-defined goal. Models serve to
navigate on this fitness landscape to analyse first barriers for change and then define and guide paths and
stepwise decision-making and learning processes (Kaufmann 1995; Pahl-Wostl 1995).
Further on, during the analysis of barriers for change, models are used in both their predictive and
learning capacity. Models may help to analyse causes for lock-in situations where change is blocked
because a number of different factors stabilize the current system (Pahl-Wostl 2002). Such factors may
be mutual expectations stabilizing conflict and lack of trust in a group of stakeholders. For example, in
water management the current system of flood protection is often in competition with attempts at river
restoration. Large-scale technical infrastructure for flood protection, people’s settling habits in flood plains
while expecting full protection, rules of good practice for engineers on how to design dams, attitudes
towards risks and fragmentation of responsibilities have all co-evolved over decades. In such situations, it
is very difficult to change to the currently advocated integrated flood and landscape management approach.
The development of conceptual models in a group can support a process of learning so that various
stakeholders understand the complex relationships and the need for collective change. We consider that
models can also be very helpful in understanding the key characteristics of transformation processes in
such complex systems (Holtz et al. in press).
Analysing barriers of change is the first step to identifying a portfolio of individual and collective action
to implement change, leading to the next phases of the cycle. In this process models are used in exploratory
analysis and learning. Here, models are important tools to identify major uncertainties in the success of
implemented actions:

GWSP Issues in Global Water System Research
���
the response of ecosystems is predictable to a limited extent only;
actors may change their behaviour;
environmental and socio-economic boundary conditions may change.
Finally, results from participatory modeling exercises can guide the design of evaluation and monitoring
programmes. Models can also support the development of performance indicators to monitor progress.
ConclusionsIn this paper we have argued that uncertainties can only be understood in the context of the modeling
exercise in which they are immersed. Different modeling purposes highlight different uncertainty sources
and ways in which these uncertainties become manifested in the data, structure and framing of the
model. When models are used for prediction purposes, uncertainties ought to be explicitly recognized
and their effect evaluated. Sometimes models cannot be used for prediction, but as devices to highlight,
communicate and resolve what is known and unknown about the reality modelled.
These characteristics have changed the way in which we understand modeling, switching its goals
from creating a valid representation of a single, unique and objective reality to being a means to build
consensus about a socially constructed reality. This new view facilitated the emergence of participatory
modeling approaches, the focus of which is not so much on prediction, but on using the model as a device
to gain social consensus about a real problem that needs solution. The model, or rather, the whole model-
building process, becomes part of, or even structures, social learning. The example showed the different
uses models can have for policy and management processes. It highlights the importance of models in
support of the learning process that allows collectively dealing with problems in a constructive manner
and better integration of the modeling and policy-making activities.
ReferencesBrugnach, M., Tagg, A., Keil, F. & de Lange, W.J. 2007. Uncertainty matters: computer models at the
science-policy interface. Special issue: Methods for Participatory Water Resources Management. Water Resource Management, 21(7): 1075–1090.
Cameron, D., Beven, K.J. & Naden, P. 2000. Flood frequency estimation by continuous simulation under climate change (with uncertainty). Hydrol. Earth Syst. Sci., 4: 393–405.
Checkland, P. 1999. Soft systems methodology: a 30-year retrospective. Chichester, Wiley.
Dewulf, A., Craps, M., Bouwen, R., Taillieu, T. & Pahl-Wostl, C. 2005. Integrated management of natural resources: dealing with ambiguous issues, multiple actors and diverging frames. Water, Science and Technology, 52: 115–124.
Gunderson, L.H., Holling, C.S. & Light, S.S. 1995. Barriers and bridges to the renewal of regional ecosystems. New York, Columbia University Press. 593 pp.
Hare, M.P. & Pahl-Wostl, C. 2002. Stakeholder categorisation in participatory integrated assessment processes. Integrated Assessment, 3(1): 50–62.
Holtz, G., Brugnach, M. & Pahl-Wostl, C. In press. Specifying “regime” — a framework for defining and describing regimes in transition research. Technological Forecasting & Social Change.
Kauffman, S. 1995. At home in the universe. The search of laws of self-organization and complexity. New York, Oxford University Press.
Levin, S. 1998. Ecosystems and the biosphere as complex adaptive systems. Ecosystems, 1: 431–436.
Pahl-Wostl, C. �995. The dynamic nature of ecosystems: Chaos and order entwined. Chichester, Wiley. 288 pp.
•
•
•
Global Assessment: Bridging Scales and Linking to Policy
���
Pahl-Wostl, C. 2002. Towards sustainability in the water sector: The importance of human actors and processes of social learning. Aquatic Sciences, 64: 394–411.
Pahl-Wostl, C. 2007a. The implications of complexity for integrated resources management. Environmental Modelling and Software, 22: 561–569.
Pahl-Wostl, C. 2007b. Transition towards adaptive management of water facing climate and global change. Water Resources Management, 21(1): 49–62.
Pahl-Wostl, C. In press. Participation in environmental scenarios. In J. Alcamo, ed. Scenarios of the future – the future of scenarios. Springer Verlag.
Pahl-Wostl, C. & Hare, M. 2004. Processes of social learning in integrated resources management. Journal of Applied and Community Psychology, 14: 193–206.
Parson, E.A. 1997. Informing global environmental policy-making: A plea for new methods of assessments and synthesis. Environmental Modeling and Assessment, 2(4): 267–279.
Saunders-Newton, D. & Scott, H. 2001. “But the computer said”. Credible uses of computational models in public decision making. Social Science Computer Review, 19(1): 47–65.
Sterman, J.D. 2000. Business dynamics: systems thinking and modeling for a complex world. Boston, London, McGraw-Hill/Irwin.
Van der Heijden, K. 1996. Scenarios, the art of strategic conversation. Chichester, Wiley.
Van der Heijden, K. 2000. Scenarios and forecasting: two perspectives. Technological Forecasting and Social Change, 65: 31–36.
Vennix, J.A.M. 1996. Group model building: Facilitating team learning using system dynamics. Chichester, Wiley.

GWSP Issues in Global Water System Research
���
Global Assessment: Bridging Scales and Linking to Policy
���
Conclusions and Outlook
GWSP Issues in Global Water System Research
���
Conclusions and Outlook
Jan Bakkesa, Claudia Pahl-Wostlb, Daniel Petryc, Caroline van Bersb,d
a Environmental Assessment Agency MNP, Bilthoven, the Netherlands, b Institute for Environmental Systems Research, University of Osnabrück, Germany, c Global Water System Project, International Project Office, Bonn, Germany, d Water Engineering and Management Department, University of Twente, Enschede, the Netherlands
The publication of this report coincides with the launch of the 4th Global Environment Outlook on
the 25th October 2007. After the IPCC 4th Assessment report, this is already the second major global
environmental assessment published in 2007 and others like the OECD Environment Outlook
and IAASTD - International Assessment of Agricultural Science and Technology for Development - will
soon follow. These assessments draw a lot of attention to global environmental change issues and further
stimulate the world-wide discourse on adaptation to and mitigation of global change and its impacts on
the environment, development and human well-being.
It was the aim of this workshop on Global Assessments to use and strengthen the momentum created by
these assessments by initiating a discussion on methodological challenges and science-policy interaction
for the next generation of global assessments, something that needs to be addressed over the next couple
of years.
From the presentations and ensuing discussions that took place at the workshop, we have drawn some
of the following conclusions for follow-up activities in various fields:
Continuity
At the interface between science and policy, worldwide assessment processes with a lot of regional
involvement and regional detail have done relatively well during the past decade. We should keep these
networks alive and improve them because they are extremely useful in creating trust between science
and policy as well as in strengthening connections between global and regional issues.
Of the five assessments presented at the workshop, one uses full-blown contrasting scenarios (GEO-4),
one uses more simple scenarios mostly in the sense of alternative directions of strategic policy response
(CA), two use a baseline scenario (OECD and AgAssessment – the latter after an abrupt midcourse
change away from contrasting scenarios) and the IPCC-AR4 does not develop its own scenarios but
assesses existing material. This diversity of approaches is a new phenomenon which evolved over the
past decade. There is a movement away from forward-looking environmental studies based on sets of
rich, contrasting scenarios. These have been very useful in identifying and contextualizing the issues,
but there is now a shift towards simpler scenario set-ups focusing on the question of policy responses
to the issues by what combinations of actors.
Improvement of methods
There is a need for better information on economic risks of environmental degradation right up front
in our outlooks. In particular, there is a need for studies using baseline and policy variants that may see
a new future after a decade of sets of contrasting scenarios. Users are requesting that baselines duly
reflect the economic consequences of the problems identified. If not, the projections will always show
environmental policies as a burden. In order to address this, evaluation of risks, non-gradual changes
and coping capacity are areas that must be examined more carefully. One contribution may emerge
from formal, protocol-based risk assessment.
•
•
•
Global Assessment: Bridging Scales and Linking to Policy
���
Remarkably, investments are poorly covered in most model set-ups used in global assessments.
Land use emerges as a key issue in many of the currently ongoing studies on global resources, as
important as energy use. But the art of worldwide land use modeling is clearly younger than energy
and climate modeling. In fact, opinions can diverge on even the direction of land-use change to be
expected under certain policy assumptions. It is important to develop this line of global modeling
quickly as a reliable and transparent component of worldwide forward-looking studies.
Moving to simpler scenario set-ups such as baseline and policy variants, does not of course mean
reverting to the state of the art of the early 1990s. In a baseline set-up (i.e an outlook based on a
single reference scenario, for example to conduct comparative policy analysis) it becomes even more
important to incorporate the advances that have been made over the past decade or two on uncertainty
assessment, acknowledgement of different stakeholder perspectives, and proper procedures for global
studies.
The Human Dimension
Improving consideration of the human dimensions, i.e. social, economic and cultural aspects of human-
environment interactions, in global assessments has to go well beyond the integration of land use
change in models and scenarios. A sound understanding of the linkages between the environment,
global change and human well-being (e.g. in terms of ecosystem goods and services), as well as its
model and assessment based representation must be developed. Furthermore, human perceptions and
valuations as well as the human dimensions of decision-making have to be recognised to understand
the dynamics of policy and governance processes. This is also a prerequisite for the improvement of
science-policy linkages. The social learning approach as well as participatory or agent-based modeling
are important emerging techniques in this respect.
In order to answer the questions raised and tackle the challenges identified, a further important outcome
of this May 2007 event is a follow-up workshop planned for spring 2008 to undertake a methodological
review of the large global assessments (e.g. GEO-4, IPCC AR-4, OECD Environment Outlook). This
special meeting will involve some thirty practitioners from the lead agencies to identify and discuss
methodological advances, gaps and sources of innovation. Since these assessments are prepared primarily
as input to policy making, they are influenced by interactions with the respective oversight bodies and the
audiences of the results. Results of this meeting will be published on the TIAS website.
•
•
•
•
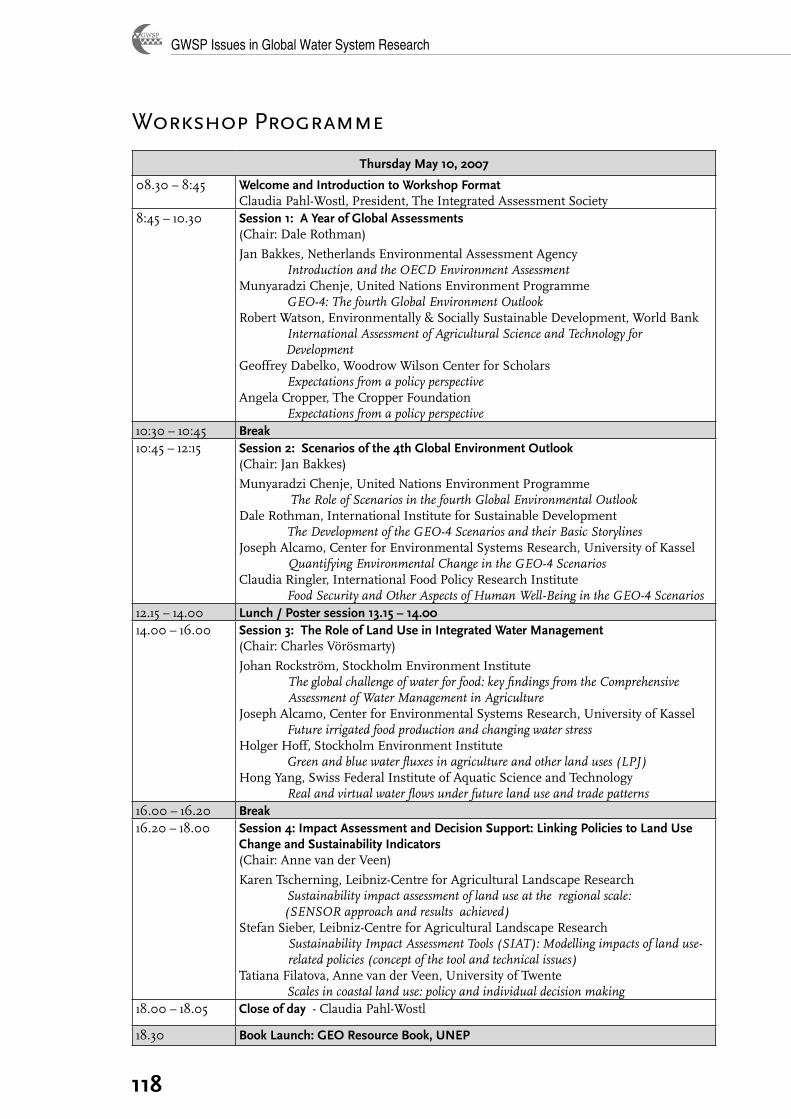
GWSP Issues in Global Water System Research
���
Workshop Programme
Thursday May �0, �00�
08.30 – 8:45 Welcome and Introduction to Workshop FormatClaudia Pahl-Wostl, President, The Integrated Assessment Society
8:45 – 10.30 Session 1: A Year of Global Assessments (Chair: Dale Rothman)
Jan Bakkes, Netherlands Environmental Assessment Agency Introduction and the OECD Environment AssessmentMunyaradzi Chenje, United Nations Environment Programme GEO-4: The fourth Global Environment OutlookRobert Watson, Environmentally & Socially Sustainable Development, World Bank International Assessment of Agricultural Science and Technology for DevelopmentGeoffrey Dabelko, Woodrow Wilson Center for Scholars Expectations from a policy perspectiveAngela Cropper, The Cropper Foundation Expectations from a policy perspective
10:30 – 10:45 Break10:45 – 12:15 Session 2: Scenarios of the 4th Global Environment Outlook
(Chair: Jan Bakkes)
Munyaradzi Chenje, United Nations Environment Programme The Role of Scenarios in the fourth Global Environmental OutlookDale Rothman, International Institute for Sustainable Development The Development of the GEO-4 Scenarios and their Basic StorylinesJoseph Alcamo, Center for Environmental Systems Research, University of Kassel
Quantifying Environmental Change in the GEO-4 ScenariosClaudia Ringler, International Food Policy Research Institute Food Security and Other Aspects of Human Well-Being in the GEO-4 Scenarios
12.15 – 14.00 Lunch / Poster session ��.�� – ��.0014.00 – 16.00 Session 3: The Role of Land Use in Integrated Water Management
(Chair: Charles Vörösmarty)
Johan Rockström, Stockholm Environment InstituteThe global challenge of water for food: key findings from the Comprehensive Assessment of Water Management in Agriculture
Joseph Alcamo, Center for Environmental Systems Research, University of Kassel Future irrigated food production and changing water stress Holger Hoff, Stockholm Environment Institute Green and blue water fluxes in agriculture and other land uses (LPJ) Hong Yang, Swiss Federal Institute of Aquatic Science and Technology Real and virtual water flows under future land use and trade patterns
16.00 – 16.20 Break16.20 – 18.00 Session 4: Impact Assessment and Decision Support: Linking Policies to Land Use
Change and Sustainability Indicators(Chair: Anne van der Veen)
Karen Tscherning, Leibniz-Centre for Agricultural Landscape Research Sustainability impact assessment of land use at the regional scale: (SENSOR approach and results achieved)
Stefan Sieber, Leibniz-Centre for Agricultural Landscape ResearchSustainability Impact Assessment Tools (SIAT): Modelling impacts of land use-related policies (concept of the tool and technical issues)
Tatiana Filatova, Anne van der Veen, University of Twente Scales in coastal land use: policy and individual decision making
18.00 – 18.05 Close of day - Claudia Pahl-Wostl
18.30 Book Launch: GEO Resource Book, UNEP
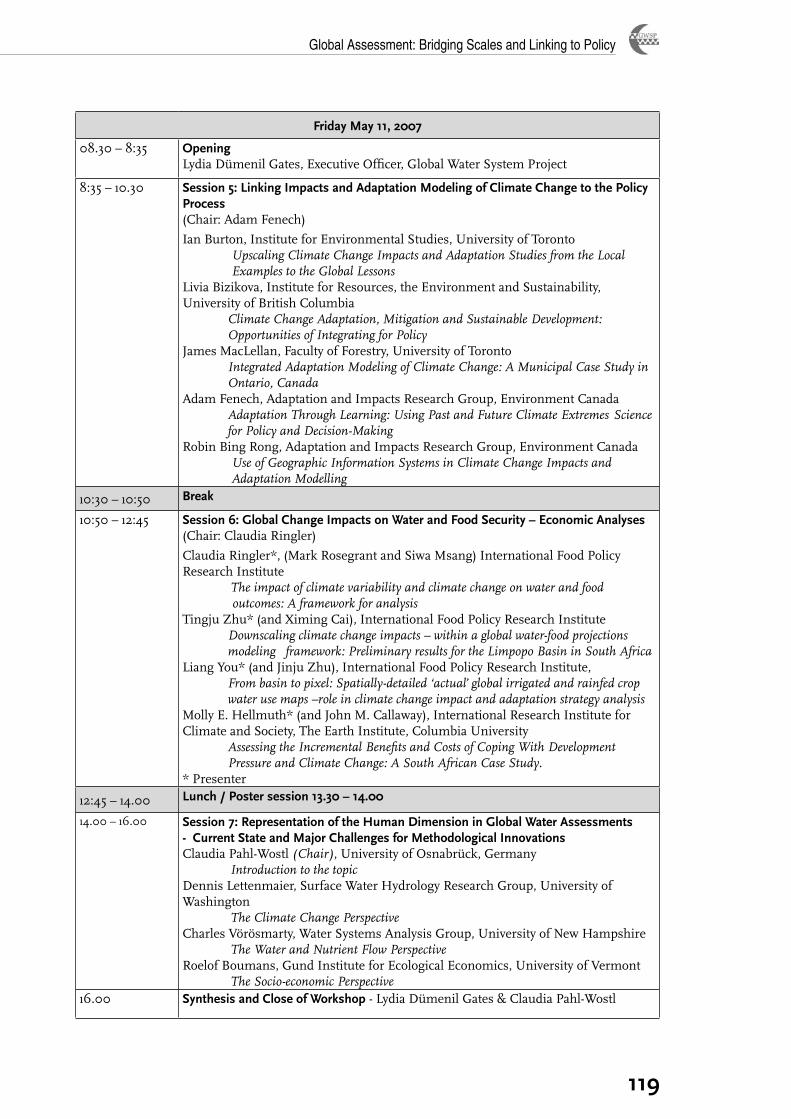
Global Assessment: Bridging Scales and Linking to Policy
���
Friday May ��, �00�
08.30 – 8:35 Opening Lydia Dümenil Gates, Executive Officer, Global Water System Project
8:35 – 10.30 Session 5: Linking Impacts and Adaptation Modeling of Climate Change to the Policy Process (Chair: Adam Fenech)
Ian Burton, Institute for Environmental Studies, University of TorontoUpscaling Climate Change Impacts and Adaptation Studies from the Local Examples to the Global Lessons
Livia Bizikova, Institute for Resources, the Environment and Sustainability, University of British Columbia
Climate Change Adaptation, Mitigation and Sustainable Development: Opportunities of Integrating for Policy
James MacLellan, Faculty of Forestry, University of TorontoIntegrated Adaptation Modeling of Climate Change: A Municipal Case Study in Ontario, Canada
Adam Fenech, Adaptation and Impacts Research Group, Environment CanadaAdaptation Through Learning: Using Past and Future Climate Extremes Science for Policy and Decision-Making
Robin Bing Rong, Adaptation and Impacts Research Group, Environment CanadaUse of Geographic Information Systems in Climate Change Impacts and Adaptation Modelling
10:30 – 10:50 Break
10:50 – 12:45 Session 6: Global Change Impacts on Water and Food Security – Economic Analyses (Chair: Claudia Ringler)
Claudia Ringler*, (Mark Rosegrant and Siwa Msang) International Food Policy Research Institute The impact of climate variability and climate change on water and food outcomes: A framework for analysis Tingju Zhu* (and Ximing Cai), International Food Policy Research Institute
Downscaling climate change impacts – within a global water-food projections modeling framework: Preliminary results for the Limpopo Basin in South Africa
Liang You* (and Jinju Zhu), International Food Policy Research Institute, From basin to pixel: Spatially-detailed ‘actual’ global irrigated and rainfed crop water use maps –role in climate change impact and adaptation strategy analysis
Molly E. Hellmuth* (and John M. Callaway), International Research Institute for Climate and Society, The Earth Institute, Columbia University
Assessing the Incremental Benefits and Costs of Coping With Development Pressure and Climate Change: A South African Case Study.
* Presenter
12:45 – 14.00 Lunch / Poster session ��.�0 – ��.00
14.00 – 16.00 Session 7: Representation of the Human Dimension in Global Water Assessments - Current State and Major Challenges for Methodological InnovationsClaudia Pahl-Wostl (Chair), University of Osnabrück, Germany Introduction to the topicDennis Lettenmaier, Surface Water Hydrology Research Group, University of Washington The Climate Change Perspective Charles Vörösmarty, Water Systems Analysis Group, University of New Hampshire The Water and Nutrient Flow PerspectiveRoelof Boumans, Gund Institute for Ecological Economics, University of Vermont The Socio-economic Perspective
16.00 Synthesis and Close of Workshop - Lydia Dümenil Gates & Claudia Pahl-Wostl

GWSP Issues in Global Water System Research
120
List of Participants
First Name Last Name Institute / Organisation Country Email Address
Joseph AlcamoCenter for Environmental Systems Research, University of Kassel
Germanyalcamo [at] usf.uni-kassel.de
Jan Bakkes Netherlands Environmental Assessment Agency (MNP)The Netherlands
jan.bakkes [at] mnp.nl
Rianne BijlsmaDepartment of Water Engineering and Management, University of Twente/ RWS-RIZA
The Netherlands
r.m.bijlsma [at] utwente.nl
Michiel BlindInstitute for Inland Water Management & Waste Water Treatment , Dutch Ministry of Transport, Public Works & Water Management
The Netherlands
michiel.blind [at] rws.nl
Livia BizikovaAdaptation and Impacts Research Division (AIRD), Environment Canada; The W. Maurice Young Center for Applied Ethics, Vancouver, BC, Canada
Canadalbizikova [at] ires.ubc.ca
Roelof BoumansGund Institute for Ecological Economics, University of Vermont
USARoelof.Boumans [at] uvm.edu
Ilke BorowskiInstitute of Environmental Systems Research, University of Osnabrück
Germanyborowski [at] usf.uos.de
Ian BurtonAdaptation and Impacts Research Division, Environment Canada
Canada ian.burton [at] ec.gc.ca
Marcela BrugnachInstitute of Environmental Systems Research, University of Osnabrück
Germanymbrugnac [at] usf.uos.de
Adrian CashmanCentre for Resource Management and Environ-mental Studies, University of the West Indies
Barbadosadrian.cashman [at] cavehill.uwi.edu
Esther Diez Cebollero School of Water Sciences, Cranfield UniversityUnited Kingdom
e.diezcebollero [at] cranfield.ac.uk
Munyaradzi Chenje GEO Section, United Nations Environment Programme Kenyamunyaradzi.chenje [at] unep.org
Robert William
Crabtree Water Research Centre plcUnited Kingdom
bob.crabtree [at] wrcplc.co.uk
Angela Cropper The Cropper FoundationTrinidad & Tobago
acropper [at] thecropper foundation.org
Geoffrey DabelkoEnvironmental Change and Security Program, Woodrow Wilson International Center for Scholars
USAgeoff.dabelko [at] wilsoncenter.org
LydiaDümenil Gates
Global Water System Project, International Project Office
Germanylydia.dumenilgates [at] uni-bonn.de
Edwin Ted Engman NASA Goddard Space Flight Center USAtengman [at] hsb.gsfc.nasa.gov
Adam FenechAdaptation and Impacts Research Division,Environment Canada
CanadaAdam.Fenech [at] ec.gc.ca
Tatiana FilatovaDepartment of Water Engineering and Management, University of Twente
The Netherlands
t.filatova [at] ctw.utwente.nl
Jong-Hwa HamDepartment of Civil & Environmental Engineering, Cornell University
USA jh438 [at] cornell.edu
Molly HellmuthInternational Research Institute for Climate and Society, The Earth Institute, Columbia University
USAhellmuth [at] iri.columbia.edu
Holger Hoff Stockholm Environment Institute Swedenholger.hoff [at] hotmail.com
Paul Jeffrey Centre for Water Science, Cranfield UniversityUnited Kingdom
bhughes [at] du.edu
Liu JunguoSystem Analysis and Modelling, Swiss Federal Institute of Aquatic Science and Technology
Switzerlandjunguo.liu [at] eawag.ch
Dennis LettenmaierSurface Water Hydrology Research Group, University of Washington
USAdennisl [at] u.washington.edu
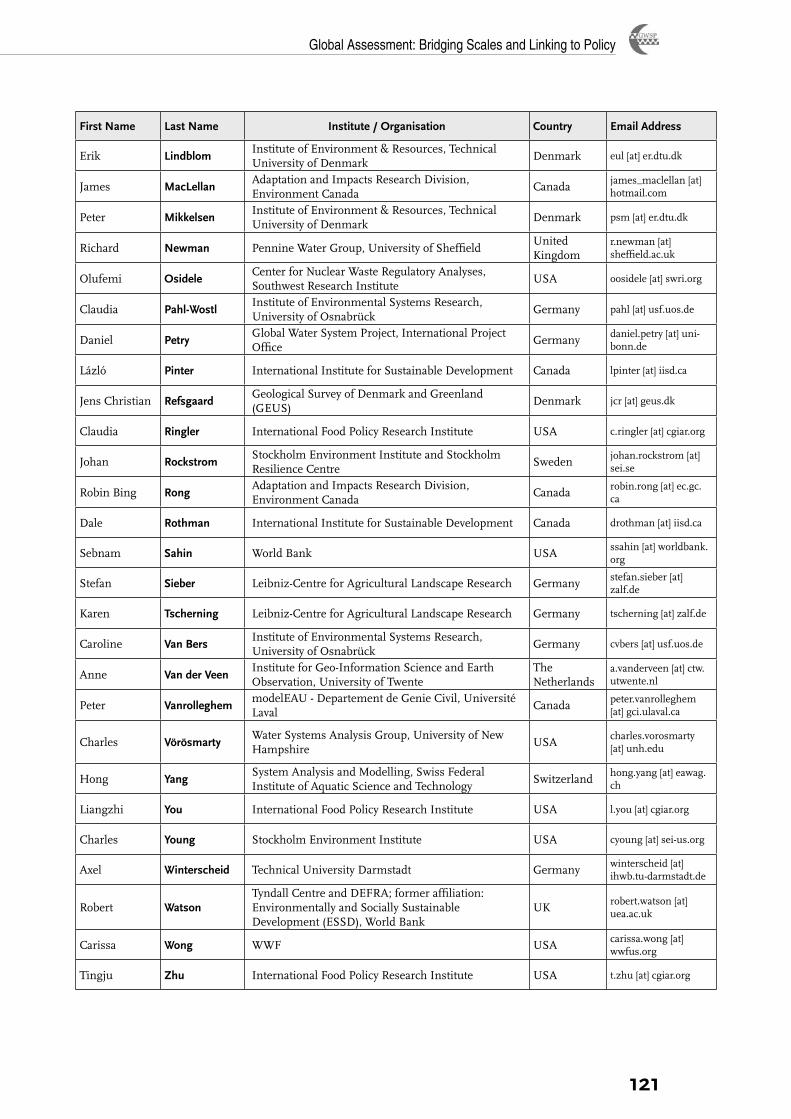
Global Assessment: Bridging Scales and Linking to Policy
121
First Name Last Name Institute / Organisation Country Email Address
Erik LindblomInstitute of Environment & Resources, Technical University of Denmark
Denmark eul [at] er.dtu.dk
James MacLellanAdaptation and Impacts Research Division, Environment Canada
Canadajames_maclellan [at] hotmail.com
Peter MikkelsenInstitute of Environment & Resources, Technical University of Denmark
Denmark psm [at] er.dtu.dk
Richard Newman Pennine Water Group, University of SheffieldUnited Kingdom
r.newman [at] sheffield.ac.uk
Olufemi OsideleCenter for Nuclear Waste Regulatory Analyses, Southwest Research Institute
USA oosidele [at] swri.org
Claudia Pahl-WostlInstitute of Environmental Systems Research, University of Osnabrück
Germany pahl [at] usf.uos.de
Daniel PetryGlobal Water System Project, International Project Office
Germanydaniel.petry [at] uni-bonn.de
Lázló Pinter International Institute for Sustainable Development Canada lpinter [at] iisd.ca
Jens Christian RefsgaardGeological Survey of Denmark and Greenland (GEUS)
Denmark jcr [at] geus.dk
Claudia Ringler International Food Policy Research Institute USA c.ringler [at] cgiar.org
Johan RockstromStockholm Environment Institute and Stockholm Resilience Centre
Swedenjohan.rockstrom [at] sei.se
Robin Bing RongAdaptation and Impacts Research Division,Environment Canada
Canadarobin.rong [at] ec.gc.ca
Dale Rothman International Institute for Sustainable Development Canada drothman [at] iisd.ca
Sebnam Sahin World Bank USAssahin [at] worldbank.org
Stefan Sieber Leibniz-Centre for Agricultural Landscape Research Germanystefan.sieber [at] zalf.de
Karen Tscherning Leibniz-Centre for Agricultural Landscape Research Germany tscherning [at] zalf.de
Caroline Van BersInstitute of Environmental Systems Research, University of Osnabrück
Germany cvbers [at] usf.uos.de
Anne Van der VeenInstitute for Geo-Information Science and Earth Observation, University of Twente
The Netherlands
a.vanderveen [at] ctw.utwente.nl
Peter VanrolleghemmodelEAU - Departement de Genie Civil, Université Laval
Canadapeter.vanrolleghem [at] gci.ulaval.ca
Charles VörösmartyWater Systems Analysis Group, University of New Hampshire
USAcharles.vorosmarty [at] unh.edu
Hong YangSystem Analysis and Modelling, Swiss Federal Institute of Aquatic Science and Technology
Switzerlandhong.yang [at] eawag.ch
Liangzhi You International Food Policy Research Institute USA l.you [at] cgiar.org
Charles Young Stockholm Environment Institute USA cyoung [at] sei-us.org
Axel Winterscheid Technical University Darmstadt Germanywinterscheid [at] ihwb.tu-darmstadt.de
Robert WatsonTyndall Centre and DEFRA; former affiliation:Environmentally and Socially Sustainable Development (ESSD), World Bank
UKrobert.watson [at] uea.ac.uk
Carissa Wong WWF USAcarissa.wong [at] wwfus.org
Tingju Zhu International Food Policy Research Institute USA t.zhu [at] cgiar.org


![Global issues[1]](https://img.dokumen.tips/doc/110x75/554a637bb4c905522f8b577d/global-issues1.jpg)
