Embed Size (px)
Citation preview

1Journal of Construction
ISSN 1994 - 7402

2 Journal of Construction
ADVISORY BOARDProf. John SmallwoodNelson Mandela Metropolitan UniversitySouth Africa
Prof. Jimmie HinzeUniversity of FloridaU.S.A.
Dr. Albert ChanThe Hong Kong Polytechnic UniversityChina
Prof. Alan GriffithSheffield Hallam UniversityU.K.
Dr. Benedict IlozorEastern Michigan UniversityU.S.A.
Dr. David EdwardsLoughborough UniversityU.K.
Dr. Dean KashiwagiArizona State UniversityU.S.A.
Prof. Charles EgbuUniversity of SalfordU.K.
Prof. Ronie NavonNational Building Research Institute (NBRI)Israel
Dr. Ayman Ahmed Ezzat OthmanCommercial Buildings DirectorateUnited Arab Emirates
Prof. Christian KochTechnical University of DenmarkDenmark
Prof. Paulo Jorge da Silva BártolaPolytechnic Institute of LeiriaPortugal
Dr. Faisal Manzoor ArainSouthern Alberta University of Technology Canada
Prof. Kerry LondonUniversity of NewcastleAustralia
Dr. Wilco TijhuisUniversity of TwenteNetherlands
Dr. Gary SmithNorth Dakota State UniversityU.S.A.
Dr. Jane EnglishUniversity of Cape TownSouth Africa
Prof. Hojjat AdeliOhio State UniversityU.S.A.
Dr. Helen LingardRoyal Melbourne Institute of TechnologyAustralia
Prof. Low Sui PhengNational University of SingaporeSingapore
Prof. Marton MarosszekyUniversity of New South WalesAustralia
Dr. Onuegbu UgwuThe University of Hong KongHong Kong
Dr. Peter ErkelensEindhoven University of TechnologyNetherlands
Prof. Chris CloeteUniversity of PretoriaSouth Africa
Prof. Martin SextonUniversity of Salford U.K.
Prof. Russell KenleySwinburne University of Technology Australia
Dr. Hendrik MarxUniversity of the Free StateSouth Africa
Journal of Construction
FROM THE PRESIDENT’S PENThe winds of change continue to sweep across the globe as people everywhere struggle to meet the challenges of economic downturns, climate change, increasing mobility of people and rapid technological development. Many of these changes hold promise for improvement in the overall quality of life of us all. Others threaten the very core of what we hold dear. At ASOCSA we have also been subjected to change, resulting in review of how we still deliver efficiently and effectively on our mandate to improve construction education in our region. We have had to become lean and mean operationally. For that reason we have not held the expected meeting of Heads in September to coincide with the 104th Annual Congress of the MBSA. However, I was thrilled to represent ASOCSA by both presenting an address and facilitating a panel on construction health and safety. I compliment the MBSA on devoting an entire day of their wonderful programme to this issue.
The second part of the preliminary findings of our indus-try-academia survey is included in these pages. There is compelling evidence both from these findings and also our experience during the recent series of accreditation visits that industry and academia need to speak more loudly to each other if the education experience of our graduates is going to be meaningful, especially with respect to their current and future employability.
Our first bold excursion beyond the borders of South Africa into Zambia for our 4th Built Environment Confer-ence was hugely successful with several new relationships developed. The success of the conference was evidenced in the largest meeting of construction heads in the region as far as I can remember. Institutions throughout South Africa as well as, for example, Botswana, Zambia, Uganda and Tanzania were represented.
I have moved on personally to lead an innovative con-struction programme in the U.S.A. where subjects and subject content have been deliberately blurred in favour of an academic experience that introduces the workplace into the classroom where each student acts as a professional under the guidance of a master professional. Feedback from industry practitioners who visited the instructional spaces was expressed as, “You are onto something!” The challenge is to encourage other institutions and programmes to experiment similarly.
It is my vision that ASOCSA should, inter alia, become the central depository of all construction-related curricu-lums, course outlines, and examination papers in the region; source of construction education statistics and information; support deserving students in construction programmes; and be able to recognise the annual contribution to the improvement of construction education and training in the region by a person and/or organisation.
In conclusion, the 5th Built Environment Conference from July 18 through 20 will take place in Durban almost immediately after the final whistle of the FIFA 2010 World Cup has blown. I am sure that the hype, excitement and thrill of this unique experience in the history of our young nation will not have quite died down yet by then. Spare a thought for the unparalleled efforts and achievements of our industry in producing the venues and physical infrastructure that will make the event not only spectacular, but a success.
Enjoy reading this issue.
Theo C. HauptPresident
Prof. Kerry LondonUniversity of NewcastleAustralia
Journal of Construction
EDITORDr. Wellington Didibhuku ThwalaUniversity of Johannesburg,South Africa
CO-EDITORProf. Theo HauptMississippi state University,U.S.A.
Prof. Abdul Rashid bin Abdul AzizUniversiti Sains MalaysiaMalaysia
Prof. Ahmad RamlyUniversity of MalayaMalaysia
Dr. Nina BakerUniversity of StrathclydeScotland
Prof. James SommervilleGlasgow Caledonian UniversityScotland
Dr. Vian AhmedUniversity of SalfordU.K.
Prof. Nicola CostantinoPolytecnico di BariItaly
Prof. Stephen EmmittTechnical University of DenmarkDenmark
Prof. Derek Clements-CroomeUniversity of ReadingU.K.
Prof. David BoydUniversity of Central EnglandU.K.
Dr. Peter LoveEdith Cowan UniversityAustralia
Dr. Ravi Srinath PereraUniversity of UlsterNorthern Ireland
Dr. Robert KongNanyang Technological UniversitySingapore
Prof. Stephen OgunlanaAsian Institute of TechnologyThailand
ISSN 1994 - 7402
3Journal of Construction
JourNal of CoNStruCtIoN
CoNteNtS
1.
2.
3.
4.
Volume 3 Number 2
edItorIal
ISSN 1994 - 7402
As the new Editor of the Journal of Construction (JOC) it is a great pleasure to bring you Volume 3 Number 2 edition during such as special year in South Africa’s history. The final whistle for the 2010 World Cup signalled the end of South Africa’s biggest soccer event and its memories will remain with us for many years to come. Billions of Rands had been spent in building stadiums, roads and other related infrastructure for the successful hosting of the event. What have we learnt from the 2010 World Cup for the improvement of the construction industry? The Journal of Construction (JOC) serves as a platform to debate such issues. It is a mouthpiece of the Association of Schools of Construction of Southern Africa (ASOCSA) in the advancement of education standards in the Southern African region.
As Editor, I challenge all those who are involved in the construction industry to critically assess the lessons learnt for the improvement of the construction industry in South Africa and internationally. In the current global economic climate, the need for effective assessment and support in the construction sector is stronger than ever. It is widely expected that the effect of the global economic downturn on this sector, which has led to the closure of thousands of companies, will continue before it starts to stabilise. I believe that sharing information and encouraging discussion regarding the state of the construction industry and the challenges our contractors face is a vital part of driving growth and development in the sector.
Thank you to the contributing authors and reviewers of this edition of JOC. A special invitation is extended to authors who have previously published in JOC and new members of the built environment to participate in future contributions.
I would particularly like to thank the previous editor of JOC, Mr Felix le Roux, for all the good work he has done in the past two years.
Dr. Wellington Didibhuku ThwalaUniversity of Johannesburg
South [email protected]
TACKLING CLIMATE CHANGE:THE ENERGY OF NEW RESIDENTIAL BUILDINGS IN ENGLAND by S. Kade, Clive Chapman Architects, United Kingdom and S. Pretlove, Archilab, School of Architecture + Landscape, Kingston University London
DEVELOPMENT OF AN INDUSTRY MATURITY FRAMEWORK FOR FACILITIES MANAGEMENTby M. Banyani and D. Then, Department of the Building Services Engineering, Faculty of Construction and Land Use,The Hong Kong Polytechnic University, Hong Kong, China.
PERCEPTION OF BARRIERS TO RISK ASSESSMENT AND MANAGEMENT PRACTICES (RAMP) DEPLOYMENT: OPINION SURVEY FINDINGSby A. Agyakwa-Baah, Postgraduate, Sheffield Hallam University, Built Environment Division, Sheffield, United Kingdom, Dr N. Chileshe, University of South Australia,School of Natural and Built Environments, Rev. Dr F. Fugar, Faculty of Architecture and Building Technology, College of Architecture, Kwame Nkrumah University of Science and Technology (KNUST), Ghana
TRIGGERS OF DISPUTES WITHIN THE GHANAIAN CONSTRUCTION INDUSTRYby M. Assah-Kissiedu, Fugar, F.D.K., and Badu, E., Department of Building Technology Kwame Nkrumah University of Science and Technology, Kumasi, Ghana
POST OCCUPANCY EXPERIENCE OF HOUSING SUBSIDY BENEFICIARIES IN THE GAUTENG PROVINCE OF SOUTH AFRICAby C.O. Aigbavboa and Dr. W.D.Thwala, Department of Construction Management and Quantity Surveying, University of Johannesburg, South Africa
5.
PRESIDENTIAL REPORT FOR THE PERIOD 07 JULY 2008 – 18 JULY 20106.
4 Journal of Construction
TACKLING CLIMATE CHANGETHE ENERGY PERFORMANCE OF NEW RESIDENTIAL BUILDINGS IN ENGLAND
Sisonie Kade*, Dr Stephen Pretlove#
*Clive Chapman Architects, 4 Eel Pie Island, TW1 3DY, Twickenham, Middlesex, United Kingdom, email: [email protected], Tel.: +4420 8891 4837, Mobile: +447594 370091
#ArchiLab, School of Architecture + Landscape, Kingston University London, Knights Park, Grange Road, KT1 2QJ, Kingston upon Thames, Surrey, United Kingdom, email: [email protected],
Tel.: +4420 8547 8491, Mobile: +447588 408305
ABSTRACTPurpose: Using the new build residential sector in England as its basis, this study examines how climate change is being tackled, and analyses the practicality of implementing the current carbon dioxide and energy requirements proposed by UK legislation, sustainability codes, and local authority planning requirements.
Design/methodology: The paper outlines the current climate change facts, analyses the global, national, regional and local requirements for energy strategy and highlights the differences that have been found. The impact of different design strategies on achieving the various requirements is then modelled, using case study data.
Findings: The preliminary findings of this study show that there are many conflicts in the interpretation on the requirements at different levels and that the methods being used in the residen-tial sector in England to tackle climate change are fraught with problems. They also show that the current additional cost of a sustainable building is prohibitively high. In order to success-fully implement environmentally sustainable solutions, there is a need for clearer regulations, guidelines and definitions, and for significant incentives.
Practical implications and value of paper: The study highlights the difficulties of implementing the energy and carbon dioxide commitments using the UK as its basis and makes a number of recommendations to make the implementation successful and to overcome the existing barriers.
KEYWORDSClimate change, sustainable construction, energy, carbon dioxide emission requirements, implementation
CLIMATE CHANGE“There is still time to avoid the worst impacts of climate change, if we act now and act internationally”[1].
There is now very strong evidence[2] that since the late 1800s the earth’s average surface temperature has risen by 0.74˚C. Since this period, there has been an ever increasing consumption of fossil fuels as oil, gas and coal, significant deforestation, and the practice of farming methods[3] that has resulted in emissions of six principal greenhouse gases[4]: Carbon Dioxide (CO2), Methane (MH4), Nitrous Oxides (N2O), Hydrofluorocarbon (HFC), Perfluorocarbon (PFC) and Sulphur Hexafluoride (SF6).
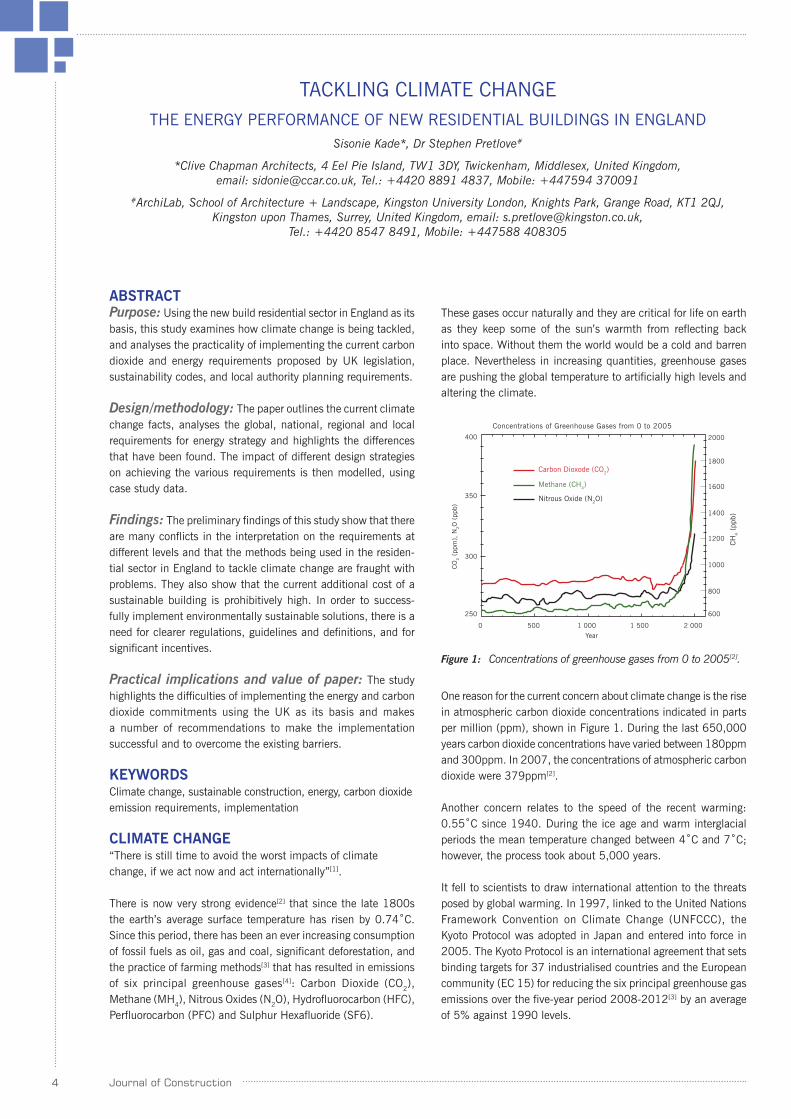
Figure 1: Concentrations of greenhouse gases from 0 to 2005[2].
These gases occur naturally and they are critical for life on earth as they keep some of the sun’s warmth from reflecting back into space. Without them the world would be a cold and barren place. Nevertheless in increasing quantities, greenhouse gases are pushing the global temperature to artificially high levels and altering the climate.
One reason for the current concern about climate change is the rise in atmospheric carbon dioxide concentrations indicated in parts per million (ppm), shown in Figure 1. During the last 650,000 years carbon dioxide concentrations have varied between 180ppm and 300ppm. In 2007, the concentrations of atmospheric carbon dioxide were 379ppm[2].
Another concern relates to the speed of the recent warming: 0.55˚C since 1940. During the ice age and warm interglacial periods the mean temperature changed between 4˚C and 7˚C; however, the process took about 5,000 years.
It fell to scientists to draw international attention to the threats posed by global warming. In 1997, linked to the United Nations Framework Convention on Climate Change (UNFCCC), the Kyoto Protocol was adopted in Japan and entered into force in 2005. The Kyoto Protocol is an international agreement that sets binding targets for 37 industrialised countries and the European community (EC 15) for reducing the six principal greenhouse gas emissions over the five-year period 2008-2012[3] by an average of 5% against 1990 levels.
Concentrations of Greenhouse Gases from 0 to 2005
Carbon Dioxode (CO2)
Methane (CH4)
Nitrous Oxide (N2O)
400
350
300
250 600
800
1000
1200
1400
1600
1800
2000
0 500 1 000
Year
1 500 2 000
CO
2 (
ppm
), N
2O
(pp
b)
CH
4 (
ppb)
5Journal of Construction
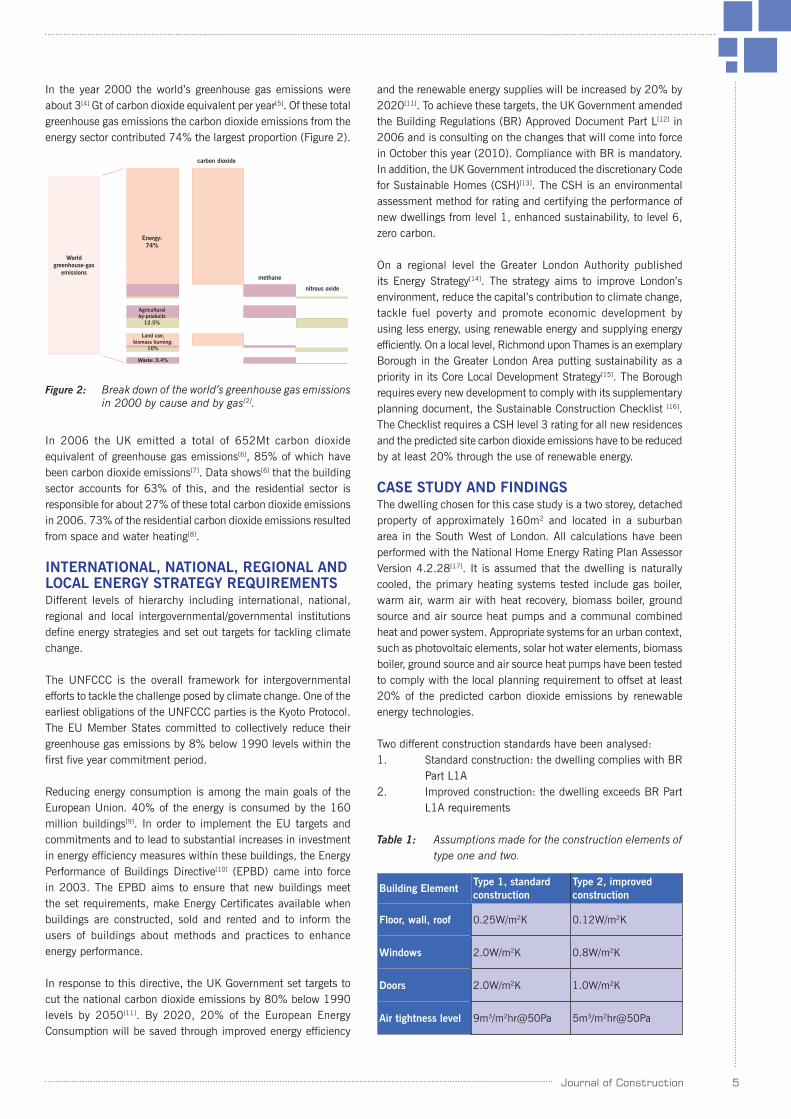
In the year 2000 the world’s greenhouse gas emissions were about 3[4] Gt of carbon dioxide equivalent per year[5]. Of these total greenhouse gas emissions the carbon dioxide emissions from the energy sector contributed 74% the largest proportion (Figure 2).
Figure 2: Break down of the world’s greenhouse gas emissions in 2000 by cause and by gas[2].
In 2006 the UK emitted a total of 652Mt carbon dioxide equivalent of greenhouse gas emissions[6], 85% of which have been carbon dioxide emissions[7]. Data shows[6] that the building sector accounts for 63% of this, and the residential sector is responsible for about 27% of these total carbon dioxide emissions in 2006. 73% of the residential carbon dioxide emissions resulted from space and water heating[8].
INTERNATIONAL, NATIONAL, REGIONAL AND LOCAL ENERGY STRATEGY REQUIREMENTSDifferent levels of hierarchy including international, national, regional and local intergovernmental/governmental institutions define energy strategies and set out targets for tackling climate change.
The UNFCCC is the overall framework for intergovernmental efforts to tackle the challenge posed by climate change. One of the earliest obligations of the UNFCCC parties is the Kyoto Protocol. The EU Member States committed to collectively reduce their greenhouse gas emissions by 8% below 1990 levels within the first five year commitment period.
Reducing energy consumption is among the main goals of the European Union. 40% of the energy is consumed by the 160 million buildings[9]. In order to implement the EU targets and commitments and to lead to substantial increases in investment in energy efficiency measures within these buildings, the Energy Performance of Buildings Directive[10] (EPBD) came into force in 2003. The EPBD aims to ensure that new buildings meet the set requirements, make Energy Certificates available when buildings are constructed, sold and rented and to inform the users of buildings about methods and practices to enhance energy performance.
In response to this directive, the UK Government set targets to cut the national carbon dioxide emissions by 80% below 1990 levels by 2050[11]. By 2020, 20% of the European Energy Consumption will be saved through improved energy efficiency
and the renewable energy supplies will be increased by 20% by 2020[11]. To achieve these targets, the UK Government amended the Building Regulations (BR) Approved Document Part L[12] in 2006 and is consulting on the changes that will come into force in October this year (2010). Compliance with BR is mandatory. In addition, the UK Government introduced the discretionary Code for Sustainable Homes (CSH)[13]. The CSH is an environmental assessment method for rating and certifying the performance of new dwellings from level 1, enhanced sustainability, to level 6, zero carbon.
On a regional level the Greater London Authority published its Energy Strategy[14]. The strategy aims to improve London’s environment, reduce the capital’s contribution to climate change, tackle fuel poverty and promote economic development by using less energy, using renewable energy and supplying energy efficiently. On a local level, Richmond upon Thames is an exemplary Borough in the Greater London Area putting sustainability as a priority in its Core Local Development Strategy[15]. The Borough requires every new development to comply with its supplementary planning document, the Sustainable Construction Checklist [16]. The Checklist requires a CSH level 3 rating for all new residences and the predicted site carbon dioxide emissions have to be reduced by at least 20% through the use of renewable energy.
CASE STUDY AND FINDINGSThe dwelling chosen for this case study is a two storey, detached property of approximately 160m2 and located in a suburban area in the South West of London. All calculations have been performed with the National Home Energy Rating Plan Assessor Version 4.2.28[17]. It is assumed that the dwelling is naturally cooled, the primary heating systems tested include gas boiler, warm air, warm air with heat recovery, biomass boiler, ground source and air source heat pumps and a communal combined heat and power system. Appropriate systems for an urban context, such as photovoltaic elements, solar hot water elements, biomass boiler, ground source and air source heat pumps have been tested to comply with the local planning requirement to offset at least 20% of the predicted carbon dioxide emissions by renewable energy technologies.
Two different construction standards have been analysed:1. Standard construction: the dwelling complies with BR Part L1A2. Improved construction: the dwelling exceeds BR Part L1A requirements
Table 1: Assumptions made for the construction elements of type one and two.
Building ElementType 1, standard construction
Type 2, improved construction
Floor, wall, roof 0.25W/m2K 0.12W/m2K
Windows 2.0W/m2K 0.8W/m2K
Doors 2.0W/m2K 1.0W/m2K
Air tightness level 9m3/m2hr@50Pa 5m3/m2hr@50Pa
Energy:74%
carbon dioxide
methane
nitrous oxide
Worldgreenhouse-gas
emissions
Agriculturalby-products
12.5%
Land use,biomass burning:
10%
Waste: 3.4%
6 Journal of Construction
ENERGY PERFORMANCE CALCULATIONSIn England, the energy performance of a building is expressed in carbon dioxide emissions, determined as Dwelling Emission Rate (DER in kgCO2/m
2yr). The DER arising from the predicted energy demand of a dwelling has to be calculated to prove compliance with Building Regulations and in order to produce Energy Performance Certificates.
To comply with Building Regulations, the actual carbon dioxide emissions of the dwelling are compared with those of a notional dwelling. The emissions of the actual dwelling have to be equal to, or lower than the targeted emission rate of the notional dwelling.The energy data for the Energy Performance Certificate is also based on the carbon dioxide emissions, the DER respectively.
However, for both verifications the emissions arising through cooking and electrical appliances are disregarded. In addition, the assumptions made for the use of a secondary heating system and for the use of energy efficient lighting are different, although the same terminology, the DER, is applied.
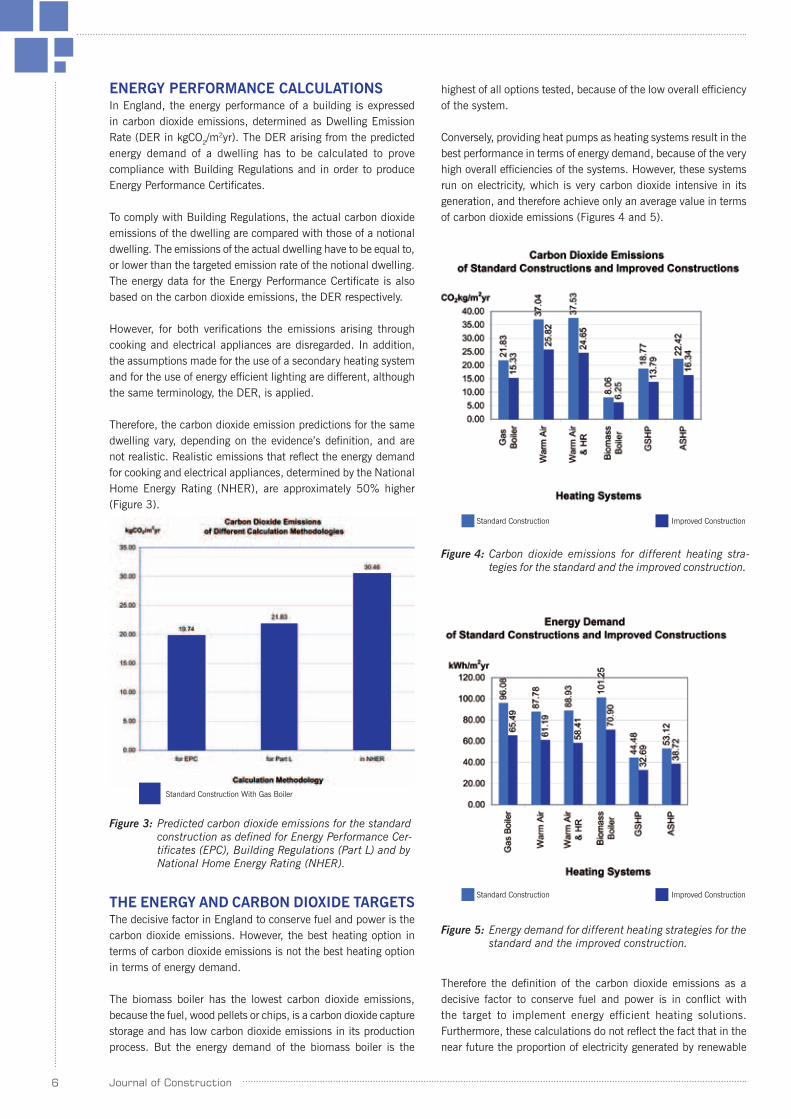
Therefore, the carbon dioxide emission predictions for the same dwelling vary, depending on the evidence’s definition, and are not realistic. Realistic emissions that reflect the energy demand for cooking and electrical appliances, determined by the National Home Energy Rating (NHER), are approximately 50% higher (Figure 3).
Figure 3: Predicted carbon dioxide emissions for the standard construction as defined for Energy Performance Cer- tificates (EPC), Building Regulations (Part L) and by National Home Energy Rating (NHER).
THE ENERGY AND CARBON DIOXIDE TARGETSThe decisive factor in England to conserve fuel and power is the carbon dioxide emissions. However, the best heating option in terms of carbon dioxide emissions is not the best heating option in terms of energy demand.
The biomass boiler has the lowest carbon dioxide emissions, because the fuel, wood pellets or chips, is a carbon dioxide capture storage and has low carbon dioxide emissions in its production process. But the energy demand of the biomass boiler is the
Standard Construction With Gas Boiler
highest of all options tested, because of the low overall efficiency of the system.
Conversely, providing heat pumps as heating systems result in the best performance in terms of energy demand, because of the very high overall efficiencies of the systems. However, these systems run on electricity, which is very carbon dioxide intensive in its generation, and therefore achieve only an average value in terms of carbon dioxide emissions (Figures 4 and 5).
Figure 4: Carbon dioxide emissions for different heating stra- tegies for the standard and the improved construction.
Figure 5: Energy demand for different heating strategies for the standard and the improved construction.
Standard Construction Improved Construction
Therefore the definition of the carbon dioxide emissions as a decisive factor to conserve fuel and power is in conflict with the target to implement energy efficient heating solutions. Furthermore, these calculations do not reflect the fact that in the near future the proportion of electricity generated by renewable
Standard Construction Improved Construction
7Journal of Construction
energy systems will increase and therefore heating systems running on electricity will have lower carbon dioxide emissions.
COGENERATION OF HEAT AND ELECTRICITYCombined heat and power systems (CHP) generate electricity and heat, and achieve 30% higher efficiencies than systems that produce heat and electricity separately[18]. Therefore the carbon dioxide emissions of a CHP system are the lowest of the systems tested in the case study.
Gas CHP systems are defined as Low or Zero Carbon Technologies in the UK. However, they are not recognised as renewable energy systems and do not count toward the requirement to incorporate 20% renewable energy technologies as required on local policy level.
Hence, although gas CHP systems are significant energy saving measures, in practice they are not often incorporated, as the capital cost for the systems are higher than those of gas boilers and additional investment has to be made to comply with the renewable energy requirement.
RENEWABLE ENERGY TECHNOLOGIESIn the UK, on a local policy level, it is a requirement that the predicted carbon dioxide emissions are offset by at least 20% by on-site renewable energy technologies. The systems that are accepted as renewable energy technologies vary on different policy levels and a generic definition is hard to find. In order to demonstrate compliance, complex and confusing calculations are required.
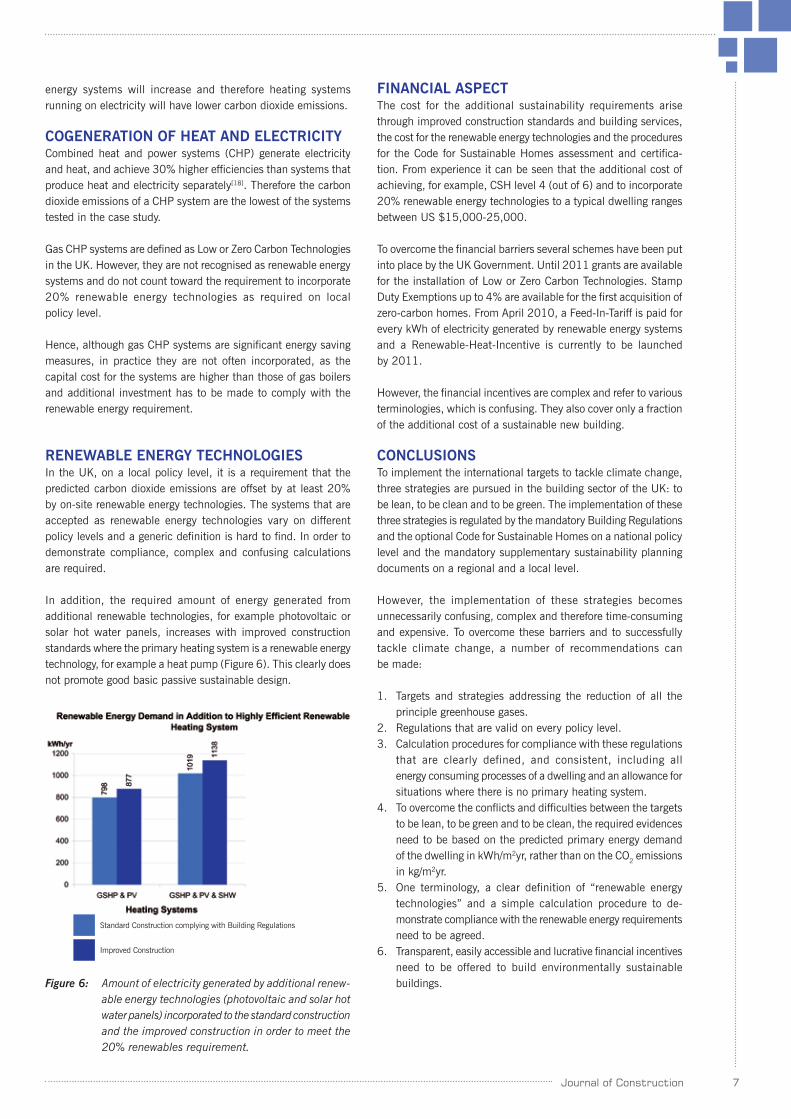
In addition, the required amount of energy generated from additional renewable technologies, for example photovoltaic or solar hot water panels, increases with improved construction standards where the primary heating system is a renewable energy technology, for example a heat pump (Figure 6). This clearly does not promote good basic passive sustainable design.
Figure 6: Amount of electricity generated by additional renew- able energy technologies (photovoltaic and solar hot water panels) incorporated to the standard construction and the improved construction in order to meet the 20% renewables requirement.
Standard Construction complying with Building Regulations
Improved Construction
FINANCIAL ASPECTThe cost for the additional sustainability requirements arise through improved construction standards and building services, the cost for the renewable energy technologies and the procedures for the Code for Sustainable Homes assessment and certifica-tion. From experience it can be seen that the additional cost of achieving, for example, CSH level 4 (out of 6) and to incorporate 20% renewable energy technologies to a typical dwelling ranges between US $15,000-25,000.
To overcome the financial barriers several schemes have been put into place by the UK Government. Until 2011 grants are available for the installation of Low or Zero Carbon Technologies. Stamp Duty Exemptions up to 4% are available for the first acquisition of zero-carbon homes. From April 2010, a Feed-In-Tariff is paid for every kWh of electricity generated by renewable energy systems and a Renewable-Heat-Incentive is currently to be launched by 2011.
However, the financial incentives are complex and refer to various terminologies, which is confusing. They also cover only a fraction of the additional cost of a sustainable new building.
CONCLUSIONSTo implement the international targets to tackle climate change, three strategies are pursued in the building sector of the UK: to be lean, to be clean and to be green. The implementation of these three strategies is regulated by the mandatory Building Regulations and the optional Code for Sustainable Homes on a national policy level and the mandatory supplementary sustainability planning documents on a regional and a local level.
However, the implementation of these strategies becomes unnecessarily confusing, complex and therefore time-consuming and expensive. To overcome these barriers and to successfully tackle climate change, a number of recommendations can be made:
1. Targets and strategies addressing the reduction of all the principle greenhouse gases.2. Regulations that are valid on every policy level.3. Calculation procedures for compliance with these regulations that are clearly defined, and consistent, including all energy consuming processes of a dwelling and an allowance for situations where there is no primary heating system.4. To overcome the conflicts and difficulties between the targets to be lean, to be green and to be clean, the required evidences need to be based on the predicted primary energy demand of the dwelling in kWh/m2yr, rather than on the CO2 emissions in kg/m2yr.5. One terminology, a clear definition of “renewable energy technologies” and a simple calculation procedure to de- monstrate compliance with the renewable energy requirements need to be agreed.6. Transparent, easily accessible and lucrative financial incentives need to be offered to build environmentally sustainable buildings.
8 Journal of Construction
REFERENCES1. Lord Stern, Nicholas (2006) “The Economics of Climate
Change” Stern Review, Executive Summary (http://www.hm-treasury.gov.uk/stern_review_report.htm).
2. IPCC (Intergovernmental Panel on Climate Change) Working Group I (2007) Climate Change 2007, The Physical Science Basis, Canada.
3. UNFCCC (United Nations Framework Convention on Climate Change) (2010), Essential Background, (Available online http://unfccc.int/essential_background/items/2877.php [accessed on 10/01/2010])
4. UN (United Nations) (1998), Kyoto Protocol To The United Nations Framework Convention on Climate Change: Annex A.
5. MacKay, David JC (2009) “Sustainable Energy – without the hot air”, UIT, Cambridge 2009, UK.
6. DEFRA (Department for Environment, Food and Rural Affairs) (2008) UK Climate Change Programme: Annual Report to Parliament, July 2008, London, UK.
7. BERR (Department of Business, Enterprise and Regulative Reform) (2008) UK Energy Sector Indicators 2008: key indicators dataset, related URN 08/193.
8. DCLG (Department of Communities and Local Government) (2007) Building a Greener Future: policy statement, London, UK.
9. CIBSE (Chartered Institution of Building Services Engineers) (2003), The Energy Performance of Buildings Directive, A summary of its objectives and contents, CIBSE Briefing 6, London, UK.
10. EU (2002), Energy Performance of Building Directive (EPBD) 2002/91/EC OF THE EUROPEAN PARLIAMENT AND OF THE COUNCIL of 16 December 2002 on the energy performance of buildings.
11. DECC (Department of Energy and Climate Change) (2008a) Climate Change Act 2008, Chapter 27, UK.
12. NBS (2006), Building Regulations Approved Document Part L1A, Conservation of fuel and power in new dwellings, RIBA Enterprises Ltd, London, UK.
13. DCLG (2008) The Code for Sustainable Homes, Setting the standard in sustainability for new homes, London, UK.
14. GLA (Greater London Authority) (2004) Green light to clean power, The Mayor’s Energy Strategy, London, UK.
15. LBRUT (London Borough Richmond upon Thames) (2009) Local Development Framework, Core Strategy, Adopted April 2009, Twickenham, Middlesex, UK.
16. LBRUT (2010) Sustainable Construction Checklist, (Available online http://www.richmond.gov.uk/home/environment/planning/planning_guidance_and_policies/supplementary_planning_guidance/sustainable_construction_checklist_supplementary_planning_document.htm [accessed on 24/01/2010]).
17. NHER (National Home Energy Rating) (2010) SAP 2005, (Available online http://www.nesltd.co.uk/ [accessed on 26/05/2010]).
18. Grindfeld A&M (2009) “Combined Heat and Power”, Building Sustainable Design 2009, Issue 06: 43-45.

9Journal of Construction
DEVELOPMENT OF AN INDUSTRY MATURITY FRAMEWORK
FOR FACILITIES MANAGEMENTMaulidi A. Banyani*, Danny S.S. Then#
*[email protected], #[email protected]
*&# Department of the Building Services Engineering, Faculty of Construction and Land Use,The Hong Kong Polytechnic University, Hung Hom, Kowloon, Hong Kong SAR, China.
ABSTRACTPurpose: This conceptual paper presents an Integrated Feeder Factors Framework (I3F) as a common yardstick in assessing maturity of Facilities Management (FM) industry.
Design/Methodology: This paper is based on a critical analysis of existing literature with a focus on existing organisa-tional maturity models, and identifying potential ‘feeder’ factors that impact on the development of any industry sector within an economy. Literature related to FM and maturity models have been evaluated, categorised and collated to provide thematic groups that are used in identifying feeder factors. The study also, used similar method in patterning critical success factors (CSFs) that are essential in establishing internal strength of the feeder factors.
Findings: The I3F framework provides a consistent basis for evaluating maturity of FM industry at national, sector-wise and organisational levels, unlike existing process-focused organisa-tional maturity models.
Research limitation/implications: The proposed frame-work has to be validated for functionality before application.
Practical implications: The study introduces the framework that is aimed at assessing the state of maturity of facilities man-agement as an industry.
Originality/Value: The study introduces the I3F framework as a potential yardstick for assessing the developmental levels of the FM industry within an economy. It aims to serve as a potential ‘road map’ for charting the growth of facilities management as an important economic activity from a ‘least developed’ to a ‘fully matured’ stage.
KEYWORDSFacilities management, Feeder factors, Industry development, Maturity model.
INTRODUCTIONAs an industry, discipline and profession, Facilities Management (FM) has received a lot of attention from both academics and practitioners (Price, 2003a). A multitude of issues have been scru-tinised and received lengthy discussions. Some of these included: FM in identity crisis (Tay and Ooi, 2001); nature or status of FM (Green and Price, 2000); and potential focus of the FM industry (Then 1999). However, despite these problems FM is by all factors growing and is now recognised in five continents (Then, 2004).
FM, as an industry, provides support services to core businesses and is a global business measured in billions in terms of major international currencies. The International Facility Management Association (www.IFMA.org, 2009) estimates the global value of the FM market to be in the tune of US$ 100billion. In the UK alone, the British Institute of Facilities Management (www.BIFM.org.uk, 2009) estimated the FM sector is worth between 40b and 95b pounds. In Germany, the FM market is estimated to be in the region of 55 billion Euros (www.GEFMA.de, 2009). FM is the largest contributor to gross national product (Ballesty, 2008). The author noted that FM in Australia in 2002-03 contributed about A$12.2 billion of value added, A$12.4 billion in GDP terms and employed 172,000 persons. Apart from direct contribution of the FM sector to the economy, it is entrusted with the crucial function of overseeing important buildings used to provide crucial services to society. The introduction of public-private partnerships (PPP) and private finance initiatives (PFI) has opened up the FM market and created direct relationship between the public sector and the FM sector. It is evident therefore that despite its relatively short history, the importance of the FM industry as an economic sector of the national economy and as a critical service sector is being acknowledged by governments and businesses alike. Nev-ertheless, in its current settings, FM as an industry is perceived in three ways as noted below.• It is an emerging industry (Grimshaw, 1999; Price 2003a;
and Ballesty, 2008).• It is a growing industry (Price 2003b; Then, 2004; Noor and
Khumpaisal, 2009).• It is a mature industry (Then, 1999; Barret and Baldry, 2003;
and Ventovuori et.al., 2007)
The analysis of the above studies reveals that there is no specific pattern of perception related to a particular timeline. For example, while some studies conducted in the late 1990s and early 2000s viewed FM as having indicators of maturity or being mature, some of those conducted in late 2000s regarded the industry as emergent. This is, in a way, an indicator of a lack of a common yardstick that can be used to measure the degree of its development. It can also be a result of diversity of functions that form FM. Other factors contributing to this dilemma can be unlimited horizontal expansion and the use of specific criteria such as market, function or country in assessing maturity. It is in light of these shortcomings that this study aims to identify feeder factors and construct a framework that can be used in determining the level of development and maturity of the FM industry within an economy.
10 Journal of Construction
The paper introduces a framework to be known as an ‘Integrated Feeder Factors Framework (I3F)’ that can be used in measuring maturity of FM industry in developed and developing economies. In more specific terms, it intends to achieve the following objectives:• To identify factors and parameters to be included as ‘Feeder
Factors’ for the continuous development of the FM industry; and
• To construct an ‘Integrated Feeder Factors Framework’ (I3F) based on the identified feeder factors and parameters.
FACILITIES MANAGEMENT IN THE 21ST CENTURYFacilities Management (FM) is a business of managing work space (McGregor and Then, 1999). The work space in this context is not considered in its narrow view of physical space but rather as a resource capable of influencing production as is the case for other factors of production i.e. information, labour, capital and technology (Stallworth and Ward, 1996). The management of work space in modern businesses has become increasingly com-plex, both at organisation and country level. At an organisational level, workplace is no more defined by four walls of a building. Technological advancement has made it possible for a work to be conducted from outside of the headquarters building. Unlike in the past where the functions of the Facilities Manager were to ensure availability of workspace; today’s challenges lie in the provision and management of strategic infrastructure and support services that enable business continuity. The Facilities Manager is required to anticipate change in demand and act swiftly while considering adding value to the core business. At country level, Facilities Management is an economic activity that contributes to GDP and which accounts for a significant proportion of govern-ment’s expenditure. Prudence will dictate that diligence is at the fore and only professional companies are engaged in managing and running long term projects. It is therefore apparent that the Facilities Manager has to be vigilant, astute, competent, ethical and knowledgeable in order to effectively provide the required range of services. One of the striking features of FM according to Atkin and Brooks (2001) is the lack of a universal approach to managing facilities and that each organisation, even within the same sector, will have different needs. Also, it is multifaceted and formed by diverse functions and core competencies. FM practice is a case-specific endeavour dealing with a diversity of facilities, organisation, business sector, surrounding environment, context and circumstances (Barret and Baldry, 2003). Due to this diversity it is indeed difficult to construct a framework based on the internal processes alone.
In its simplest form, FM deals mainly with technical and op-erational aspects of providing services necessary to support the core business. The focus at this stage is to minimise operational costs associated with the provision and management of work space. At the highest level, it is concerned with the management of work space at strategic level and abilities to cope up with the rapid changes in business environment. The focus of the industry at this level is to add value through effective management of facilities provision and support services (Then, 2004). Available literature suggests that over the last 30 years FM has evolved from operational focused to strategic orientation. Then, (2004) noted “FM has grown from managing and maintaining corporate property (operational buildings) with a deliberate slant towards
meeting stakeholders’ expectations”. The evolution of FM from operational based functions to strategic orientation is a prime indicator of the industry maturity.
Based on literature review, the high performance FM practice today is strategy-driven in the provision and management of sup-port services. It is at the strategic level where the FM industry can forecast and match supply to existing demand with the high-est efficiency by influencing high level decisions and add value to corporate performance. Businesses and country both aspire to attain this level, which is an immediate maturity level. This study looks at the contribution of feeder factors into enabling an organisation or a country to reach this level.
ANALYSIS OF THE EXISTING MATURITY MODELSAccording to Cookie-Davies (2004) the term ‘maturity’ has a number of usages; but when used in conjunction with organisation or industry development signifies full development or perfection. According to Lahti et.al. (2009), maturity conveys the idea of evolution from some initial state to some advanced state. Gen-erally, a maturity framework is a measure to aid organisations in gauging their performance relative to industry best practice. According to Fraser et.al. (2002), all maturity models share the common property of defining a number of dimensions at several maturity stages, with a description of characteristics performance at various levels of granularity. The basic components of the mod-els are number of levels, descriptors, generic description of each level, a number of dimensions (such as process areas or critical factors) and element or activities to be performed.
AN OVERVIEW OF MATURITY MODELS FROM OTHER DISCIPLINESMaturity models are popular in Project Management (PM), Knowl-edge Management, Information Systems (IS) and Supply Chain Management (SCM) industries. In these industries there is plenty and elaborate literature on maturity models and their applications. Nevertheless, some maturity models have had influence beyond the sphere of their intended application and are worth a men-tion. The most popular maturity model in use is the Capability Maturity Model (CMM). This is based in the work of software engineering pioneer Watts Humphrey (Cookie-Davies, 2004). The model addresses problems that arose from organisational inability to manage the software development ‘process’ (Paulk, et.al. 1993). The CMM is a five levels model starting from ‘initial stage’ being least developed to ‘optimising’ which is the highest level. In between these levels there are ‘repeatable’, ‘defined’ and ‘managed’ stages in ascending order. The model has received significant application in human resources, project management and information system (Lahti et.al. 2009). Another maturity model in use is the Organisational Project Management Maturity Model (OPM3) developed by the Project Management Institute (PMI). This model looks into the best practices achieved within the project, program and portfolio domain. Also in application is a concept by Vaidyanathan and Howells (2007) of the Construc-tion Supply Chain Maturity Model (CSCMM). The objective of the CSCM model is to provide a roadmap for members to realise their operational excellence, so that collectively the construction project can realise the benefits of improved performance (Lahti et.al. 2009). Standardised Process Improvement for Construction Enterprises (SPICE) is another maturity model in construction
11Journal of Construction
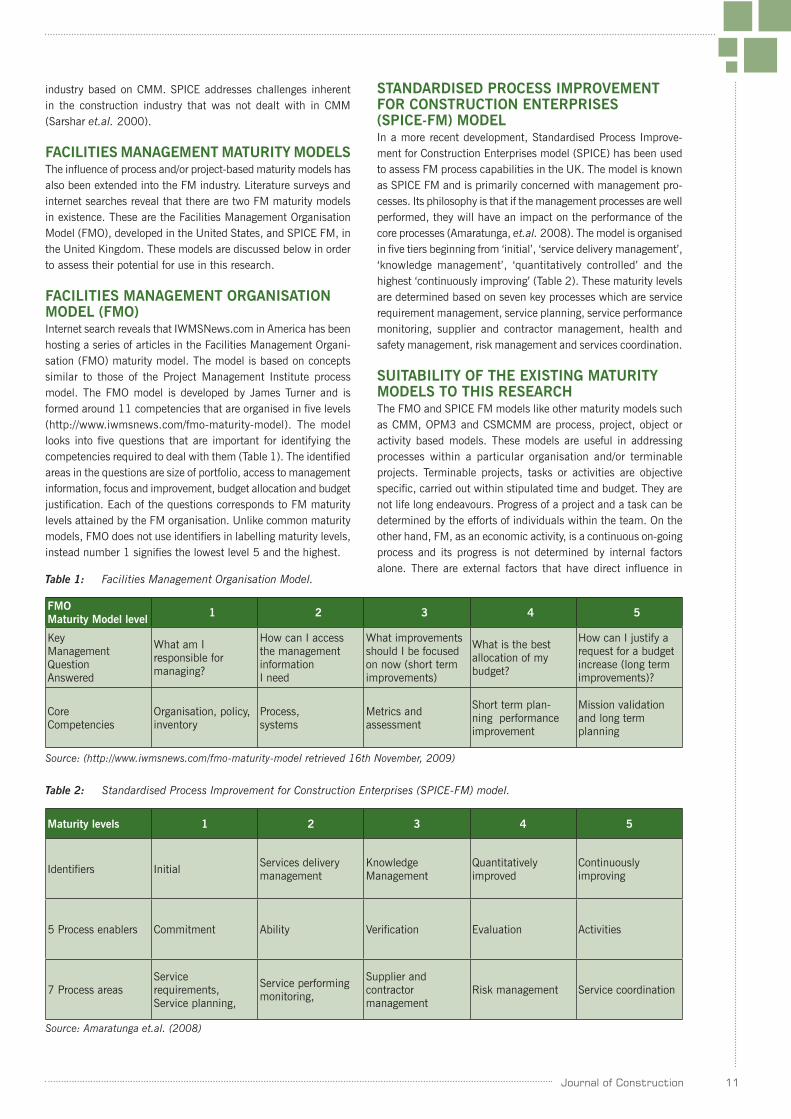
Table 1: Facilities Management Organisation Model.
FMO Maturity Model level 1 2 3 4 5
Key Management Question Answered
What am I responsible for managing?
How can I access the management information I need
What improvements should I be focused on now (short term improvements)
What is the best allocation of my budget?
How can I justify a request for a budget increase (long term improvements)?
Core Competencies
Organisation, policy, inventory
Process, systems
Metrics and assessment
Short term plan-ning performance improvement
Mission validation and long term planning
Source: (http://www.iwmsnews.com/fmo-maturity-model retrieved 16th November, 2009)
Maturity levels 1 2 3 4 5
Identifiers Initial Services delivery management
Knowledge Management
Quantitatively improved
Continuously improving
5 Process enablers Commitment Ability Verification Evaluation Activities
7 Process areasService requirements, Service planning,
Service performing monitoring,
Supplier and contractor management
Risk management Service coordination
Table 2: Standardised Process Improvement for Construction Enterprises (SPICE-FM) model.
Source: Amaratunga et.al. (2008)
industry based on CMM. SPICE addresses challenges inherent in the construction industry that was not dealt with in CMM (Sarshar et.al. 2000).
FACILITIES MANAGEMENT MATURITY MODELSThe influence of process and/or project-based maturity models has also been extended into the FM industry. Literature surveys and internet searches reveal that there are two FM maturity models in existence. These are the Facilities Management Organisation Model (FMO), developed in the United States, and SPICE FM, in the United Kingdom. These models are discussed below in order to assess their potential for use in this research.
FACILITIES MANAGEMENT ORGANISATION MODEL (FMO)Internet search reveals that IWMSNews.com in America has been hosting a series of articles in the Facilities Management Organi-sation (FMO) maturity model. The model is based on concepts similar to those of the Project Management Institute process model. The FMO model is developed by James Turner and is formed around 11 competencies that are organised in five levels (http://www.iwmsnews.com/fmo-maturity-model). The model looks into five questions that are important for identifying the competencies required to deal with them (Table 1). The identified areas in the questions are size of portfolio, access to management information, focus and improvement, budget allocation and budget justification. Each of the questions corresponds to FM maturity levels attained by the FM organisation. Unlike common maturity models, FMO does not use identifiers in labelling maturity levels, instead number 1 signifies the lowest level 5 and the highest.
STANDARDISED PROCESS IMPROVEMENT FOR CONSTRUCTION ENTERPRISES (SPICE-FM) MODELIn a more recent development, Standardised Process Improve-ment for Construction Enterprises model (SPICE) has been used to assess FM process capabilities in the UK. The model is known as SPICE FM and is primarily concerned with management pro-cesses. Its philosophy is that if the management processes are well performed, they will have an impact on the performance of the core processes (Amaratunga, et.al. 2008). The model is organised in five tiers beginning from ‘initial’, ‘service delivery management’, ‘knowledge management’, ‘quantitatively controlled’ and the highest ‘continuously improving’ (Table 2). These maturity levels are determined based on seven key processes which are service requirement management, service planning, service performance monitoring, supplier and contractor management, health and safety management, risk management and services coordination.
SUITABILITY OF THE EXISTING MATURITY MODELS TO THIS RESEARCHThe FMO and SPICE FM models like other maturity models such as CMM, OPM3 and CSMCMM are process, project, object or activity based models. These models are useful in addressing processes within a particular organisation and/or terminable projects. Terminable projects, tasks or activities are objective specific, carried out within stipulated time and budget. They are not life long endeavours. Progress of a project and a task can be determined by the efforts of individuals within the team. On the other hand, FM, as an economic activity, is a continuous on-going process and its progress is not determined by internal factors alone. There are external factors that have direct influence in
12 Journal of Construction
its development and maturity. It is therefore opined that existing maturity models within and from other disciplines and specifically terminable projects, cannot be directly applied to the FM industry, defined in its widest meaning to include not only processes but also external factors (Figure 1). In order to assess the degree of maturity of the FM industry, measures that incorporate and integrate external factors should be adopted. It is evident that process based models concentrate on practice only, which is one of the six factors identified in Figure 1. Concentration of these models into practice (internal provision of services) limits their application in assessing industry maturity especially in a unique industry like FM.
DEVELOPMENT OF FACILITIES MANAGE-MENT INDUSTRY MATURITY FRAMEWORKAs mentioned above, FM is highly localised in terms of solutions to be used in solving a particular problem. There is no one ‘fit all solution’ to FM issues (Atkin and Brooks, 2001). This situation and the fact that it is an amalgamation of various competencies make FM unique when compared to many industries. While understanding of the general principles and global perceptions of management issues may be crucial, it is a local knowledge that may prove to be an important asset. Knowledge about economic climate, market volume, regulatory frameworks, institutional culture, innovation, industry acceptance and availability of trained personnel may provide a highlight of FM developmental status within a country. The question at this moment is; how can FM developmental status be assessed? It has been that existing ma-turity models are biased towards processes and projects may not be used in this study. In responding to the question, this study introduces an Integrated Feeder Factors Framework (I3F) that can be used in assessing maturity levels of FM industry. I3F is a gauge against which FM industries can be compared internally and externally. It is a metric that countries can use to evaluate themselves within the FM development ladder. It is a decision
support tool for countries and business that require or offer FM services. It starts by identifying key factors (feeder factors) from the literature related to facilities management.
IDENTIFICATION OF FEEDER FACTORSStudies related to FM discipline and profession development have been receiving increasing attention in recent years (Ventovuori et.al. 2007). Review of these studies has identified two modalities through which FM industry has developed. In the first modality, the FM industry grows organically (Price, 2004) purely responding to market forces of demand and supply. In this modality government plays a passive role. In the second, apart from market forces, the government and stakeholders joined forces and created initiatives within which the industry is encouraged to grow (Ballesty, 2008). FM development studies have also shed light in identifying the factors that are referred to in this work as ‘feeder factors’.
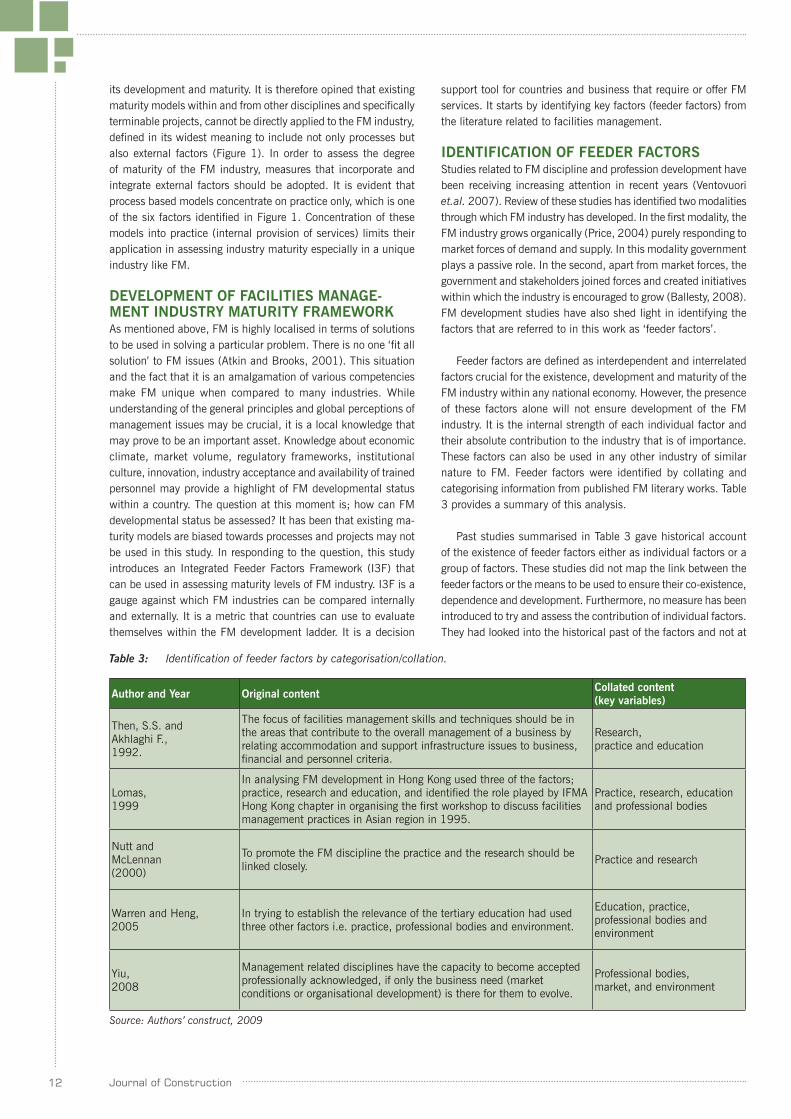
Feeder factors are defined as interdependent and interrelated factors crucial for the existence, development and maturity of the FM industry within any national economy. However, the presence of these factors alone will not ensure development of the FM industry. It is the internal strength of each individual factor and their absolute contribution to the industry that is of importance. These factors can also be used in any other industry of similar nature to FM. Feeder factors were identified by collating and categorising information from published FM literary works. Table 3 provides a summary of this analysis.
Past studies summarised in Table 3 gave historical account of the existence of feeder factors either as individual factors or a group of factors. These studies did not map the link between the feeder factors or the means to be used to ensure their co-existence, dependence and development. Furthermore, no measure has been introduced to try and assess the contribution of individual factors. They had looked into the historical past of the factors and not at
Author and Year Original content Collated content(key variables)
Then, S.S. and Akhlaghi F., 1992.
The focus of facilities management skills and techniques should be in the areas that contribute to the overall management of a business by relating accommodation and support infrastructure issues to business, financial and personnel criteria.
Research, practice and education
Lomas, 1999
In analysing FM development in Hong Kong used three of the factors; practice, research and education, and identified the role played by IFMA Hong Kong chapter in organising the first workshop to discuss facilities management practices in Asian region in 1995.
Practice, research, education and professional bodies
Nutt and McLennan (2000)
To promote the FM discipline the practice and the research should be linked closely. Practice and research
Warren and Heng, 2005
In trying to establish the relevance of the tertiary education had used three other factors i.e. practice, professional bodies and environment.
Education, practice, professional bodies and environment
Yiu, 2008
Management related disciplines have the capacity to become accepted professionally acknowledged, if only the business need (market conditions or organisational development) is there for them to evolve.
Professional bodies, market, and environment
Table 3: Identification of feeder factors by categorisation/collation.
Source: Authors’ construct, 2009
13Journal of Construction
the present or into the future. This study intends to take already established history into the future by analysing the contribution of each individual factor and their potential impact when considered as a ‘feeder chain’ in the developmental growth of FM.
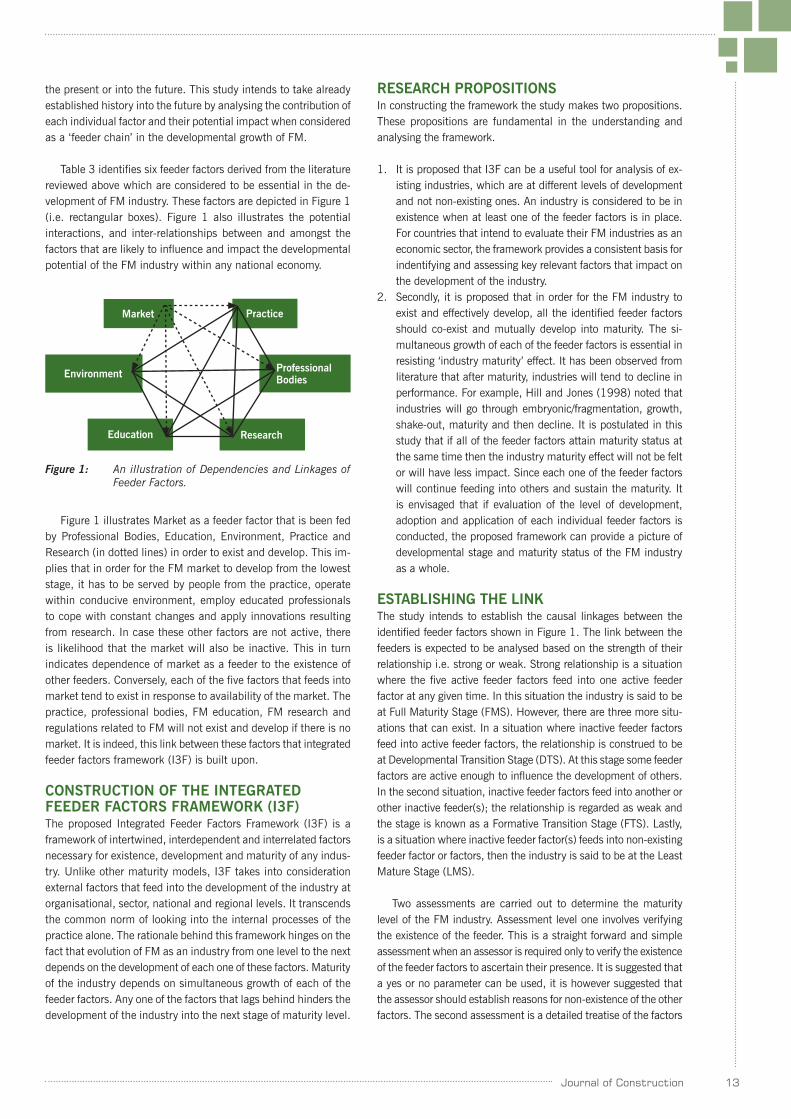
Table 3 identifies six feeder factors derived from the literature reviewed above which are considered to be essential in the de-velopment of FM industry. These factors are depicted in Figure 1 (i.e. rectangular boxes). Figure 1 also illustrates the potential interactions, and inter-relationships between and amongst the factors that are likely to influence and impact the developmental potential of the FM industry within any national economy.
Figure 1: An illustration of Dependencies and Linkages of Feeder Factors.
Figure 1 illustrates Market as a feeder factor that is been fed by Professional Bodies, Education, Environment, Practice and Research (in dotted lines) in order to exist and develop. This im-plies that in order for the FM market to develop from the lowest stage, it has to be served by people from the practice, operate within conducive environment, employ educated professionals to cope with constant changes and apply innovations resulting from research. In case these other factors are not active, there is likelihood that the market will also be inactive. This in turn indicates dependence of market as a feeder to the existence of other feeders. Conversely, each of the five factors that feeds into market tend to exist in response to availability of the market. The practice, professional bodies, FM education, FM research and regulations related to FM will not exist and develop if there is no market. It is indeed, this link between these factors that integrated feeder factors framework (I3F) is built upon.
CONSTRUCTION OF THE INTEGRATED FEEDER FACTORS FRAMEWORK (I3F)The proposed Integrated Feeder Factors Framework (I3F) is a framework of intertwined, interdependent and interrelated factors necessary for existence, development and maturity of any indus-try. Unlike other maturity models, I3F takes into consideration external factors that feed into the development of the industry at organisational, sector, national and regional levels. It transcends the common norm of looking into the internal processes of the practice alone. The rationale behind this framework hinges on the fact that evolution of FM as an industry from one level to the next depends on the development of each one of these factors. Maturity of the industry depends on simultaneous growth of each of the feeder factors. Any one of the factors that lags behind hinders the development of the industry into the next stage of maturity level.
RESEARCH PROPOSITIONSIn constructing the framework the study makes two propositions. These propositions are fundamental in the understanding and analysing the framework.
1. It is proposed that I3F can be a useful tool for analysis of ex-isting industries, which are at different levels of development and not non-existing ones. An industry is considered to be in existence when at least one of the feeder factors is in place. For countries that intend to evaluate their FM industries as an economic sector, the framework provides a consistent basis for indentifying and assessing key relevant factors that impact on the development of the industry.
2. Secondly, it is proposed that in order for the FM industry to exist and effectively develop, all the identified feeder factors should co-exist and mutually develop into maturity. The si-multaneous growth of each of the feeder factors is essential in resisting ‘industry maturity’ effect. It has been observed from literature that after maturity, industries will tend to decline in performance. For example, Hill and Jones (1998) noted that industries will go through embryonic/fragmentation, growth, shake-out, maturity and then decline. It is postulated in this study that if all of the feeder factors attain maturity status at the same time then the industry maturity effect will not be felt or will have less impact. Since each one of the feeder factors will continue feeding into others and sustain the maturity. It is envisaged that if evaluation of the level of development, adoption and application of each individual feeder factors is conducted, the proposed framework can provide a picture of developmental stage and maturity status of the FM industry as a whole.
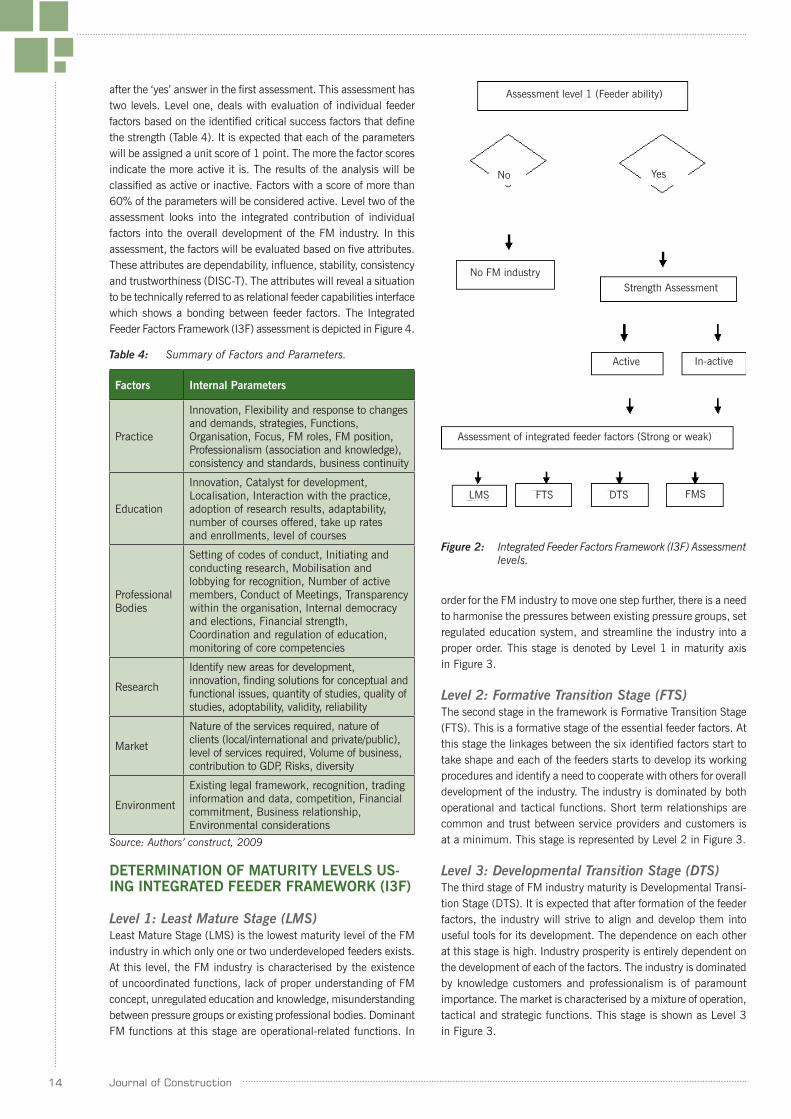
ESTABLISHING THE LINKThe study intends to establish the causal linkages between the identified feeder factors shown in Figure 1. The link between the feeders is expected to be analysed based on the strength of their relationship i.e. strong or weak. Strong relationship is a situation where the five active feeder factors feed into one active feeder factor at any given time. In this situation the industry is said to be at Full Maturity Stage (FMS). However, there are three more situ-ations that can exist. In a situation where inactive feeder factors feed into active feeder factors, the relationship is construed to be at Developmental Transition Stage (DTS). At this stage some feeder factors are active enough to influence the development of others. In the second situation, inactive feeder factors feed into another or other inactive feeder(s); the relationship is regarded as weak and the stage is known as a Formative Transition Stage (FTS). Lastly, is a situation where inactive feeder factor(s) feeds into non-existing feeder factor or factors, then the industry is said to be at the Least Mature Stage (LMS).
Two assessments are carried out to determine the maturity level of the FM industry. Assessment level one involves verifying the existence of the feeder. This is a straight forward and simple assessment when an assessor is required only to verify the existence of the feeder factors to ascertain their presence. It is suggested that a yes or no parameter can be used, it is however suggested that the assessor should establish reasons for non-existence of the other factors. The second assessment is a detailed treatise of the factors
Market
Environment
Education Research
Professional Bodies
Practice
14 Journal of Construction
after the ‘yes’ answer in the first assessment. This assessment has two levels. Level one, deals with evaluation of individual feeder factors based on the identified critical success factors that define the strength (Table 4). It is expected that each of the parameters will be assigned a unit score of 1 point. The more the factor scores indicate the more active it is. The results of the analysis will be classified as active or inactive. Factors with a score of more than 60% of the parameters will be considered active. Level two of the assessment looks into the integrated contribution of individual factors into the overall development of the FM industry. In this assessment, the factors will be evaluated based on five attributes. These attributes are dependability, influence, stability, consistency and trustworthiness (DISC-T). The attributes will reveal a situation to be technically referred to as relational feeder capabilities interface which shows a bonding between feeder factors. The Integrated Feeder Factors Framework (I3F) assessment is depicted in Figure 4.
Table 4: Summary of Factors and Parameters.
Factors Internal Parameters
Practice
Innovation, Flexibility and response to changes and demands, strategies, Functions, Organisation, Focus, FM roles, FM position, Professionalism (association and knowledge), consistency and standards, business continuity
Education
Innovation, Catalyst for development, Localisation, Interaction with the practice, adoption of research results, adaptability, number of courses offered, take up rates and enrollments, level of courses
Professional Bodies
Setting of codes of conduct, Initiating and conducting research, Mobilisation and lobbying for recognition, Number of active members, Conduct of Meetings, Transparency within the organisation, Internal democracy and elections, Financial strength, Coordination and regulation of education, monitoring of core competencies
Research
Identify new areas for development, innovation, finding solutions for conceptual and functional issues, quantity of studies, quality of studies, adoptability, validity, reliability
Market
Nature of the services required, nature of clients (local/international and private/public), level of services required, Volume of business, contribution to GDP, Risks, diversity
Environment
Existing legal framework, recognition, trading information and data, competition, Financial commitment, Business relationship, Environmental considerations
Source: Authors’ construct, 2009
Figure 2: Integrated Feeder Factors Framework (I3F) Assessment levels.
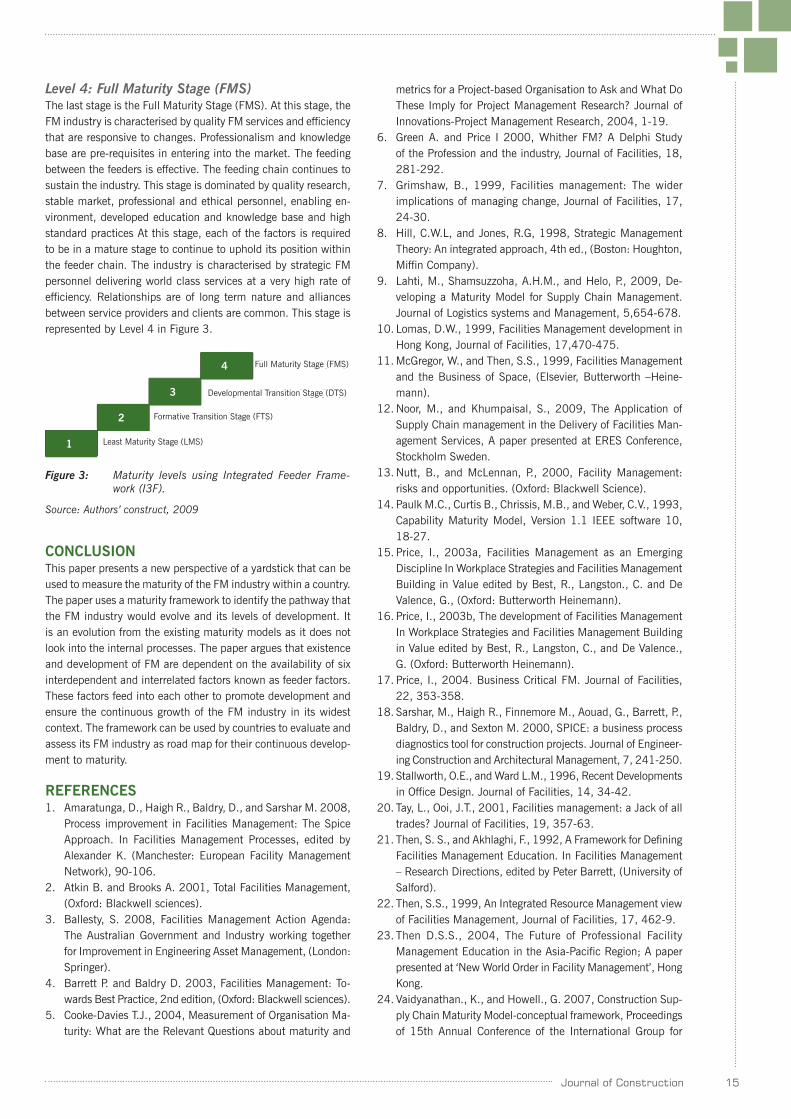
order for the FM industry to move one step further, there is a need to harmonise the pressures between existing pressure groups, set regulated education system, and streamline the industry into a proper order. This stage is denoted by Level 1 in maturity axis in Figure 3.
Level 2: Formative Transition Stage (FTS)The second stage in the framework is Formative Transition Stage (FTS). This is a formative stage of the essential feeder factors. At this stage the linkages between the six identified factors start to take shape and each of the feeders starts to develop its working procedures and identify a need to cooperate with others for overall development of the industry. The industry is dominated by both operational and tactical functions. Short term relationships are common and trust between service providers and customers is at a minimum. This stage is represented by Level 2 in Figure 3.
Level 3: Developmental Transition Stage (DTS)The third stage of FM industry maturity is Developmental Transi-tion Stage (DTS). It is expected that after formation of the feeder factors, the industry will strive to align and develop them into useful tools for its development. The dependence on each other at this stage is high. Industry prosperity is entirely dependent on the development of each of the factors. The industry is dominated by knowledge customers and professionalism is of paramount importance. The market is characterised by a mixture of operation, tactical and strategic functions. This stage is shown as Level 3 in Figure 3.
DETERMINATION OF MATURITY LEVELS US-ING INTEGRATED FEEDER FRAMEWORK (I3F)
Level 1: Least Mature Stage (LMS)Least Mature Stage (LMS) is the lowest maturity level of the FM industry in which only one or two underdeveloped feeders exists. At this level, the FM industry is characterised by the existence of uncoordinated functions, lack of proper understanding of FM concept, unregulated education and knowledge, misunderstanding between pressure groups or existing professional bodies. Dominant FM functions at this stage are operational-related functions. In
Assessment level 1 (Feeder ability)
No FM industryStrength Assessment
Active In-active
Assessment of integrated feeder factors (Strong or weak)
No Yes
LMS FTS DTS FMS
15Journal of Construction
Level 4: Full Maturity Stage (FMS)The last stage is the Full Maturity Stage (FMS). At this stage, the FM industry is characterised by quality FM services and efficiency that are responsive to changes. Professionalism and knowledge base are pre-requisites in entering into the market. The feeding between the feeders is effective. The feeding chain continues to sustain the industry. This stage is dominated by quality research, stable market, professional and ethical personnel, enabling en-vironment, developed education and knowledge base and high standard practices At this stage, each of the factors is required to be in a mature stage to continue to uphold its position within the feeder chain. The industry is characterised by strategic FM personnel delivering world class services at a very high rate of efficiency. Relationships are of long term nature and alliances between service providers and clients are common. This stage is represented by Level 4 in Figure 3.
CONCLUSIONThis paper presents a new perspective of a yardstick that can be used to measure the maturity of the FM industry within a country. The paper uses a maturity framework to identify the pathway that the FM industry would evolve and its levels of development. It is an evolution from the existing maturity models as it does not look into the internal processes. The paper argues that existence and development of FM are dependent on the availability of six interdependent and interrelated factors known as feeder factors. These factors feed into each other to promote development and ensure the continuous growth of the FM industry in its widest context. The framework can be used by countries to evaluate and assess its FM industry as road map for their continuous develop-ment to maturity.
REFERENCES1. Amaratunga, D., Haigh R., Baldry, D., and Sarshar M. 2008,
Process improvement in Facilities Management: The Spice Approach. In Facilities Management Processes, edited by Alexander K. (Manchester: European Facility Management Network), 90-106.
2. Atkin B. and Brooks A. 2001, Total Facilities Management, (Oxford: Blackwell sciences).
3. Ballesty, S. 2008, Facilities Management Action Agenda: The Australian Government and Industry working together for Improvement in Engineering Asset Management, (London: Springer).
4. Barrett P. and Baldry D. 2003, Facilities Management: To-wards Best Practice, 2nd edition, (Oxford: Blackwell sciences).
5. Cooke-Davies T.J., 2004, Measurement of Organisation Ma-turity: What are the Relevant Questions about maturity and
Figure 3: Maturity levels using Integrated Feeder Frame- work (I3F).
Source: Authors’ construct, 2009
metrics for a Project-based Organisation to Ask and What Do These Imply for Project Management Research? Journal of Innovations-Project Management Research, 2004, 1-19.
6. Green A. and Price I 2000, Whither FM? A Delphi Study of the Profession and the industry, Journal of Facilities, 18, 281-292.
7. Grimshaw, B., 1999, Facilities management: The wider implications of managing change, Journal of Facilities, 17, 24-30.
8. Hill, C.W.L, and Jones, R.G, 1998, Strategic Management Theory: An integrated approach, 4th ed., (Boston: Houghton, Miffin Company).
9. Lahti, M., Shamsuzzoha, A.H.M., and Helo, P., 2009, De-veloping a Maturity Model for Supply Chain Management. Journal of Logistics systems and Management, 5,654-678.
10. Lomas, D.W., 1999, Facilities Management development in Hong Kong, Journal of Facilities, 17,470-475.
11. McGregor, W., and Then, S.S., 1999, Facilities Management and the Business of Space, (Elsevier, Butterworth –Heine-mann).
12. Noor, M., and Khumpaisal, S., 2009, The Application of Supply Chain management in the Delivery of Facilities Man-agement Services, A paper presented at ERES Conference, Stockholm Sweden.
13. Nutt, B., and McLennan, P., 2000, Facility Management: risks and opportunities. (Oxford: Blackwell Science).
14. Paulk M.C., Curtis B., Chrissis, M.B., and Weber, C.V., 1993, Capability Maturity Model, Version 1.1 IEEE software 10, 18-27.
15. Price, I., 2003a, Facilities Management as an Emerging Discipline In Workplace Strategies and Facilities Management Building in Value edited by Best, R., Langston., C. and De Valence, G., (Oxford: Butterworth Heinemann).
16. Price, I., 2003b, The development of Facilities Management In Workplace Strategies and Facilities Management Building in Value edited by Best, R., Langston, C., and De Valence., G. (Oxford: Butterworth Heinemann).
17. Price, I., 2004. Business Critical FM. Journal of Facilities, 22, 353-358.
18. Sarshar, M., Haigh R., Finnemore M., Aouad, G., Barrett, P., Baldry, D., and Sexton M. 2000, SPICE: a business process diagnostics tool for construction projects. Journal of Engineer-ing Construction and Architectural Management, 7, 241-250.
19. Stallworth, O.E., and Ward L.M., 1996, Recent Developments in Office Design. Journal of Facilities, 14, 34-42.
20. Tay, L., Ooi, J.T., 2001, Facilities management: a Jack of all trades? Journal of Facilities, 19, 357-63.
21. Then, S. S., and Akhlaghi, F., 1992, A Framework for Defining Facilities Management Education. In Facilities Management – Research Directions, edited by Peter Barrett, (University of Salford).
22. Then, S.S., 1999, An Integrated Resource Management view of Facilities Management, Journal of Facilities, 17, 462-9.
23. Then D.S.S., 2004, The Future of Professional Facility Management Education in the Asia-Pacific Region; A paper presented at ‘New World Order in Facility Management’, Hong Kong.
24. Vaidyanathan., K., and Howell., G. 2007, Construction Sup-ply Chain Maturity Model-conceptual framework, Proceedings of 15th Annual Conference of the International Group for
1
2
3
4 Full Maturity Stage (FMS)
Developmental Transition Stage (DTS)
Formative Transition Stage (FTS)
Least Maturity Stage (LMS)
16 Journal of Construction
Lean Construction (IGLC)-15, East Lansing, Michigan, USA, 170-180.
25. Ventovuori, T., Lehtonen, T., Salonen, A., and Nenonen S., 2007, A Review and Classification of Academic Research in Facilities Management, Journal of Facilities, 25, 227-237.
26. Warren, C.M.J., and Heng, S.H.K., 2005, FM Education are we meeting industry needs? A paper presented in Pacific Rim Real Estate Society Conference, Melbourne, Australia.
27. www.IWMSNews.com/FMNotes from the field. Retrieved on 20th October, 2009.
28. Yiu, C.Y.(2008). A conceptual link among facilities man-agement, strategic management and Project management. Journal of Facilities, 26, 501-511.
17Journal of Construction
ABSTRACTPurpose: Despite extensive research on risk management in the construction industry, there is limited literature dealing specifi-cally with the identification of barriers to the deployment of risk assessment and management practices in developing countries. This paper examines the barriers to the implementation of risk assessment and management practices.
Design/Methodology/Approach: The research explored these barriers of risk assessment and management practices, using an opinion survey approach to collect data from 103 professionals (representing clients, consultants and contractors) in the Ghanaian construction industry. Response data was subjected to descriptive statistics and subsequently analysis of variance (ANOVA) and other non-parametric tests were used to examine the differences in the identification of the barriers.
Findings: Significant differences were found between the per-ceptions of these sub-groups for the barriers to risk assessment and management practices in the following: lack of experience; and lack of information. The clients rated ‘lack of experience’ higher than the contractors and consultants while the consultants found the ‘lack of information’ barrier as more significant than the contractors. There was also disparity in the ranking of the seven barriers among the sub-groups.
Originality/Value: This research is part of a large project focusing on the understanding of risk assessment and manage-ment practices issues impacting on the project performance of the Ghanaian construction industry. This paper contributes to the understanding of the barriers facing the stakeholders in deploying risk assessment and management practices. It also establishes a number of managerial implications in that the identified barriers could be used in the decision making process thus enabling the development of a ‘road map’ for the successful implementation of risk assessment and management processes in Ghana. The study also expands the effort of studying and evaluating barri-ers across the developing economies and particularly within the African context.
KEYWORDSConstruction industry, barriers, risk management, developing countries
PERCEPTION OF BARRIERS TO RISK ASSESSMENT AND MANAGEMENT
PRACTICES (RAMP) DEPLOYMENT
OPINION SURVEY FINDINGSAdwoa Agyakwa-Baah
Postgraduate, Sheffield Hallam University, Built Environment Division, Sheffield, United Kingdom, email: [email protected]
Dr Nicholas ChilesheSenior Lecturer, Research Education Portfolio Leader, University of South Australia,School of Natural and Built
Environments, Institute for Sustainable Systems and Technologies, City East Campus Adelaide, Australia, email: [email protected] [corresponding author]
Rev. Dr Frank. D.K. FugarDean, Faculty of Arrchitecture and Building Technology, College of Architecture, Kwame Nkrumah University of Science
and Technology (KNUST), Kumasi, Ghana, email: [email protected]
INTRODUCTIONThe construction industry in Ghana has been growing steadily over the years. The Government’s objective in the Ghana Poverty Reduction Strategy (GPRS II) to promote urban infrastructure development and the provision of basic services including in-creased access to safe, decent and affordable shelter has given the industry a further boost. Ghana seeks to be the gateway to West Africa and the champion of African excellence. The 2008 Budget Statement of Ghana projected the construction industry to grow by 11.0 percent, exceeding the 10.0 percent target for the year. This statement attributes the growth to the increased road construction and other infrastructural development through-out the country. According to the World Bank (2003) report, the annual value of public procurement for goods, works and consultant services represents about 10% of Ghana’s Gross Do-mestic Product. Despite the noted contribution of the Ghanaian construction industry to economic growth and development, it is still fraught with frequent cost overruns and delays on a lot of projects. The above observation calls for the further exploration into the possible implementation issues of risk assessment and management techniques on construction projects executed in Ghana. For example, how many construction organisations in Ghana currently implement risk assessment and management techniques? If there are, what are the barriers to the deployment of Risk Assessment and Management Practices (RAMP)? Can the level of RAMP deployment be assessed? Thus, based on the analysis of past research, the main objectives of this paper are as follows:
(1) To identify the barriers to RAMP in the Ghanian construction sector; and
(2) To examine whether differences exist in the perceptions of the barriers by the construction professionals working with the 3 groups of respondents (clients, contractors and consultants).
LITERATURE REVIEW ON BARRIERS TO RAMPSLiterature review indicates several studies have examined the antecedents to risk management practices (Mok et.al., 1997; Akintoye and MacLeod, 1997; Frimpong et.al., 2003; Ayirebi-Dansoh, 2005; Hassanein and Affify, 2007; Osburn, 2008; Luu et.al., 2008). However, despite the proliferation of such
18 Journal of Construction
studies, very few have been within the African context, particu-larly Ghana. Against, this background, this study collected and compiled seven barriers to the implementation or risk assessment and management practices as drawn from both developing and developed economics. These are as follows: (BR1) awareness of risk management processes; (BR2) lack of experience; (BR3) lack of co-ordination between parties involved; (BR4) lack of in-formation; (BR5) availability of specialist risk consultants; (BR6) time constraints; and (BR7) implementation cost. Within the concept of benchmarking, Deros et.al., (2006) defined critical success factors (CSFs) as a range of enablers which, when put into practice will enhance the chance for successful benchmark-ing implementation and adoption in an organisation. Drawing heavily on Deros et.al., (2006) definition of CSFs, within the context of this study, barriers are defined as factors inhibiting the successful risk assessment and management practices implementation. The following section briefly describes some of these studies and the barriers as adopted within this study.
LACK OF AWARENESS OF RISK MANAGEMENT PROCESSESLack of awareness of risk management processes has been identified as leading to poor resource management (Frimpong et.al., 2003). According to Frimpong et.al., (2003), project management tools and techniques play an important role in the effective management of a project. Dada and Jagboro (2007) examined the impact of risk on project cost overrun in the Nige-rian construction industry and identified improper assessment of risk factors as a contributory factor to ineffective project delivery. Manelele and Muya (2008) also found lack of technical advice as one of the project initiation risks affecting community based projects in Zambia. Some of the earlier studies such as Akintoye and MacLeod (1997) also identified lack of familiarity with the techniques as one of the reasons provided by contractors for not using techniques of risk analysis and management. Mok et.al. (1997) identified ‘managers’ understanding of risk management techniques’ as one of the top problems needed to be overcome.
LACK OF EXPERIENCEWang et.al. (2010) in their quest to improve risk-based decision making, investigated the critical factors affecting contractor’ risk attitudes in construction projects in China. The study highlighted the importance of ascertaining the construction experience and professional background of the respondents during the risk deci-sion making process as due to the varying perceptions of risks as established by Wang & Yuan (2010) who found that factors such as early experience and education background (among others) led decision makers to perceive risk differently. Within the context of Ghana, Agyakwa-Baah (2009) and Agyakwa-Baah and Chileshe (2010) established that despite the industry being composed of professionals with more than five years of experience, the level of risk management awareness and implementation was still low. It could also be argued that lack of experience limits the management capability, which in turn can have an impact on time and cost performance of building projects as established by Aje et.al., (2009). Hassanein and Affify (2007) evaluated the risks relevant to construction contracts among Egyptian international and local contractors and found limited project management experience among the local contractors as one of the barriers to the identification of risks.
LACK OF CO-ORDINATION BETWEEN PARTIES INVOLVEDCo-ordination between parties involved in the construction process should be based on a co-operative culture. This culture can be defined as an environment where team members are able to work or act together or jointly for a common purpose or benefit. Osburn (2008) assert that co-operate culture has the potential to make the organisation more than the sum of its parts. Lack of com-munication amongst team members is a risk factor as observed by Tchankova (2002) that changes in people’s values, human behaviour and state of social structure are another source of risk. According to Carter (1986), the parties within the construction industry represent different professions and their multidisciplinary skills limit the scope of co-operation between them. Projects rely on clients, consultants, contractors amongst other stakeholders. Lester (2007) acknowledged that relationships to the project by stakeholders can vary from being very supportive to antagonistic but added that this needs to be managed effectively so that it does not have any effect on the project. It is essential that for each project, communication and team work is encouraged. Yang et.al. (2009) observe that successful relationships between the project and its stakeholders are vital for successful delivery of projects and meeting stakeholder expectations. Other studies such as Santoso et.al. (2003) have highlighted the importance of communication between the project teams as being essential to the successful completion of the project. However, this barrier is difficult to overcome as noted by Dey and Ogunlana (2004) that the stakeholders (people) within the construction industry usually have different interests, so co-ordinating project goals is very difficult
LACK OF INFORMATIONLack of information among the project participants has often being regarded as a source of risk. This has the potential of leading to design changes and often contributes as a source of claims. The type of information that might be required to carry out the risk management processes includes understanding of scope of work and site environment, client planning supervisor’s risk schedule and other stakeholder; risk both known and perceived (Agyakwa et.al., 2010)
AVAILABILITY OF SPECIALIST RISK MANAGEMENT CONSULTANTSWithin Ghana, Agyakwa-Baah (2009) established that risk man-agement specialist are not readily available and are unpopular. The study recommended the need to publicise the importance of the specialist risk management consultants.
TIME CONSTRAINTS AND IMPLEMENTATION COSTMok et.al., (1997) identified ‘time involvement’ and ‘cost-justi-fication of risk management process techniques’ as some of the inherent and implementation problems encountered.
RESEARCH METHODOLOGYTo identify the barriers to risk assessment and management practices deployment within the Ghanaian construction sector, the following specific methodology of this study based on literature review, a pilot study and a questionnaire survey was employed to ensure a robust methodological design (Edwards and Holt, 2010).
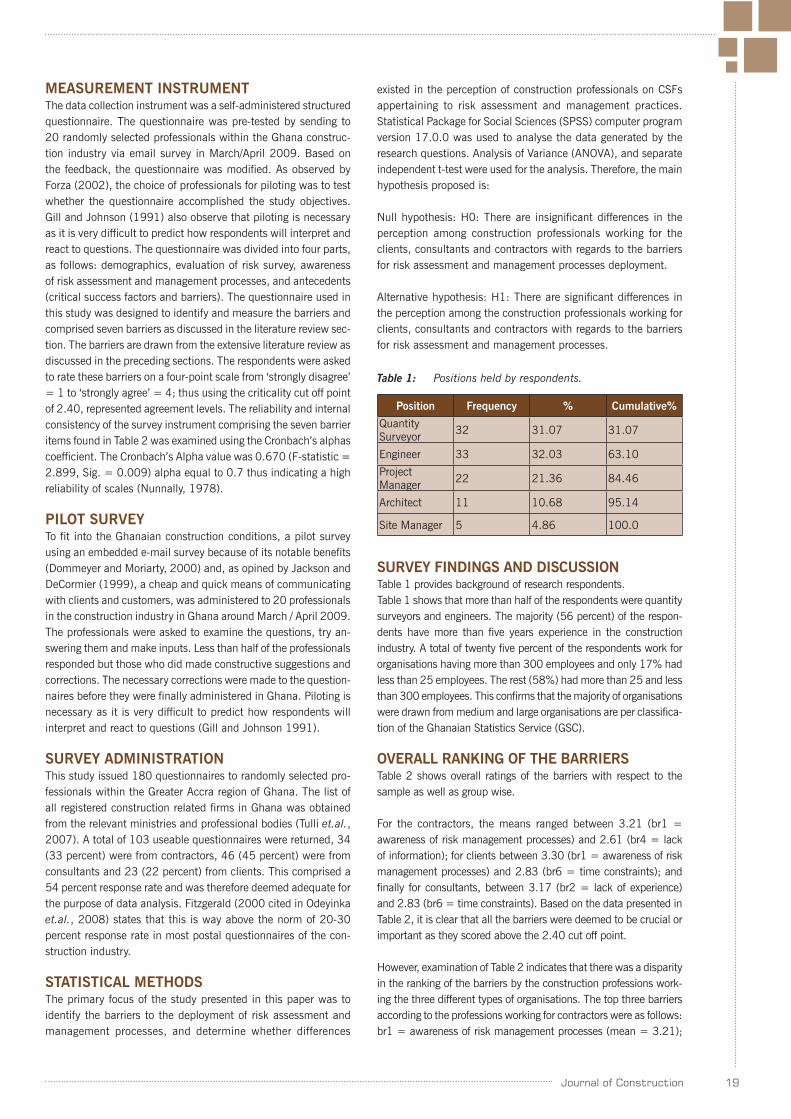
19Journal of Construction
MEASUREMENT INSTRUMENTThe data collection instrument was a self-administered structured questionnaire. The questionnaire was pre-tested by sending to 20 randomly selected professionals within the Ghana construc-tion industry via email survey in March/April 2009. Based on the feedback, the questionnaire was modified. As observed by Forza (2002), the choice of professionals for piloting was to test whether the questionnaire accomplished the study objectives. Gill and Johnson (1991) also observe that piloting is necessary as it is very difficult to predict how respondents will interpret and react to questions. The questionnaire was divided into four parts, as follows: demographics, evaluation of risk survey, awareness of risk assessment and management processes, and antecedents (critical success factors and barriers). The questionnaire used in this study was designed to identify and measure the barriers and comprised seven barriers as discussed in the literature review sec-tion. The barriers are drawn from the extensive literature review as discussed in the preceding sections. The respondents were asked to rate these barriers on a four-point scale from ‘strongly disagree’ = 1 to ‘strongly agree’ = 4; thus using the criticality cut off point of 2.40, represented agreement levels. The reliability and internal consistency of the survey instrument comprising the seven barrier items found in Table 2 was examined using the Cronbach’s alphas coefficient. The Cronbach’s Alpha value was 0.670 (F-statistic = 2.899, Sig. = 0.009) alpha equal to 0.7 thus indicating a high reliability of scales (Nunnally, 1978).
PILOT SURVEYTo fit into the Ghanaian construction conditions, a pilot survey using an embedded e-mail survey because of its notable benefits (Dommeyer and Moriarty, 2000) and, as opined by Jackson and DeCormier (1999), a cheap and quick means of communicating with clients and customers, was administered to 20 professionals in the construction industry in Ghana around March / April 2009. The professionals were asked to examine the questions, try an-swering them and make inputs. Less than half of the professionals responded but those who did made constructive suggestions and corrections. The necessary corrections were made to the question-naires before they were finally administered in Ghana. Piloting is necessary as it is very difficult to predict how respondents will interpret and react to questions (Gill and Johnson 1991).
SURVEY ADMINISTRATIONThis study issued 180 questionnaires to randomly selected pro-fessionals within the Greater Accra region of Ghana. The list of all registered construction related firms in Ghana was obtained from the relevant ministries and professional bodies (Tulli et.al., 2007). A total of 103 useable questionnaires were returned, 34 (33 percent) were from contractors, 46 (45 percent) were from consultants and 23 (22 percent) from clients. This comprised a 54 percent response rate and was therefore deemed adequate for the purpose of data analysis. Fitzgerald (2000 cited in Odeyinka et.al., 2008) states that this is way above the norm of 20-30 percent response rate in most postal questionnaires of the con-struction industry.
STATISTICAL METHODSThe primary focus of the study presented in this paper was to identify the barriers to the deployment of risk assessment and management processes, and determine whether differences
existed in the perception of construction professionals on CSFs appertaining to risk assessment and management practices. Statistical Package for Social Sciences (SPSS) computer program version 17.0.0 was used to analyse the data generated by the research questions. Analysis of Variance (ANOVA), and separate independent t-test were used for the analysis. Therefore, the main hypothesis proposed is:
Null hypothesis: H0: There are insignificant differences in the perception among construction professionals working for the clients, consultants and contractors with regards to the barriers for risk assessment and management processes deployment.
Alternative hypothesis: H1: There are significant differences in the perception among the construction professionals working for clients, consultants and contractors with regards to the barriers for risk assessment and management processes.
SURVEY FINDINGS AND DISCUSSIONTable 1 provides background of research respondents.Table 1 shows that more than half of the respondents were quantity surveyors and engineers. The majority (56 percent) of the respon-dents have more than five years experience in the construction industry. A total of twenty five percent of the respondents work for organisations having more than 300 employees and only 17% had less than 25 employees. The rest (58%) had more than 25 and less than 300 employees. This confirms that the majority of organisations were drawn from medium and large organisations are per classifica-tion of the Ghanaian Statistics Service (GSC).
OVERALL RANKING OF THE BARRIERSTable 2 shows overall ratings of the barriers with respect to the sample as well as group wise.
For the contractors, the means ranged between 3.21 (br1 = awareness of risk management processes) and 2.61 (br4 = lack of information); for clients between 3.30 (br1 = awareness of risk management processes) and 2.83 (br6 = time constraints); and finally for consultants, between 3.17 (br2 = lack of experience) and 2.83 (br6 = time constraints). Based on the data presented in Table 2, it is clear that all the barriers were deemed to be crucial or important as they scored above the 2.40 cut off point.
However, examination of Table 2 indicates that there was a disparity in the ranking of the barriers by the construction professions work-ing the three different types of organisations. The top three barriers according to the professions working for contractors were as follows: br1 = awareness of risk management processes (mean = 3.21);
Table 1: Positions held by respondents.
Position Frequency % Cumulative%
Quantity Surveyor 32 31.07 31.07
Engineer 33 32.03 63.10
Project Manager 22 21.36 84.46
Architect 11 10.68 95.14
Site Manager 5 4.86 100.0
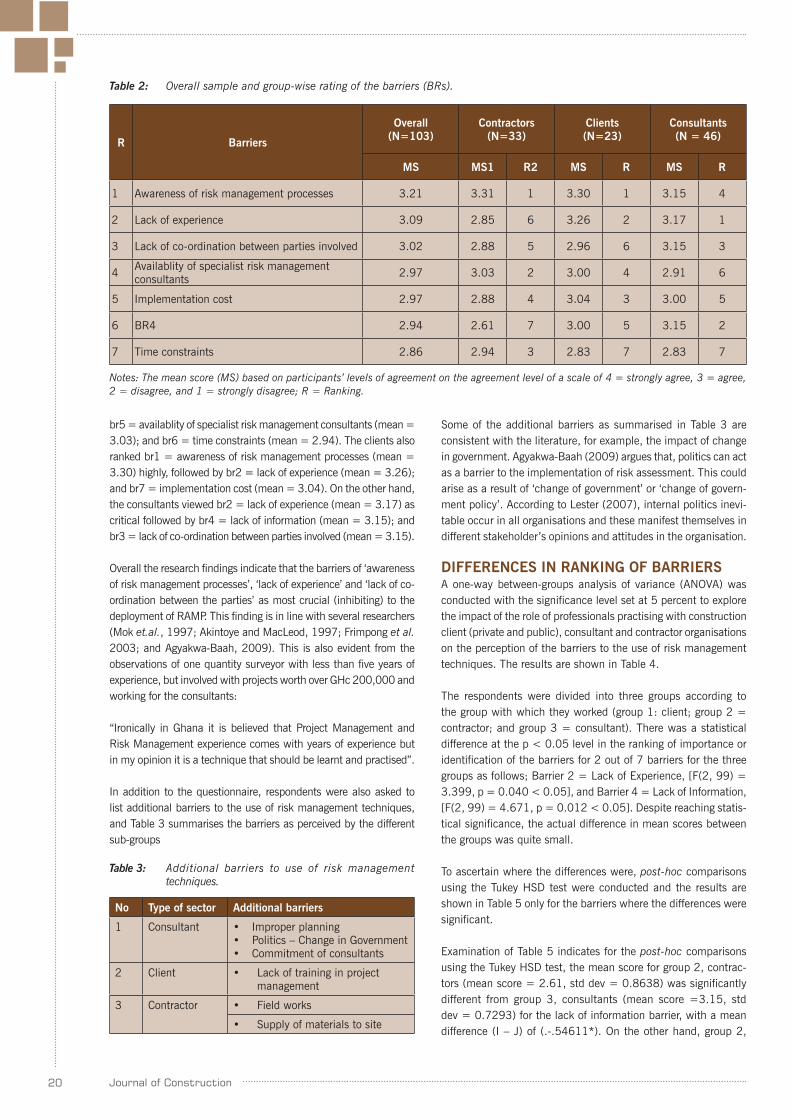
20 Journal of Construction
R Barriers
Overall(N=103)
Contractors(N=33)
Clients(N=23)
Consultants(N = 46)
MS MS1 R2 MS R MS R
1 Awareness of risk management processes 3.21 3.31 1 3.30 1 3.15 4
2 Lack of experience 3.09 2.85 6 3.26 2 3.17 1
3 Lack of co-ordination between parties involved 3.02 2.88 5 2.96 6 3.15 3
4 Availablity of specialist risk management consultants 2.97 3.03 2 3.00 4 2.91 6
5 Implementation cost 2.97 2.88 4 3.04 3 3.00 5
6 BR4 2.94 2.61 7 3.00 5 3.15 2
7 Time constraints 2.86 2.94 3 2.83 7 2.83 7
Table 2: Overall sample and group-wise rating of the barriers (BRs).
br5 = availablity of specialist risk management consultants (mean = 3.03); and br6 = time constraints (mean = 2.94). The clients also ranked br1 = awareness of risk management processes (mean = 3.30) highly, followed by br2 = lack of experience (mean = 3.26); and br7 = implementation cost (mean = 3.04). On the other hand, the consultants viewed br2 = lack of experience (mean = 3.17) as critical followed by br4 = lack of information (mean = 3.15); and br3 = lack of co-ordination between parties involved (mean = 3.15).
Overall the research findings indicate that the barriers of ‘awareness of risk management processes’, ‘lack of experience’ and ‘lack of co-ordination between the parties’ as most crucial (inhibiting) to the deployment of RAMP. This finding is in line with several researchers (Mok et.al., 1997; Akintoye and MacLeod, 1997; Frimpong et al. 2003; and Agyakwa-Baah, 2009). This is also evident from the observations of one quantity surveyor with less than five years of experience, but involved with projects worth over GHc 200,000 and working for the consultants:
“Ironically in Ghana it is believed that Project Management and Risk Management experience comes with years of experience but in my opinion it is a technique that should be learnt and practised”.
In addition to the questionnaire, respondents were also asked to list additional barriers to the use of risk management techniques, and Table 3 summarises the barriers as perceived by the different sub-groups
Some of the additional barriers as summarised in Table 3 are consistent with the literature, for example, the impact of change in government. Agyakwa-Baah (2009) argues that, politics can act as a barrier to the implementation of risk assessment. This could arise as a result of ‘change of government’ or ‘change of govern-ment policy’. According to Lester (2007), internal politics inevi-table occur in all organisations and these manifest themselves in different stakeholder’s opinions and attitudes in the organisation.
DIFFERENCES IN RANKING OF BARRIERSA one-way between-groups analysis of variance (ANOVA) was conducted with the significance level set at 5 percent to explore the impact of the role of professionals practising with construction client (private and public), consultant and contractor organisations on the perception of the barriers to the use of risk management techniques. The results are shown in Table 4.
The respondents were divided into three groups according to the group with which they worked (group 1: client; group 2 = contractor; and group 3 = consultant). There was a statistical difference at the p < 0.05 level in the ranking of importance or identification of the barriers for 2 out of 7 barriers for the three groups as follows; Barrier 2 = Lack of Experience, [F(2, 99) = 3.399, p = 0.040 < 0.05], and Barrier 4 = Lack of Information, [F(2, 99) = 4.671, p = 0.012 < 0.05]. Despite reaching statis-tical significance, the actual difference in mean scores between the groups was quite small.
To ascertain where the differences were, post-hoc comparisons using the Tukey HSD test were conducted and the results are shown in Table 5 only for the barriers where the differences were significant.
Examination of Table 5 indicates for the post-hoc comparisons using the Tukey HSD test, the mean score for group 2, contrac-tors (mean score = 2.61, std dev = 0.8638) was significantly different from group 3, consultants (mean score =3.15, std dev = 0.7293) for the lack of information barrier, with a mean difference (I – J) of (.-.54611*). On the other hand, group 2,
Table 3: Additional barriers to use of risk management techniques.
No Type of sector Additional barriers
1 Consultant • Improper planning• Politics – Change in Government• Commitment of consultants
2 Client • Lack of training in project management
3 Contractor • Field works
• Supply of materials to site
Notes: The mean score (MS) based on participants’ levels of agreement on the agreement level of a scale of 4 = strongly agree, 3 = agree, 2 = disagree, and 1 = strongly disagree; R = Ranking.

21Journal of Construction
Barrier Sum of squares df Mean square F-value Sig
Awareness of risk management processes
Between groups 0.357 2 0.178 0.366 0.695
Within groups 48.319 99 0.488
Total 48.676 101
Lack of experience
Between groups 2.920 2 1.460 3.339 0.040*
Within groups 43.286 99 0.437
Total 46.206 101
Lack of co-ordination between parties involved
Between groups 1.554 2 0.777 1.317 0.273
Within groups 58.406 99 0.590
Total 59.961 101
Availability of specialist risk management consultant
Between groups 0.290 2 0.145 0.209 0.812
Within groups 68.622 99 0.693
Total 68.912 101
Implementation cost
Between groups 0.440 2 0.220 0.415 0.661
Within groups 52.472 99 0.530
Total 52.912 101
Lack of information
Between groups 5.833 2 2.917 4.671 0.012*
Within groups 61.814 99 0.624
Total 67.647 101
Time constraints
Between groups 0.287 2 0.143 0.274 0.761
Within groups 51.792 99 0.523
Total 52.078 101
Table 4: Overall sample and group-wise rating of the barriers (BRs).
Notes:* Significant difference at 95 percent confidence level.
Table 5: Multiple comparisons –Turkey HSD.
Barrier
(I) Which party in the construction industry do you
work with?
(J) Which party in the construction industry do you
work with?
Mean Difference(I – J) Std. Error Sig.
Lack of experience Contractor Consultant -0.32543 0.15085 0.084
Client -0.41238 0.17961 0.061
Consultant Contractor 0.32543 0.15085 0.084
Client -0.08696 0.16886 0.864
Client Contractor 0.41238 0.17961 0.061
Consultant 0.08696 0.16886 0.864
Lack of information Contractor Consultant -0.54611* 0.18026 0.009
Client -0.39394 0.21463 0.163
Consultant Contractor -0.54611* 0.18026 0.009
Client 0.15217 0.20179 0.732
Client Contractor 0.39394 0.21463 0.163
Consultant -0.15217 0.20179 0.732
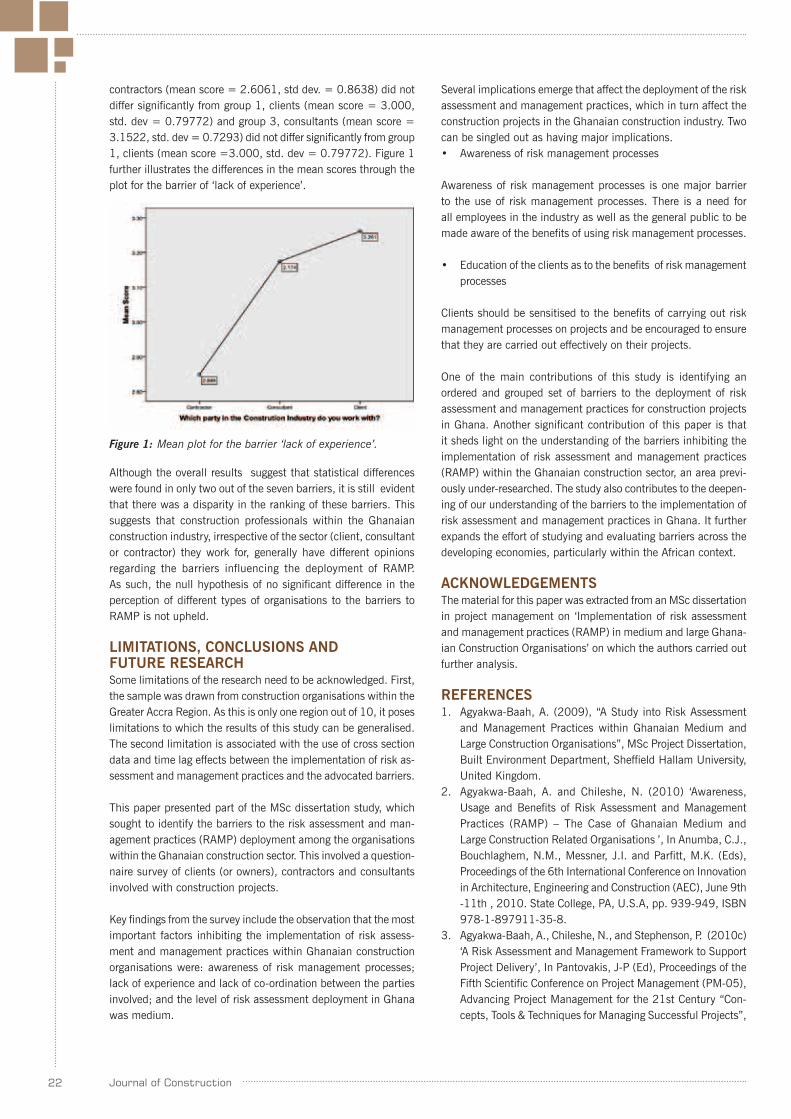
22 Journal of Construction
contractors (mean score = 2.6061, std dev. = 0.8638) did not differ significantly from group 1, clients (mean score = 3.000, std. dev = 0.79772) and group 3, consultants (mean score = 3.1522, std. dev = 0.7293) did not differ significantly from group 1, clients (mean score =3.000, std. dev = 0.79772). Figure 1 further illustrates the differences in the mean scores through the plot for the barrier of ‘lack of experience’.
Several implications emerge that affect the deployment of the risk assessment and management practices, which in turn affect the construction projects in the Ghanaian construction industry. Two can be singled out as having major implications.• Awareness of risk management processes
Awareness of risk management processes is one major barrier to the use of risk management processes. There is a need for all employees in the industry as well as the general public to be made aware of the benefits of using risk management processes.
• Education of the clients as to the benefits of risk management processes
Clients should be sensitised to the benefits of carrying out risk management processes on projects and be encouraged to ensure that they are carried out effectively on their projects.
One of the main contributions of this study is identifying an ordered and grouped set of barriers to the deployment of risk assessment and management practices for construction projects in Ghana. Another significant contribution of this paper is that it sheds light on the understanding of the barriers inhibiting the implementation of risk assessment and management practices (RAMP) within the Ghanaian construction sector, an area previ-ously under-researched. The study also contributes to the deepen-ing of our understanding of the barriers to the implementation of risk assessment and management practices in Ghana. It further expands the effort of studying and evaluating barriers across the developing economies, particularly within the African context.
ACKNOWLEDGEMENTSThe material for this paper was extracted from an MSc dissertation in project management on ‘Implementation of risk assessment and management practices (RAMP) in medium and large Ghana-ian Construction Organisations’ on which the authors carried out further analysis.
REFERENCES1. Agyakwa-Baah, A. (2009), “A Study into Risk Assessment
and Management Practices within Ghanaian Medium and Large Construction Organisations”, MSc Project Dissertation, Built Environment Department, Sheffield Hallam University, United Kingdom.
2. Agyakwa-Baah, A. and Chileshe, N. (2010) ‘Awareness, Usage and Benefits of Risk Assessment and Management Practices (RAMP) – The Case of Ghanaian Medium and Large Construction Related Organisations ’, In Anumba, C.J., Bouchlaghem, N.M., Messner, J.I. and Parfitt, M.K. (Eds), Proceedings of the 6th International Conference on Innovation in Architecture, Engineering and Construction (AEC), June 9th -11th , 2010. State College, PA, U.S.A, pp. 939-949, ISBN 978-1-897911-35-8.
3. Agyakwa-Baah, A., Chileshe, N., and Stephenson, P. (2010c) ‘A Risk Assessment and Management Framework to Support Project Delivery’, In Pantovakis, J-P (Ed), Proceedings of the Fifth Scientific Conference on Project Management (PM-05), Advancing Project Management for the 21st Century “Con-cepts, Tools & Techniques for Managing Successful Projects”,
Although the overall results suggest that statistical differences were found in only two out of the seven barriers, it is still evident that there was a disparity in the ranking of these barriers. This suggests that construction professionals within the Ghanaian construction industry, irrespective of the sector (client, consultant or contractor) they work for, generally have different opinions regarding the barriers influencing the deployment of RAMP. As such, the null hypothesis of no significant difference in the perception of different types of organisations to the barriers to RAMP is not upheld.
LIMITATIONS, CONCLUSIONS AND FUTURE RESEARCHSome limitations of the research need to be acknowledged. First, the sample was drawn from construction organisations within the Greater Accra Region. As this is only one region out of 10, it poses limitations to which the results of this study can be generalised. The second limitation is associated with the use of cross section data and time lag effects between the implementation of risk as-sessment and management practices and the advocated barriers.
This paper presented part of the MSc dissertation study, which sought to identify the barriers to the risk assessment and man-agement practices (RAMP) deployment among the organisations within the Ghanaian construction sector. This involved a question-naire survey of clients (or owners), contractors and consultants involved with construction projects.
Key findings from the survey include the observation that the most important factors inhibiting the implementation of risk assess-ment and management practices within Ghanaian construction organisations were: awareness of risk management processes; lack of experience and lack of co-ordination between the parties involved; and the level of risk assessment deployment in Ghana was medium.
Figure 1: Mean plot for the barrier ‘lack of experience’.
23Journal of Construction
29th-31st May, Heraklion, Crete, Greece, pp. 52-59, ISBN: 978-960-254-690-1
4. Aje, O.I., Odusami, K.T. and Ogunsemi, D.R. (2009), “The impact of contractors management capability on cost and time performance of construction projects in Nigeria”, Journal of Financial Management of Property and Construction, 14(1), 171 -187.
5. Akintoye, A.S. and MacLeod, M.J. (1997), “Risk analysis and management in construction”, International Journal of Project Management, 15(1), 31-38.
6. Ayirebi-Dansoh, K. (2005), “Strategic Planning Practice of Construction Firms in Ghana”, Construction Management and Economics, 23(2), 148-163.
7. Carter, R.K. (1986), “General review project management”, Facilities, 4(12), 37-44.
8. Dada, J.O. and Jagboro, G.O. (2007), “An evaluation of risk factors impacting construction cash flow forecast”, Journal of Financial Management of Property and Construction, 12(1), 37-44.
9. Deros, M.D. B., Yusof, S.M., and Salleh, Md. A. (2006), “A benchmarking implementation framework for automo-tive manufacturing SMEs”, Benchmarking: An International journal, 13(4), 396-430.
10. Dey, P., and Ogunlana, S. (2004), “Selection and Application of Risk Management Tools and Techniques for Build Operate Transfer Projects”, Industrial Management and Data Systems, 104(4),334-346.
11. Dommeyer, C.J. and Moriarty, E. (2000) “Comparing two forms of an e-mail survey: embedded vs. attached”, Interna-tional Journal of Market Research, Vol. 42(1), pp. 39-50.
12. Edwards, D.J. and Holt, G.D. (2010), “The case for “3D triangulation” when applied to construction management research”, Construction Innovation, 10(1), 25-41.
13. Forza, C. (2002), “Survey research in operations manage-ment: a process-based perspective.” International Journal of Operations Management, 22(2), 152-194.
14. Frimpong, Y., Oluwoye, J. and Crawford, L. (2003), “Causes of delay and cost overruns in construction of groundwater projects in a developing countries; Ghana as a case study” International Journal of Project Management, 21, 321-326.
15. Gill, J. and Johnson, P. (1991) Research Methods for Manag-ers, Paul Chapman Publishing Ltd.
16. Hassanein, AMR A.G. and Afify, Halaa M.F. (2007), “Risk management practices of contractors: A case study of power station projects in Egypt”, Journal of Financial Management of Property and Construction, 12(3), 164 – 179.
17. Jackson, A. and DeCormier, R. (1999) “E-mail survey re-sponse rates: targeting increases response”, Marketing Intel-ligence & Planning, Vol. 17, (3), pp. 135-139.
18. Lester, A. (2007), “Project Management, Planning and Con-trol”, 5th ed. Elsevier Ltd.
19. Luu, T., Kim, S., Cao, H. and Park, Y. (2008), “Performance measurement of construction firms in developing countries”, Construction Management and Economics, 26, 373-386.
20. Manelele, I. and Muya, M. (2008), “Risk Identification on Community-Based Construction Projects in Zambia”, Journal of Construction, 12(1), 2-7.
21. Mok, C.K., Rao Tummala, V.M., and Leung, H.M. (1997), “Practices, barriers and benefits of risk management process in building services cost estimation”, Construction Manage-ment and Economics, 15, 161-175.
22. Nunnally, J., (1978), Psychometric Theory, 2nd ed., McGraw-Hill, New York, NY.
23. Odeyinka, H.A., Lowe, J. and Kaka, A. (2008), “An evalua-tion of risk factors impacting construction cash flow forecast”, Journal of Financial Management of Property and Construc-tion, 13(1), 5-17.
24. Osburn, C.B. (2008), “Corporate culture and the individual in perspective”, Advances in Library Administration and Organization, 26, 41-70.
25. Santoso, D.J., Ogunlana, S.O. and Minato, T. (2003) Assess-ment of risks in high rise building construction in Jakarta, Journal of Engineering, Construction and Architecture Man-agement, 10(1): 43-55.
26. Tchankova, L. (2002), “Risk Identification - Basic Stage in Risk Management”, Environmental Management and Health, 13(3), 290- 297, MCB University Press.
27. Tuuli, M. M., Baiden, B. K. and Badu, E. (2007),“Assess-ment and enforcement of liquidated damages in construction contracts in Ghana”, Structural Survey; 25 (3/4), 204 – 219.
28. Wang, J. and Yuan, H (2010), “Factors affecting contractors’ risk attitudes in construction projects: Case study from China”, International Journal of Project Management, accepted 9 February 2010, viewed 17th May 2010, <http://www.sciencedirect.com.ezlibproxy.unisa.edu.au>
29. World Bank (2003), Country Procurement Assessment Report: Ghana, Report No. 29055, Vol. 2, World Bank, Washington, DC.
30. Yang, J., Shen, G.Q., Ho, M., Drew, D.S. and Chan, A.P. (2009), “Exploring critical success factors for stakeholder management in construction projects”, Journal of Civil Engi-neering and Management, 15(4), 337-348.
24 Journal of Construction
TRIGGERS OF DISPUTES WITHIN THE GHANAIAN CONSTRUCTION
INDUSTRYAssah-Kissiedu, M., Fugar, F.D.K, and Badu, E.
email: [email protected] (Corresponding Author)
Department of Building TechnologyKwame Nkrumah University of Science and Technology
ABSTRACT:The purpose of this study was to identify the factors that cause disputes within the Ghanaian construction industry and their relative importance from the perspectives of clients, consultants and contractors and to recommend possible ways of preventing or reducing them.
Design/Methodology/Approach: To achieve the study objectives, a comprehensive literature search and interviews of the main stakeholders in the Ghanaian construction industry were conducted to identify the factors that cause or have the potential of causing disputes within the construction industry. A questionnaire was subsequently designed to collect information from clients, contractors and consultants on the relative importance of these factors in causing disputes in the Ghanaian construction industry. The field survey conducted included 20 clients, 27 contractors and 57 consultants.
Findings: The results suggest that the ten most important triggers of construction disputes in the Ghanaian construction industry from the collective view point of the three categories of respondents were: (1) poor financial arrangements by clients leading to late payments; (2) failure of the client to honour pay-ments as and when due; (3) unclear and incomplete description of items in the bills of quantities; (4) ineffective communication between the parties on the project; (5) contractor’s failure to read the contract documents; (6) design and specification oversights; (7) award of contractors to incapable contractors; (8) contractors’ failure to price properly for the works; (8) disruptions and delays by the contractor that create deviation from initial programme of works; and (10) government policy, which encourages low evaluated tenders followed by claims.
Research limitations/implications: The survey was done on samples from two regions of Ghana. An expanded sample cov-ering the other eight regions would have generated an increased understanding of the nature disputes in Ghana.
Practical implications: The study increases the aware-ness of stakeholders of the causes of construction disputes and provides concepts that contribute to minimising the factors that trigger them.
Originality/Value: This study provides a basis for reducing construction disputes and thereby minimising the incidence of costly disputes. The findings are of value for clients, contractors and consultants.
KEYWORDSConstruction industry, Disputes, Ghana
INTRODUCTIONConstruction disputes happen fairly often; they are a reality on every construction project and could happen at any point in time during the design or construction phase of the project (Hall 2002). Disputes occur because construction projects by their nature bring together a wide variety of people with different sets of objectives and who are often unfamiliar with one another. These individuals or groups of individuals are expected to mesh hurriedly to get a specific job done in a short-term and afterwards get disbanded. These project participants rarely have any opportunity to align their interests before the project begins; their roles and obliga-tions are often predetermined and cut out in conditions of contract which seek to apportion risks, sometimes disproportionately. This ad hoc arrangement provides a hot bed for disputes prompted by mistrust and the predictable attempt by each party to make the most of its position while minimising its risk.
Construction disputes vary in nature, size and complexity, but they all have a common thread; they are costly both in terms of time and money and are often accompanied with the destruction of individual and good working relationships. Indeed, it is this tendency to destroy relationships and increase time and cost of construction projects, that has provoked a common interest of researchers in different countries to understand the nature of the causes of construction disputes in order to formulate measures to prevent or minimise their occurrence or resolve them swiftly, efficiently and in a cost effective manner if they happen.
In Ghana there is no published literature or statistics regarding construction disputes, but there is sufficient anecdotal evidence to suggest that they occur in numbers that should justify a research in the area.
OBJECTIVES OF THE STUDYThe main objectives of this study are the following:
• To identify from the literature and interviews the factors that cause disputes on construction projects;
• To evaluate and rank the importance and frequency of the fac-tors responsible for disputes on Ghanaian construction projects from the view point of clients, contractors and consultants and
• To suggest ways to prevent or minimise the occurrences of disputes on Ghanaian construction projects.

25Journal of Construction
LITERATURE REVIEWThe literature on conflicts and disputes in construction reveals that conflict and disputes are sometimes used interchangeably but “conflict should be distinguished from dispute” (Murdoch and Hughes (2000, p.337). According to Murdoch and Hughes, con-flict occurs when objectives are incompatible. On the other hand, disputes arise when conflict becomes an altercation. Similarly, Fenn et.al. (1997) submit that “conflict exists where there is an incompatibility of interest. When a conflict becomes irreconcilable and the mechanisms for avoiding it are exhausted, or inadequate, techniques for resolving the dispute are required.” (cited in Poh, 2005, p. 10)
A number of articles and studies on causes of disputes on construction projects internationally were reviewed. Poh (2005) reported that disputes in the construction industry in Malaysia are attributable to actions or inactions by all parties. Some of these causes include incompleteness of drawings and specifica-tions, design and specification oversights, poor management and supervision of projects, failure to provide design information in a timely manner and underestimation of the cost of the works.
Levy (2007) reported that the principal reasons for misun-derstandings leading to disputes on construction projects in the USA were:
• Plans and specifications containing errors, omissions and ambiguities or which lack proper degree of co-ordination;
• Incomplete or inaccurate responses or non-responses to ques-tions or resolutions of problems presented by one party in the contract to another party in the contract;
• The inadequate administration of responsibilities by the client, architect/engineer, contractor, subcontractors, or suppliers;
• An unwillingness or inability to comply with the intent of the contract or to adhere to industry standards in the performance of work;
• Site conditions which differ materially from those described in the contract documents;
• Unforeseen subsurface conditions;• The uncovering of existing building conditions, which differ
materially from those indicated in the contract drawings situ-ations that occur primarily during rehabilitation or renovation work;
• Extra work or change order work;• Breeches of contract by either party in the contract;• Disruptions, delays or acceleration to the work that creates
any deviation from the initial baseline schedule and• Inadequate financial strength on the part of the client, con-
tractor or subcontractor.
Campbell (1997) also revealed that in the UK, construction disputes generally occur due to:
• Adversarial nature of contracts;• Poor communication between the parties;• Ineffective communication on site;• The inability to understand terms of contract and expectations
of the parties;• Proliferation of subsidiary contracts and warranties including
those with consultants;
• Fragmented nature of the industry;• Improper contractual documentation;• Tender systems and government policy on tendering encourag-
ing low tenders followed by claims; the inability or reluctance to pay;
• Erosion of contract administrator’s role as quasi-arbitrator in contracts and
• Unforeseen effect of third party interests.
Soekimo et.al. (2007) studied the causes of disputes on construction projects in Indonesia and grouped the causes into the following categories:
• External conditions (26.79%);• Change of drawings document (21.43%);• Condition of the field (19.64%);• Change of technical specifications (16.07%);• Others (e.g., cost estimates, professional ethics and licensing)
(16.07%)
It is evident from these studies that the causes of disputes are varied. As suggested by Kumaraswamy (1997) and supported by Younis et.al. (2008), a direct comparison of the results is “nei-ther possible nor useful, because of the diverse industry cultures and differing methodologies and terminologies used in data col-lection, analysis and outcome presentations.” This observation not withstanding, these researchers support the suggestion by Kumaraswamy (1997) that these factors could be categorised into three broad causes: external factors, contract, and project teams. Consistent with this opinion, others (Vorster, 1993 and Mitropolous, and Howell, 2001) have similarly classified them under project uncertainty, process problems and people issues.
SAMPLING TECHNIQUEA total of 97 respondents including 20 clients, 50 consultants and 27 large scale contractors (D1contractors) in the Greater Ac-cra and Ashanti Regions of Ghana were interviewed. These two regions have the highest population of contractors and consultants and these researchers believe that they are representative of the population of interest. Again, the researchers assumed that D1 contractors were the most likely to be involved in construction disputes since they handle more complex projects involving many parties.
The lists of D1 contractors and consultants were obtained from the Building and Civil Engineering Contractors Association of Ghana, Ghana Institution of Surveyors (GhIS) and Ghana Institute of Architects (GIA). The total number of registered D1 contrac-tors and the combined total of registered quantity surveying and architectural firms in both regions at the time of the study (2008) were 30 and 65 respectively.
Stoker (1985) (cited by Strydom and De Vos, 1998, p.192) suggested that for a population size of 30, at least 24 (80%) ought to be the sample size. Nevertheless, the questionnaire was sent to all the contractors listed.
The sample for the consultants was determined using the Kish’s (1965) formula. The calculation produced a sample size of 39. However, in order to overcome problems of non-response, wrong
26 Journal of Construction
answering of questionnaire, and to achieve the desired confidence level, the questionnaire was sent all 65.
Clients in the study consisted of both public and private in-stitutions. A snowball sampling was used to select the number of clients for the study. Contractors and consultants interviewed were asked to suggest clients they had worked for having the characteristics been required. This resulted in 30 respondents.
QUESTIONNAIRE DESIGNQuestionnaire was designed to determine the importance, and frequency of occurrence, of the identified causes of construction disputes. The questionnaire was divided into two main parts. Part 1 related to general information for both the company and respondent. Respondents were asked to give a brief background of the company and their experience. Part 2 included questions related to the potential causes of disputes. A 5-point ranking system and a three-level scale of low, moderate, and high were utilised and the respondents were asked to indicate from the list of 56 potential causes of construction disputes, how important each cause was and how frequent it occurred.
DATA COLLECTIONSixty-five (65) questionnaires were issued to the consultants and a total of 50 were returned representing 77% rate of return. Thirty (30) questionnaires were issued to the D1 contractors and a total 27 were received representing 90% rate of return. Finally, 20 answered questionnaires out of 30 were received from the clients’ organisation representing 67% rate of response. The total response rate was 78% which is acceptable for analysis.
RESEARCH FINDINGS AND RESULTS
General characteristics of respondentsThe respondents were quantity surveyors (56.7%), project manag-ers (9.3%), architects (7.2%), project engineers or clerk of works (6.2%) and directors of firms or companies (26.8%). Majority (77.3%) of the respondents had more than five-years experience in the construction industry.
RANKING OF POTENTIAL CAUSES OF DISPUTESThe relative importance of each variable was calculated using the formula:
Relative Importance Index (RII) = ∑
× W
A Nwhere,
W = the weighting given to each cause by respondents, ranging from 1 to 5,A = the highest weight (i.e. 5 in the study)N = the total number of samples
Clients consider ‘disruptions and delays by the contractor that create deviation from initial programme of works’ the most impor-tant factor causing delay. On the other hand, contractors believe that the most important factor causing disputes is ‘unconfirmed oral instructions.’ Consultants think that the most important cause of disputes is ‘Failure of clients to honour payments as and when due.’ However, from the combined perspective of the respondents,
the most important cause of disputes is ‘Failure of the client to honour payments as and when due.’
Frequency of causes of disputesThe frequency index formula was used to rate the frequency of occurrence for each cause according to three ordinal scales: high (3), medium (2), or low (1).
Frequency Index (F.I) = 3 23
1 2 3
1 2 3
n n nn n n
+ ++ +( )
: where n1 is the
number of respondents who answered ‘high’, n2 the number of respondents who answered ‘medium’ and n3 the number of respondents who answered ‘low’.
From the collective point of view, the most frequent cause of disputes is ‘Poor financial arrangements by the clients, leading to late payments.’
Severity of causes of disputesThis is an overall index (‘Relative Importance Index’ x ‘Frequency Index’), which was used to obtain the ten most severe triggers of disputes among the 56 probable causes of disputes on Ghanaian construction projects.
The combined opinion of participants regarding the ten most severe causes of construction disputes in Ghana are:
i. Poor financial arrangements by the clients leading to late payments;ii. Failure of the client to honour payments as and when due;iii. Unclear and incomplete description of items in the bills of quantities;iv. Ineffective communication between the parties on the project;v. Contractor's failure to read the contract documents;vi. Design and specification oversights and errors or omissions resulting from uncoordinated civil, structural, architectural, mechanical and electrical designs;vii. Award of contracts to incapable contractors;viii. Contractor’s failure to price properly for works;ix. Disruptions and delays by the contractor that create deviation from initial programme of works;x. Government policy, which encourages low evaluated tenders followed by claims.
AGREEMENT ANALYSISTo investigate the agreement among the three groups of respon-dents, a non- parametric statistical method, the Kendall‘s coef-ficient of concordance (W) was used for assessing agreement among the clients, consultants and contractors.
W R R n nik
i= ∑ − −=12 2 1 12( ) / ( ) /
W = 9036.76/14630W = 0.62
The value of W obtained from calculation is 0.62. This result showed a fair to good level of agreement beyond chance alone amongst the respondents consisting of clients, consultants and contractors.
27Journal of Construction
SIGNIFICANCE TESTINGThis method was used to obtain the most significant causes of disputes on Ghanaian construction projects among the fifty six (56) factors found in literature.
The decision was whether or not to reject the null hypothesis (Ho), which was:
Ho = a source among the list of the 56 potential causes of construction disputes listed in the questionnaires does not qualify to be selected as a real cause of disputes on Ghanaian construction projects.
Based on the ranking assigned by the respondents, the summation of weighting of each potential cause was computed to perform the significance test to enable the relevant ones to be selected for the first objective to be achieved. An evaluation of the test statistic (Xs) was done and the p-value determined. The P-value was taken to be the smallest value at which the significance level (α = 0.05) could be present and still have been able to reject the Ho. The Ho was rejected when the P-value was considered to less than 0.475.
The five point ranking (i.e. 1, 2, 3, 4, & 5) have a mean (µ) of three (3) with a standard deviation of 1.58. The probability of observing the sample mean or larger if µ = 3 and standard deviation (δ) =1.58 was computed. The test statistic was by Central Limit Theorem, approximately normally distributed with a µ =3 and δ n where n is the number of responses for that factor. The P-value therefore, was obtained using the equation below:
Ρ Ρχ µχ µδ
≥[ ] = ≥−
zn/
...............(For positive values of z)
P Pχ µχ µδ
≤[ ] = − ≥−
1 zn/
..........(For negative values of z)
From the standard normal distribution table, values z was read.= 0.5 – [α/2]= 0.5 – [0.05/2]= 0.475
All P-values greater than 0.475 were accepted while those less than 0.475 were rejected (95% level of confidence).
Based on the test of significance, 30 causes were accepted as having the potential of causing disputes in the Ghanaian construction industry significance.
CONCLUSIONSThis study investigated the causes of disputes on construction projects in Ghana. It studied the importance, frequency and severity of the 56 causes identified from the literature and semi-structured interviews. The respondents in this study included 20 clients, 50 consultants and 27 contractors. The ten most severe causes of disputes which occur on Ghanaian construc-tion projects from the collective view point of the three groups of respondents were:
i. Poor financial arrangements by the clients leading to late payments;
ii. Failure of the client to honour payments as and when due;iii. Unclear and incomplete description of items in the bills of
quantities;iv. Ineffective communication between the parties on the project;v. Contractor's failure to read the contract documents;vi. Design and specification oversights and errors or omissions
resulting from uncoordinated civil, structural, architectural, mechanical and electrical designs;
vii. Award of contracts to incapable contractors;viii. Contractor’s failure to price properly for works;ix. Disruptions and delays by the contractor that create deviation
from initial programme of works;x. Government policy, which encourages low evaluated tenders
followed by claims.
RECOMMENDATIONSThe following recommendations are made to minimise disputes on constructions sites.
Clients must pay particular attention to the following factors:
• Progress payments must be paid to contractors as and when they are due. It means that sufficient financial arrangements must be made before construction projects are initiated. Addi-tionally, the long bureaucratic processes involved in honouring payments of contractor’s claims must be curtailed to conform strictly to the provisions of the contract;
• Resources and capabilities of contractors must be thoroughly investigated prior to awarding of contract to the lowest bidder or any bidder;
• A comprehensive and thorough brief to the design team is necessary to enable it prepare detailed contract documents that leave no doubt in the minds of the contractor regarding what the must be constructed. This is a key to avoiding design errors and omissions and the consequent variations on site;
• All members of the design team must be employed at the onset and must be involved in the evolution and production of working drawings. There must be proper coordination of the design process.
Contractors must consider the following factors:
• The right calibre of administrative and technical staff should be assigned to projects to handle all administrative and technical issues including pricing, planning and scheduling, interpretation of production drawings, receipt of instructions from consultants or project managers, and general supervision of works;
• Resources must be made available as and when required on site to ensure minimal interruption of the programme of works. This must involve proper management of financial resources, cash flow planning, the deployment of sufficient and motivated labour, and the provision of the right plant and equipment and
• Contract documents must be reviewed and related to one another and all ambiguities, inconsistencies, and deficien-cies must be brought to the attention of consultants before construction begins.
28 Journal of Construction
Consultants must take note of the following:
• Sufficient time must be allowed for design production. Ad-equate and quality information must be obtained from the client, site, and market to achieve comprehensive design and specification and
• Design must be co-ordinated; all members must be involved and nothing must be left “to be sorted out” on site. Without fully co-ordinated drawings and specifications, the project will most certainly lead to variations and increase in cost.
Generally, effective communication between the parties before and during the construction of the project must be a priority. Is-sues concerning design, payment and compensation, variations in scope and others must be communicated effectively, efficiently and in a timely manner by the originator to the recipient. Effective communication must be supported by good record keeping by all parties. Before the works begin, the parties should foresee pos-sible future problems and establish procedures to organise and retain complete and accurate records concerning the progress of work. Taking photographs of the works as it progresses, carefully documenting all discussions particularly on site project meetings and recording all instructions received and actions taken on those instructions are absolutely valuable.
REFERENCES1. Campbell, P. (1997) Construction Dispute Avoidance and
Resolution. Latheronwheel: Whittles Publishing, at 51.2. Fenn, P., Lowe, D., and Speck, C. (1997). Conflict and dispute
in construction. Construction Management and Economics. 15 (6), 513-518.
3. Hall, J. M. (2002) Ineffective communication: Common causes of construction disputes. Alliance’s Advisory Council Legal Notes. Vol. 13, No.2.
4. Kumaraswamy, M.H. (1997) Conflicts, claims and disputes in construction engineering, Construction and Architectural Management, 4(2): 66-74.
5. Levy, S.M.(2007) Project Management in construction 5th Edition pages 261-293. McGraw Hill companies
6. Mitropolous, P. and Howell, G. (2001) Model for understand-ing, preventing and resolving project disputes, Journal of Con-struction Engineering and Management, 127(3): 223-231.
7. Murdoch, J. and Hughes, W.(2000) Construction Contracts: Law and Mangement. London:Taylor & Francis
8. Poh, K.C. (2005). The causes of construction disputes on client organisations. A project report for the degree of MSc. (Construction Management), Faculty of Civil Engineering, Universiti Teknologi Malaysia.
9. Soekirno, P., et al, 2007. The disputes in the Construction Project in Indonesia, Reference Books, Connstruction, In-dustrial, Management, and Engineering, ITB Publisher, ISBN 979-3507-98-5
10. Strydom, H. and De, Vos A.S.(1998). Sampling and sampling methods. In A.S. De Vos (Ed) Research at grass roots: A primer for the caring professions. Van Schaik Publishers, Pretoria.
11. Vorster, M. (1993) Dispute Prevention and Resolution, Source Document 95, Construction Industry Institute, Austin Texas.
12. Younis, G., Wood, G., Malak, M.A.A (2008). Minimizing construction disputes: the relationship between risk allocation and behavioral attitudes (www.bear2008.org/post/184pdf) assessed March 2, 2008.
29Journal of Construction
ABSTRACTPurpose: The purpose of this paper is to present findings on the home usage of housing subsidy beneficiaries when they are allocated houses, including their socio-demographic profile and overall satisfaction regarding their housing situation, in the Gauteng Province of South Africa.
Methodology/Approach: The methodology used in the research was exploratory and descriptive in nature comprising of qualitative and quantitative data. The quantitative research was conducted in four different existing housing subsidy locations in Gauteng. Data was obtained through a structured question-naire administered during individual interviews with the heads or spouses of the head of the selected households to meet the objectives of the research.
Findings: Findings revealed that the original intended use of the houses by the government (private residential usage) is what the subsidised houses are being used for as revealed by 96.2% of the respondents, with a few exceptions. The result of the socio-demographic profiles of the respondents indicated that the needs of marginalised women and other disadvantaged groups of unfair discrimination were being met. The result also indicated that the respondents were satisfied with their overall housing situation, but had complaints about certain aspects of the housing unit. However beneficiaries indicated that the subsidised houses had changed their lives and given them more comfort than previously experienced.
Originality/Value: Post occupancy evaluation (POE) studies inform the government and various stakeholders of the housing satisfaction levels of the occupants, which include whether the house is up to standard. It also helps to ascertain whether the houses have improved their lives and what beneficiaries actually ‘do’ with the houses. POE studies help to avoid mistakes previ-ously made, save money and ensure proper construction of houses amongst others. The paper contributes to this body of knowledge.
KEYWORDSPost-occupancy evaluation, Housing subsidy, Housing, Low income, Housing satisfaction
INTRODUCTIONSouth African is one of the countries in the world that has delivered the highest number of houses to the poor through various housing subsidy mechanisms to fulfil her vision of adequate housing for all, as reflected in the National Housing Policy Framework. Over the past fifteen years, the government has vigorously ensured that
essential services were available to advance the lives of ordinary people. Since 1994 to date, about 2,700,000 houses have been delivered, providing more than 13 million people with secure homes[1]. Since 1994, the South African Government has initi-ated and implemented several housing delivery programmes and Housing Subsidy mechanisms to provide houses to its citizens, thus eliminating the incidence of slum housing associated with poverty. This is done to fulfil the vision of adequate housing for all as reflected in the National Housing Policy framework, which is to increase housings’ share in the total State budget to five percent and to increase housing delivery on a sustainable basis. Over the past fifteen years, the government has vigorously ensured that essential services were made available to advance the lives of the low income group. The paper starts with an overview of literature on the topic (housing subsidy scheme, housing satisfac-tion and post occupancy evaluation) and then presents the results of the analysis and findings of the research. Empirical evidence for the research is drawn from surveys conducted in four existing housing subsidy schemes in Johannesburg, Gauteng Province of South Africa. The empirical discussions first explore what Housing Subsidy beneficiaries use their houses for when they are allocated to them. Secondly, housing satisfaction is discussed to know if the needs of low income and the disadvantaged groups, including marginalised women, are being promoted and met by the housing subsidy scheme. Finally, the paper draws some conclusions and recommendation for the future.
THE SOUTH AFRICA HOUSING SUBSIDY SCHEMEIt has never proved easy to help the poor and disadvantaged group through housing subsidies, particularly in developing countries. Today, very few governments are prepared to offer housing sub-sidies to the poor unless they are delivered as up-front, targeted capital subsidies. However, lack of resources has forced each government into making difficult decisions about the size and the number of subsidies to be offered. Dependent on those deci-sions, has come a series of implementation problems relating to the quality of construction, the location of the new housing solutions, the use of credit and how to allocate subsidies between so many ‘would-be’ beneficiaries. However, housing delivery for the low income group in South Africa is reliant on this process. At the core of the National Housing Strategy is the provision of housing subsidy assistance to eligible households. The Depart-ment of Housing[2] informed that Capital subsidy assistance will be granted to low-income households in order to assist them in accessing at least minimum standard accommodation. Subsidy assistance is provided through three subsidy programmes, which
Aigbavboa C.O., Dr. Thwala [email protected] (Corresponding author)
Department of Construction Management and Quantity Surveying, University of Johannesburg, South Africa
POST OCCUPANCY EXPERIENCE OF HOUSING SUBSIDY BENEFICIARIES
IN THE GAUTENG PROVINCE OF SOUTH AFRICA

30 Journal of Construction
are the Housing Subsidy Scheme, the Discount Scheme and Hostel Redevelopment Programme. The Housing Subsidy Scheme is the primary means of assistance in terms of the National Housing Policy. On March 15, 1994, the housing subsidy scheme replaced all previous government subsidy programmes for households with an income of R3,500 per month or less. These households could not own property or receive a government housing subsidy before and were expected to meet a range of criteria contained in the National Housing Act of 1997.
The Government Housing Policy makes provision for financial grants to assist the homeless, low-income and disadvantaged group to become homeowners. The Housing Subsidy Scheme has been the key to the delivery of housing since the advent of government’s low-cost housing programme mechanism, which provides government-funded assistance packages to households categorised as ‘poor’. Recent policy shifts have been attempting to simplify the administration of housing subsidies and increasing the subsidy amount. In addition, government policy is placing an increasing emphasis on the role that beneficiaries of government-funded subsidies should play in delivery, partly in response to concerns of the culture of ‘entitlement’ and ownership that out-right subsidies create. As a result, government now requires that subsidy beneficiaries contribute to the construction of their homes either through physical participation in the building of the home, in what is known as the People’s Housing Process or through the payment of a financial contribution. The amount of money a beneficiary qualifies for depends on how much the household earns each month[3]. For the past few years, the National Hous-ing Subsidy has been increased annually to account for inflation and rising building costs. In 2008, the increase was significant; it went up by almost 12% for the mostly poor. There are only two conditions under which the subsidy amount will be increased; when there is a geophysical variation that causes development costs to be particularly high because of location and topographical conditions. The other condition is when the subsidy is awarded to a beneficiary with a disablement or a household member of the beneficiary is disabled. Because of the limitation of funds and the predetermined housing units these grants can build, it is very difficult to satisfy beneficiaries in terms of their needs. The next section of the research looks into housing satisfaction and the determinants of beneficiaries housing satisfaction.
HOUSING SATISFACTIONHousing satisfaction is defined as the perceived gap between a respondent’s needs and aspiration and the reality of the current residential context[4]. It also refers to as the degree of contentment experienced by an individual or a family with regard to their current housing situation[5]. Housing satisfaction is a complex attitude[6] which includes satisfaction with the dwelling unit and satisfaction with the neighbourhood and the area[7]. The concept of residential satisfaction is often used to evaluate residents’ perceptions of and feelings for their housing units and the environment[8]. Also, the concept of housing satisfaction has been used as (a) a key predic-tor of an individual’s perceptions of general ‘quality of life’, (b) an indicator of incipient residential mobility and hence has altered housing demands and affected neighbourhood change, (c) an ad hoc evaluative measure for judging the success of developments constructed by private and public sectors, and (d) an assessment tool of residents’ perceptions of inadequacies in their current hous-ing environment in order to improve the status quo[9]. Some schol-
ars have argued that residents’ perception of their environment defines the quality of their lives[8]. Housing satisfaction is based entirely on the beneficiaries’ individual definition of residential quality. For instance, one beneficiary’s idea of good residential quality will be to have a toilet inside the housing unit while for another it may not be the same. Housing satisfaction also depends on culture and in some cases different socio-economic levels. Beneficiaries usually compare what they consider to be high or good residential quality to the previous residential environment in which they resided[10] which influences housing satisfaction. Housing satisfaction gives an indication of how people respond to the environment in which they live[11]. The relationship of beneficiaries with their environment is based on the relationship between a person’s characteristics (their background, feelings, beliefs, attitude and behavioural tendencies amongst others) and the social and physical components of that particular environ-ment[11]. Housing satisfaction is influenced by a broad array of objective and subjectively perceived conditions[12]. Residential satisfaction relies heavily on the beneficiaries’ views, perceptions, previous experiences, behaviour, norms, values, emotions[3]; and the socio-economic background of beneficiaries with regards to the aspiration concerning their home.
Measuring residential satisfaction among the low-income group is therefore important because it broadens one’s understanding of how and why beneficiaries respond to certain factors in the environment in which they live as well as ascertaining housing types and living conditions. It provides information that can be used to improve residential living conditions of the low-income group, whose preferences and requirements are not known through normal housing channels and markets as they relate to the more affluent segment of the population[3]. Residential satisfaction should be constantly measured in low-income housing areas and among low-income groups, because these are the groups who usually cannot move away if they are dissatisfied with the areas or housing units they live in, because of where most of them are coming from and their financial situation/state. When the gap between what they expect and what they have decrease, residential satisfaction increases[13].
POST OCCUPANCY EVALUATIONPost Occupancy Evaluation (POE), is a process that allows the systematic study of buildings and its occupant once occupied from the perspective of the occupants who use them, so that lessons may be learned that will improve their performance and future design[14]. Occupants’ indisputable, but unfulfilled expectations of building quality are documented within the recorded opinion in post occupancy evaluation. POE identifies ways to improve build-ing design, performance, the role the housing plays in the lives of the occupants and how it can facilitate the purpose for which it was built. POE systematically analyses a particular environment to gain understanding of the impact it has on occupants of a building and its environment, hence how it facilitates or inhibits daily activities of the occupants[14].
POE is conducted after the building has been occupied for some time so that occupants are accustomed to the new space and the experience of moving in does not bias the results[15]. Beneficiaries input are three-fold in POE; they provide information and feed-back to the architect, housing policy makers and the construction company responsible for the design of the building environment.
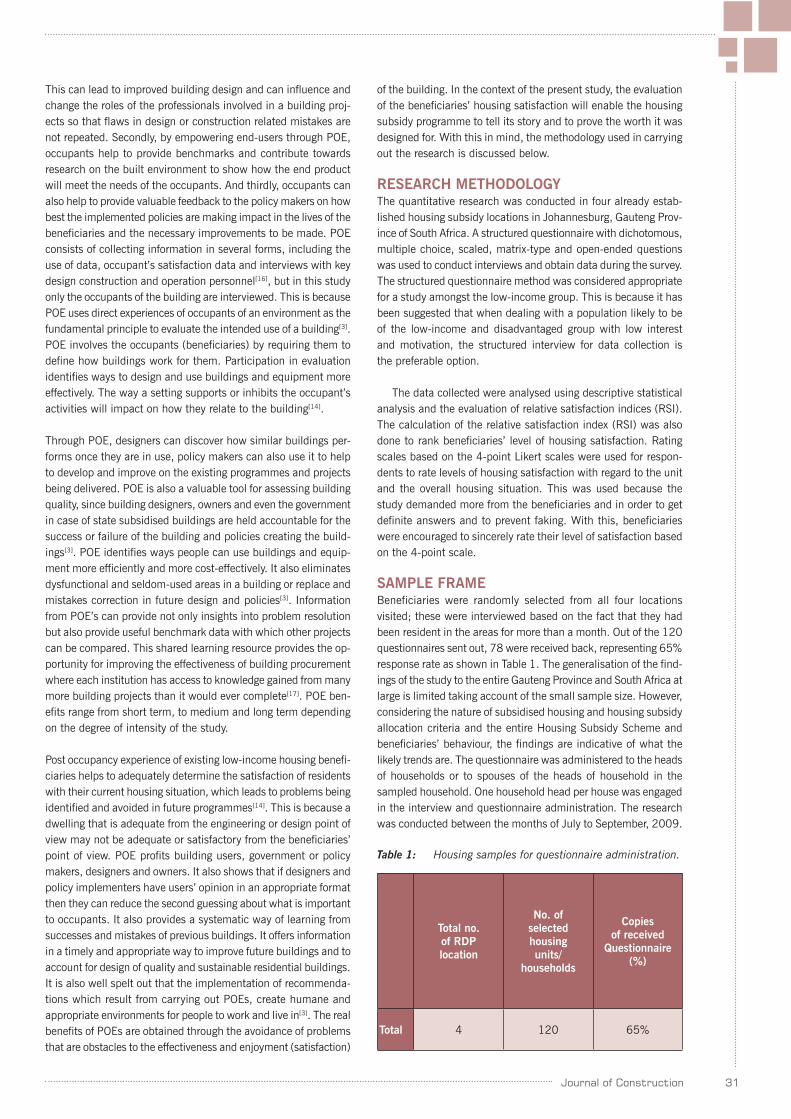
31Journal of Construction
This can lead to improved building design and can influence and change the roles of the professionals involved in a building proj-ects so that flaws in design or construction related mistakes are not repeated. Secondly, by empowering end-users through POE, occupants help to provide benchmarks and contribute towards research on the built environment to show how the end product will meet the needs of the occupants. And thirdly, occupants can also help to provide valuable feedback to the policy makers on how best the implemented policies are making impact in the lives of the beneficiaries and the necessary improvements to be made. POE consists of collecting information in several forms, including the use of data, occupant’s satisfaction data and interviews with key design construction and operation personnel[16], but in this study only the occupants of the building are interviewed. This is because POE uses direct experiences of occupants of an environment as the fundamental principle to evaluate the intended use of a building[3]. POE involves the occupants (beneficiaries) by requiring them to define how buildings work for them. Participation in evaluation identifies ways to design and use buildings and equipment more effectively. The way a setting supports or inhibits the occupant’s activities will impact on how they relate to the building[14].
Through POE, designers can discover how similar buildings per-forms once they are in use, policy makers can also use it to help to develop and improve on the existing programmes and projects being delivered. POE is also a valuable tool for assessing building quality, since building designers, owners and even the government in case of state subsidised buildings are held accountable for the success or failure of the building and policies creating the build-ings[3]. POE identifies ways people can use buildings and equip-ment more efficiently and more cost-effectively. It also eliminates dysfunctional and seldom-used areas in a building or replace and mistakes correction in future design and policies[3]. Information from POE’s can provide not only insights into problem resolution but also provide useful benchmark data with which other projects can be compared. This shared learning resource provides the op-portunity for improving the effectiveness of building procurement where each institution has access to knowledge gained from many more building projects than it would ever complete[17]. POE ben-efits range from short term, to medium and long term depending on the degree of intensity of the study.
Post occupancy experience of existing low-income housing benefi-ciaries helps to adequately determine the satisfaction of residents with their current housing situation, which leads to problems being identified and avoided in future programmes[14]. This is because a dwelling that is adequate from the engineering or design point of view may not be adequate or satisfactory from the beneficiaries’ point of view. POE profits building users, government or policy makers, designers and owners. It also shows that if designers and policy implementers have users’ opinion in an appropriate format then they can reduce the second guessing about what is important to occupants. It also provides a systematic way of learning from successes and mistakes of previous buildings. It offers information in a timely and appropriate way to improve future buildings and to account for design of quality and sustainable residential buildings. It is also well spelt out that the implementation of recommenda-tions which result from carrying out POEs, create humane and appropriate environments for people to work and live in[3]. The real benefits of POEs are obtained through the avoidance of problems that are obstacles to the effectiveness and enjoyment (satisfaction)
of the building. In the context of the present study, the evaluation of the beneficiaries’ housing satisfaction will enable the housing subsidy programme to tell its story and to prove the worth it was designed for. With this in mind, the methodology used in carrying out the research is discussed below.
RESEARCH METHODOLOGYThe quantitative research was conducted in four already estab-lished housing subsidy locations in Johannesburg, Gauteng Prov-ince of South Africa. A structured questionnaire with dichotomous, multiple choice, scaled, matrix-type and open-ended questions was used to conduct interviews and obtain data during the survey. The structured questionnaire method was considered appropriate for a study amongst the low-income group. This is because it has been suggested that when dealing with a population likely to be of the low-income and disadvantaged group with low interest and motivation, the structured interview for data collection is the preferable option.
The data collected were analysed using descriptive statistical analysis and the evaluation of relative satisfaction indices (RSI). The calculation of the relative satisfaction index (RSI) was also done to rank beneficiaries’ level of housing satisfaction. Rating scales based on the 4-point Likert scales were used for respon-dents to rate levels of housing satisfaction with regard to the unit and the overall housing situation. This was used because the study demanded more from the beneficiaries and in order to get definite answers and to prevent faking. With this, beneficiaries were encouraged to sincerely rate their level of satisfaction based on the 4-point scale.
SAMPLE FRAMEBeneficiaries were randomly selected from all four locations visited; these were interviewed based on the fact that they had been resident in the areas for more than a month. Out of the 120 questionnaires sent out, 78 were received back, representing 65% response rate as shown in Table 1. The generalisation of the find-ings of the study to the entire Gauteng Province and South Africa at large is limited taking account of the small sample size. However, considering the nature of subsidised housing and housing subsidy allocation criteria and the entire Housing Subsidy Scheme and beneficiaries’ behaviour, the findings are indicative of what the likely trends are. The questionnaire was administered to the heads of households or to spouses of the heads of household in the sampled household. One household head per house was engaged in the interview and questionnaire administration. The research was conducted between the months of July to September, 2009.
Table 1: Housing samples for questionnaire administration.
Total no. of RDP location
No. of selected housing units/
households
Copies of received
Questionnaire (%)
Total 4 120 65%
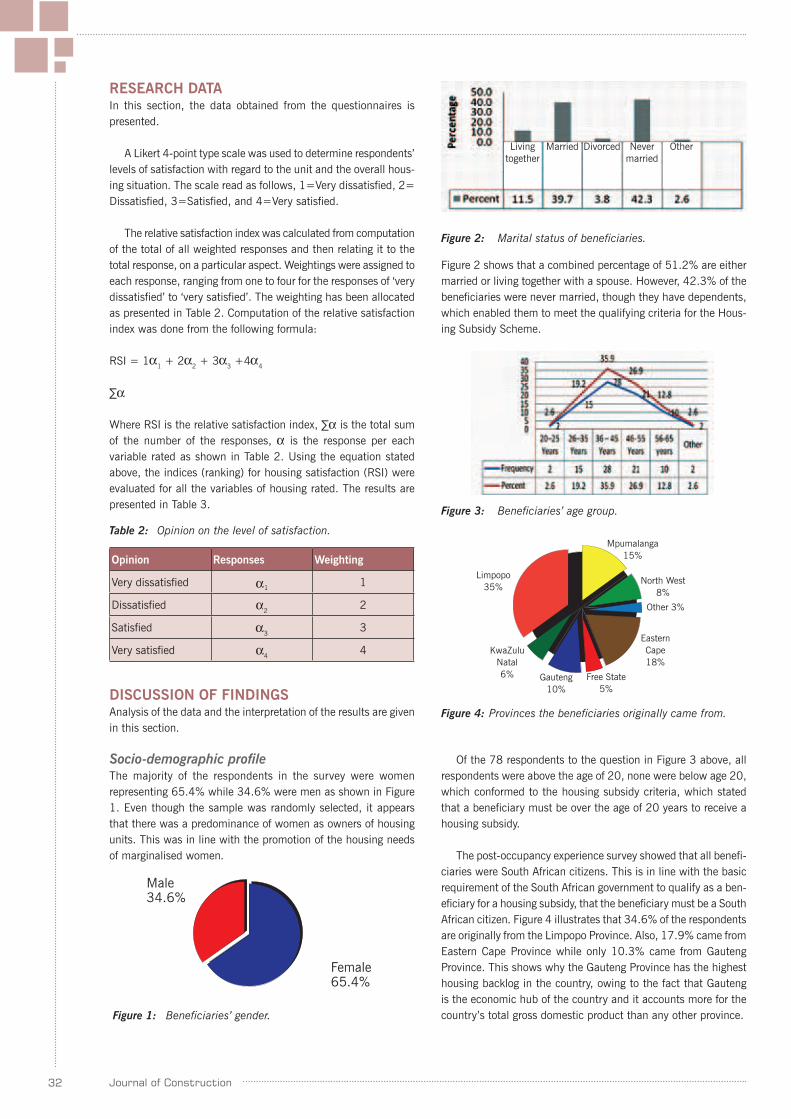
32 Journal of Construction
RESEARCH DATAIn this section, the data obtained from the questionnaires is presented.
A Likert 4-point type scale was used to determine respondents’ levels of satisfaction with regard to the unit and the overall hous-ing situation. The scale read as follows, 1=Very dissatisfied, 2= Dissatisfied, 3=Satisfied, and 4=Very satisfied.
The relative satisfaction index was calculated from computation of the total of all weighted responses and then relating it to the total response, on a particular aspect. Weightings were assigned to each response, ranging from one to four for the responses of ‘very dissatisfied’ to ‘very satisfied’. The weighting has been allocated as presented in Table 2. Computation of the relative satisfaction index was done from the following formula:
RSI = 1α1 + 2α
2 + 3α3 +4α
4
∑α
Where RSI is the relative satisfaction index, ∑α is the total sum of the number of the responses, α is the response per each variable rated as shown in Table 2. Using the equation stated above, the indices (ranking) for housing satisfaction (RSI) were evaluated for all the variables of housing rated. The results are presented in Table 3.
Figure 2 shows that a combined percentage of 51.2% are either married or living together with a spouse. However, 42.3% of the beneficiaries were never married, though they have dependents, which enabled them to meet the qualifying criteria for the Hous-ing Subsidy Scheme.
Table 2: Opinion on the level of satisfaction.
Opinion Responses Weighting
Very dissatisfied α1 1
Dissatisfied α22
Satisfied α33
Very satisfied α44
DISCUSSION OF FINDINGSAnalysis of the data and the interpretation of the results are given in this section.
Socio-demographic profileThe majority of the respondents in the survey were women representing 65.4% while 34.6% were men as shown in Figure 1. Even though the sample was randomly selected, it appears that there was a predominance of women as owners of housing units. This was in line with the promotion of the housing needs of marginalised women.
Figure 1: Beneficiaries’ gender.
Figure 2: Marital status of beneficiaries.
Of the 78 respondents to the question in Figure 3 above, all respondents were above the age of 20, none were below age 20, which conformed to the housing subsidy criteria, which stated that a beneficiary must be over the age of 20 years to receive a housing subsidy.
The post-occupancy experience survey showed that all benefi-ciaries were South African citizens. This is in line with the basic requirement of the South African government to qualify as a ben-eficiary for a housing subsidy, that the beneficiary must be a South African citizen. Figure 4 illustrates that 34.6% of the respondents are originally from the Limpopo Province. Also, 17.9% came from Eastern Cape Province while only 10.3% came from Gauteng Province. This shows why the Gauteng Province has the highest housing backlog in the country, owing to the fact that Gauteng is the economic hub of the country and it accounts more for the country’s total gross domestic product than any other province.
Figure 3: Beneficiaries’ age group.
Figure 4: Provinces the beneficiaries originally came from.
Female65.4%
Male34.6%
Livingtogether
Married Divorced Nevermarried
Other
Mpumalanga15%
Limpopo35%
KwaZulu Natal6% Gauteng
10%Free State
5%
Eastern Cape18%
Other 3%
North West8%

33Journal of Construction
The survey result in Figure 5 further shows that 31.0% of the beneficiaries were born in the Limpopo province, while 22.0% were born in the Gauteng province. Finding from the study as in Figure 6 revealed that 72.0% of the respondents had achieved Grade 11 or lower (Standard 9 or lower - final year of secondary education), while 20.0% Grade 12 (Matric standard 10 – graduate of secondary education) and only 2.6% of the respondents had a qualification beyond Matric.
Figure 5: Provinces in which beneficiaries were born.
Figure 6: Beneficiaries’ highest educational qualification.
Socio-economic profileFindings revealed that 37.2% of the respondents were unem-ployed or looking for work as in Figure 7. The largest proportion had only achieved Grade 11 or lower (Standard 9 or lower - final year of secondary education). The fact they have only achieved Grade 11 or lower (Standard 9 or lower) might contribute to them being unemployed. This showed that more people are unemployed in the Gauteng Province and the country at large. However, 28.2% were employed, and of the total percentage employed (28.2%), 37.3% are women, while 29.6% are men.
Figure 7: Beneficiaries’ current employment status.
Figure 8 shows that a combined total of 89.4% have a monthly household income of between R0 and R3,500 per month. This is in line with the Housing Department Policy that to qualify as a beneficiary of a housing subsidy, the gross household income should be between R0 - R3,500 per month.
Figure 8: Beneficiaries’ monthly income.
Beneficiaries’ home usageFindings as shown in Figure 9 revealed that 96.2% of the respon-dents used their houses (solely) for private residential function (only). When further asked if the home was used for other things apart from the primary home usage, 91.0% asserted that they do not used it for other things. However, 9.0% did indicate that apart from the primary home use, they also used it for other things. Among the 9.0% that used their homes for other things, 28.6% used their homes to run tuck shops as shown in Figure 10, while 14.3% used their homes for day care centres, salon businesses, internet café and business centres, selling of beer and to carry out other personal works.
Figure 9: Beneficiaries’ primary home usage.
Figure 10: What beneficiaries use their homes for, apart from the basic home use.
Mpumalanga13%
Private Residential96.2%
Commercial use 3.8%
North West 9%
Eastern Cape 15%
Free State 4%
Gauteng 22%
KwaZulu Natal 6%
Limpopo31%
Other 5%
Grade 12 (Matric, Std 10)20%
Post Matric Diploma or...
Grade 11 or lower (Std 9 or lower)

34 Journal of Construction
Figure 11: Beneficiaries’ home used as financial security.
Figure 12: Part of the house beneficiaries use the most.
Table 3: Perceived level of unit satisfaction according to beneficiaries.
Aspect:
Response (n) Range 1 = Very dissatisfied , 4 = Very Satisfied
1 2 3 4 Satisfaction index Rank
Position of unit 5 14 31 28 3.05 1
Position of windows 1 14 44 19 3.04 2
Number of doors 4 16 31 27 3.04 2
Position of doors 4 11 43 20 3.01 3
Position of bedrooms 5 14 38 21 2.96 4
Safety around the unit 6 19 46 7 2.69 5
Position of lounge 10 24 28 16 2.64 6
Kitchen bathroom/toilet 7 28 31 12 2.62 7
Privacy in the unit 11 26 33 8 2.49 8
Layout of the unit 5 35 34 4 2.47 9
Noise level around the unit 6 31 39 2 2.47 10
Noise levels in the unit 6 34 35 3 2.45 11
Safety in the unit 15 18 37 7 2.44 12
Size of unit 16 27 25 10 2.38 13
Position of kitchen 14 35 17 12 2.35 14
Climate conditions of unit 16 24 33 5 2.35 14
Space in unit 16 32 24 6 2.26 15
Exterior finishes 12 39 22 5 2.26 15
Number of rooms 12 40 23 3 2.22 16
Ventilation in the unit 15 38 20 5 2.19 17
Interior finishes 21 39 11 7 2.05 18
Further findings as represented in Figure 11 revealed that 94.9% of the respondents have not used their houses for any sort of financial security since it was allocated to them. Only 3.8% have used their houses for financial security. This might be due to the fact that most beneficiaries do not know the worth of what has
been given to them because of lack of housing education; as such they cannot appreciate that the housing unit can be used for any other things like the house being collateral for a loan (financial security) apart from the basic home usage. Since beneficiaries use their housing unit basically for private residential function only, respondents were further asked the part of the house mostly used. Figure 12 showed that 50.7% use the kitchen mostly. When respondents were asked why this part of the house is used mostly, 60.0% said they used the area mostly because the house
Not sure 1.3%
Yes 3.8%
No 94.9%
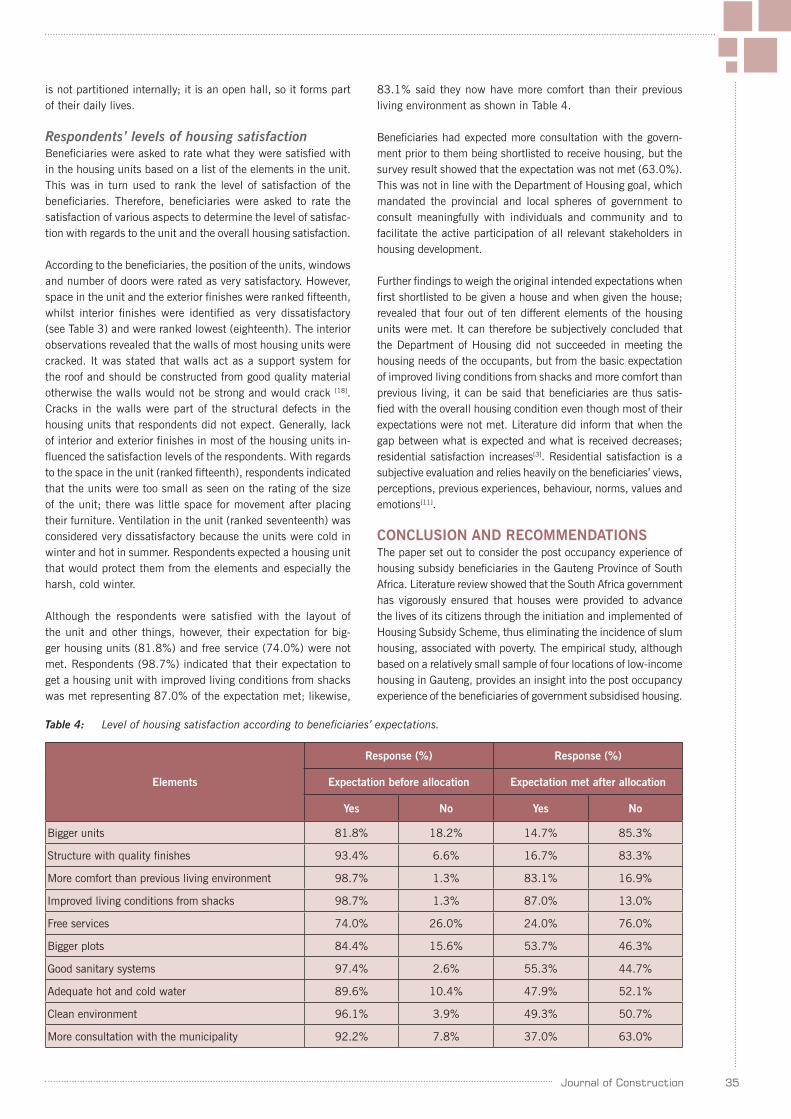
35Journal of Construction
is not partitioned internally; it is an open hall, so it forms part of their daily lives.
Respondents’ levels of housing satisfactionBeneficiaries were asked to rate what they were satisfied with in the housing units based on a list of the elements in the unit. This was in turn used to rank the level of satisfaction of the beneficiaries. Therefore, beneficiaries were asked to rate the satisfaction of various aspects to determine the level of satisfac-tion with regards to the unit and the overall housing satisfaction.
According to the beneficiaries, the position of the units, windows and number of doors were rated as very satisfactory. However, space in the unit and the exterior finishes were ranked fifteenth, whilst interior finishes were identified as very dissatisfactory (see Table 3) and were ranked lowest (eighteenth). The interior observations revealed that the walls of most housing units were cracked. It was stated that walls act as a support system for the roof and should be constructed from good quality material otherwise the walls would not be strong and would crack [18]. Cracks in the walls were part of the structural defects in the housing units that respondents did not expect. Generally, lack of interior and exterior finishes in most of the housing units in-fluenced the satisfaction levels of the respondents. With regards to the space in the unit (ranked fifteenth), respondents indicated that the units were too small as seen on the rating of the size of the unit; there was little space for movement after placing their furniture. Ventilation in the unit (ranked seventeenth) was considered very dissatisfactory because the units were cold in winter and hot in summer. Respondents expected a housing unit that would protect them from the elements and especially the harsh, cold winter.
Although the respondents were satisfied with the layout of the unit and other things, however, their expectation for big-ger housing units (81.8%) and free service (74.0%) were not met. Respondents (98.7%) indicated that their expectation to get a housing unit with improved living conditions from shacks was met representing 87.0% of the expectation met; likewise,
83.1% said they now have more comfort than their previous living environment as shown in Table 4.
Beneficiaries had expected more consultation with the govern-ment prior to them being shortlisted to receive housing, but the survey result showed that the expectation was not met (63.0%). This was not in line with the Department of Housing goal, which mandated the provincial and local spheres of government to consult meaningfully with individuals and community and to facilitate the active participation of all relevant stakeholders in housing development.
Further findings to weigh the original intended expectations when first shortlisted to be given a house and when given the house; revealed that four out of ten different elements of the housing units were met. It can therefore be subjectively concluded that the Department of Housing did not succeeded in meeting the housing needs of the occupants, but from the basic expectation of improved living conditions from shacks and more comfort than previous living, it can be said that beneficiaries are thus satis-fied with the overall housing condition even though most of their expectations were not met. Literature did inform that when the gap between what is expected and what is received decreases; residential satisfaction increases[3]. Residential satisfaction is a subjective evaluation and relies heavily on the beneficiaries’ views, perceptions, previous experiences, behaviour, norms, values and emotions[11].
CONCLUSION AND RECOMMENDATIONSThe paper set out to consider the post occupancy experience of housing subsidy beneficiaries in the Gauteng Province of South Africa. Literature review showed that the South Africa government has vigorously ensured that houses were provided to advance the lives of its citizens through the initiation and implemented of Housing Subsidy Scheme, thus eliminating the incidence of slum housing, associated with poverty. The empirical study, although based on a relatively small sample of four locations of low-income housing in Gauteng, provides an insight into the post occupancy experience of the beneficiaries of government subsidised housing.
Table 4: Level of housing satisfaction according to beneficiaries’ expectations.
Elements
Response (%) Response (%)
Expectation before allocation Expectation met after allocation
Yes No Yes No
Bigger units 81.8% 18.2% 14.7% 85.3%
Structure with quality finishes 93.4% 6.6% 16.7% 83.3%
More comfort than previous living environment 98.7% 1.3% 83.1% 16.9%
Improved living conditions from shacks 98.7% 1.3% 87.0% 13.0%
Free services 74.0% 26.0% 24.0% 76.0%
Bigger plots 84.4% 15.6% 53.7% 46.3%
Good sanitary systems 97.4% 2.6% 55.3% 44.7%
Adequate hot and cold water 89.6% 10.4% 47.9% 52.1%
Clean environment 96.1% 3.9% 49.3% 50.7%
More consultation with the municipality 92.2% 7.8% 37.0% 63.0%
36 Journal of Construction
The findings showed that the original intended use of the houses by the government is what the subsidised houses are being used for. The secondary usage of the homes by beneficiaries can be seen as a way of self empowerment by the respective beneficiaries. Despite the majority of the respondents’ expectations not being met, beneficiaries were satisfied with the privacy and improved living conditions in the housing units compared to where they were previously living. Further findings from the research revealed that the progressive realisation of the right to adequate housing as contained in the South Africa constitution is being met by the government, as a majority of the beneficiaries that were allocated houses by the government were South Africa citizens. This shows that government is still the major player when it comes to the progressive realisation of the right to housing in South Africa. The Department of Housing objective of the broader housing vision in promoting social cohesion and improving quality of life for the poor is being achieved as findings showed.
However, the following are therefore recommended in order to increase the satisfaction level of beneficiaries: Meaningful consul-tation should be held with individuals and communities affected to facilitate the active participation of all relevant stakeholders in housing development and to improve the overall housing delivery and the satisfaction of the housing subsidy beneficiaries, the Department of Housing and administrator of subsidised housing units in Gauteng should conduct a complete and thorough needs assessment of the beneficiaries of a proposed housing subsidy development. The results of the needs assessment should be explained and limitations of the housing development need to be identified. For example, the beneficiaries may have indicated a need for a two-bedroom housing unit, but the subsidy amount and beneficiary contribution might only be sufficient to supply a unit with one bedroom. It is also recommended that government should provide as wide a choice of housing and tenure options as is reasonably possible. This can be achieved through the rental housing option. Findings show that the majority of the beneficiaries are originally from the Limpopo province, In accordance with the findings of this study, it is recommended that the Department of Housing should formulate better quality control mechanisms to ensure that the houses that will be delivered through the Housing Subsidy Programme will be of good physical quality.
The Department of Housing should move beyond the progressive realisation of the right to adequate housing as contained in the South Africa Constitution, to the use of the housing to improve the lives of the citizens. Findings revealed that most respondents are unemployed / looking for work and the largest proportion had only achieved Grade 11 or lower (Std 9 or lower – final year of second-ary education). Finally it is further recommended that informal economic activities should be supported in housing projects as most housing subsidy beneficiaries depend on informal economic activity, as source of income. This will thus ensure that economic opportunities are created for beneficiaries in line with the goal of the national government.
REFERENCES1. Department of Housing. (2009), Annual Report of the Depart-
ment of Housing: Gauteng Provincial Government, Johannes-burg, South Africa.
2. Department of Housing. (2000), Annual Report of the Depart-ment of Housing: Gauteng Provincial Government, Johannes-burg, South Africa.
3. Darkwa, I., (2006). Post-occupancy evaluation of State-subsidised housing units in Kayamandi, Stellenbosch. Masters in Consumer Science (Housing), University of Stellenbosch.
4. Varady, D.P. and Preiser, W.F.E. (1998). Scattered-Site Public Housing and Housing Satisfaction: Implications for the New Public Housing Program, Journal of American Planning As-sociation, 6(2): 189-207.
5. Mastura Jjaafar, Noor Liza Hasan, Osman Mohamad, Ra-mayah T. (2007). The Determinants of Housing Satisfaction Level: A Study on Residential Development Project by Penang Development Corporation (PDC). Available on: www.fppsm.utm.my/.../73-the-determinants-of-housing-satisfaction-level-a-study-on-residential-development-project-by-penang.html accessed on April, 2 2010.
6. Satsangi, M. and Kearns, A. (1992). The Use and Interpreta-tion of Tenant Satisfaction Surveys in British Social Housing, Environment and Planning, 10(4): 317-331.
7. Onibokun, A.G. (1974). Evaluating Consumers’ Satisfaction with Housing: An Application of a System Approach, Journal of American Institute of Planners, 40(3): 189-200.
8. Ogu, V.I. (2002). Urban Residential Satisfaction and The Plan-ning Implications in a Developing World Context: The Example of Benin City, Nigeria, International Planning Studies, 7(1): 37-53.
9. Djebuarni, R., & Al-Abed, A. (2000). Satisfaction level with neighbourhood in low-income Public housing in Yemen. Prop-erty Management, 18(4), 230–242
10. Amerigo M. & Aragones J.I., (1997). A theoretical and meth-odological approach to the study of residential satisfaction. Journal of Environmental Psychology.
11. Francescato G.B. (1998). Residential satisfaction. In VAN VLIET, W (Ed). 1998. The Encyclopaedia of Housing. London. Sage Publication.
12. Theodori, G.L. (2001). Examining the Effects of Community Satisfaction and Attachment on Individual Well-being, Rural Sociology, 4(66): 618-628.
13. Athram H.M., (2000). Residential satisfaction of Public Hous-ing dwellers in Albush Alzaiton Benghazi city, Libya, Master’s Thesis, University of Putra Malaysia.
14. Watson C. (2003). Review of building quality using post-occupancy evaluation. Journal of programme educational building 35:1-5.
15. Huizenga, C., Zagreus L., Arens E., & Lehrer D., (2003) Measuring indoor environment quality: A web-based occupant satisfaction survey. Centre for the built environment. Berkeley. Wurster Hall.
16. Carmody J. (2002), Post-Occupancy evaluation of DNR area office headquarters at Tower and Windom, Minnesota. Centre for sustainable Building research. Minnesota.
17. Barlex M.J., (2006). Guide to Post Occupancy Evaluation. University of Westminister. Education Funding Council for England (HEFCE). London
18. Winston A.J., & Turner C.J. (2001). Technical elements of a housing structure: The effects of the elements on everyday life.
37Journal of Construction
PRESIDENTIAL REPORT
FOR THE PERIOD 07 JULY 2008-18 JULY 2010
INTRODUCTIONThe period under review has been extremely challenging for ASOCSA. Shortly after taking up my presidency in 2008, the world went into an economic downward spiral bringing with it one of the worst economic downturns in modern times. In order to survive this sudden downturn ASOCSA has had to curtail its plan to expand activities into Southern Africa, limit the number of regional industry liaison meetings, restrict meetings of heads to conferences, and cancel planned presidential visits. The revenue generated by annual conferences has been the sole source of the operating income of ASOCSA. Despite the generous support of sponsors, the steady decline in numbers of delegates over the period is a cause for concern.
OVERVIEW OF STRATEGIC OBJECTIVESThe Association of Schools of Construction of Southern Africa (ASOCSA) since its launch on June 20, 2006 has continued to develop as the professional association for the development and advancement of construction education in Southern Africa. Progress to varying degrees has been made with the sharing of ideas and knowledge between institutions and largely at Heads meetings relative to development of curriculums, introduction to alternative teaching approaches, opportunities for research. Little has been done with regard to broader service to the industry and community at large. ASOCSA has partnered with the South African construction industry and Master Builders South Africa, in particular, to find ways to effectively represent the interests of both construction academic and industry practitioners. To this end, ASOCSA provided a forum for the debate and discussion of issues of mutual interest to all industry stakeholders. As part of its commitment to helping its members to serve their customers more effectively and succeed in an increasingly challenging environment of construction information management and technology, ASOCSA has attempted to establish a database of annual registration and graduation statistics, and depository of examination papers. To date the response to this initiative has been disappointing. In the period ASOCSA has convened two annual conferences, namely in Zambia and Durban, where construction academics and practi-tioners interacted relative to practical experience and the findings of relevant research.
MEMBERSHIPThe membership of ASOCSA has grown from six South African members to include Ardhi University in Tanzania, the National Council of Construction in Zambia, the Durban University of Technology, University of Kwa-Zulu Natal, Central University of Technology, and Tswana University of Technology. Efforts are being made to recruit the Copperbelt University in Zambia, University of Botswana, Lerotholi Polytechnic in Lesotho and Universities of Cape Town and the Witwatersrand. Interest in membership has been expressed from universities in Nigeria and Ghana. Despite the economic challenges facing universities on the continent interest in ASOCSA continues to grow.
OUTREACH AND PUBLIC RELATIONSI had the privilege during 2009 to have personal discussions with the then President of Associated Schools of Construction in the United States, Dr Charles Gains, about increased international col-laboration. This initiative has been endorsed with further contact with the incoming president, Dr Lloyd Scott.
I had discussions with CIB about an association with the or-ganisation, which is the largest grouping of construction research-ers in the world. These discussions have led to the CIB endorsing and supporting the activities and conferences of ASOCSA.
I have made representations to the RICS about the low weightings given to the peer reviewed Journal of Construction and our peer reviewed annual conferences. These weighting have unfortunately been adopted by the SACQSP. This matter is being referred to the appropriate committee for review.
I delivered a keynote address and chaired a panel of experts during the MBSA Congress in Sandton in September 2009.
HEADS MEETINGSThe efforts of Kathy Michell, the vice-president responsible for this portfolio resulted in the largest meeting of Heads ever during the conference in Zambia where all institutions made presentations about their respective programmes. Following on these presentations there was considerable discussion and debate about education strategies. These discussions continued in Durban. I have made attempts to develop an online database of annual registration and graduation statistics, and depository of examination papers as a service to ASOCSA members. Only two institutions to date have provided their statistics. None have provided examination papers. This initiative may need to be reviewed by the incoming Council.
CONFERENCESThe conferences in Cape Town and Zambia were well attended with excellent keynote addresses drawn largely from industry stakeholders. However, the anticipated growth in the number of delegates did not occur. Peer reviewed conference proceedings were produced. Particularly disappointing was the limited numbers of international delegates and industry practitioners who partici-pated. Making the conferences more appealing to these potential participants is a challenge. Despite the poor economic climate our regular sponsors, namely the Council for the Built Environ-ment, Wiehahn, Construction Industry Development Board, and Group Five continued to support our efforts generously. In Durban a number of pre-conference workshops are being presented as a strategy to increase interest in the conferences.
INDUSTRY-ACADEMIA LIAISONI led an extensive national drive during which ASOCSA met with industry representatives in every region in South Africa to discuss
38 Journal of Construction
the meeting of academia and industry minds. The role of the MBSA and regional MBAs in this initiative is appreciated and encourag-ing. The results of an ensuing survey were published in two articles in separate issues of JOC. I hope that they will provide the basis for further intensive discussion in the future. A national meeting between a delegation of Heads and the MBSA would be a good initiative as a follow-up to the survey and something I am com-mitted to bringing about. The regional industry-academia liaison forums were not followed through, in part due to the economic downturn and in part due to associations like SACQSP insisting on individual advisory boards and council by each institution. To then still have regional forums was seen as non-value adding and possible duplication. However, given the need for broad base col-laboration between academic institutions and industry, ASOCSA will need to work to change this position of the professional and accreditation bodies and associations.
JOURNAL OF CONSTRUCTION (JOC)The Journal of Construction, which is presently published twice a year, remains the official journal of ASOCSA and four issues were produced during the period under review. More than 5,000 complimentary copies of each issue were distributed to all industry stakeholders in the Southern African region as part of the endea-vour to grow the partnership between academia and industry. There have been changes in editors during the period – all of which have not impacted on the quality of the publication. Felix Le Roux from the University of Pretoria, who has done a sterling job, has decided to step down. Didi Thwala from the University of Johannesburg has agreed to take up the reins. One of his first tasks as editor has been to push for JOC to be included on the approved list of journals on the Department of Education. This process was commenced a while ago but ran into a few red tape glitches. The renewed application has been acknowledged by the DoE. We hope to have a decision in our favour by December.
WEBSITEThe website has experienced an average of 7,162 hits per month ranging from 4,253 in July 2008 when I became President to 15,165 in June 2010. For the period June 2008-June 2010 the website experienced a total of 169,352 hits. These statistics confirm that the website remains of vital importance to ASOCSA and its constituency, representing our window to the world. One of the initiatives that I have introduced is to include regular in-formative articles and others of interest about developments on
the African higher education landscape. These articles together with online versions of past issues of JOC have been found to be both useful and of interest to a broad spectrum of visitors to the site. Additionally, the website provides a portal to the websites of our sponsors and member institutions. I encourage ASOCSA to continue these initiatives.
BURSARY FUNDWhile we have R25,000 in the ASOCSA bursary fund, no bursaries have as yet been awarded. This initiative is one that I have not been able to fully develop during the period under review.
FINANCIAL STATUSASOCSA continues in a financially stable state with revenue primarily attributable to conference fees and conference sponsor-ships. ASOCSA through its member institutions has funded the publication of each of the issues of the Journal of Construction since 2008. Given that ASOCSA is a Section 21 Company, in theory it should not realise a financial surplus.
THE WAY FORWARDASOCSA faces challenges during the coming months and years. The old guard is being changed, with several retirements from Council. New blood with fresh ideas will be taking over the reins of this fledgling association, which has gone through its painful birth pains. Services to its members needs to be more visible and interaction with industry stakeholders more vibrant. ASOCSA has a difficult mandate to deliver on. However, I am confident it can, if all members remain committed to and believe in the vision of ASOCSA.
FINAL WORDSI have enjoyed serving the ASOCSA constituency during my term of office. In particular, my sincere thanks and appreciation go to each member of my Council and the great work they have done to keep ASOCSA moving towards its strategic objectives despite difficult odds. Additionally, thanks to each member institution and their continued support. Finally, a personal huge thank you to our sponsors who have consistently provided us with the lifeline to stay in business. I wish the incoming President and Council every success for the future.
Prof Theo C. HauptPresident
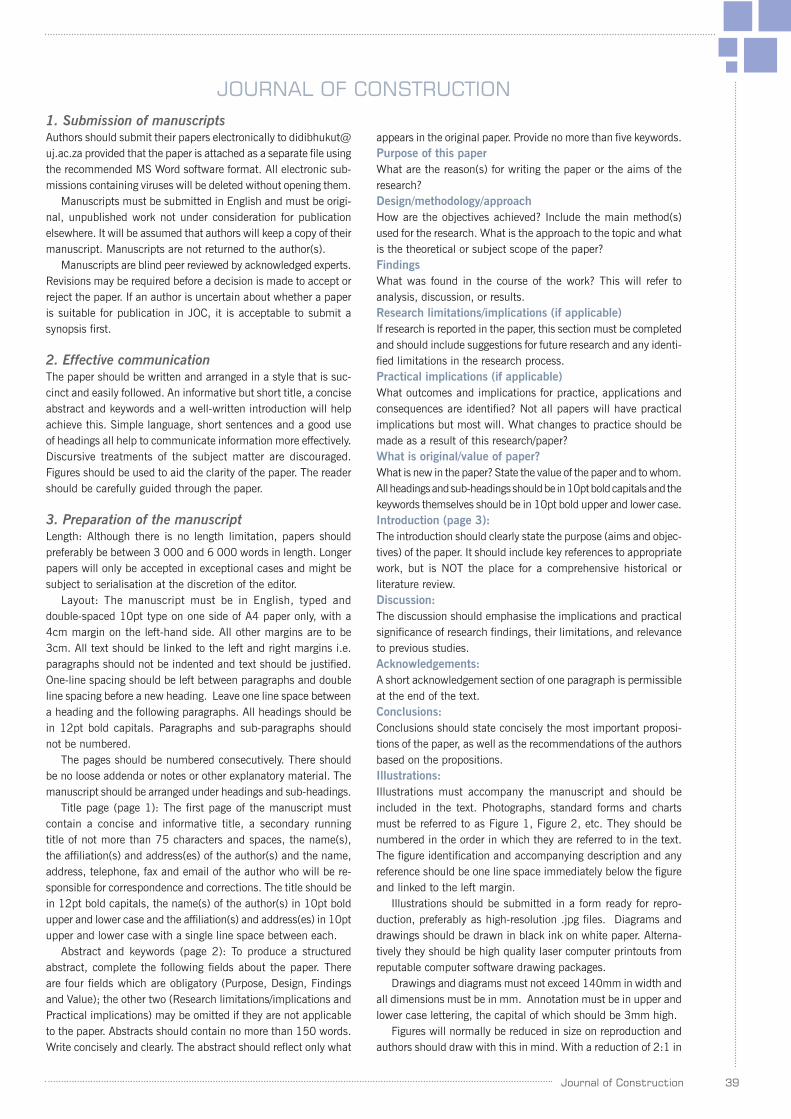
39Journal of Construction
1. Submission of manuscriptsAuthors should submit their papers electronically to [email protected] provided that the paper is attached as a separate file using the recommended MS Word software format. All electronic sub-missions containing viruses will be deleted without opening them.
Manuscripts must be submitted in English and must be origi-nal, unpublished work not under consideration for publication elsewhere. It will be assumed that authors will keep a copy of their manuscript. Manuscripts are not returned to the author(s).
Manuscripts are blind peer reviewed by acknowledged experts. Revisions may be required before a decision is made to accept or reject the paper. If an author is uncertain about whether a paper is suitable for publication in JOC, it is acceptable to submit a synopsis first.
2. Effective communicationThe paper should be written and arranged in a style that is suc-cinct and easily followed. An informative but short title, a concise abstract and keywords and a well-written introduction will help achieve this. Simple language, short sentences and a good use of headings all help to communicate information more effectively. Discursive treatments of the subject matter are discouraged. Figures should be used to aid the clarity of the paper. The reader should be carefully guided through the paper.
3. Preparation of the manuscriptLength: Although there is no length limitation, papers should preferably be between 3 000 and 6 000 words in length. Longer papers will only be accepted in exceptional cases and might be subject to serialisation at the discretion of the editor.
Layout: The manuscript must be in English, typed and double-spaced 10pt type on one side of A4 paper only, with a 4cm margin on the left-hand side. All other margins are to be 3cm. All text should be linked to the left and right margins i.e. paragraphs should not be indented and text should be justified. One-line spacing should be left between paragraphs and double line spacing before a new heading. Leave one line space between a heading and the following paragraphs. All headings should be in 12pt bold capitals. Paragraphs and sub-paragraphs should not be numbered.
The pages should be numbered consecutively. There should be no loose addenda or notes or other explanatory material. The manuscript should be arranged under headings and sub-headings.
Title page (page 1): The first page of the manuscript must contain a concise and informative title, a secondary running title of not more than 75 characters and spaces, the name(s), the affiliation(s) and address(es) of the author(s) and the name, address, telephone, fax and email of the author who will be re-sponsible for correspondence and corrections. The title should be in 12pt bold capitals, the name(s) of the author(s) in 10pt bold upper and lower case and the affiliation(s) and address(es) in 10pt upper and lower case with a single line space between each.
Abstract and keywords (page 2): To produce a structured abstract, complete the following fields about the paper. There are four fields which are obligatory (Purpose, Design, Findings and Value); the other two (Research limitations/implications and Practical implications) may be omitted if they are not applicable to the paper. Abstracts should contain no more than 150 words. Write concisely and clearly. The abstract should reflect only what
appears in the original paper. Provide no more than five keywords.Purpose of this paperWhat are the reason(s) for writing the paper or the aims of the research? Design/methodology/approach How are the objectives achieved? Include the main method(s) used for the research. What is the approach to the topic and what is the theoretical or subject scope of the paper?Findings What was found in the course of the work? This will refer to analysis, discussion, or results. Research limitations/implications (if applicable)If research is reported in the paper, this section must be completed and should include suggestions for future research and any identi-fied limitations in the research process.Practical implications (if applicable)What outcomes and implications for practice, applications and consequences are identified? Not all papers will have practical implications but most will. What changes to practice should be made as a result of this research/paper?What is original/value of paper? What is new in the paper? State the value of the paper and to whom. All headings and sub-headings should be in 10pt bold capitals and the keywords themselves should be in 10pt bold upper and lower case. Introduction (page 3):The introduction should clearly state the purpose (aims and objec-tives) of the paper. It should include key references to appropriate work, but is NOT the place for a comprehensive historical or literature review.Discussion:The discussion should emphasise the implications and practical significance of research findings, their limitations, and relevance to previous studies.Acknowledgements:A short acknowledgement section of one paragraph is permissible at the end of the text.Conclusions:Conclusions should state concisely the most important proposi-tions of the paper, as well as the recommendations of the authors based on the propositions.Illustrations:Illustrations must accompany the manuscript and should be included in the text. Photographs, standard forms and charts must be referred to as Figure 1, Figure 2, etc. They should be numbered in the order in which they are referred to in the text. The figure identification and accompanying description and any reference should be one line space immediately below the figure and linked to the left margin.
Illustrations should be submitted in a form ready for repro-duction, preferably as high-resolution .jpg files. Diagrams and drawings should be drawn in black ink on white paper. Alterna-tively they should be high quality laser computer printouts from reputable computer software drawing packages.
Drawings and diagrams must not exceed 140mm in width and all dimensions must be in mm. Annotation must be in upper and lower case lettering, the capital of which should be 3mm high.
Figures will normally be reduced in size on reproduction and authors should draw with this in mind. With a reduction of 2:1 in
JourNal of CoNStruCtIoN
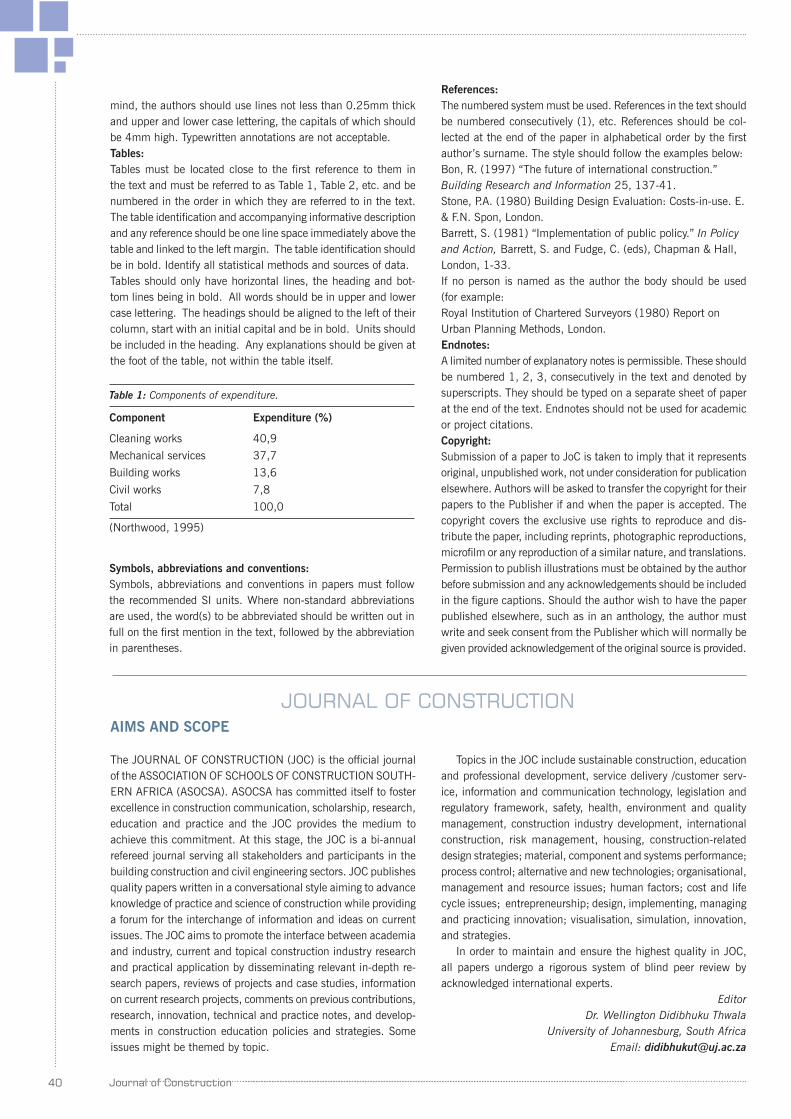
40 Journal of Construction
The JOURNAL OF CONSTRUCTION (JOC) is the official journal of the ASSOCIATION OF SCHOOLS OF CONSTRUCTION SOUTH-ERN AFRICA (ASOCSA). ASOCSA has committed itself to foster excellence in construction communication, scholarship, research, education and practice and the JOC provides the medium to achieve this commitment. At this stage, the JOC is a bi-annual refereed journal serving all stakeholders and participants in the building construction and civil engineering sectors. JOC publishes quality papers written in a conversational style aiming to advance knowledge of practice and science of construction while providing a forum for the interchange of information and ideas on current issues. The JOC aims to promote the interface between academia and industry, current and topical construction industry research and practical application by disseminating relevant in-depth re-search papers, reviews of projects and case studies, information on current research projects, comments on previous contributions, research, innovation, technical and practice notes, and develop-ments in construction education policies and strategies. Some issues might be themed by topic.
AIMS AND SCOPE
Topics in the JOC include sustainable construction, education and professional development, service delivery /customer serv-ice, information and communication technology, legislation and regulatory framework, safety, health, environment and quality management, construction industry development, international construction, risk management, housing, construction-related design strategies; material, component and systems performance; process control; alternative and new technologies; organisational, management and resource issues; human factors; cost and life cycle issues; entrepreneurship; design, implementing, managing and practicing innovation; visualisation, simulation, innovation, and strategies.
In order to maintain and ensure the highest quality in JOC, all papers undergo a rigorous system of blind peer review by acknowledged international experts.
EditorDr. Wellington Didibhuku Thwala
University of Johannesburg, South AfricaEmail: [email protected]
mind, the authors should use lines not less than 0.25mm thick and upper and lower case lettering, the capitals of which should be 4mm high. Typewritten annotations are not acceptable.Tables:Tables must be located close to the first reference to them in the text and must be referred to as Table 1, Table 2, etc. and be numbered in the order in which they are referred to in the text. The table identification and accompanying informative description and any reference should be one line space immediately above the table and linked to the left margin. The table identification should be in bold. Identify all statistical methods and sources of data.Tables should only have horizontal lines, the heading and bot-tom lines being in bold. All words should be in upper and lower case lettering. The headings should be aligned to the left of their column, start with an initial capital and be in bold. Units should be included in the heading. Any explanations should be given at the foot of the table, not within the table itself.
Table 1: Components of expenditure.
Component Expenditure (%)
Cleaning works 40,9
Mechanical services 37,7
Building works 13,6
Civil works 7,8
Total 100,0
(Northwood, 1995)
Symbols, abbreviations and conventions:Symbols, abbreviations and conventions in papers must follow the recommended SI units. Where non-standard abbreviations are used, the word(s) to be abbreviated should be written out in full on the first mention in the text, followed by the abbreviation in parentheses.
References:The numbered system must be used. References in the text should be numbered consecutively (1), etc. References should be col-lected at the end of the paper in alphabetical order by the first author’s surname. The style should follow the examples below: Bon, R. (1997) “The future of international construction.” Building Research and Information 25, 137-41.Stone, P.A. (1980) Building Design Evaluation: Costs-in-use. E. & F.N. Spon, London.Barrett, S. (1981) “Implementation of public policy.” In Policy and Action, Barrett, S. and Fudge, C. (eds), Chapman & Hall, London, 1-33.If no person is named as the author the body should be used (for example:Royal Institution of Chartered Surveyors (1980) Report on Urban Planning Methods, London.Endnotes:A limited number of explanatory notes is permissible. These should be numbered 1, 2, 3, consecutively in the text and denoted by superscripts. They should be typed on a separate sheet of paper at the end of the text. Endnotes should not be used for academic or project citations.Copyright:Submission of a paper to JoC is taken to imply that it represents original, unpublished work, not under consideration for publication elsewhere. Authors will be asked to transfer the copyright for their papers to the Publisher if and when the paper is accepted. The copyright covers the exclusive use rights to reproduce and dis-tribute the paper, including reprints, photographic reproductions, microfilm or any reproduction of a similar nature, and translations. Permission to publish illustrations must be obtained by the author before submission and any acknowledgements should be included in the figure captions. Should the author wish to have the paper published elsewhere, such as in an anthology, the author must write and seek consent from the Publisher which will normally be given provided acknowledgement of the original source is provided.
JourNal of CoNStruCtIoN
41Journal of Construction
Notes
42 Journal of Construction
Notes
ADVISORY BOARDProf. John SmallwoodNelson Mandela Metropolitan UniversitySouth Africa
Prof. Jimmie HinzeUniversity of FloridaU.S.A.
Dr. Albert ChanThe Hong Kong Polytechnic UniversityChina
Prof. Alan GriffithSheffield Hallam UniversityU.K.
Dr. Benedict IlozorEastern Michigan UniversityU.S.A.
Dr. David EdwardsLoughborough UniversityU.K.
Dr. Dean KashiwagiArizona State UniversityU.S.A.
Prof. Charles EgbuUniversity of SalfordU.K.
Prof. Ronie NavonNational Building Research Institute (NBRI)Israel
Dr. Ayman Ahmed Ezzat OthmanCommercial Buildings DirectorateUnited Arab Emirates
Prof. Christian KochTechnical University of DenmarkDenmark
Prof. Paulo Jorge da Silva BártolaPolytechnic Institute of LeiriaPortugal
Dr. Faisal Manzoor ArainSouthern Alberta University of Technology Canada
Prof. Kerry LondonUniversity of NewcastleAustralia
Dr. Wilco TijhuisUniversity of TwenteNetherlands
Dr. Gary SmithNorth Dakota State UniversityU.S.A.
Dr. Jane EnglishUniversity of Cape TownSouth Africa
Prof. Hojjat AdeliOhio State UniversityU.S.A.
Dr. Helen LingardRoyal Melbourne Institute of TechnologyAustralia
Prof. Low Sui PhengNational University of SingaporeSingapore
Prof. Marton MarosszekyUniversity of New South WalesAustralia
Dr. Onuegbu UgwuThe University of Hong KongHong Kong
Dr. Peter ErkelensEindhoven University of TechnologyNetherlands
Prof. Chris CloeteUniversity of PretoriaSouth Africa
Prof. Martin SextonUniversity of Salford U.K.
Prof. Russell KenleySwinburne University of Technology Australia
Dr. Hendrik MarxUniversity of the Free StateSouth Africa
Journal of Construction
FROM THE PRESIDENT’S PENThe winds of change continue to sweep across the globe as people everywhere struggle to meet the challenges of economic downturns, climate change, increasing mobility of people and rapid technological development. Many of these changes hold promise for improvement in the overall quality of life of us all. Others threaten the very core of what we hold dear. At ASOCSA we have also been subjected to change, resulting in review of how we still deliver efficiently and effectively on our mandate to improve construction education in our region. We have had to become lean and mean operationally. For that reason we have not held the expected meeting of Heads in September to coincide with the 104th Annual Congress of the MBSA. However, I was thrilled to represent ASOCSA by both presenting an address and facilitating a panel on construction health and safety. I compliment the MBSA on devoting an entire day of their wonderful programme to this issue.
The second part of the preliminary findings of our indus-try-academia survey is included in these pages. There is compelling evidence both from these findings and also our experience during the recent series of accreditation visits that industry and academia need to speak more loudly to each other if the education experience of our graduates is going to be meaningful, especially with respect to their current and future employability.
Our first bold excursion beyond the borders of South Africa into Zambia for our 4th Built Environment Confer-ence was hugely successful with several new relationships developed. The success of the conference was evidenced in the largest meeting of construction heads in the region as far as I can remember. Institutions throughout South Africa as well as, for example, Botswana, Zambia, Uganda and Tanzania were represented.
I have moved on personally to lead an innovative con-struction programme in the U.S.A. where subjects and subject content have been deliberately blurred in favour of an academic experience that introduces the workplace into the classroom where each student acts as a professional under the guidance of a master professional. Feedback from industry practitioners who visited the instructional spaces was expressed as, “You are onto something!” The challenge is to encourage other institutions and programmes to experiment similarly.
It is my vision that ASOCSA should, inter alia, become the central depository of all construction-related curricu-lums, course outlines, and examination papers in the region; source of construction education statistics and information; support deserving students in construction programmes; and be able to recognise the annual contribution to the improvement of construction education and training in the region by a person and/or organisation.
In conclusion, the 5th Built Environment Conference from July 18 through 20 will take place in Durban almost immediately after the final whistle of the FIFA 2010 World Cup has blown. I am sure that the hype, excitement and thrill of this unique experience in the history of our young nation will not have quite died down yet by then. Spare a thought for the unparalleled efforts and achievements of our industry in producing the venues and physical infrastructure that will make the event not only spectacular, but a success.
Enjoy reading this issue.
Theo C. HauptPresident
Prof. Kerry LondonUniversity of NewcastleAustralia
Journal of Construction
EDITORDr. Wellington Didibhuku ThwalaUniversity of Johannesburg,South Africa
CO-EDITORProf. Theo HauptMississippi state University,U.S.A.
Prof. Abdul Rashid bin Abdul AzizUniversiti Sains MalaysiaMalaysia
Prof. Ahmad RamlyUniversity of MalayaMalaysia
Dr. Nina BakerUniversity of StrathclydeScotland
Prof. James SommervilleGlasgow Caledonian UniversityScotland
Dr. Vian AhmedUniversity of SalfordU.K.
Prof. Nicola CostantinoPolytecnico di BariItaly
Prof. Stephen EmmittTechnical University of DenmarkDenmark
Prof. Derek Clements-CroomeUniversity of ReadingU.K.
Prof. David BoydUniversity of Central EnglandU.K.
Dr. Peter LoveEdith Cowan UniversityAustralia
Dr. Ravi Srinath PereraUniversity of UlsterNorthern Ireland
Dr. Robert KongNanyang Technological UniversitySingapore
Prof. Stephen OgunlanaAsian Institute of TechnologyThailand

ISSN 1994 - 7402