Embed Size (px)
Citation preview
▪ Birkbeck, University of London ▪ Malet Street ▪ London ▪ WC1E 7HX ▪
ISSN 1745-8587
Department of Economics, Mathematics and Statistics
BWPEF 1605
On the Causes of Brexit
Agust Arnorsson University of Iceland
Gylfi Zoega University of Iceland
Birkbeck, University of London
August 2016
Bir
kb
ec
k W
ork
ing
Pa
pe
rs in
Ec
on
om
ics
& F
inan
ce
1
On the Causes of Brexit
Agust Arnorsson
Department of Economics
University of Iceland
and
Gylfi Zoega*
Department of Economics
University of Iceland, and
Department of Mathematics, Statistics and Economics
Birkbeck College, University of London
10 August 2016
Abstract
We analyse the voting pattern in the June 23rdreferendum on the continued participation of the
United Kingdom in the European Union and evaluate the reasons for the results. We find that
regions where GDP per capita is low, a high proportion of people have low education, a high
proportion is over the age of 65 and there is strong net immigration are more likely to be
apprehensive of the E.U., consider the enlargement of the E.U. as having gone too far, be
suspicious of immigrants and not want them as neighbours and, most importantly, to vote for
Brexit. The fear of immigration does not seem to be fully justified in terms of the literature on
the labour market effects of immigrants in the UK. Looking at the response of the sterling
exchange to poll numbers we find that investors appear to view Brexit as a negative event.
Keywords: Brexit referendum; European Union.
JEL: E24, J6
*) Corresponding author: Gylfi Zoega, Department of Economics, University of Iceland, 2 Sæmundargata, 101
Reykjavik, Iceland. Email: [email protected]. Tel: +354 525 5230. The authors would like to thank Ron Smith and
Thorvaldur Gylfason for valuable comments.
2
1. Introduction
The world witnessed economic and political turmoil in the United Kingdom in the summer of
2016. A country known for the strength of its institutions, the tolerance of its population and
an outward looking and measured foreign policy, unilaterally decided to withdraw from the
European Union (E.U.) in a close-call referendum. The vote to leave on 23 June subsequently
created volatility in financial markets, a political crisis and a possible constitutional crisis
caused by the unwillingness of Scotland and Northern Ireland to leave the E.U. World
financial markets suffered turbulence with the shares of banks hit particularly hard.1 There
were political consequences for both of the main political parties in the UK as well as for
other countries where political parties have demanded referendums. The pattern of voting
revealed stark differences between regions, countries and generations within the United
Kingdom. Scotland voted with a large majority to remain in the E.U. and there was a majority
in Northern Ireland as well as in London while a large majority of electoral districts in
provincial England voted to leave.
In this paper, we explore the pattern of voting using data on NUTS 2 regions in the United
Kingdom in a search for an answer to the question why a majority of voters wanted to leave
the E.U.2 In particular, we will explain the pattern of voting with variables that measure
economic activity and demographic factors, as well as social values. We will first explore the
election results briefly and then discuss possible reasons for the leave vote before turning to
the statistical analysis. We then evaluate the results in the light of the empirical literature on
the effect of immigration on employment and wages in the UK. Finally, we analyse the
relationship between the sterling exchange rate and Brexit poll numbers to assess the view of
the market on the referendum.
1 See “Global markets lose record $3tn since Brexit vote” by Nicole Bullock, Financial Times, 27 June, 2016.
https://next.ft.com/content/91dd01b6-3caf-11e6-8716-a4a71e8140b0 2 The NUTS classification system (Nomenclature des unités territoriales statistiques) is a coherent regional
breakdown system administrated by Eurostat. Its purpose is to provide stable regional statistics for the European
Community. The stability aspect makes sure that published data refers to the same regional unit over a certain
period of time. Nevertheless, national interests sometimes require an amendment in the breakdown of a country
in order to capture more variety within the country. The amendments to the annexes follow a regulated
transmission, which guarantees that data published under an older NUTS version are compatible with the current
classification. This accounts for the difference in the number of regions between versions. The values measures
in this paper from the European Values Study (2011) follow the 2010 version of the NUTS system albeit the
output indicators are published under the current 2013 version, which has been accounted for (History of NUTS,
n.d.).
3
2. The election results
In the days before the election the results were judged to be too close to call. While the leave
vote had increased in the Financial Times polls in the weeks prior to the vote, it seemed that
the remain-side was strengthening in the few days before the referendum.3 Thus the leave side
had 50.6% in the polls taken on 17 June but had weakened to 48.3% on the day before the
referendum. The currency markets appeared to expect the remain-side to win since the
sterling exchange rate appreciated in the days before the voting. However, the leave side won
with 17,410,742 voters, or 51.9% of the total, wanting to leave the E.U. and 16,141,241, or
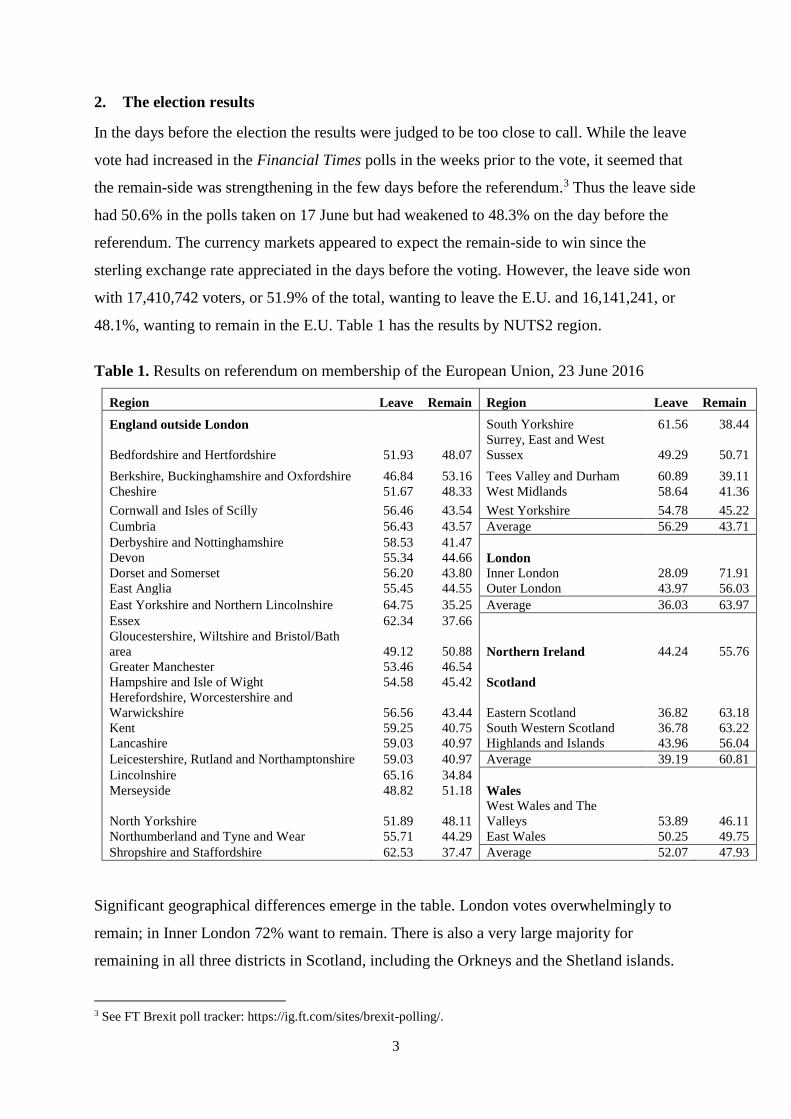
48.1%, wanting to remain in the E.U. Table 1 has the results by NUTS2 region.
Table 1. Results on referendum on membership of the European Union, 23 June 2016
Region Leave Remain Region Leave Remain
England outside London South Yorkshire 61.56 38.44
Bedfordshire and Hertfordshire 51.93 48.07
Surrey, East and West
Sussex 49.29 50.71
Berkshire, Buckinghamshire and Oxfordshire 46.84 53.16 Tees Valley and Durham 60.89 39.11
Cheshire 51.67 48.33 West Midlands 58.64 41.36
Cornwall and Isles of Scilly 56.46 43.54 West Yorkshire 54.78 45.22
Cumbria 56.43 43.57 Average 56.29 43.71
Derbyshire and Nottinghamshire 58.53 41.47
Devon 55.34 44.66 London
Dorset and Somerset 56.20 43.80 Inner London 28.09 71.91
East Anglia 55.45 44.55 Outer London 43.97 56.03
East Yorkshire and Northern Lincolnshire 64.75 35.25 Average 36.03 63.97
Essex 62.34 37.66
Gloucestershire, Wiltshire and Bristol/Bath
area 49.12 50.88 Northern Ireland 44.24 55.76
Greater Manchester 53.46 46.54
Hampshire and Isle of Wight 54.58 45.42 Scotland
Herefordshire, Worcestershire and
Warwickshire 56.56 43.44 Eastern Scotland 36.82 63.18
Kent 59.25 40.75 South Western Scotland 36.78 63.22
Lancashire 59.03 40.97 Highlands and Islands 43.96 56.04
Leicestershire, Rutland and Northamptonshire 59.03 40.97 Average 39.19 60.81
Lincolnshire 65.16 34.84
Merseyside 48.82 51.18 Wales
North Yorkshire 51.89 48.11
West Wales and The
Valleys 53.89 46.11
Northumberland and Tyne and Wear 55.71 44.29 East Wales 50.25 49.75
Shropshire and Staffordshire 62.53 37.47 Average 52.07 47.93
Significant geographical differences emerge in the table. London votes overwhelmingly to
remain; in Inner London 72% want to remain. There is also a very large majority for
remaining in all three districts in Scotland, including the Orkneys and the Shetland islands.
3 See FT Brexit poll tracker: https://ig.ft.com/sites/brexit-polling/.
4
The same can be said of Northern Ireland. In contrast, there is a majority for leaving in Wales,
although not a very large one. In East Wales the two sides are almost equal.4
It was in England outside London where the decision to leave the E.U. was made. The
leave-side won in every district except for Berkshire, Buckinghamshire and Oxfordshire,
where the remain-side had a significant majority; Gloucestershire, Wiltshire and Bristol,
where there was a narrow majority for remaining; Merseyside, again with a narrow majority;
and Surrey, East and West Sussex, where there was also a narrow majority. The first and the
last region surround London, the second includes the city of Bristol and surrounding areas and
the last includes the city of Liverpool and surrounding areas. The leave camp was strongest in
some of the regions that prospered during the industrial revolution in manufacturing and
declined due to globalisation at both the end of the 19th and the end of the 20th centuries. The
leave vote was close to 65% in Lincolnshire, which had a booming engineering industry in the
19th and the first half of the 20th century; in Yorkshire it was 65% in the East and 61.56% in
the South, the source of the coal and iron ore industries, including the centre of the textile
industry and the steel industry in the city of Sheffield; the leave vote was 62.53% in
Shropshire, which includes the Ironbridge Gorge known as the birthplace of the Industrial
Revolution, and Staffordshire, which includes the city of Stoke with its mining industry and
iron and steel industries; and the vote was almost 61% in the Tees Valley and Durham, a
leading producer of coal in England in the late 19th century. What these areas have in common
is that they have declined over the past century relative to London and the South East.5
However, this pattern is not visible in Scotland and Northern Ireland. Scotland, which
prospered during the industrial revolution producing linen and wool and had a strong
shipbuilding and steel industry and voted for the remain side, and voters in Northern Ireland,
where the industrial revolution transformed the city of Belfast, also voted to remain.
The regions voting to remain have generally prospered in recent decades. The service
sector has expanded for decades in London, in particular financial services, and the same
applies to a lesser extent to Liverpool in Merseyside. Other regions in England voting to
remain were Berkshire, Buckinghamshire and Oxfordshire and Bristol and surrounding areas.
4 East Wales covers Blaenau Gwent, Caerphilly (eastern half), Monmouthshire, Newport, South Powys and
Torfaen. 5 While memories of a better life in the past may have influenced voting behaviour in these districts, objective
accounts describe less than stellar standards of living during the industrial revolution. For example, the town of
Wigan northeast of Liverpool voted overwhelmingly for leaving the E.U. Yet the poverty of the town’s working
class extends into the Industrial Revolution, as described by George Orwell in his book The Road to Wigan Pier.
See Andres Higgins, “Wigan‘s Road to “Brexit”: Anger, Loss and Class resentments,” The New York Times, 6
July 2016.
5
In Bristol, both the IT sector as well as financial services have grown in recent decades and
replaced a declining manufacturing sector. Oxford has a growing hi-tech sector and benefits
from a supply of well-educated university graduates. Buckinghamshire on the outskirts of
London essentially shares the London labour market and Berkshire, which includes the city of
Reading, hosts the headquarters of many foreign multinationals. The same applies to Surrey,
which has many organisation and company headquarters and a generally a high standard of
living.
3. Reasons for leaving and remaining
We now turn to the possible reasons behind the decision to leave or remain within the E.U.
put forth in the debate that preceded the referendum. The arguments made by the advocates
for leaving centred on immigration and national autonomy. Thus, the supremacy of European
laws over British laws – as exemplified by the European Court of Justice – was deemed
unacceptable.6 Moreover, another related issue is the inability of the UK to stem the flow of
immigrants coming from other E.U. countries. One objective of the leave camp appears to be
to maintain access to the single European market in goods, services and capital – hence
protect the interests of the City and the manufacturing sectors – while reducing the flow of
immigrants coming mostly from Eastern Europe.
The counterargument made by those who wished to remain within the E.U. was that free
migration was one part of the four freedoms that define the Single Market set up in the Treaty
of Maastricht in 1993. The 27 remaining countries within the E.U. would never allow the UK
to withdraw from one of the four markets – having access to the common market in goods,
services and capital while not being a part of the common labour market. In addition,
participation in the Single Market through the European Economic Area would requires the
UK to adopt the E.U. rules and legislation that apply to the Single Market without having any
say in setting these rules as well as to pay an annual sum to the E.U. Thus, leaving the E.U.
would not bring any rewards while increasing uncertainty about future trading arrangements,
which would lower investment, employment and growth.7
6 By passing the European-Communities Act 1973 Parliament recognised the primacy of EU law over UK law.
This principle was in the following decades deepened and extended by the decision of the European Court of
Justice. 7 The following quotes are good examples of the arguments for and against leaving the EU :
Napoleon, Hitler, various people tried this out, and it ends tragically. The EU is an attempt to do this by
different methods. Boris Johnson, 14 May 2016. http://www.telegraph.co.uk/news/2016/05/14/boris-johnson-the-
E.U. -wants-a-superstate-just-as-hitler-did/
So it goes to this argument, as well, about sovereignty. The people who want us to leave, one of their arguments
is if we left, we’d have greater sovereignty and a greater ability to write our own laws. Now, that’s true in a
6
These arguments can be framed in the context of the literature on the optimal size of
countries. As argued by Alesina and Spolaore (1997), there are economies of scale in country
size in that expanding the size of a country reduces the fixed cost per inhabitant of providing
public goods, laws and regulations, operating government institutions and, in the absence of
trade with other countries, having access to a larger market. The cost of expanding the size of
a country, in contrasts, consists of increasing the heterogeneity of the population, making it
more difficult for the government to provide the type of goods and services that each ethnic or
cultural group demands. But the trade-off is altered by membership in the European Union
because free trade reduces the benefits of size by making it possible for a small country to
enjoy access to a larger market than its own and enjoy economic integration without political
integration.8 Gancia et al. (2016) argue that the political response to globalization in recent
decades is to remove borders by creating economic unions, leading to a reduction in country
size. In the context of the European Union, each county has to accept the common rules and
regulations that apply in the Single Market.
In the context of the Brexit debate, participation in the European Union and the Single
Market has allowed the UK to benefit from access to a large market without giving up
political independence as the remain side argued. This applies particularly to Scotland, having
only about 5 million inhabitants, and its hopes for future independence. But the leave
campaign argues that the rules of the Single Market infringe too much on the UK’s
sovereignty and ability to satisfy the wishes of its population, in particular when it comes to
immigration. Set in this context, the decision by the English regions to leave the E.U. could be
explained by their inhabitants having different attitudes towards immigration or facing more
immigration than other regions.
technical sense, but is it really true that we’d become more powerful; that we’d be able to get things done? And I
think the answer to that is no. Let’s take Caterpillar, let’s take this great business, right? You’re making engines,
for instance, which are governed to some extent by single market rules in EU rope. If we were to leave, if you
want to sell your engines to EU rope you’ve still got to meet those rules. The only difference is, today I’m sat
round the table helping to write those rules. I can listen to you here at Caterpillar and make sure the rules are
written in a way that will help British business. If we’re outside the EU , you’ve got to meet all those rules, but
you have absolutely no accountability for what they are. David Cameron, speech at Caterpillar, 28 April 2016.
(https://www.gov.uk/government/speeches/pm-speech-at-caterpillar-on-the-E.U. -referendum-28-april-2016). 8Alesina et al. (2000) argue that under free trade and global markets even small cultural or ethnic groups can
benefit from forming small, more homogeneous, political entities while Alesina and Wacziarg (1998) show that
empirically smaller countries are more open to trade.

7
4. Values, the economy and the Brexit vote
To explain the geographical dispersion in Table 1 we resort to economic variables that
measure differences in economic performance, demographic variables that measure
differences in the average level of education and the average age, and variables that measure
differences in values and attitudes between the regions.
The voting pattern may reflect differences in economic performance between the regions
of the UK. For most of the past century the regions in Northern England have been declining
relative to London and the South. The same applies to Scotland, which saw most of its
manufacturing industries wiped out in the 1980s. The stark difference between vibrant
London, which benefits from the financial sector in the City and a booming service economy,
and the South East, on the one hand, and the regions in the north of England, Scotland and
Northern Ireland may explain differences in the pattern of voting. Thus low income workers
in the North may fear immigration and trade more than the high income workers in London
and the South. We will use output per capita and the rate of unemployment at the regional
level to test for these effects on the pattern of voting. In a later section we discuss the
empirical evidence on the effect of immigration.
One important variable is the level of migration in recent years, which could possibly
explain the pattern of the leave vote across regions. Migrants have played an important role in
the economic recovery that followed the recession caused by the financial crisis of 2008.
Thus, economic growth has primarily occurred in London and the South East, powered by the
influx of immigrant labour, mostly from other E.U. countries. The capital and the South East
have created more than half of all growth from 2009 to 2014 according to Deutsche Bank
estimates.9 These results also suggest that the correlation between growth in London and other
regions of England is quite low. In 2014 there were around 3 million people living in the UK
who were citizens of another E.U. country, which was about 5% of the UK population at the
time, of which 2 million are in work, which is about 7% of the working population.10
Nevertheless, the employment rate of UK-born citizens was at a record high, and the
participation rate has not declined, which does not, prima facie, suggest that UK-born
individuals were suffering in terms of employment levels as a result of migration.
Thirdly, there is also the possibility that the districts differ in terms of the age profile of
the population. We include the proportion of 65 year olds and older of the total population
9 See Deutsche Bank, markets Research, special report (2016), “Divided nation: Why Britain voted for Brexit
and what it means for sterling.” 10See https://fullfact.org/immigration/E.U. -migration-and-uk/.
8
among our explanatory variables. The older generation differs from the younger one in
remembering the times before the UK joined the then European Community in 1973 and may
be driven by better knowledge or nostalgia when voting. In addition they are more likely to
turn up at the polls.11
Fourthly, we include the proportion of the population who have not completed secondary
school. This group may feel more threatened by increased immigration of less-skilled workers
coming from the other member states, especially from Eastern Europe, and hence want the
UK to “take control” of the number of immigrants arriving in the country. We discuss the
empirical evidence in a later section, which does suggest that the low education workers have
more to fear from immigration.
Fifth, the values and attitudes of the population may differ between the districts. The
districts may be characterised by different sets of values and attitudes or social capital to sue a
term from sociology. The social capital of a region may determine its ability to absorb
immigrants.12 Moreover, values and attitudes towards E.U. extension, towards immigration in
general and the importance for the UK of not to share political power with other E.U. member
states may differ between regions. In essence, values may differ irrespective of the economic
situation, education and age structure. These differences may be reflected in responses to
questions in value surveys. We include responses from the European Values Study (EVS,
2011) to questions on the attitude to having neighbours who are immigrants, about the effect
of immigrants on society, questions about respondents’ attitudes towards the European Union,
whether the E.U. should take in more member states, and, finally, whether the UK should
accept new immigrants from developing countries.13
5. Canonical correlations
We will split our variables into two groups. There is a group of variables, summarised by a
latent variable E that stands for the economy, which are exogenous to voters’ decision in the
referendum, state variables that cannot be changed by them. These are GDP per capita in each
district, the rate of unemployment, the share of the population with low levels of education,
the share over 65 years of age, and the rate of net immigration.14 These variables may then
11 See http://www.economist.com/blogs/economist-explains/2014/10/economist-explains-24 and
https://next.ft.com/content/1ce1a720-ce94-3c32-a689-8d2356388a1f. 12 See Coleman (1990), Putnam (2000), Knack and Keefer (1997), and Arnorsson and Zoega (2016). 13 The survey is the European Values Study in 2008 and 2009. It is chosen because it is the only survey on values
known to the authors that publishes results using the NUTS classification system. 14 Unemployment is the rate of unemployment in 2015 for workers aged 15 and over; GDP per capita is
measured at current market prices in thousands of euros; education is the percentage of inhabitants, between 25
9
possibly affect the attitudes of voters, including their voting behaviour. Our values variables
fall into several groups, summarised by the latent variable V.
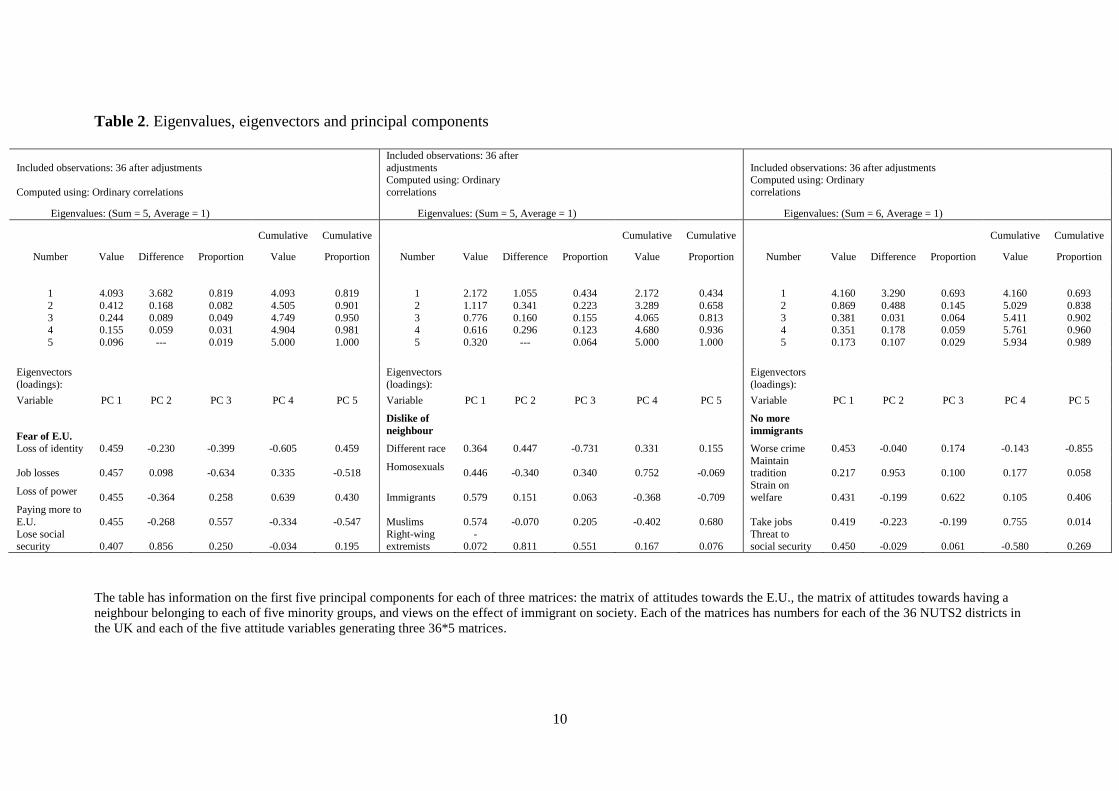
Turning first to values, we summarize the information in V by calculating principal
components (PC) as shown in Table 2. The first set of variables measure how many are “very
afraid” of the E.U. because they will lose social security; lose national identity and culture;
end up paying more and more to the E.U.; fear that Britain will lose power in the world; and
lose jobs in Britain. The first PC of a matrix of 36 observations (districts) and these five
values variables explains 82% of the variation in the matrix. The eigenvector corresponding to
the first PC has similar values for all five variables. It follows that people who fear the
influence of the E.U. express this fear in all five dimensions. We will include the first PC in
the subsequent testing of voting behaviour and label it Fear of E.U.
The second group of variables measuring respondents’ dislike of having various minority
groups as neighbours: These are people of a different race; right-wing extremists; Muslims;
immigrants/foreign workers; and homosexuals. The first PC explains 43% of the variation in
the matrix and the corresponding eigenvector has positive weights for all groups apart from
right-wing extremists. Thus people who dislike the other four groups tend not to dislike the
right-wing extremists. We label this PC Dislike of neighbour.
The third group of variables measures the extent to which respondents fear the effect of
immigrants on society: That immigrants take jobs away from natives; that a country’s cultural
life is undermined by immigrants; that immigrants make crime problems worse; that
immigrants are a strain on a country’s welfare system; that in the future the proportion of
immigrants will become a threat to society; and that it is better if immigrants maintain their
distinct customs and traditions. The first PC explains 69% of the variation in the data and the
values in the eigenvector are similar for all six variables. We call this PC Dislike of
immigrants.
In addition to the Fear of E.U., Dislike of immigrant and Dislike of neighbour variables
we add the share of respondents who agree that E.U. enlargement has already gone too far,
labelled E.U. enlargement and the share who think that the UK should not receive any more
immigrants from less developed countries or No more immigrants. We also use the share of
voters who wanted the UK to leave the European Union.
and 64 years of age, with less than primary and lower secondary education in 2015; the share of the elderly is
measured as the share of the total population 65 years old or older; immigration is measured as net migration as a
share of the population in each district.
10
Table 2. Eigenvalues, eigenvectors and principal components
Included observations: 36 after adjustments
Included observations: 36 after
adjustments Included observations: 36 after adjustments
Computed using: Ordinary correlations
Computed using: Ordinary
correlations
Computed using: Ordinary
correlations
Eigenvalues: (Sum = 5, Average = 1) Eigenvalues: (Sum = 5, Average = 1) Eigenvalues: (Sum = 6, Average = 1)
Cumulative Cumulative Cumulative Cumulative Cumulative Cumulative
Number Value Difference Proportion Value Proportion Number Value Difference Proportion Value Proportion Number Value Difference Proportion Value Proportion
1 4.093 3.682 0.819 4.093 0.819 1 2.172 1.055 0.434 2.172 0.434 1 4.160 3.290 0.693 4.160 0.693
2 0.412 0.168 0.082 4.505 0.901 2 1.117 0.341 0.223 3.289 0.658 2 0.869 0.488 0.145 5.029 0.838
3 0.244 0.089 0.049 4.749 0.950 3 0.776 0.160 0.155 4.065 0.813 3 0.381 0.031 0.064 5.411 0.902 4 0.155 0.059 0.031 4.904 0.981 4 0.616 0.296 0.123 4.680 0.936 4 0.351 0.178 0.059 5.761 0.960
5 0.096 --- 0.019 5.000 1.000 5 0.320 --- 0.064 5.000 1.000 5 0.173 0.107 0.029 5.934 0.989
Eigenvectors
(loadings):
Eigenvectors
(loadings):
Eigenvectors
(loadings):
Variable PC 1 PC 2 PC 3 PC 4 PC 5 Variable PC 1 PC 2 PC 3 PC 4 PC 5 Variable PC 1 PC 2 PC 3 PC 4 PC 5
Fear of E.U.
Dislike of
neighbour
No more
immigrants
Loss of identity 0.459 -0.230 -0.399 -0.605 0.459 Different race 0.364 0.447 -0.731 0.331 0.155 Worse crime 0.453 -0.040 0.174 -0.143 -0.855
Job losses 0.457 0.098 -0.634 0.335 -0.518 Homosexuals
0.446 -0.340 0.340 0.752 -0.069 Maintain tradition 0.217 0.953 0.100 0.177 0.058
Loss of power 0.455 -0.364 0.258 0.639 0.430 Immigrants 0.579 0.151 0.063 -0.368 -0.709
Strain on
welfare 0.431 -0.199 0.622 0.105 0.406 Paying more to
E.U. 0.455 -0.268 0.557 -0.334 -0.547 Muslims 0.574 -0.070 0.205 -0.402 0.680 Take jobs 0.419 -0.223 -0.199 0.755 0.014
Lose social security 0.407 0.856 0.250 -0.034 0.195
Right-wing extremists
-0.072 0.811 0.551 0.167 0.076
Threat to social security 0.450 -0.029 0.061 -0.580 0.269
The table has information on the first five principal components for each of three matrices: the matrix of attitudes towards the E.U., the matrix of attitudes towards having a
neighbour belonging to each of five minority groups, and views on the effect of immigrant on society. Each of the matrices has numbers for each of the 36 NUTS2 districts in
the UK and each of the five attitude variables generating three 36*5 matrices.
11
We use canonical correlation analysis, a method proposed by Harold Hotelling in 1936.
The observed variables are separated into two groups and the weights chosen so as to
maximise the correlation between the two latent variables E and V, each latent variable
summarising the information contained in one group of variables. In our context, we take
unemployment, GDP per capita, the share of the population with low education, the share of
the older workers and net immigration and summarise these in the latent variable E and relate
E to the latent variable V that measures voting for Brexit, and values and attitudes towards the
E.U. and immigrants. Thus we hypothesize that there are two latent variables; economic,
demographic and migration rates on the one hand and values and attitudes on the other hand,
each of which depends on a set of observable variables. We calculate the latent variables by
taking a weighted average of the underlying observable variables to maximise the correlation
between the two latent variables, which are economic and demographic E and values V. The
canonical correlation is the bivariate correlation between the two variables. The estimated
model, shown in Table 3, consists of several observed measures, which are summarized by
two different latent variable sets, E and V.
The results of the analysis report several statistics. These include the Canonical
correlation coefficient, which measures the correlation between the two latent variables E and
V in a given canonical function; the Canonical function, defined as a set of standardized
coefficients from the observed variable sets; the Standardized coefficient, defined as the set of
weights attached to observed variables in the two variable sets to yield the linear
combinations that maximize the correlation between the two latent variables, i.e. the canonical
correlation;15and the Structure coefficient, defined as the bivariate correlation between an
observed variable and a latent variable, E or V, which help to describe the structure of the
latent variable by showing which observed variables contribute to the creation of the latent
variable.16
15 They are standardised due to the constraint that the variance of the pair of canonical variables in a canonical
function are equal, 𝑣𝑎𝑟(𝐸𝑖∗) = 𝑣𝑎𝑟(𝑉𝑖
∗) = 1 ∀ 𝑖 where i represents the number of canonical functions. This is
vital in order to obtain unique values for the coefficients. 16In addition, the Squared structure coefficient measures the proportion of variance an observed variable linearly
shares with a latent variable and the Communality coefficient gives the proportion of variance in each variable
that is explained by all the canonical functions that are interpreted. It informs the researcher about the usefulness
of the observed variable for the whole model.

12
Table 3. The economy, values and the leave vote in 36 districts
Function 1 Function 2 Function 3 Function 4 Function 5
Variable
Std.
Coef
Str.
Coef Str. Coef 2
Std.
Coef
Str.
Coef Str. Coef 2
Std.
Coef
Str.
Coef Str. Coef 2
Std.
Coef
Str.
Coef Str. Coef 2
Std.
Coef
Str.
Coef Str. Coef 2 Com. Coef
Inputs: E
Unemployment -0.053 -0.037 0.14% 1.332 0.642 41.17% 0.413 0.408 16.65% 0.188 0.573 32.87% 0.437 -0.303 9.18% 100.00%
GDP -0.282 -0.783 61.34% -0.108 0.102 1.03% 1.207 0.141 2.00% -0.972 -0.502 25.20% -0.407 -0.323 10.43% 100.00%
Low education 0.660 0.612 37.44% -0.617 -0.039 0.15% 0.599 0.417 17.36% -0.276 0.521 27.19% -1.103 -0.423 17.87% 100.00%
Migration 0.491 0.308 9.46% 0.582 0.304 9.23% -0.520 -0.519 26.95% -0.495 -0.733 53.66% -0.467 -0.084 0.70% 100.00%
Elderly 0.330 0.672 45.14% 0.243 -0.183 3.35% 1.123 0.126 1.59% -0.644 -0.288 8.31% 0.768 0.645 41.60% 100.00%
Outputs: V
Fear of E.U. 0.062 0.424 17.97% 1.256 0.190 3.59% -0.877 -0.616 37.95% 0.937 0.331 10.96% -0.364 0.525 27.56% 98.03%
Dislike of
immigrants 0.086 0.544 29.56% -1.111 -0.052 0.27% 0.792 -0.082 0.68% 0.056 0.232 5.37% 1.172 0.799 63.78% 99.65% Dislike of
neighbour -0.090 0.325 10.56% 0.204 0.327 10.70% 0.090 0.317 10.02% 0.619 0.336 11.28% -0.021 0.185 3.43% 45.98%
Leave 0.920 0.979 95.86% -0.296 -0.076 0.58% -0.111 0.042 0.18% -0.293 0.051 0.26% -0.568 -0.164 2.69% 99.58%
No more
immigrants 0.091 0.310 9.59% 0.969 0.641 41.14% 0.564 0.646 41.71% 0.103 -0.226 5.10% -0.028 0.156 2.43% 99.96% E.U.
enlargement 0.084 0.324 10.52% -0.016 0.405 16.38% -0.475 -0.288 8.29% -1.151 -0.441 19.43% 0.275 0.621 38.59% 93.21%
Canonical correlation coefficients Squared canonical correlation coefficients
1 2 3 4 5 1 2 3 4 5
0.790 0.512 0.351 0.187 0.128 0.624 0.262 0.123 0.035 0.016
F-statistics 1.5044 0.69 0.4286 0.2462 0.2415
Prob. 0.0685 0.8258 0.947 0.9589 0.787
13
The interpretation of each canonical correlation depends on the sign and size of both the
standardized coefficient and the structured coefficient. When they have opposite signs one
pays more attention to the structured coefficient because if a given variable is positively
correlated with the latent variable but has a negative weight (standardized coefficient) then
this implies that there is multicollinearity, i.e. the variable is correlated with some of the other
variables that are included.17
Looking at the first canonical function in Table 3, which is the only one that is statistically
significant with F=1.5, shows that low levels of education, a high proportion of people over
65, low GDP per capita and high rates of immigration may create a social climate that fosters
fears about the European Union, dislike of neighbours other than right-wing extremists, a
negative attitude towards immigrants and a belief that the enlargement of the E.U. has already
gone too far in addition to a willingness to prohibit people coming from less developed
countries coming into the UK. Most importantly, these feelings go together with voting for
leaving the E.U. in the referendum.
A low level of output per capita, a large share of the population lacking education, many
over the age of 65 and immigration all contribute positively to E. Fear of E.U., dislike of
minority group neighbours, being suspicious of foreigners, unwillingness to accept migrants
from the less-developed world, not wanting the E.U. to enlarge more, and voting for Brexit
contribute positively to the latent variable V. The correlation between the two latent variables,
E and V, is then 0.79.
The figure below shows the relationship between the latent variable E – measuring
economic variables, the extent of low education and the share of those over age 65 – and the
share of the leave vote in the referendum.
17 See Sherry and Henson (2005) and Tacq and Tacq (1997) on interpreting the results of a canonical correlation
analysis.
14
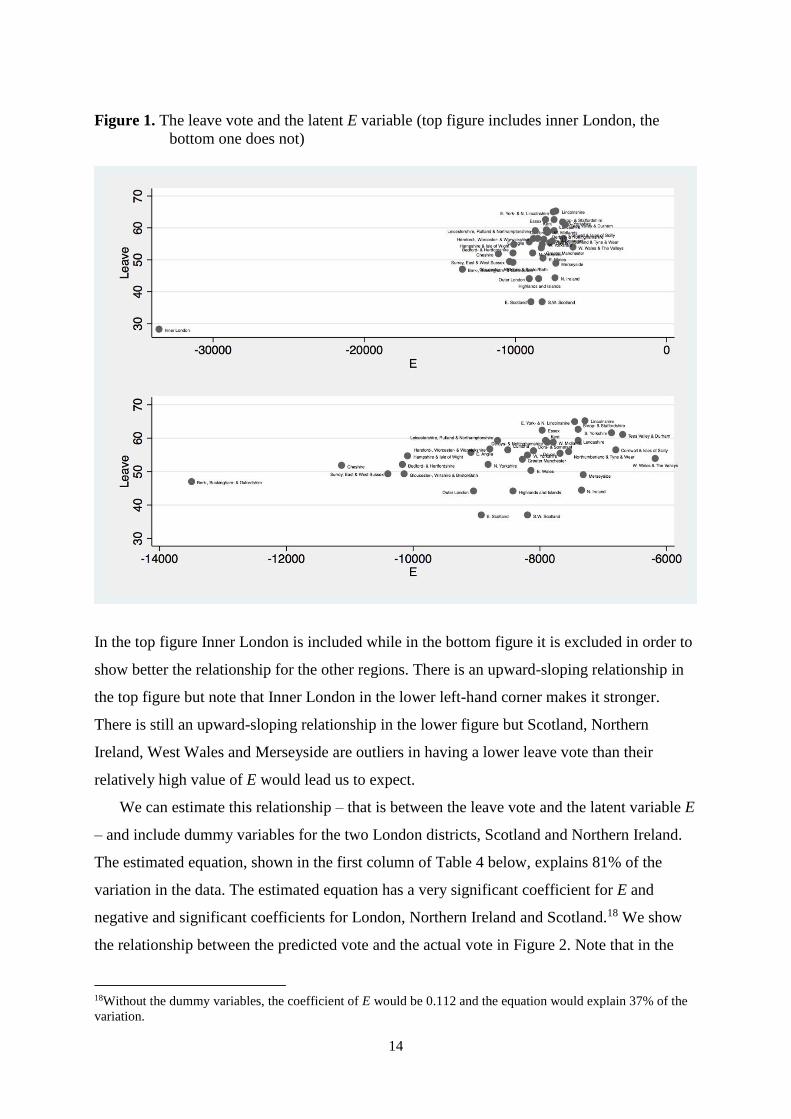
Figure 1. The leave vote and the latent E variable (top figure includes inner London, the
bottom one does not)
In the top figure Inner London is included while in the bottom figure it is excluded in order to
show better the relationship for the other regions. There is an upward-sloping relationship in
the top figure but note that Inner London in the lower left-hand corner makes it stronger.
There is still an upward-sloping relationship in the lower figure but Scotland, Northern
Ireland, West Wales and Merseyside are outliers in having a lower leave vote than their
relatively high value of E would lead us to expect.
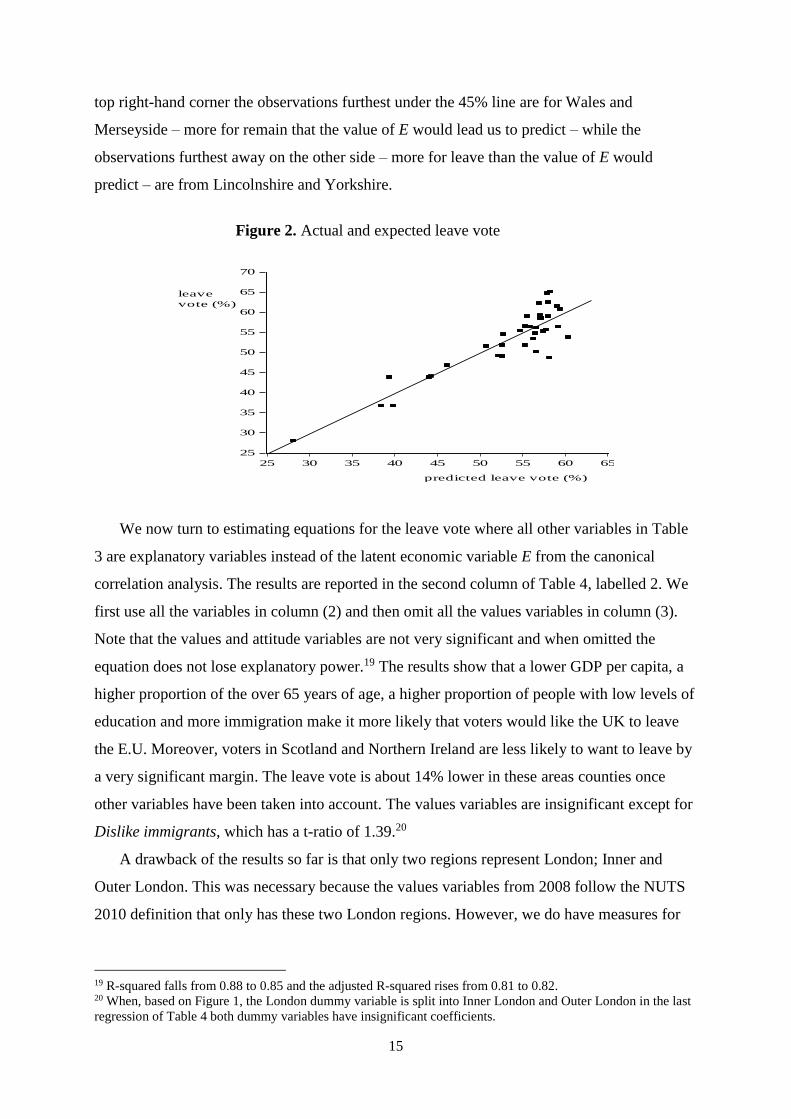
We can estimate this relationship – that is between the leave vote and the latent variable E
– and include dummy variables for the two London districts, Scotland and Northern Ireland.
The estimated equation, shown in the first column of Table 4 below, explains 81% of the
variation in the data. The estimated equation has a very significant coefficient for E and
negative and significant coefficients for London, Northern Ireland and Scotland.18 We show
the relationship between the predicted vote and the actual vote in Figure 2. Note that in the
18Without the dummy variables, the coefficient of E would be 0.112 and the equation would explain 37% of the
variation.
15
top right-hand corner the observations furthest under the 45% line are for Wales and
Merseyside – more for remain that the value of E would lead us to predict – while the
observations furthest away on the other side – more for leave than the value of E would
predict – are from Lincolnshire and Yorkshire.
Figure 2. Actual and expected leave vote
25
30
35
40
45
50
55
60
65
70
25 30 35 40 45 50 55 60 65
leave
vote (%)
predicted leave vote (%)
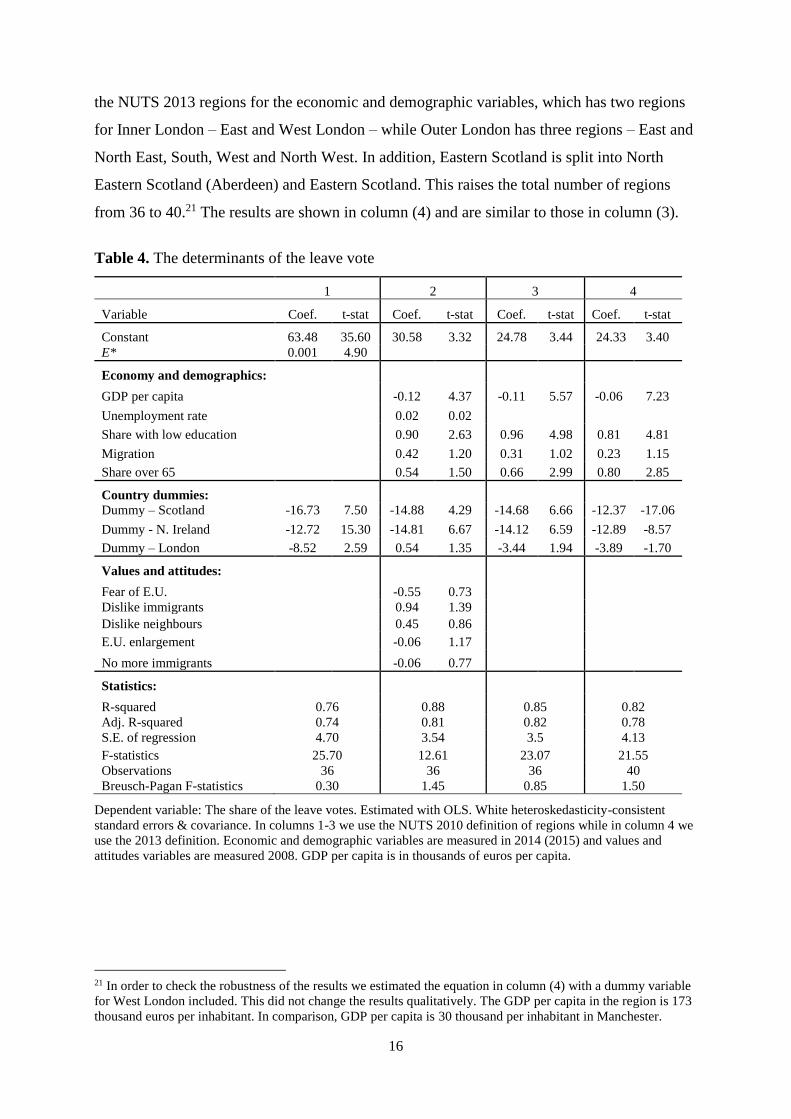
We now turn to estimating equations for the leave vote where all other variables in Table
3 are explanatory variables instead of the latent economic variable E from the canonical
correlation analysis. The results are reported in the second column of Table 4, labelled 2. We
first use all the variables in column (2) and then omit all the values variables in column (3).
Note that the values and attitude variables are not very significant and when omitted the
equation does not lose explanatory power.19 The results show that a lower GDP per capita, a
higher proportion of the over 65 years of age, a higher proportion of people with low levels of
education and more immigration make it more likely that voters would like the UK to leave
the E.U. Moreover, voters in Scotland and Northern Ireland are less likely to want to leave by
a very significant margin. The leave vote is about 14% lower in these areas counties once
other variables have been taken into account. The values variables are insignificant except for
Dislike immigrants, which has a t-ratio of 1.39.20
A drawback of the results so far is that only two regions represent London; Inner and
Outer London. This was necessary because the values variables from 2008 follow the NUTS
2010 definition that only has these two London regions. However, we do have measures for
19 R-squared falls from 0.88 to 0.85 and the adjusted R-squared rises from 0.81 to 0.82. 20 When, based on Figure 1, the London dummy variable is split into Inner London and Outer London in the last
regression of Table 4 both dummy variables have insignificant coefficients.
16
the NUTS 2013 regions for the economic and demographic variables, which has two regions
for Inner London – East and West London – while Outer London has three regions – East and
North East, South, West and North West. In addition, Eastern Scotland is split into North
Eastern Scotland (Aberdeen) and Eastern Scotland. This raises the total number of regions
from 36 to 40.21 The results are shown in column (4) and are similar to those in column (3).
Table 4. The determinants of the leave vote
1 2 3 4
Variable Coef. t-stat Coef. t-stat Coef. t-stat Coef. t-stat
Constant 63.48 35.60 30.58 3.32 24.78 3.44 24.33 3.40
E* 0.001 4.90
Economy and demographics:
GDP per capita -0.12 4.37 -0.11 5.57 -0.06 7.23
Unemployment rate 0.02 0.02
Share with low education 0.90 2.63 0.96 4.98 0.81 4.81
Migration 0.42 1.20 0.31 1.02 0.23 1.15
Share over 65 0.54 1.50 0.66 2.99 0.80 2.85
Country dummies:
Dummy – Scotland -16.73 7.50 -14.88 4.29 -14.68 6.66 -12.37 -17.06
Dummy - N. Ireland -12.72 15.30 -14.81 6.67 -14.12 6.59 -12.89 -8.57
Dummy – London -8.52 2.59 0.54 1.35 -3.44 1.94 -3.89 -1.70
Values and attitudes:
Fear of E.U. -0.55 0.73
Dislike immigrants 0.94 1.39
Dislike neighbours 0.45 0.86
E.U. enlargement -0.06 1.17
No more immigrants -0.06 0.77
Statistics:
R-squared 0.76 0.88 0.85 0.82
Adj. R-squared 0.74 0.81 0.82 0.78
S.E. of regression 4.70 3.54 3.5 4.13
F-statistics 25.70 12.61 23.07 21.55
Observations 36 36 36 40
Breusch-Pagan F-statistics 0.30 1.45 0.85 1.50
Dependent variable: The share of the leave votes. Estimated with OLS. White heteroskedasticity-consistent
standard errors & covariance. In columns 1-3 we use the NUTS 2010 definition of regions while in column 4 we
use the 2013 definition. Economic and demographic variables are measured in 2014 (2015) and values and
attitudes variables are measured 2008. GDP per capita is in thousands of euros per capita.
21 In order to check the robustness of the results we estimated the equation in column (4) with a dummy variable
for West London included. This did not change the results qualitatively. The GDP per capita in the region is 173
thousand euros per inhabitant. In comparison, GDP per capita is 30 thousand per inhabitant in Manchester.
17
Using the estimation (3) in Table 4, an increase in GDP per capita of 5000 euros – such as
between the West Midlands and Surrey and Sussex – will lower the share of the leave vote by
0.55%; an increase in the share of the population by 5% over age 65 – such as between West
Yorkshire and Herefordshire, Worcestershire and Warwickshire – will increase the leave vote
by 3.3%; and an increase in the share of the population with low education by 5% – such as
between Inner London and Dorset – will increase the leave vote by 4.8%.The coefficient of
the migration variable is less significant (insignificant at the 10% level) but an increase in the
rate of immigration by 2% is would raise the leave vote by 1.55%. Thus, the leave vote is
more sensitive to changes in the share of the less educated and the share of the old.
The vote for leaving was lowest in Inner London (28.09%) and highest in Lincolnshire
(65.16%). We use the equation in column (2) of Table 4 to explain the difference in Table 5
below.
Table 5. Difference between Inner London and Lincolnshire explained
Variable Inner London Lincolnshire Coefficient Difference
Leave vote % 28.09 65.16 37.07
GDP per capita 119 25.9 -0.11 10.24
Share with low education 12.95 23.9 0.96 10.51
Migration 5.65 8.8 0.31 0.98
Share over 65 8.88 22.64 0.66 9.08
Residual 6.26
The difference in the leave vote is 37.07% with Lincolnshire voting heavily to leave and Inner
London to stay. This can be explained by GDP per capita being much higher in London,
which leads us to predict that the leave vote would be 10.2% lower there; the share of the
population with less education being lower in London, which gives a 10.5% lower leave vote
in London; and the share of the over 65 years of age being lower in London, which gives a
9.1% lower leave vote. In contrast, differences in the level of migration do not play a big role.
The residual is 6.3%, which is the unexplained leave vote in Lincolnshire.
The difference between the economic fortunes of London and the rest of the country is
highlighted in Figure 3, which plots the average annual growth of GDP per capita from 2000
to 2014 against the level of GDP per capita in 2000. Inner London starts out having three
times the average level of GDP per capita in 2000 but grows faster than any other region in
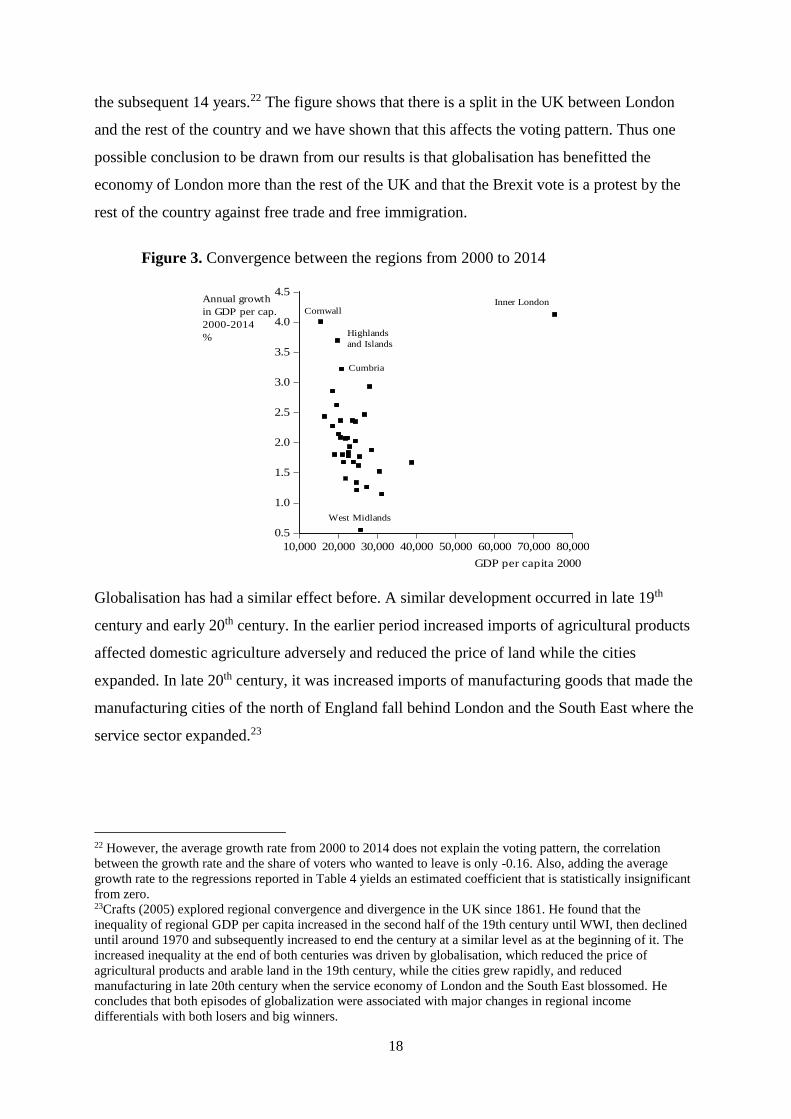
18
the subsequent 14 years.22 The figure shows that there is a split in the UK between London
and the rest of the country and we have shown that this affects the voting pattern. Thus one
possible conclusion to be drawn from our results is that globalisation has benefitted the
economy of London more than the rest of the UK and that the Brexit vote is a protest by the
rest of the country against free trade and free immigration.
Figure 3. Convergence between the regions from 2000 to 2014
0.5
1.0
1.5
2.0
2.5
3.0
3.5
4.0
4.5
10,000 20,000 30,000 40,000 50,000 60,000 70,000 80,000
Annual growth
in GDP per cap.
2000-2014
%
GDP per capita 2000
Inner LondonCornwall
Highlands
and Islands
Cumbria
West Midlands
Globalisation has had a similar effect before. A similar development occurred in late 19th
century and early 20th century. In the earlier period increased imports of agricultural products
affected domestic agriculture adversely and reduced the price of land while the cities
expanded. In late 20th century, it was increased imports of manufacturing goods that made the
manufacturing cities of the north of England fall behind London and the South East where the
service sector expanded.23
22 However, the average growth rate from 2000 to 2014 does not explain the voting pattern, the correlation
between the growth rate and the share of voters who wanted to leave is only -0.16. Also, adding the average
growth rate to the regressions reported in Table 4 yields an estimated coefficient that is statistically insignificant
from zero. 23Crafts (2005) explored regional convergence and divergence in the UK since 1861. He found that the
inequality of regional GDP per capita increased in the second half of the 19th century until WWI, then declined
until around 1970 and subsequently increased to end the century at a similar level as at the beginning of it. The
increased inequality at the end of both centuries was driven by globalisation, which reduced the price of
agricultural products and arable land in the 19th century, while the cities grew rapidly, and reduced
manufacturing in late 20th century when the service economy of London and the South East blossomed. He
concludes that both episodes of globalization were associated with major changes in regional income
differentials with both losers and big winners.

19
6. Economic interests and the pattern of voting
It is easy to dismiss the leave vote as based on irrational fear of free trade and the free
mobility of workers. The currency market seems to view Brexit as a bad event in that it
caused capital outflows, not inflows. Data on the contribution of immigrants to the UK
economy also suggest that voters made a mistake. In a recent paper, Dustman and Frattini
(2013) study the net fiscal contribution of immigrants to the UK. They find that E.U.
immigrants have a positive net contribution to the budget, while non-E.U. immigrants and
natives have a negative contribution. Thus recent E.U. immigrants (who immigrated since
2000) are more likely to be employed than native workers, less likely to live in social housing
and receiving lower benefits. Between 2001 and 2011 the net fiscal contribution of those who
arrived after 1999 amounted to 22.1 billion GBP. So did the UK make a mistake by voting to
leave?
We must begin by acknowledging that voters differ in terms of the industries that employ
them, their level of education and their exposure to international trade and immigration. It is
entirely possible that both voters who voted to leave, as well as those who voted to remain,
voted in their self-interest. Perhaps the well paid and well educated workers in the financial
services and other industries that have flourished in the Single Market voted to remain out of
self-interest while the less well paid and less educated workers in non-tradable sectors voted
to leave, also out of self-interest. In an interesting study, which is directly comparable to ours,
Lars Jonung (2004) studied voting patterns in the 2003 Swedish referendum on whether to
adopt the euro or keep the Swedish krona. He used the results of exit polls conducted by the
public broadcaster Sveriges Television (SVT), which yielded a response of around 11,000
voters to 38 questions, and found that the pattern of voting was consistent with the self-
interest of voters based on the theory of optimum currency areas. Thus the yes vote was
strongest among voters in the tradable sector, in high-growth regions, and, as in our results,
among high-income workers and the well-educated. In contrast, the no-vote was strongest
among workers in the public sector, among workers with low income, the unemployed and
the less educated. Political attitudes towards European integration also influenced the voting
decision although these may be correlated with income and education, as in our study. In
another study yielding similar results, Mayda (2006) studied data from several countries and
found that skilled individuals favour immigration when the native workers are more skilled
than immigrants and oppose it otherwise. Hellwig and Sinni (2016) conducted a survey in
Britain and found that the qualities of different immigrant groups affect the attitude of the
public towards them. Thus security fears affect attitudes towards Muslim immigrants while
20
economic concerns affect attitudes towards Eastern European immigrants. Also, concerns
about crime affect attitudes towards the latter groups while cultural threats are more
associated with Muslim immigrants.
Immigration may affect average wages in a country and also relative wages across skill
and occupational groups. Immigration could be neutral in simply increasing the population of
a country if immigrants are no different in their composition across age, education and
occupational groups from native workers. But they may differ. An influx of rich millionaires
– such as the many “non-doms” (that is people with non-domiciled status) residing in London
– will increase demand for output and services and the demand for labour and can thus be
expected to raise wages of the working force. In contrast, the immigration of low-wage
workers into such occupations as services and construction may add primarily to the potential
output of the country and less to aggregate demand. This applies particularly if these workers
spend their earnings in their countries of origin. Relative wages may also be affected if the
immigrants are primarily low skilled or going into certain professions such as unskilled
services. There is also the possibility that immigrants from Eastern Europe may have lower
reservation wages because they spend their earning in their countries of origin where prices
are lower or because they are used to a lower standards of living. The lower reservation wages
may affect average real wages across the economy or relative wages if the immigrant workers
are more heavily represented in such sectors as unskilled services and construction.
There is a broad consensus in the literature on UK immigration that the share of
immigrants in the labour force has had at most a very small effect on average native wages
and employment.24 In an early paper on the effect of the influx of workers coming from
Eastern Europe, Gilpin et al. (2006) fail to find any effect on unemployment. Lemos and
Portes (2008) find only a limited effect of the free movement of workers from Central and
Eastern Europe on the UK labour market, both wages and unemployment. Wadsworth (2010)
reviews the literature on the evidence on the effects of immigration on the UK labour market
and finds that immigration has not had a notable effect on employment or wages although
there are some indications of downward pressure on wages in the low-skill sector. These
downward effects are not large. Reed and Latorre (2009) use LFS data on hourly wages from
2001 to 2007 and subdivide the labour market along occupational and regional lines. They
24 In the US the results of Card (1990) and Borjas (2003) has created a debate on the effect of immigrants on
native wages. In a more recent paper Card (2005) finds no adverse effect on the relative wages of the low skilled
in US cities. Ottaviano and Peri (2012) also fail to find an adverse effect on the relative wages of the unskilled.
21
find that a 1% increase in the share of migrants in the UK working-age population (like from
9% to 10%) would reduce wages by around 0.3%. This effect is only significant at the 10%
level. Dustman et al. (2005) found very weak effect on the employment outcomes of native
workers in the UK. Interestingly, they found a positive relationship between changes in the
share of immigrants and changes in wages for a slightly earlier period although this effect is
statistically poorly determined. In a recent government report, Devlin et al. (2014) find that
immigration has had very little effect on the employment of the UK work force. In particular,
they find that the employment rates among E.E.A. (European Economic Area) immigrants
exceed those of the native population and that the inactivity rates among these immigrants
have been falling for twenty years. The E.E.A. migrants also have lower unemployment rates
than native UK workers. Manacorda et al. (2012) provide one explanation for the limited
effect of immigrants on the wages of native workers. They show using a pooled time series of
British cross-sectional micro data on male wages and employment from the mid-1970s to the
mid-2000s that natives and immigrants are imperfect substitutes, so that an increase in
immigration reduces the wages of immigrants relative to natives.
There is some evidence that the lowest skilled workers in the UK may be adversely
affected by immigration. Dustman et al. (2013) found that each 1% increase in the share of
migrants in the UK-born working-age population caused a 0.6% fall in wages of the 5%
lowest paid workers and an increase in the wages of higher paid workers. Nickell and
Salaheen (2008) found that a 1% increase in the share of migrants in the unskilled and semi-
skilled service sector reduced average wages in that occupation by 0.5%. In a recent paper,
Nickell and Saleheen (2015) explore the effect of immigration on average wages (not native
wages) while considering different occupational groups at the regional level instead of skill
levels. They measure wages by the average hourly wage of full-time employees. The findings
suggest that an increase in the immigrant-to-native ratio has a small negative effect on
average British wages. Moreover, the results reveal that the effect of immigration on wages is
greatest within the semi-skilled and unskilled service occupational group where a 10
percentage point rise in the proportion of immigrants working in the semi/unskilled service
sector leads to a 1.8 percent reduction in pay. However, Nickell and Salaheen note that part of
this decrease can be due to a compositional effect since immigrants tend to earn less than
natives and estimate this compositional effect to account for a 0.54% fall in wages. Finally,
these authors find that there is no difference between the effect of E.U. and non-E.U.
immigrants on native wages in the UK.
22
We have found that the leave vote is concentrated in provincial England and is positively
correlated with the share of the less educated and the over 65 years of age group and
negatively correlated with the GDP per capita. But in our regressions the rate of immigration
did not come out strongly. We have seen that the literature on the labour market effect of
immigration suggests a weak, possibly non-existent, effect on average wages and slightly
stronger but still a weak effect on the wages of unskilled service-sector workers. Moreover,
the data show that the remain-vote was strong in London and the South East where
immigrants are a large share of the labour force.25 So how do we fit the poll results with the
empirical evidence on the effect of immigration if the regions that voted most strongly for
leaving are neither the regions where the share of immigrants in the labour force is high nor
the regions having large flows of immigration from the E.U.? A likely answer is that voters
perceive the numbers and effects of immigrants as being much greater than they actually are.
In a Mori poll published a couple of weeks before the referendum on 9 June 2016 responders
thought on average that E.U. citizens made up 15% of the total UK population (around 10.5
million people) when in reality it is 5% (3.5 million people).26 Moreover, people also
underestimated the volume of foreign direct investment by other E.U. countries in the UK;
they overestimated the net financial contribution the UK makes to the E.U. budget (half of
that of Germany, and less than the contributions of France, Italy and Spain).
An exaggerated fear of immigration in public debate may have caused voters to want to
leave the E.U., driven by anxiety about their economic security.27 One can also argue that
voting to leave may be justified by immigration having a small negative effect on the lowest
wages. Clearly, the act of voting costs a voter only a few minutes of his time but may prevent
his wages from falling slightly due to future immigration. This may be a rational thing to do
from a pure self-interest in spite of the indications of a weak effect of immigration on native
wages.
25 See Reed and Latorre (2009). 26 See www.ipsos-mori.com/researchpublications/rese. 27 A striking example is provided by The Telegraph newspaper on 27 July 2016. This is the strong leave vote in
some regions where industries dependent on the UK remaining in the Single Market are significant employers.
For example, the leave vote was strong in the English towns of Dagenham and Bridgehead where Ford produces
car engines and then ships them to its plants on the Continent. Many of the cars are subsequently sold in the UK.
The Telegraph reports that Ford is considering closing both plants because of the decision of the UK to leave the
EU and firing 3,800 workers.
23
7. Brexit and Sterling
We turn to the currency markets to analyse whether the currency traders anticipated the Brexit
vote, whether they thought it was good for the currency, and what was the effect of changes in
the poll numbers from one poll to another on the sterling exchange rate if not fully
anticipated. The UK’s departure from the E.U. could affect the fundamentals of the sterling
exchange rate. For example, the UK may no longer be a good place for foreign direct
investment in production facilities aimed at the E.U. market and the price of credit default
swaps for UK banks may increase. Conversely, if the markets expect post-Brexit UK to
flourish outside the E.U., forming trade relationships with countries outside the E.U. and
passing laws and regulations that make the business sector more flexible and dynamic, then
sterling might actually appreciate.
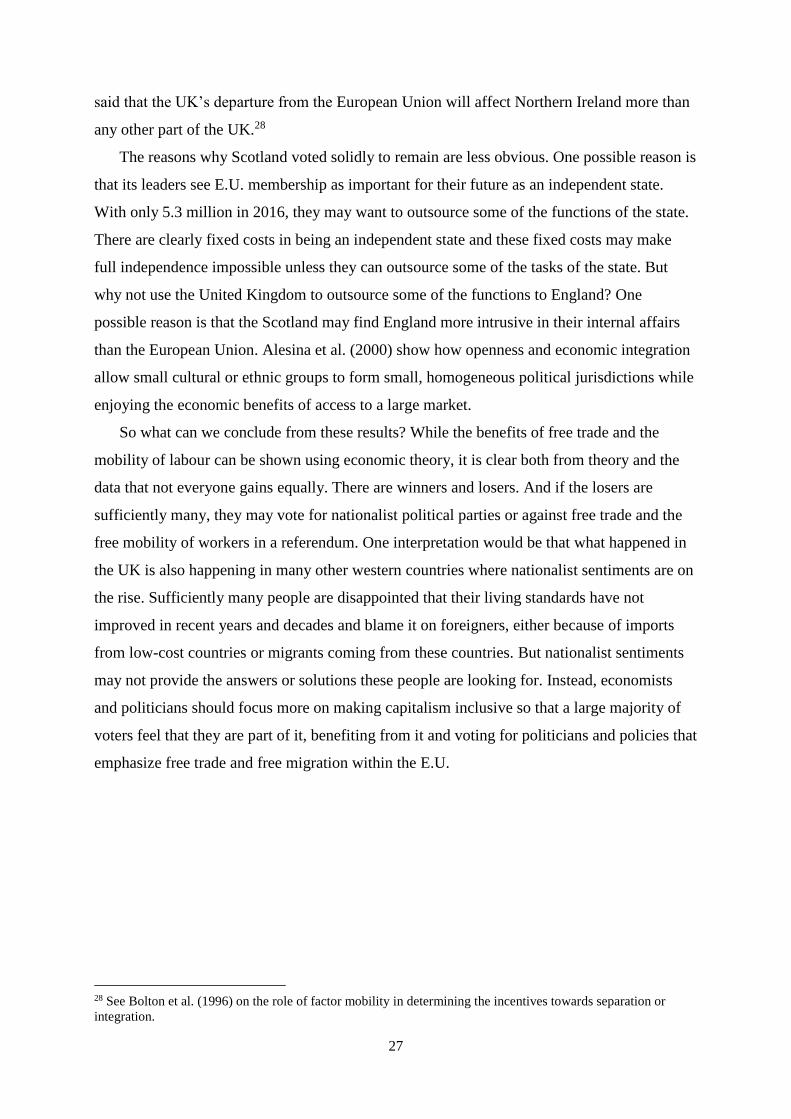
We start in Figure 4 by showing the movement of the sterling-euro exchange rate since
shortly before the announcement that there would be a referendum in early 2013 (defined as
the price of the pound measured in euros). The price of sterling fell in the first couple of
months of 2013, increased gradually throughout the remainder of 2013 and 2014, and then
more steeply in early 2015. The initial fall in 2013 started before the announcement of a
referendum so cannot be attributed to the announcement. Sterling appreciated in the
immediate aftermath of the General Election victory of the Conservative Party, which made
the referendum a likely event. It then fell in value after the referendum bill was unveiled. The
announcement that Tory ministers would be allowed to campaign for the leave side was
followed by the depreciation of sterling and the same occurred after the draft renegotiation.
Throughout this period there is no clear effect in either direction from news that should have
made Brexit more or less likely. However, in the days before the referendum on 23 June the
movements of sterling appear to reflect changes in the probable outcome of the referendum.
Thus polls that gave the leave campaign a majority were followed by a large depreciation of
the currency and the tragic murder of an MP only a week before the referendum, which may
have convinced some that the remain side would come out on top, was followed by an
appreciation. Finally, the referendum outcome caused a sudden depreciation.
Table A2 in the appendix documents some of the news events that may be expected to
have impacted the sterling exchange rate. Visual inspection suggests that the political events
in the two to three years prior to the referendum had a modest impact on the sterling exchange
rate. However, there is some indication that events in the days before had an effect and
certainly the referendum outcome did make sterling depreciate.
24
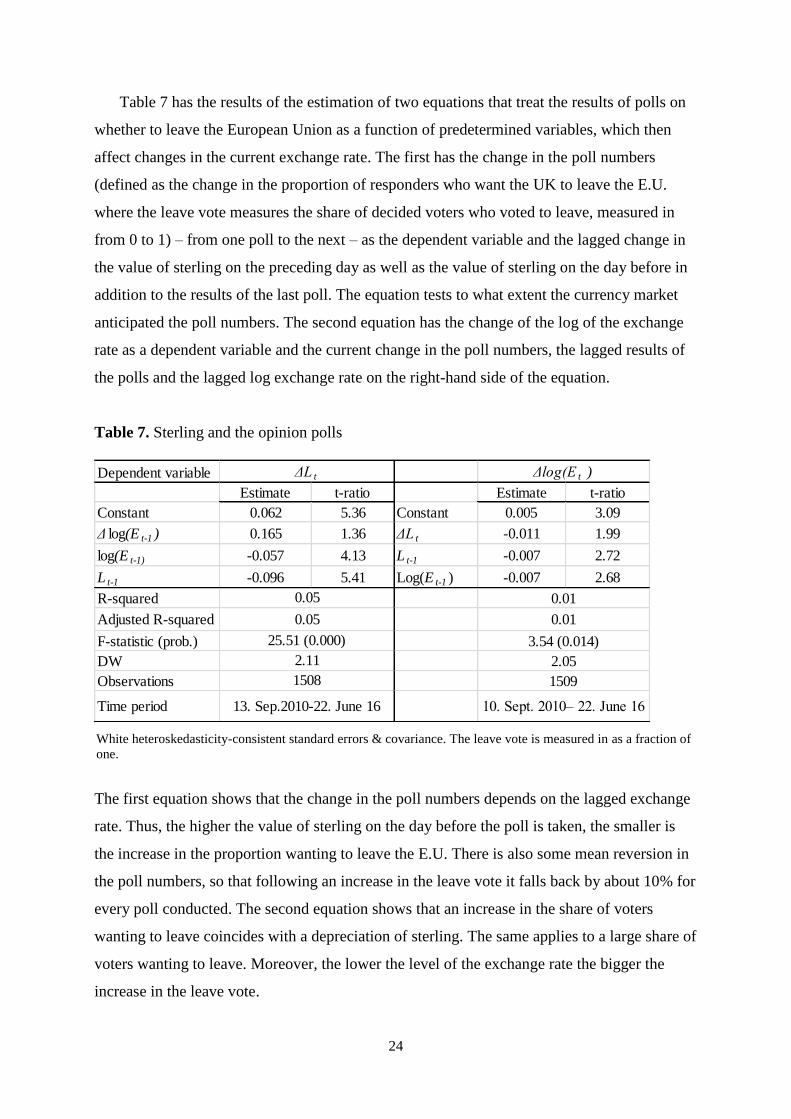
Table 7 has the results of the estimation of two equations that treat the results of polls on
whether to leave the European Union as a function of predetermined variables, which then
affect changes in the current exchange rate. The first has the change in the poll numbers
(defined as the change in the proportion of responders who want the UK to leave the E.U.
where the leave vote measures the share of decided voters who voted to leave, measured in
from 0 to 1) – from one poll to the next – as the dependent variable and the lagged change in
the value of sterling on the preceding day as well as the value of sterling on the day before in
addition to the results of the last poll. The equation tests to what extent the currency market
anticipated the poll numbers. The second equation has the change of the log of the exchange
rate as a dependent variable and the current change in the poll numbers, the lagged results of
the polls and the lagged log exchange rate on the right-hand side of the equation.
Table 7. Sterling and the opinion polls
White heteroskedasticity-consistent standard errors & covariance. The leave vote is measured in as a fraction of
one.
The first equation shows that the change in the poll numbers depends on the lagged exchange
rate. Thus, the higher the value of sterling on the day before the poll is taken, the smaller is
the increase in the proportion wanting to leave the E.U. There is also some mean reversion in
the poll numbers, so that following an increase in the leave vote it falls back by about 10% for
every poll conducted. The second equation shows that an increase in the share of voters
wanting to leave coincides with a depreciation of sterling. The same applies to a large share of
voters wanting to leave. Moreover, the lower the level of the exchange rate the bigger the
increase in the leave vote.
Dependent variable
Estimate t-ratio Estimate t-ratio
Constant 0.062 5.36 Constant 0.005 3.09
Δ log(E t-1 ) 0.165 1.36 ΔL t -0.011 1.99
log(E t-1) -0.057 4.13 L t-1 -0.007 2.72
L t-1 -0.096 5.41 Log(E t-1 ) -0.007 2.68
R-squared
Adjusted R-squared
F-statistic (prob.)
DW
Observations
Time period
ΔL t Δlog(E t )
0.05
0.05
25.51 (0.000)
2.11
0.01
0.01
1508
3.54 (0.014)
2.05
1509
10. Sept. 2010– 22. June 1613. Sep.2010-22. June 16

25
1
1,05
1,1
1,15
1,2
1,25
1,3
1,35
1,4
1,45
1,5
1.1
.13
1.2
.13
1.3
.13
1.4
.13
1.5
.13
1.6
.13
1.7
.13
1.8
.13
1.9
.13
1.1
0.1
3
1.1
1.1
3
1.1
2.1
3
1.1
.14
1.2
.14
1.3
.14
1.4
.14
1.5
.14
1.6
.14
1.7
.14
1.8
.14
1.9
.14
1.1
0.1
4
1.1
1.1
4
1.1
2.1
4
1.1
.15
1.2
.15
1.3
.15
1.4
.15
1.5
.15
1.6
.15
1.7
.15
1.8
.15
1.9
.15
1.1
0.1
5
1.1
1.1
5
1.1
2.1
5
1.1
.16
1.2
.16
1.3
.16
1.4
.16
1.5
.16
1.6
.16
1.7
.16
David
Cameron
promises
referendum
Greece's bailout plan
approved
General Elections
Referendum bill
unveiled
E.U. Council meeting
Speculations over Boris
Johnson
Paris attacks
E.U. summits in
Brussels
Tory ministers allowed to
campaign to leave while
remaning in government
Draft renegotiation
package published
UK local elections
Polls gives
Brexit lead
Jo Cox muredered
Referendum
Figure 4. The Sterling-euro exchange rate
26
The fact that an increase in the leave vote makes sterling depreciate suggests that the currency
market does not anticipate the poll numbers fully. Note that the explanatory power of both
equations is very weak: Sterling movements explain only 5% of the variation of the poll
numbers and the changes in the poll results explain only 1% of the sterling movements.
Finally, the numerical values of the estimates suggest that a 1% increase in the proportion
of respondents who want the UK to leave the European Union leads to a 1% decline in the
exchange rate. This is a very strong long-term effect on sterling. Since about 50% of voters
wanted to leave the E.U. according to poll numbers the days before the referendum, the effect
of the result of the referendum could be calculated by setting the leave side at 100%. This
would make sterling depreciate by about 50% in steady state. In contrast, the short term effect
would be small.
8. Concluding remarks
The pattern of voting in the referendum reflects differences in the age composition of the
population and the share of the less educated, with the older generation and the less educated
voting for Brexit, in addition to a low level of per capita income having the same effect. These
variables not only explain the voting patterns but also the attitude towards immigrants as
neighbours, the dangers posed by immigrants to society and feelings of apprehension towards
the European Union. The less educated may have more to fear from immigration and free
trade and for that reason want to leave the E.U. The reasons why the old would want to leave
are more difficult to decipher. These individuals may have good memories of life without the
E.U. or be driven by nostalgia. The importance of GDP per capita would lead us to think that
low income makes people more willing to upend the status quo, but reading economic history
would tell us that the relative poverty in provincial England does not have much to do with
the membership of the E.U. since the decline of northern England in comparison to London
and the South East is a long-term evolution driven by the decline of manufacturing and the
rise of a service economy.
What remains to explain is the strong remain vote in Scotland and Northern Ireland. There
is an obvious reason why more people in Northern Ireland voted to remain in the E.U. than
our model would predict. With Ireland and the UK being members of the European Union,
both have a common labour market. The authorities abolished systematic customs checks
between the two regions in 1993. Brexit spells the end of the common labour market and the
beginning of formal border controls, which will aggravate problems in Northern Ireland and
may endanger the 1998 peace accord, the so-called Good Friday Agreement. Thus it could be
27
said that the UK’s departure from the European Union will affect Northern Ireland more than
any other part of the UK.28
The reasons why Scotland voted solidly to remain are less obvious. One possible reason is
that its leaders see E.U. membership as important for their future as an independent state.
With only 5.3 million in 2016, they may want to outsource some of the functions of the state.
There are clearly fixed costs in being an independent state and these fixed costs may make
full independence impossible unless they can outsource some of the tasks of the state. But
why not use the United Kingdom to outsource some of the functions to England? One
possible reason is that the Scotland may find England more intrusive in their internal affairs
than the European Union. Alesina et al. (2000) show how openness and economic integration
allow small cultural or ethnic groups to form small, homogeneous political jurisdictions while
enjoying the economic benefits of access to a large market.
So what can we conclude from these results? While the benefits of free trade and the
mobility of labour can be shown using economic theory, it is clear both from theory and the
data that not everyone gains equally. There are winners and losers. And if the losers are
sufficiently many, they may vote for nationalist political parties or against free trade and the
free mobility of workers in a referendum. One interpretation would be that what happened in
the UK is also happening in many other western countries where nationalist sentiments are on
the rise. Sufficiently many people are disappointed that their living standards have not
improved in recent years and decades and blame it on foreigners, either because of imports
from low-cost countries or migrants coming from these countries. But nationalist sentiments
may not provide the answers or solutions these people are looking for. Instead, economists
and politicians should focus more on making capitalism inclusive so that a large majority of
voters feel that they are part of it, benefiting from it and voting for politicians and policies that
emphasize free trade and free migration within the E.U.
28 See Bolton et al. (1996) on the role of factor mobility in determining the incentives towards separation or
integration.
28
References
Alesina, Alberto and Enrico Spolaore (1997), “On the Number and Size of Nations,” The
Quarterly Journal of Economics, 112 (4), 127-156.
Alesina, Alberto and R. Wacziarg (1998),“Openness, Country Size and Government,” Journal
of Public Economics, 69(3), 305-321.
Alesina, Alberto F. , Enrico Spolaore and Romain Wacziaarg (2000), “Economic Integration
and Political Disintegration,” American Economic Review, 9 (5), 1276-1296.
Arnorsson, August and Gylfi Zoega (2016), “Social Capital and the Labor Market,”
Capitalism and Society, 11(1), Article 1.
Bolton, Patrick, Gérard Roland and Enrico Spolaore (1996), “Economic Theories of the
Break-up and Integration of Nations,” European Economic Review, 40 (3), 697-705.
Coleman, James (1990). Foundations of Social Theory. Cambridge, MA: Belknap.
Borjas, George (2003), “The Labour Demand Curve is Downward Sloping,” Quarterly
Journal of Economics, 116 (4), 463–486.
Card, David (1990), “The impact of the Mariel Boatlift on the Miami labour
market,” Industrial and Labour Relations Review, 43 (2), 245–257.
Card, David (2005), “Is the New Immigration really so bad?” Economic Journal, 115 (507),
300–323.
Crafts, Nicholas (2005), “Regional GDP in Britain, 1871-1911; Some Estimates, Scottish
Journal of Political Economy, 52 (1), 54-64.
Deutsche Bank Markets Research Global Foreign Exchange Special Report Rates date 29
June 2016: “Divided nation: why Britain voted for Brexit and what it means for sterling.”
Devlin, Ciaran, Olivia Bolt, Dhi Patel, David Harding and Ishtiaq Hussian (2014), “Impacts
of Migration on UK Native Employment: An Analytical Review of the evidence,” Home
Office Occasional Paper 109.
Dustman, Christian, Francesa Fabbri and Ian Preston (2005), “The Impact of
Immigration on the British Labour Market,” The Economic Journal, 115 (507), F324-
F341.
Dustman, Christian, Tommaso Frattini, and Ian Preston (2013), “The Effect of Immigration
along the Distribution of Wages.” Review of Economic Studies 80 (1), 145-173.
Dustman, Christian and Tommaso, Frattini (2013), “The Fiscal Effects of Immigration to the
UK,” CReAM Discussion Paper Series CDP No 22/13.
Gancia, Gino, Ponzetto, Giacomo A.M and Jaume Ventura (2016), “Globalization and
Political Structure,” NBER Working Paper No. 22046.
29
Gilpin, Nicola, Matthew Henty, Sara Lemos, Jonathan Portes and Chris Bullen (2006), “The
Impact of Free Movement of Workers from Central and Eastern Europe on the UK Labour
Market”, Department for Work and Pensions Working Paper No 29.
Hellwig, Timorthy and Abdulkader Sinno (2016), “Different Goups, Different Threats: Public
Attitudes towards Immigrants,” Journal of Ethnic and Migration Studies, 1-20.
Hotelling, Harold (1936), “Relations between Two Sets of Variates.” Biometrika, 321-377.
Jonung, Lars (2004), “To be or not to be in the euro? Benefits and Costs of Monetary
Unification as Perceived by Voters in the Swedish euro Referendum 2003,” Cato Journal, 24
(1-2), 123-149.
Knack, Stephen and Philip Keefer (1997). Does Social Capital Have an Economic Payoff? A
Cross-Country Investigation. The Quarterly Journal of Economics, 112(4), 1251-1288.
Lemos, Sara and Jonathan Portes (2008), “New Labour? The Impact of Migration from
Central and Eastern European Countries on the UK Labour Market,” IZA Discussion Paper
No. 3756.
Manacorda, Marco, Manning, Alan, and Jonathan Wadsworth (2012), “The Impact of
Immigration on the Structure of Male Wages: Theory and Evidence from Britain,” Journal of
the European Economic Association 10 (1), 120-151.
Mayda, Anna Maria (2006), “Who is Against Immigration? A Cross-country Investigation of
Individual Attitudes toward Immigrants, The Review of Economics and Statistics, 88 (3), 510-
530.
Nickell, Stephen and Jumana Saleheen (2015), “The Impact of Immigration On Occupational
Wages: Evidence from Britain,“ Staff Working Paper No. 574, Bank of England.
Nickell, S. and J. Salaheen (2008), “The Impact of Immigration on Occupational Wages:
Evidence from Britain.” Working Paper No. 08-6, Federal Reserve Bank of Boston, Boston,
2008.
Ottaviano, Gianmarco and Giovanni Peri (2012), “Rethinking the Gains from Immigration:
Theory and Evidence from the U.S.”, Journal of European Economic Association, 10 (1),
152-197.
Putnam, Robert D. (2000). Bowling alone: The collapse and revival of American community.
New York: Simon & Schuster.
Reed, Howard and Maria Latorre (2009), “The Economic Impacts of Migration on the UK
Labour Market”, Economics of Migration Working Paper 3, Institute for Public Policy
Research.
Sherry, Alissa and Robin K. Henson (2005), “Conducting and Interpreting Canonical
Correlation Analysis in Personality Research: A User-Friendly Primer,” Journal of
personality assessment, 84 (1), 37-48.

30
Tacq, Jacques J.A. and Jacques Tacq (1997), Multivariate Analysis Techniques in Social
Science Research: From Problem to Analysis. Sage.
Wadsworth, Jonathan (2010), “The UK Labour Market and Immigration,” National Institute
Economic Review, 213 (1), R35-R42.
E.U. Referendum local results (2016, June 24), Retrieved June 24, 2016, from
http://www.bbc.co.uk/news/politics/eu_referendum/results/local/a
Relationship of NUTS Areas to UK Administrative Geographies (n.d.), Retrieved June 24,
2016, from
http://webarchive.nationalarchives.gov.uk/20160105160709/http://www.ons.gov.uk/ons/guide
-method/geography/beginner-s-guide/eurostat/relationship-of-nuts-to-uk-administrative-
geographies.html
EVS (2011), European Values Study 2008: Integrated Dataset (EVS 2008). GESIS Data
Archive, Cologne. ZA4800 Data file version 3.0.0, doi:10.4232/1.11004.
History of NUTS. (n.d.). Retrieved July 18, 2016, from gttp://ec.europa.eu
/eurostat/web/nuts/history
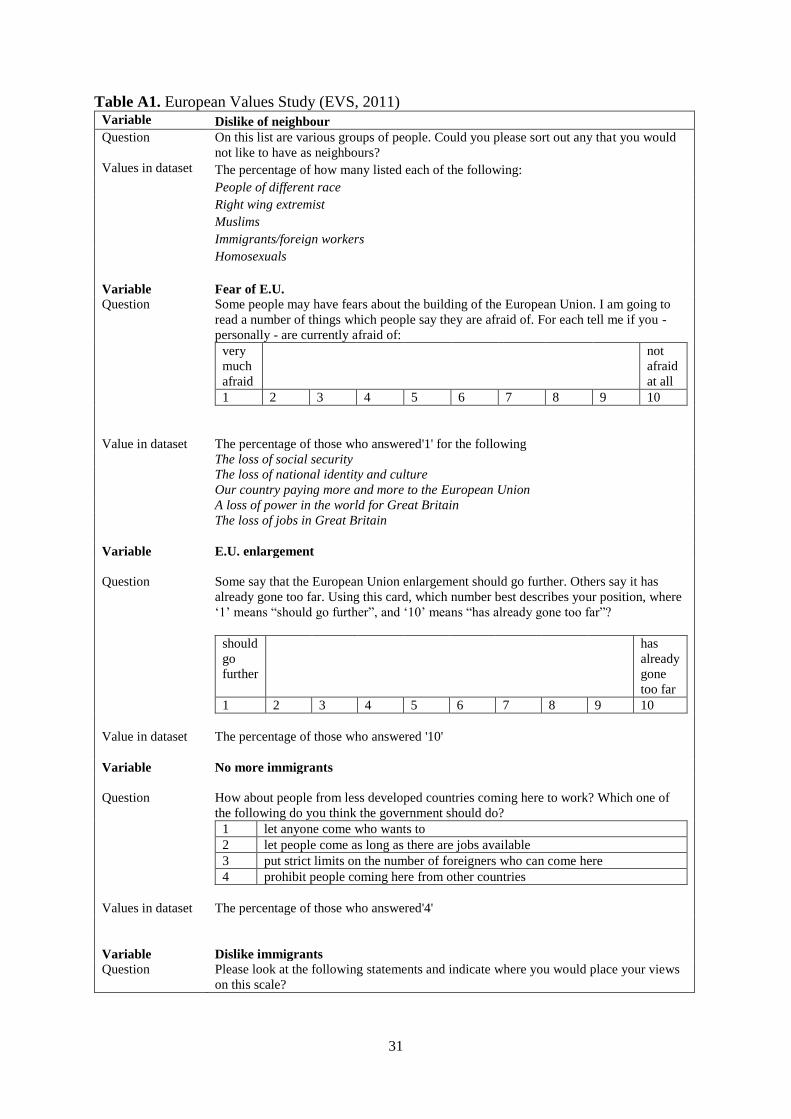
31
Table A1. European Values Study (EVS, 2011) Variable Dislike of neighbour
Question On this list are various groups of people. Could you please sort out any that you would
not like to have as neighbours?
Values in dataset The percentage of how many listed each of the following:
People of different race
Right wing extremist
Muslims
Immigrants/foreign workers
Homosexuals
Variable Fear of E.U.
Question Some people may have fears about the building of the European Union. I am going to
read a number of things which people say they are afraid of. For each tell me if you -
personally - are currently afraid of:
very
much
afraid
not
afraid
at all
1 2 3 4 5 6 7 8 9 10
Value in dataset The percentage of those who answered'1' for the following
The loss of social security
The loss of national identity and culture
Our country paying more and more to the European Union
A loss of power in the world for Great Britain
The loss of jobs in Great Britain
Variable E.U. enlargement
Question
Some say that the European Union enlargement should go further. Others say it has
already gone too far. Using this card, which number best describes your position, where
‘1’ means “should go further”, and ‘10’ means “has already gone too far”?
should
go
further
has
already
gone
too far
1 2 3 4 5 6 7 8 9 10
Value in dataset The percentage of those who answered '10'
Variable No more immigrants
Question
How about people from less developed countries coming here to work? Which one of
the following do you think the government should do?
1 let anyone come who wants to
2 let people come as long as there are jobs available
3 put strict limits on the number of foreigners who can come here
4 prohibit people coming here from other countries
Values in dataset The percentage of those who answered'4'
Variable Dislike immigrants
Question Please look at the following statements and indicate where you would place your views
on this scale?
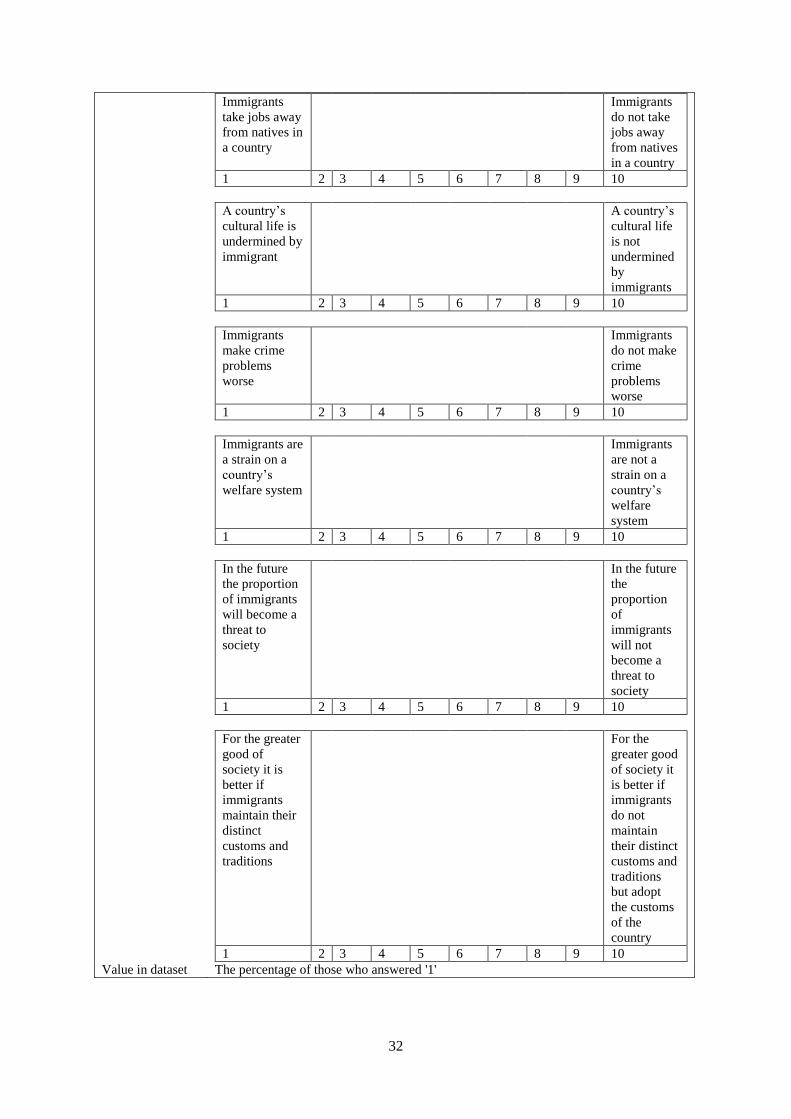
32
Immigrants
take jobs away
from natives in
a country
Immigrants
do not take
jobs away
from natives
in a country
1 2 3 4 5 6 7 8 9 10
A country’s
cultural life is
undermined by
immigrant
A country’s
cultural life
is not
undermined
by
immigrants
1 2 3 4 5 6 7 8 9 10
Immigrants
make crime
problems
worse
Immigrants
do not make
crime
problems
worse
1 2 3 4 5 6 7 8 9 10
Immigrants are
a strain on a
country’s
welfare system
Immigrants
are not a
strain on a
country’s
welfare
system
1 2 3 4 5 6 7 8 9 10
In the future
the proportion
of immigrants
will become a
threat to
society
In the future
the
proportion
of
immigrants
will not
become a
threat to
society
1 2 3 4 5 6 7 8 9 10
For the greater
good of
society it is
better if
immigrants
maintain their
distinct
customs and
traditions
For the
greater good
of society it
is better if
immigrants
do not
maintain
their distinct
customs and
traditions
but adopt
the customs
of the
country
1 2 3 4 5 6 7 8 9 10
Value in dataset The percentage of those who answered '1'
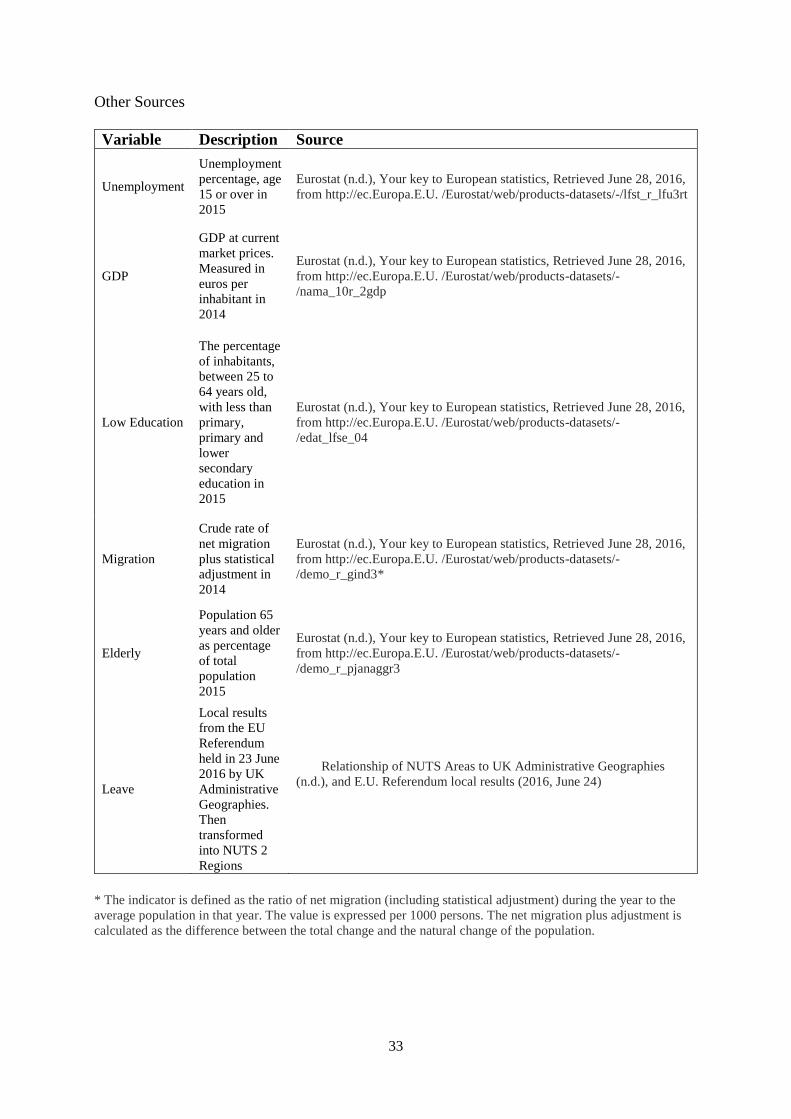
33
Other Sources
Variable Description Source
Unemployment
Unemployment
percentage, age
15 or over in
2015
Eurostat (n.d.), Your key to European statistics, Retrieved June 28, 2016,
from http://ec.Europa.E.U. /Eurostat/web/products-datasets/-/lfst_r_lfu3rt
GDP
GDP at current
market prices.
Measured in
euros per
inhabitant in
2014
Eurostat (n.d.), Your key to European statistics, Retrieved June 28, 2016,
from http://ec.Europa.E.U. /Eurostat/web/products-datasets/-
/nama_10r_2gdp
Low Education
The percentage
of inhabitants,
between 25 to
64 years old,
with less than
primary,
primary and
lower
secondary
education in
2015
Eurostat (n.d.), Your key to European statistics, Retrieved June 28, 2016,
from http://ec.Europa.E.U. /Eurostat/web/products-datasets/-
/edat_lfse_04
Migration
Crude rate of
net migration
plus statistical
adjustment in
2014
Eurostat (n.d.), Your key to European statistics, Retrieved June 28, 2016,
from http://ec.Europa.E.U. /Eurostat/web/products-datasets/-
/demo_r_gind3*
Elderly
Population 65
years and older
as percentage
of total
population
2015
Eurostat (n.d.), Your key to European statistics, Retrieved June 28, 2016,
from http://ec.Europa.E.U. /Eurostat/web/products-datasets/-
/demo_r_pjanaggr3
Leave
Local results
from the EU
Referendum
held in 23 June
2016 by UK
Administrative
Geographies.
Then
transformed
into NUTS 2
Regions
Relationship of NUTS Areas to UK Administrative Geographies
(n.d.), and E.U. Referendum local results (2016, June 24)
* The indicator is defined as the ratio of net migration (including statistical adjustment) during the year to the
average population in that year. The value is expressed per 1000 persons. The net migration plus adjustment is
calculated as the difference between the total change and the natural change of the population.
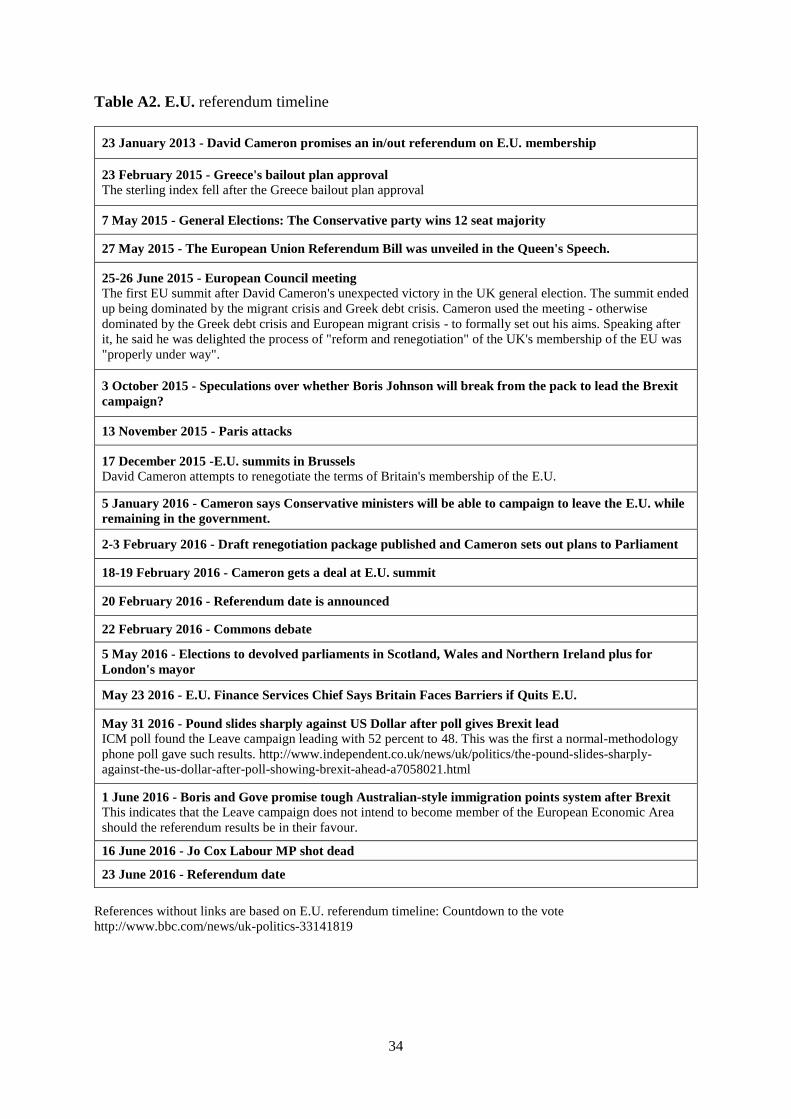
34
Table A2. E.U. referendum timeline
23 January 2013 - David Cameron promises an in/out referendum on E.U. membership
23 February 2015 - Greece's bailout plan approval
The sterling index fell after the Greece bailout plan approval
7 May 2015 - General Elections: The Conservative party wins 12 seat majority
27 May 2015 - The European Union Referendum Bill was unveiled in the Queen's Speech.
25-26 June 2015 - European Council meeting
The first EU summit after David Cameron's unexpected victory in the UK general election. The summit ended
up being dominated by the migrant crisis and Greek debt crisis. Cameron used the meeting - otherwise
dominated by the Greek debt crisis and European migrant crisis - to formally set out his aims. Speaking after
it, he said he was delighted the process of "reform and renegotiation" of the UK's membership of the EU was
"properly under way".
3 October 2015 - Speculations over whether Boris Johnson will break from the pack to lead the Brexit
campaign?
13 November 2015 - Paris attacks
17 December 2015 -E.U. summits in Brussels
David Cameron attempts to renegotiate the terms of Britain's membership of the E.U.
5 January 2016 - Cameron says Conservative ministers will be able to campaign to leave the E.U. while
remaining in the government.
2-3 February 2016 - Draft renegotiation package published and Cameron sets out plans to Parliament
18-19 February 2016 - Cameron gets a deal at E.U. summit
20 February 2016 - Referendum date is announced
22 February 2016 - Commons debate
5 May 2016 - Elections to devolved parliaments in Scotland, Wales and Northern Ireland plus for
London's mayor
May 23 2016 - E.U. Finance Services Chief Says Britain Faces Barriers if Quits E.U.
May 31 2016 - Pound slides sharply against US Dollar after poll gives Brexit lead
ICM poll found the Leave campaign leading with 52 percent to 48. This was the first a normal-methodology
phone poll gave such results. http://www.independent.co.uk/news/uk/politics/the-pound-slides-sharply-
against-the-us-dollar-after-poll-showing-brexit-ahead-a7058021.html
1 June 2016 - Boris and Gove promise tough Australian-style immigration points system after Brexit
This indicates that the Leave campaign does not intend to become member of the European Economic Area
should the referendum results be in their favour.
16 June 2016 - Jo Cox Labour MP shot dead
23 June 2016 - Referendum date
References without links are based on E.U. referendum timeline: Countdown to the vote
http://www.bbc.com/news/uk-politics-33141819


![Kalispell Ordinance No. 1745 › aviation › docs › Kalispell-Ordinance-1745.pdf11111111111111111 IIIII 1111111111111111111111111111111111111111 lllll lllll 111111111111111111 !:::;}]?!os](https://img.dokumen.tips/doc/110x75/5f213ebb2e287b5f527962c7/kalispell-ordinance-no-1745-a-aviation-a-docs-a-kalispell-ordinance-1745pdf.jpg)