Embed Size (px)
Citation preview
1
Isoperibolic Calorimetric Measurements of theFleischmann-Pons Effect
Melvin H. Milesa and Martin Fleischmannb
aThe Dixie Foundation, Dixie State College, St. George, UT 84770, email: [email protected] Lodge, Duck Street, Tisbury, Salisbury, Wilts SP3 6LJ, U.K.
ABSTRACT
Important advantages exist for selecting a Dewar type isoperibolic calorimeter for measurementsof anomalous excess enthalpy produced by the Fleischmann-Pons Effect (FPE). Theseadvantages include a wide dynamic range for both the cell temperature and cell input power,direct visual observations inside the cell during calorimetric experiments, relative low cost, self-purification of the system, the safety of an open system, and heat transfer mainly byelectromagnetic radiation. Various generations of this calorimetry are described along with themathematical modeling. The use of control or “blank” experiments, such as replacing palladiumby platinum, show that anomalous excess power is measurable to within ±0.1 mW using thiselectrochemical calorimetry. The application of this Dewar isoperibolic calorimetry at otherlaboratories such as NHE (Japan), Grenoble (France) and Harwell (U.K.) is discussed.Variations of isoperibolic calorimetry used by China Lake, Caltech, and M.I.T. are alsoexamined where the main heat transfer pathway is by conduction. An improved version of theChina Lake isoperibolic calorimeter is capable of measuring the small excess power (6.5 mW)produced at the beginning of an experiment by the exothermic absorption of deuterium intopalladium.
Introduction: Why choose a Dewar Isoperibolic Calorimeter?
The Dewar type of isoperibolic calorimeters developed by Fleischmann and Pons provides awide dynamic range for both the cell temperature and cell input power. The experimentaltemperature range can be as great as the liquid range of the electrolyte system (3.82°C to101.42°C for pure D2O). For typical D2O+0.1 M LiOD electrolytes, the temperature range usedis typically from 20°C dictated by the bath temperature up to the boiling point of the electrolyte.The maximum cell input power will vary with the size of the cell, but input powers up to 10 Ware possible before the cell contents are driven to boiling temperatures.
The ability provided by the Dewar type cells for directly observing processes inside the cell is avery important advantage. This is especially important for co-deposition and cell boil-offexperiments. Other calorimetric systems generally do not provide for visual observations insidethe cell.
The relatively low cost of the Dewar type cells is another important factor for the selection ofthis isoperibolic system. This makes possible the simultaneous use of multiple cells involvingdifferent experiments in a single water bath of sufficient size for handling the total heat output.The major cost is simply the construction of glass Dewar cells with a high vacuum between the

2
inner and outer glass surfaces. The top portion (about 30%) needs to be silvered to minimize theeffect of the decreasing electrolyte level caused by the electrolysis of D2O to produce D2 and O2
gases. Larger cells will obviously exhibit smaller changes in the electrolyte level duringelectrolysis.
Another important positive feature of these Dewar cells, as well as other open systems, is thatthey are self-purifying. Ordinary H2O will act as a poison to the Fleischmann-Pons effect (FPE)in D2O+0.1 M LiOD electrolytes. Because H is preferentially electrolyzed versus D at thecathode, any H2O contamination will be gradually removed during electrolysis. In closedsystems, the initial H2O contamination will remain trapped throughout the experiment. Not to beoverlooked is the inherent safety of an open system that allows the deuterium and oxygen gasesto escape as fast as they are generated.
The main heat transfer pathway for Dewar isoperibolic cells is via electromagnetic radiation(mostly infrared radiation1). The radiative heat transfer coefficient, therefore, can be estimatedby using the Stefan-Boltzmann constant (kB=5.6704 × 10⁻¹² W cm-2 K-4) and the experimentalsurface area of the inner, unsilvered portion of the glass surface of the Dewar cell. This providesa useful guide to the integrity of the Dewar vacuum and the extent of minimization of heattransfer pathways via conduction. Because of the predominate heat transfer by electromagneticradiation, this Dewar cell system has no memory effect. For example, gas bubbles or stagnantlayers that form on the inner cell wall will exert no effect on the radiative heat transfercoefficient. Any media in the cell will suffice that maintains the temperature of the inner cellwall. Furthermore, small devices for nuclear measurements can be inserted into these Dewarcells without significantly affecting the calorimetry.
The skill of the experimenter in isoperibolic calorimetry using Dewar cells is mainly exhibited inaccurately determining the radiative heat transfer coefficient (kR) and the water equivalent of thesystem (CpM) consisting of the heat capacity of D2O (Cp) and the equivalent D2O mass (M) ofthe calorimetric system. For a given cell, these important parameters (kR, CpM) will remainlargely unchanged for all experiments conducted in a similar manner in the same cell, i.e., usingthe same mass of D2O+0.1 M LiOD, electrodes, thermistors, and internal heaters. Theseimportant calorimetric parameters (kR, CpM) can be most accurately determined in control or“blank” experiments such as using Pt/D2O+0.1 M LiOD in place of Pd/D2O+0.1 M LiOD [1, 2].The use of controls avoids the all too frequent problem of attributing calorimetric errors toexcess enthalpy production. The modeling of the Dewar isoperibolic calorimetric cell and theresulting mathematical equations may appear daunting, but these calculations are easily handledaccurately by computers or even hand calculators as long as the kR and CpM parameters areproperly determined.
The Fleischmann-Pons Dewar System
The Fleischmann-Pons (F-P) isoperibolic calorimetry using a Dewar type cell evolved throughvarious designs dating back to the early 1980’s. The major changes involved the dimensions
1 From Wien’s Law, the wavelength of maximum energy density, λmax, is 8.82 × 10⁻⁶ m (8820 nm) for a celltemperature of 60°C (333.15 K). Visible light consists of much shorter wavelengths between 400 and 750 nm.
3
selected for the cell as well as incorporating the silvering of the top portion of the cell. Properscaling of the system is critical because the cell diameter and length determine the volume ofelectrolyte used, the rate of change of the electrolyte level, the effectiveness of stirring by theelectrolysis gases, the dynamic range for power input, and the magnitude of kR and CpM. Thesechanges led to the ICARUS (Isoperibolic Calorimetry: Acquisition, Research and UtilitiesSystem) series of cells used in later experiments.
The ICARUS 1 to 3 calorimeters were for lower temperatures up to boiling, and the ICARUS 4to 9 calorimeters allowed long-term maintenance of boiling conditions. Results of ICARUS 9experiments have been presented [3]. The ICARUS 10 to 13 were designed and constructed forfurther studies of boiling, but they were never put in use [4]. A schematic diagram for theICARUS-14 calorimeter is available, but this calorimeter was never constructed [4]. Anexample of the ICARUS-1 type cell used at the New Hydrogen Energy (NHE) laboratory atSapporo, Japan from 1994 to 1998 had a filled electrolyte volume of 90 cm3, an inner diameterof 2.5 cm, an outer diameter of 4.2 cm, and a length of 25.0 cm with the top 8.0 cm silvered. Asimilar Fleischmann-Pons Dewar cell was used in France by Longchampt and Bonnetain [5].
The modeling and mathematical equations of the Fleischmann-Pons Dewar isoperiboliccalorimeter have been previously presented [1, 2, 4, 6, 7]. These equations are given inAppendix I, and a list of symbols and units are found in Appendix II. This modeling mustinclude all power sources that flow into and out of the calorimeter (Pcalor). These power sourcesare the electrical power of the electrochemistry (PEI), the net electromagnetic radiation (PR),power due to conduction (PC), power applied by the internal heater (PH), if any, power carriedaway by the electrolysis gases exiting the cell (Pgas), power due to the rate of any pressure-volume work done by the generated gases (PW), and any anomalous power sources (PX). Theresulting equation is
WCRgasXHElcalor PPPPPPPP (1)
where each power term is a function of time P(t). As usual in thermodynamics, heat or poweradded to the system (calorimeter) is positive in sign while a negative sign is used for power thatflows out of the calorimeter into the surroundings. The mathematical expressions for Pcalor, PEI,Pgas, PR, PC and PW are given in Appendix I. For Dewar cells where the bulk of heat transferfrom the cell to the water bath is by electromagnetic radiation, the much smaller PC and PW termscan be incorporated into a pseudo radiative power term, RP , where
TfkPPPP RWCRR (2)
and 44
bcell TTTf . The substitution of Eq. 2 into Eq. 1 yields
TfkPPPPdtdTMCP RgasXHElcellpcalor / (3)
4
where PEI and TfkR are generally the largest terms. Equation 3 is the fundamental equation
used for isoperibolic calorimetry in Dewar cells. It should be noted that no valid scientificchallenge has been made in the past nineteen years to the validity of any of these calorimetricequations. Mathematically, this Equation 3 is a nonlinear, inhomogeneous differential equation.For a given electrolyte level, the pseudoradiative heat transfer coefficient Rk and the heat
capacity of the system (CpM) can be treated as constants. For large Dewar cells silvered at thetop, Rk exhibits only a weak time dependency
tkk RR 1 (4)
that is due to the slowly changing electrolyte level during electrolysis.
By assuming PX=0, a lower bound heat transfer coefficient, 1Rk , can be calculated by
rearranging Eq. 3
TfPPPPk calorgasHElR /1 (5)
The use of Eq. 5 is generally the simplest starting point for the analysis of calorimetric data;therefore 1Rk should always be calculated at the beginning of an experimental analysis. For
blank or control experiments, PX will be very small, thus 1Rk will be close to the true heat
transfer coefficient, 2Rk given by
TfPPPPPk calorgasXHElR /2 (6)
Subtracting Eq. 5 from Eq. 6 yields
TfkkP RRX 12 (7)
In any experiment there will likely be time periods where PX is small, thus 1Rk will approach
the value of 2Rk .
For control experiments, a very small excess power is measurable (1.1 mW ±0.1 mW) that is dueto the controversial recombination of the D2 + O2 electrolysis gases [1, 2]. This effect is actuallydue solely to the reduction of O2 gas at the cathode because D2 cannot be oxidized at theplatinum oxide covered anode in these experiments.
It is convenient to cast Eq. 6 into a straight-line form, y=mx+c, to yield
2/// RcellpgasXHEl kTfdtdTMCTfPPPP (8)
where Eq. 3 is used for Pcalor. The left-hand-side (L.H.S.) of Eq. 8 represents the variable y, theslope m = CpM, x = (dTcell/dt)/f(T) and the constant 2Rkc .
5
Analogous to the differential equations of chemical kinetics, mathematical integration yieldsmore accurate results than the direct use of the differential equation. The numerical integrationof Eq. 8, however, requires the selection of time periods where the excess power, PX, is constantwith time. It is also important for integration to select time periods where there are significantchanges in the cell temperature with time such as the time period where the internal cell heaterpower, PH, is applied (t1≤t≤t2). Previous experiments have shown that backward integrationfrom t2 (cessation of heater power) produces the most accurate results [1, 2, 4, 7]. This backwardintegration of Eq. 8 from t2 back to time, t, yields
2622
2
)(
)(
)]()([
)(
)()(
22
2
Rt
t
cellcellP
t
t
t
t
xnet
k
dtTf
tTtTMC
dtTf
ttPdttP
(9)
where Pnet (t) = PEI (t)+PH (t)+Pgas (t).
Various types of heat transfer coefficients such as 262)( Rk in Eq. 9 are designated by kjiRk ,,)(
where i = 1 designates differential, i = 2 signifies backward integration, i = 3 signifies forwardintegration, k = 1 denotes “lower bound” (assumes PX = 0) and k = 2 signifies “true”. If used, jdesignates the particular time period of the two-day cycle used for the integration. For example,j = 6 used in Eq. 9 is especially useful because this time period between t1 and t2 involves theapplication of the cell heater power and large changes in the cell temperature. Note that Eq. 9 isin the straight-line-form where y = L.H.S., MCm p and 262Rkc . It should also be noted
that the extrapolation of Eq. 9 to x = 0 (t = t2) automatically removes the effect of MCp on the
values of the derived heat transfer coefficient. This is a desirable feature because the heatcapacity of the system, MCp , has the highest error. Furthermore, 262)( Rk is the value of the
integral heat transfer coefficient at t=t2, the mid-point of the two-day cycle (see Eq. 4). Forwardintegration of this same experimental data simply involves the substitution of t1 for t2 in Eq. 9 toyield 362)( Rk . Similarly, assuming PX=0 in Eq. 9 would yield 261)( Rk .
The use of Eq. 9 requires an evaluation of PX for the time period of interest. The obviousadvantage of blank or control experiments is that PX will be close to zero. For other experiments,the calculation of 1Rk using Eq. 5 can reveal time periods where PX is small. The combination
of Eq. 9 with thermal inputs made at one or a series of points can also be used [1, 2, 4]. Forexample, a thermal balance can be made just before application of the heater pulse (t=t1), or nearthe end of the heater pulse (t=t2), then if the system has relaxed adequately, dTcell/dt≈0.
Once the accurate determination of 262)( Rk and CpM is completed for a particular calorimetric
cell, then Eq. 9 can be used directly in evaluating the excess power, PX, during all time periodsand even for future experiments using this same calorimetric system. However, the Dewarvacuum may soften with the passage of several years (due mainly to the slow diffusion of
6
atmospheric helium through the glass walls of the Dewar cell) leading to a gradual increase inthe radiative heat transfer coefficient [4].
The application of Eq. 9 to obtain integral heat transfer coefficients requires that the excesspower, PX, be constant over the time period considered. In turn, this requires experiments usingsuitable “blank” or control systems. If the excess power generation varies with time, one willinevitably conclude that the instrumentation has enhanced errors. Moreover, such a conclusionwill apply to any calorimetric system that is used. The lack of execution of appropriate “blankexperiments” is undoubtedly a contributory factor to confusion concerning the Fleischmann-Ponscalorimetry.
These Dewar calorimeters behave as ideal well-stirred tanks, thus the errors are mainly those setby the temperature measurements. If the temperature measurement error is ±0.01 K and Tcell-Tb
= 10.00 K, then this temperature error would be ±0.1%. This temperature measurement error canbe reduced to ±0.001 K by calibrating the thermometers, by room temperature control, and byaveraging methods; therefore, random measurement errors can be reduced to ±0.01%. The useof an 11-point average has been found to be especially useful in decreasing the random errors[4]. For measurements every five minutes, such averaging gives about 52 independent values forthe recommended 2-day measurement cycle [4].
The use of a Dewar isoperibolic calorimeter in a control experiment to measure the rate ofenthalpy production due to the reduction of electrogenerated oxygen yielded 1.1 ±0.1 mW wherethe cell input power was in the range of 800 to 1000 mW [1, 2]. This demonstrates that thecalorimetric error was, in fact, reduced to ±0.01% for this experiment [1, 2].
The Use of F-P Dewar Calorimeters at NHE
Three F-P Dewar isoperibolic calorimetric cells with detailed instructions were supplied to theNHE laboratory in Sapporo, Japan around 1993. The NHE studies concluded that the originalmethod of Fleischmann-Pons calorimetry was not satisfactory, hence a modified version of thiscalorimetry was adopted [8]. It was reported that the NHE modified version of the F-Pcalorimetry could detect excess power exceeding 30 mW over a two month period whereas NHEclaimed an error as large as ±0.3 W existed for the original F-P method [8].
One of us (M.H.M.) had the opportunity to work directly with this F-P Dewar calorimetry atNHE in 1997-1998 and completed six experiments using these three cells [4, 9-13]. Thecathodes investigated were Pd-B, Pd-Ce, and Pd-B-Ce alloys as well as three individualco-deposition experiments [9]. The Pd-B and Pd-B-Ce alloys were prepared by Dr. Imam at theNaval Research Laboratory (NRL), and the Pd-Ce alloy was supplied by Martin Fleischmann.The independent method of data analysis developed by Miles showed that all experiments exceptthe Pd-B-Ce alloy produced significant amounts of excess power and excess enthalpy [9, 10].The Miles method of analysis used only the experimental data where dTcell/dt was small tominimize the error in the CpM value (see Eq. 3). This data selection also minimizes the changesof various properties with time and thus minimizes the need for integration of the data to

7
improve accuracy. By adopting the NHE value of CpM = 490 Jmol-1 and assuming PX = 0, thelower bound heat transfer coefficient, 1Rk , was calculated using Eq. 5. The results for 1Rk
for the Pd-B-Ce cell are shown in Fig. 1. Similar calculations of 1Rk were performed for the
Pd-B and Pd-Ce cells.
By taking averaged values over selected time periods, the lower bound pseudoradiative heattransfer coefficients were 0.84632 ±0.00642 × 10⁻⁹WK-4 for the Pd-Ce-B cell, 0.81120±0.00976 × 10⁻⁹ WK-4 for the Pd-B cell, and 0.79999 ±0.00790 × 10⁻⁹ WK-4 for the Pd-Ce cell.These cells were labeled A.1, A.2, and A.3, respectively, and placed in the same water bath withcell A.2 in the middle [9]. In retrospect, because these three cells were identical, the larger
1Rk
value for the Pd-B-Ce cell, where there was very little excess power, would be more correct.Nevertheless, the individual 1Rk value were used for each cell, and the excess power was then
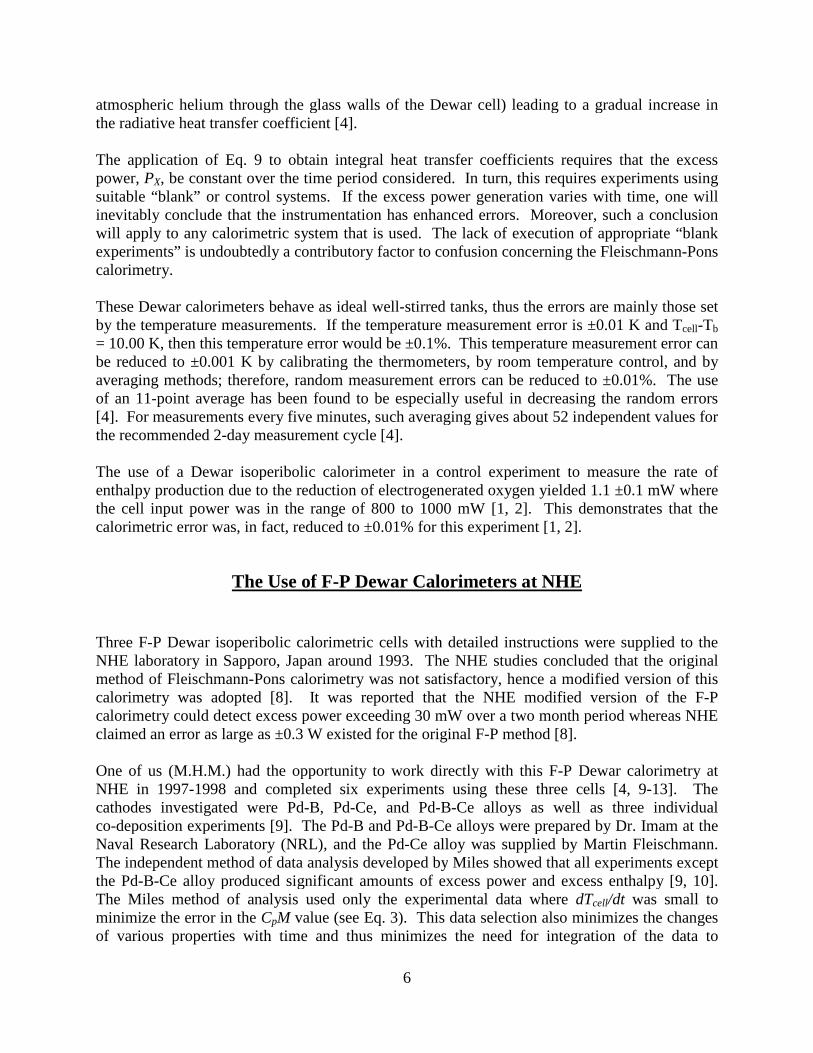
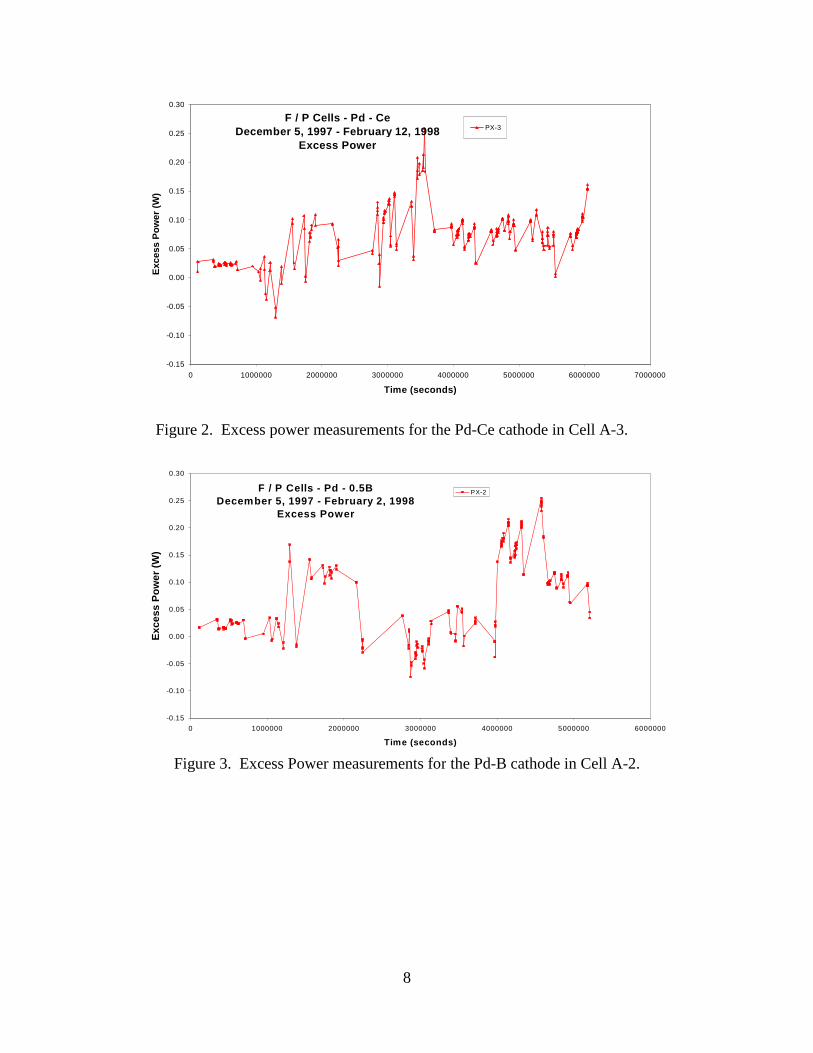
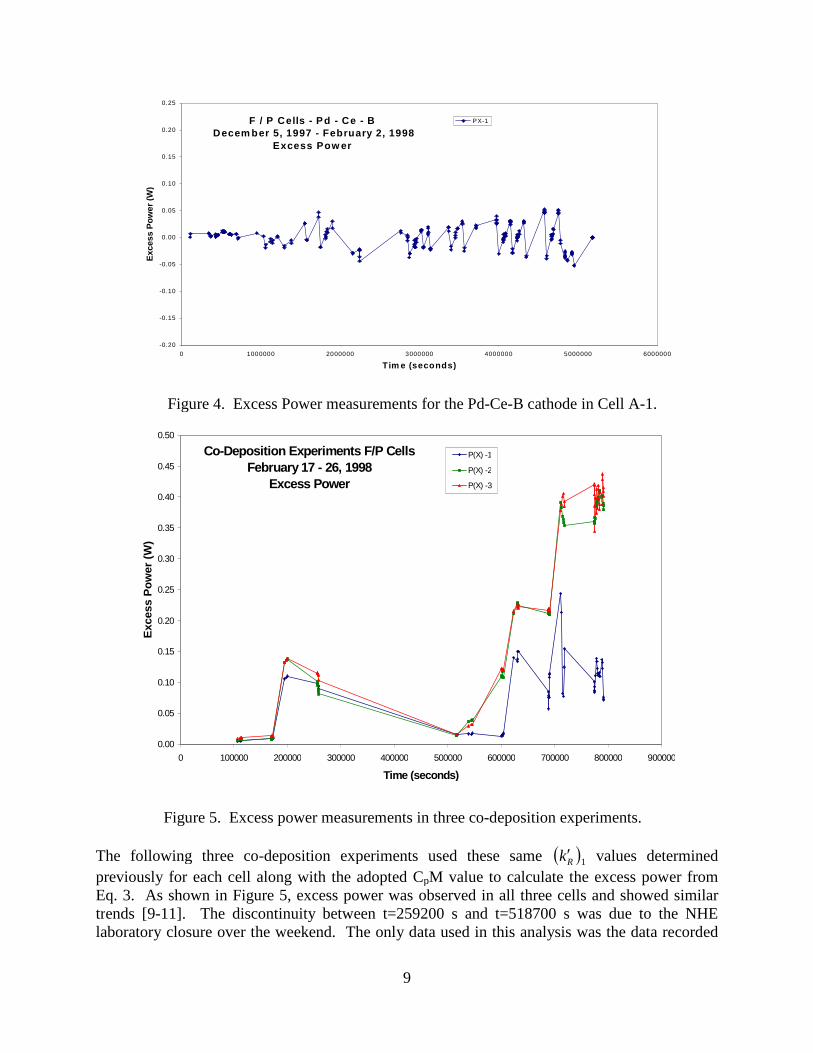
calculated by using Eq. 3. These results are given in Figs. 2, 3, and 4. Large excess power peaksare seen for Pd-Ce (Fig. 2) and Pd-B (Fig. 3), but despite the use of a larger 1Rk , there is no
obvious excess power for Pd-B-Ce (Fig. 4). All of these calculations were made using Excelspreadsheets.
Figure 1. Experimental cell constant, 1Rk , versus time for Cell A-1 (Pd-Ce-B).
F / P Cells - Pd - Ce - BDecember 5, 1997 - February 2, 1998
Cell Constant
8.1E-10
8.2E-10
8.3E-10
8.4E-10
8.5E-10
8.6E-10
8.7E-10
8.8E-10
0 1000000 2000000 3000000 4000000 5000000 6000000
Time (seconds)
Cell
Co
nsta
nt
(W/
K4)
K1 1 -1
8
Figure 2. Excess power measurements for the Pd-Ce cathode in Cell A-3.
Figure 3. Excess Power measurements for the Pd-B cathode in Cell A-2.
F / P Cells - Pd - Ce
December 5, 1997 - February 12, 1998
Excess Power
-0.15
-0.10
-0.05
0.00
0.05
0.10
0.15
0.20
0.25
0.30
0 1000000 2000000 3000000 4000000 5000000 6000000 7000000
Time (seconds)
Ex
ce
ss
Po
we
r(W
)
PX-3
F / P Cells - Pd - 0.5B
December 5, 1997 - February 2, 1998
Excess Power
-0.15
-0.10
-0.05
0.00
0.05
0.10
0.15
0.20
0.25
0.30
0 1000000 2000000 3000000 4000000 5000000 6000000
Time (seconds)
Ex
ce
ss
Po
we
r(W
)
PX-2
9
Figure 4. Excess Power measurements for the Pd-Ce-B cathode in Cell A-1.
Figure 5. Excess power measurements in three co-deposition experiments.
The following three co-deposition experiments used these same 1Rk values determined
previously for each cell along with the adopted CpM value to calculate the excess power fromEq. 3. As shown in Figure 5, excess power was observed in all three cells and showed similartrends [9-11]. The discontinuity between t=259200 s and t=518700 s was due to the NHElaboratory closure over the weekend. The only data used in this analysis was the data recorded
F / P Cells - Pd - Ce - BDecem ber 5, 1997 - February 2, 1998
Excess Pow er
-0.20
-0.15
-0.10
-0.05
0.00
0.05
0.10
0.15
0.20
0.25
0 1000000 2000000 3000000 4000000 5000000 6000000
Tim e (seconds)
Excess
Po
wer
(W)
PX-1
Co-Deposition Experiments F/P Cells
February 17 - 26, 1998
Excess Power
0.00
0.05
0.10
0.15
0.20
0.25
0.30
0.35
0.40
0.45
0.50
0 100000 200000 300000 400000 500000 600000 700000 800000 900000
Time (seconds)
Excess
Po
wer
(W)
P(X) -1
P(X) -2
P(X) -3
10
by hand in a notebook. The full computer data recorded every five minutes for these six F-PDewar type experiments became available only after Miles left NHE.
For the three co-deposition experiments shown in Fig. 5, the cell current was turned on to 0.006A at 86100 seconds, increased to 0.100 A at 173100 seconds, increased to 0.200 A at 259200 s,and then reduced for the weekend due to chlorine evolution. During the following week, thecurrent was increased to 0.100 A at 518700 s, then to 0.200 A at 604500 s, and finally to 0.400 Aat 691200 seconds. The larger excess power effects in this F-P Dewar cell were observed at thehigher currents. The initial composition of the co-deposition solution was 0.025 M PdCl2, 0.15M ND4Cl, and 0.15 M ND4OD in D2O. The cylindrical copper cathodes used in each cell wereapproximately 4 mm × 25 mm. Careful measurements of changes in electrolyte volume showedthat there were no obvious correlations of the excess enthalpy to recombination of theelectrogenerated D2 or O2 gases [9].
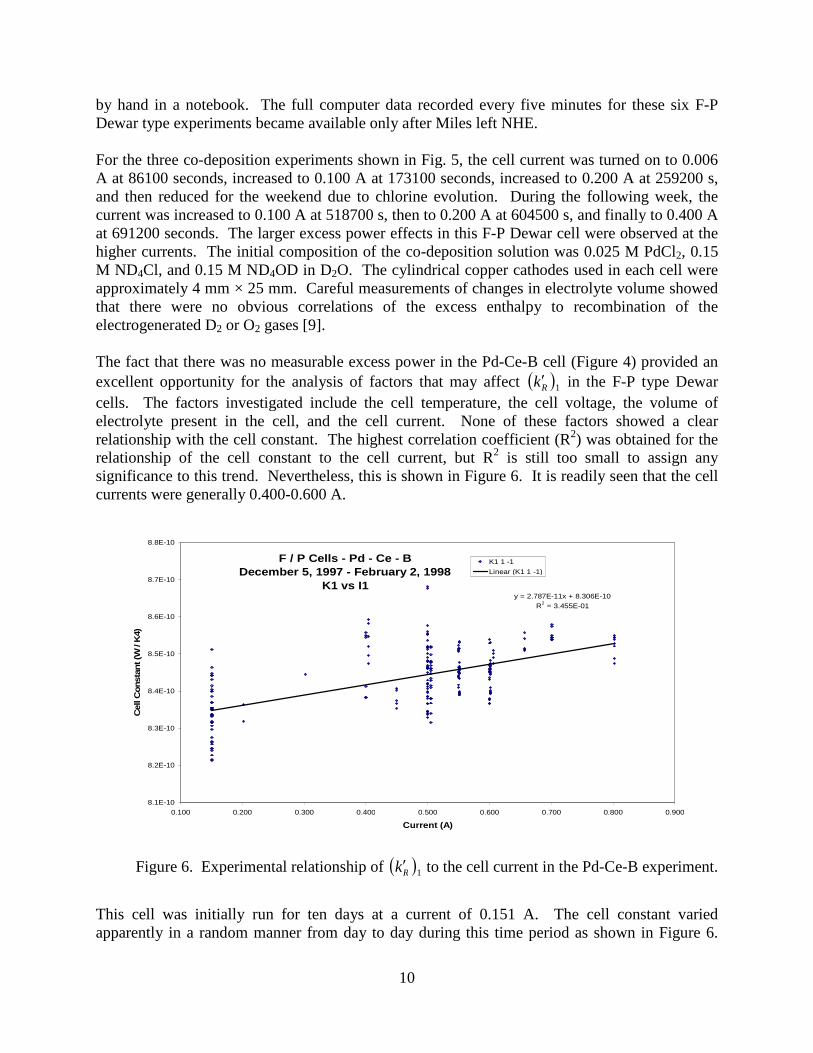
The fact that there was no measurable excess power in the Pd-Ce-B cell (Figure 4) provided anexcellent opportunity for the analysis of factors that may affect 1Rk in the F-P type Dewar
cells. The factors investigated include the cell temperature, the cell voltage, the volume ofelectrolyte present in the cell, and the cell current. None of these factors showed a clearrelationship with the cell constant. The highest correlation coefficient (R2) was obtained for therelationship of the cell constant to the cell current, but R2 is still too small to assign anysignificance to this trend. Nevertheless, this is shown in Figure 6. It is readily seen that the cellcurrents were generally 0.400-0.600 A.
Figure 6. Experimental relationship of 1Rk to the cell current in the Pd-Ce-B experiment.
This cell was initially run for ten days at a current of 0.151 A. The cell constant variedapparently in a random manner from day to day during this time period as shown in Figure 6.
F / P Cells - Pd - Ce - B
December 5, 1997 - February 2, 1998
K1 vs I1y = 2.787E-11x + 8.306E-10
R2
= 3.455E-01
8.1E-10
8.2E-10
8.3E-10
8.4E-10
8.5E-10
8.6E-10
8.7E-10
8.8E-10
0.100 0.200 0.300 0.400 0.500 0.600 0.700 0.800 0.900
Current (A)
Cell
Consta
nt(W
/K
4)
K1 1 -1
Linear (K1 1 -1)
11
The large variations in the cell constant at this initial low current illustrate the error in using asingle heating pulse to determine the cell constant. Experimental data from various time periodsis needed to accurately determine the true pseudoradiative heat transfer coefficient [1, 2, 4].
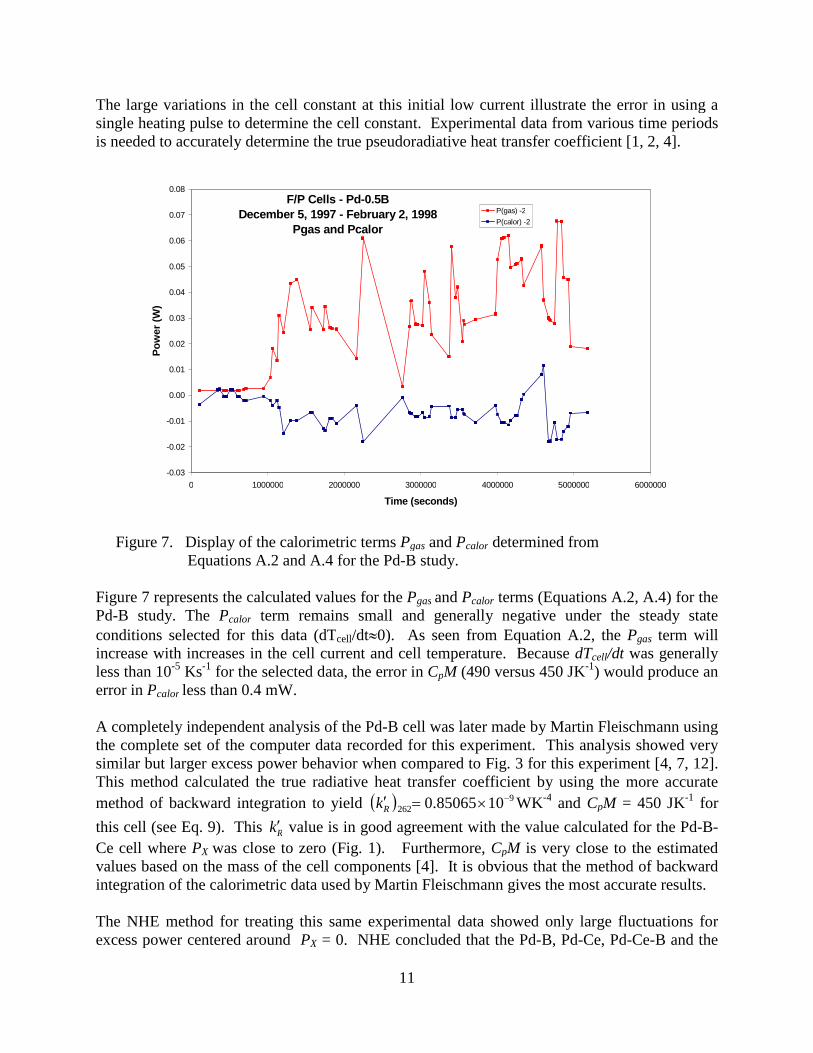
Figure 7. Display of the calorimetric terms Pgas and Pcalor determined fromEquations A.2 and A.4 for the Pd-B study.
Figure 7 represents the calculated values for the Pgas and Pcalor terms (Equations A.2, A.4) for thePd-B study. The Pcalor term remains small and generally negative under the steady stateconditions selected for this data (dTcell/dt0). As seen from Equation A.2, the Pgas term willincrease with increases in the cell current and cell temperature. Because dTcell/dt was generallyless than 10-5 Ks-1 for the selected data, the error in CpM (490 versus 450 JK-1) would produce anerror in Pcalor less than 0.4 mW.
A completely independent analysis of the Pd-B cell was later made by Martin Fleischmann usingthe complete set of the computer data recorded for this experiment. This analysis showed verysimilar but larger excess power behavior when compared to Fig. 3 for this experiment [4, 7, 12].This method calculated the true radiative heat transfer coefficient by using the more accurate
method of backward integration to yield 9262 1085065.0
Rk WK-4 and CpM = 450 JK-1 for
this cell (see Eq. 9). This Rk value is in good agreement with the value calculated for the Pd-B-
Ce cell where PX was close to zero (Fig. 1). Furthermore, CpM is very close to the estimatedvalues based on the mass of the cell components [4]. It is obvious that the method of backwardintegration of the calorimetric data used by Martin Fleischmann gives the most accurate results.
The NHE method for treating this same experimental data showed only large fluctuations forexcess power centered around PX = 0. NHE concluded that the Pd-B, Pd-Ce, Pd-Ce-B and the
F/P Cells - Pd-0.5B
December 5, 1997 - February 2, 1998
Pgas and Pcalor
-0.03
-0.02
-0.01
0.00
0.01
0.02
0.03
0.04
0.05
0.06
0.07
0.08
0 1000000 2000000 3000000 4000000 5000000 6000000
Time (seconds)
Po
wer
(W)
P(gas) -2
P(calor) -2
12
co-deposition experiments gave large calorimetric errors and no excess power. A comparison ofthe NHE and Fleischmann results for the same Pd-B study have been reported previously (seeFig. A.18 and Fig. A.19 of Reference 4).
The main issues with the NHE analysis of the F-P calorimetric data are as follows [4, 7, 12]:
1. The radiative heat transfer coefficient was determined solely by the first heating pulsethat occurred on the third day.
2. The presence of any excess heat on the third day will result in radiative heat transfercoefficients that are too small.
3. The use of a radiative heat transfer coefficient that is too small produces, in effect, a shiftof the zero line for excess power. Excess power, therefore, becomes confused with thecalorimetric error.
The Pd-B study and the three co-deposition experiments were all producing excess power on thethird day (see Figs. 3, 5). Another problem was that the heating pulse used by NHE was tooshort for these cells (6 versus 12 hours); therefore, the cell temperature did not have sufficienttime to relax to equilibrium [4, 7, 12]. An additional concern is that forward integration wasused by NHE rather than the more accurate backward integration (Eq. 9). Also, the heat capacityof the system (CpM) used by NHE was too large (490 versus 450 JK-1). This error will becomeserious for time periods where the cell temperature is changing rapidly with time.
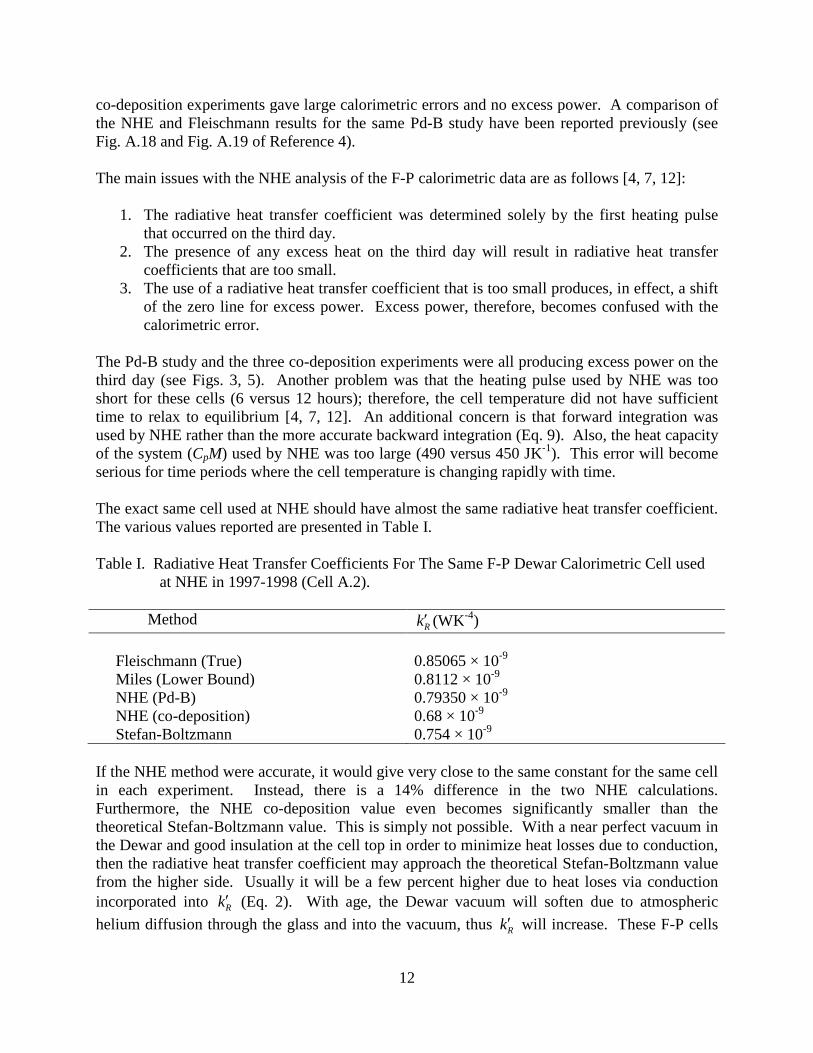
The exact same cell used at NHE should have almost the same radiative heat transfer coefficient.The various values reported are presented in Table I.
Table I. Radiative Heat Transfer Coefficients For The Same F-P Dewar Calorimetric Cell usedat NHE in 1997-1998 (Cell A.2).
MethodRk (WK-4)
Fleischmann (True) 0.85065 × 10⁻⁹
Miles (Lower Bound) 0.8112 × 10⁻⁹
NHE (Pd-B) 0.79350 × 10⁻⁹
NHE (co-deposition) 0.68 × 10⁻⁹
Stefan-Boltzmann 0.754 × 10⁻⁹
If the NHE method were accurate, it would give very close to the same constant for the same cellin each experiment. Instead, there is a 14% difference in the two NHE calculations.Furthermore, the NHE co-deposition value even becomes significantly smaller than thetheoretical Stefan-Boltzmann value. This is simply not possible. With a near perfect vacuum inthe Dewar and good insulation at the cell top in order to minimize heat losses due to conduction,then the radiative heat transfer coefficient may approach the theoretical Stefan-Boltzmann valuefrom the higher side. Usually it will be a few percent higher due to heat loses via conductionincorporated into Rk (Eq. 2). With age, the Dewar vacuum will soften due to atmospheric
helium diffusion through the glass and into the vacuum, thus Rk will increase. These F-P cells
13
were at least 4 years old when used in 1997-1998 at NHE, thus the higher value for Rk reported
by Fleischmann is not surprising. A very similar high value was found for 1Rk from data for
the Pd-B-Ce cell (0.84632 ± 0.00642 × 10⁻⁹ WK-4, see Fig. 1) where there was very little excesspower.
The data analysis of these F-P Dewar cells must involve averaging procedures to accuratelydetermine any excess power. For example, an experimental error of only ±0.01°C in a singlemeasurement of the cell temperature produces an error of ±15 mW. This is due to the largevalue of 450 JK-1 for CpM. When this 450 JK-1 is multiplied by ±0.01K/300 s, then ±15 mW isthe error in Pcalor (Eq. 3). The 300 seconds (5 minutes) is the time period between measurementsby the ICARUS data acquisition system.
The Use of F-P Dewar Calorimeters at Grenoble
The objective of the Grenoble (France) work was to check the reliability of the F-P Dewarcalorimeter from ambient to the boiling temperature [5]. The Dewar cells with the upper partsilvered were claimed to be identical to those used by Fleischmann and Pons [5]. The conclusionof this study over a three year period was that the F-P Dewar calorimeters were very accurateand well adapted to study the F-P effect [5]. Five out of eighteen experiments produced excessheat. The measured excess power using palladium cathodes ranged from 50 to 300 mW. Thelargest excess heat measurements occurred above 70°C, and the percent of excess during theboiling phase reached 150% [5].
Notable experimental conditions used at Grenoble include the excellent room temperaturecontrol (20°C±0.1°C), the filling of the cell in an argon atmosphere to avoid H2O and CO2
contamination, the automatic addition of D2O every time 1 cm3 is consumed, the collection ofdata every 6 seconds, and averaging every minute [5]. The experimental profile was to use aconstant current of 0.20 A (0.26 A cm-2) until the cell temperature reached 40°C (typically 1 to 2weeks). The cell current was then raised to 0.50 A, and the experiment continued untileventually cell boiling began that led to a dry cell [5].
Considerable simplification of the calorimetric equations was used at Grenoble [5]. The excessheat was calculated by neglecting PH, PC and PW in Eq. 1, thus
gasRXEIcalor PPPPP (10)
where gasP is approximated by using only the larger term that involves the enthalpy of
vaporization of D2O, L (Eq. A.4).
Thus
LPPPFIPgas /75.0/ (11)
14
At cell temperatures below 70°C, Eq. 10 is further simplified by assuming that Pcalor and Pgas
can also be neglected, thus
IEETfkPPP HRElRX (12)
The cell was calibrated using a Pt cathode and assuming PX=0, thus Eq. 12 becomes
TfIEEk HR / (13)
Some errors would obviously be introduced by these calorimetric approximations. Nevertheless,these errors would likely be less than 5% and would generally minimize the reported excesspower.
A troubling aspect of the Grenoble experiments is that kR was reported as 0.075, 00905, and0.078 for cells P1, P2, and P3, respectively, with no assigned units [5]. These values would bemore fitting for a conductive heat transfer coefficient, kC. The electrolyte volumes used in thesecells ranged from 72 to 85.5 cm3 giving on average volume of 78.9 cm3 compared to 90 cm3 forF-P Dewar cells used at NHE. If the Grenoble and NHE Dewar cells had a similar diameter,then the radiative heat transfer surface area would be proportional to the cell volumes. AssumingkR=0.80 × 10⁻⁹WK-4 for a newer NHE Dewar cell, then the cells used at Grenoble would have aradiative heat transfer coefficient of kR=0.70 × 10⁻⁹WK-4 instead of the values reported. It islikely that Grenoble converted kR into an equivalent kC constant using
bcellRC TTTfkk / (14)
For a cell temperature of 40°C (313.15 K) and a bath temperature of 20°C (293.15 K), thecalculated value for kC is 0.078 WK-1. This is approximately the numerical values reported byGrenoble [3]. It should be noted that kC calculated from Eq. 14 will increase with the celltemperature. For Tcell = 70°C (343.15 K) and the same bath temperature, kC = 0.091 WK-1. Thismay explain the range of cell constants reported. Although CpM was not reported by Grenoble, itcan be estimated from the electrolyte volumes that CpM = 395 JK-1 versus CpM = 450 JK-1 forthe NHE F-P Dewar cells.
The Use of F-P Dewar Cells at Harwell
The Harwell (U.K.) laboratory investigated the F-P Dewar calorimetric cells during the earlystage (1989) of the cold fusion controversy [14]. These Harwell experiments were hastilyperformed, and the apparent calorimetric error of ±15% falls far short of the ±0.01% error or±0.1 mW reported by Fleischmann [1, 2].
The F-P type Dewar calorimeter used by Harwell had an inner diameter of 2.5 cm and a height of10.0 cm with no silvering versus 2.5 cm and 25.0 cm respectively, with silvering for theICARUS-1 cell used at NHE. From the cell dimensions given, it appears that stirring by theelectrolysis gases would be adequate for the Harwell cell. A single thermistor was used that was

15
positioned in the upper half of the cell. Details of this Harwell cell design have been presentedelsewhere [14, 15].
The Harwell publication [14] provides only fragmental information about the calorimetricequations used in their calculations for the F-P Dewar cell. Searching for terms corresponding toEq. 1 yielded only PEI and an approximation for Pgas that is even less accurate than Eq. 11. ThePcalor, PH, and PW terms are missing. The missing Pcalor term may account for periods of largeendothermic behavior (Figs. 2b, 2c, 2d of Ref. 12) that violates the First Law ofThermodynamics. About equal contributions were reported for PR and PC modeled simply by
PR + PC = k ΔT (15)
where k = 0.1 WK-1 [14]. If true, this suggests a very poor vacuum for the Dewar cell that wasused at Harwell.
To the credit of the Harwell group, their raw data was made available, and an independentanalysis of this raw data has been reported by Melich and Hansen [16, 17]. This analysisreduced the calorimetric error to approximately 1% for some of the time periods. In one ofHarwell’s D2O cells (Cell 3), there were more than ten time intervals where an unexplainedpower source may be operating in the F-P cell to produce 100 to 200 mW of anomalous power[16]. It was also concluded that Harwell would not have been expected to produce significantexcess heat in almost all of their cells because of low current densities, low levels of D loadinginto the Pd, and other poor choices in their experimental design [15].
Another important analysis of the Harwell raw data has been made by Fleischmann [15].Seventeen “heat bursts” were documented for a Pd/D2O+0.1 M NaOD study (Cell 3) whereasnone were observed for a similar Pd/H2O + 0.1 M NaOH experiment (Cell 4). The calculation of 1Rk , by assuming PX = 0 (Eq. 5) for the Harwell data shows a significant difference in actual
values as well as different behavior over time for the H2O and D2O experiments [15]. BecausePX is actually close to zero for the H2O study, then 21 RR kk for this experiment in the Dewar
cell. The use of Eq. 7, therefore, gives an excess power of PX = 190 mW at 14239 hours thatdecreases to PX = 70 mW at 15636 hours for the D2O study (Fig. 3A, Ref. 15). Fleischmann alsoconcluded that this D2O study shows a decrease in excess power with time [15]. Fleischmann’sfinal conclusion was that excess enthalpy generation was in fact observed in the Harwell studycontrary to the conclusions reached by the authors [15].
Discussion of possible errors in the Harwell experiments has also been provided by Worledge[18]. Many of the Harwell experiments were run at current densities below the thresholdrequired for excess power production [18]. The persistence of Harwell’s negative power balanceis not easily explained [18]. To stabilize the baseline during calibration of the F-P cell, theelectrolytic current used by Harwell was reduced to zero or to 20-40% of the operating current[18]. Uncontrolled errors could be introduced by changing the cell current to perform thesecalibrations [18]. It was also shown that the assertion in the Harwell paper that use of thelinearized form (Eq. 15) always overestimates the cell power is incorrect [18].

16
The Harwell laboratory used two other calorimeters in addition to the F-P Dewar cell. Thesewere the improved heat-flow calorimeter (IHF) with a 500 mL capacity and an isothermalcalorimeter with a 1000 mL capacity [14]. The later calorimeter was designed to determine theheat production for samples of plutonium, thus the operating environment for the F-P experimentusing this system was quite different from that for Dewar cells. As admitted by Harwell [14], thelarge volumes of these cells makes them less sensitive for the detection of any excess power.
A previous summary of error sources and problems for the Harwell calorimetry included theirmethod of cell calibration during electrolysis when any excess power is unknown, their largepower changes during calibrations, marked endothermic behavior following topping their cellswith D2O, and their use of small electrodes in large electrolyte volumes that would minimize thedetectability of any excess power effect as well as contribute to poor stirring [19]. Furthermore,the unfavorable geometry of various cathodes (beads, ribbon, bar) would not provide for uniformelectric fields and symmetry required for high deuterium loadings [19]. As previouslyconcluded, the Harwell results in no way disprove the F-P effect [17].
China Lake Calorimetry / Heat Conduction
No Dewar cell was used in the China Lake isoperibolic calorimeter, thus the main heat transferpathway was by conduction through the insulated jacket surrounding the cell. The samecalorimetric equations apply except Eq. 2 becomes
bcellCWRCC TTkPPPP (16)
where the much smaller PR and PW terms are incorporated into a pseudoconductive power term,
CP . Therefore, Eq. 3 becomes
TkPPPPdtdTMCP CgasXHElcellpcalor / (17)
where ΔT = Tcell – Tb.
The basic design of the China Lake calorimeter has been described in previous publications [20-22]. Important features include the small size of the electrochemical cell (1.8 cm diameter and15.0 cm length) that was filled with 18.0 cm3 of electrolyte. The electrochemical cell was placedin a calorimetric jacket within a secondary compartment that contains two thermistor positionedoutside the cell on opposite sides of the cell wall and at different heights from the bottom of thecell (1.9 and 4.5 cm). This calorimetric design where the temperature is measured in a secondaryliquid or solid phase surrounding the electrochemical cell minimizes the sloping baselineproblem, i.e. the change in the cell constant due to solvent losses [19]. The cell can then besimply modeled as the heating source for the secondary phase. This secondary phase also servesas an integrator for the power produced by the electrochemical cell. The estimated error range ofthe basic China Lake calorimetry was ±20 mW or ±1% of the input power, whichever is larger[19, 22]. The pseudoconductive heat transfer coefficient varied somewhat with the actual cellused, but generally Ck was approximately 0.14 WK-1[19]. The value for CpM was estimated at
150 JK-1. Calorimetric measurements were generally performed where dTcell/dt was small, thus

17
Pcalor was generally less than 10 mW and usually negative in sign [19]. No mathematicalintegration of the differential equation (Eq. 17) was used to improve the accuracy.
Near the end of the Navy (ONR) funded program at China Lake, an improved calorimeter wasdeveloped with the work of Kendall B. Johnson [20, 23]. The noise level for this improvedcalorimeter was only 0.2 mW or 0.1% of the input power, whichever is larger. This new open,isoperibolic calorimeter used at China Lake along with the specific improvements is illustrated inFigure 8.
Figure 8. Improved design for the integrating, open, isoperibolic calorimeterconstructed at China Lake in 1994.
The major new improvements included a copper inner jacket that acts as the integrator andreplaces the previous H2O-filled jacket. An insulating box over the cell top and bath greatlyreduced the effect of changes in the room temperature. A copper outer jacket contacts the bathand minimizes bath level effects by virtue of its high thermal conductivity. Foam insulation wasused between the two copper jackets to avoid any shifting of the insulating material.Furthermore, the lead wires coming out of the cell were thermally staked to the bath itself,thereby further reducing the effect of the room temperature. Active cooling of the bath providedexcellent stability for the bath temperature even at high input power to the cell. The size of theelectrochemical cell remained the same and provided a filled volume of 18 cm3 for theelectrolyte.
The ability of this new China Lake isoperibolic calorimeter to measure the heat of absorption ofdeuterium into the palladium cathode is shown in Figure 9.

18
Figure 9. Measurement of the exothermic heat of absorption of deuterium into a palladium wire(0.1 × 4.3 cm) cathode using the improved China Lake calorimeter.
An excess power output of approximately 6.5 mW was observed for 2 hours (Figure 9).Integrating the excess power shown in Figure 9 yields -44.7 J that compares very favorably tothe calculated -40.2 J based on the cathode size (0.1 × 4.3 cm Pd wire), a loading level of PdD0.6,and using the reported value of ΔH= -10.53 kJ/mol Pd [20]. The somewhat larger experimentalvalue is expected because the loading shown in Figure 9 likely proceeds beyond PdD0.6 togenerate even more heat. Assuming ΔH remains constant, the measured excess power would correspond to PdD0.67.
Several excess power effects were measured with this improved China Lake calorimeter beforethe ONR funded program terminated in 1995 [20]. Figure 10 presents an excess power effect ofapproximately 75 mW for a Johnson-Matthey wire cathode sample. Previous samples of thismaterial had produced excess heat in earlier China Lake experiments with the older calorimetricdesign [20]. A later experiment at NHE in 1997 using this material also produced excess power[21].
19
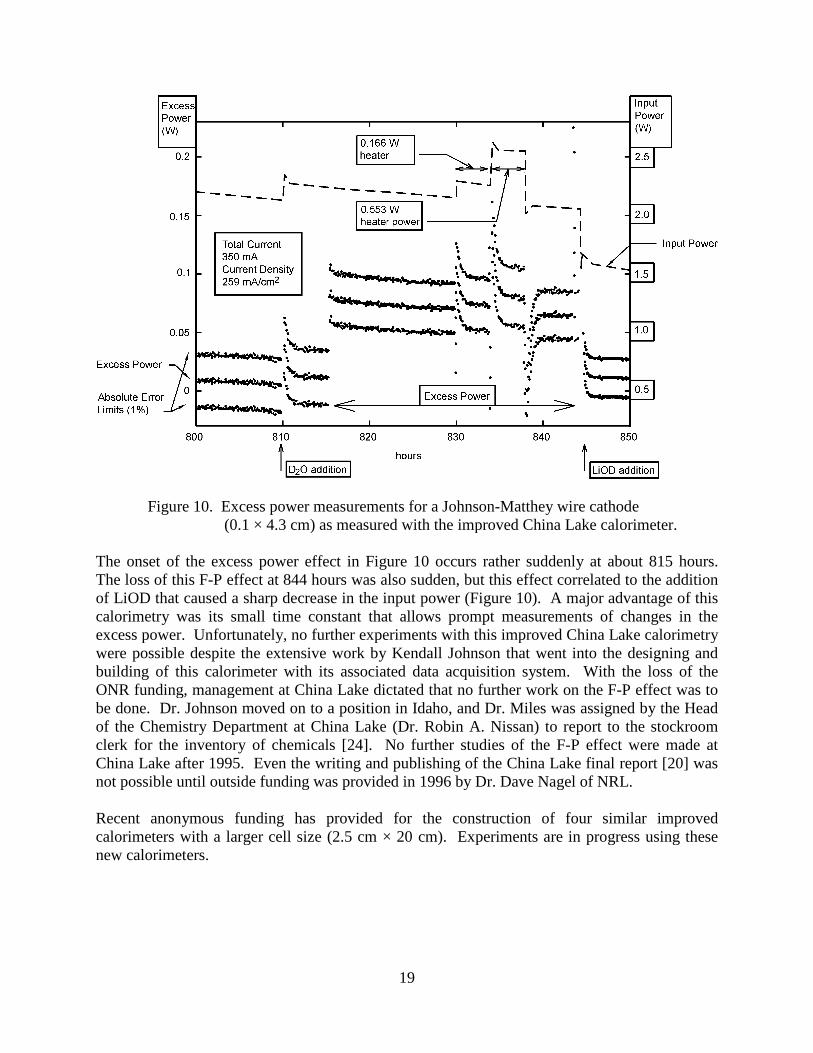
Figure 10. Excess power measurements for a Johnson-Matthey wire cathode(0.1 × 4.3 cm) as measured with the improved China Lake calorimeter.
The onset of the excess power effect in Figure 10 occurs rather suddenly at about 815 hours.The loss of this F-P effect at 844 hours was also sudden, but this effect correlated to the additionof LiOD that caused a sharp decrease in the input power (Figure 10). A major advantage of thiscalorimetry was its small time constant that allows prompt measurements of changes in theexcess power. Unfortunately, no further experiments with this improved China Lake calorimetrywere possible despite the extensive work by Kendall Johnson that went into the designing andbuilding of this calorimeter with its associated data acquisition system. With the loss of theONR funding, management at China Lake dictated that no further work on the F-P effect was tobe done. Dr. Johnson moved on to a position in Idaho, and Dr. Miles was assigned by the Headof the Chemistry Department at China Lake (Dr. Robin A. Nissan) to report to the stockroomclerk for the inventory of chemicals [24]. No further studies of the F-P effect were made atChina Lake after 1995. Even the writing and publishing of the China Lake final report [20] wasnot possible until outside funding was provided in 1996 by Dr. Dave Nagel of NRL.
Recent anonymous funding has provided for the construction of four similar improvedcalorimeters with a larger cell size (2.5 cm × 20 cm). Experiments are in progress using thesenew calorimeters.
20
California Institute of Technology Calorimetry
The initial publication by Caltech on the F-P effect was received by Nature on 23 May 1989[25]. This means that all work was completed in less than two months after the initialannouncement of the F-P effect (March 23, 1989). It is remarkable that Caltech claimscompletion of multiple calorimetric experiments in this short time span because completion of asingle F-P experiment generally requires 4 to 8 weeks of electrolysis. It was reported that noevidence had been obtained for any excess enthalpy, neutron, gamma ray, tritium or heliumproduction during electrolysis of D2O with palladium cathodes [25].
The first step in evaluating this Caltech calorimetry is to look for the modeling equations such asEq. 3 or Eq. 17. It was found that this paper is almost devoid of any calorimetric equations.Only PEI and a term for the total power (PT) could be identified where PT = (Tcell – Tb) / h, thush = KC
-1 (KW-1) and is called the heating coefficient. This use of h shows that the main heattransfer pathway was by conduction in the Caltech calorimetry. A Dewar flask containing 30mL of electrolyte was used, but the Dewar walls contained 1 atm of air, hence there was novacuum and heat conduction would dominate over electromagnetic radiation.
A Tronac Model 1250 vacuum-jacketed calorimetric Dewar is also described, but it appears thatmost reported results were for the air-jacketed Dewar [25]. A surprising feature was that theelectrolyte was vigorously stirred with a motor, and the resulting Joule heating from stirring(~0.3°C) had to be accounted for in all measurements [25]. Besides being a rather large errorsource, this need for stirring suggests a much larger diameter cell than the NHE, Grenoble, orChina Lake cells. A schematic of the calorimeter in a later Caltech publication [26] indeedshows a short, fat cell with a length/diameter ratio of only 1.4 versus a ratio of 10 (25 cm / 2.5cm) for the NHE F-P cells [4]. There would not be room for the unneeded mechanical stirrer inthe narrow F-P Dewar cells.
The most disturbing aspect of the Caltech report concerns the heating coefficient in aPd/D2O+0.1 M LiOD experiment that was allowed to increase with time from 14.0 KW-1
(0.0714 WK-1) at 14.7 hours to 15.9 (0.0629 WK-1) KW-1 at 115.0 hours. This could just as wellhave been interpreted as a 13.6% excess power effect. Experiments at Caltech for Pd/H2O + 0.1M LiOH gave lower heating coefficients (h = 12.5 ± 0.7 KW-1) that did not show this largeincrease with time. Using a constant h value of 14.0, KW-1 yields excess power that increaseswith the electrolysis time up to 76 mW [19]. The excess power density of 1.0 W/cm3 Pd for ananalysis of the Lewis study [19] is in excellent agreement with reported excess power in other F-P experiments using similar current densities [27, 28]. A complete analysis of the Caltechcalorimetry has been previously presented [19]. Caltech was informed of this error analysis andwas asked to respond, but no rebuttal was received. A related discussion of the Caltechcalorimetry was also produced by Noninski [29]. Both Noninski [29] and Miles [19] concludedthat the Caltech calorimetric method of replacing a portion of the electrolysis power by resistorpower cannot be used to prove that there is no excess power. This Caltech method only indicatesthat any resulting change in excess power is small.
21
Another related paper by Caltech that appeared later in 1989 [26] provides no additionalinformation on the calorimetric equations used to model the calorimeter except for
PEI = (E - γ EH) I (18)
where γ is the current efficiency for electrolysis. If all the electrolysis gases escape from the open cell, then γ = 1.00. This is the case in almost all F-P experiments in open cells, thus Eq.A.3 can be used. Nevertheless, the current efficiency should always be monitored to justify theuse of γ == 1.00 (Eq. A.3). In several co-deposition experiments at China Lake where palladiumparticles became exposed to the electrolysis gases above the electrolyte level, γ values considerably less than unity were measured and appropriate corrections were made [20]. For acontrol experiment using Pt/D2O+0.1 M LiOD in a F-P Dewar cell, the power due to thereduction of electrogenerated oxygen at the cathode was measured at 0.0011±0.0001 W withI=0.2000 A [1, 2]. Therefore, γ was very close to unity for this cell.
Massachusetts Institute of Technology Calorimetry
The stated purpose of the M.I.T. investigation was to replicate as nearly as possible theexperimental procedure of Fleischmann, Pons, and Hawkins [30]. Their conclusions stated thatno excess output power or any other evidence of fusion products (neutrons, gamma, helium,tritium) was detected [30].
For both the Phase I and Phase II calorimetry, Dewar cells were not used, thus the main heattransfer pathway was by conduction rather than by electromagnetic radiation as in the F-P Dewarcells. The Phase I calorimetry used by M.I.T. was admittedly relatively crude with error limits of±0.3 W. The two Phase II calorimeters were greatly improved and consisted of reasonable celldimensions of 12 cm in height and a narrow 2.1 cm in diameter. For these two cells, theelectrolysis gases provided sufficient mixing of the electrolyte to provide thermal uniformity forcell current densities above about 18 mA/cm2 (50 mA). Unlike the short, fat cells used byCaltech [25, 26], no mechanical cell stirring was necessary.
The two M.I.T. calorimeters used glass wool thermal insulation in the compartment between thecell and water bath [30]. The Pt RTD thermometer used in each cell by M.I.T. had an accuracyof ±0.1°C compared to ±0.01°C for the two thermistors used in each F-P Dewar cell. Thesensitivity of the Phase II M.I.T. calorimeters was stated at ±40 mW [30] contrasted to ±0.1 mWsensitivity for the F-P Dewar calorimeters [1, 2]. From the dimensions of the M.I.T. Pd rodcathodes (0.1 × 9 cm), the expected excess power of about 70 mW would not be easilydistinguished from the ±40 mW calorimetric error. The M.I.T. laboratory reported their keycalorimetric measurements over a rather short time period (100 hours). The observation ofmeasureable excess power with Pd cathodes in D2O generally requires 6 days or more ofelectrolysis [19]. No data was provided by M.I.T. for the bath temperature used or for their cellconstants (kC), hence it is not possible to accurately check their calorimetric results.
The proper calorimetric equation to be used by M.I.T. would be Eq. 17. However, M.I.T. used afeedback control system that adjusted the heater power to maintain a constant cell temperature
22
(dTcell/dt = 0), thus Pcalor = 0 (Eq. 17). The calorimetric equation reported by M.I.T. [30]transforms into
TkPPPP CXHElcalor 0 (19)
Comparison with Eq. 17 reveals that the Pgas term (Eq. A.4) involving mainly the evaporation ofD2O is missing. Nevertheless, this error would be constant for a constant cell temperature andcell current (Eq. A.4). Although no equation for Pgas was presented, M.I.T. comments thatevaporative losses will affect power measurements for the calorimetric cell [30]. It was assumedby M.I.T. that at constant cell temperature
PX + PH = kC ΔT – PEI = constant (20)
thus a decrease in PH at constant Tcell would measure any increase in PX. This is only anapproximation because the cell voltage, E, and hence PEI (Eq. A.3) will decrease with time due tothe decreasing electrolyte volume and hence increasing conductance. Furthermore, thedecreasing electrolyte volume will cause a decreasing cell constant, kC [19]. Therefore, it is notunexpected that a significant drift in PH caused by the reduction in solvent volume was observedover long time periods [30]. This drift in PH over time makes the determination of excess powerusing Eq. 20 difficult and subjective.
It is interesting that the M.I.T. D2O cell (Fig. 5 of Ref. 30) shows an increasing cell temperatureand a corresponding decreasing cell voltage that was not present in the H2O cell (Fig. 4 of Ref.30). This suggests a possible excess power effect in the D2O cell that increases with time. Thefeedback system should have lowered the heater power (PH) to maintain a constant temperaturein the D2O cell, but (heaven forbid) this would have implied an increase in excess power usingEq. 20. This increase in cell temperature of 0.3°C gives an estimated excess power of 30 mW(assuming kC = 0.1 W/K) that was not recorded by Equation 20. It has been claimed that therewas a serious discrepancy between the unpublished raw data and the final published data for theM.I.T. D2O cell [31]. The D2O data points appear to be arbitrarily shifted down to make theapparent excess power vanish [31]. Extensive analysis performed by Dr. Mitchell R. Swartzconcludes that the M.I.T. H2O and D2O data sets were “asymmetrically” treated [32-34]. Thiscontroversy caused M.I.T. to change their calorimetric conclusion from the previous “failure-to-reproduce” to “too-insensitive-to-confirm” [33].
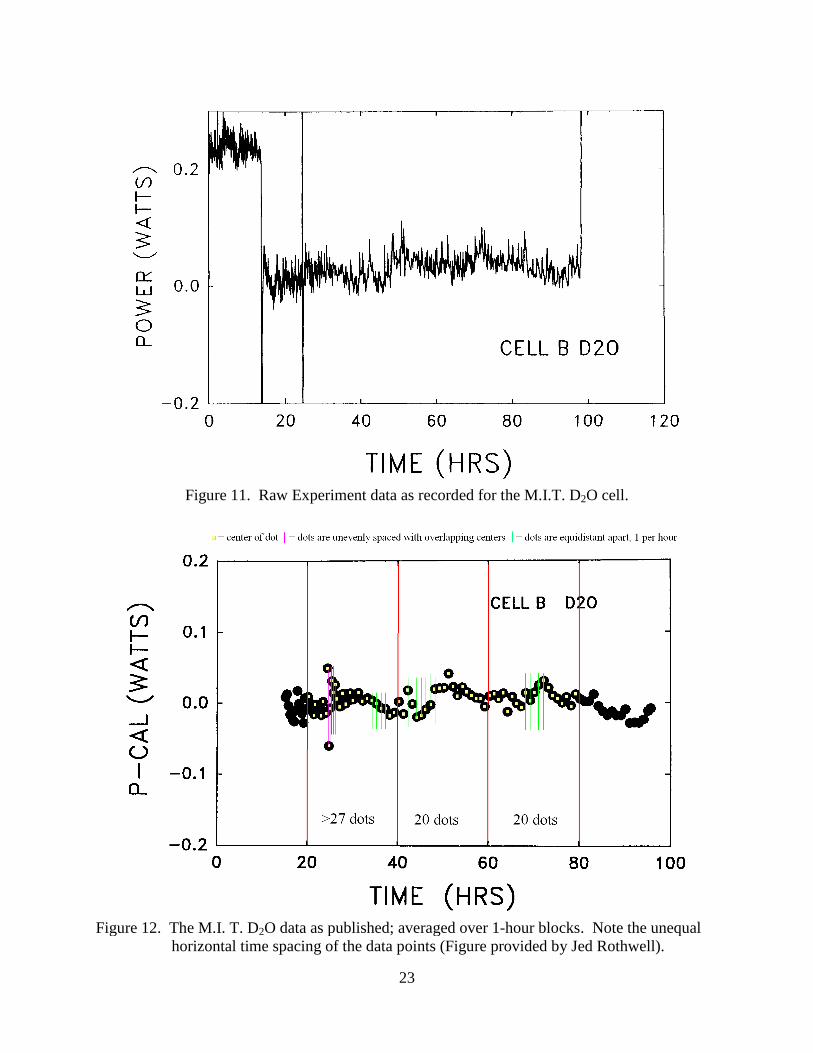
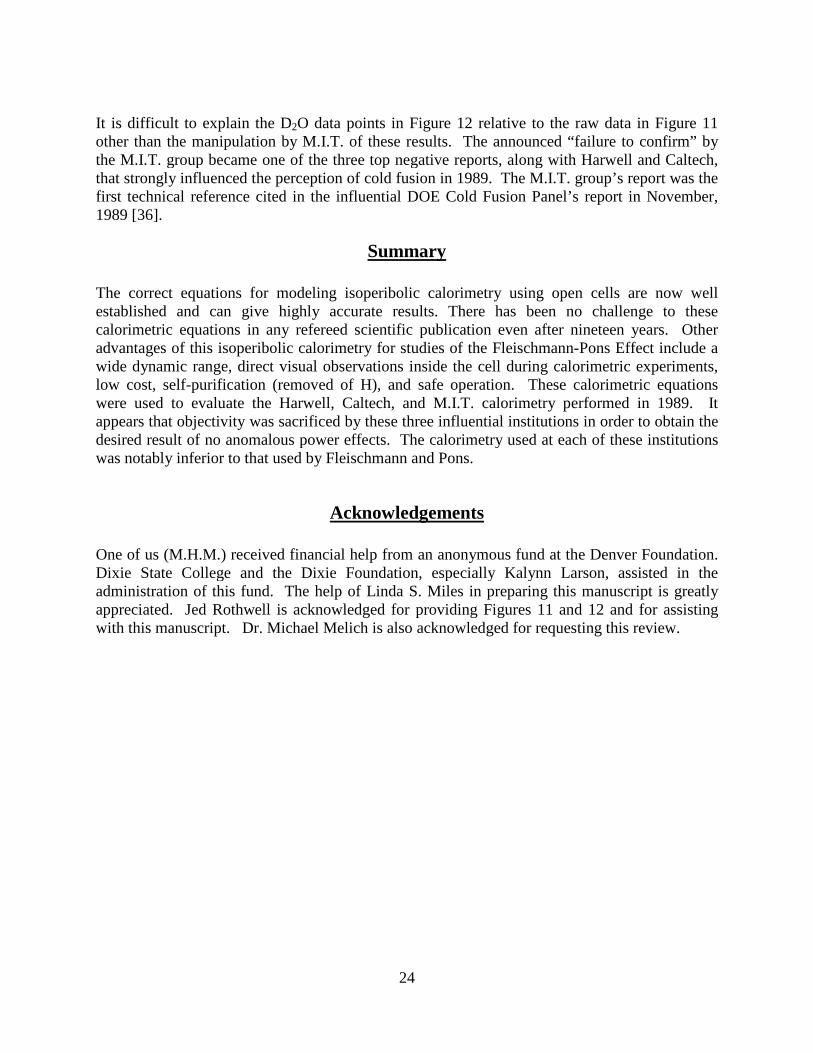
A simple method to ascertain that the H2O and D2O data sets were not treated equally by M.I.T.has been pointed out by Jed Rothwell [35]. It was reported that both the H2O and D2O raw datawas averaged over 1-hour blocks to produce the two figures [30]. For the H2O data (Fig. 4 ofRef. 30), it is readily verified that the averaged data points are evenly spaced with one point perhour as stated. Even a cursory visual inspection shows that this is not true for the D2O data (Fig.5 of Ref. 30). The unpublished M.I.T. raw experimental data as recorded for the D2O cell ispresented in Figure 11. Even if one ignores the raw data showing 235 mW of average excesspower over the first 13.6 hours that was adjusted to zero in Figure 11, there remains later peaksthat yield about 70 mW of excess power. The published data for this D2O cell is shown in Figure12 where the averaged data points for the 1-hour blocks were apparently moved horizontally aswell as vertically to give the unequal spacing and near zero excess power [35].
23
Figure 11. Raw Experiment data as recorded for the M.I.T. D2O cell.
Figure 12. The M.I. T. D2O data as published; averaged over 1-hour blocks. Note the unequalhorizontal time spacing of the data points (Figure provided by Jed Rothwell).
24
It is difficult to explain the D2O data points in Figure 12 relative to the raw data in Figure 11other than the manipulation by M.I.T. of these results. The announced “failure to confirm” bythe M.I.T. group became one of the three top negative reports, along with Harwell and Caltech,that strongly influenced the perception of cold fusion in 1989. The M.I.T. group’s report was thefirst technical reference cited in the influential DOE Cold Fusion Panel’s report in November,1989 [36].
Summary
The correct equations for modeling isoperibolic calorimetry using open cells are now wellestablished and can give highly accurate results. There has been no challenge to thesecalorimetric equations in any refereed scientific publication even after nineteen years. Otheradvantages of this isoperibolic calorimetry for studies of the Fleischmann-Pons Effect include awide dynamic range, direct visual observations inside the cell during calorimetric experiments,low cost, self-purification (removed of H), and safe operation. These calorimetric equationswere used to evaluate the Harwell, Caltech, and M.I.T. calorimetry performed in 1989. Itappears that objectivity was sacrificed by these three influential institutions in order to obtain thedesired result of no anomalous power effects. The calorimetry used at each of these institutionswas notably inferior to that used by Fleischmann and Pons.
Acknowledgements
One of us (M.H.M.) received financial help from an anonymous fund at the Denver Foundation.Dixie State College and the Dixie Foundation, especially Kalynn Larson, assisted in theadministration of this fund. The help of Linda S. Miles in preparing this manuscript is greatlyappreciated. Jed Rothwell is acknowledged for providing Figures 11 and 12 and for assistingwith this manuscript. Dr. Michael Melich is also acknowledged for requesting this review.
25
APPENDIX I. Calorimetric Equations
Treating the isoperibolic calorimetric cell as the system of interest, the First Law ofThermodynamics expressed as power (J/s or W) becomes
tPtPtPtPtPtPtPtP WCRgasXHElcalor (A.1)
By definition, Pcalor is the power for the calorimetric cell, PEI is the electrochemical power, PH isthe internal heater power, PX is any anomalous excess power, Pgas is the power carried away bythe gas stream exiting the open cell (D2, O2, D2O vapor), PR is the net power transferred byradiation between the cell and water bath, PC is the power transferred by conduction, and PW
represents the rate of pressure-volume work by the generated electrolysis gases (D2, O2).Because both the cell temperature and cell voltage change with time during electrolysis, most ofthe terms in Eq. A.1 also vary with the time (t). The internal heater power, PH, will be zeroexcept for the time period between turning the heater on (t1) and off (t2). Typical values for PH,when on, are either 0.2000 W or 0.2500 W. There are often time periods where PX is zero orconstant. As usual in thermodynamics, positive quantities represent power added to the system(calorimetric cell) and negative quantities represent power given off by the system to thesurroundings.
The mathematical expressions for the terms in Eq. A.1 are as follows:
Pcalor = CpM(dTcell/dt) (A.2)
PEI=(E-EH)I (A.3)
Pgas=-(I/F){[0.5CP,D 2+0.25CP,O 2
+0.75(P/(P*–P))CP,D2
O(g)]T
+ 0.75 (P / (P*–P)) L} where ΔT=Tcell - Tb (A.4)
PR=-kRf(T) where f(T)=Tcell4 – Tb
4 (A.5)
PC= -kC (Tcell – Tb) (A.6)
PW= -RTcell (dng/dt) = -RTcell(0.75I/F) (A.7)
The pressure terms in Eq. A.4 are bolded to minimize confusion with any power terms. Undernormal constant current (I) operation, the terms Tcell, E, ΔT, and P will vary with time, t. Thechange of the cell temperature with time, as given by Pcalor in Eq. A.2, makes Eq. A.1 anonlinear, inhomogeneous differential equation. Although this differential equation can be useddirectly, numerical integration yields more accurate results. The Pcalor term is obviously largerwhen the cell temperature is changing more rapidly such as when D2O is replenished or when theinternal heater is turned on (t1) or off (t2). The normal 2-day experimental cycle for isoperibolicDewar cells is to replenish D2O at t=0, turn on the internal heater at t1=12 hours, and turn off the

26
internal heater at t2=24 hours for the next 24 hours. This sequence allows adequate time for therelaxation of the cell temperature following each change back to the small baseline value fordTcell/dt. The small progressive decrease with time for the cell temperature is due to theprogressive increase of the electrolyte concentration due to electrolysis resulting in an increasingionic conductance and hence a decreasing cell voltage and input power (Eq. A.3).
The most complicated term, Pgas, is generally small except when the cell temperature exceeds70°C. The electrolysis reaction
0.5 D2O(l) → 0.5 D2(g) +0.25 O2(g) (A.8)
consumes 0.5 mol of D2O and produces 0.5 mol of D2 gas and 0.25 mol of O2 gas per Faraday, F(96485.3415 C mol-1). The 0.75 moles total of electrolysis gases generated per Faraday alsocarry away D2O vapor due to the equilibrium vapor pressure of D2O in the cell, P= PD2O(g)
.
Using Dalton’s Law of partial pressures, the moles of D2O(g) carried away per Faraday are givenby
moles D2O(g) = 0.75 (P/(PD2+PO
2)) = 0.75 (P/(P* - P)) (A.9)
where the gas pressure within the cell, P*, is expressed by
P* = PD2(g)
+ PO2(g)
+ PD2
O(g) (A.10)
and is close to the atmospheric pressure for this open system. This P* term dictates themonitoring of the atmospheric pressure for highly accurate calorimetric measurements, but thishas not been done by most laboratories. The largest term for Pgas results from the large enthalpyof vaporization of D2O, L=41678.9 J/mol at 101.42°C. Therefore, simpler versions of Eq. A.4are often used such as
Pgas=-(0.75 I/F)(P/(P*-P))[(Cp,D2O(g)– Cp,D2O(l)
)ΔT+L] (A.11)
Assuming I=0.2000A and Tb=22.00°C, the Pgas term is -5.6489 mW at Tcell=40.00°C andincreases to -57.8253 mW at Tcell= 80.00°C. The term involving the enthalpy of vaporization (L)contributes -4.9103 mW and -52.9857 mW, respectively, at these two cell temperatures, (Ref. 2).The electrolysis of D2O in the calorimeter causes the equivalent mass to change with time
M = M° – (1+β) γ It/2F) (A.12)
where I is the constant current, β is the fraction of D2O lost by evaporation, and γ is the currentefficiency for electrolysis. Thus, a more exact expression used in earlier publication byFleischmann and Pons is
Pcalor = Cp d/dt (MΔT) = Cp M(dΔT/dt) + CpΔT(d M/dt) (A.13)
or equivalently
27
Pcalor = Cp [M° – (l+β) γ It/2F](dΔT/dt)-CpΔT(l+β) γ I/2F (A.14)
where ΔT = Tcell-Tb. For constant Tb, dΔT/dt =dTcell/dt. Except for small cells and largecurrents, the simpler Eq. A.2 is adequate.
In chemical kinetics, the differential equations for the rates of the reactions are seldom usedbecause the integrated expressions are much more accurate. The use of numerical integration ofthe calorimetric data also results in greater accuracy. Integrals can be numerically evaluated byusing the mean value of the function, and the integration limits. Mathematically,
xfabdxxfb
a
(A.15)
where a and b are the integration limits and <f(x)> is the mean value of the function. Otherapproximate integration methods can also be used such as Simpson’s Rule or the TrapezoidalRule, but only A.15 is, strictly speaking, correct in that it agrees with the mathematical definitionof an integral. The Trapezoidal Rule, however, allows integration around the discontinuities att=t1 and t=t2. The integrals of power over selected time periods give units of energy (J).
The required heat capacities at constant pressure (Cp), enthalpy of vaporization of D2O (L), thevapor pressure of D2O (P), and the thermoneutral potential (EH) are available fromthermodynamic tables at 25°C (298.15K) and standard pressure. The temperature dependence ofthese calorimetric parameters at standard atmospheric pressure can be calculated from thefollowing equations where T is the Kelvin temperature (°C + 273.15).
1342 18055691091913.12586.0429.1739.85263 TTTTL (in J/mol-1) (A.16)
15.2730002067.05318346.1 TEH (in V) (A.17)
log P TTTT 397.197/14056.90041645.0log9.1093.334347686.35 1
(P in atm) (A.18)
25263, 10765.161007.573109.49513.200
2
TTTClODp (in J mol-K-1) (A.19)
25263, 102907.11066774.2102897.217006.26
2
TTTCgODp
(in J mol-1K-1) (A.20)
25263, 1026544.01014779.41049226.19778.28
2
TTTCgDp
(in J mol-1K-1) (A.21)
28
25263, 102118.110605.6102628.181436.23
2
TTTCgOp
(in J mol-1K-1) (A.22)
At a typical cell temperature of 60°C (333.15 K) and standard pressure, these calculated valuesare L = 43672 J mol-1, EH = 1.5194 V, P = 0.18317 atm, Cp,D2O(l)
= 83.420 J mol-1K-1, Cp,D2O(g)=
34.660 J mol-1K-1, Cp,D2(g)= 29.180 J mol-1K-1, and Cp,O2(g)
= 29.587 J mol-1K-1.
Although the radiative and conductive heat transfer coefficients, kR and kC in Eqs. A.5 and A.6,are independent of the cell temperature, the use of the pseudoradiative heat transfer coefficient(Eq. 2) introduces a slight temperature dependence [2]. From Eq. 2,
4444]/75.0[ bcellRcellbcellCbcellRR TTkFIRTTTkTTkP (A.23)
Solving Eq. A.23 for Rk yields
44//75.0 bcellcellbcellCRR TTFIRTTTkkk (A.24)
As the cell temperature increases, Rk decreases and approaches more closely the value of kR. For
Dewar cells with good vacuums, Rk will be close to kR [1, 2].
Another approach that has been used is to express the conductive heat transport contribution to
Rk by the use of Tcell = Tb+ΔT [1, 4]. Expansion by the binomial theorem yields
432234444464 TTTTTTTTTTTT bbbbbbcell (A.25)
Each term in this expansion becomes smaller as the power of Tb decreases. The first term is thelargest and is similar to a conductive term because it is proportional to ΔT. Therefore, the conductive heat transfer coefficient can also be expressed approximately by
kC = 4 kR φ T 3b (A.26)
where φ is the fraction of the heat transferred by conduction. By assuming φ = 0.05,kR=0.8000 × 10⁻⁹ WK-4, Tb=20°C (293.15), Tcell=60°C (333.15 K), and I = 0.2000 A, then fromEq. A.26, kC= 0.004031 WK-1, and from Eq. A.23, PR= -3.9467 W, PC = -0.1612 W, PW= -0.0043 W, thus 1122.4RP W and Rk = 0.8336 × 10⁻⁹ WK-4. Therefore, for these
assumptions using typical experimental conditions, the contributions of PC and PW to RP are only
3.92% and 0.10%, respectively.
It has been falsely asserted that conductive heat transfer pathways such as through the cell top orvia the wire leads can cause large errors in this Dewar calorimetric cell. However, calculationsusing known thermal conductivities yield less than 1 mW for the rate of heat transfer by the wire
29
leads in this cell [2]. From Eq. A.23, it can be readily shown that the actual radiative power, PR,is given by
RRRbcellRR kkPTTkP /44
(A.27)
Therefore, if only 50% of the heat transfer was by radiation ( RR PP 5.0 ), then RR kk 2 . For
Dewar calorimetric cells with good vacuums, RR kk as calculated by the Stefan – Boltzmann
coefficient, thus the rate of heat transfer by conduction is much smaller than the rate of heattransfer by radiation.

30
APPENDIX II. List of Symbols
Cp = heat capacity at constant pressure, JK-1 mol-1
EH = thermoneutral potential, V
F = Faraday constant, 96485.3415 C mol-1
I = cell current, A
kC = conductive heat transfer coefficient, WK-1
Ck = pseudoconductive heat transfer coefficient, WK-1
kR = radiative heat transfer coefficient, WK-4
Rk = pseudoradiative heat transfer coefficient, WK-4
L = enthalpy of evaporation for D2O, J mol-1
ng = moles of electrolysis gases, mol
M = heavy water equivalent of the calorimetric cell, mol
P = partial pressure of D2O, Pa
P* = atmospheric pressure, Pa
PC = power transferred by conduction, W
Pcalor = rate of enthalpy change within the calorimeter, W
PEI = power input due to electrolysis, W
Pgas = rate of enthalpy transport by the gas stream, W
PH = power input due to the calibration heater, W
PR = power transferred by radiation, W
PW = rate of pressure-volume work by the generated gases, W
PX = excess power generated, W
R = gas constant, 8.314472 JK-1 mol-1
Tb = temperature of water bath, K
Tcell = temperature of cell, K
ΔT = Tcell – Tb, K
f(T) = T 4cell - T 4
b , K4
α = rate of change of Rk , s-1
β = fraction of D2O lost by evaporation, dimensionless
γ = current efficiency for electrolysis, dimensionless
φ = fraction of heat transferred by conduction, dimensionless

31
References
1. M Fleischmann and M.H. Miles, “The Instrument Function of Isoperibolic Calorimeters:Excess Enthalpy Generation Due to Parasitic Reduction of Oxygen” in Condensed MatterNuclear Science: Proceedings of the 10th International Conferences on Cold Fusion,Cambridge, MA, August 24-29, 2003, P.L. Hagelstein and S.R. Chubb, Editors, WorldScientific Publishing Co., Singapore, 2006, pp. 247-268.See also http://lenr-canr.org/acrobat/Fleischmantheinstrum.pdf
2. M.H. Miles and M. Fleischmann, “Accuracy of Isoperibolic Calorimetry Used in a ColdFusion Control Experiment” in Low Energy Nuclear Reactions Sourcebook, ACSSymposium Series 998, 71. J. Marwan and S. Krivit, Editors, ISBN 978-0-8412-6966-8,Oxford University Press, Fall 2008 (in press).
3. T. Roulette, J. Roulette and S. Pons, “Results of ICARUS 9 Experiments Run at IMRAEurope”, in Progress in New Hydrogen Energy, Vol. 1, ICCF-6 Proceedings, Lake Toya,Hokkaido, Japan, October 13-18, 1996, M. Okamoto, Editor, pp. 85-92.See also http://lenr-canr.org/acrobat/RoulettTresultsofi.pdf
4. M.H. Miles, M. Fleischmann and M.A. Imam, “Calorimetric Analysis of a Heavy WaterElectrolysis Experiment Using a Pd-B Alloy Cathodes”, Naval Research LaboratoryReport Number NRL/MR/6320-01-8526, Washington, DC, March 26, 2001, pp. 1-155.
5. G. Lonchampt, L. Bonnetrain and P. Hicter, “Reproduction of Fleischmann and PonsExperiments” in Progress in New Hydrogen Energy, Vol. 1, ICCF-6 Proceedings, LakeToya, Hokkaido, Japan, October 13-18, 1996, M. Okamoto, Editor, pp. 113-120.See also http://lenr-canr.org/acrobat/LonchamptGreproducti.pdf
6. M. Fleischmann, “Simulation of the Electrochemical Cell (ICARUS) Calorimetry”, inThermal and Nuclear Aspects of the Pd/D2O System, Volume 2, SPAWAR SystemsCenter, Technical Report Number 1862, S. Szpak and P.A. Mosier-Boss, Editors,February 2002, pp. 1-180.See also http://lenr-canr.org/acrobat/MosierBossthermalanda.pdf
7. S. Szpak, P.A. Mosier-Boss, M.H. Miles, M.A. Imam and M. Fleischmann, “Analysis ofExperiment MC-21: A Case Study” in Thermal and Nuclear Aspects of the Pd/D2OSystem, Volume 1, SPAWAR Systems Center, Technical Report Number 1862, S. Szpakand P.A. Mosier-Boss, Editors, February 2002, pp. 31-89.See also http://lenr-canr.org/acrobat/MosierBossthermaland.pdf
8. T. Saito, M. Sumi, N. Asami and H. Ikegami, “Studies on Fleischmann-Pons Calorimetrywith ICARUS 1”, in Proceedings of the 5th International Conference on Cold Fusion,ICCF-5, Monte-Carlo, Monaco, April 9-13, 1995, pp. 105-115.

32
9. M.H. Miles, “Electrochemical Calorimetric Studies of Palladium and Palladium Alloys inHeavy Water”, NEDO Final Report, Sapporo, Japan, March 31, 1998.See also http://lenr-canr.org/acrobat/MilesMnedofinalr.pdf
10. S. Szpak, P.A. Mosier-Boss and M.H. Miles, “Calorimetry of the Pd-D Codeposition”,Fusion Technol., 1999, 36, pp. 234-241.
11. S. Szpak, P.A. Mosier-Boss, M.H. Miles and M. Fleischmann, “Thermal Behavior ofPolarized Pd/D Electrodes Prepared by Codeposition”, Thermochemica Acta, 2004, 410,pp. 101-107.See also http://lenr-canr.org/acrobat/SzpakSthermalbeh.pdf
12. M.H. Miles, M.A. Imam and M. Fleischmann, “Case Studies of Two ExperimentsCarried Out with the Icarus Systems” in ICCF-8: Proceedings of the Eighth InternationalConference on Cold Fusion, Lerici (La Spezia), Italy, May 21-26, 2000, F. Scaramuzzi,Editor, Italian Physical Society, Vol. 70, Bologna, Italy, 2001, pp. 105-119.
13. M.H. Miles, “Calorimetric Studies of Palladium Alloy Cathodes Using Fleischmann-PonsDewar Type Cells” in ICCF-8 Proceedings of the Eighth International Conference onCold Fusion, Lerici (La Spezia), Italy, May 21-26, 2000, F. Scaramuzzi, Editor, ItalianPhysical Society, Vol. 70, Bologna, Italy, 2001, pp. 97-104.See also http://lenr-canr.org/acrobat/MilesMcalorimetrb.pdf
14. D.E. Williams et al., “Upper Bounds on Cold Fusion in Electrolytic Cells”, Nature, 1989,342, pp. 375-384.
15. M. Fleischmann, “The experimenters’ Regress”, in Proceedings of the 5th InternationalConference on Cold Fusion, ICCF-5, Monte-Carlo, Monaco, April 9-13, 1995, pp. 152-161.
16. M.E. Melich and W.N. Hansen, “Some Lessons from 3 years of ElectrochemicalCalorimetry”, in Frontiers of Cold Fusion, ICCF-3 Proceedings, Nagoya, Japan, October21-25, 1992, H. Ikegami, Editor, pp. 397-400.See also http://lenr-canr.org/acrobat/MelichMEsomelesson.pdf
17. M.E. Melich and W.N. Hansen, “Back to the Future: The Fleischmann-Pons Effect in1994”, in Proceedings: Fourth International Conference on Cold Fusion Volume 2:Calorimetry and Materials Papers, December 6-9, 1993, Lahaina, Maui, Hawaii, T.O.Passell and M.C.H. McKubre, Co-Chairman, pp. 10.1-10.10.See also http://lenr-canr.org/acrobat/MelichMEbacktothef.pdf
18. D. Worledge, “Some Notes on the AERE Harwell Experiments in Cold Fusion”, pp. 1-15, April 1990.

33
19. M.H. Miles, B.F. Bush and D.E. Stilwell, “Calorimetric Principles and Problems inMeasurements of Excess Power During Pd-D2O Electrolysis”, J. Phys. Chem., 1994, 98,pp. 1948-1952.See also http://lenr-canr.org/acrobat/MilesMcalorimetr.pdf
20. M.H. Miles, B.F. Bush and K.B. Johnson, “Anomalous Effects in Deuterated Systems”,NAWCWPNS TP 8302, China Lake, CA, September 1996, pp. 1-98.See also http://lenr-canr.org/acrobat/MilesManomalousea.pdf
21. M.H. Miles, “Calorimetric Studies of Pd/D2O + LiOD Electrolysis Cells”, J. Electroanal.Chem., 2000, 482, pp. 56-65.See also http://lenr-canr.org/acrobat/MilesMcalorimetrc.pdf
22. M.H. Miles, K.H. Park and D.E. Stilwell, “Electrochemical Calorimetric Evidence forCold Fusion in the Palladium-Deuterium System”, J. Electroanal. Chem., 1990, 296, pp.409-414.
23. M.H. Miles and K.B. Johnson, “Improved, Open-Cell, Heat Conduction, IsoperibolicCalorimetry”, in Progress in New Hydrogen Energy, Vol. 2, ICCF-6 Proceedings, LakeToya, Hokkaido, Japan, October 13-18, 1996, M. Okamoto, Editor, pp. 496-501.
24. B. Daviss, “Reasonable Doubt”, New Scientist, 29 March 2003, pp. 36-43.
25. N.S. Lewis et al., “Searches for Low-Temperature Nuclear Fusion of Deuterium inPalladium”, Nature, 1989, 340, pp. 525-530.
26. N.S. Lewis et al., “Analysis of the Published Calorimetric Evidence for ElectrochemicalFusion of Deuterium in Palladium”, Science, 1989, 246, pp. 793-796.
27. M. Fleischmann, S. Pons, M.W. Anderson, L. Li and M. Hawkins, “Calorimetry of thePalladium-Deuterium-Heavy Water System”, J. Electroanal. Chem., 1990, 287, pp. 293-348.See also http://lenr-canr.org/acrobat/Fleischmancalorimetr.pdf
28. M.H. Miles, R.A. Hollins, B.F. Bush, J.J. Lagowski and R.E. Miles, “Correlation ofExcess Enthalpy and Helium Production During D2O and H2O Electrolysis UsingPalladium Cathodes”, J. Electroanal. Chem., 1993, 346, pp. 99-117.See also http://lenr-canr.org/acrobat/MilesMcorrelatio.pdf
29. V.C. Noninski and C.I. Noninski, Fusion Technology, 1993, 23, pp. 474-480.
30. D. Albagli et al., “Measurements and Analysis of Neutron and Gamma-Ray EmissionRates, Other Fusion Products, and Power in Electrochemical Cells Having Pd Cathodes”,J. Fusion Energy, 1990, 9, pp. 133-148.

34
31. E.F. Mallove, “Why M.I.T. and Cold Fusion?”, Infinite Energy, Issue 24, 1999, pp. 1-55.Also, C. Anderson, “Cold Fusion Tempest at MIT”, Nature, 353, 12 September 1991, p.98.See also http://lenr-canr.org/acrobat/MalloveEmitspecial.pdf
32. M.R. Swartz, “A Method to Improve Algorithms Used to Detect Steady State ExcessEnthalpy”, Trans Fusion Technology, 1994, 26, pp. 369-372.
33. M.R. Swartz, “Some Lessons From Optical Examination of the PPC (M.I.T.) Phase IICalorimetric Curves” in Proceedings: Fourth International Conference on Cold FusionVolume 2: Calorimetry and Materials Papers, December 6-9, 1993, Lahaina, Maui,Hawaii, T.O. Passell and M.C.H. McKubre, Co-Chairmen, pp. 19.1-19.1
34. M. Swartz, “Calorimetric Complications: The Examination of the Phase II Experimentsand Other Select Calorimetric Issues”, in Science and Engineering of Hydrided MetalsSeries, Volume 2, M. Swartz, Editor, JET Technology Press, Wellesley Hills, MA, 1999.
35. J. Rothwell, personal email, June 20, 2008.
36. Cold Fusion Research. A Report of the Energy Research Advisory Board to the UnitedStates Department of Energy, John Huizenga and Norman Ramsey, Co-Chairman,November 1989.