Embed Size (px)
Citation preview

Isolation and Characterization of
Novel Natural Compounds
from
Myxobacteria
Dissertation
zur Erlangung des Grades
des Doktors der Naturwissenschaften
der Naturwissenschaftlich-Technischen Fakultät III
Chemie, Pharmazie, Bio- und Werkstoffwissenschaften
der Universität des Saarlandes
von
Suvd Nadmid
Saarbrücken
2015

II
Tag des Kolloquiums: 06. August 2015
Dekan: Prof. Dr. –Ing. Dirk Bähre
Berichterstatter: Prof. Dr. Rolf Müller
Prof. Dr. Uli Kazmaier
Vorsitz: Prof. Dr. Rolf W. Hartmann
Akad. Mitarbeiter: Dr. Josef Zapp

III
Diese Arbeit entstand unter der Anleitung von Prof. Dr. Rolf Müller in der Fachrichtung 8.2,
Pharmazeutische Biotechnologie der Naturwissenschaftlich-Technischen Fakultät III der
Universität des Saarlandes von Oktober 2010 bis Juni 2015.

IV
Acknowledgements
First of all, I would like to express my sincere gratitude to my supervisor Prof. Dr. Rolf Müller for
giving me the opportunity to work in his group on the fascinating and challenging projects. I thank
him for his encouragement, support and guidance throughout my PhD study.
I owe my special gratitude to Dr. Alberto Plaza for being my mentor, who introduced me to the world
of natural product chemistry by spending his precious time with me in the lab. Without him, all these
challenging tasks would never be completed.
I want to specially thank Prof. Dr. Uli Kazmaier for his support for the DAAD scholarship and for
being my second supervisor.
I also would like to thank Deutscher Akademischer Austausch Dienst (DAAD) for the financial
support during my stay in Germany without which my biggest dream would never come true. I am
grateful to HZI for scholarship for the final part of the study as big support to complete the thesis.
I am particularly grateful to Dr. Kirsten Harmrolfs for her support and helpful discussion regarding
tough chemical synthesis and derivatization reactions as well as her valuable comments on the thesis
and translation of the abstract to german. I would like to express my gracious appreciations to Dr.
Ronald Garcia for providing me the prolific myxobacterial strains, Dr. Thomas Hoffmann, and Eva
Luxenburger for performing MS/MS fragmentation studies, and Dr. Jennifer Herrmann and Viktoria
Schmitt for carrying out the bioactivity evaluation experiments. In addition, I would like to thank Dr.
Nyan Gawas, who was mentoring me in the beginning of my study and guided me well to the
analytical chemistry field.
To Hilda Sucipto and Dr. Louise Kjaerulff, thank you for spending unforgettable time together and
cheering me on besides for their helpful comments and suggestion for writing the thesis.
Last but not least, my deepest thanks go to my husband Batchudur Sukhbaatar and our children
Misheel and Tuguldur for their patience, support and understanding their “busy mummy” who could
not always be there by you for the past few years.

V
Publications
T. Hoffmann, S. Müller, S. Nadmid, R. Garcia, and R. Müller; Microsclerodermins from Terrestrial
Myxobacteria: An Intriguing Biosynthesis Likely Connected to a Sponge Symbiont; Journal of the
American Chemical Society, 2013, 135, 16904-16911.
S. Nadmid, A. Plaza, G. Lauro, R. Garcia, G. Bifulco and R. Müller; Hyalachelins A-C, Unusual
Siderophores Isolated from the Terrestrial Myxobacterium Hyalangium minutum; Organic Letters,
2014, 16, 4130-4133.
S. Nadmid, A. Plaza, R. Garcia, and R. Müller; Cystochromones, Unusual Chromone-Containing
Polyketides from the Myxobacterium Cystobacter sp.; Journal of Natural Products, submitted
Conference Contributions
S. Nadmid, A. Plaza, G. Lauro, R. Garcia, G. Bifulco and R. Müller. “Hyalachelins A-C, a New
Structural Class of Siderophores Isolated from Myxobacterium” 4th HIPS Symposium, Saarbrucken,
Germany, 2013 (poster)
S. Nadmid, A. Plaza, G. Lauro, R. Garcia, G. Bifulco and R. Müller. “Discovery of Novel
Catecholate Type of Siderophores from Myxobacterium” VAAM International Workshop, Dresden,
Germany, 2014 (poster)
VI
Zusammenfassung
Mikrobielle Naturstoffe sind bekanntermaßen eine ergiebige Quelle für neue therapeutische
Wirkstoffe. Aus Myxobakterien werden fortwährend neue biologisch aktive Naturstoffe mit
einzigartigen Strukturen isoliert. Ein chemisches screening dieser Gram-negativen Bakterien
resultierte in der Identifizierung von zwei strukturell neuen Klassen von Sekundärmetaboliten und
einem neuen Derivat eines bereits bekannten Naturstoffes. In der vorliegenden Arbeit werden die
Isolierung, Strukturaufklärung und die biologischen Aktivitäten dieser Substanzen diskutiert.
Die Hyacheline A-C, neue Siderophore vom Catecholat-Typ, wurden aus einem Stamm der wenig
erforschten myxobakteriellen Spezies Hyalangium minutum isoliert. Die dreidimensionale Struktur
der Hyacheline wurde mittels Kombination von spektroskopischen Daten mit quantenmechanischen
Berechnungen aufgeklärt, sowie ihr Eisen-Bindungsverhalten anhand von CAS Assays bestimmt. Die
Cystochromone wurden aus Extrakten von Cystobacter sp. isoliert. Die chromonartigen Polyketide
tragen an Position C-5 des Chromonsystems einen langkettigen aliphatischen Rest. Diese Substitution
ist von natürlichen Chromonen bisher nicht bekannt. Auf Basis von Fütterungsexperimenten konnte
ein Biosyntheseweg für die Cystochromone vorgeschlagen werden.
Weiterhin wurde ein neues Derivat der Mikrosklerodermine aus dem Extrakt eines terrestrischen
Myxobakteriums isoliert. Diese Naturstoffe waren bisher aus Meeresschwämmen bekannt und stellen
ein Beispiel des selten beschriebenen Falles eines gemeinsamen oder ähnlichen
Sekundärmetabolismus von marinen und terrestrischen Mikroorganismen dar.

VII
Abstract
Microbial secondary metabolites are known to be an excellent source for novel therapeutic agents.
Among other microorganisms, myxobacteria are continuously providing new biologically active
natural compounds with unique structures. Here, chemical screening of these gram-negative bacteria
has resulted in the identification of two new structural classes of natural products along with a new
derivative of a sponge-derived natural product. In this thesis, isolation, structural elucidation, and
biological activity of these new secondary metabolites are presented.
New catecholate-type siderophores, hyalachelins A-C, were isolated from the strain belonging to the
underexplored species Hyalangium minutum. Their complete 3D structure was obtained by combining
the spectroscopic data and quantum mechanical calculations. Iron binding activity of hyalachelins was
determined by CAS assay. Moreover, novel polyketides, named cystochromones, were isolated from
Cystobacter sp. Cystochromones bear a chromone ring that is substituted by a long aliphatic chain on
position C-5 which is not preceded among natural chromones. Additionally, a biosynthetic pathway
was proposed on the basis of the results of the feeding experiments.
Furthermore, a new derivative of the marine sponge-derived peptide microsclerodermin was isolated
from the terrestrial myxobacterium. This result represents the rare example of isolation of same
compounds from terrestrial and marine sources.

VIII
Table of Contents
Acknowledgements ........................................................................................... IV
Publications ........................................................................................................ V
Conference Contributions................................................................................. V
Zusammenfassung ............................................................................................ VI
Abstract ........................................................................................................... VII
1. Introduction 1
1.1. Natural Products as Source for New Drugs ............................................................... 1
1.2. Myxobacteria Produce Diverse Bioactive Natural Products ...................................... 3
1.2.1. Myxobacterial Natural Products ........................................................................................4
1.2.2. Siderophores ......................................................................................................................8
1.3. Isolation Procedure and Structure Elucidation of Natural Products .......................... 9
1.3.1. Screening and Dereplication of Microbial Extract ............................................................9
1.3.2. Isolation and Structure Elucidation of Novel Metabolites ...............................................11
1.3.3. Assignment of Stereochemical Configuration .................................................................14
1.4. Outline of the Work ................................................................................................. 19
1.5. References ................................................................................................................ 21
Chapter 2 25
2. Microsclerodermins 26
2.1. Abstract .................................................................................................................... 26
2.2. Introduction .............................................................................................................. 26
2.3. Experimental Section ............................................................................................... 29
2.3.1. Bacterial Strains and Culture Conditions ........................................................................29
2.3.2. Disruption of the mscH Locus in Soce38 ........................................................................29
2.3.3. Isolation of Microsclerodermin M from So ce38 ............................................................29
2.3.4. Isolation of Microsclerodermins from MSr9139 .............................................................30
2.3.5. LC-MS data acquisition ...................................................................................................30
2.3.6. 16S rRNA Gene and Phylogenetic Analysis ...................................................................31
2.3.7. Genome Data ...................................................................................................................31
2.4. Results and Discussion............................................................................................. 31
2.4.1. Production of Microsclerodermins by Terrestrial Myxobacteria ....................................31
2.4.2. Microsclerodermin Biosynthetic Machinery ...................................................................35
2.4.3. Genetic Basis for the Structural Diversity of Microsclerodermins ..................................38
2.5. Conclusion ............................................................................................................... 39

IX
2.6. References ................................................................................................................ 40
Chapter 3 47
3. Hyalachelins 48
3.1. Abstract .................................................................................................................... 48
3.2. Main Text ................................................................................................................. 48
3.3. References ................................................................................................................ 55
3.4. Supporting Informations .......................................................................................... 57
3.4.1. General Experimental Procedures................................................................................... 57
3.4.2. Isolation and Cultivation of Strain .................................................................................. 57
3.4.3. Isolation of Hyalachelins ................................................................................................ 57
3.4.4. CAS Assay ...................................................................................................................... 58
3.4.5. Computational Details .................................................................................................... 64
3.5. References of Supporting Information .................................................................... 70
Chapter 4 71
4. Cystochromones 72
4.1. Abstract .................................................................................................................... 72
4.2. Main Text ................................................................................................................. 72
4.3. Results and Discussion ............................................................................................ 72
4.3.1. Biosynthesis of Cystochromones .................................................................................... 77
4.4. Experimental Section ............................................................................................... 79
4.4.1. General Experimental Procedure .................................................................................... 79
4.4.2. Strain Isolation and Identification ................................................................................... 79
4.4.3. Strain Cultivation ............................................................................................................ 79
4.4.4. Extraction and Isolation .................................................................................................. 80
4.4.5. Stable Isotope Feeding .................................................................................................... 81
4.4.6. Methylation and Preparation of (R) and (S)-MTPA esters of 4. ..................................... 81
4.4.7. Assigment of Absolute Configuration of Rhamnose. ..................................................... 82
4.5. References ................................................................................................................ 82
4.6. Supporting Informations .......................................................................................... 84
5. Discussions 93
5.1. General Scope of the Work ...................................................................................... 93
5.2. Microsclerodermins – Marine Natural Products Rediscovered from Terrestrial
Myxobacteria ........................................................................................................... 93
5.3. Unusual Catecholate type Siderophores – Hyalachelins ......................................... 96
5.4. Cystochromones - Structures and Insights into the Biosynthesis ............................ 99

X
Summary 106
5.5. References .............................................................................................................. 106
Author’s Contribution in the Work Presented in this Thesis 109
6. Appendix 110
6.1. Microsclerodermins ............................................................................................... 110
6.2. Hyalachelins ........................................................................................................... 114
6.3. Cystochromones ..................................................................................................... 125
Introduction
1
1. Introduction
1.1. Natural Products as Source for New Drugs
The chemical substances isolated from natural sources such as plants, animals and microorganisms,
have been playing important roles in treating and preventing various human diseases due to their
broad range of biological activities. Besides showing great chemical structural diversity, these organic
molecules, called natural products (NPs), are considered as templates for synthetic modification for
drug development.[1]
[2]
In the past 30 years (1981-2010), 1355 new drugs have been approved around
the world by the U.S. Food and Drug Administration (FDA) and similar organizations.[3]
26.8% of
these new drugs were derived from either natural products or their semisynthetic compounds whereas
24% of the new drugs were made by total synthesis based on pharmacophores of natural compounds.
During this time, the majority of clinically launched new antibacterial (66%) and anticancer (61%)
drugs were inspired by NPs.[3]
These statistics already imply how significant natural products are in
drug discovery and development.
Among natural products, microorganisms have been considered a prolific source of bioactive
molecules. Since the discovery of penicillin in 1928 a number of bacteria and fungi have been
screened for new antibiotics.[4]
This effort has successfully brought many antibiotics, which are still in
use or natural scaffold of those are semisynthetically tailored into more active generations (e.g.
erythromycin clarithromycin telithromycin)[5]
[6]
(Figure 1.1). Among microorganisms, the order
Actinomycetales is known to produce a large number of bioactive secondary metabolites that have
significant applications in human medicine. By 2001 roughly 3000 antibiotics have been identified
from this order, more precisely 90% of those were from genus Streptomyces.[7]
However the resistance of pathogenic bacteria to existing drugs has become one of the main problems
in hospitals. Various infectious diseases specifically caused by nosocomial pathogens abbreviated
ESKAPE (Enterococcus faecium, Staphylococcus aureus, Klebsiella pneumonia, Acinetobacter
baumanii, Pseudomonas aeruginosa, and Enterobacter species) are the majority of hospital infections
in the USA. Methicillin-resistant S. aureus (MRSA) alone is the reason of more deaths than those
caused by HIV/AIDS and tuberculosis combined.[8]
Although many antibiotics were approved
between 1960s and 2000, they were synthetic derivatives of existing molecules. Most of the core
scaffolds of currently used antibiotics were introduced between 1930s and 1960s, and the ESKAPE
pathogens are already resistant to most of them.[9]

Introduction
2
Figure 1.1 (a) Selected examples of natural products derived from microorganisms representing important
antibiotics in the clinic. Name, activity, native producer are indicated below the structures. (b)
Example of synthetic tailoring of natural scaffold leads to active generation of antibiotic
Therefore, there is a huge demand for new antibiotics that possess either new mode of action or novel
chemical scaffold. Although terrestrial and marine microorganisms continue to provide a rich
reservoir for such compounds, there is a high chance to re-isolate an already known compound. In
order to minimize the rediscovery rate, different approaches are in use to discover new molecules that
can fulfill the requirement for therapeutic agents, e.g. retrieving strains from underexplored
Introduction
3
environments, screening new microbial taxa and genome-mining.[10]
In this regard, within the last few
years the study of marine organisms has yielded more than 22000 novel natural products bearing
diverse chemical structures and biological activity.[11]
It has been estimated that more than 99% of all
bacteria on earth are unculturable under standard laboratory conditions and many of them could
produce valuable natural products that may serve as lead structures for drug development.[12]
Therefore it is believed that further attempts on drug discovery from nature remains promising. This
presumption has been supported by the recent development of a new method using a multichannel
device iChip which enabled the growth of uncultureable soil bacteria in their natural environment.
Screening of the new isolates led to a new antibiotic teixobactin (Figure 1.1) and surprisingly no
resistance has been detected so far against this new antibacterial peptide.[13]
Moreover, chemical
studies of microbial genera and/or strains isolated from unusual ecological niches, and underexplored
species appear to be an attractive source of new chemical scaffolds. Besides actinomycetes,
myxobacteria attract attention due to their potential to produce natural products with wide range of
biological activities.
1.2. Myxobacteria Produce Diverse Bioactive Natural Products
Myxobacteria are found in soil, dung, tree bark, decaying plants, and a small number of isolates were
found from marine environment.[14]
[15]
This gram-negative bacteria, which belong to the delta
subgroup of proteobacteria, are intriguing subjects for both academic and commercial drug discovery
programs, due to their many unique characteristics.[16]
[17]
In general myxobacteria show a complex
life cycle. Vegetative cells spread on the surface by gliding as swarm colony. When nutrients are
scarce, cells aggregate and form multicellular fruiting bodies, showing various morphology which are
used for taxonomic classification (Figure 1.2).
Within the fruiting body, cells alter their form into rod shaped vegetative cells and create myxospores
enclosed in slimy cell wall. This life form ensures the colony to survive under extreme environmental
conditions like starvation, heat and desiccation.[18]
Another noticeable behavior is that myxobacteria are able to consume biological macromolecules
(e.g. cellulose), as well as other microorganisms like fungi and bacteria, as mini-predators.[19]
The
swarm on the solid surface allows the accumulation of extracellular enzymes so that such macro food
sources can be decomposed and consumed.[14]

Introduction
4
Figure 1.2 Stereo photomicrograph of (a) Hyalangium minutum fruiting bodies (b) H. minutum swarming and
rippling growth pattern (c) swarm colony of Jahnella sp. and (d) Fruiting bodies of Cystobacter sp.
(Pictures by Dr. R. Garcia, HIPS)
1.2.1. Myxobacterial Natural Products
The most remarkable benefit of myxobacteria is their ability to produce diverse bioactive secondary
metabolites, which covers 5% of total known microbial natural products.[20]
At least 100 core
structures and 600 derivatives were characterized from 7500 myxobacterial strains.[14] [15]
In terms of
structures, myxobacterial metabolites vary from modified polyketides, alkaloids, terpenoids, phenyl-
pronapoids and peptides showing a number of structural variants on each basic chemical scaffold.[21]
Antifungal/yeast activity is commonly observed with myxobacterial metabolites (~54%) and this
activity arises frequently from inhibition of electron flow within the mitochondrial respiratory
chain.[20]
Even this is a common mode-of-action among myxobacterial compounds; it is rarely
reported for natural products from other microorganism.[22]
Furthermore, approximately 30% of
myxobacterial compounds show antibacterial activity with different mechanisms such as inhibiting
the protein synthesis and RNA polymerase etc.[20]
[23]
Cytotoxicity towards mammalian cells is one of
the promising bioactivity exhibited by myxobacterial natural substances. This bioactivity arises
mainly from acting at tubulin and with actin.[23]
Besides the secondary metabolites that are active against other pathogenic organisms, myxobacteria
also produce compounds which are necessary for their own survival. For instance, DKxanthenes, a
family of yellow pigments, are required for the formation of fruiting body[24]
which is an essential
structure for the survival under extreme condition.

Introduction
5
Myxobacterial secondary metabolites representing diverse chemical structures are assembled by
multistep biosynthetic processes catalyzed by special enzymes such as polyketide synthases (PKSs),
non-ribosomal peptide synthetases (NRPSs) or hybrid thereof. These mega-enzymes are organized as
several modules showing independent multi-functions which incorporate one carboxylic acid (for
PKSs) or one amino acid (for NRPSs) to the growing polyketide or peptide chain.[25]
Notably, the
hybrid PKS-NRPS system is known to be responsible for the production of majority of myxobacterial
natural products, whereas secondary metabolites isolated from actinomycetes are pure PKS and NRPS
products.[16]
Polyketides – myxobacterial polyketides are classified into many structural classes such as
macrocyclic lactones, polyethers, polyenes and aromatics.[25]
These structurally complex organic
molecules are often found from myxobacterial extracts and show diverse biological activity. For
instance, potent antifungal stigmatellins were isolated from Stigmatella aurantiaca and they are
characterized by containing a bicyclic chromone ring substituted by apolar branched side chain.[26]
The antimicrobial activity arises from inhibition of electron flow in mitochondrial respiratory chain by
targeting NADH dehydrogenase (complex I).[27]
Isoprenoid quinoline alkaloid aurachin is a type II
PKS polyketide biosynthesized by S. aurantiaca as well and it shows various bioactivities such as
antibacterial, antifungal and anti-plasmodial properties.[28]
[29]
The myxobacterial genus Chondromyces is well known as prolific producer of structurally unique
groups of metabolites under laboratory conditions. Among them the antibacterial polyketides
chondrochlorens[30]
and NRPS/PKS hybrid antifungal crocacins[31]
have been isolated. (Figure 1.3)
Figure 1.3 Selected polyketides isolated from myxobacteria
Macrolides – many antibacterial macrolides presenting structural diversity have been isolated from
myxobacteria. A successful example of a myxobacterial macrolides approved by the FDA is

Introduction
6
epothilone. Epothilone was isolated from Sorangium cellulosum by activity guided fractionation and
the pure compound showed broad activity against eukaryotic cells.[32]
A semi-synthetic amide
derivative of epothilone B Ixempra® (ixabepilone) is in clinical use for the treatment of advanced
breast cancer.[33]
Moreover, the boron-containing macrodiolide tartrolons are active against Gram positive bacteria as
well as mammalian cells.[34]
[35]
A macrolide glycoside disciformycins were isolated by activity guided
isolation approach using Gram positive indicator bacteria.[36]
They exhibit antibacterial activity
against methicillin- and vancomycin-resistant S. aureus (MRSA/VRSA) in the range of vancomycin.
Remarkably, no cross-resistant was detected to vancomycin and no cytotoxicity was observed against
mammalian cell, suggesting these compounds could be a lead molecule for antibiotic development.
(Figure 1.4)
Figure 1.4 Selected macrolides isolated from myxobacteria
Peptides – even as mentioned earlier the polyketide-peptide mixed structure is the majority of
myxobacterial natural products, a number of pure NRPS derived molecules were discovered from
myxobacteria. The NRPs often are depsipeptides bearing unusual structural features such as hydroxy-
and β-amino acids as well as homoproline etc.[25]
As the representative of recent discovery of such
molecule, the cyclic depsipeptide crocapeptins were isolated from Chondromyces crocatus.[37]
(Figure
1.5) They belong to cyanopeptolins which is characterized by the presence of an unique structural unit
amino-hydroxy-piperidone (Ahp)-heterocycle. This residue is known to be crucial for the protease
inhibition activity[38]
and crocapeptins exhibited the serine protease inhibition activity with low IC50
value, as predicted. Another cyclic depsipeptide aetheramides were isolated from novel myxobacterial
strain Aetherobacter fulvus.[39]
They show anti-HIV activity in low nM range and characterized by
bearing the unusual fatty acid as well as modified amino acid residues.
More recently, NRPS derived potent antibiotics cystobactamides were discovered from Cystobacter
sp. It shows broad-spectrum antibacterial activity against Gram-positive and more importantly Gram-

Introduction
7
negative bacteria such as E. coli and A. baumannii. Cystobactamides are characterized by possessing
para-aminobenzoic acid (PABA) chain which is unique for natural products. Hence, due to the novel
scaffold and limited cross-resistance, cystobactamides can serve as lead structure for novel class of
antibiotic development with wide range of bioactivity.[40]
The NRPS-PKS hybrid systems often yield structurally diverse molecules. Interestingly, few
myxobacterial metabolites contain structural elements known from other biological source such as
streptomycetes, cyanobacteria and sponges. Among them, chondramides are NRPS-PKS hybrid
depsipeptides comprised of three amino acids (alanine, N-methyltryptophan and an unusual amino
acid, either β-tyrosine or α-methoxy-β-tyrosine) and a polyketide chain (E-7-hydroxy-2,4,6-
trimethyloct-4-enoic acid). The chondramides have been isolated from the terrestrial myxobacterial
strain Chondromyces crocatus,[41]
while their analogues, the jaspamides, were discovered from a
marine sponge Jaspis johnstoni.[42]
Both families of compounds inhibit growth of yeast and the
chondramides exhibit high cytostatic activity against mammalian cells. (Figure 1.5)
Figure 1.5 Examples of nonribosomal peptides and NRPS/PKS hydrid secondary metabolites from
myxobacteria
Above mentioned metabolites are only few examples representing structural diversity of natural
compounds isolated from myxobacteria. Since new compounds are continuously being discovered and
characterized (60 new compounds in three years), the myxobacterial collection at HZI/HIPS

Introduction
8
(Braunschweig and Saarbruecken) covering 8200 different strains is being partially chemically
screened (1700 strains) in order to exploit the biosynthetic capacity of this intriguing microorganism
by finding new anti-infectives.[43]
Furthermore, investigation of novel strains and genera belonging to
unexplored bacterial groups is believed to provide new interesting chemistry, the screening program
at HZI/HIPS includes extensively new myxobacterial isolates.
1.2.2. Siderophores
Iron is an essential element for many important biological processes of living organisms. Even though
it is considered as the fourth most abundant metal on earth, its availability is often limited for
microorganisms. Under physiological pH conditions, soluble Fe(II) readily oxidizes to insoluble
Fe(III). In order to overcome environmental scarcity of Fe(II), bacteria, fungi and plants produce and
secrete iron scavenging molecules, called siderophores.[44]
Siderophores are metal transporting agents
which facilitate uptake, transport, and solubility of iron with high affinity. Their biosynthesis is
triggered by low abundance of soluble iron in the environment.[45]
Once the excreted siderophore is
bound to a metal ion, the siderophore-iron complex is actively transported into the cell by membrane-
associated ATP-dependent transport systems in bacteria. Subsequently, the iron is released by
reduction and the free siderophore is again excreted from the cell.[46]
[47]
Siderophores are classified due to their functional groups, e.g. hydroxamate, catecholate or α-
hydroxycarboxylate which carry charged oxygen atoms as donor for iron-siderophore complex
formation.[46]
Over hundred structurally diverse microbial siderophores have been reported, including
chatecholate-type myxochelins[48]
and citrate-hydroxamate-type nannochelins[49]
isolated from
myxobacteria to date. Siderophores and their derivatives have potential medical applications.
Deferoxamine is produced by Streptomyces pilosus in large scale[50]
and its methane sulfonate salt
(Desferal, Novartis) is used in the treatment of iron overload disease such as haemochromatosis. It
binds Fe(III) ions and forms a water soluble complex which is readily excreted from the body through
the kidneys.[51]
In the same mechanism, it is used in the treatment of aluminium toxicity.[52]
The linear
trishydroxamate deferoxamine also shows potent antimalarial activity against Plasmodium falciparum
both in vitro and in vivo.[53]
[54]
Having metal chelating activity, siderophores play a major role as virulence factors of pathogenic
bacteria[55]
e.g. the human pathogen Yersinia pestis completely lose their virulence in the absence of
yersiniabactin.[56]
Another potential application of siderophores is “Trojan horse” strategy that brings
the antibiotic in to the resistant cell as siderophore-iron-drug complex. This concept exploits the
bacterial iron-siderophore uptake system as a cellular entry gateway and it is effective against the low
permeability of the outer membranes of resistance strains.[57]
The advantages of Trojan horse
mechanism have led to the discovery of new siderophore-antibiotic conjugates, termed sideromycins,
Introduction
9
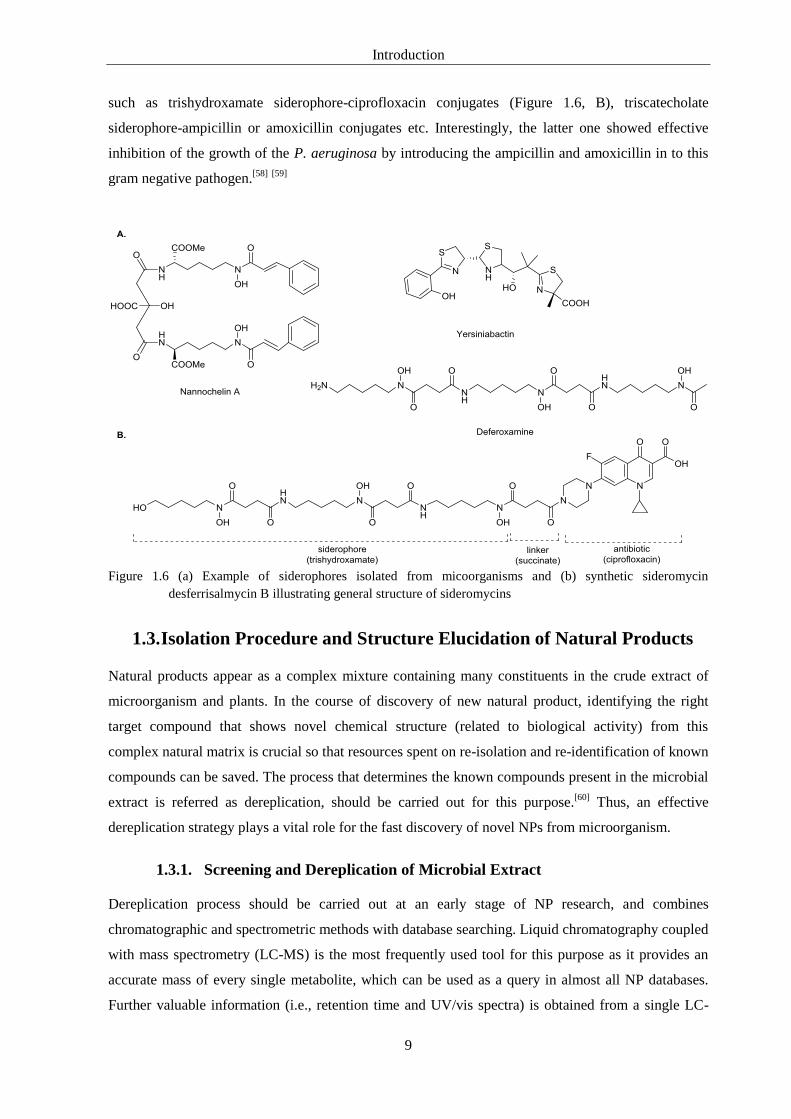
such as trishydroxamate siderophore-ciprofloxacin conjugates (Figure 1.6, B), triscatecholate
siderophore-ampicillin or amoxicillin conjugates etc. Interestingly, the latter one showed effective
inhibition of the growth of the P. aeruginosa by introducing the ampicillin and amoxicillin in to this
gram negative pathogen.[58]
[59]
Figure 1.6 (a) Example of siderophores isolated from micoorganisms and (b) synthetic sideromycin
desferrisalmycin B illustrating general structure of sideromycins
1.3. Isolation Procedure and Structure Elucidation of Natural Products
Natural products appear as a complex mixture containing many constituents in the crude extract of
microorganism and plants. In the course of discovery of new natural product, identifying the right
target compound that shows novel chemical structure (related to biological activity) from this
complex natural matrix is crucial so that resources spent on re-isolation and re-identification of known
compounds can be saved. The process that determines the known compounds present in the microbial
extract is referred as dereplication, should be carried out for this purpose.[60]
Thus, an effective
dereplication strategy plays a vital role for the fast discovery of novel NPs from microorganism.
1.3.1. Screening and Dereplication of Microbial Extract
Dereplication process should be carried out at an early stage of NP research, and combines
chromatographic and spectrometric methods with database searching. Liquid chromatography coupled
with mass spectrometry (LC-MS) is the most frequently used tool for this purpose as it provides an
accurate mass of every single metabolite, which can be used as a query in almost all NP databases.
Further valuable information (i.e., retention time and UV/vis spectra) is obtained from a single LC-

Introduction
10
MS run. Based on these information, the known metabolites can be identified by comparing with
database. Soft ionization techniques such as electrospray ionization (ESI+/ESI
-) and atmospheric
pressure chemical ionization (APCI) provide gentle and versatile compound ionization, as e.g. ESI+
was shown to detect 93% of natural products existing in microbial crude extract.[61]
Positive and
negative ionization techniques generate multiple ion adducts and simple fragments so that high
resolution MS data permits unambiguous assignment of molecular weight.
LC-MS based dereplication is successfully combined with bioassay-guided isolation process to
determine the active component(s) in the extract.[62]
This can be conveniently achieved by performing
micro-scale UHPLC-DAD-MS fractionation (usually in micro well plates) which is subsequently
subjected to in vitro bioassays against certain test organisms that were initially identified by screening
of the crude extract. On the basis of the activity result (Figure 1.7), the peak corresponding to the
active area can be determined from the HPLC metabolite profile, and its spectroscopic features
(UV/vis, HR-MS and retention time if applicable) should be considered to identify whether it is a
known or an unreported molecule. At this stage, a good database is essential. In case of more than one
hit is found from database searching, tandem MS/MS fragmentation offers a powerful solution for
Figure 1.7 LC-MS fractionation of active fraction coupled to bioassay
obtaining structural information.[63]
Besides the commercially available database Dictionary of
Natural Products (The Chapman & Hall), an in-house database “Myxobase” is being developed and
employed for the research of myxobacterial natural products.[64]
This comprehensive database
provides information regarding the producer strains (>9000 strains) and secondary metabolome
dataset (ca. 2500 compounds). It contributes greatly for the dereplication of myxobacterial extracts by
covering the high resolution LC-MS data linked with bioactivity and producer strains.
0
2
4
6
A00
1
A00
4
A00
7
A01
0
B0
01
B0
04
B0
07
B0
10
C00
1
C00
4
C00
7
C01
0
D0
01
D0
04
D0
07
D0
10
E00
1
E00
4
E00
7
E01
0
F00
1
F00
4
F00
7
F01
0
G0
01
G0
04
G0
07
G0
10
H00
1
H00
4
H00
7
H01
0
OD
60
0
0 5 10 15 20 25 30 35 40 45 Time [min]
0.0
0.2
0.4
0.6
0.8
5x10
Intens.
[mAU]
SR007MB-1-S22.D: UV Chromatogram, 190-600 nm
HPLC-UV chromatogram of active fraction
Bioactivity result of fraction on 96 well plate

Introduction
11
Another useful hyphenated technique used in the dereplication process is LC-MS coupled with solid-
phase extraction (SPE) and NMR (LC-MS/SPE-NMR, Figure 1.8). The advantage of this combination
is time saving by using small scale bacterial crude extract, and no initial purification is needed for the
evaluation of a target compound.[65]
Analytical HPLC separation with DAD and MS monitoring is
used to track the peak of interest that has been previously identified by HPLC-bioassay-fractionation.
A candidate peak is adsorbed on SPE cartridge and this step can be repeated multiple times in order to
obtain sufficient amount of sample for NMR measurements. When the HPLC solvent is removed from
the cartridge by nitrogen flow, the deuterated solvent is used to transfer the adsorbed compound via
flow-probe to the NMR spectrometer. Nevertheless water and organic solvents used for HPLC cannot
be removed completely, multi solvent suppression pulse programs provide reasonable NMR spectra.
A NMR spectrometer equipped with a cryogenically cooled probe allows the acquisition of decent
NMR spectra from few µg samples.[66]
Figure 1.8 Scheme of multiple hyphenation LC-MS/SPE-NMR, reproduced from ref 67
Even though only partial (but sometimes complete) structural information is obtained from LC-
MS/SPE-NMR, it facilitates the rapid identification of the desired target whether it exhibits structural
novelty. Thus, the information obtained from LC-MS/SPE-NMR can play a central role for making
decision on further upscaling and purification processes of compounds under examination.[68]
1.3.2. Isolation and Structure Elucidation of Novel Metabolites
Most myxobacterial secondary metabolites are extracted by adsorbing them onto resin polymer, e.g.
XAD-16 which is known to capture the greatest amount of semi-polar metabolites from fermentation
broth. This facilitates the isolation and structure elucidation of secondary metabolites produced in
trace amount. Moreover, the production of antibiotics that acts against gram-negative bacteria can
cause growth inhibition of the producer strain. To avoid this self-inhibition, sterilized XAD-16 resin is
added in to the growing culture.[20]
post-column
dilution
deuterated
solvent
N2 in N2 out
HPLC column
injection
system HPLC pump
and gradient
mixing
H2O
sample in
(mixture)
CH3CN
Mass
spectrometer
PDA
detector
Sample
Out
H2O
NMR
spectrometer
HPLC
eluent
waste SPE

Introduction
12
A microbial crude extract is a reservoir of many different compounds so that it is difficult to apply a
single separation step to isolate an individual compound. An efficient enrichment procedure of the
target molecule facilitates the elimination of byproducts. It includes liquid-liquid partition, column
chromatography on various stationary phase e.g. normal phase silica gel and Sephadex LH-20 etc.
The final isolation process is designed on the basis of physical and chemical properties of compound
of interest. Preparative and semi-preparative HPLCs are employed greatly. They are usually coupled
with mass spectrometric (MS) detectors besides common UV/vis detectors, and equipped with
automatic fraction collectors. This hyphenation facilitates the isolation of the target compound in
highest level of purity.
NMR spectroscopy is a very powerful tool for structure elucidation of natural products. The
experiments rely on the quantum mechanical property of a nucleus – the spin. The nuclei such as 1H,
13C,
15N and
19F have two different spin states (energy low and high states) since they have a half spin
numbers. During the irradiation of the electromagnetic wave through the sample, the nuclei flip from
one state to another by absorbing or emitting the energy difference in the form of electromagnetic
radiation. The frequency of the irradiation must match the energy difference between two spin states
and the irradiation is applied as radio frequency (rf) pulses. After one or several rf pulses, a NMR
signal can be observed. It consists of rf waves with frequencies that match the energy difference
between two spin states of the individual nuclei involved. The different types of nuclei apply widely
different resonance frequencies. Protons resonate at a four times higher frequency than 13
C, and ten
times higher than 15
N nuclei. Therefore the nuclei are represented by characteristic resonance
frequencies in an NMR spectrum.[69]
Due to the interaction between a nuclei and surrounding electrons, the local magnetic field is affected
and thus resonance frequency of the nuclei is influenced. Therefore, a NMR spectrum exhibits the
signals corresponding to different classes of protons or carbons etc.[69]
Moreover, the magnetic
moments of individual nuclei interact with the magnetic fields created by the spins of nearby nuclei.
This spin-spin interaction is used to correlate different nuclei in the molecule with one another. Two
types of interactions can be observed, either through bond or through space. Through bond interaction
occurs via polarization of bonding electrons and known as J coupling, while through space correlation
is the basis for the nuclear Overhauser effect (NOE). The latter permits distance measurement
between protons and thus provides geometric information.[70]
In the case of complex organic molecules, 1D NMR data are obtained as complicated spectrum
containing overlapped signals. An array of two dimensional pulse sequences has been created
providing both increased resolution and correlations that are easy to analyze. A resonance in the 2D-
NMR spectrum represents a pair of nuclei that interact with each other either scalar or through bond.

Introduction
13
All 2D NMR experiments have the same scheme that consists of four phases: excitation-evolution-
mixing-detection. During the excitation period, the spins are prepared, and consequently the chemical
shifts of the individual nuclei are detected during the evolution period, t1. Furthermore, the mixing
period allows the correlation of spins with each other and chemical shift of one nucleus ends up on an
another nucleus of which the frequency is measured during the detection period, t2.
The skeletal structures of natural products can be deduced by number of 2D NMR experiments. 1H-
1H
homonuclear correlation spectrum combined with one-bond 13
C-1H correlation spectrum allow
determining the fragments. Furthermore, the long-range 13
C-1H correlation links those fragments to
build the planar structure of the molecule under study.
The homonuclear 2D 1H-
1H COSY (correlation spectroscopy) experiment is used to identify the
protons which are directly coupled to each other.[71]
The basic COSY-90 is the most widely used
experiment while its minor variant COSY-45 sequence is acquired in order to distinguish geminal and
vicinal proton pairs with less sensitivity than the previous one.[72]
A useful supplement to the COSY is
TOCSY (total correlation spectroscopy) sequence that exhibits the sequence of coupled protons by
transferring the magnetization subsequently from one proton to the next within a same spin system.[73]
The extent of magnetization transfer depends on duration of the mixing time which is generally 60-
100 ms. The alternate version of 2D TOCSY is selective 1D TOCSY, using shaped pulses to excite
individual peaks.[74]
This is a particularly helpful method in the case of the compound possessing
polysaccharide units, since the subspectrum for each monosaccharide unit can be obtained including
all individual protons. Furthermore, hybrid 2D HSQC-TOCSY experiment is useful in the case of
extreme signal overloading in 1H-NMR spectra. This relies on the better resolution of the
13C signals,
due to a broader chemical shift-range, to overcome the overlapping.[75]
In the early date, heteronuclear one bond 1H-
13C correlation spectra were acquired by
13C detection,
using HETCOR sequence.[76]
Its more sensitive analogue sequences HMQC (heteronuclear multiple
quantum coherence) and HSQC (heteronuclear single quantum coherence) were developed. The
advantage of these new sequences is the fact that they apply the detection of proton directly bonded to
13C (inverse detection), and hence are more sensitive than the previous detection method. The
gradient-selected HSQC sequence exhibits edited spectrum showing CH and CH3 as negative, and
CH2 as positive signals. The significant advantage of this method is the elimination of additional
DEPT-135 experiment.[77]
2D HMBC (heteronuclear multiple bond correlation) determines long range 1H-
13C connectivity
separated by 2-3 bonds[78]
and it provides essential information for structure elucidation since it allows
the linkage of the small structural fragments into the entire structure. This experiment is especially
useful for the detection of quaternary carbons which are not observed in other 2D experiments.

Introduction
14
Furthermore, 1H-
15N HMBC provides powerful information for alkaloids and compounds with high
amount of nitrogen content, although it is roughly five times less sensitive than the 1H-
13C HMBC.
[79]
Figure 1.9 Illustration of 2D NMR correlations shown on the partial structure of hyalachelin
The major challenge for NMR spectroscopy of microbial natural products is the insufficient amount
of available compound combined with the relative insensitivity of the technique. Numerous
developments have been made for NMR instruments including cryogenically cooled probes and
narrow probes that facilitate the performance of various insensitive 2D NMR experiments with good
resolution in reasonable time with remarkably lowered amounts of sample – few micrograms.[80]
By
cooling the NMR probe-head with liquid helium (cryogenic probe) to 20-30 K, the signal to noise
ratio (S/N) is enhanced by up to a factor of four. The acquisition time is also reduced by a factor of
sixteen and enhance the signal output of the NMR instrument.[66]
1.3.3. Assignment of Stereochemical Configuration
The stereochemical configuration often determines important properties in the chemical, physical,
biological and pharmaceutical aspects of the compound. Thus, obtaining an enantiomerically pure
compound is a prerequisite for chemists which encouraged the development of various methods for
the assignment of relative and absolute configuration of newly discovered natural molecule.
Relative configuration – The NOESY (nuclear overhauser effect spectroscopy) experiment is used
very often to determine the relative configuration by observing the NOEs between protons up to 5 Å
apart through space. However, the intensity of the NOE correlation is influenced by molecular weight
and mixing time.[81]
Since compounds of over 750 Da produce weak or negative signals, the ROESY
(rotating-frame overhauser effect spectroscopy) experiment is used instead to overcome this
problem.[82]
In selective 1D NOE difference experiments, a proton resonance is selectively irradiated.
The resulting spectra are cleaner and free of the artifacts those are observed in 2D NOE experiment,
and therefore the few NOE peaks are detected.[72]
[83]
NOESY and ROESY data are utilized e.g. for

Introduction
15
the establishment of geometrical configuration of double bonds (Figure 1.10, A) and cyclic
substructures (Figure 1.10, B).
Figure 1.10 NOESY/ROESY correlation for the (a) E and Z geometry of a double bond and (b) a substituted
heterocycle
Additional NMR methods for the relative configuration assignment are based on hetero- and
homonuclear coupling constants (nJC,H and
3JH,H). Karplus has described that the dihedral-angle of two
protons is dependent on the vicinal proton coupling constants 3JH,H.
[84] On the basis of this theory,
Murata’s J-based configurational analysis method has been developed and is well suited for the (1,2)
or (1,3) stereogenic system on acyclic chain.[85]
As an example, in a 1,2-diol system, the value of 3JH,H
alone is inadequate because two H/H-gauche rotamers cannot be distinguished (Figure 1.11, A).
Additional information given from 3JC,H can be used for configurational analysis in this case (Figure
1.11, C). Therefore, when an oxygen functionality on a carbon atom is gauche to its geminal proton
2JC,H is large, and when it is anti, the value becomes small (Figure 1.11, B).
[85] A similar strategy
combining ROESY data can be applied for relative configuration assignment of 1,3 and 1,4 methine
systems.[85]
Figure 1.11 Dihedral angle dependence on hetero- and homonuclear coupling constants. (a) vicinal 3JH,H (b)
germinal 2JC,H and (c) vicinal
3JC,H (adapted from ref. 85)
The 3JH,H can be extracted from a 1D
1H NMR and more precisely from various 2D COSY type of
experiments,[86]
[87]
while 2,3
JC,H are accurately measured from J-resolved HMBC,[88]
2D hetero half-
filtered TOCSY (HETLOC)[89]
and many other modified pulse sequences[90]
. Even though the
HETLOC is one of the most sensitive experiments and most easily interpreted, it is limited to spin
systems with contiguous TOCSY coherence transfer. For a structure with stereocenters at a quaternary
carbon or small 1H-
1H couplings, PS-HMBC and J-HMBC are more suitable.
[91]

Introduction
16
The application of Murata’s method relies on the judgement on the size of coupling constant that is
either large or small. In some molecules, multiple conformers exist and show averaged J values which
are classified as medium.[92]
In this case, the quantum mechanical (QM) calculation approach suggest
most probable assignment of the relative configuration which is performed by calculating the relevant
J values on all possible configurations (three syn and three anti rotamers) and quantitatively compared
to the experimental ones.[93]
Recent developments in quantum chemistry enable quick, accurate, and reliable calculation of NMR
parameters (coupling constants 2,3
JC,H, 3
JH,H and 1H and
13C chemical shifts) which allows predicting
the stereostructure.[94]
[95]
In brief, conformational search and geometry optimization of all significant
conformers of each stereoisomer are carried out by empirical methods such as molecular mechanics
(MM) or molecular dynamics (MD) at the empirical level. Furthermore, the quantum mechanical
calculation of NMR chemical shifts is performed on the previously optimized geometries of all
possible stereoisomers, and is compared to the experimental data. The mean absolute error (MAE) is
considered to compare the calculated and experimental parameters.[92]
Another approach for the assignment of the relative configuration of a contiguous stereogenic unit is
the one based on the Universal NMR Database (UDB).[96]
[97]
This is an empirical procedure that relies
on the comparison of the experimental NMR chemical shifts of the molecule under examination with
the database value. Since the local electronic environment is affected by the relative configuration, the
NMR chemical shift is applicable to predict the relative configuration. Concisely, the structure under
study is divided into small fragments and its chemical shifts are compared with the one of an
appropriate reference compound in the database.
A widely used chemical approach for the relative configuration assignment of 1,3-diol systems is
Rychnovsky’s acetonide method.[98]
As the result of a chemical reaction, a six membered heterocycle
is obtained in a specific conformation which depends on the relative configuration of the 1,3-diol. As
illustrated in Figure 1.12, a chair conformation is furnished from syn-1,3-diols, which is distinguished
by the 13
C-NMR chemical shifts of CMe2 groups (δC<100 ppm), axial methyl group (δC ~20 ppm) and
equatorial methyl groups (δC ~30 ppm). In contrast, an anti-1,3-diol leads to a twisted-boat
conformation, that exhibits diagnostic chemical shifts of the CMe2 group (δC>100 ppm) and similar
values (δC ~25 ppm) for both methyl groups. Moreover, standard 2D NMR experiments
(NOESY/ROESY) allow this method to be applicable for more complex polyacetonide systems. In
syn-1,3-diols, the axial methyl group shows NOE correlations to H4 and H6 axial protons. In the case
of anti-1,3-diols, one acetonide methyl shows an NOE to H6.[99]
[100]
(Figure 1.12)

Introduction
17
Figure 1.12 Conformations, diagnostic 13
C chemical shifts and NOESY correlations for syn-1,3-diol acetonide
and anti-1,3-diol acetonide (reproduced from ref. 100)
Absolute configuration – several instrumental methods are available for the determination of the
absolute configuration, including X-ray crystallography,[101]
chiroptical methods such as circular
dichroism (CD), optical rotatory dispersion (ORD) and specific optical rotation.[100]
X-ray diffraction
requires a monocrystal in very good quality which is unfortunately hard to obtain from natural
products since the amount of available pure sample is often limited.[102]
[103]
Chiroptical methods are based on the optical measurement of chiral molecules. ORD is based on the
measurement of the optical rotation at various wavelengths whereas CD is the measurement of the
difference of absorption intensity between right and left circularly polarized light at various
wavelengths. The most specific character of ORD is that it is based on the compound skeleton.
Therefore, sometimes ORD is more complicated to interpret than CD due to overlapped bands,
whereas CD gives a signal only in the optically active absorption band.[104]
Since light absorption is
associated with electronic transitions and the presence of chromophores in the molecule, CD as a true
spectroscopic technique can be made much more sensitive and can also be treated using the tools of
molecular orbital calculations. CD spectra can therefore be QM calculated from known geometries
and transition moments, and further compared with the one of molecule in study.[105]
[106]
Mosher’s method is the most widely used tool for determining the absolute configuration of
secondary alcohols and amines via chemical derivatization.[107]
Optically pure (R)- and (S)-α-
methoxy-α-trifluoromethylphenyl acetic acid (MTPA) or its acid chloride (MTPA-Cl) are used as
chiral derivatizing agents. In the corresponding (R)- and (S)-MTPA esters, anisotropic effects are
observed that lead to small chemical shift differences in the 1H-NMR spectrum. The phenyl group of
the chiral auxiliary (S)-MTPA shields the neighboring substituent (L1) of the chiral center, whereas
the other diastereomer, the (R)-MTPA ester has a shielding effect on L2. (Figure 1.13) The difference

Introduction
18
in the chemical shift ∆δSR
between the (S)-MTPA and (R)-MTPA esters is used to express the
shielding effect and its sign (+/-) is utilized for determining the absolute configuration based on the
chiral center of the auxiliary MTPA. All of the protons shielded in the (R)-MTPA present a positive
∆δSR
, while those shielded in the (S)-MTPA present a negative ∆δSR
value.[108]
Figure 1.13 Model for the (a) (R)-MTPA ester and (b) (S)-MTPA ester of secondary alcohols, and the ∆δSR
values for (c) (R)-MTPA ester and (d) (S)-MTPA ester (reproduced from ref 108)
The absolute configuration of peptides is determined by nonempirical advanced Marfey’s method
using LC-MS. After hydrolysis of the peptide, the constituent amino acids are derivatized with chiral
Marfey’s reagents, 1-fluoro-2,4-dinitrophenyl-5-L/D-alaninamide (L/D-FDAA) or -5-L/D-
leucinamide (L/D-FDLA), and further analyzed by LC-MS in comparison with corresponding
derivatives of standard amino acids. Since each derivatized enantiomer results in two diastereomers,
these can be separated by HPLC. The method relies on the elution order of L and D amino acid. [109]
Mass spectrometry is used to detect the amino acid derivative and the retention time is considered for
the absolute configuration assignment. Namely, the retention time of the L-FDLA derivative of a D
amino acid (D-L type) is different than those of L-amino acid (L-L type) since they are diastereomers.
Moreover, the retention time of L-D and D-L are the same, while the one for L-L and D-D are the
same, since each pair acts enantiomeric. In most cases, L-amino acid derivatives elute before the
corresponding D-isomers. However, for absolute configuration assignment of unusual amino acids,
Marfey’s method requires an enantiomerically pure standard.[110]
(Figure 1.14)

Introduction
19
Figure 1.14 HPLC behavior of common L-amino acid after derivatized with Marfey’s reagent, FDLA
Notable developments on the techniques essential for the isolation and structure elucidation of natural
compounds facilitate the structure determination and characterization of novel natural compound(s) in
reasonable time frame. NMR is the main method used for the unambiguous complete structure
elucidation of complex molecule due to its advantages such as modern developments for the
instrument sensitivity requiring low amount of samples (micrograms) which can be recovered after
data acquisition. Since the natural compounds often demonstrate structural complexity and high
diversity, there is no general rule to elucidate the stereochemical configuration.[100]
However,
successful combination of spectroscopic techniques and chemical methods enables the unequivocally
elucidation of the 3D structure of novel natural compounds.
1.4. Outline of the Work
The purpose of the present thesis was the discovery of new secondary metabolites from myxobacteria,
specifically from the underexplored and newly discovered myxobacterial genus – an approach that is
believed to increases the discovery rate of new natural product. In this regard, the organic extract of
strain MCy9135 belonging to the unexplored species Hyalangium minutum and the antifungal crude
extract of Jahnella sp. strain MSr9139 were analyzed by hyphenated techniques, and revealed the
presence of new metabolites. Furthermore, a chemistry guided approach was applied for the discovery
of new natural products from Cystobacter sp. MCy9104.
The thesis describes the isolation and structure elucidation of the identified secondary metabolites
from complex extracts using various analytical and comprehensive spectroscopic methods, including
1D- and 2D-NMR as well as high resolution MS, and tandem MS techniques. Absolute and relative
configurations were determined using chemical derivatization methods and quantum mechanical
calculations in cooperation with Prof. Giuseppe Bifulco at University of Salerno, Italy.
Introduction
20
The crude extract of Jahnella sp. strain MSr9139 exhibited strong antifungal activity against Candida
albicans. LC-MS/SPE-NMR analysis coupled to whole-cell assays enabled to trace the activity of the
extract to a family of cyclic peptides. Isolation of these peptides was carried out using subsequent
analytical tools and structure elucidation of these active metabolites was performed using
spectroscopic instruments. Structure elucidation revealed a new microsclerodermin derivative, termed
microsclerodermin L, together with a known microsclerodermin D and pedein A. The
microsclerodermins family was originally discovered from lithistid sponge Microscleroderma sp. and
Theonella sp. The results have contributed to the exploration of the biosynthetic pathway of these
antifungal cyclic peptides as described in Chapter 2.
Chapter 3 deals with the isolation and full characterization of the novel catecholate-type siderophores
hyalachelins A-C, from strain MCy9135 that belongs to the underexplored myxobacterial species H.
minutum. Analysis of crude extract performed by LC-MS and LC-MS/SPE-NMR revealed the
presence of unreported metabolites together with the known tartrolon D, myxochelin B and
hyafurones. Scaled-up cultivation was performed in a total of 160 L since the yield of the target
compounds was very low (15-30 µg/L). Reiterated purification steps yielded pure target molecules in
sufficient amounts to acquire full 2D NMR datasets for structure elucidation. The relative
configuration was determined (by Dr. G. Lauro and Prof. G. Bifulco, University of Salerno, Italy) by
applying a QM calculation on NMR parameters such as 1H and
13C chemical shifts and heteronuclear
coupling constants whereas the absolute configuration was analyzed by QM calculations of CD
spectra. Hyalachelins are characterized by the unusual 3,7,8-trihydroxy-1-oxo-1,2,3,4-
tetrahydroisoquinoline-3-carboxylic acid which has not been reported in natural products so far.
Moreover, their iron chelating activity was assessed by chrome-azurol S (CAS) assay, and bioactivity
evaluation was done against various Gram-negative and -positive bacteria as well as a number of
fungi and mammalian cell lines towards assessing the cytotoxicity.
Chemical screening of Cystobacter sp. strain MCy9104 revealed the presence of a family of unknown
metabolites in the crude extract. Scaled-up cultivation process enabled the isolation of seven new
compounds, termed cystochromones A-G. Structure elucidation was carried out by means of
comprehensive NMR data together with HR-MS/MS experiments. Cystochromones are characterized
by an unusually attached pentadecyl moiety to the chromone core, which has not been reported among
known chromone derivatives. The biosynthetic origin of the cystochromones was determined by
feeding experiments with various stable isotope labeled precursors and a biosynthetic pathway was
proposed as reported in Chapter 4.

Introduction
21
1.5. References
[1] F. E. Koehn, G. T. Carter, Nat. Rev. Drug. Discov. 2005, 4, 206–220.
[2] Y. W. Chin, M. J. Balunas, H. B. Chai, A. D. Kinghorn, AAPS J. 2006, 8, E239.
[3] D. J. Newman, G. M. Cragg, J. Nat. Prod. 2012, 75, 311–335.
[4] J. W. H. Li, J. C. Vederas, Science 2009, 325, 161–165.
[5] F. von Nussbaum, M. Brands, B. Hinzen, S. Weigand, D. Habich, Angew. Chem. Int. Ed. Engl. 2006, 45,
5072–5129.
[6] J. Clardy, M. A. Fischbach, C. T. Walsh, Nat. Biotechnol. 2006, 24, 1541–1550.
[7] M. G. Watve, R. Tickoo, M. M. Jog, B. D. Bhole, Arch. Microbiol. 2001, 176, 386–390.
[8] H. W. Boucher, G. H. Talbot, J. S. Bradley, J. E. Edwards, D. Gilbert, L. B. Rice, M. Scheld, B. Spellberg,
J. Bartlett, Clin. Infect. Dis. 2009, 48, 1–12.
[9] M. A. Fischbach, C. T. Walsh, Science 2009, 325, 1089–1093.
[10] S. Donadio, S. Maffioli, P. Monciardini, M. Sosio, D. Jabes, J. Antibiot. 2010, 63, 423–430.
[11] W. H. Gerwick, A. M. Fenner, Microb. Ecol. 2013, 65, 800–806.
[12] J. Kennedy, J. R. Marchesi, A. D. W. Dobson, Microb. Cell. Fact. 2008, 7, 27.
[13] L. L. Ling, T. Schneider, A. J. Peoples, A. L. Spoering, I. Engels, B. P. Conlon, A. Mueller, T. F.
Schäberle, D. E. Hughes, S. Epstein et al., Nature 2015, 517, 455–459.
[14] H. Reichenbach, J. Ind. Microbiol. Biotechnol. 2001, 27, 149–156.
[15] H. Reichenbach, K. Gerth, H. Irschik, B. Kunze, Trends Biotechnol. 1988, 6, 115–121.
[16] S. C. Wenzel, R. Müller in Comprehensive Natural Products Chemistry II, Vol 2: Structural Diversity II -
Secondary Metabolite Sources, Evolution and Selected Molecular Structures. B. Moore, Ed. Elsevier:
Oxford, 2010.
[17] W. Dawid, FEMS Microbiol. Rev. 2000, 24, 403–427.
[18] L. Shimkets, M. Dworkin, H. Reichenbach in The Prokaryotes M. Dworkin, S. Falkow, E. Rosenberg, K.
Schleifer, E. Stackebrandt., Eds.; Springer Verlag: New York, 2006.
[19] R. O. Garcia, D. Krug, R. Müller in Methods in Enzymology. Discovering Natural Products from
Myxobacteria with Emphasis on Rare Prodcuer Strains in Combination with Improved Analytical
Methods. Vol. 458. D. A. Hopwood, Ed. Academic Press: Burlington, 2009.
[20] K. Gerth, S. Pradella, O. Perlova, S. Beyer, R. Müller, J. Biotechnol. 2003, 106, 233–253.
[21] M. Nett, G. M. Konig, Nat. Prod. Rep. 2007, 24, 1245–1261.
[22] Degli E. M. Biochim. Biophys. Acta. Bioenerg. 1998, 1364, 222-235.
[23] K. J. Weissman, R. Müller, Nat. Prod. Rep. 2010, 27, 1276–1295.
[24] P. Meiser, H. B. Bode, R. Müller, P. Natl. Acad. Sci. USA 2006, 103, 19128–19133.
[25] S. C. Wenzel, R. Müller, Curr. Opin. Drug. Discov. Devel. 2009, 12, 220–230.
[26] B. Kunze, T. Kemmer, G. Höfle, H. Reichenbach, J. Antibiot. 1984, 37, 454–461.
[27] W. Oettmeier, D. Godde, B. Kunze, G. Höfle, Biochim. Biophys. Acta 1985, 807, 216–219.
[28] B. Kunze, G. Höfle, H. Reichenbach, J. Antibiot. 1987, 40, 258–265.
[29] A. Sandmann, J. Dickschat, H. Jenke-Kodama, B. Kunze, E. Dittmann, R. Müller, Angew. Chem. Int. Ed.
2007, 46, 2712–2716.
[30] R. Jansen, B. Kunze, H. Reichenbach, G. Höfle, Eur. J. Org. Chem. 2003, 2684–2689.

Introduction
22
[31] R. Jansen, P. Washausen, B. Kunze, H. Reichenbach, G. Hofle, Eur. J. Org. Chem. 1999, 1085–1089.
[32] G. Höfle, N. Bedorf, H. Steinmetz, D. Schomburg, K. Gerth, H. Reichenbach, Angew. Chem. Int. Ed. 1996,
35, 1567–1569.
[33] A. Conlin, M. Fornier, C. Hudis, S. Kar, P. Kirkpatrick, Nat. Rev. Drug. Discov. 2007, 6, 953–954.
[34] S. I. Elshahawi, A. E. Trindade-Silva, A. Hanora, A. W. Han, M. S. Flores, V. Vizzoni, C. G. Schrago, C.
A. Soares, G. P. Concepcion, D. L. Distel et al., P. Natl. Acad. Sci. USA 2013, 110, E295.
[35] M. Perez, C. Crespo, C. Schleissner, P. Rodriguez, P. Zuniga, F. Reyes, J. Nat. Prod. 2009, 72, 2192–
2194.
[36] F. Surup, K. Viehrig, K. I. Mohr, J. Herrmann, R. Jansen, R. Müller, Angew. Chem. Int. Ed. 2014, 53,
13588-13591.
[37] K. Viehrig, F. Surup, K. Harmrolfs, R. Jansen, B. Kunze, R. Müller, J. Am. Chem. Soc. 2013, 135, 16885–
16894.
[38] H. Yamaki, N. Sitachitta, T. Sano, K. Kaya, J. Nat. Prod. 2005, 68, 14–18.
[39] A. Plaza, R. Garcia, G. Bifulco, J. P. Martinez, S. Hüttel, F. Sasse, A. Meyerhans, M. Stadler, R. Müller,
Org. Lett. 2012, 14, 2854–2857.
[40] S. Baumann, J. Herrmann, R. Raju, H. Steinmetz, K. I. Mohr, S. Hüttel, K. Harmrolfs, M. Stadler, R.
Müller, Angew. Chem. Int. Ed. 2014, 53, 14605–14609.
[41] B. Kunze, R. Jansen, F. Sasse, G. Höfle, H. Reichenbach, J. Antibiot. 1995, 48, 1262–1266.
[42] T. M. Zabriskie, J. A. Klocke, C. M. Ireland, A. H. Marcus, T. F. Molinski, D. J. Faulkner, C. Xu, J.
Clardy, J. Am. Chem. Soc. 1986, 108, 3123–3124.
[43] A. Plaza, R. Müller in Natural Products A. Osbourn, R. J. Goss, G. T. Carter., Eds.; John Wiley & Sons
Inc: Hoboken, NJ, USA, 2014.
[44] S. C. Andrews, A. K. Robinson, F. Rodriguez-Quinones, FEMS Microbiol. Rev. 2003, 27, 215–237.
[45] Sigel, A., Sigel, H., Eds.; Metal Ions in Biological Systems: Iron Transport and Storage in
Microorganisms, Plants, and Animals; Dekker: New York, 1998.
[46] R. C. Hider, X. Kong, Nat. Prod. Rep. 2010, 27, 637–657.
[47] M. Sandy, A. Butler, Chem. Rev. 2009, 109, 4580–4595.
[48] H. D. Ambrosi, V. Hartmann, D. Pistorius, R. Reissbrodt, W. Trowitzsch-Kienast, Eur. J. Org. Chem.
1998, 541–551.
[49] B. Kunze, W. Trowitzsch-Kienast, G. Höfle, H. Reichenbach, J. Antibiot. 1992, 45, 147–150.
[50] G. Müller, K. N. Raymond, J. Bacteriol. 1984, 160, 304–312.
[51] B. Nagoba, D. Vedpathak, Eur. J. Gen. Med. 2011;8, 229-235.
[52] P. Ackrill, A.J. Raiston, K.C. Hoodge, Lancet 1980, 2, 692-693.
[53] S. Pollack, R. N. Rossan, D. E. Davidson, A. Escajadillo, Proc. Soc. Exp. Biol. Med. 1987, 184, 162–164.
[54] C. Raventos-Suarez, S. Pollack, R. L. Nagel. 1982. Am. J. Trop. Med. Hyg. 1982, 31, 919–922.
[55] M. Miethke, M. A. Marahiel, Microbiol. Mol. Biol. Rev. 2007, 71, 413.
[56] S. Schubert, A. Rakin, J. Heesemann, Int. J. Med. Microbiol. 2004, 294, 83–94.
[57] A. Gorska, A. Sloderbach, A. P. Marszatt, Trends. Pharmacol. Sci. 2014, 35, 442-449.
[58] C. Ji, P. A. Miller, M. J. Miller, J. Am. Chem. Soc. 2012, 134, 9898–9901.
[59] L. A. Mislin, I. J. Schalk, Metallomics, 2014, 6, 408-420.

Introduction
23
[60] G. Lang, N. A. Mayhudin, M. I. Mitova, L. Sun, S. S. van der, J. W. Blunt, A. L. Cole, G. Ellis, H.
Laatsch, M. H. Munro, J. Nat. Prod. 2008, 71, 1595–1599.
[61] K. F. Nielsen, M. Mansson, C. Rank, J. C. Frisvad, T. O. Larsen, J. Nat. Prod. 2011, 74, 2338–2348.
[62] J. L. Wolfender, K. Ndjoko, K. Hostettmann, Phytochem. Anal. 2001, 12, 2-22
[63] S. D. Sarker, Z. Latif, A. I. Gray., Eds.; Methods in Biotechnology; Natural products isolation. Humana
Press: Totowa, New Jersey, 2010.
[64] D. Krug, R. Müller, Nat. Prod. Rep. 2014, 31, 768–783.
[65] J. -L. Wolfender, K. Ndjoko, K. Hostettmann, J. Chromatogr. A. 2003, 1000, 437-455.
[66] S. Sturm, C. Seger, J. Chromatogr. A. 2012, 1259, 50-61.
[67] J. W. Jaroszewski, Planta. Med. 2005, 71, 795-802.
[68] D. Krug, K. Harmrolfs, T. Hoffmann, N. S. Cortina, R. Müller, Screening for novel natural products from
myxobacteria using LC-MS and LC-NMR, 2012.
[69] G. Wider, BioTechniques. 2000, 29, 1278-1294.
[70] I. Solomon, Phys. Rev. 1955, 99, 559-565.
[71] A. Bax, R. Freeman, J. Magn. Reson. 1981, 44, 542-561.
[72] W. F. Reynolds, R. Enriquez, J. Nat. Prod. 2002, 65, 221-244.
[73] A. Bax, D. G. Davis, J. Magn. Reson. 1985, 65, 355-360.
[74] D. G. Davis, A. Bax, J. Am. Chem. Soc. 1985, 107, 7197-7198.
[75] K. E. Kover, O. Prakash, J. Hruby, J. Magn. Reson. 1993, A103, 92-96.
[76] A. Bax, R. Freeman, J. Magn. Reson. 1981, 44, 542-561.
[77] R. C. Breton, W. F. Reynolds, Nat. Prod. Rep. 2013, 30, 501-524.
[78] A. Bax, M. F. Summers, Am. Chem. Soc. 1986, 108, 2093-2094.
[79] G. E. Martin, C. E. Hadden, J. Nat. Prod. 2000, 63, 543-585.
[80] T. F. Molinski, Nat. Prod. Rep. 2010, 27, 321–329.
[81] T. D. W. Claridge, High-Resolution NMR Techniques in Organic Chemistry, Elsevier: Amsterdam, 2009.
[82] W. Bauer, A. Soi, A. Hirsch, Magn. Reson. Chem. 2000, 38, 500–503.
[83] K. Stott, J. Keeler, Q. N. Van, A.J. Shaka, J. Magn. Reson. 1997, 125, 302-324.
[84] M. Karplus, J. Am. Chem. Soc. 1963, 85, 2870-2871.
[85] N. Matsumori, D. Kaneno, M. Murata, H. Nakamura, K. Tachibana, J. Org. Chem. 1999, 64, 866-876.
[86] C. Griesinger, O. W. Soerensen, R. R. Ernst, J. Am. Chem. Soc. 1985, 107, 6394-6396.
[87] H. Kessler, M. Gehrke, C. Griesinger, Angew. Chem. Int. Ed. 1988, 27, 490-536.
[88] A. Meissner, O. W. Sorensen, Magn. Reson. Chem. 2001, 39, 49-52.
[89] D. Uhrı́n, G. Batta, V. J. Hruby, P. N. Barlow, K. E. Kövér, J. Magn. Reson. 1998, 130, 155-161.
[90] T. Parella, J. F. Espinosa, Prog. Nucl. Magn. Reson. Spectrosc. 2013, 73, 17-55.
[91] B. L. Marquez, W. H. Gerwick, R. T. Williamson, Magn. Reson. Chem. 2001, 39, 499-530.
[92] G. Bifulco, P. Dambruoso, L. Gomez-Paloma, R. Riccio, Chem. Rev. 2007, 107, 3744–3779.
[93] G. Bifulco, C. Bassarello, R. Riccio, L. Gomez-Paloma Org. Lett. 2004, 6, 1025-1028.
[94] P. Cimino, L. Gomez-Paloma, D. Duca, R. Riccio, G. Bifulco, Magn. Reson. Chem. 2004, 42, S26-33.
[95] T. Helgaker, M. Jaszunski, K. Ruud, Chem. Rev. 1999, 99, 293-352.
[96] Y. Kobayashi, J. Lee, K. Tezuka, Y. Kishi, Org. Lett. 1999, 13, 2177-2180.

Introduction
24
[97] J. Lee, Y. Kobayashi, K. Tezuka, Y. Kishi, Org. Lett. 1999, 13, 2181-2184.
[98] S. D. Rychnovsky,J. D. Skalitzky, Tetrahedron Lett. 1990, 31, 945-948.
[99] S. D. Rychnovsky, D. J. Skalitzky, C. Pathirana, P. R. Jensen, W. Fenical, J. Am. Chem. Soc. 1992, 114,
671–677.
[100] T. F. Molinski, B. I. Morinaka, Tetrahedron. 2012, 68, 9307-9343.
[101] J. M. Bijvoet, A. F. Peerdeman, A. J. Van Bommel, Nature. 1951, 168, 271–272.
[102] M. F. C. Ladd, R. A. Palmer. Eds. Structure determination by X-ray crystallography 2nd
ed. Plenum:
NY, 1985.
[103] N. Harada, Chirality. 2008, 20, 691-723.
[104] A. Gergely, J. Pharmaceut. Biomed. 1989, 7, 523-541.
[105] M. Masullo, C. Bassarello, G. Bifulco, S. Piacente, Tetrahedron 2010, 66, 139–145.
[106] S. G. Allenmark, Nat. Prod. Rep. 2000, 17, 145–155.
[107] T. R. Hoye, C. S. Jeffrey, F. Shao, Nat. Protoc. 2007, 2, 2451–2458.
[108] J. M. Seco, E. Quinoa, R. Riguera, Chem. Rev. 2004, 104, 17–117.
[109] K. Fujii, Y. Ikai, H. Oka, M. Suzuki, K. Harada, Anal. Chem. 1997, 69, 5146–5151.
[110] R. Bhushan, H. Bruckner, Amino Acids 2004, 27, 231–247.

Microsclerodermins
25
Chapter 2
Microsclerodermins from Terrestrial Myxobacteria:
An Intriguing Biosynthesis Likely Connected
to a Sponge Symbiont
Thomas Hoffmann, Stefan Müller, Suvd Nadmid, Ronald Garcia and Rolf Müller*
Journal of the American Chemical Society, 2013, 135 (45), 16904–16911
DOI: 10.1021/ja4054509
Published online: October 14, 2013
Supporting information is available online at:
http://pubs.acs.org/doi/suppl/10.1021/ja4054509
Microsclerodermins
26
2. Microsclerodermins
2.1. Abstract
The microsclerodermins are unusual peptide natural products exhibiting potent antifungal activity
reported from marine sponges of the genera Microscleroderma and Theonella. We here describe a
variety of microbial producers of microsclerodermins and pedeins among myxobacteria along with
the isolation of several new derivatives. A retro-biosynthetic approach led to the identification of
microsclerodermin biosynthetic gene clusters in genomes of Sorangium and Jahnella species,
allowing for the first time insights into the intriguing hybrid PKS/NRPS machinery required for
microsclerodermin formation. This study reveals the biosynthesis of a “marine natural product” in a
terrestrial myxobacterium where even the identical structure is available from both sources. Thus, the
newly identified terrestrial producers provide access to additional chemical diversity; moreover, they
are clearly more amenable to production optimization and genetic modification than the original
source from the marine habitat. As sponge metagenome data strongly suggest the presence of
associated myxobacteria, our findings underpin the recent notion that many previously described
“sponge metabolites” might in fact originate from such microbial symbionts.
2.2. Introduction
Natural products have a longstanding tradition as leads for the development of new medicines.1 In
addition to well-established and extensively investigated plant, fungal, and bacterial producers of
secondary metabolites, newer screening campaigns increasingly include organisms from less studied
taxa and previously underexploited habitats such as terrestrial myxobacteria and marine sponges.2–5
Their potential as sources of novel chemical scaffolds has been clearly demonstrated and despite the
impressive structural diversity originating from these organisms, the overall picture has emerged that
structural types obtained from phylogenetically distant producers usually show little overlap.6
However, as an exception to this general notion the production of several strikingly similar
compounds by unrelated species has also been reported. Some of these findings are parallel
discoveries of initially sponge-derived metabolite classes from microbial sources, leading to the
assumption that the respective natural products might in fact be produced by bacterial sponge
symbionts.7–9
Support for this theory comes from the identification of filamentous bacteria growing
within intercellular space inside the sponge.8,10
However, studies which unambiguously prove the
production of a “sponge metabolite” by a symbiotic bacterium are exceedingly rare.10,11
The same
holds true for marine natural products of other host organisms.12–14
This shortcoming may be

Microsclerodermins
27
attributed to difficulties with isolation and cultivation of symbiotic microbes under laboratory
conditions. Notably, the ability to independently cultivate the "real" producer of a specific secondary
metabolite holds great promise, not only for sustained production but also for improving yields using
both biotechnological and genetic engineering approaches. These opportunities present an invaluable
advantage when further investigating a compound of interest, as the marine organism itself usually
faces critical supply limitations and is poorly amenable to genetic manipulation. Moreover, access to a
microbial producer facilitates the identification of biosynthetic genes underlying the formation of the
metabolite of interest - a crucial prerequisite for understanding the biosynthetic machinery and a
promising step toward transferring these genes into a suitable heterologous expression host.15
Figure 2.1 The microsclerodermin scaffold with an overview of the different residues identified so far. Groups
R1-R
4 are related to the presence of tailoring enzymes during biosynthesis whereas the side chain R
5
is derived by the PKS part of the biosynthetic machinery. The pyrrolidone is reported to have R,R- or
S,S-configuration, respectively.
Looking at those natural products from marine sources having apparent microbial counterparts,
several cases exist where structures of myxobacterial secondary metabolites are indeed strikingly
similar to previously discovered sponge-derived compounds. For example, the cyclodepsipeptide
jaspamide (jasplakinolide) isolated from the marine sponge Jaspis.16,17
is closely related to the
structure of chondramides produced by the myxobacterium Chondromyces crocatus Cm c5,
suggesting that the biosynthetic pathways responsible for production of these molecules should be
largely similar.18
The same holds true for renieramycin and saframycin MX1, isolated from a Reniera
sponge and a myxobacterium of the genus Myxococcus.19,20
Moreover, the macrolides
salicylihalamide and apicularen were isolated from a Halicona sp. sponge and a Chondromyces
species, respectively.21,22
Very recently, bengamides were described from a Jaspis sponge and a
cultured myxobacterium.23,24
Adding to the list of "biosynthetic look-alikes", the structure of pedein
from the terrestrial myxobacterium Chondromyces pediculatus Cm p3 closely resembles that of
microsclerodermin,25
which was isolated in 1994 from Microscleroderma sp., a lithistid sponge

Microsclerodermins
28
harvested in New Caledonia.26
Upon their finding of pedeins in myxobacteria, Kunze et al. suggested
that the origin of microsclerodermins could be a bacterial sponge symbiont closely related to
myxobacteria.25
Indeed, pedein and microsclerodermin are highly similar, and both exhibit potent
antifungal activity. To date several new derivatives belonging to the microsclerodermin class of
peptides have been identified from various Microscleroderma species as well as from a Theonella
sponge.27–30
Nevertheless, the biosynthetic machinery behind this natural product remains so far
elusive.
Table 2.1 Overview of Different Microsclerodermins and Pedeins and Their Origin
[a] Microscleroderma sp. (3 species) [b] Theonella sp. (1 species) [c] Chondromyces sp. (2 species) [d] Jahnella
sp. (2 species) [e] Sorangium sp. (11 species) [f] The tryptophan side chain is reduced to an α-β-unsaturated
amino acid. [g] Based on their same biosynthetic origin, we implicitly include pedeins when referring to the
microsclerodermin family in this study.
In this study we present several terrestrial myxobacteria as alternative producers of
microsclerodermins and pedeins. Our data show that Jahnella and Chondromyces species can produce
the identical derivate also known from a Microscleroderma species. In addition, they produce new
derivatives not previously reported from other sources. Access to genomic sequences for two
myxobacterial producers allowed us to establish for the first time a biosynthetic model for
microsclerodermin formation and also provided us with an opportunity to probe the molecular basis
responsible for the structural diversity observed from microsclerodermins. Moreover, it was shown
that the myxobacterial pedeins25
originate from the same biosynthetic machinery as the
microsclerodermins; hence, they belong to the same compound family. Taken together with recent
metagenomic studies providing evidence that myxobacterial taxa may even exist as sponge
symbionts,31
our results underpin the assumption that a myxobacterium is the real biosynthetic source
of the "marine" natural product microsclerodermin.
derivative R1 R2 R3 R4 R5 pyrrolidone
confign sum formula (M+H)+ [m/z] [a] [b] [c] [d] [e] ref.
A H H COOH OH i S, S C47H62N8O16 995.4357 •
26,29
B H H COOH H i S, S C47H62N8O15 979.4407 •
26,29
C Cl CONH2 H H vii R, R C41H50N9O13Cl 912.3289 • •
27
D Cl H H H vii R, R C40H49N8O12Cl 869.3231 • • • •
27, this
study
E H H COOH H iii R, R C45H54N8O14 931.3832 •
27
F + G f H H H H iv R, R C45H56N8O12 901.4090 •
28
H + I f H H H H ii R, R C46H58N8O12 915.4247 •
28
J H H H H i S, S C46H60N8O12 917.4403 •
29
K H H H OH i S, S C46H60N8O13 933.4353 •
29
L Cl H H OMe vii R, R C41H51N8O13Cl 899.3337
• •
this study
M H H H H v R, R C44H54N8O12 887.3934
• this study
Pedein Ag Cl H H OMe vi R, R C43H53N8O13Cl 925.3493
• •
25, this
study
Pedein B g H H H OMe vi R, R C43H54N8O13 891.3883
• •
25, this
study

Microsclerodermins
29
2.3. Experimental Section
2.3.1. Bacterial Strains and Culture Conditions
Sorangium cellulosum So ce38 was cultivated in H-medium (2 g/L soybean flour, 2 g/L glucose, 8
g/L starch, 2 g/L yeast extract, 1 g/L CaCl2·2H2O, 1 g/L MgSO4·7H2O, 8 mg/L Fe-EDTA, 50 mM
HEPES, adjusted to pH 7.4 with 10N KOH). Mutants of S. cellulosum So ce38 were cultivated in H-
medium supplemented with hygromycin B (100 µg/mL) and 1% (w/v) adsorber resin (XAD-16,
Rohm & Haas) at 180 rpm and 300C. Jahnella sp. MSr9139 was cultivated in buffered yeast broth
medium VY/2 (5 g/L baker’s yeast, 1 g/L CaCl2·2H2O, 5 mM HEPES pH 7.0 with 10N KOH) at 180
rpm and 300C.
32 The Escherichia coli strains DH10B and ET12567 harboring the plasmids pUB307
and pSUPmscH_KO for conjugation purposes were cultivated in Luria-Bertani (LB) medium at 370C.
Transformation of strains was performed according to the standard methods described elsewhere.33
Antibiotics were added with the following final concentrations: chloramphenicol (25 µg/mL),
kanamycin sulfate (25 µg/mL) and hygromycin B (100 µg/mL).
2.3.2. Disruption of the mscH Locus in Soce38
Gene disruption in So ce38 using biparental mating was carried out according to a previously
established protocol.34
For construction of the plasmid pSUPmscH_KO a homologous fragment with
the size of 2472 bp was amplified from genomic DNA using the oligonucleotides mscH_KO_for
(GAT CCA GCG CTG GTT CCT CG) and mscH_KO_rev (ACG AGG CTG TCG AAG AGC G) and
cloned into pCR-TOPO II-vector, resulting in the plasmid pTOPO_mscH_KO. The genomic segment
was subsequently recovered from this plasmid using the restriction enzymes HindIII and EcoRV and
further integrated into the prepared vector pSUPHyg.
2.3.3. Isolation of Microsclerodermin M from So ce38
The production medium for So ce38 was P38X medium (2 g/L peptone, 2 g/L glucose, 8 g/L starch, 4
g/L probion, 1 g/L CaCl2 2H2O, 1 g/L MgSO4·7H2O, 8 mg/L Fe-EDTA, 50 mM HEPES, adjusted to
pH 7.5 with 10 N KOH). A 100 L fermenter with 2% (w/v) XAD-16 adsorber resin (Rohm & Haas)
was harvested after 14 days of fermentation. The cells were removed from the XAD before extraction
with 3 x 3 L of methanol followed by 1 x 3 L of acetone. The combined fractions yielded 47.2 g dry
weight of crude extract. Five grams of this extract was suspended in cold water, the suspension was
centrifuged immediately, and the remaining pellet was dissolved in DMSO/MeOH (1:1, v/v) to give a
product-enriched solution which was subjected to preparative HPLC using a Waters Autopurifier
System equipped with a Waters XBridge C18, 150x19 mm, 5 µm dp column operated at room
temperature. The gradient started at 30% B, increased to 50% B in 2 min and to 51 % B in another 2
min before increasing to 95% B in 4min for column flushing. The combined fractions of interest were

Microsclerodermins
30
lyophilized, dissolved in DMSO/MeOH (1:1, v/v), and forwarded to a semipreparative Dionex HPLC
system (P680 pump, TCC100 thermostat, and PDA100 detector) equipped with a Phenomenex Fusion
C18, 250x4.6 mm, 4 µm dp column. Separation was achieved by a linear gradient using (A) H2O and
(B) ACN at a flow rate of 5 mL/min and 300C. The gradient started at 10 % B and increased to 30% B
in 3 min, followed by an increase to 38% B in 15 min (0.9% B/column volume). UV data were
acquired at 316 nm. A maximum of 100 µL of the sample was manually injected before fraction
collection, yielding 8.1 mg of microsclerodermin M. Microsclerodermin M: white amorphous solid,
[𝛼]𝐷20 - 55.7 (c 0.10, DMSO/MeOH 8:2).
2.3.4. Isolation of Microsclerodermins from MSr9139
The strain MSr9139 was cultivated in 3 x 1 L shaking flasks containing 500 mL of buffered VY/2
medium for 30 days. The medium was changed every 24 h by pipetting out the liquid broth. The cell
pellet was harvested by centrifugation and lyophilized overnight, followed by extraction with 3 x 300
mL of methanol. The combined fractions yielded an orange-brown crude extract which was further
partitioned between hexane and MeOH/H2O 7:3 (v/v) to yield 170 mg of crude extract out of the
aqueous phase. Subsequently, the extract was purified by semipreparative HPLC using an Agilent
1260 Infinity system (G1311C quaternary pump, G1330B thermostat, G1315D DAD detector and
G1328C manual injector) equipped with a Phenomenex Jupiter Proteo, 250x10 mm, 4 µm dp column.
Separation was achieved by a linear gradient using (A) H2O and (B) ACN at a flow rate of 2.5
mL/min and 220C. The gradient started at 20% B and increased to 50% B in 35 min (5.7% B/column
volume). UV data were acquired at 280 nm. A maximum of 100 µL of the sample was manually
injected before fraction collection yielding 0.7 mg of microsclerodermin D, 0.45 mg of
microsclerodermin L, and 0.85 mg of pedein A. Microsclerodermin L: white amorphous solid, [𝛼]𝐷20 -
77.7 (c 0.12, MeOH).
2.3.5. LC-MS data acquisition
All measurements were performed on a Dionex Ultimate 3000 RSLC system using a BEH C18, 100 x
2.1 mm, 1.7 µm dp column (Waters, Germany). Separation of 1 µL sample was achieved by a linear
gradient from (A) H2O + 0.1% FA to (B) ACN + 0.1% FA at a flow rate of 600 µL/min and 450C. The
gradient was initiated by a 0.5 min isocratic step at 5% B, followed by an increase to 95% B in 18 min
to end up with a 2 min step at 95% B before reequilibration under the initial conditions. UV spectra
were recorded by a DAD in the range from 200 to 600 nm. The LC flow was split to 75 µL/min
before entering the maXis 4G hr-ToF mass spectrometer (Bruker Daltonics, Germany) using the
Apollo II ESI source. Mass spectra were acquired in centroid mode ranging from 150–2500 m/z at 2
Hz scan rate.
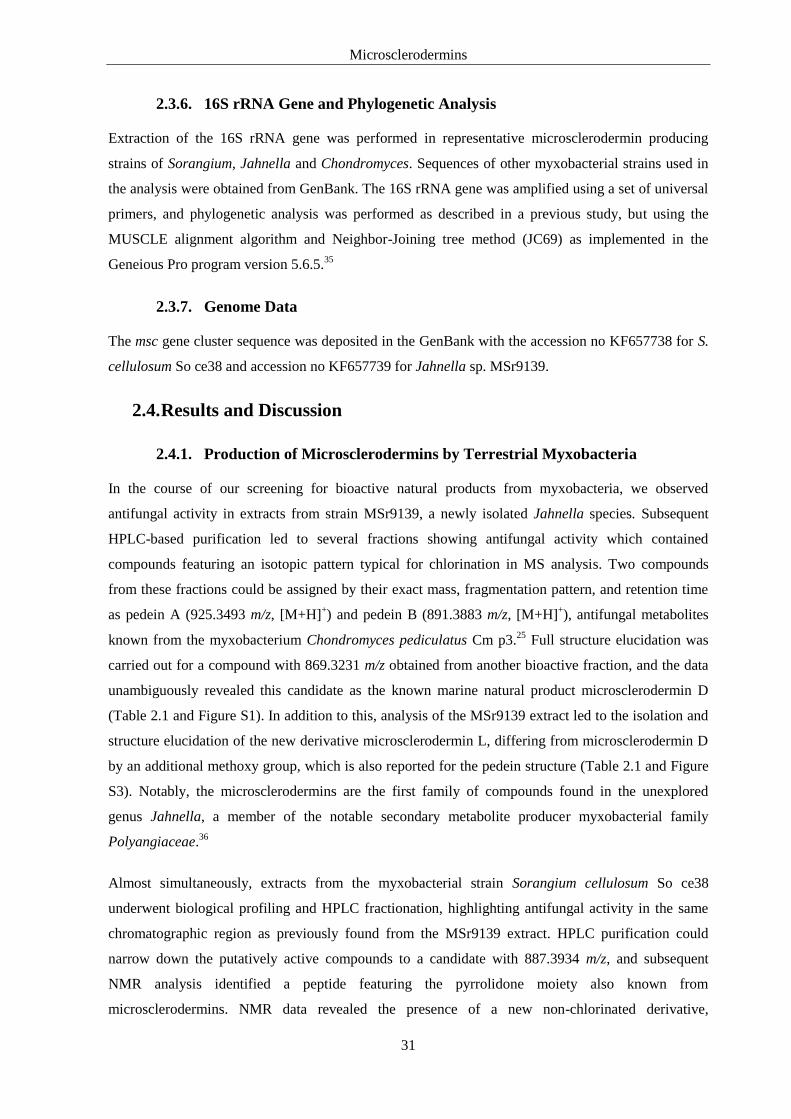
Microsclerodermins
31
2.3.6. 16S rRNA Gene and Phylogenetic Analysis
Extraction of the 16S rRNA gene was performed in representative microsclerodermin producing
strains of Sorangium, Jahnella and Chondromyces. Sequences of other myxobacterial strains used in
the analysis were obtained from GenBank. The 16S rRNA gene was amplified using a set of universal
primers, and phylogenetic analysis was performed as described in a previous study, but using the
MUSCLE alignment algorithm and Neighbor-Joining tree method (JC69) as implemented in the
Geneious Pro program version 5.6.5.35
2.3.7. Genome Data
The msc gene cluster sequence was deposited in the GenBank with the accession no KF657738 for S.
cellulosum So ce38 and accession no KF657739 for Jahnella sp. MSr9139.
2.4. Results and Discussion
2.4.1. Production of Microsclerodermins by Terrestrial Myxobacteria
In the course of our screening for bioactive natural products from myxobacteria, we observed
antifungal activity in extracts from strain MSr9139, a newly isolated Jahnella species. Subsequent
HPLC-based purification led to several fractions showing antifungal activity which contained
compounds featuring an isotopic pattern typical for chlorination in MS analysis. Two compounds
from these fractions could be assigned by their exact mass, fragmentation pattern, and retention time
as pedein A (925.3493 m/z, [M+H]+) and pedein B (891.3883 m/z, [M+H]
+), antifungal metabolites
known from the myxobacterium Chondromyces pediculatus Cm p3.25
Full structure elucidation was
carried out for a compound with 869.3231 m/z obtained from another bioactive fraction, and the data
unambiguously revealed this candidate as the known marine natural product microsclerodermin D
(Table 2.1 and Figure S1). In addition to this, analysis of the MSr9139 extract led to the isolation and
structure elucidation of the new derivative microsclerodermin L, differing from microsclerodermin D
by an additional methoxy group, which is also reported for the pedein structure (Table 2.1 and Figure
S3). Notably, the microsclerodermins are the first family of compounds found in the unexplored
genus Jahnella, a member of the notable secondary metabolite producer myxobacterial family
Polyangiaceae.36
Almost simultaneously, extracts from the myxobacterial strain Sorangium cellulosum So ce38
underwent biological profiling and HPLC fractionation, highlighting antifungal activity in the same
chromatographic region as previously found from the MSr9139 extract. HPLC purification could
narrow down the putatively active compounds to a candidate with 887.3934 m/z, and subsequent
NMR analysis identified a peptide featuring the pyrrolidone moiety also known from
microsclerodermins. NMR data revealed the presence of a new non-chlorinated derivative,

Microsclerodermins
32
microsclerodermin M (Table 2.1 and Figure 2.2, S4). It shares the typical cyclic core structure with
other microsclerodermins but features an unbranched side chain with three double bonds in
conjugation to a phenyl moiety. Like the known microsclerodermins, the newly identified derivatives
show potent activity against Candida albicans (microsclerodermin M, MIC 0.16 µg/mL;
microsclerodermin L, MIC 18 µg/mL, microsclerodermin D, MIC 6.8 µg/mL). The stereochemistry of
the isolated microsclerodermins was identified by acetonide formation and chemical degradation
experiments followed by advanced Marfey analysis (see supporting information). It is identical to that
reported for the microsclerodermins C – I and pedeins.25,27,28
Having discovered that myxobacteria from three different genera Jahnella, Sorangium, and
Chondromyces are able to produce microsclerodermin congeners including even the exact same
structure as previously described from two species of lithistid sponges (microsclerodermin D) was
surprising for two reasons: examples of myxobacteria producing an identical scaffold also known
from a phylogenetically distant organism are to date exceedingly rare (even when counting among the
bacterial kingdom), and according to previous studies the secondary metabolite profiles from strains
belonging to different myxobacterial genera usually exhibit little overlap.6 In order to shed light on the
occurrence of microsclerodermins within the myxobacteria, we conducted a search across high-
resolution LC-MS data sets measured from almost 800 extracts, thus covering a sufficiently
representative sample including most known myxobacterial taxa (Figure S20). On the basis of the
evaluation of exact masses, isotope patterns and retention times we could identify a panel of 15 strains
from the suborder Sorangineae (no single producer was found within the Cystobacterineae) as
producers of microsclerodermins. Interestingly, our comprehensive LC-MS survey of myxobacterial
secondary metabolomes revealed that producers of microsclerodermins form two mutually exclusive
groups: one group comprises 11 Sorangium species producing solely the new microsclerodermin M,
while the second group includes two strains of Jahnella sp. and two Chondromyces sp. that produce a
variety of different derivatives: i.e. the “marine” microsclerodermin D in addition to the new
microsclerodermin L and pedeins A/B (Figures S21 and S22). The various microsclerodermins differ
in side chain, tryptophan modification and oxidation state at the pyrrolidone ring, whereas the peptidic
core structure is always identical (Figure 2.1).
The fact that all microsclerodermins, irrespective of their origin, exhibit an identical macrocycle and
in most cases even the same stereochemistry supports the idea of a shared biosynthetic origin or even
a shared evolutionary ancestor. Moreover, the finding of a group of terrestrial myxobacteria producing
exactly the same compound as found in lithistid sponges27
(microsclerodermin D) fuels speculation
about the actual biosynthetic origin of marine microsclerodermins. We herein propose that the marine
microsclerodermins actually originate from a myxobacterium phylogenetically related to the
Sorangineae suborder – possibly a yet uncultured species of the Chondromyces, Jahnella, or

Microsclerodermins
33
Sorangium taxa living in symbiosis with the sponges from which microsclerodermins were previously
isolated.
Figure 2.2 (A) Organization of the msc biosynthetic gene cluster in Jahnella sp. MSr9139 compared to
Sorangium cellulosum So ce38. (B) Proposed biosynthetic route to microsclerodermin formation in
So ce38. (C) Postulated biosynthetic steps leading to the amino group that is involved in
macrolactam formation. A, adenylation domain; AMT, aminotransferase; ACP, acyl-carrier-protein
domain; AT, acyltransferase; C, condensation domain; CoA-Lig, coenzyme A Ligase; DH,
dehydratase; E, epimerase; KR, ketoreductase; KS, ketosynthase; MT, methyltransferase; MOX,
monooxygenase; PCP, peptidyl-carrier-protein domain.
In coincidence with this hypothesis, phylogenetic studies of sponge metagenomes recently identified
δ-proteobacteria in the sponge holobiont.31
Indeed, the phylogenetic tree presented in the work of
Simister et al. lists a clade containing nine myxobacterial species of terrestrial origin, including
Sorangium cellulosum and Chondromyces pediculatus.31
These data underpin our assumption that an
evolutionary link exists between microsclerodermin biosynthesis in terrestrial and marine producers.
Notably, 13 out of 15 producers identified by our LC-MS metabolome survey belong to the genera
Sorangium or Chondromyces. In addition, the new Jahnella sp. MSr9139 was isolated from a soil
sample collected from the same Philippine island where the sponge Microscleroderma was initially
Microsclerodermins
34
found.27
This intriguing finding suggests that myxobacteria are possibly flushed to the ocean and
adapted to an association with a sponge. The diversity and density of microbial flora present in
sponges appears to be a good niche for a predator and proteo-bacteriolytic myxobacterium;7 thus it is
expected that in the future myxobacteria will be isolated from this underexplored source.
Access to myxobacterial producers holds a remarkable benefit, as these bacteria may be cultivated in
large-scale fermentations, thereby allowing efficient production of the compounds of interest.
Microsclerodermin M is produced at 12 mg/L in S. cellulosum So ce38 without optimization of
growth conditions or genetic modification of the strain. Moreover, it allows us to investigate their
biosynthesis, which has not been elucidated from any marine source to date. Thus, we set out to mine
genome sequences of the new terrestrial producers for the presence of putative microsclerodermin
biosynthetic pathways, using a retrobiosynthetic analysis as the starting point. The genome sequence
of the strain Sorangium cellulosum So ce38, producer of the new microsclerodermin M, was already
available from a previous study.37
The newly isolated Jahnella sp. MSr9139 was selected for
additional genome sequencing, as it produces the new microsclerodermin L in addition to known
pedeins A and B and the “marine” microsclerodermin D.

Microsclerodermins
35
Figure 2.3 Neighbor-joining tree of myxobacteria inferred from 16S rRNA gene sequences showing the clades
of microsclerodermin producing strains in suborder Sorangiineae. The numbers at branch points
indicate percentage bootstrap support based on 1000 resamplings. GenBank accession numbers are
indicated in parentheses. Bar = 0.05 substitutions per nucleotide position.
2.4.2. Microsclerodermin Biosynthetic Machinery
All microsclerodermins share the same cyclic peptide core but feature different lipophilic side chains
and modifications of amino acid residues. On the basis of retrobiosynthetic considerations, the
biosynthetic machinery for microsclerodermin formation was expected to consist of a multimodular
PKS/NRPS system accompanied by a set of enzymes involved in side chain biosynthesis and post
assembly line modification. The core PKS/NRPS modules should be conserved between producers,
while enzymes involved in side chain biosynthesis and additional tailoring enzymes – responsible for
modifications such as halogenation or oxidation of the pyrrolidone ring – should occur differentially
between the two producer groups, as a consequence of evolutionary diversification of the
microsclerodermin pathway.

Microsclerodermins
36
Using S. cellulosum So ce38 and Jahnella sp. MSr9139 as representative strains from both
microsclerodermin producer groups, we sought to identify microsclerodermin biosynthetic pathways
in their genomes and subsequently elaborate on the molecular basis for the observed structural
variations. The genome sequences of both strains were searched in silico for secondary metabolite
gene clusters using the antiSMASH analysis pipeline.38
The assignment of a matching candidate
cluster to microsclerodermin biosynthesis was verified in So ce38 via targeted gene disruption by
single crossover integration using biparental conjugation (Figure S24). Sequence comparison on the
protein and nucleotide level revealed high similarity between gene clusters from both strains (Table
2.2), and comparison of operons permitted the tentative assignment of cluster boundaries. The
microsclerodermin cluster spans a region of 58 kbp (74.7 % GC) in So ce38 and 62 kbp (72.4 % GC)
in MSr9139, respectively. In both strains, genes encoding a major facilitator superfamily transporter
(mscK) followed by a type II thioesterase (mscJ) are located upstream to mscA. The core biosynthetic
assembly line covers five NRPS modules and three PKS modules encoded on genes mscA to mscI. An
additional halogenase is encoded by mscL near the downstream boundary of the cluster in MSr9139
(Figure 2.2 A).
Microsclerodermin biosynthesis is initiated at the side chain to build up a phenyl group in conjugation
to a double bond. An activated starter unit such as benzoyl-CoA or trans-cinnamoyl-CoA is usually
recruited by the enzyme in such a case. However, a retrobiosynthetic proposal tells us that the
observed double bond order of the side chain is likely different during biosynthesis (Figure 2.2, B).
The biosynthetic logic requests the incorporation of C2 units, which is only possible if the double
bonds are rearranged (Figure S23). A rearrangement of double bonds has already been reported for
other natural products like bacillaen, rhizoxin, corallopyronin and ansamitocin where isomerization is
likely catalyzed by a dehydratase domain.39–42
The reason for isomerization of the microsclerodermin
side chain remains elusive; however, it is supported by an energetic benefit of a conjugated π-system.
On the basis of this hypothesis, the only suitable starter unit is phenylacetyl-CoA, which has already
been reported for other natural product biosynthesis.43
The incorporation of a phenylacetate starter
unit was indeed verified by feeding experiments using isotope-labeled precursors. Feeding ring-
labeled 13
C6-L-phenylalanine resulted in a mass increase of 6 Da, whereas the fully labeled
15N,
13C9-L-phenylalanine led to a mass shift of 8 Da, indicating the incorporation of two side chain
carbons (Figure S27). Feeding d5-benzoic acid or d7-trans-cinnamic acid resulted in no mass increase
(Figure S25). We can conclude that the α and β carbon atoms of phenylalanine - but not the carboxyl
carbon - is incorporated into microsclerodermin. Elongation of the phenylacetate unit is catalyzed by
modules MscA and MscC using three times malonate and two times 3-hydroxymalonate as extender
units in an iterative manner. Modules 2 (MscB) and 4 (MscD) do only exhibit a combination of a
functional KS domain attached to an inactive AT domain as identified by consensus sequence
analysis, likely a relic of a former PKS complex.

Microsclerodermins
37
Table 2.2 Proteins involved in microsclerodermin biosynthesis as identified in two myxobacterial strains.
The PKS-derived unit is forwarded to the first PCP domain of module MscF. This module harbors
two additional domains of rather uncommon type showing high homology to the amino transferase
family (AMT) and to the monooxygenase family, both located downstream to the PCP domain. A
biosynthetic proposal to account for this domain order is based on oxidation of the β-hydroxyl group
of the bound intermediate to the respective β-keto functionality followed by conversion to a β-amino
moiety that undergoes macrocyclization (Figure 2.2, C). The use of an aminotransferase is known
from other natural product biosynthetic pathways, however, not in combination with the initial
oxidation step.44
Sorangium cellulosum So ce38 Jahnella sp. MSr9139
protein length
[aa]
domains and position in sequence length
[aa]
domains and position in sequence identity
[%]
MscA 3275 CoA-Lig (264-701), KR*(1034-1197),
ACP (1348-1411), KS (1441-1828), AT
(1976-2286), DH (2342-2505), KR'
(2870-3047), ACP' (3149-3214)
3535 CoA-Lig (215-649), KR*(1032-1126),
MT (1229-1509), ACP (1613-1676),
KS (1712-2147), AT (2244-2555), DH
(2610-2774), KR*' (3132-3309), ACP'
(3411-3476)
65.4
MscB 870 KS (27-451), AT* (548-772) 878 KS (39-464), AT* (561-792) 73.4
MscC 1551 KS (36-460), AT (557-859), DH* (956-
1076), KR (1158-1336), ACP (1436-
1505)
1549 KS (39-464), AT (561-865), DH* (956-
1076), KR (1157-1335), ACP (1436-
1499)
75.0
MscD 900 KS (36-461), AT* (565-678) 848 KS (36-461), AT* (564-675) 72.0
MscE 446 Putative amidohydrolase 386 Putative amidohydrolase 82.9
MscF 2273 PCP (27-98), AMT (329-660), MOX
(828-1127), C (1185-1529), A (1673-
2082), PCP' (2169-2237)
2189 PCP (4-75), AMT (280-614), MOX
(758-1057), C (1105-1397), A (1594-
2000), PCP' (2088-2149)
76.5
MscG 1548 KS (14-439), AT (534-828), KR (1156-
1330), ACP (1441-1509)
1511 KS (14-439), AT (531-850), KR (1136-
1312), ACP (1404-1472)
72.1
MscH 4141 C (76-377), A (564-966), MT (1037-
1256), PCP (1469-1531), C' (1554-
1850), A' (2037-2426), PCP' (2515-
2574), E (2591-2905), C'' (3074-3374),
A'' (3558-3967), PCP'' (4054-4121)
4106 C (48-346), A (534-936), MT (1007-
1225), PCP (1442-1505), C' (1526-
1827), A' (2013-2405), PCP' (2492-
2551), E (2568-2872), C'' (3043-3343),
A'' (3527-3932), PCP'' (4019-4083)
78.8
MscI 2904 C (48-346), A (533-936), PCP (1023-
1087), KS (1111-1535), AT (1638-
1936), KR (2266-2465), ACP (2549-
2612), TE (2634-2888)
2945 C (77-375), A (563-965), PCP (1053-
1116), KS (1150-1573), AT (1676-
1970), KR (2309-2509), ACP (2597-
2660), TE (2683-2945)
77.8
MscJ 257 thioesterase type II 263 thioesterase type II 43.5
MscK 415 major facilitator superfamily (MFS)
transporter
450 major facilitator superfamily (MFS)
transporter
24.5
MscL - - 535 Tryptophan halogenase -
MscM - - 438 Fe(II)/α-ketoglutarate dependent
oxygenase
-
MscN - - 277 methyltransferase -
A, adenylation domain; AMT, aminotransferase; ACP, acyl-carrier-protein domain; AT, acyltransferase; C,
condensation domain; CoA-Lig, coenzyme A Ligase; DH, dehydratase; E, epimerase; KR, ketoreductase; KS,
ketosynthase; MT, methyltransferase; MOX, monooxygenase; PCP, peptidyl-carrier-protein domain. * inactive
domain

Microsclerodermins
38
Thereafter, biosynthesis continues with a set of NRPS- and PKS-based reaction cycles. Analysis of
the A domain specificities in silico is consistent with the amino acids incorporated.45
We propose the
uncommon pyrrolidone moiety is built up by asparagine cyclization. To the best of our knowledge,
such an asparagine-derived pyrrolidone system is only found in microsclerodermins and
koshikamides, a natural product that was isolated from a Theonella species.46
Indeed, the A domain of
MscF is specific for asparagine activation and we did a feeding experiment with fully labeled
15N2-
13C4-L-asparagine to prove this biosynthetic step. We observed a mass increase of 6 Da
according to the incorporation of all carbon and nitrogen atoms of asparagine into the compound
(Figures S26, S28). On the basis of this result, a plausible biosynthetic hypothesis requires the
nucleophilic attack of the asparagine side chain to the backbone carbonyl atom. A suitable mechanism
is known from the intein-mediated peptide cleavage, where intein initiates an intra-molecular
asparagine cyclization, notwithstanding the poor reactivity of the side chain’s amide.47
In
microsclerodermin biosynthesis, this reaction likely is accompanied by an inversion of the
stereochemistry at the α-carbon of the former (S)-asparagine. The relative configuration of the
pyrrolidone ring was identified by NOE correlations, whereas the absolute (R,R)-configuration is
derived from degradation experiments (see supporting information). The stereochemistry at this
position is thereby identical with that of microsclerodermins C – I. The protein MscE is most likely
responsible for the cyclization step, as it is found in both microsclerodermin clusters and shows
similarity to the amidohydrolase class, a fairly promiscuous enzyme family able to act on a variety of
substrates. However, the exact mechanism involved in this biosynthetic step remains elusive at
present.
The forthcoming NRPS modules correspond to the observed structure of microsclerodermin in terms
of domain order and predicted substrate specificity (Figure 2.2, B). For both new microsclerodermins
an R-configured tryptophan was identified by means of the advanced Marfey method, which is in
agreement with the epimerization domain found in module 8. The (3R)-configuration of the γ-amino
butyric acid (GABA) subunit was identified by the same technique (see Figures S13, S14). Both
stereogenic centers have the same configuration as identified in all microsclerodermins so far.
2.4.3. Genetic Basis for the Structural Diversity of Microsclerodermins
The derivatives found in Jahnella sp. MSr9139 feature side chains with either one or two double
bonds while the side chain in So ce38 comprises strictly three double bonds. As the number of PKS
modules encoded in the gene cluster does not match the number of required elongation cycles, an
iterative function of the type I PKS subunits MscA and MscC as described for the stigmatellin
megasynthase may explain this finding.48
The KS domains of each module are highly identical for
both strains and do not comprise any of the postulated sequence-based identifiers of iterative KS
domains.49
Nevertheless, MscB is grouping with iterative KS domains in a phylogenetic analysis

Microsclerodermins
39
(Figure S11). Comparing the entire module MscA of both clusters revealed the insertion of an
additional methyl transferase-like domain into the first part of the protein in MSr9139. This domain is
likely inactive on the basis of in silico analysis as judged by the presence of a corrupted SAM-binding
motif (Table S13).50
Currently, we cannot rule out the possibility that the presence of this additional
methyl transferase may influence the iteration process within MscA. In addition to this difference,
there is no obvious reason why biosynthesis in So ce38 results in a triene whereas MSr9139 is less
strict in iteration. As another hint for a shared origin of the biosynthetic cluster, some of the sponge-
derived derivatives exhibit a methyl-branched side chain which could be attributed to this methyl
transferase being active in some of the marine producers. Eventually, the variable side chains of the
microsclerodermin family are in agreement with the alternating PKS functionality. Halogenation of
tryptophan as well as oxidation of the pyrrolidone ring is catalyzed by tailoring enzymes. The
halogenase MscL is located downstream to the cluster in MSr9139 and is responsible for chlorination
of the tryptophan. It shows 32 % identity on a protein level to a tryptophan halogenase from a
Streptomyces species (PDB entry 2WET_A). There is no analogue of MscL found in So ce38, which
is in agreement with the absence of chlorinated products in this strain. Supplementing KBr or NaBr to
the MSr9139 cultivation broth led to the production of brominated microsclerodermins on the basis of
LC-MS analysis. Another difference is the inter-region between the main PKS and NRPS parts. In
MSr9139 two additional proteins are found in this region. MscN is a member of the SAM-dependent
methyl transferase family, and MscM shows homology to Fe(II)/α-ketoglutarate-dependent
dioxygenases. On the basis of the structures produced by MSr9139, we conclude that MscM and
MscN are responsible for oxidation and methylation of the pyrrolidone ring, respectively.
Modifications at the tryptophan as known from some marine-derived microsclerodermins were not
observed in this study. Such modifications are attributed to promiscuous acting enzymes that could be
related to the producer strain or even to enzymes related to some sponge symbiont.
2.5. Conclusion
The discovery of microsclerodermins/pedeins from several myxobacteria represents one of the few
findings of identical compounds from marine organisms and terrestrial bacteria reported to date. This
study thus strengthens the notion that certain natural products, which have been isolated from marine
sources such as sponges or other invertebrates, actually originate from associated microbes. Notably,
the identification of microsclerodermin-producing myxobacteria provides meaningful hints for future
attempts to isolate the symbiotic microbe. This knowledge is considered particularly helpful because
isolation success in many cases critically depends on methods well adapted to the requirements of the
genus targeted for isolation, especially when aimed at the rather challenging isolation of slow-
growing myxobacteria. Availability of an alternative microbial producer as a sustainable source is an
advantage for realizing the potential of a marine natural product for therapeutic applications.
Microsclerodermins
40
Moreover, the myxobacterial producers come along with additional chemical diversity and are
amenable to genetic manipulation, as demonstrated in this study. Finally, the identification of two
slightly different microsclerodermin biosynthetic gene clusters from two myxobacteria allowed us to
establish a conclusive model for microsclerodermin biosynthesis and provided insights into the
molecular basis for structural diversity within this compound family. A detailed understanding of
microsclerodermin biosynthesis is an important prerequisite for any future efforts toward engineering
the pathway for yield improvement or for the production of new derivatives: whether in the native
producer, by heterologous expression, or by using synthetic biology approaches.
2.6. References
[1] Newman, D. J.; Cragg, G. M. J. Nat. Prod. 2012, 75, 311–35.
[2] Wenzel, S. C.; Müller, R. Mol. Biosyst. 2009, 5, 567–74.
[3] Weissman, K. J.; Müller, R. Bioorg. Med. Chem. 2009, 17, 2121–36.
[4] Lane, A. L.; Moore, B. S. Nat. Prod. Rep. 2011, 28, 411–28.
[5] Winder, P. L.; Pomponi, S. A.; Wright, A. E. Mar. Drugs. 2011, 9, 2643–82.
[6] Wink, J.; Müller, R. Int. J. Med. Microbiol. 2013, in press.
[7] Hentschel, U.; Piel, J.; Degnan, S. M.; Taylor, M. W. Nat. Rev. Microbiol. 2012, 10, 641–54.
[8] Taylor, M. W.; Radax, R.; Steger, D.; Wagner, M. Microbiol. Mol. Biol. Rev. 2007, 71, 295–347.
[9] Bewley, C. A.; Faulkner, D. J. Angew. Chem. Int. Ed. 1998, 37, 2162–2178.
[10] Schmidt, E. W.; Obraztsova, A. Y.; Davidson, S. K.; Faulkner, D. J.; Haygood, M. G. Mar. Biol. 2000,
136, 969–977.
[11] Unson, M. D.; Faulkner, D. J. Experientia 1993, 49, 349–353.
[12] Elshahawi, S. I.; Trindade-Silva, A. E.; Hanora, A.; Han, A. W.; Flores, M. S.; Vizzoni, V.; Schrago, C.
G.; Soares, C. A.; Concepcion, G. P.; Distel, D. L.; Schmidt, E. W.; Haygood, M. G. Proc. Natl. Acad. Sci.
U.S.A. 2013, 110, E295–304.
[13] Lin, Z.; Torres, J. P.; Ammon, M. A.; Marett, L.; Teichert, R. W.; Reilly, C. A.; Kwan, J. C.; Hughen, R.
W.; Flores, M.; Tianero, M. D.; Peraud, O.; Cox, J. E.; Light, A. R.; Villaraza, A. J. L.; Haygood, M. G.;
Concepcion, G. P.; Olivera, B. M.; Schmidt, E. W. Chem. Biol. 2013, 20, 73–81.
[14] Kwan, J. C.; Donia, M. S.; Han, A. W.; Hirose, E.; Haygood, M. G.; Schmidt, E. W. Proc. Natl. Acad. Sci.
U.S.A. 2012, 109, 20655–60.
[15] Wenzel, S. C.; Müller, R. In Comprehensive Natural Products II, Vol. 2: Natural Products Structural
Diversity-II Secondary Metabolites: Sources, Structures and Chemical Biology; Moore, B. S.; Crews, P.,
Eds.; Elsevier, 2010; pp 189-222.
[16] Crews, P.; Manes, L. V; Boehler, M. Tetrahedron Lett. 1986, 27, 2797–2800.
[17] Zabriskie, T. M.; Klocke, J. A.; Ireland, C. M.; Marcus, A. H.; Molinski, T. F.; Faulkner, D. J.; Xu, C.;
Clardy, J. J. Am. Chem. Soc. 1986, 108, 3123–3124.
[18] Kunze, B.; Jansen, R.; Sasse, F.; Höfle, G.; Reichenbach, H. J. Antibiot. 1995, 48, 1262–6.
[19] Irschik, H.; Trowitzsch-Kienast, W.; Gerth, K.; Höfle, G.; Reichenbach, H. J. Antibiot. 1988, 41, 993–8.
[20] Frincke, J. M.; Faulkner, D. J. J. Am. Chem. Soc. 1982, 104, 265–269.

Microsclerodermins
41
[21] Erickson, K. L.; Beutler, J. A.; Cardellina, J. H.; Boyd, M. R. J. Org. Chem. 1997, 62, 8188–8192.
[22] Kunze, B.; Jansen, R.; Sasse, F.; Höfle, G.; Reichenbach, H. J. Antibiot. 1998, 51, 1075–80.
[23] Hoffmann, H.; Haag-Richter, S.; Kurz, M.; Tietgen, H. Bengamide derivatives, method for the production
thereof and use thereof for the treatment of cancer. WO2005044803 A1, 2005.
[24] Johnson, T. A.; Sohn, J.; Vaske, Y. M.; White, K. N.; Cohen, T. L.; Vervoort, H. C.; Tenney, K.;
Valeriote, F. A.; Bjeldanes, L. F.; Crews, P. Bioorg. Med. Chem. 2012, 20, 4348–55.
[25] Kunze, B.; Böhlendorf, B.; Reichenbach, H.; Höfle, G. J. Antibiot. 2008, 61, 18–26.
[26] Bewley, C. A.; Debitus, C.; Faulkner, D. J. J. Am. Chem. Soc. 1994, 116, 7631–7636.
[27] Schmidt, E. W.; John Faulkner, D. Tetrahedron 1998, 54, 3043–3056.
[28] Qureshi, A.; Colin, P. L.; Faulkner, D. J. Tetrahedron 2000, 56, 3679–3685.
[29] Zhang, X.; Jacob, M. R.; Ranga Rao, R.; Wang, Y. H.; Agarwal, A. K.; Newman, D. J.; Khan, I. A.; Clark,
A. M.; Li, X. C. Res. Rep. Med. Chem. 2012, 2012, 7–14.
[30] Zhang, X.; Jacob, M. R.; Ranga Rao, R.; Wang, Y. H.; Agarwal, A. K.; Newman, D. J.; Khan, I. A.; Clark,
A. M.; Li, X. C. Res. Rep. Med. Chem. 2013, 9.
[31] Simister, R. L.; Deines, P.; Botté, E. S.; Webster, N. S.; Taylor, M. W. Environ. Microbiol. 2012, 14, 517–
24.
[32] Garcia, R. O.; Krug, D.; Müller, R. Meth. Enzymol. 2009, 458, 59–91.
[33] Sambrook, J.; Russell, D. W. Molecular cloning: A laboratory manual; Cold Spring Harbor Laboratory
Press: Cold Spring Harbor, NY, 2001.
[34] Kopp, M.; Irschik, H.; Gross, F.; Perlova, O.; Sandmann, A.; Gerth, K.; Müller, R. J. Biotechnol. 2004,
107, 29–40.
[35] Garcia, R.; Gerth, K.; Stadler, M.; Dogma, I. J.; Müller, R. Mol. Phylogenet. Evol. 2010, 57, 878–87.
[36] Garcia, R.; Müller, R. In The Prokaryotes: Deltaproteobacteria and Epsilonproteobacteria; Rosenberg, E.;
DeLong, E. F.; Lory, S.; Stackebrandt, E.; Thompson, F., Eds.; Springer: Heidelberg, 2014, in press.
[37] Jahns, C.; Hoffmann, T.; Müller, S.; Gerth, K.; Washausen, P.; Höfle, G.; Reichenbach, H.; Kalesse, M.;
Müller, R. Angew. Chem. Int. Ed. 2012, 51, 5239–43.
[38] Medema, M. H.; Blin, K.; Cimermancic, P.; de Jager, V.; Zakrzewski, P.; Fischbach, M. A.; Weber, T.;
Takano, E.; Breitling, R. Nucleic Acids Res. 2011, 39, W339–46.
[39] Butcher, R. A.; Schroeder, F. C.; Fischbach, M. A.; Straight, P. D.; Kolter, R.; Walsh, C. T.; Clardy, J.
Proc. Natl. Acad. Sci. U.S.A. 2007, 104, 1506–9.
[40] Kusebauch, B.; Busch, B.; Scherlach, K.; Roth, M.; Hertweck, C. Angew. Chem. Int. Ed. 2010, 49, 1460–4.
[41] Erol, O.; Schäberle, T. F.; Schmitz, A.; Rachid, S.; Gurgui, C.; El Omari, M.; Lohr, F.; Kehraus, S.; Piel,
J.; Müller, R.; König, G. M. Chem. Bio. Chem. 2010, 11, 1253–65.
[42] Taft, F.; Brünjes, M.; Knobloch, T.; Floss, H. G.; Kirschning, A. J. Am. Chem. Soc. 2009, 131, 3812–3.
[43] Magarvey, N. A.; Beck, Z. Q.; Golakoti, T.; Ding, Y.; Huber, U.; Hemscheidt, T. K.; Abelson, D.; Moore,
R. E.; Sherman, D. H. ACS Chem. Biol. 2006, 1, 766–79.
[44] Tillett, D.; Dittmann, E.; Erhard, M.; von Döhren, H.; Börner, T.; Neilan, B. A. Chem. Biol. 2000, 7, 753–
64.
[45] Röttig, M.; Medema, M. H.; Blin, K.; Weber, T.; Rausch, C.; Kohlbacher, O. Nucleic Acids Res. 2011, 39,
W362–7.

Microsclerodermins
42
[46] Plaza, A.; Bifulco, G.; Masullo, M.; Lloyd, J. R.; Keffer, J. L.; Colin, P. L.; Hooper, J. N. A.; Bell, L. J.;
Bewley, C. A. J. Org. Chem. 2010, 75, 4344–55.
[47] Mujika, J. I.; Lopez, X.; Mulholland, A. J. Org. Biomol. Chem. 2012, 10, 1207–18.
[48] Gaitatzis, N.; Silakowski, B.; Kunze, B.; Nordsiek, G.; Blöcker, H.; Höfle, G.; Müller, R. J. Biol. Chem.
2002, 277, 13082–90.
[49] Yadav, G.; Gokhale, R. S.; Mohanty, D. PLoS Comput. Biol. 2009, 5, e1000351.
[50] Kozbial, P. Z.; Mushegian, A. R. BMC Struct. Biol. 2005, 5, 19.

Microsclerodermins
43
Table S2.1. NMR chemical shifts of microsclerodermin D.
Amino acid Assignment δC a δH (mult., J in Hz)
b
APTO 1 172.3
2 69.2 4.39 (d, 3.2)
3 53 4.13 (d, 11.3)
4 69.5 3.32 (m)
5 68.8 3.57 (m)
6 36.3 2.35 (m)
7 128.0 6.24 (m)
8 130.5 6.40 (d, 15.8)
9 137.2
10, 14 125.4 7.35 (d, 7.3)
11, 13 128.2 7.29 (t, 7.6)
12 126.5 7.19 (t, 7.3)
OH-2 6.58 (brs)
OH-4 4.17 (m)
OH-5 4.36 (d, 4.5)
NH-3 7.47 (d, 6.0)
GABOB 15 172.3
16 40.7 2.43 (d, 14.0)
2.15 (d, 14.0)
17 66.8 3.72 (m)
18 44.7 3.39 (m)
2.61 (m)
OH-17 4.88 (d, 4.8)
NH-18 7.50 (m)
Gly 19 168.5
20 42.3 3.75 (d, 7.0)
3.34 (d, 7.0)
NH-20 8.54 (t, 6.0)
6-Cl-Trp 21 171.5
22 55.1 4.17 (m)
23 25.8 3.10 (dd, 5.7, 14.7)
2.98 (dd, 5.7, 14.7)
24 124.6 7.26 (d, 1.8)
25 109.5
26 125.6
27 119.4 7.52 (d, 8.3)
28 118.4 7.00 (dd, 1.5, 8.3)
29 c
30 110.7 7.37 (s)
31 136.1
NH-22 8.64 (d, 4.3)
NH-24 11.04 (brs)
N-Me-Gly 32 169.9
33 49.5 4.08 (d, 16.3)
3.84 (d, 16.3)
34 36.2 2.93 (s)
Pyrrolidone 35 170.2
36 38.6 2.84 (d, 17.1)
2.69 (d, 17.1)
37 85.2
38 50.3 4.47 (m)
39 35.0 2.27 (m)

Microsclerodermins
44
Figure S2.1 Structure and atom numbering of microsclerodermin D. Compound isolated from marine sponges of
the genera Microscleroderma sp. and Theonella sp. and the myxobacterium Jahnella sp. MSr9139
40 172.3
NH-37 7.96 (brs)
NH-38 7.56 (m)
OH-37 c a Recorded at 175 MHz, referenced to residual solvent DMSO-d6 at 39.51 ppm.
b Recorded at 700 MHz, referenced to residual solvent DMSO-d6 at 2.50 ppm.
c Not observed.
ov overlapping signals.

Microsclerodermins
45
Table S2.2 NMR chemical shifts of microsclerodermin L.
Amino acid Assignment δC a δH (mult., J in Hz)
b HMBC ROESY
APTO 1 172.9
2 69.2 4.43 (brs) 1
3 53 4.19 (d, 11.3) 4 4
4 69.7 3.32 (m)
5 68.7 3.59 (q, 6.5)
6 36.6 2.38 (m) 4, 5, 7, 8
2.33 (m)
7 128 6.26 (m) 6, 9
8 130.5 6.40 (d, 15.8) 6, 9, 10, 14 6
9 137.2
10, 14 125.6 7.36 (d, 7.0) 8, 12 7, 8
11, 13 128.3 7.29 (t, 7.6) 9, 10, 14
12 126 7.19 (t, 7.4) 10, 11, 13, 14
OH-2 6.57 (brs)
OH-4 4.85 (d, 4.9)
OH-5 4.30 (brs)
NH-3 7.42 (brs) 16
GABOB 15 172.1
16 40.6 2.43 (d, 14.0) 15
2.12 (d, 14.0)
17 66.6 3.77 (m) 16, 18 OH-17
18 44.8 3.33 (m) 17
2.65 (m)
OH-17 4.85 (brs)
NH-18 7.43 (brs) 20
Gly 19 168.5
20 42.5 3.72 (d, 7.0) 19, 21
3.36 (d, 7.0)
NH-20 8.51 (t, 6.0 ) 22
6-Cl-Trp 21 171.6
22 55.2 4.17 (m) NH-20
23 25.8 3.10 (dd, 5.7, 15.0) 21, 22, 24, 25, 26
2.98 (dd, 5.7, 15.0)
24 124.7 7.26 (d, 2.0) 25, 31, 32
25 109.3
26 125.5
27 119.4 7.52 (d, 8.5) 31
28 118.5 7.00 (dd, 1.8, 8.5) 30, 26
29 c
30 110.7 7.37 (s) 27
31 136.3
NH-22 8.68 (d, 4.3) 22, 23, 24, 33
NH-24 11.03 (d, 2.0) 24, 25, 31, 26 24, 30
N-Me-Gly 32 172.2
33 49.6 4.28 (d, 16.4) 32, 34
3.69 (d, 16.4)
34 35.9 2.92 (s) 33, 35
Pyrrolidone 35 170.4
36 38.6 2.83 (d, 16.9) 35, 37 38
2.61 (d, 16.9)
37 82.3
38 55.8 4.44 (d, 9.0) 39 NH-38
39 79.0 4.04 (d, 8.8) 40, 41 NH-38
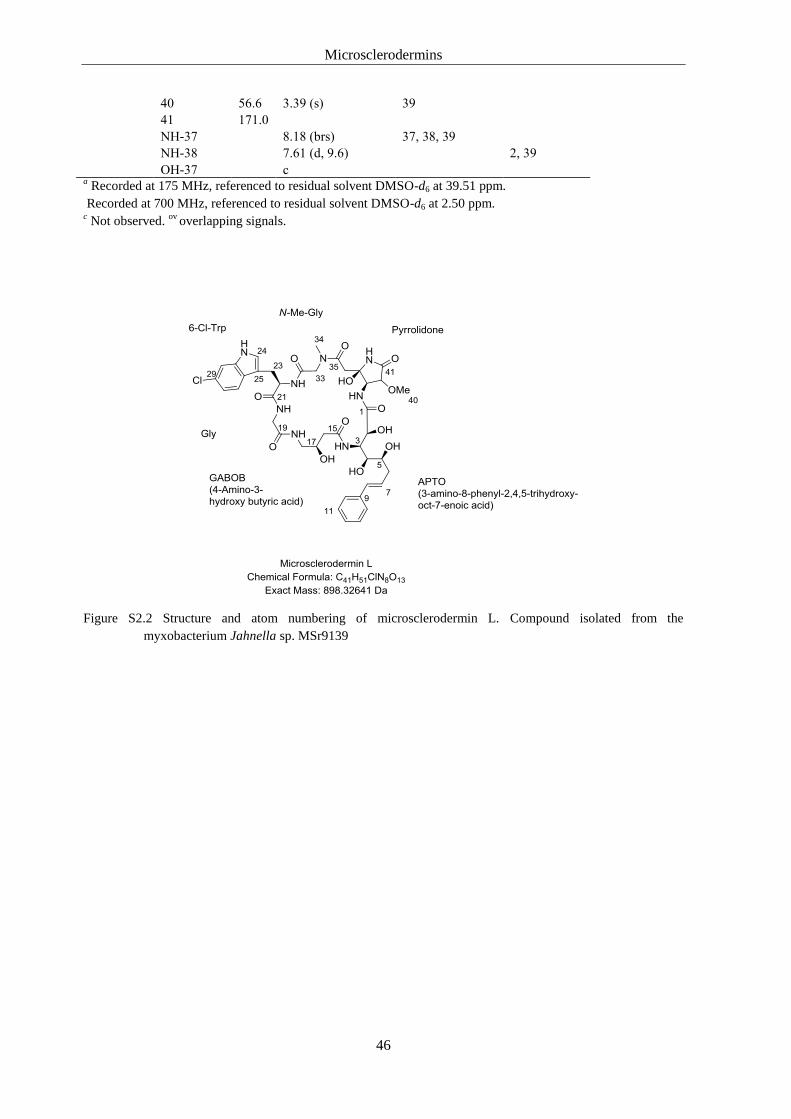
Microsclerodermins
46
40 56.6 3.39 (s) 39
41 171.0
NH-37 8.18 (brs) 37, 38, 39
NH-38 7.61 (d, 9.6) 2, 39
OH-37 c a Recorded at 175 MHz, referenced to residual solvent DMSO-d6 at 39.51 ppm.
Recorded at 700 MHz, referenced to residual solvent DMSO-d6 at 2.50 ppm. c Not observed.
ov overlapping signals.
Figure S2.2 Structure and atom numbering of microsclerodermin L. Compound isolated from the
myxobacterium Jahnella sp. MSr9139
Hyalachelins
47
Chapter 3
Hyalachelins A-C, Unusual Siderophores Isolated from the Terrestrial
Myxobacterium Hyalangium minutum
Suvd Nadmid,†,§
Alberto Plaza,†,§
Gianluigi Lauro,‡ Ronald Garcia,
†,§ Giuseppe Bifulco,
*,‡
and Rolf Müller*,†,§
Organic Letters. 2014, 16, 4130–4133.
DOI 10.1021/ol501826a
Published online: July 14, 2014

Hyalachelins
48
3. Hyalachelins
3.1. Abstract
Three new siderophores, termed hyalachelins A-C (1-3), were isolated from the terrestrial
myxobacterium Hyalangium minutum. Their structures were determined by 2D NMR and HR-
MS/MS experiments and their stereochemical configuration was established by a combination of
NMR data, quantum mechanical calculations, and circular dichroism experiments. Hyalachelins are
unusual catecholate-type siderophores that bear an 3,7,8-trihydroxy-1-oxo-1,2,3,4-
tetrahydroisoquinoline-3-carboxylic acid. Their iron chelating activities were evaluated in a CAS
assay showing EC50 values of around 30 M.
3.2. Main Text
Most bacteria require iron for growth. In response to iron limitation which is caused by low solubility
of Fe+3
at physiological pH, bacteria produce and secrete iron chelating small molecules, termed
siderophores. The siderophore-iron complex exhibits improved solubility and enables the transport of
ferric iron into the cell through outer-membrane receptor proteins.1,2
To date only two different
structural classes of siderophores, the catecholates myxochelin A and B,3,4
and the citrate-
hydroxamates nannochelins,5 have been reported from myxobacteria.
Over the course of our research aimed at the discovery of new bioactive natural products from
myxobacteria by using NMR and MS profiling,6 our attention was drawn to screen novel and
unexplored strains, which led to the isolation of new structural varieties.7,8
Strain MCy9135 was
isolated from a soil sample collected in Xiamen, China and it is phenotypically and phylogenetically
related to the unexplored species Hyalangium minutum by 16S rDNA analysis. An ethyl acetate
extract of the strain MCy9135 was analyzed by LC-MS and LC-NMR and revealed the presence of
four different classes of natural products, including three new catecholate siderophores, termed
hyalachelins A-C (1-3), together with the known tartrolon D9, myxochelin B
4, and hyafurones
10.

Hyalachelins
49
Figure 3.1. Hyalachelins A-C (1-3)
Hyalachelin A (1) was isolated as colorless amorphous solid. Its molecular formula was determined to
be C29H32N3O10, based on a molecular ion at m/z 582.2074 [M+H]+observed in HR-ESI-MS
(calculated 582.2088, ∆ppm 2.4), requiring 16 degrees of unsaturation. The 1H NMR spectrum of 1 in
CD3OD (see Table 3.1) exhibited aromatic proton signals including two doublets at δ 7.17 (2H, d, J =
8.5 Hz) and 6.72 (2H, d, J = 8.5 Hz) corresponding to a para-substituted aromatic ring and a pair of
doublets at δ 6.80 (1H, d, J = 8.2 Hz) and 6.12 (1H, d, J = 8.2 Hz), characteristic of tetrasubstituted
benzene ring. Moreover, a set of signals comprising two doublets at δ 7.17 (1H, d, J = 8.0 Hz), 6.90
(1H, dd, J = 8.0, 1.0 Hz), and a triplet at δ 6.68 (1H, t, J = 8.0 Hz) was observed and suggested
presence of 1,2,3-trisubstituted benzene ring. Examination of the HSQC spectrum revealed the
presence of two methines (δC-4 52.2, δH-4 4.70; δC-2' 59.6, δH-2' 3.51) and two aminomethylenes (δC-1'
41.3, δH-1' 3.87, 3.13; δC-6' 40.1, δH-6' 3.36, 3.31).
Figure 3.2 Selected key HMBC and COSY correlations for fragment A and B of hyalachelin A (1)
Analysis of TOCSY and COSY cross peaks yielded four spin systems, three of which comprise
aromatic protons. HMBC and HSQC correlations together with splitting patterns of the aromatic
protons at δ 6.12-7.17 were indicative of two 2,3-dihydroxybenzoyl moieties (DHB-1 and DHB-2,
respectively) and a phenol moiety. Finally, the last spin system comprising protons H-1' to H-6' was

Hyalachelins
50
deduced as a hexane-1,2,6-triamine moiety. A long-range correlation from the proton at δ 3.36 (H-6'a)
to the carbonyl resonance at δ 171.2 linked the triamine moiety to DHB-1 forming the partial structure
A (see Figure 3.2). Partial structure B was assembled on the basis of HMBC correlations. In
particular, key correlations from the methine proton H-4 to the aromatic carbons at δ 132.1 (C-5),
113.0 (C-6), 118.4 (C-10), and 133.4 (C-2''') connected DHB-2 to the phenol residue via the methine
at C-4. ROESY correlations from H-10 to H-4 and H-2''' supported this connectivity (see Figure 3.3).
Further HMBC correlations from H-4 to the carbon resonances at δ 94.3 (C-3) and 175.2 (C-11),
attached C-4 to the α-hydroxy acid at C-3, completing the partial fragment B as depicted in Figure
3.3.
Inspection of the partial fragments A and B revealed that together they contained 15 of the required 16
degrees of unsaturation indicating that linkage between fragments A and B involved formation of a
ring to satisfy the unsaturation index and the molecular formula. HMBC correlations from H-2' to the
carbon resonances at δ 172.3 (C-1) and 94.3 (C-3) linked fragments A and B, which form a six-
membered ring containing both an amide and a hemiaminal functional group. Therefore, the structure
of 1 was established as a linear catecholate siderophore that contains a hexasubstituted
tetrahydroisoquinoline ring linked to a phenol moiety at position 4.
Figure 3.3 Key HMBC correlations used to link two fragments and ROESY correlations.
Tandem mass spectrometry provided further evidence to support the structure of 1. The MS2
fragmentation of the major ion peak at m/z 582 [M+H]+
displayed an intense ion at m/z 564 [M+H-
H2O]+. MS of the daughter ion peak displayed a predominant fragment at m/z 503 [M+H-H2O-44-17]
+
corresponding to loss of CO2 and NH2. Finally, MS4 fragmentation of this ion peak produced a
fragment ion at m/z 367 [M+H-H2O-44-17-136]+ corresponding to the loss of a DHB residue along
with an ion peak at m/z 270 [M+H-H2O-44-17-233]+ corresponding to the loss of fragment A (see
Figure S3.1). Thus, the MSn fragmentation patterns were in complete agreement with the structure of
1 as determined by NMR.

Hyalachelins
51
Table 3.1 NMR spectroscopic data for hyalachelin A (1) in CD3OD
pos δHa, mult (J in Hz) δC
b HMBC
c
1 172.3
2
3 94.3
4 4.70, s 52.2 3, 5, 6, 10, 11, 1''', 2'''
5 132.1
6 113.0
7 150.6
8 145.3
9 6.80, d (8.2) 120.1 5, 7, 8
10 6.12, d (8.2) 118.4 1, 4, 6, 7, 8
11 175.2
1'a 3.87, t (11.7) 41.3 2'
1'b 3.13, dd (12.5, 3.3)
2' 3.51, m 59.6 1, 3, 1', 3', 4'
3'a 2.16, m 31.5 1', 2', 4', 5'
3'b 2.03, m 2', 4'
4'a 1.41, m 25.1 2', 3', 6'
4'b 1.36, m
5' 1.60, m 30.0 3', 4', 6'
6'a 3.36, m 40.1 4', 5', 7''
6'b 3.31, m
1'' 116.5
2'' 150.1
3'' 147.0
4'' 6.90, dd (8.0, 1.0) 119.3 2'', 3'', 6''
5'' 6.68, t (8.0) 119.3 1'', 3'', 6''
6'' 7.17, d (8.0) 118.4 1'', 2'', 4'', 5'', 7''
7'' 171.2
1''' 128.4
2''', 6''' 7.17, d (8.5) 133.4 4, 1''', 4''
3''', 5''' 6.72, d (8.5) 115.6 1''', 4'''
4''' 157.8
aRecorded at 700 MHz, referenced to residual CD3OD at δ 3.31 ppm;
brecorded at 175 MHz, referenced to
residual CD3OD at δ 49.15 ppm; cproton showing HMBC correlation to indicated carbon
HR-ESI-MS analysis of hyalachelin B (2) showed a molecular ion peak at m/z 566.2127 [M+H]+
appropriate for a molecular formula of C29H32N3O9 (calculated 566.2139, ∆ppm 2.12), which is 16
mass units lower than that of 1. The 2D NMR data for 2 closely resembled those of 1 with the

Hyalachelins
52
exception that resonances belonging to the phenol of 1 were replaced by resonances belonging to a
phenyl group in 2.
Hyalachelin C (3) showed a molecular ion peak at 605.2235 [M+H]+ observed in HR-ESI-MS
(calculated 605.2248, ∆ppm 2.15), which corresponded to a molecular formula of C31H33N4O9. 1H
NMR spectrum exhibited significant differences on the downfield region in comparison to that of 1,
displaying proton signals consistent with the presence of an indole ring. On the basis of the 2D NMR
data 3 was identified as the indole-derivative of 1.
Due to the lack of possible diagnostic ROE effects in the cyclic and flexible portions of the molecule,
the relative configuration of representative hyalachelin B (2) was assigned by quantum mechanical
calculations of 13
C and 1H NMR chemical shifts.
11,12 By using Monte-Carlo Molecular Mechanics
(MCMM) and Molecular Dynamics (MD) simulations, an extensive conformational search at the
empirical level was performed for each of the four possible relative stereoisomers (see Figure S3.3),
termed 2a (2'S*,3R*,4R*), 2b (2'S*,3S*,4R*), 2c (2'S*,3R*,4S*), and 2d (2'S*,3S*,4S*). All the non-
redundant conformers were subsequently geometry and energy optimized at the density functional
level (DFT) using the MPW1PW91 functional and 6-31G(d) basis set and using IEFPCM for
simulating the DMSO solvent (Gaussian 09 software package).13
On the previously optimized
geometries of all four possible relative stereoisomers (2a-d), we performed
quantum mechanical calculations of 13
C and 1H NMR chemical shifts (see Table S3.5 and Table S3.6)
and compared them to the experimental data in order to have indications on the relative configuration
of 2. The mean absolute error (MAE) value was used to impartially compare calculated and
experimental 1H and
13C NMR chemical shifts (see Figure 3.4). Indeed, isomer 2b displayed the
lowest MAE values (13
C MAE = 2.35 ppm, 1H MAE = 0.15 ppm) suggesting that the relative
configuration of 2 is 2'S*,3S*,4R*. To further confirm this result, a comparison of the calculated and
experimental 2JC-H heteronuclear coupling constant for C-3 and H-4 was considered. It is worth
mentioning that no other significant experimental coupling constants and/or dipolar effects were
observed for the tetrahydroisoquinolinic ring. A 2JC3-H4 value of -5.8 Hz was obtained from a J-
resolved HMBC14
spectrum, which was in good accordance with the -4.3 Hz calculated value of 2b.
On the other hand, the experimental 2JC3-H4 value significantly differed with respect to the calculated
values for the remaining stereoisomers (-8.7 Hz for 2a, -2.8 Hz for 2c, and -8.9 Hz for 2d, see Figure
S3.4 and Table S3.7).

Hyalachelins
53
Figure 3.4 Mean absolute errors (MAE) histograms obtained by comparison of the 13
C (blue bars) and 1H (red
bars) chemical shifts for stereoisomers 2a, 2b, 2c and 2d with the experimental data. MAE=Σ[|(δexp–
δcalcd)|]/n, summation through n of the absolute error values (difference of the absolute values
between corresponding experimental and 13
C, 1H chemical shifts), normalized to the number of the
chemical shifts considered. The lowest MAE is reflected by the 2b relative stereoisomer.
Finally, the absolute configuration of 2 was analyzed by comparing the calculated and experimental
circular dichroism (CD) spectra of the two possible enantiomers, 2'S,3S,4R and 2'R,3R,4S.15,16
Starting
from the previously obtained conformation of 2b, a new optimization of the geometries was
performed at DFT level using the IEFPCM methanol model. Boltzmann-weighted CD spectrum was
calculated for 2'S,3S,4R, and its enantiomer 2'R,3R,4S. As shown in Figure 3.5, the experimental
curve closely fits with that of 2'S,3S,4R, thereby suggesting the absolute configuration of 2. CD
spectra were also calculated for all the other six possible stereoisomers. None of them showed
significant similarity to the experimental spectrum (see Figure S3.5).
Figure 3.5 Comparison of experimental CD spectrum and 2'S,3S,4R and 2'R,3R,4S CD calculated spectra.
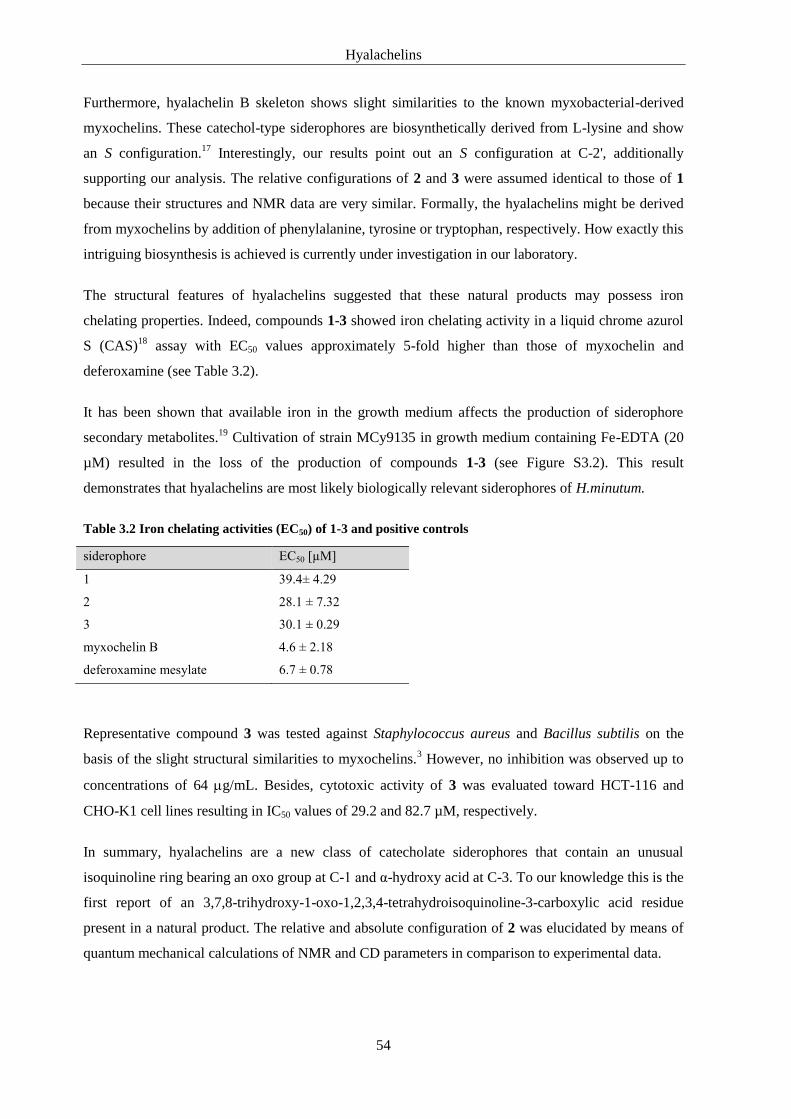
Hyalachelins
54
Furthermore, hyalachelin B skeleton shows slight similarities to the known myxobacterial-derived
myxochelins. These catechol-type siderophores are biosynthetically derived from L-lysine and show
an S configuration.17
Interestingly, our results point out an S configuration at C-2', additionally
supporting our analysis. The relative configurations of 2 and 3 were assumed identical to those of 1
because their structures and NMR data are very similar. Formally, the hyalachelins might be derived
from myxochelins by addition of phenylalanine, tyrosine or tryptophan, respectively. How exactly this
intriguing biosynthesis is achieved is currently under investigation in our laboratory.
The structural features of hyalachelins suggested that these natural products may possess iron
chelating properties. Indeed, compounds 1-3 showed iron chelating activity in a liquid chrome azurol
S (CAS)18
assay with EC50 values approximately 5-fold higher than those of myxochelin and
deferoxamine (see Table 3.2).
It has been shown that available iron in the growth medium affects the production of siderophore
secondary metabolites.19
Cultivation of strain MCy9135 in growth medium containing Fe-EDTA (20
µM) resulted in the loss of the production of compounds 1-3 (see Figure S3.2). This result
demonstrates that hyalachelins are most likely biologically relevant siderophores of H.minutum.
Table 3.2 Iron chelating activities (EC50) of 1-3 and positive controls
siderophore EC50 [µM]
1 39.4± 4.29
2 28.1 ± 7.32
3 30.1 ± 0.29
myxochelin B 4.6 ± 2.18
deferoxamine mesylate 6.7 ± 0.78
Representative compound 3 was tested against Staphylococcus aureus and Bacillus subtilis on the
basis of the slight structural similarities to myxochelins.3 However, no inhibition was observed up to
concentrations of 64 g/mL. Besides, cytotoxic activity of 3 was evaluated toward HCT-116 and
CHO-K1 cell lines resulting in IC50 values of 29.2 and 82.7 µM, respectively.
In summary, hyalachelins are a new class of catecholate siderophores that contain an unusual
isoquinoline ring bearing an oxo group at C-1 and α-hydroxy acid at C-3. To our knowledge this is the
first report of an 3,7,8-trihydroxy-1-oxo-1,2,3,4-tetrahydroisoquinoline-3-carboxylic acid residue
present in a natural product. The relative and absolute configuration of 2 was elucidated by means of
quantum mechanical calculations of NMR and CD parameters in comparison to experimental data.

Hyalachelins
55
The discovery of this new suite of secondary metabolites reconfirms the notion that unexplored
myxobacteria are a promising source of new scaffolds. It also highlights the abundant biosynthetic
capabilities of these gram-negative microorganisms.
3.3. References
[1] Sandy, M.; Butler, A. Chem. Rev. 2009, 109, 4580-4595.
[2] Kong, X.; Hider, R. C. Nat. Prod. Rep. 2010, 27, 637-657.
[3] Kunze, B.; Bedorf, N.; Kohl, W.; Höfle, G.; Reichenbach, H. J. Antibiot. 1989, 42, 14-17.
[4] Silakowski, B.; Kunze, B.; Nordsiek, G.; Blöcker, H.; Höfle, G.; Müller, R. Eur. J. Biochem. 2000, 267,
6476-6485.
[5] Kunze, B.; Trowitzsch-Kienast, W.; Höfle, G.; Reichenbach, H. J. Antibiot. 1992, 45, 147-150.
[6] Plaza, A.; Müller, R. In Natural Products: Discourse, Diversity, and Design; Osbourn, A., Goss, R.,
Carter, G.T., Eds.; John Wiley & Sons: 2014; Chapter 6, 103-124.
[7] Plaza, A.; Viehrig, K.; Garcia, R.; Müller, R. Organic Letters 2013, 15, 5882-5885.
[8] Plaza, A.; Garcia, R.; Bifulco, G.; Martinez, J. P.; Hüttel, S.; Sasse, F.; Meyerhans, A.; Stadler, M.; Müller,
R. Organic Letters 2012, 14, 2854-2857.
[9] Perez, M.; Crespo, C.; Schleissner, C.; Rodriguez, P.; Zuniga, P.; Reyes, F. J. Nat. Prod. 2009, 72, 2192-
2194.
[10] Okanya, P. W.; Mohr, K. I.; Gerth, K.; Kessler, W.; Jansen, R.; Stadler, M.; Müller, R. J. Nat. Prod. 2014,
77, 1420-1429.
[11] Cimino, P.; Duca, D.; Gomez-Paloma, L.; Riccio, R.; Bifulco, G. Magn. Reson. Chem. 2004, 42, S26–S33.
[12] Bifulco, G.; Dambruoso, P.; Gomez-Paloma, L.; Riccio, R. Chem. Rev. 2007, 107, 3744–3779. b) Bagno,
A.; Rastrelli, F.; Saielli, G. Chem. Eur. J. 2006, 12, 5514–5525.
[13] Gaussian 09, Revision D.01, Frisch, M. J.; Trucks, G. W.; Schlegel, H. B.; Scuseria, G. E.; Robb, M. A.;
Cheeseman, J. R.; Scalmani, G.; Barone, V.; Mennucci, B.; Petersson, G. A.; Nakatsuji, H.; Caricato, M.;
Li, X.; Hratchian, H. P.; Izmaylov, A. F.; Bloino, J.; Zheng, G.; Sonnenberg, J. L.; Hada, M.; Ehara, M.;
Toyota, K.; Fukuda, R.; Hasegawa, J.; Ishida, M.; Nakajima, T.; Honda, Y.; Kitao, O.; Nakai, H.; Vreven,
T.; Montgomery, J. A., Jr.; Peralta, J. E.; Ogliaro, F.; Bearpark, M.; Heyd, J. J.; Brothers, E.; Kudin, K. N.;
Staroverov, V. N.; Kobayashi, R.; Normand, J.; Raghavachari, K.; Rendell, A.; Burant, J. C.; Iyengar, S.
S.; Tomasi, J.; Cossi, M.; Rega, N.; Millam, N. J.; Klene, M.; Knox, J. E.; Cross, J. B.; Bakken, V.;
Adamo, C.; Jaramillo, J.; Gomperts, R.; Stratmann, R. E.; Yazyev, O.; Austin, A. J.; Cammi, R.; Pomelli,
C.; Ochterski, J. W.; Martin, R. L.; Morokuma, K.; Zakrzewski, V. G.; Voth, G. A.; Salvador, P.;
Dannenberg, J. J.; Dapprich, S.; Daniels, A. D.; Farkas, Ö.; Foresman, J. B.; Ortiz, J. V.; Cioslowski, J.;
Fox, D. J. Gaussian, Inc., Wallingford CT, 2009.
[14] Meissner, A.; Soerensen, O. W. Magn. Reson. Chem. 2001, 39, 49-52.
[15] Bringmann, G.; Bruhn, T.; Maksimenka, K.; Hemberger, Y. Eur. J. Org. Chem. 2009, 17, 2717–2727.
[16] Masullo, M.; Bassarello, C.; Bifulco, G.; Piacente, S. Tetrahedron 2010, 66, 139-145.
[17] Miyanaga, S.; Obata, T.; Onaka, H.; Fujita, T.; Saito, N.; Sakurai, H.; Saiki, I.; Furumai, T.; Igarashi, Y. J.
Antibiot. 2006, 59, 698-703.
[18] Schwyn, B.; Neilands, J. B. Analytical Biochemistry 1987, 160, 47-56.

Hyalachelins
56
[19] Metal Ions in Biological Systems: Iron Transport and Storage in Microorganisms, Plants, and Animals;
Sigel, A., Sigel, H., Eds.; Dekker: New York, 1998.

Hyalachelins
57
3.4. Supporting Informations
3.4.1. General Experimental Procedures
Optical rotations were measured at Jasco polarimeter, IR spectra were obtained on Perkin-Elmer FT-
IR Spectrum One spectrometer and UV spectra were recorded on an Agilent 8453 spectrophotometer.
NMR spectra were acquired on a Bruker Ascend 500 MHz and 700 MHz spectrometers equipped with
a 5 mm TXI cryoprobe in CD3OD and DMSO-d6 deuterated solvents. HSQC, HMBC, COSY,
TOCSY and ROESY spectra were recorded using standard pulse programs. LC-HRMS data were
obtained on a maXis 4G mass spectrometer (Bruker Daltonics, Germany) coupled with Dionex
Ultimate 3000 RSLC system, using a BEH C18, 100 x 2.1 mm, 1.7 mm dp column (Waters, Germany)
with linear gradient of 5-95% MeCN + 0.1% FA in H2O + 0.1% FA at 600 µL/min in 18 min with UV
detection in 200-600 nm range. Mass spectra were acquired using the ESI source in the range from
150–2000 m/z at 2 Hz scan speed. CD spectrum was recorded on a Jasco J-1500 CD spectrometer.
3.4.2. Isolation and Cultivation of Strain
Hyalangium minutum strain MCy9135 was isolated in May 2008 from a gift soil sample collected in
China. The strain appears on standard isolation set-up for myxobacteria by bacterial baiting method.
Series of subcultivations of sample taken from the colony edge led to the isolation of the strain.
Growth maintenance is performed by cultivation of the strain in MD1G liquid medium and by plating
on buffered yeast agar.1 Identification of the strain was performed by morphology characterization of
different growth stages and by 16S rDNA molecular-phylogenetic analysis. Strain MCy9135 shows
characteristic features of type strain Hyalangium minutum NOCB-2T and was determined to be in the
same cluster with 99.3% similarity suggesting that they belong to same species. The strain was
cultivated in MD1G medium (3 g/L casitone, 0.7 g/L CaCl2 x 2H2O, 2 g/L MgSO4 x 7H20 and 5 g/L
soluble starch) for up-scaled fermentation at 300C on rotary shaker at 180 rpm for 10d after 4% v/v
preculture inoculation.
3.4.3. Isolation of Hyalachelins
XAD and cell mass were harvested by centrifugation, lyophilized and subsequently defatted by 300
ml n-hexane which was followed by extraction with water/acetone 1:1 (v/v, three portions of 500 ml
mixture). The combined extracts were evaporated to yield 2 g of crude extract. A solvent-solvent
partition was further performed between n-butanol and water and the collected butanol layer was then
evaporated to obtain 1.7g crude butanol extract. This was further suspended in water/acetone 1:1
(v/v), centrifuged and fractionated by preparative HPLC using Waters AutoPurification system
equipped with XBridge Prep 19 x 150 mm, 5 µm dp C18 column. Linear gradient initiated with 10%
solvent B (MeCN + 0.1% FA) in solvent A (H2O + 0.1% FA) and increased to 45% B in 19 min with

Hyalachelins
58
25ml/min flow rate. The automatically collected fractions of interest were dried in Genevac EZ-2
evaporator and subsequently subjected to semi-preparative HPLC Agilent system for final purification
on Jupiter Proteo 90Å, 10 x 250 mm, 4 µm dp C12 column. Separation was achieved utilizing same
eluents as preparative HPLC with linear gradient started with 30% B and increased to 40% B over 20
min with 2.5 ml/min at 300C to afford pure compound 1 (tR = 8.4 min), 2 (tR = 12.9 min) and 3 (tR =
13.3 min).
3.4.4. CAS Assay
Iron chelating activity of hyalachelins was evaluated by chrome-azurol S (CAS) assay. The CAS
assay solution was prepared as previously described.2 For CAS assay, 50 µl of freshly prepared assay
solution was added into 96 well plate. Stock solutions (1 mM) of compound 1-3 were prepared in
20% MeOH in water and considered amount of which was added into CAS solution. Millipore water
was filled up to total assay volume of 100 µL that contain test compounds in 0, 2, 4, 8, 15, 30, 60,
125, 200 and 250 µM final concentrations. UV-vis absorbance was measured at the PHERAstar FS
microplate reader (BMG labtech) at 630 nm every 5 minutes for 30 minutes in total. Iron chelating
activity was determined as EC50 value which is the concentration of compound that reduces the
absorbance of CAS solution by 50% at 630 nm. EC50 value calculations were performed by OriginPro
8.5G software. CAS assays for myxochelin B and deferoxamine mesylate have been done
simultaneously in 0, 1, 2, 4, 8, 15, 20, 30 and 50 µM final concentrations.
Hyalachelin A (1): colorless amorphous solid, [α]20
D + 35.9 (c 0.06, MeOH), IR (film) νmax 3356,
2921, 1595, 1445, 1381, 1261, 1023 cm-1
, UV (ACN) λmax 206, 256, 320 nm, 1H and
13C NMR data
see Table S3.1, HR-ESI-MS m/z 582.2074 [M+H]+
(calcd for C29H32N3O10, 582.2088)
Hyalachelin B (2): colorless amorphous solid, [α]20
D + 16.5 (c 0.12, MeOH), IR (film) νmax 3281,
2970, 1738, 1598, 1445, 1365, 1217 cm-1
, UV (ACN) λmax 208, 256, 320 nm, 1H and
13C NMR data
see Table S3.2 and S3.3, HR-ESI-MS m/z 566.2127 [M+H]+
(calcd for C29H32N3O9, 566.2139)
Hyalachelin C (3): colorless amorphous solid, [α]20
D + 14.4 (c 0.06, MeOH), IR (film) νmax 3344,
2941, 1737, 1595, 1456, 1368, 1227, 1046 cm-1
, UV (ACN) λmax 224, 256, 320 nm, 1H and
13C NMR
data see Table S3.4, HR-ESI-MS m/z 605.2235 [M+H]+
(calcd for C31H33N4O9, 605.2248)

Hyalachelins
59
Figure S3.1 MSn fragmentation data of hyalachelin A (1)
Figure S3.2 LC-MS extracted ion chromatograms (EIC) of hyalachelins A-C (1-3) in crude extract of MCy9135
cultivated in MD1G medium with presence of 20 µM Fe-EDTA (bottom) in comparison with culture
without additional iron as control (top).
150 200 250 300 350 400 450 500 550 600
m/z
0
20
40
60
80
100
0
20
40
60
80
100
Re
lative
Ab
un
da
nce
0
20
40
60
80
100564.19623
196.53433 278.57202 600.96881460.70685377.20102 536.12115433.99512252.40675161.71750 486.31689344.53745
503.18137
547.17139
520.20813
428.18155196.53944 251.13760 384.19141 471.75555290.72906 320.99686168.54420 571.28717
367.16498
270.07571
234.11230196.54430 540.18231321.07431 414.57422 573.58740385.60254
464.26553283.87494 497.59470170.46942341.64850
NL: 8.39E5
Hy001_175-1_mz582_02#26 RT: 0.39 AV: 1 T: FTMS + c NSI Full ms3 [email protected] [email protected] [155.00-620.00]
NL: 6.03E5
Hy001_175-1_mz582_02#58 RT: 0.93 AV: 1 T: FTMS + c NSI Full ms3 [email protected] [email protected] [155.00-620.00]
NL: 1.90E5
Hy001_175-1_mz582_02#79 RT: 1.31 AV: 1 F: FTMS + c NSI Full ms4 [email protected] [email protected] [email protected] [135.00-620.00]
4.5 5.0 5.5 Time [min]
2
6.0 6.5 7.0 Time [min] 5.0 5.5 6.0 6.5 Time [min]
1 3
EIC 566.2
control
+Fe-EDTA
EIC 582.2 EIC 605.2

Hyalachelins
60
Table S3.1 NMR data of hyalachelin A (1) in CD3OD
pos δHa, mult (J in Hz) δC
b HMBC
c COSY
d ROESY
e
1 172.3
2
3 94.3
4 4.70, s 52.2 3, 5, 6, 10, 11, 1''', 2''', 6''' 10, 2''', 6'''
5 132.1
6 113.0
7 150.6
8 145.3
9 6.80, d (8.2) 120.1 5, 7, 8 10
10 6.12, d (8.2) 118.4 1, 4, 6, 7, 8 9 4
11 175.2
1'a 3.87, t (11.7) 41.3 2' 1'b, 2'
1'b 3.13, dd (12.5, 3.3) 1'a, 2'
2' 3.51, m 59.6 1, 3, 1', 3', 4' 1'a, 1'b, 3'a,
3'b
3'a 2.16, m 31.5 1', 2', 4', 5' 2', 3'b, 4'
3'b 2.03, m 2', 4' 2', 3'a, 4'
4'a 1.41, m 25.1 2', 3', 6' 3'a, 3'b, 4'b, 5'
4'b 1.36, m 3'a, 4'a
5' 1.60, m 30.0 3', 4', 6' 4'a, 4'b, 6'a,
6'b
6'a 3.36, m 40.1 4', 5', 7'' 5'
6'b 3.31, m 5'
1'' 116.5
2'' 150.1
3'' 147.0
4'' 6.90, dd (8.0, 1.0) 119.3 2'', 3'', 6'' 5''
5'' 6.68, t (8.0) 119.3 1'', 3'', 6'' 4'', 6''
6'' 7.17, d (8.0) 118.4 1'', 2'', 4'', 5'', 7'' 5''
7'' 171.2
1''' 128.4
2''', 6''' 7.17, d (8.5) 133.4 4, 1''', 4'' 3''', 5''' 10
3''', 5''' 6.72, d (8.5) 115.6 1''', 4''' 2''', 6'''
4''' 157.8
arecorded at 700 MHz, referenced to residual CD3OD at δ 3.31 ppm
brecorded at 175 MHz, referenced to residual CD3OD at δ 49.15 ppm
cproton showing HMBC correlation to indicated carbon
dproton showing COSY correlation to indicated proton
eproton showing ROESY correlation to indicated proton

Hyalachelins
61
Table S3.2 NMR data of hyalachelin B (2) in CD3OD
pos δHa, mult (J in Hz) δC
b
1 172.5
2
3 94.2
4 4.79, s 53.0
5 131.6
6 113.0
7 150.7
8 145.5
9 6.80, d (8.2) 120.1
10 6.07, d (8.2) 118.4
11 175.2
1'a 3.88, t (11.7) 41.4
1'b 3.14, dd (12.5, 3.3)
2' 3.53, m 59.4
3'a 2.16, m 31.5
3'b 2.03, m
4'a 1.40, m 25.2
4'b 1.36, m
5' 1.60, m 29.9
6'a 3.34, m 40.0
6'b 3.31, m
1'' 116.5
2'' 150.3
3'' 147.2
4'' 6.90, dd (8.0, 1.0) 119.0
5'' 6.68, t (8.0) 119.3
6'' 7.17, d (8.0) 118.4
7'' 171.4
1''' 138.1
2''', 6''' 7.36, d (8.5) 132.4
3''', 5''' 7.28c 128.5
4''' 7.29c 128.8
arecorded at 700 MHz, referenced to residual CD3OD at δ 3.31 ppm
brecorded at 175 MHz, referenced to residual CD3OD at δ 49.15 ppm
coverlapping signals

Hyalachelins
62
Table S3.3 NMR data of hyalachelin B (2) in DMSO-d6
pos δHa, mult (J in Hz) δC
b HMBC
e COSY
f
1 c
2
3 91.8
4 4.71, s 50.7 3, 6, 5, 1''', 2'''
5 130.5
6 111.8
7 149.0
8 143.8
9 6.76, d (8.2) 118.8 5, 7, 8 10
10 5.84, d (8.2) 116.1 4, 6, 8 9
11 c
1'a 3.58, t (11.2) 39.0 1'b, 2'
1'b 2.97, dd (11.2, 4.1) 1'a, 2'
2' 3.42, m 57.6 1'a, 1'b, 3'
3' 1.92, m 29.7 4' 2', 4'
4' 1.26, m 23.7 2', 3', 6' 3', 5'
5' 1.41, m 29.1 4', 6' 4', 6'
6' 3.17, m 37.7 4', 5' 5'
1'' c
2'' c
3'' c
4'' c
c
5'' c
c
6'' 7.08, d (7.7) 118.1
7'' 168.6
1''' 137.4
2''', 6''' 7.25d 130.8 4, 1'''
3''', 5''' 7.26d 127.1 1'''
4''' 7.23d 126.6 2''', 3'''
arecorded at 700 MHz, referenced to residual DMSO-d6 at δ 2.50 ppm
brecorded at 175 MHz, referenced to residual DMSO-d6 at δ 39.51 ppm
cnot observed
doverlapping signals
eproton showing HMBC correlation to indicated carbon
fproton showing COSY correlation to indicated proton
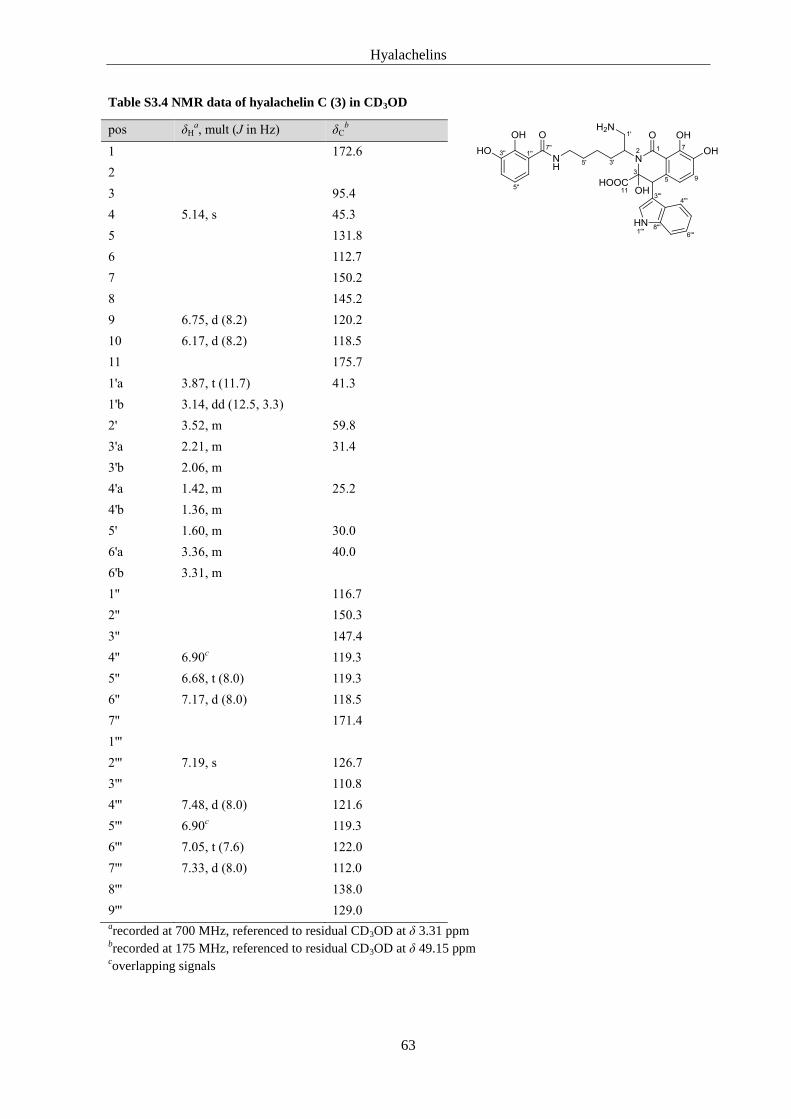
Hyalachelins
63
Table S3.4 NMR data of hyalachelin C (3) in CD3OD
pos δHa, mult (J in Hz) δC
b
1 172.6
2
3 95.4
4 5.14, s 45.3
5 131.8
6 112.7
7 150.2
8 145.2
9 6.75, d (8.2) 120.2
10 6.17, d (8.2) 118.5
11 175.7
1'a 3.87, t (11.7) 41.3
1'b 3.14, dd (12.5, 3.3)
2' 3.52, m 59.8
3'a 2.21, m 31.4
3'b 2.06, m
4'a 1.42, m 25.2
4'b 1.36, m
5' 1.60, m 30.0
6'a 3.36, m 40.0
6'b 3.31, m
1'' 116.7
2'' 150.3
3'' 147.4
4'' 6.90c 119.3
5'' 6.68, t (8.0) 119.3
6'' 7.17, d (8.0) 118.5
7'' 171.4
1'''
2''' 7.19, s 126.7
3''' 110.8
4''' 7.48, d (8.0) 121.6
5''' 6.90c 119.3
6''' 7.05, t (7.6) 122.0
7''' 7.33, d (8.0) 112.0
8''' 138.0
9''' 129.0 arecorded at 700 MHz, referenced to residual CD3OD at δ 3.31 ppm
brecorded at 175 MHz, referenced to residual CD3OD at δ 49.15 ppm
coverlapping signals

Hyalachelins
64
Figure S3.3 The four relative stereoisomers 2a, 2b, 2c and 2d of hyalachelin B (2)
3.4.5. Computational Details
Chemical structures of the four possible relative stereoisomers of 2: 2a (2'S*,3R*,4R*), 2b
(2'S*,3S*,4R*), 2c (2'S*,3R*,4S*), and 2d (2'S*,3S*,4S*) (see Figure S3.3) were built using Maestro
9.63 and optimized through the MacroModel 10.2
4 software package, using the OPLS force field and
the Polak-Ribier conjugate gradient algorithm (PRCG, maximum derivative less than 0.001 kcal/mol).
Starting from the obtained 3D structures, exhaustive conformational searches were performed at the
empirical molecular mechanics (MM) level following the subsequent scheme:
a) Monte Carlo Multiple Minimum (MCMM) method (50,000 steps) of the MacroModel 10.2 package
was used in order to allow a full exploration of the conformational space;
b) Low mode Conformational Search (LMCS) method (50,000 steps) as implemented in MacroModel
10.2 software was used to integrate the conformational sampling.
For each stereoisomer, all the obtained conformers were then minimized (PRCG, maximum derivative
less than 0.001 kcal/mol) and compared. The selection of non-redundant conformers was performed
using the “Redundant Conformer Elimination” module of Macromodel 10.2, choosing a 1.0 Å RMSD
(root-mean-square deviation) minimum cutoff for saving structures and excluding the conformers
differing more than 13.0 kJ/mol (3.11 kcal/mol) from the most energetically favored conformation. In
this way, we obtained 17 conformers for 2a, 10 for 2b, 11 for 2c, and 19 for 2d.

Hyalachelins
65
Next, the obtained conformations of 2a, 2b, 2c, 2d were optimized at quantum mechanical (QM) level
by using the MPW1PW91 functional and the 6-31G(d) basis set. Experimental solvent effects
(DMSO) were reproduced using the integral equation formalism version of the polarizable continuum
model (IEFPCM). On the obtained geometries, the MPW1PW91 functional and the 6-31G(d,p) basis
set and IEFPCM were used for calculating the 1H and
13C chemical shifts. The final
13C and
1H NMR
spectra for each of the investigated stereoisomers were built considering the influence of each
conformer on the total Boltzmann distribution taking into account the relative energies. Calibration of
calculated 13
C and 1H chemical shifts was performed following the multi-standard approach (MSTD)
as reported by Pellegrinet et al.;5 in particular, aromatic
13C and
1H chemical shifts were scaled using
benzene as reference compound, while we considered C-1 and C-2 of ethylamine for C-1' and C-2',
respectively. All the other 13
C and 1H calculated chemical shifts were scaled to TMS
(tetramethylsilane) (see Table S3.5 and Table S3.6).
For each relative stereoisomer, starting from the most energetically favored QM optimized conformer,
2JC-H heteronuclear coupling constants value for C-3 and H-4 was calculated accounting the Fermi
contact (FC) contributions by adding tighter polarization functions for the s and d orbitals to the
original 6-311+G(d,p) basis set, which was accomplished in Gaussian 09 with the “mixed” keyword.
Regarding CD spectra calculations, in order to reproduce the experimental solvent environment
(methanol), all the conformers previously obtained from MM calculations were optimized at the QM
level by using the MPW1PW91 functional and the 6-31G(d) basis set, in methanol IEFPCM. Then,
CD calculations were performed at TDDFT MPW1PW91/6-31g(d,p) level. The final CD spectra for
each of the investigated relative stereoisomers were built considering the influence of each conformer
on the total Boltzmann distribution taking into account the relative energies, and were graphically
plotted using SpecDis software. In order to simulate the experimental CD curve, a Gaussian band-
shape function was applied with the exponential half-width (σ/γ) of 0.26 eV.6
All QM calculations were performed using Gaussian 09 software package.

Hyalachelins
66
Table S3.5 1H NMR experimental and calculated chemical shifts for 2a, 2b, 2c, and 2d with |Δδ|(
1H) and
MAE values.
δcalc (1H), ppm δexp (
1H), ppm |Δδ|(
1H), ppm
a
Position 2a 2b 2c 2d 2a 2b 2c 2d
4 4.23 4.65 4.21 4.45 4.71 0.48 0.06 0.50 0.26
9 6.58b 6.59
b 6.63
b 6.50
b 6.76 0.18 0.17 0.13 0.26
10 6.11b 5.92
b 5.93
b 6.19
b 5.84 0.27 0.08 0.09 0.35
1'a 3.35 3.49 3.43 3.46 3.58 0.23 0.09 0.15 0.12
1'b 2.51 2.92 3.28 2.91 2.97 0.46 0.05 0.31 0.06
2' 4.05 2.94 2.71 3.42 3.42 0.63 0.48 0.71 0.00
3' 2.27 1.99 2.49 2.19 1.92 0.35 0.07 0.57 0.27
4' 1.38 1.22 1.55 1.75 1.26 0.12 0.04 0.29 0.49
5' 1.61 1.84 1.83 1.61 1.41 0.20 0.43 0.42 0.20
6' 3.37 3.37 3.74 3.62 3.17 0.20 0.20 0.57 0.45
2''' 7.48b 7.31
b 7.24
b 7.50
b 7.25 0.23 0.06 0.01 0.25
3''' 7.45b 7.35
b 7.35
b 7.37
b 7.23 0.22 0.12 0.12 0.14
4''' 7.43b 7.39
b 7.39
b 7.37
b 7.26 0.17 0.13 0.13 0.11
MAEc 0.29 0.15 0.31 0.23
a |Δδ|(
1H) = |δexp –δcalc| (
1H), ppm: absolute differences for experimental versus calculated
1H NMR chemical
shifts
b 1H calculated values were referenced to benzene H, following the multi-standard approach (MSTD);
3 all the
remaining calculated values were referenced to TMS (tetramethylsilane).
c MAE = Σ[|(δexp – δcalcd)|]/n, summation through n of the absolute error values (difference of the absolute values
between corresponding experimental and 1H chemical shifts), normalized to the number of the chemical shifts
considered
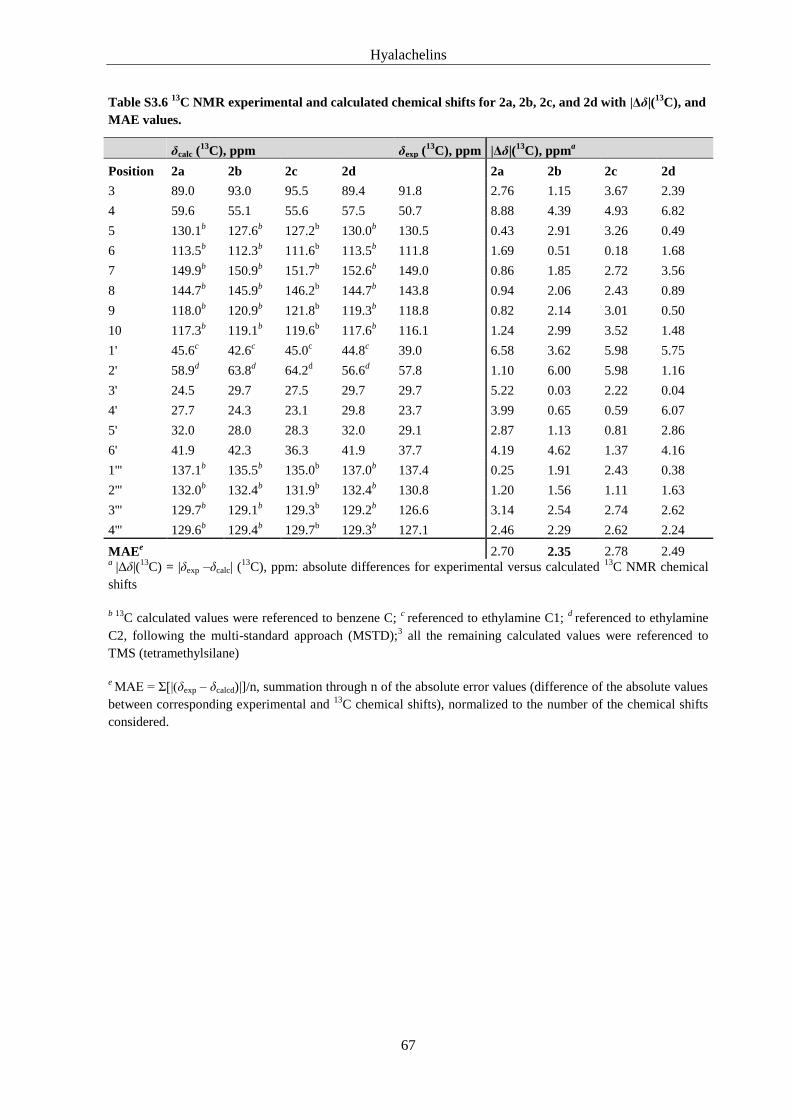
Hyalachelins
67
Table S3.6 13
C NMR experimental and calculated chemical shifts for 2a, 2b, 2c, and 2d with |Δδ|(13
C), and
MAE values.
δcalc (
13C), ppm δexp (
13C), ppm |Δδ|(
13C), ppm
a
Position 2a 2b 2c 2d
2a 2b 2c 2d
3 89.0 93.0 95.5 89.4 91.8 2.76 1.15 3.67 2.39
4 59.6 55.1 55.6 57.5 50.7 8.88 4.39 4.93 6.82
5 130.1b 127.6
b 127.2
b 130.0
b 130.5 0.43 2.91 3.26 0.49
6 113.5b 112.3
b 111.6
b 113.5
b 111.8 1.69 0.51 0.18 1.68
7 149.9b 150.9
b 151.7
b 152.6
b 149.0 0.86 1.85 2.72 3.56
8 144.7b 145.9
b 146.2
b 144.7
b 143.8 0.94 2.06 2.43 0.89
9 118.0b 120.9
b 121.8
b 119.3
b 118.8 0.82 2.14 3.01 0.50
10 117.3b 119.1
b 119.6
b 117.6
b 116.1 1.24 2.99 3.52 1.48
1' 45.6c 42.6
c 45.0
c 44.8
c 39.0 6.58 3.62 5.98 5.75
2' 58.9d 63.8
d 64.2
d 56.6
d 57.8 1.10 6.00 5.98 1.16
3' 24.5 29.7 27.5 29.7 29.7 5.22 0.03 2.22 0.04
4' 27.7 24.3 23.1 29.8 23.7 3.99 0.65 0.59 6.07
5' 32.0 28.0 28.3 32.0 29.1 2.87 1.13 0.81 2.86
6' 41.9 42.3 36.3 41.9 37.7 4.19 4.62 1.37 4.16
1''' 137.1b 135.5
b 135.0
b 137.0
b 137.4 0.25 1.91 2.43 0.38
2''' 132.0b 132.4
b 131.9
b 132.4
b 130.8 1.20 1.56 1.11 1.63
3''' 129.7b 129.1
b 129.3
b 129.2
b 126.6 3.14 2.54 2.74 2.62
4''' 129.6b 129.4
b 129.7
b 129.3
b 127.1 2.46 2.29 2.62 2.24
MAEe 2.70 2.35 2.78 2.49
a |Δδ|(
13C) = |δexp –δcalc| (
13C), ppm: absolute differences for experimental versus calculated
13C NMR chemical
shifts
b 13C calculated values were referenced to benzene C;
c referenced to ethylamine C1;
d referenced to ethylamine
C2, following the multi-standard approach (MSTD);3 all the remaining calculated values were referenced to
TMS (tetramethylsilane)
e MAE = Σ[|(δexp – δcalcd)|]/n, summation through n of the absolute error values (difference of the absolute values
between corresponding experimental and 13
C chemical shifts), normalized to the number of the chemical shifts
considered.
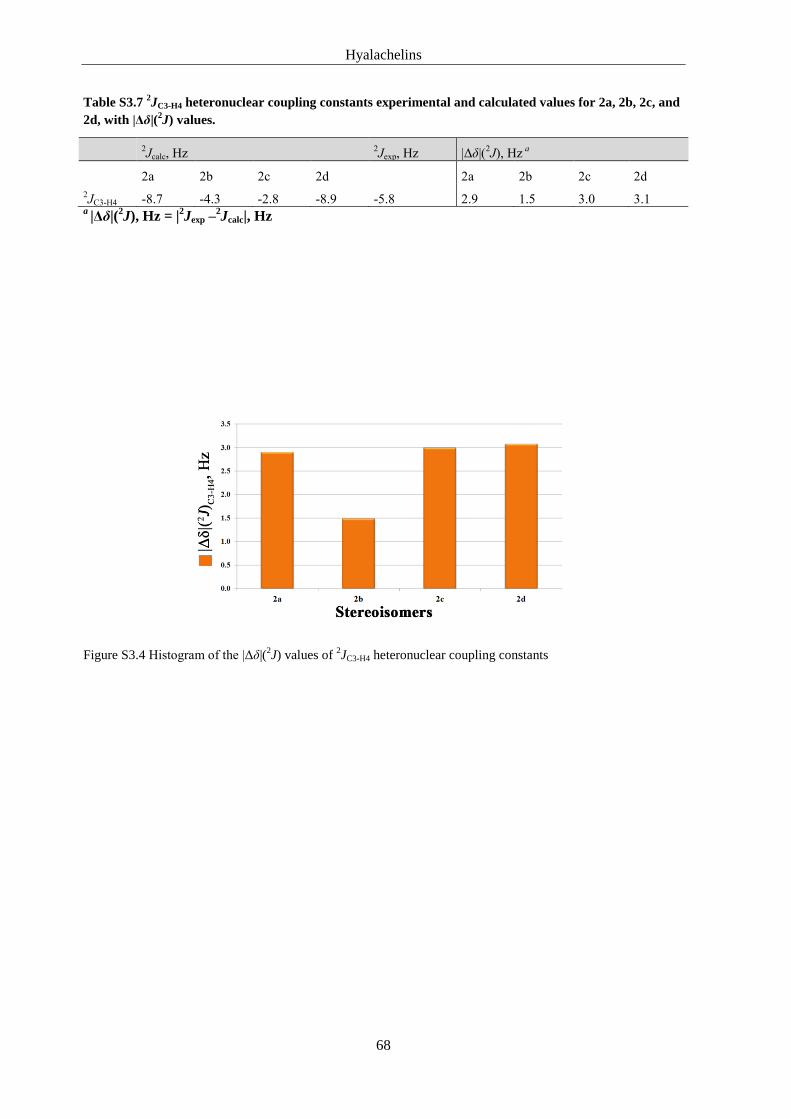
Hyalachelins
68
Table S3.7 2JC3-H4 heteronuclear coupling constants experimental and calculated values for 2a, 2b, 2c, and
2d, with |Δδ|(2J) values.
2Jcalc, Hz
2Jexp, Hz |Δδ|(
2J), Hz
a
2a 2b 2c 2d 2a 2b 2c 2d
2JC3-H4 -8.7 -4.3 -2.8 -8.9 -5.8 2.9 1.5 3.0 3.1
a |Δδ|(
2J), Hz = |
2Jexp –
2Jcalc|, Hz
Figure S3.4 Histogram of the |Δδ|(2J) values of
2JC3-H4 heteronuclear coupling constants

Hyalachelins
69
Figure S3.5 Comparison of experimental CD spectrum and calculated CD spectra of 2'S,3R,4R; 2'R,3S,4S;
2'S,3R,4S; 2'R,3S,4R; 2'S,3S,4S, and 2'R,3R,4R.

Hyalachelins
70
3.5. References of Supporting Information
[1] Garcia, R. O.; Krug, D.; Müller, R. In Methods in Enzymology; Hopwood D.A., Ed., Complex Enzymes in
Microbial Natural Product Biosynthesis, Vol 458, Part A; Academic: Burlington, 2009; pp 59-91.
[2] Schwyn, B.; Neilands, J. B. Analytical Biochemistry 1987, 160, 47-56.
[3] Schrödinger, LLC: New York, NY, 2013.
[4] MacroModel, version 10.2, Schrödinger LLC, New York, NY, 2013.
[5] Sarotti, A. M.; Pellegrinet, S. C. J. Org. Chem. 2009, 74, 7254–7260.
[6] Bruhn, T.; Schaumlöffel, A.; Hemberger, Y.; Bringmann, G.; SpecDis version 1.61, University of
Wuerzburg, Germany, 2013.
[7] Gaussian 09, Revision D.01, Frisch, M. J.; Trucks, G. W.; Schlegel, H. B.; Scuseria, G. E.; Robb, M. A.;
Cheeseman, J. R.; Scalmani, G.; Barone, V.; Mennucci, B.; Petersson, G. A.; Nakatsuji, H.; Caricato, M.;
Li, X.; Hratchian, H. P.; Izmaylov, A. F.; Bloino, J.; Zheng, G.; Sonnenberg, J. L.; Hada, M.; Ehara, M.;
Toyota, K.; Fukuda, R.; Hasegawa, J.; Ishida, M.; Nakajima, T.; Honda, Y.; Kitao, O.; Nakai, H.; Vreven,
T.; Montgomery, J. A., Jr.; Peralta, J. E.; Ogliaro, F.; Bearpark, M.; Heyd, J. J.; Brothers, E.; Kudin, K. N.;
Staroverov, V. N.; Kobayashi, R.; Normand, J.; Raghavachari, K.; Rendell, A.; Burant, J. C.; Iyengar, S.
S.; Tomasi, J.; Cossi, M.; Rega, N.; Millam, N. J.; Klene, M.; Knox, J. E.; Cross, J. B.; Bakken, V.;
Adamo, C.; Jaramillo, J.; Gomperts, R.; Stratmann, R. E.; Yazyev, O.; Austin, A. J.; Cammi, R.; Pomelli,
C.; Ochterski, J. W.; Martin, R. L.; Morokuma, K.; Zakrzewski, V. G.; Voth, G. A.; Salvador, P.;
Dannenberg, J. J.; Dapprich, S.; Daniels, A. D.; Farkas, Ö.; Foresman, J. B.; Ortiz, J. V.; Cioslowski, J.;
Fox, D. J. Gaussian, Inc., Wallingford CT, 2009.
Cystochromones
71
Chapter 4
Cystochromones, Unusual Chromone-Containing Polyketides from the
Myxobacterium Cystobacter sp. MCy9104
Suvd Nadmid,†,§
Alberto Plaza,†,§,‡
Ronald Garcia,†,§
and Rolf Müller†,§,*
Journal of Natural Products, submitted

Cystochromones
72
4. Cystochromones
4.1. Abstract
Seven new chromone-containing polyketides, termed cystochromones A-G, were isolated from the
myxobacterial strain Cystobacter sp. MCy9104. Their structures were elucidated by comprehensive
NMR spectroscopy and HR-MS/MS. Cystochromones bear a pentadecyl moiety unusually attached at
C-5 of the chromone ring. Moreover, feeding experiments and NMR analysis suggested a hybrid iso-
fatty acid and polyketide synthase biosynthetic pathway for these secondary metabolites.
4.2. Main Text
Over the past years, myxobacteria have attracted the attention of the scientific community due to their
enormous biosynthetic capabilities and the potent biological activity of their secondary metabolites.1,2
The investigation of these gram negative bacteria has resulted in numerous lead structures with
diverse biological activities, including the HIV inhibitors aetheramides,3 the unusual catecholate type
of siderophores hyalachelins,4 and the potent antibiotics disciformycins
5 and cystobactamides.
6
During our ongoing screening program aimed at the discovery of novel metabolites from terrestrial
myxobacteria, strain MCy9104 Cystobacter sp. stood out due to its LC-HR-MS chromatographic
profile which showed a number of unreported metabolites. Herein, we report the isolation, structure
elucidation, and first insights into the biosynthesis of a new group of chromone-containing natural
products, named cystochromones A-G (1-7). Their structures were elucidated by a combination of
HR-MS/MS and 2D NMR experiments. Moreover, a biosynthetic scheme was proposed on the basis
of results from feeding experiments employing isotopically labeled precursors.
4.3. Results and Discussion
The myxobacterial strain MCy9104 was cultivated in CLF production medium in the presence of
2.5% v/v of the neutral adsorber resin Amberlite XAD-16. After 10 days the resin was harvested by
sieving, lyophilized, defatted with hexane, and subsequently extracted with ethyl acetate. The
resultant dark brown oily crude extract was fractionated by size exclusion chromatography, and
further subjected to semi preparative HPLC yielding seven new chromone derivatives, termed
cystochromones A-G (1-7).

Cystochromones
73
HR-ESI-MS of cystochromone A (1) gave a molecular ion at m/z 459.3115 [M+H]+ corresponding to
a molecular formula of C28H43O5 requiring eight degrees of unsaturation. 1H-NMR spectrum of 1
exhibited two doublets ascribable to two meta coupled aromatic protons at δ 6.65 (1H, d, J = 2.3 Hz,
H-6) and 6.63 (1H, d, J = 2.3 Hz, H-8), an olefinic singlet at δ 6.07 (1H, s, H-3), a downfield shifted
methylene singlet at δ 3.60 (2H, s, H-3'), and two singlets corresponding to three methyl groups at δ
2.26 (3H, s, H-1') and 1.21 (6H, s, H-15''/H-16'') (Table 4.1). Additionally, highly overlapped signals
corresponding to methylene protons were observed at δ 1.25-1.35 (H-3'' – H-12'') indicating the
presence of a saturated alkyl chain. 13
C-NMR spectrum of 1 showed signals corresponding to two
carbonyls at δ 201.8 (C-2') and 179.3 (C-4), three oxygenated aromatic quaternary carbons at δ 160.21
(C-7), 160.19 (C-9) and 159.4 (C-2), an oxygenated sp3 quaternary carbon at δ 72.0 (C-14''), and
overlapped carbon resonances at δ 29-30 (C-3'' – C-12'') (Table 4.1).
Analysis of the HMBC correlations from the olefinic proton H-3, and the aromatic protons H-6 and
H-8 established the occurrence of a 2,5,7-trisubstituted chromone ring (Figure 4.1). Furthermore, long
range correlations from the proton signal at δ 3.60 (H-3') to the ketone carbonyl at δ 201.8 (C-2') and
to the methyl carbon at δ 29.7 (C-1') revealed the presence of a propan-2-one moiety. Connectivity of
the propan-2-one moiety to the chromone ring was deduced via long range correlations from H-3' to
the aromatic carbons at δ 159.4 (C-2) and 113.7 (C-3) (Figure 4.1). The structure of the remaining
C16H33O unit was established as 2-methylpentadecan-2-ol residue (C-1'' – C-16'') on the basis of
HMBC and COSY correlations. Linkage of this saturated alkyl chain to the chromone ring was
secured by strong HMBC correlations from the equivalent methylene protons at δ 3.18 (H-1'') to the
aromatic carbon resonances at δ 148.4 (C-5), 116.5 (C-6), and 115.3 (C-10) (Figure 4.1). Thereby, the

Cystochromones
74
planar structure of 1 was established as a chromone ring bearing an alkyl chain in position C-5 and a
propane-2-one moiety at C-2.
Figure 4.1 Key HMBC (arrow) and COSY (bold line) correlations of 1
HR-ESI-MS supported the molecular formulae C28H43O4 and C28H43O6 for cystochromone B (2) and C
(3), respectively. Detailed analysis of 2D NMR data of 2 and 3 in comparison to that of 1 clearly
indicated that cystochromone B and C were the 14''-deoxy and 15''-hydroxy derivatives of 1,
respectively (Table S4.2).
Cystochromone D (4) showed a molecular ion peak at m/z 491.3001 [M+H]+ ascribable to a molecular
formula of C28H43O7. The HSQC spectrum of 4 closely resembled to that of 1 only differing by the
existence of two additional oxymethine signals (δH-2' 4.19, δC-2' 66.1 and δH-8'' 4.06, δC-8'' 77.9) (Table
4.1). Moreover, COSY correlations observed between protons H-1'/H-2'/H-3' established the presence
of a propan-2-ol moiety (Figure 4.2). In turn, HMBC correlations from methylene protons H-3' to the
carbons C-2 and C-3, together with HMBC correlations from H-2' to C-2 linked the propanol moiety
to C-2 of the chromone ring (Figure 4.2).
Figure 4.2 Key COSY (bold line) and HMBC (arrow) correlations of 4
HMBC, COSY correlations, and MS2 fragmentation experiment allowed us to identify the alkyl chain
of 4 as 8,14-dihydroxy-14-methylpentadecan-7-one. In particular, HMBC correlations from the
methylene protons H-9'' (δ 1.53, 1.72), H-6'' (δ 2.55), and H-5'' (δ 1.58), and from the oxymethine
proton H-8'' (δ 4.06) to the ketone carbon resonance at δ 215.2 (C-7'') determined the presence of an
α-ketol functionality (Figure 4.2). The exact position of this functionality was proposed by an ESI-
MS2 fragmentation experiment. Indeed, the ESI-MS
2 spectrum of the molecular ion peak at m/z 491
[M+H]+ gave a daughter ion peak at m/z 455 [M+H-36]
+ corresponding to loss of two water
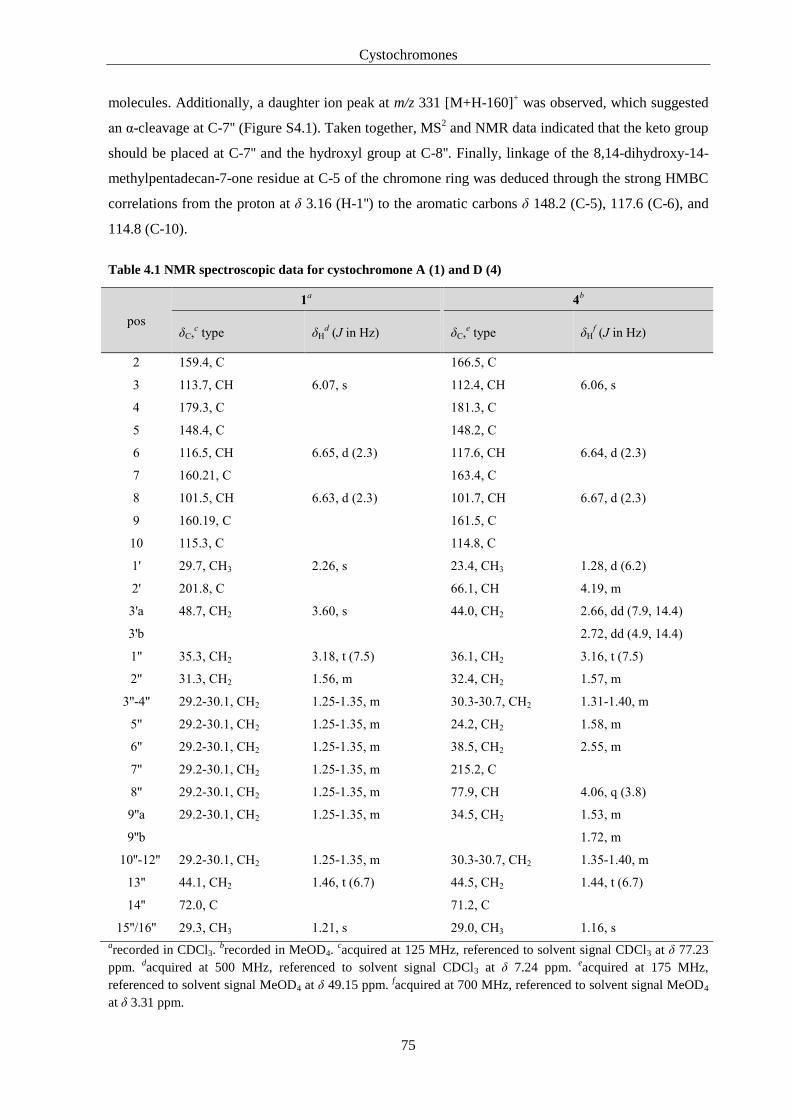
Cystochromones
75
molecules. Additionally, a daughter ion peak at m/z 331 [M+H-160]+ was observed, which suggested
an α-cleavage at C-7'' (Figure S4.1). Taken together, MS2 and NMR data indicated that the keto group
should be placed at C-7'' and the hydroxyl group at C-8''. Finally, linkage of the 8,14-dihydroxy-14-
methylpentadecan-7-one residue at C-5 of the chromone ring was deduced through the strong HMBC
correlations from the proton at δ 3.16 (H-1'') to the aromatic carbons δ 148.2 (C-5), 117.6 (C-6), and
114.8 (C-10).
Table 4.1 NMR spectroscopic data for cystochromone A (1) and D (4)
pos
1a 4
b
δC,c type δH
d (J in Hz) δC,
e type δH
f (J in Hz)
2 159.4, C 166.5, C
3 113.7, CH 6.07, s 112.4, CH 6.06, s
4 179.3, C 181.3, C
5 148.4, C 148.2, C
6 116.5, CH 6.65, d (2.3) 117.6, CH 6.64, d (2.3)
7 160.21, C 163.4, C
8 101.5, CH 6.63, d (2.3) 101.7, CH 6.67, d (2.3)
9 160.19, C 161.5, C
10 115.3, C 114.8, C
1' 29.7, CH3 2.26, s 23.4, CH3 1.28, d (6.2)
2' 201.8, C 66.1, CH 4.19, m
3'a 48.7, CH2 3.60, s 44.0, CH2 2.66, dd (7.9, 14.4)
3'b 2.72, dd (4.9, 14.4)
1'' 35.3, CH2 3.18, t (7.5) 36.1, CH2 3.16, t (7.5)
2'' 31.3, CH2 1.56, m 32.4, CH2 1.57, m
3''-4'' 29.2-30.1, CH2 1.25-1.35, m 30.3-30.7, CH2 1.31-1.40, m
5'' 29.2-30.1, CH2 1.25-1.35, m 24.2, CH2 1.58, m
6'' 29.2-30.1, CH2 1.25-1.35, m 38.5, CH2 2.55, m
7'' 29.2-30.1, CH2 1.25-1.35, m 215.2, C
8'' 29.2-30.1, CH2 1.25-1.35, m 77.9, CH 4.06, q (3.8)
9''a 29.2-30.1, CH2 1.25-1.35, m 34.5, CH2 1.53, m
9''b 1.72, m
10''-12'' 29.2-30.1, CH2 1.25-1.35, m 30.3-30.7, CH2 1.35-1.40, m
13'' 44.1, CH2 1.46, t (6.7) 44.5, CH2 1.44, t (6.7)
14'' 72.0, C 71.2, C
15''/16'' 29.3, CH3 1.21, s 29.0, CH3 1.16, s
arecorded in CDCl3.
brecorded in MeOD4.
cacquired at 125 MHz, referenced to solvent signal CDCl3 at δ 77.23
ppm. dacquired at 500 MHz, referenced to solvent signal CDCl3 at δ 7.24 ppm.
eacquired at 175 MHz,
referenced to solvent signal MeOD4 at δ 49.15 ppm. facquired at 700 MHz, referenced to solvent signal MeOD4
at δ 3.31 ppm.
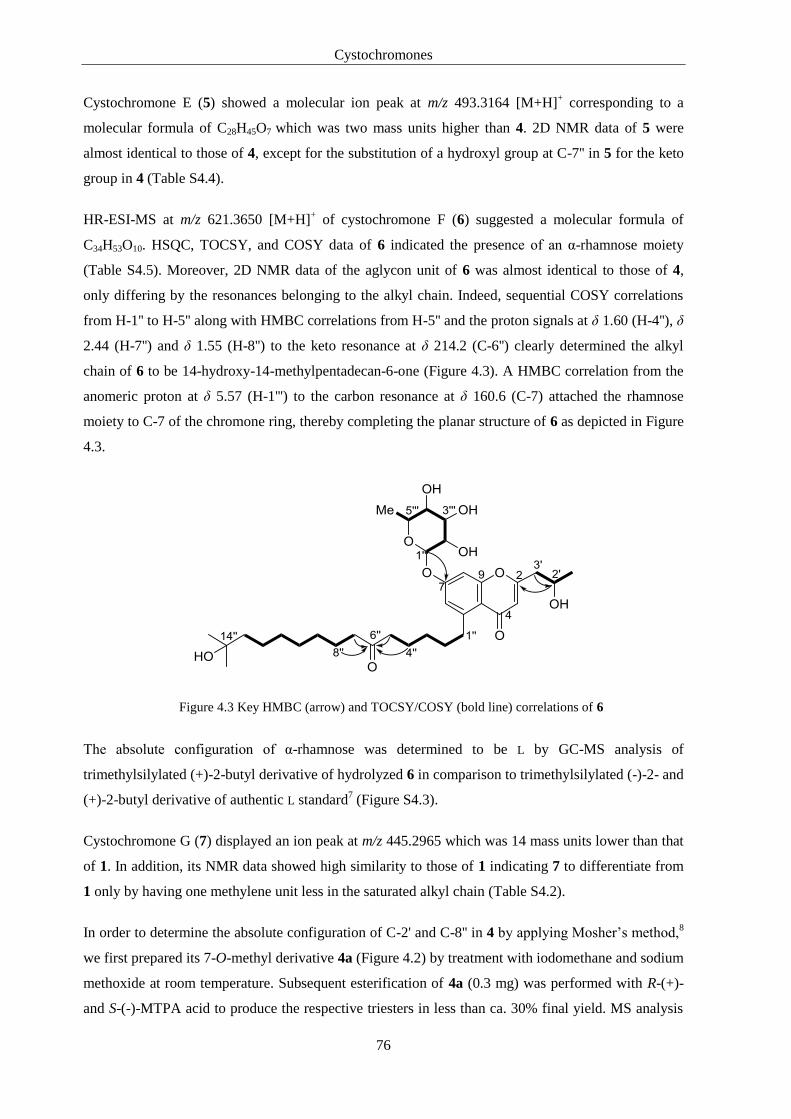
Cystochromones
76
Cystochromone E (5) showed a molecular ion peak at m/z 493.3164 [M+H]+ corresponding to a
molecular formula of C28H45O7 which was two mass units higher than 4. 2D NMR data of 5 were
almost identical to those of 4, except for the substitution of a hydroxyl group at C-7'' in 5 for the keto
group in 4 (Table S4.4).
HR-ESI-MS at m/z 621.3650 [M+H]+ of cystochromone F (6) suggested a molecular formula of
C34H53O10. HSQC, TOCSY, and COSY data of 6 indicated the presence of an α-rhamnose moiety
(Table S4.5). Moreover, 2D NMR data of the aglycon unit of 6 was almost identical to those of 4,
only differing by the resonances belonging to the alkyl chain. Indeed, sequential COSY correlations
from H-1'' to H-5'' along with HMBC correlations from H-5'' and the proton signals at δ 1.60 (H-4''), δ
2.44 (H-7'') and δ 1.55 (H-8'') to the keto resonance at δ 214.2 (C-6'') clearly determined the alkyl
chain of 6 to be 14-hydroxy-14-methylpentadecan-6-one (Figure 4.3). A HMBC correlation from the
anomeric proton at δ 5.57 (H-1''') to the carbon resonance at δ 160.6 (C-7) attached the rhamnose
moiety to C-7 of the chromone ring, thereby completing the planar structure of 6 as depicted in Figure
4.3.
Figure 4.3 Key HMBC (arrow) and TOCSY/COSY (bold line) correlations of 6
The absolute configuration of α-rhamnose was determined to be L by GC-MS analysis of
trimethylsilylated (+)-2-butyl derivative of hydrolyzed 6 in comparison to trimethylsilylated (-)-2- and
(+)-2-butyl derivative of authentic L standard7 (Figure S4.3).
Cystochromone G (7) displayed an ion peak at m/z 445.2965 which was 14 mass units lower than that
of 1. In addition, its NMR data showed high similarity to those of 1 indicating 7 to differentiate from
1 only by having one methylene unit less in the saturated alkyl chain (Table S4.2).
In order to determine the absolute configuration of C-2' and C-8'' in 4 by applying Mosher’s method,8
we first prepared its 7-O-methyl derivative 4a (Figure 4.2) by treatment with iodomethane and sodium
methoxide at room temperature. Subsequent esterification of 4a (0.3 mg) was performed with R-(+)-
and S-(-)-MTPA acid to produce the respective triesters in less than ca. 30% final yield. MS analysis
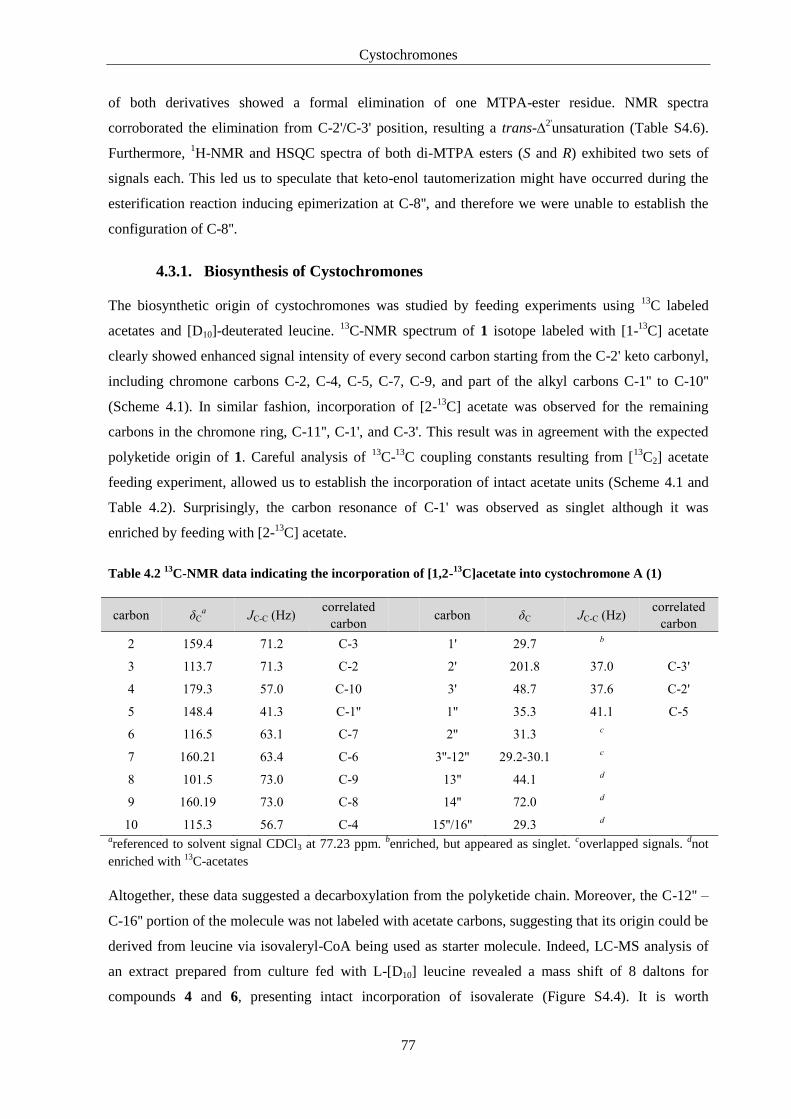
Cystochromones
77
of both derivatives showed a formal elimination of one MTPA-ester residue. NMR spectra
corroborated the elimination from C-2'/C-3' position, resulting a trans-∆2'unsaturation (Table S4.6).
Furthermore, 1H-NMR and HSQC spectra of both di-MTPA esters (S and R) exhibited two sets of
signals each. This led us to speculate that keto-enol tautomerization might have occurred during the
esterification reaction inducing epimerization at C-8'', and therefore we were unable to establish the
configuration of C-8''.
4.3.1. Biosynthesis of Cystochromones
The biosynthetic origin of cystochromones was studied by feeding experiments using 13
C labeled
acetates and [D10]-deuterated leucine. 13
C-NMR spectrum of 1 isotope labeled with [1-13
C] acetate
clearly showed enhanced signal intensity of every second carbon starting from the C-2' keto carbonyl,
including chromone carbons C-2, C-4, C-5, C-7, C-9, and part of the alkyl carbons C-1'' to C-10''
(Scheme 4.1). In similar fashion, incorporation of [2-13
C] acetate was observed for the remaining
carbons in the chromone ring, C-11'', C-1', and C-3'. This result was in agreement with the expected
polyketide origin of 1. Careful analysis of 13
C-13
C coupling constants resulting from [13
C2] acetate
feeding experiment, allowed us to establish the incorporation of intact acetate units (Scheme 4.1 and
Table 4.2). Surprisingly, the carbon resonance of C-1' was observed as singlet although it was
enriched by feeding with [2-13
C] acetate.
Table 4.2 13
C-NMR data indicating the incorporation of [1,2-13
C]acetate into cystochromone A (1)
areferenced to solvent signal CDCl3 at 77.23 ppm.
benriched, but appeared as singlet.
coverlapped signals.
dnot
enriched with 13
C-acetates
Altogether, these data suggested a decarboxylation from the polyketide chain. Moreover, the C-12'' –
C-16'' portion of the molecule was not labeled with acetate carbons, suggesting that its origin could be
derived from leucine via isovaleryl-CoA being used as starter molecule. Indeed, LC-MS analysis of
an extract prepared from culture fed with L-[D10] leucine revealed a mass shift of 8 daltons for
compounds 4 and 6, presenting intact incorporation of isovalerate (Figure S4.4). It is worth
carbon δCa JC-C (Hz)
correlated
carbon carbon δC JC-C (Hz)
correlated
carbon
2 159.4 71.2 C-3 1' 29.7 b
3 113.7 71.3 C-2 2' 201.8 37.0 C-3'
4 179.3 57.0 C-10 3' 48.7 37.6 C-2'
5 148.4 41.3 C-1'' 1'' 35.3 41.1 C-5
6 116.5 63.1 C-7 2'' 31.3 c
7 160.21 63.4 C-6 3''-12'' 29.2-30.1 c
8 101.5 73.0 C-9 13'' 44.1 d
9 160.19 73.0 C-8 14'' 72.0 d
10 115.3 56.7 C-4 15''/16'' 29.3 d
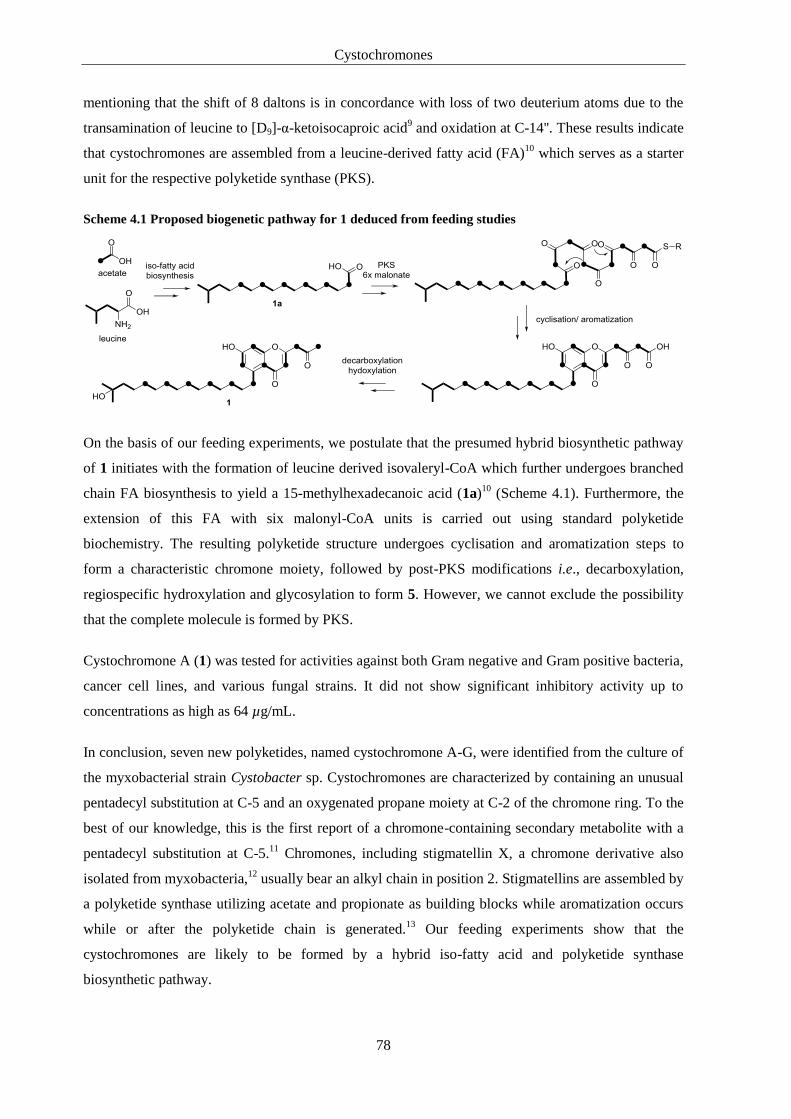
Cystochromones
78
mentioning that the shift of 8 daltons is in concordance with loss of two deuterium atoms due to the
transamination of leucine to [D9]-α-ketoisocaproic acid9 and oxidation at C-14''. These results indicate
that cystochromones are assembled from a leucine-derived fatty acid (FA)10
which serves as a starter
unit for the respective polyketide synthase (PKS).
Scheme 4.1 Proposed biogenetic pathway for 1 deduced from feeding studies
On the basis of our feeding experiments, we postulate that the presumed hybrid biosynthetic pathway
of 1 initiates with the formation of leucine derived isovaleryl-CoA which further undergoes branched
chain FA biosynthesis to yield a 15-methylhexadecanoic acid (1a)10
(Scheme 4.1). Furthermore, the
extension of this FA with six malonyl-CoA units is carried out using standard polyketide
biochemistry. The resulting polyketide structure undergoes cyclisation and aromatization steps to
form a characteristic chromone moiety, followed by post-PKS modifications i.e., decarboxylation,
regiospecific hydroxylation and glycosylation to form 5. However, we cannot exclude the possibility
that the complete molecule is formed by PKS.
Cystochromone A (1) was tested for activities against both Gram negative and Gram positive bacteria,
cancer cell lines, and various fungal strains. It did not show significant inhibitory activity up to
concentrations as high as 64 µg/mL.
In conclusion, seven new polyketides, named cystochromone A-G, were identified from the culture of
the myxobacterial strain Cystobacter sp. Cystochromones are characterized by containing an unusual
pentadecyl substitution at C-5 and an oxygenated propane moiety at C-2 of the chromone ring. To the
best of our knowledge, this is the first report of a chromone-containing secondary metabolite with a
pentadecyl substitution at C-5.11
Chromones, including stigmatellin X, a chromone derivative also
isolated from myxobacteria,12
usually bear an alkyl chain in position 2. Stigmatellins are assembled by
a polyketide synthase utilizing acetate and propionate as building blocks while aromatization occurs
while or after the polyketide chain is generated.13
Our feeding experiments show that the
cystochromones are likely to be formed by a hybrid iso-fatty acid and polyketide synthase
biosynthetic pathway.

Cystochromones
79
4.4. Experimental Section
4.4.1. General Experimental Procedure
The specific optical rotations were measured on JASCO P-2000 polarimeter. UV spectra were
measured on an Agilent 8453 spectrophotometer and IR spectra were obtained on Perkin-Elmer FT-IR
spectrum One spectrometer. NMR spectra were acquired on Bruker Ascend 500 MHz and 700 MHz
NMR spectrometers equipped with a 5 mm TXI cryoprobe. Deuterated MeOD4 and CDCl3 were used
as NMR solvents and HSQC, HMBC, 1H-
1H COSY, 2D TOCSY, ROESY spectra were recorded
using standard pulse programs. LC-HRMS data were obtained on a maXis 4G mass spectrometer
(Bruker Daltonics, Germany) coupled with Dionex Ultimate 3000 RSLC system, using a BEH C18,
100 × 2.1 mm, 1.7 mm dP column (Waters, Germany) with linear gradient of 5-95% ACN + 0.1% FA
in H2O + 0.1% FA at 600 μL/min in 18 min with UV detection in 200-600 nm range. Mass spectra
were acquired using the ESI source in the range from 150–2000 m/z at 2 Hz scan speed.
4.4.2. Strain Isolation and Identification
The strain MCy9104 was isolated in 2006 from a soil sample collected in Manila, Philippines. The
bacterium was discovered by a standard myxobacterial baiting method using rabbit dung pellets which
were half-burrowed in the soil.14,15
It was recognized as myxobacterium by the development of
rounded and brownish fruiting bodies on the baits. By picking them up using a sterile fine needle and
inoculating onto buffered water agar baited with Escherichia coli and for successive transfers of the
farthest swarm colony edge,16
the strain was finally purified. The isolate was maintained in buffered
VY/2 agar and permanently stored in -80ºC freezer using 50% glycerol as cryo protectant. Based on
complete 16S rRNA gene sequence (1524bp), strain MCy9104 shows closest similarity (99%) with
Cystobacter fuscus DSM 2262T (GenBank accession number: NR_043941), Cystobacter ferrugineus
Cb fe18T (NR_025343), and Cystobacter badius DSM14723
T (NR_043940). The strain’s affiliation to
genus Cystobacter was also supported by morphological characteristics, and phylogenetic analysis
(Figure S4.2).
4.4.3. Strain Cultivation
Preculture of strain MCy9104 Cystobacter sp. grew in CLF medium (4 g fructose, 6 g glucose, 10 g
skim milk, 2 g yeast extract, 1 g CaCl2 × 2H2O, 1 g MgSO4 × 7H2O, 11.9 g HEPES per liter, pH 7.0
adjusted with 10N KOH) on rotary shaker at 300C. 4d old preculture was inoculated (2% v/v) in to 12
L CLF production medium (distributed in 6 × 5 L shaking flasks), and placed on rotary shaker at 180
rpm in 300C room, and adsorber resin Amberlite XAD-16 (2.5% w/v) was added on day nine. XAD
was collected on next day by sieving, and lyophilized overnight.

Cystochromones
80
4.4.4. Extraction and Isolation
Dry XAD was defatted with n-hexane and extracted with ethyl acetate 3 × 500 mL. 1 g dark brown
oily crude extract was obtained after evaporation of ethyl acetate in vacuo, and the crude extract was
then subjected to Sephadex-LH 20 column chromatography with MeOH as eluent. The fractions
containing cystochromones were dried in Genevac and purified by semi-prep HPLC Agilent system
equipped with Luna C18(2), 250 × 10 mm, 5 µm dP column. Linear gradient started with 10% of B
(ACN + 0.1% FA) for 5 mins, increased to 50% in 15 mins, and to 100% in 30 mins at 2.5 mL/min,
followed by isocratic run for 10 mins at 3 mL/min to afford compounds 1 (1 mg, tR = 39.1 mins), 2
(0.2 mg, tR = 53.7 mins), 3 (0.4 mg, tR = 31.0 mins), 4 (0.3 mg, tR = 20.5 mins), 5 (0.3 mg, tR = 19.8
mins), 6 (0.7 mg, tR = 21.6 mins), and 7 (0.5 mg, tR = 37.2 mins).
Cystochromone A (1): colorless solid, [α]20
D -12.9 (c 0.2 in MeOH), IR (film) νmax 3681, 2938, 2865,
1455, 1346, 1055, 1032 cm-1
, UV(ACN) λmax 220, 250, 292 nm, 1H and
13C NMR data see Table 4.1
and S4.1, HR-ESI-MS m/z 459.3103 [M+H]+ (calcd for C28H43O5 459.3105)
Cystochromone B (2): colorless solid, [α]20
D -22.5 (c 0.15 in MeOH:CH2Cl2/1:1), IR (film) νmax 2920,
2851, 1652, 1611, 1352 cm-1
, UV(ACN) λmax 222, 250, 292 nm, 1H and
13C NMR data see Table S4.2,
HR-ESI-MS m/z 443.3150 [M+H]+ (calcd for C28H43O4 443.3155)
Cystochromone C (3): colorless solid, [α]20
D -11.6 (c 0.2 in MeOH), IR (film) νmax 3372, 2923, 2853,
1647, 1600 cm-1
, UV(ACN) λmax 220, 251, 288 nm, 1H and
13C NMR data see Table S4.2, HR-ESI-
MS m/z 475.3051 [M+H]+ (calcd for C28H43O6 475.3054)
Cystochromone D (4): colorless solid, [α]20
D -4.7 (c 0.2 in MeOH), IR (film) νmax 3328, 2932, 2857,
1643, 1598, 1390 cm-1
, UV(ACN) λmax 220, 251, 286 nm, 1H and
13C NMR data see Table 4.1 and
S4.3, HR-ESI-MS m/z 491.3001 [M+H]+ (calcd for C28H43O7 491.3003)
Cystochromone E (5): colorless solid, [α]20
D -8.0 (c 0.2 in MeOH), IR (film) νmax 3708, 2923, 2866,
1738, 1455, 1365, 1228, 1055 cm-1
, UV(ACN) λmax 220, 250, 288 nm, 1H and
13C NMR data see
Table S4.4, HR-ESI-MS m/z 493.3164 [M+H]+ (calcd for C28H45O7 493.3159)
Cystochromone F (6): colorless solid, [α]20
D -28.0 (c 0.2 in MeOH), IR (film) νmax 3352, 2926, 2851,
1643, 1598, 1395 cm-1
, UV(ACN) λmax 220, 251, 282 nm, 1H and
13C NMR data see Table S4.5, HR-
ESI-MS m/z 621.3650 [M+H]+ (calcd for C34H53O10 621.3633)
Cystochromone G (7): colorless solid, [α]20
D -20.8 (c 0.1 in MeOH:CH2Cl2/1:1), IR (film) νmax 2929,
2851, 1646, 1598 cm-1
, UV(ACN) λmax 220, 251, 290 nm, 1H and
13C NMR data see Table S4.2, HR-
ESI-MS m/z 445.2965 [M+H]+ (calcd for C27H41O5 445.2954

Cystochromones
81
4.4.5. Stable Isotope Feeding
Feeding experiments were carried out using [1-13
C]-, [2-13
C]- and [1,2-13
C2] acetates, each in 5mM
final concentration in 2 L cultures. Precursors were dissolved in mixture of 7 mL sterile water and 2
mL DMSO, and added into the culture as three equal portions at 20, 28 and 44h after inoculation.
Simultaneously, positive and negative control cultures were prepared with 5mM unlabeled sodium
acetate, and 2 mL DMSO, respectively. After 5 days of inoculation, 50 mL XAD-16 was added, and
harvested after another 2 days. XAD was collected by sieving, lyophilized, defatted with n-hexane,
and extracted with 3 × 300 mL ethyl acetate. EtOAc extracts were then subjected to Agilent semi-prep
HPLC equipped with an automatic fraction collector and Luna C18(2), 250 × 10 mm, 5 µm dP
column. Fractionation was carried out using linear gradient started with 10% B (ACN+0.1% FA)
increased to 50% in 15 mins and to 100% B in 30 mins. Fractions of interest were combined, and
concentrated under reduced pressure and final purification was achieved on the semi-prep HPLC
system equipped with Synergi Fusion 250 × 10 mm, 4 µm dP column with linear gradient of 75%-
100% B in 20 mins at 2.5 mL/min flow rate to yield enriched 1 in 1.0 mg ([1-13
C]-acetate), 1.2 mg
([2-13
C]-acetate) and 0.3 mg ([1,2-13
C]-acetate).
Feeding experiment with L-[D10]leucine was achieved with 0.1mM labeled precursor as final
concentration that was dissolved in 2 mL DMSO. It was added as two equal portions to the culture at
18h and 24h after cultivation initiation. MeOH extract of XAD was analyzed by LC-HR-MS.
4.4.6. Methylation and Preparation of (R) and (S)-MTPA esters of 4.
Starting material 4 (1 mg) was mixed in methyl iodide (100 µL) with 0.5M sodium methoxide
solution in methanol (30 µL) at room temperature. After 2, 24 and 29h another 3 portions of both
reagents were added. Mixture was dried under N2 stream after 46h, and resuspended in MeOH. The
methylated product 4a was purified by semi-prep HPLC equipped with Luna C18(2) 250 × 10 mm, 5
µm dP column with linear gradient of 10-100% B (ACN+0.1% FA) in 25 mins.
To the solution of 4a (0.35 mg in 100 µL dried chloroform) was added (R)-(+)- and (S)-(-)-α-
methoxy-α-trifluoromethyl phenylacetic acid (MTPA, 150 µL), extra dry pyridine (20 µL), N,N'-
diisopropylcarbodiimide (DIC, 140 µL), and excess amount of dimethylaminopyridine in four
portions at 0, 24, 48, 72h. The reactions were monitored by LC-MS. After 4 days, the reaction was
dried under N2, dissolved in water, and extracted with ethyl acetate. Organic layer was concentrated,
and analyzed by LC-MS. Purification of (R)- and (S)-Mosher ester of 4a were carried out by semi-
prep HPLC equipped with Luna C18(2) 250 × 10 mm, 5 µm dP column under linear gradient of 10-
65% B in 15 mins, increased up to 100% in 30 mins followed by isocratic run at 100% for another 9
mins with 2.5 mL/min. Mosher esters were eluted at 56 min.

Cystochromones
82
4.4.7. Assigment of Absolute Configuration of Rhamnose.
Approximately 0.3 mg of 6 was hydrolyzed with 1 N HCl (0.25 mL) at 600C for 4h. After cooled
down to room temperature, the solution was concentrated by Speedvac concentrator (Eppendorf). The
residue was dissolved in (+)-2-butanol (0.3 mL) and acetyl chloride (5 µL), and stirred for 8h at 800C.
After cooling, the reaction was quenched with sat. aqueous NaHCO3 (0.5 mL) and subsequently
extracted with ethyl acetate (2 × 0.5 mL). The organic layer was dried first with stream of N2,
followed by overnight drying in vacuo and then threated with 1-(trimethylsilyl)imidazole (40 µL) and
pyridine (160 µL) for 15 mins at 600C. The solution was dried by Speedvac concentrator, and the
residue was separated by H2O and EtOAc (2 × 400 µL, 1:1 v/v). The organic layer was analyzed by
GC-MS on an Agilent 6890N gas chromatograph with a 5973 electron impact mass selective detector
and a 7683B injector (Agilent) using a dimethyl-(5% phenyl)-polysiloxane capillary column (Agilent
DB-5ht, 0.25 mm by 30 m by 0.1 µm). Helium was used as the carrier gas at a flow rate of 1 mL/min.
5 µl of the sample was injected in split mode (split ratio, 10:1). The column temperature was
increased from 50°C to 180°C at a rate of 5°C/min. Other temperatures were as follows: inlet, 275°C;
GC-MS transfer line, 280°C; ion source, 230°C; and quadrupole, 150°C. The mass selective detector
was operated in scan mode, scanning the mass range from m/z 40 to 700. Peaks corresponding to the
trimethylsilylated (+)-2-butyl rhamnoside was co-eluted with same derivative of authentic L-
rhamnose (eluted at 22.26 mins) that was treated in same manner. Since the retention times of (+)-2-
butyl L-rhamnoside and (-)-2-butyl D-rhamnoside are the same, the authentic L standard was
derivatized with (-)-2-butanol, and analysed by GC-MS (eluted at 22.07 mins).
4.5. References
[1] Wenzel, S. C.; Müller, R. Mol. Biosyst. 2009, 5, 567–574.
[2] Weissman, K. J.; Müller, R. Nat. Prod. Rep. 2010, 27, 1276–1295.
[3] Plaza, A.; Garcia, R.; Bifulco, G.; Martinez, J. P.; Hüttel, S.; Sasse, F.; Meyerhans, A.; Stadler, M.; Müller,
R. Org. Lett. 2012, 14, 2854–2857.
[4] Nadmid, S.; Plaza, A.; Lauro, G.; Garcia, R.; Bifulco, G.; Müller, R. Org. Lett. 2014, 16, 4130–4133.
[5] Surup, F.; Viehrig, K.; Mohr, K. I.; Herrmann, J.; Jansen, R.; Müller, R. Angew. Chem. Int. Ed. 2014, 53,
13588-13591.
[6] Baumann, S.; Herrmann, J.; Raju, R.; Steinmetz, H.; Mohr, K. I.; Hüttel, S.; Harmrolfs, K.; Stadler, M.;
Müller, R. Angew. Chem. Int. Ed. 2014, 53, 14605–14609.
[7] Gerwig, G. J.; Kamerling, J. P.; Vliegenthart, J. F. 1978, 349–357.
[8] Hoye, T. R.; Jeffrey, C. S.; Shao, F. Nat. Protoc. 2007, 2, 2451–2458.
[9] Dickschat, J. S.; Bode, H. B.; Kroppenstedt, R. M.; Müller, R.; Schulz, S. Org. Biomol. Chem. 2005, 3,
2824–2831.
[10] Bode, H. B.; Dickschat, J. S.; Kroppenstedt, R. M.; Schulz, S.; Müller, R. J. Am. Chem. Soc. 2005, 127,
532–533.
Cystochromones
83
[11] Gaspar, A.; Matos, M. J.; Garrido, J.; Uriarte, E.; Borges, F. Chem. Rev. 2014, 114, 4960–4992.
[12] Kunze, B.; Kemmer, T.; Höfle, G.; Reichenbach, H. J. Antibiot. 1984, 37, 454–461.
[13] Gaitatzis, N.; Silakowski, B.; Kunze, B.; Nordsiek, G.; Blöcker, H.; Höfle, G.; Müller, R. J. Biol. Chem.
2002, 277, 13082–13090.
[14] Krzemieniewska, H.; Krzemieniewski, S.; Myxobacteria of the species Chondromyces Bull Acad Polon
Sci Lettr Classe Sci Math Nat Ser B; Berkeley and Curtis, 1946, 1:31–48
[15] Shimkets, L.; Dworkin, M.; Reichenbach, H. The myxobacteria. In The Prokaryotes; Dworkin, M.;
Falkow, S.; Rosenberg, E.; Schleifer, K-H.; Stackebrandt, E., Eds.; Springer-Verlag: Berlin, 2006; Vol. 7,
3rd edn. pp 31–11.
[16] Garcia, R.; Müller, R. Family Polyangiaceae. In The Prokaryotes; Rosenberg, E.; DeLong, E.; Lory, S.;
Stackebrandt, E.; Thompson, F., Eds.; Springer-Verlag: Berlin Heidelberg, 2014, pp 247–279.

Cystochromones
84
4.6. Supporting Informations
Table S4.1 NMR spectroscopic data for cystochromone A (1)
pos δC,a type δH
b (J in Hz) HMBC
c COSY
d
2 159.4, C
3 113.7, CH 6.07, s 2, 2', 3', 4, 10
4 179.3, C
5 148.4, C
6 116.5, CH 6.65, d (2.3) 1'', 4, 7, 8, 10
7 160.21, C
8 101.5, CH 6.63, d (2.3) 4, 6, 7, 9, 10
9 160.19, C
10 115.3, C
1' 29.7, CH3 2.26, s 2, 2', 3'
2' 201.8, C
3' 48.7, CH2 3.60, s 1', 2, 2', 3
1'' 35.3, CH2 3.18, t (7.5) 2'', 3'', 5, 6, 10 2''
2'' 31.3, CH2 1.56, m 1'', 3'' 1'', 3''
3''-12'' 29.2-30.1, CH2 1.25-1.35, m e
e
13'' 44.1, CH2 1.46, t (6.7) 14'', 15'', 16'' 12''
14'' 72.0, C
15''/16'' 29.3, CH3 1.21, s 13'', 14'', 15/16''
arecorded at 125 MHz, referenced to solvent signal CDCl3 at δ 77.23 ppm.
brecorded at 500 MHz, referenced to
solvent signal CDCl3 at δ 7.24 ppm. cproton showing HMBC correlation to indicated carbons.
dproton showing
COSY correlation to indicated protons. eoverlapped signals

Cystochromones
85
Table S4.2 NMR spectroscopic data for cystochromone B (2), C (3) and G (7)
pos 2
a 3
b 7
b
δC,c type δH
d (J in Hz) δC,
e type δH
f (J in Hz) δC,
e type δH
f (J in Hz)
2 159.2, C 162.3, C 162.4, C
3 113.9, CH 6.07, s 113.5, CH 6.09, s 113.5, CH 6.09, s
4 g
181.1, C 181.2, C
5 148.6, C 148.6, C 148.6, C
6 116.0, CH 6.60, d (2.3) 117.5, CH 6.65, d (2.3) 117.5, CH 6.65, d (2.3)
7 159.8, C 163.3, C 163.2, C
8 101.4, CH 6.63, d (2.3) 101.6, CH 6.64, d (2.3) 101.6, CH 6.64, d (2.3)
9 159.0, C 161.4, C 161.6, C
10 115.7, C 114.9, C 115.1, C
1' 29.9, CH3 2.26, s 29.7, CH3 2.27, s 29.8, CH3 2.27, s
2' 201.3, C 204.1, C 204.1, C
3' 48.6, CH2 3.60, s 48.0, CH2 3.31h 48.0, CH2 3.31
h
1'' 35.3, CH2 3.18, t (7.5) 36.2, CH2 3.16, t (7.9) 36.2, CH2 3.16, t (7.9)
2'' 31.5, CH2 1.55, m 32.5, CH2 1.56, m 32.5, CH2 1.56, m
3''-11'' 29.2-30.1, CH2 1.25-1.35, m 29.2-30.5, CH2 1.25-1.35, m 29.2-30.5, CH2 1.25-1.35, m
12'' 29.2-30.1, CH2 1.25-1.35, m 29.2-30.5, CH2 1.25-1.35, m 44.6, CH2 1.43, m (6.7)
13'' 39.3, CH2 1.12, m 39.5, CH2 1.45, m (6.7) 71.4, C
14'' 28.0, CH 1.49, m 73.5, C 28.9, CH3 1.16, s
15'' 22.8, CH3 0.84, d (6.6) 70.2, CH2 3.35, s 28.9, CH3 1.16, s
16'' 22.8, CH3 0.84, d (6.6) 23.5, CH3 1.11, s
arecorded in CDCl3.
brecorded in MeOD4.
cacquired at 175 MHz, referenced to solvent signal CDCl3 at δ 77.23
ppm. dacquired at 700 MHz, referenced to solvent signal CDCl3 at δ 7.24 ppm.
eacquired at 125 MHz,
referenced to solvent signal MeOD4 at δ 49.15 ppm. facquired at 500 MHz, referenced to solvent signal MeOD4
at δ 3.31 ppm. gnot observed.
hoverlapped with solvent signal

Cystochromones
86
Table S4.3 NMR spectroscopic data for cystochromone D (4)
pos δC,a type δH
b (J in Hz) HMBC
c COSY
d
2 166.5, C
3 112.4, CH 6.06, s 2, 4
4 181.3, C
5 148.2, C
6 117.6, CH 6.64, d (2.3) 1'', 7, 8, 10
7 163.4, C
8 101.7, CH 6.67, d (2.3) 6, 7, 9, 10
9 161.5, C
10 114.8, C
1' 23.4, CH3 1.28, d (6.2) 2', 3' 2'
2' 66.1, CH 4.19, m 1', 2, 3' 1', 3'a, 3'b
3'a 44.0, CH2 2.66, dd (7.9, 14.4) 1', 2', 2, 3 2', 3'b
3'b 2.72, dd (4.9, 14.4) 1', 2', 2, 3 2', 3'a
1'' 36.1, CH2 3.16, t (7.5) 2'', 3'', 5, 6, 10 2''
2'' 32.4, CH2 1.57, m 5 1'', 3''
3''-4'' 30.3-30.7, CH2 1.31-1.40, m e
e
5'' 24.2, CH2 1.58, m 7'' 4'', 6''
6'' 38.5, CH2 2.55, m 7'' 5''
7'' 215.2, C
8'' 77.9, CH 4.06, q (3.8) 7'', 9'' 9''a, 9''b
9''a 34.5, CH2 1.53, m 7'', 8'' 8'', 9''b
9''b 1.72, m 7'' 8'', 9''a
10''-12'' 30.3-30.7, CH2 1.35-1.40, m e
13'' 44.5, CH2 1.44, t (6.7) 14'', 15''/16''
14'' 71.2, C
15''/16'' 29.0, CH3 1.16, s 13'', 14''
arecorded at 175 MHz, referenced to solvent signal MeOD4 at δ 49.15 ppm.
brecorded at 700 MHz, referenced to
solvent signal MeOD4 at δ 3.31 ppm. cproton showing HMBC correlation to indicated carbons.
dproton showing
COSY correlation to indicated protons. eoverlapped signals

Cystochromones
87
Table S4.4 NMR spectroscopic data for cystochromone E (5)
pos δC,a type δH
b (J in Hz) HMBC
c COSY
d
2 166.7, C
3 112.3, CH 6.06, s 2, 4
4 181.4, C
5 148.6, C
6 117.4, CH 6.64, d (2.3) 1'', 7, 8, 10
7 163.1, C
8 101.6, CH 6.67, d (2.3) 6, 7, 9, 10
9 161.6, C
10 115.1, C
1' 23.5, CH3 1.28, d (6.3) 2', 3' 2'
2' 66.4, CH 4.20, m 1', 2, 1', 3'a, 3'b
3'a 44.0, CH2 2.65, dd (7.9, 14.3) 1', 2', 2, 3 2', 3'b
3'b 2.73, dd (4.9, 14.3) 1', 2', 2, 3 2', 3'a
1'' 36.0, CH2 3.15, m 2'', 3'', 5, 6, 10 2''
2'' 32.5, CH2 1.55, m 5
1'', 3''
3'' 30.5, CH2 1.40, m e
e
4'' 30.8, CH2 1.32, m e
e
5'' 24.4, CH2 1.58, m e
e
6''a 33.6, CH2 1.43, m 7'', 8'' e
6''b 1.51, m 7'', 8'' e
7'' 75.4, CH 3.38, m 5'', 6'', 8'', 9'' 6''a, 6''b
8'' 75.4, CH 3.38, m 5'', 6'', 7'', 9'' 9''a, 9''b
9''a 33.6, CH2 1.43, m 7'', 8'' e
9''b 1.51, m 7'', 8'' e
10'' 26.9, CH2 1.51, m e
e
11''-12'' 30.1, CH2 1.35, m e
e
13'' 44.1, CH2 1.45, t (6.7) 14'', 15'', 16'' e
14'' 71.5, C
15''/16'' 29.0, CH3 1.16, s 13'', 14'', 15''/16''
arecorded at 125 MHz, referenced to solvent signal MeOD4 at δ 49.15 ppm.
brecorded at 500 MHz, referenced to
solvent signal MeOD4 at δ 3.31 ppm. cproton showing HMBC correlation to indicated carbons.
dproton showing
COSY correlation to indicated protons. eoverlapped signals

Cystochromones
88
Figure S4.1ESI-MS2 fragmentation of cystochromone D (4)
Figure S4.2 Neighbor-joining tree of myxobacteria based on 16S rRNA gene sequences showing the position of
Cystobacter sp. MCy9104 (bold) in suborder Cystobacterineae. Values at the branch points represent
the bootstrap support based on 1000 resamplings. Desulfovibrio desulfuricans strain MBT was used
as an outgroup to root the tree. GenBank accession number of the 16S rRNA gene sequence is shown
in parenthesis. Bar, 0.05 nucleotide substitution per site.

Cystochromones
89
Table S4.5 NMR spectroscopic data for cystochromone F (6)
pos δC,a type δH
b (J in Hz) HMBC
c COSY
d TOCSY
f ROESY
g
2 167.4, C
3 112.7, CH 6.13, s 2, 3', 4, 5, 10 2', 3'b
4 181.3, C
5 148.2, C
6 118.0, CH 6.88, d (2.3) 1'', 4, 7, 8, 10 8 1''', 1'', 2''
7 160.6, C
8 102.7, CH 7.07, d (2.3) 6, 7, 9, 10 6 1'''
9 160.2, C
10 116.9, C
1' 23.4, CH3 1.28, d (6.3) 2', 3' 2' 2', 3'a, 3'b
2' 66.2, CH 4.21, m 1', 2, 3' 1', 3'a, 3'b 1', 3'a, 3'b
3'a 44.0, CH2 2.68, dd (7.9, 14.3) 1', 2', 2, 3 2', 3'b 1', 2' 3
3'b 2.75, dd (4.9, 14.3) 1', 2', 2, 3 2', 3'a 1', 2' 3
1'' 36.0, CH2 3.20, m 2'', 3'', 5, 6, 10 2'' 2'', 3'', 4'', 5'' 6
2'' 32.3, CH2 1.58, m 1''
1'', 3'' 1'', 3'', 4'', 5'' 6
3'' 30.0, CH2 1.40, m 1'' 2'', 4'' 1'', 2'', 4'', 5''
4'' 24.5, CH2 1.60, m 5'', 6'' 3'', 5'' 1'', 2'', 3'', 5''
5'' 43.3, CH2 2.46, t (7.44) 3'', 4'', 6'' 4'' 1'', 2'', 3'', 4''
6'' 214.3, C
7'' 43.3, CH2 2.44, t (7.46) 6'', 8'' 8'' 8'', 9''
8'' 24.6, CH2 1.55, m 6'', 7'' 7'', 9'' 7'', 9''
9'' 30.1, CH2 1.30, m 7'' 8'' 7'', 8''
10''-12'' 29.8-31.0, CH2 1.28-1.35, m e
e
e
13'' 44.5, CH2 1.44, m 14'', 15''/16'' e
14'' 71.3, C
15''/16'' 29.0, CH3 1.16, s 13'', 14'',
15''/16''
1''' 99.3, CH 5.57, d (1.7) 3''', 5''', 7 2''' 2''' 6, 8,
2''' 71.6, CH 4.03, dd (1.8, 3.3) 1''', 3''', 4''' 1''', 3''' 1''', 3''', 4''',
5''', 6'''
3'''
3''' 72.0, CH 3.84, dd (3.3, 9.4) 2''', 4''', 5''' 2''', 4''' 2''', 4''', 5''',
6'''
2''', 5'''
4''' 73.5, CH 3.47, t (9.4) 2''', 3''', 5''', 6''' 3''', 5''' 2''', 3''', 5''',
6'''
6'''
5''' 71.1, CH 3.57, m 1''', 3''', 4''', 6''' 4''', 6''' 2''', 3''', 4''',
6'''
3'''
6''' 18.0, CH3 1.24, d (6.4) 4''', 5''' 5''' 2''', 3''', 4''',
5'''
4'''
aacquired at 125 MHz, referenced to solvent signal MeOD4 at δ 49.15 ppm.
bacquired at 500 MHz, referenced to
solvent signal MeOD4 at δ 3.31 ppm. cproton showing HMBC correlation to indicated carbons.
dproton showing
COSY correlations to indicated protons. eoverlapped signals
fproton showing TOCSY correlations to indicated
protons. gproton showing ROESY correlations to indicated protons.

Cystochromones
90
Figure S4.3 Overlapped GC-MS chromatogram of trimethylsilylated derivatives of (+)-2-butyl – rhamnoside of
cystochromone F (6), and authentic (+)-2- and (-)-2-butyl –L-rhamnoside

Cystochromones
91
490.2870 1+
491.3000 1+
492.3029 1+
493.3096 1+
495.3296 497.3093 0
1
2
3
4
5 4 x10
Intens.
490 492 494 496 498 500 m/z
Cystochromone D, control
491.2997
1+
492.3024 1+
493.3087 1+
495.3289 499.3494 0.0
0.2
0.4
0.6
0.8
1.0 5 x10
Intens.
491 492 493 494 495 496 497 498 499 m/z
Cystochromone D, [D10
] Leu
621.3640 1+
622.3666 1+
623.3694 1+
0.0
0.2
0.4
0.6
0.8
1.0
5 x10 Intens.
621 622 623 624 625 626 627 628 629 m/z
Cystochromone F, control
621.3629
1+
622.3657 1+
623.3679 1+
629.4108 0.0
0.5
1.0
1.5 5 x10
Intens.
621 622 623 624 625 626 627 628 629 m/z
Cystochromone F, [D10] Leu
Figure S4.4 HR-ESI isotopic peak pattern of cystochromone D (4) and F (6) indicating the incorporation of
labeled leucine. Observed mass shift suggested the incorporation of eight deuterium atoms, due to
the transamination of leucine to [D9]-α-ketoisocaproic acid and oxidation at C-14''.

Cystochromones
92
Table S4.6 NMR spectroscopic data for di-(S)-MTPA ester of
4a
pos δC,a type δH
b (J in Hz) HMBC
c COSY
d
2 161.9, C
3 110.1, CH 6.04, s 2, 3', 4
4 181.5, C
5 148.0, C
6 117.0, CH 6.75, d (2.3) 1''
7 164.6, C
8 99.6, CH 6.93, d (2.3) 4, 7, 9
9 161.8, C
10 116.0, C
11 56.2, CH3 3.90, s 7
1' 18.5, CH3 1.98, m 2', 3' 2'
2' 137.7, CH 6.91, m 1', 2 1', 3'
3' 124.3, CH 6.28, m 1', 2 2'
1'' 35.9, CH2 3.18, t (7.5) 2'', 5, 10 2''
2'' 32.4, CH2 1.56, m
3''-4'' 30.3-30.7, CH2 1.31-1.40, m f f
5'' 24.0, CH2 1.58/1.62*, m 6''
6'' 39.0, CH2 2.38/2.53*, m 7'' 5''
7'' 206.9, C
8'' 81.0, CH 5.22/5.24*, m 9'' 9''
9'' 30.0, CH2 1.68/1.76*; 1.82
*, m 8''
10''-13'' e e
14'' 87.5, C
15''/16'' 25.8, CH3 1.51, s 14''
aacquired at 175 MHz, referenced to solvent signal MeOD4 at δ 49.15 ppm.
bacquired at 700 MHz, referenced to
solvent signal MeOD4 at δ 3.31 ppm. cproton showing HMBC correlation to indicated carbons.
dproton showing
COSY correlation to indicated protons. enot observed
foverlapped signals.
*second split signals

Discussions
93
5. Discussions
5.1. General Scope of the Work
The overall goal of this thesis was to discover novel secondary metabolites from myxobacteria. In this
regard, chemical screening has been performed on the extract of a number of myxobacterial strains
including the ones possessing bioactivity, novel strain isolates as well as the underexplored ones. As a
result, three strains MSr9139, MCy9135 and MCy9104 were chosen due to the presence of novel
metabolites in their respective extracts.
In particular, chemical analyses of the myxobacterial strains MCy9135 and MSr9139 belonging to
underexplored species H. minutum and Jahnella sp., respectively, was performed by hyphenated
techniques. LC-MS/SPE-NMR based dereplication of these strains suggested the presence of novel
structures at an early stage of the isolation period, which were further isolated and characterized as
new metabolites hyalachelins and a new derivative of marine-derived microsclerodermin,
respectively. Furthermore, the existence of a family of new compounds, cystochromones, in the crude
extract of the Cystobacter sp. MCy9104 was revealed by using standard LC-MS screening method
combined with the myxobacterial compound database “Myxobase”.
Column chromatographies as well as semi-preparative and preparative HPLC coupled with MS were
the main tools to perform the purification of target metabolites. Although the final yield of the studied
compounds were most of the case very low, the use of high field NMR spectrometer equipped with a
cryogenically cooled probe allowed to acquire full 2D-NMR data with small amounts of material (<1
mg). On the basis of comprehensive NMR data, the structures were elucidated and further supported
by HR-MS/MS fragmentation experiments. Moreover, the biosynthetic precursors of cystochromones
have been studied by feeding experiments with D- and 13
C-labeled precursors.
5.2. Microsclerodermins – Marine Natural Products Rediscovered from
Terrestrial Myxobacteria
The methanol crude extract of strain MSr9139 Jahnella sp., showing potent antifungal activity, was
analyzed by LC-MS/SPE-NMR coupled with bioactivity guided fractionation (Figure 1.7). Strong
bioactivity against Candida albicans was traced to cyclic peptides pedein A,[1]
microsclerodermin
D,[2]
and its new derivative, termed microsclerodermin L.

Discussions
94
Microsclerodermins are cyclic peptides bearing characteristic chlorinated tryptophan, complex β-
amino acid (3-amino-8-phenyl-2,4,5-trihydroxy-oct-7-enoic acid (APTO) as in microsclerodermin D
and L) and unusual pyrrolidone moiety.[3]
1D and 2D NMR data of microsclerodermin L were closely
resembled to that of microsclerodermin D, possessing additional methoxy functionality located on C-
39. (Figure 5.1, Table S2.2) Relative and absolute stereochemical configurations were analyzed for
the myxobacterial isolates by applying the previously utilized methods reported for other
microsclerodermins[3]
(chemical degradations followed by Marfey analysis and acetonide formation
followed by ROE analysis) and the result revealed the same configurations as the known marine
microsclerodermins. Microsclerodermins differ in their substitution of the β-amino acid,
modifications of the tryptophan moiety and oxidation state of the pyrrolidone ring.
Figure 5.1 Key HMBC (arrow) and COSY (bold line) correlations of new derivative microsclerodermin L
Microsclerodermins were originally reported from the lithistid marine sponges Microscleroderma and
Theonella, which are known to be excellent sources of a variety of natural products. The structural
analogues, the pedeins, were discovered in parallel from the terrestrial myxobacterium Chondromyces
pediculatus, suggesting that the biosynthetic origin of these antifungal natural compounds could be
bacterial sponge symbionts.[1]
Furthermore, the biosynthesis of microsclerodermin was studied by a
retro-biosynthetic approach (investigated by co-authors Dr. T. Hoffmann and S. Müller) in the
genome of Jahnella sp. strain MSr9139 and Sorangium cellulosum So ce38, which provided the
access to the biosynthesis of the marine natural product.
There are a number of examples where marine sponge-derived natural products exhibit structural
similarity to terrestrial myxobacterial compounds. For instance, the macrolide apicularen produced by
Chondromyces sp.[4]
is closely related to the marine sponge isolate salicylihalamide.[5]
Moreover,
renieramycin and its analogue saframycin MX1 were discovered from a Reniera sponge[6]
and a

Discussions
95
myxobacterium of the genus Myxococcus.[7]
(Figure 5.2) Another noticeable example is the
investigation of bengamide E, which was isolated from both terrestrial myxobacterium Myxococcus
virescens[8]
and sponge Jaspis coriacea.[9]
Even though it is very rare to find an example
demonstrating that bacterial symbiont is the real producer of the sponge-derived compounds.[10]
Figure 5.2 Analogues isolated in parallel from marine sponges and terrestrial myxobacteria
Furthermore, unexplored Jahnella sp. belongs to the myxobacterial family Polyangiaceae, which is
known as the source of many remarkable secondary metabolites.[11]
Further chemical studies of
Jahnella sp. has resulted in a family of linear peptides (Drs. A. Plaza, T. Klefisch and Prof. R. Müller,
unpublished data) together with the novel cyclic peptides jahnellamides A and B that contain an α-
keto-β-methionine residue.[12]
Although a discovery of exactly the same compound from both marine sponge and terrestrial habitats
is quite uncommon, our findings reinforce the theory that bacterial symbionts indeed are the producer
of diverse sponge metabolites. Discovery of marine sponge derived microsclerodermins from
terrestrial myxobacteria provides alternative sources for these powerful antifungal molecules.
Accessibility to a sustainable microbial producer allows performing further biotechnological
development such as production optimization and structural modification towards therapeutic
application.

Discussions
96
5.3. Unusual Catecholate type Siderophores – Hyalachelins
The Hyalangium is an underexplored myxobacterial genus and so far two groups of bioactive natural
products have been isolated. Hyaladione, a chlorinated cyclic hexadiene derivative, was isolated via
bioactivity guided fractionation approach using S. aureus as indicator strain and shows significant
antibacterial activity.[13]
A family of polyketides bearing either furanone (hyafurones), pyrroline
(hyapyrrolines), or pyrone rings (hyapyrones) was isolated from the type strain H. minutum NOCB-2T
and show slight antibacterial activity.[14]
(Figure 5.3, A)
Figure 5.3 Secondary metabolites produced by H. minutum A) isolated from the type strain NOCB-2T and B)
identified from the strain MCy9135
Discussions
97
During further study of this genus aimed at the discovery of novel metabolites, the strain MCy9135
was investigated since the preliminary bioactivity screening exhibited antibacterial activity against
Gram-positive organisms. The strain MCy9135 was isolated in 2008 (by Dr. R. Garcia) from a soil
sample collected in Xiamen, China. Its 16S rDNA analysis revealed it to be phenotypically and
phylogenetically related to the unexplored species H. minutum. The strain was fermented and
chemical composition of the extract was assessed using LC-MS coupled with SPE-NMR.
Subsequently, the result allowed determining the presence of three new metabolites hyalachelins A-C
together with the known compounds hyafurones, myxochelin B and tartrolon D. (Figure 5.3, B) As a
consequence of stepwise chromatographic fractionations, the latter one was linked to the antibacterial
activity of the crude extract.[15]
Isolation of new metabolites has been performed from water/acetone crude extract of both adsorber
resin XAD-16 and cell mass. Preparative LC-MS was employed for the initial fractionation which
facilitated the rapid collection of target compounds according to online mass detection. Target
enriched fractions were subsequently subjected to semi-preparative HPLC as final purification step
which yielded the pure hyalachelins. Planar structures were elucidated by means of 1D- and 2D-NMR
data together with high resolution ESI+-MS/MS fragmentation experiments.
Hyalachelins are characterized by possessing an unusual isoquinoline ring bearing an oxo group at C-
1 and α-hydroxy acid at C-3, altogether forming unprecedented unit 3,7,8-trihydroxy-1-oxo-1,2,3,4-
tetrahydroisoquinoline-3-carboxylic acid. They differ in their side chain either bearing phenyl, phenol
or indol rings. (Figure 5.3, B)
Due to the absence of useful proton in the structure which could show diagnostic NOE correlation
with H-4 (for the assignment of the relative configuration at C-3 and C-4) and low yield of isolated
compounds, full elucidation of the stereochemical configuration was carried out by collaborators Dr.
G. Lauro and Prof. G. Bifulco (University of Salerno, Italy) using quantum mechanical (QM)
calculation of NMR parameters and CD spectra.[16]
[17]
The NMR chemical shifts provide valuable information regarding the structure of the molecule.
Despite the planar structure elucidation, the relative configuration of the molecule under examination
is predicted by means of chemical shifts. Based on this, universal NMR database has been developed
for the assignment of relative configuration.[18]
Besides this, theoretical NMR parameters (13
C, 1H
chemical shifts and J-coupling values) can be readily obtained by QM calculation of all possible
stereoisomers.[17]
Subsequent comparison to the experimental data suggests the relative configuration
for the compound under examination. Significant computational developments on QM calculations
brought this approach more applicable by consuming less time and resulting more accurate data.[16]
This widely applied method was used for the determination of relative configuration of hyalachelin B

Discussions
98
in the laboratory of Prof. Bifulco. Both calculated chemical shifts and 3JC3-H4 value of isomer
2'S*,3S*,4R* were obtained with significant lowest mean absolute error (MAE) values, thus the
relative configuration of hyalachelin B was assigned as 2'S*,3S*,4R*.
Comparison of calculated and experimentally obtained CD spectra is an excellent tool for the
assignment of absolute configuration and it is being used extensively for many complex natural
compounds. Since the chiroptical behavior of a chiral compound depends on the spatial orientation of
its chromophoric group, the CD spectrum is conformation dependent and clearly demonstrates the
absolute configuration of chiral molecule.[19]
Accordingly, the Boltzmann-weighted CD spectra were
calculated for all possible stereoisomers of hyalachelin B (2'S,3R,4R; 2'S,3S,4R; 2'S,3R,4S and
2'S,3S,4S) and their enantiomers after optimization of the minimum energy conformers. Direct
comparison demonstrated the CD curve of isomer 2'S,3S,4R closely fits to the experimental one and
suggested the absolute configuration as 2'S,3S,4R (Figure 3.5). Moreover, the absolute configuration
of structurally related myxochelin was determined as S on C-2'[20]
thus further supports our findings.
In contrast, calculated CD spectra of other isomers showed no significant similarity as depicted in
Figure S3.5.
High structural resemblance of the hyalachelins to that of myxochelin possessing even same absolute
configuration implied they might have common biosynthetic pathways. The structure of hyalachelins
suggested that they could be formed from myxochelin by incorporation of tyrosine, phenylalanine or
tryptophan. Hypothetically this amino acid incorporation occurred from a series of biochemical
reactions, such as transamination to eliminate the amino group from the incorporated amino acid,
hydroxylation on its α position and unusual C-C bond formation between C-4 and C-5 of hyalachelins
(Figure 5.4). Another possible biosynthetic pathway for hyalachelins is that they are assembled from a
distinct gene cluster than myxochelin showing high similarity to the one of myxochelin. The gene
cluster for hyalachelin should contain additional genes that are responsible for incorporation of the
aromatic amino acids and carry out the above mentioned biochemical reactions.
Figure 5.4 Postulated biosynthesis of hyalachelin A generated from myxochelin B
However, the challenging issue of the hyalachelin project was their very low final titer (15-30 µg/L).
Various experiments were performed towards the yield enhancement, including different growth

Discussions
99
media, production MD1G medium with various concentrations of ingredients as well as different
cultivation flasks (baffled and normal glass Erlenmeyer flasks as well as plastic cultivation bottles).
Highest production was observed in the plastic cultivation bottle Ultra Yield FlaskTM
(Thomson
Instrument Company, USA) in which the cell grows in suspension and with higher velocity in
comparison to the glass flasks (data not shown). Observation of higher yield might be related to the
chelating property of hyalachelins because their production is regulated by the present iron amount
and the normal glass wares contain glass-bound iron.
Thus, it was assumed that iron-limiting conditions could lead to an improved hyalachelin yield. In
order to create such appropriate conditions, various experiments were performed by treating the
growth medium with Chelex 100 resin beads or washing the cultivation flask with Chelex before
usage. Unfortunately, no cell growth was observed under resin treated condition suggesting that the
Chelex removed most of the iron and the remaining iron in the medium is insufficient for the growth.
Therefore, FeCl3 (5-200 µM) was added to the Chelex treated medium and LC-MS data showed no
production enhancement.
Once the growth conditions were optimized, the cultivation was performed 16 times in 12 Ultra Yield
FlaskTM
bottles each contained 800 mL production media to accumulate enough amount of pure
compounds. During the purification procedure, it was found out that the hyalachelins were unstable
when exposed to light. Assumingly, it might happen due to the presence of unstable and highly
reactive hemi-aminal functionality which could lead to the opening of the isoquinoline ring.
There are over 500 different siderophores, of which 270 have been structurally characterised.[21]
This
promising group of compounds shows diverse important biological activities in clinical use as
mentioned before (Chapter 1.2.2). The identification of the new unusual siderophore hyalachelins is
another contribution to this intriguing class of molecules. The uncommon structural feature of
hyalachelins is the multisubstituted isoquinoline ring which is not reported from natural products to
date. Although, the structurally related catecholate type myxochelin occurs often in many
myxobacteria,[22]
[23]
[24]
the more complex hyalachelins were described for the first time in current
study from the underexplored species H. minutum. Discovery of this new siderophores also
demonstrates the biosynthetic capability of myxobacteria is being exploited to produce unusual novel
natural compounds.
5.4. Cystochromones - Structures and Insights into the Biosynthesis
The genus Cystobacter is well-known among myxobacteria for its biosynthetic potential producing
diverse bioactive secondary metabolites such as the protein synthesis inhibitor althiomycin,[25]
the
potent antifungal metabolite melithiazol,[26]
and the antibiotic roimatacene active against Gram-
negative bacteria,[27]
as few examples. The strain MCy9104 was isolated in 2006 (by Dr. R. Garcia,

Discussions
100
HIPS) from a soil sample collected in Manila, Philippines and is classified as Cystobacter sp. on the
basis of the morphological and phylogenetic analysis.
In the course of chemical screening of myxobacteria aimed at the discovery of novel metabolites,
crude extract of the strain MCy9104 was appealing due to the existence of unknown compounds,
whose isolation and characterization are described in the present thesis. Cultivation of the strain in the
complex growth medium CLF has triggered the biosynthesis of a family of new metabolites, termed
cystochromones. Dereplication of the new compounds has been done by means of the LC-MS data in
comparison to the in-house myxobacterial compound database “Myxobase”. XAD-16 was used to
capture the metabolites from the culture supernatant and subsequent extraction procedure guided by
solvent polarity (apolar to polar) led to an enrichment of cystochromones in the ethyl acetate extract.
Size exclusion chromatography on Sephadex LH-20 was performed as initial fractionation and
cystochromones enriched fractions were further subjected to semi-preparative HPLC to obtain pure
metabolites.
Cystochromone A occurred as the main metabolite in the highest titer (ca. 500 µg/L) while the others
were produced in much lower yield (ca. 25-60 µg/L). CDCl3 was the proper NMR solvent for most
nonpolar cystochromone A, B and F whereas methanol-d4 was used for the others to acquire good
NMR data since they are not soluble in CDCl3. Accordingly, planar structures were elucidated by
means of comprehensive NMR data.
The name “cystochromones” was derived by merging the name of the producer strain Cystobacter
with “chromone” that represents the core scaffold. Chromone C-2 bears either a propan-2-one moiety
(cystochromone A-C and G) or its reduced analogue propan-2-ol (cystochromone D-F). C-7 of the
chromone ring is substituted with a hydroxyl group in all cystochromones while cystochromone F
carries an L-rhamnose residue at this position. C-5 is substituted with various saturated long alkyl
chains differing in their oxidation state, and length of the chain (C14 – C15). Careful analysis of
comprehensive 2D NMR data and tandem HR-MS experiment suggested the oxidation occurred at C-
7'' and C-8'' of cystochromone D, forming 8,14-dihydroxy-14-methylpentadecan-7-one residue while
cystochromone F possesses a single oxidation at C-6''. (Figure 5.5)
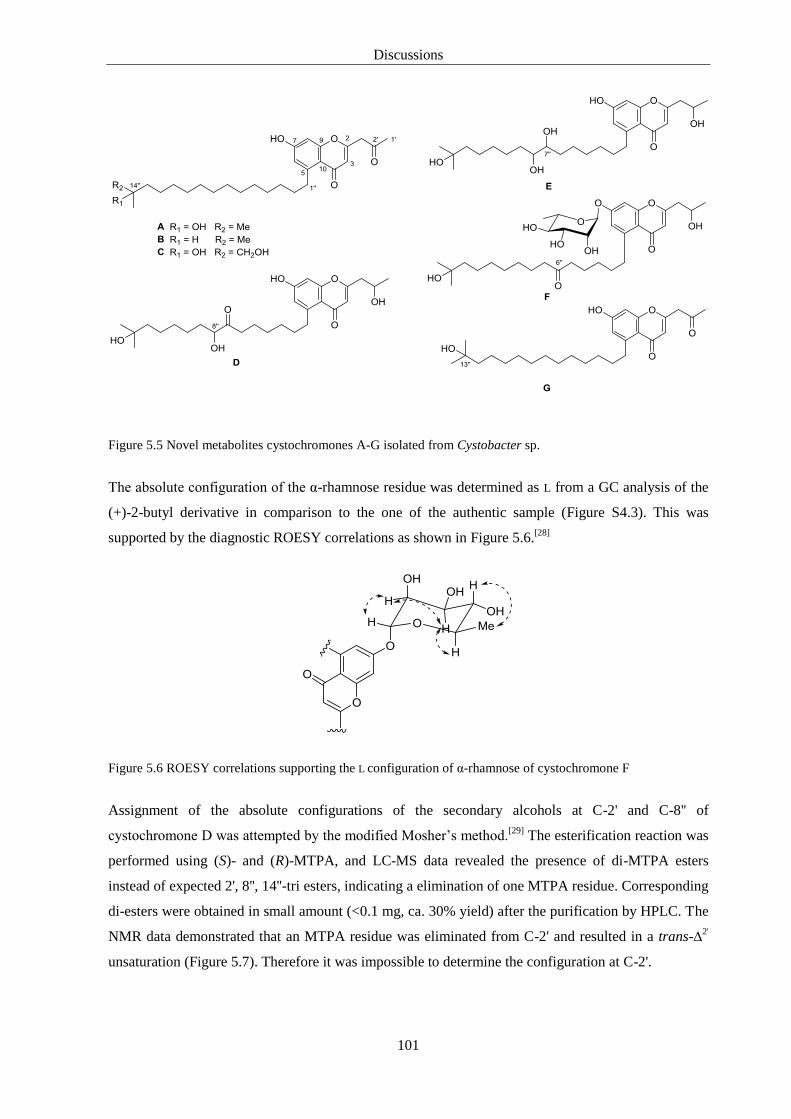
Discussions
101
Figure 5.5 Novel metabolites cystochromones A-G isolated from Cystobacter sp.
The absolute configuration of the α-rhamnose residue was determined as L from a GC analysis of the
(+)-2-butyl derivative in comparison to the one of the authentic sample (Figure S4.3). This was
supported by the diagnostic ROESY correlations as shown in Figure 5.6.[28]
Figure 5.6 ROESY correlations supporting the L configuration of α-rhamnose of cystochromone F
Assignment of the absolute configurations of the secondary alcohols at C-2' and C-8'' of
cystochromone D was attempted by the modified Mosher’s method.[29]
The esterification reaction was
performed using (S)- and (R)-MTPA, and LC-MS data revealed the presence of di-MTPA esters
instead of expected 2', 8'', 14''-tri esters, indicating a elimination of one MTPA residue. Corresponding
di-esters were obtained in small amount (<0.1 mg, ca. 30% yield) after the purification by HPLC. The
NMR data demonstrated that an MTPA residue was eliminated from C-2' and resulted in a trans-∆2'
unsaturation (Figure 5.7). Therefore it was impossible to determine the configuration at C-2'.

Discussions
102
Figure 5.7 8'', 14''-di-MTPA ester of cystochromone D
Moreover, NMR data showed the presence of split signals corresponding to the diagnostic protons (H-
5'' – H-9'') that interfered with the absolute configuration assignment of C-8''. It was anticipated that
this might happen due to the keto-enol tauromerization on C-7''/C-8''. Therefore the configuration of
C-8'' remained elusive. Due to the fact that the cystochromones were obtained in very low yield, the
stereochemistry of the secondary alcohols of cystochromones D-E remained unsolved.
To gain insights into the biosynthetic origin of cystochromones, feeding experiments have been
carried out with isotopically labeled precursors. Indeed 13
C labeled acetate fed experiments have
revealed incorporation of intact acetate units for the carbon skeleton of chromone ring including C-1'
– C-3' as well as C-1'' – C-11''. Moreover, LC-MS data of the [D10]leucine fed culture indicated the
rest of the molecule C-12'' – C-16'' was originated from leucine-derived starter unit (Figure 5.8) as
seen by mass shift of 8 daltons.
With this data in hand, a biosynthetic pathway for the cystochromones have been proposed (Figure
5.8). Assumingly, a hybrid fatty acid and polyketide synthase (FA/PKS) pathway initiates with
transamination of a leucine to the corresponding α-ketoisocaproate which is further converted to
isovaleryl-CoA.[30]
Furthermore, six elongation steps with malonate take place to generate 15-
methylhexadecanoic acid. The latter serves as the starter unit for the second part of the biosynthesis -
PKS with malonate as extender.
The resulting polyketide chain is further cyclized/aromatized to generate a 7-hydroxy-chromone ring
bearing a 2-methylpentadecane chain at position 5 as well as 3-oxobutanoic acid residue at position 2.
Interestingly, the 13
C NMR spectrum of cystochromone A derived from 13
C2 labeled acetate indicated
the resonance corresponding to C-1' as singlet, although it was labeled as 2-13
C acetate. This finding
suggested a decarboxylation from 3-oxobutanoic acid resulting in propan-2-one.

Discussions
103
Figure 5.8 Biosynthesis of representative cystochromone A showing the incorporation of intact acetate and
leucine precursors. Box with bold line illustrates iso-FA pathway and box with dashed line illustrates
PKS
Biosynthesis of an iso-FA resulting from a branched chain amino acid is well known pathway from
myxobacteria.[30]
[31]
Valine, leucine and isoleucine are converted into respective α-keto acids by
separate transaminases and then oxidatively decarboxylated by the Bkd complex (branched chain keto
acid dehydrogenase), resulting in the coenzyme A esters of isobutyric acid (IBA), isovaleric acid
(IVA) and 2-methyl butyric acid (2MBA). These primers are employed in the iso-FA biosynthesis
such as the IBA generates iso-even FA and IVA generates iso-odd FA while 2MBA creates ante-iso
FA.[32]
The fact that formation of iso-even FAs from the iso-odd FAs occur by α-oxidation[31]
suggests that
aliphatic chain of cystochromone G (one methylene unit less) could be generated from 15-
methylhexadecanoic acid in the early stage of the biosynthesis of cystochromones. However, a “pure”
PKS pathway shouldn’t be excluded for the biosynthesis of cystochromones.
Various branched amino acid derived iso-FA containing metabolites have been reported from
myxobacteria such as the lipopeptide cystomanamides,[33]
as well as the antifungal lipopeptide
cyrmenins.[34]
Moreover, these modified precursors are not only utilized for FA synthesis but many
myxobacterial polyketides employ them as starter units, e.g. the electron-transfer chain inhibitors
myxothiazols[35]
[32]
and myxalamids[36]
[37]
(Figure 5.9).

Discussions
104
Figure 5.9 Myxobacterial metabolites possessing branched chain FA, bold line indicated the part derived from
branched chain amino acid via iso-FA pathway
The most remarkable feature of the cystochromones is the unprecedented substitutional position of the
pentadecyl moiety that attached to the C-5 of the chromone ring. Among known chromone ring-
bearing molecules, the long chain substitution is usually located on C-2, as observed in myxobacterial
stigmatellins.[38]
Many other plant derived chromone derivatives have been reported that bear various
substitutions on position C-2 of the chromone ring such as aromatic side chain as in aquilarone I from
resinous wood of Aquilaria sinensis[39]
or branched aliphatic chain as in urachromone B isolated from
aerial part of Hypericum henry.[40]
Pestalotiopsones A-F are chromones isolated from Chinese
Mangrove plant Rhizophora mucronata, having both an alkyl side chain substituted at the C-2 and a
free or substituted carboxyl group at the C-5.[41]
(Figure 5.10)
On top of that, cystochromone F appears as the first example of a chromone derivative that bears the
deoxysugar rhamnose on position C-7 whereas glucose is a common sugar residue found in the
chromone family.[42]

Discussions
105
Figure 5.10 Chromone bearing natural products isolated from different bacteria and plants
From the biosynthetic point of view, the intriguing part of the cystochromone structure is the
chromone ring. Biosynthesis of the structurally related myxobacterial metabolites, the isochromanone
ajudazole[43]
(Figure 5.10) and the chromone ring-breaing stigmatellins[44]
(Figure 1.3) were
intensively investigated. In general, bacterial type III PKS is capable of producing both aromatic and
linear structures.[45]
[46]
Surprisingly, stigmatellin is encoded by an unusual type I PKS, which is
generally known to produce non-aromatic compounds.[45]
[47]
Moreover, the chromone ring of
stigmatellin is formed by a novel type of cyclase domain (Cy) located at the end of the assembly
line.[38]
In the case of ajudazol, the AjuTE domain, a novel class of type I TE, plays a role as the
accelerator in the spontaneous formation of the isochromanone ring.[48]
Both cyclisation/aromatization
seem plausible for the chromone ring formation in the cystochromones. In addition, a type II PKS-like
ring closing mechanism[49]
should not be excluded and further investigation should be carried out to
clarify this intriguing biochemistry.
Bioactivity test evaluation of cystochromone A was performed with different bacteria, fungi and cell
lines and no significant inhibition was observed. However, chromone is a powerful core for bioactive
secondary metabolites obtained from both plants and microorganisms.[50]
Diverse significant
therapeutic activities have been attributed to simple chromone ring-bearing molecules and analogues.
Among them, anti-inflammatory, anticancer, antibacterial, diuretics and antioxidant activity have been
described. Moreover, since the chromone is a promising scaffold for medicinal chemistry, huge effort
has been put in synthetic chemistry for drug development against various diseases.[42]
Discussions
106
Although the genus Cystobacter is rather broadly studied well-known source of diverse natural
products, the discovery of cystochromones suggests that the screening of newly isolated strain
belonging to “well-studied genus” is worthy for the exploration of novel natural molecules.
Summary
The main achievement of this work was the discovery of two new families of compounds,
hyalachelins and cystochromones together with a new derivative of the sponge-derived peptide
microsclerodermins from myxobacteria. These results provide another evidence that these gram
negative bacteria are warranted sources of novel secondary metabolites and further exploration into
myxobacterial natural products has the potential to find new molecules bearing unique chemical
structures.
5.5. References
[1] B. Kunze, B. Bohlendorf, H. Reichenbach, G. Höfle, J. Antibiot. 2008, 61, 18–26.
[2] E. W. Schmidt, D. J. Faulkner, Tetrahedron. 1998, 54, 3043–3056.
[3] C. A. Bewley, C. Debitus, D. J. Faulkner, J. Am. Chem. Soc. 1994, 116, 7631–7636.
[4] B. Kunze, R. Jansen, F. Sasse, G. Höfle, H. Reichenbach, J. Antibiot. 1998, 51, 1075–1080.
[5] K. L. Erickson, J. A. Beutler, J. H. Cardellina, M. R. Boyd, J. Org. Chem. 1997, 62, 8188–8192.
[6] H. Y. He, D. J. Faulkner, J. Org. Chem. 1989, 54, 5822–5824.
[7] H. Irschik, W. Trowitzsch-Kienast, K. Gerth, G. Höfle, H. Reichenbach, J. Antibiot. 1988, 41, 993–998.
[8] T. A. Johnson, J. Sohn, Y. M. Vaske, K. N. White, T. L. Cohen, H. C. Vervoort, K. Tenney, F. A.
Valeriote, L. F. Bjeldanes, P. Crews, Bioorg. Med. Chem. 2012, 20, 4348–4355.
[9] M. Adamczeski, E. Quinoa, P. Crews, J. Am. Chem. Soc. 1989, 111, 647-654.
[10] E. W. Schmidt, A. Y. Obraztsova, S. K. Davidson, D. J. Faulkner, M. G. Haygood, Marine Biology 2000,
136, 969–977.
[11] R. Garcia, R. Müller in The Prokaryotes E. Rosenberg, E. DeLong, S. Lory, E. Stackebrandt, F.
Thompson, Eds.; Springer-Verlag: Berlin Heidelberg, 2014.
[12] A. Plaza, K. Viehrig, R. Garcia, R. Müller, Organic letters 2013, 15, 5882–5885.
[13] P. W. Okanya, K. I. Mohr, K. Gerth, H. Steinmetz, V. Huch, R. Jansen, R. Müller, J. Nat. Prod. 2012, 75,
768–770.
[14] P. W. Okanya, K. I. Mohr, K. Gerth, W. Kessler, R. Jansen, M. Stadler, R. Müller, J. Nat. Prod. 2014, 77,
1420–1429.
[15] H. Irschik, D. Schummer, K. Gerth, G. Höfle, H. Reichenbach, J. Antibiot. 1995, 48, 26–30.
[16] G. Bifulco, P. Dambruoso, L. Gomez-Paloma, R. Riccio, Chem. Rev. 2007, 107, 3744–3779.
[17] S. D. Micco, M. G. Chini, R. Riccio, G. Bifulco, Eur. J. Org. Chem. 2010, 8, 1411-1432.

Discussions
107
[18] Y. Kobayashi, C. H. Tan, Y. Kishi, Angew. Chem. Int. Ed. 2000, 39, 4279.
[19] G. Bringmann, T. Bruhn, K. Maksimenka, Y. Hemberger, Eur. J. Org. Chem. 2009, 17, 2717-2727.
[20] S. Miyanaga, T. Obata, H. Onaka, T. Fujita, N. Saito, H. Sakurai, I. Saiki, T. Furumai, Y. Igarashi, J.
Antibiot. 2006, 59, 698–703.
[21] R. C. Hider, X. Kong, Nat. Prod. Rep. 2010, 27, 637–657.
[22] B. Kunze, N. Bedorf, W. Kohl, G. Höfle, H. Reichenbach, J. Antibiot. 1989, 42, 14–17.
[23] Y. Li, K. J. Weissman, R. Müller, J. Am. Chem. Soc. 2008, 130, 7554–7555.
[24] B. Silakowski, B. Kunze, G. Nordsiek, H. Blöcker, G. Höfle, R. Müller, Eur. J. Biochem. 2000, 267, 6476–
6485.
[25] B. W. Bycroft, R. Pinchin, J. Chem. Soc., Chem. Commun. 1975, 121–122.
[26] B. Böhlendorf, M. Herrmann, H. J. Hecht, F. Sasse, E. Forche, B. Kunze, H. Reichenbach, G. Höfle, Eur.
J. Org. Chem. 1999, 10, 2601–2608.
[27] W. Zander, K. Gerth, K. l. Mohr, W. Kessler, R. Jansen, R. Müller, Chem-Eur J 2011, 17, 7875–7881.
[28] B. Ohlendorf, W. Lorenzen, S. Kehraus, A. Krick, H. B. Bode, G. König, J. Nat. Prod. 2009, 72, 82–86.
[29] T. R. Hoye, C. S. Jeffrey, F. Shao, Nat. Protoc. 2007, 2, 2451–2458.
[30] H. B. Bode, J. S. Dickschat, R. M. Kroppenstedt, S. Schulz, R. Müller, J. Am. Chem. Soc. 2005, 127, 532–
533.
[31] J. S. Dickschat, H. B. Bode, R. M. Kroppenstedt, R. Müller, S. Schulz, Org. Biomol. Chem. 2005, 3, 2824–
2831.
[32] T. Mahmud, H. B. Bode, B. Silakowski, R. M. Kroppenstedt, M. Xu, S. Nordhoff, G. Höfle, R. Müller, J.
Biol. Chem. 2002, 277, 23768–32774.
[33] L. Etzbach, A. Plaza, R. Garcia, S. Baumann, R. Müller, Org. Lett. 2014, 16, 2414–2417.
[34] T. Leibold, F. Sasse, H. Reichenbach, G. Höfle, Eur. J. Org. Chem. 2004, 2, 431–435.
[35] G. Thierbach, H. Reichenbach, Biochim. Biophys. Acta. 1981, 638, 282–289.
[36] K. Gerth, R. Jansen, G. Reifenstahl, G. Höfle, H. Irschik, B. Kunze, H. Reichenbach, G. Thierbach, J.
Antibiot. 1983, 36, 1150–1156.
[37] B. Silakowski, G. Nordsiek, B. Kunze, H. Blöcker, R. Müller, Chem. Biol. 2001, 8, 59–69.
[38] N. Gaitatzis, B. Silakowski, B. Kunze, G. Nordsiek, H. Blöcker, G. Höfle, R. Müller, J. Biol. Chem. 2002,
277, 13082–13090.
[39] D. Chen, Z. Xu, X. Chai, K. Zeng, Y. Jia,D. Bi, Z. Ma, P. Tu, Eur. J. Org. Chem. 2012, 27, 5389-5397.
[40] X.-Q. Chen, Y. Li, X. Cheng, K. Wang, J. He, Z.-H. Pan, M.-M. Li, L.-Y. Peng, G. Xu, Q.-S. Zhao, Chem.
Biodiversity. 2010, 7, 196-204.
[41] J. Xu, J. Kjer, J. Sendker, V. Wray, H. Guan, R. Edrada, W. Lin, J. Wu, P. Proksch, J. Nat. Prod. 2009, 72,
662–665.
[42] A. Gaspar, M. J. Matos, J. Garrido, E. Uriarte, F. Borges, Chem. Rev. 2014, 114, 4960–4992.
[43] B. Kunze, R. Jansen, G. Höfle, H. Reichenbach, J. Antibiot. 2004, 57, 151–155.
[44] B. Kunze, T. Kemmer, G. Höfle, H. Reichenbach, J. Antibiot. 1984, 37, 454–461.
[45] D. E. Cane, Chem. Rev. 1997, 7, 2463-2464.
[46] B. Shen, Top. Curr. Chem. 2000, 209, 1–51.
Discussions
108
[47] J. Staunton, B. Wilkinson in Topics in Current Chemistry. A. Meijere, K. Houk, H. Kessler, J. Lehn, S.
Ley, S. Schreiber, J. Thiem Eds.; Springer Verlag: Berlin, 1998.
[48] K. Buntin, K. J. Weissman, R. Müller, Chem. Bio. Chem. 2010, 11, 1137–1146.
[49] C. Hertweck, A. Luzhetskyy, Y. Rebets, A. Bechthold, Nat. Prod. Rep. 2007, 24, 162–190.
[50] S. Khadem, R. J. Marles, Molecules. 2011, 17, 191–206.
109
Author’s Contribution in the Work Presented in this Thesis
Chapter 2
The author carried out the cultivation of the strain MSr9139 and performed the extraction, purification
as well as the NMR data acquisition of microsclerodermin D and L. Further the author assigned the
structure of microsclerodermins based on the NMR data. The author carried out the cultivation of the
strain MSr9139 in the presence of various halogenated salts and analyzed the corresponding LC-MS
data.
Chapter 3
The author involved in the LC-NMR screening of the strain MCy9135 and dereplication process.
Further the author performed the cultivation of the strain, isolated the hyalachelins and acquired the
NMR data. The author elucidated the planar structures of hyalachelins and performed the CAS assay.
Chapter 4
The author performed the screening of the strain MCy9104, cultivation in production medium,
planned the strategy of the purification and isolated the cystochromones. The author acquired the
NMR data, elucidated the structures and carried out the Mosher analysis as well as methoxylation
reaction. Further, the author performed the feeding experiment and analyzed the LC-MS and 13
C-
NMR data.

Appendix
110
6. Appendix
6.1. Microsclerodermins
1H NMR spectrum of microsclerodermin L in DMSO-d6
HSQC spectrum of microsclerodermin L in DMSO-d6

Appendix
111
HMBC spectrum of microsclerodermin L in DMSO-d6
COSY spectrum of microsclerodermin L in DMSO-d6

Appendix
112
2D TOCSY spectrum of microsclerodermin L in DMSO-d6
ROESY spectrum of microsclerodermin L in DMSO-d6

Appendix
113
1H NMR spectrum of microsclerodermin D in DMSO-d6
HSQC spectrum of microsclerodermin D in DMSO-d6

Appendix
114
HMBC spectrum of microsclerodermin D in DMSO-d6
6.2. Hyalachelins
1H-NMR spectrum of hyalachelin A in CD3OD (700MHz)

Appendix
115
13C-NMR spectrum of hyalachelin A in CD3OD (175MHz)
HSQC spectrum of hyalachelin A in CD3OD (700MHz)

Appendix
116
HMBC spectrum of hyalachelin A in CD3OD (700MHz)
COSY spectrum of hyalachelin A in CD3OD (700MHz)

Appendix
117
2D-TOCSY spectrum of hyalachelin A in CD3OD (700MHz)
ROESY spectrum of hyalachelin A in CD3OD (700MHz)

Appendix
118
1H-NMR spectrum of hyalachelin B in CD3OD (500MHz)
13C-NMR spectrum of hyalachelin B in CD3OD (125MHz)

Appendix
119
HSQC spectrum of hyalachelin B in CD3OD (500MHz)
HMBC spectrum of hyalachelin B in CD3OD (500MHz)

Appendix
120
COSY spectrum of hyalachelin B in CD3OD (700MHz)
1H NMR spectrum of hyalachelin C in CD3OD (700 MHz)

Appendix
121
13C-NMR spectrum of hyalachelin C in CD3OD (175MHz)
HSQC spectrum of hyalachelin C in CD3OD (700 MHz)

Appendix
122
HMBCspectrum of hyalachelin C in CD3OD (700 MHz)
COSY spectrum of hyalachelin C in CD3OD (700 MHz)

Appendix
123
1H-NMR spectrum of hyalachelin B in DMSO-d6 (700 MHz)
HSQC spectrum of hyalachelin B in DMSO-d6 (700 MHz)

Appendix
124
HMBC spectrum of hyalachelin B in DMSO-d6 (700 MHz)
J-resolved HMBC spectrum of hyalachelin B in CD3OD (700 MHz)

Appendix
125
6.3. Cystochromones
1H-NMR spectrum of cystochromone A in CDCl3 (500 MHz)
13C-NMR spectrum of cystochromone A in CDCl3 (500 MHz)
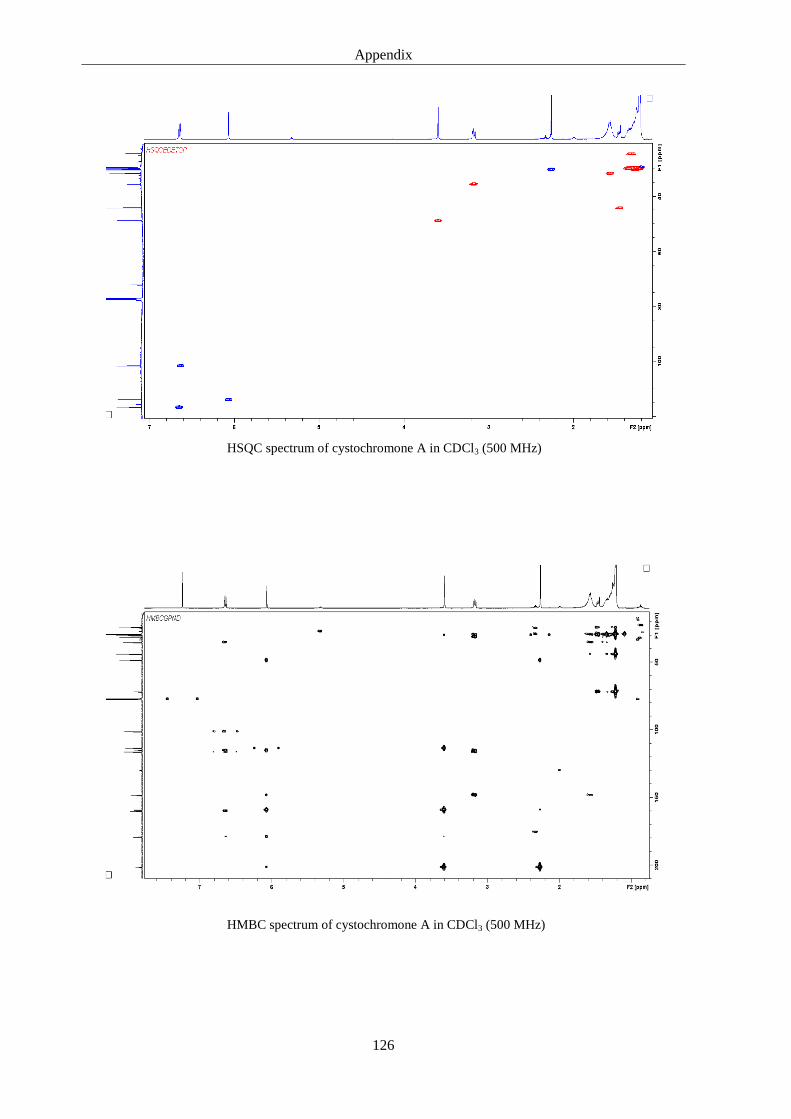
Appendix
126
HSQC spectrum of cystochromone A in CDCl3 (500 MHz)
HMBC spectrum of cystochromone A in CDCl3 (500 MHz)

Appendix
127
COSY spectrum of cystochromone A in CDCl3 (500 MHz)
TOCSY spectrum of cystochromone A in CDCl3 (500 MHz)

Appendix
128
1H-NMR spectrum of cystochromone B in CDCl3 (700 MHz)
HSQC spectrum of cystochromone B in CDCl3 (700 MHz)

Appendix
129
HMBC spectrum of cystochromone B in CDCl3 (700 MHz)
COSY spectrum of cystochromone B in CDCl3 (700 MHz)

Appendix
130
1H-NMR spectrum of cystochromone C in MeOD4 (500 MHz)
HSQC spectrum of cystochromone C in MeOD4 (500 MHz)

Appendix
131
HMBC spectrum of cystochromone C in MeOD4 (500 MHz)
COSY spectrum of cystochromone C in MeOD4 (500 MHz)

Appendix
132
1H-NMR spectrum of cystochromone D in MeOD4 (700 MHz)
HSQC spectrum of cystochromone D in MeOD4 (700 MHz)

Appendix
133
HMBC spectrum of cystochromone D in MeOD4 (700 MHz)
COSY spectrum of cystochromone D (4) in MeOD4 (700 MHz)

Appendix
134
TOCSY spectrum of cystochromone D in MeOD4 (700 MHz)
1H-NMR spectrum of cystochromone E in MeOD4 (500 MHz)
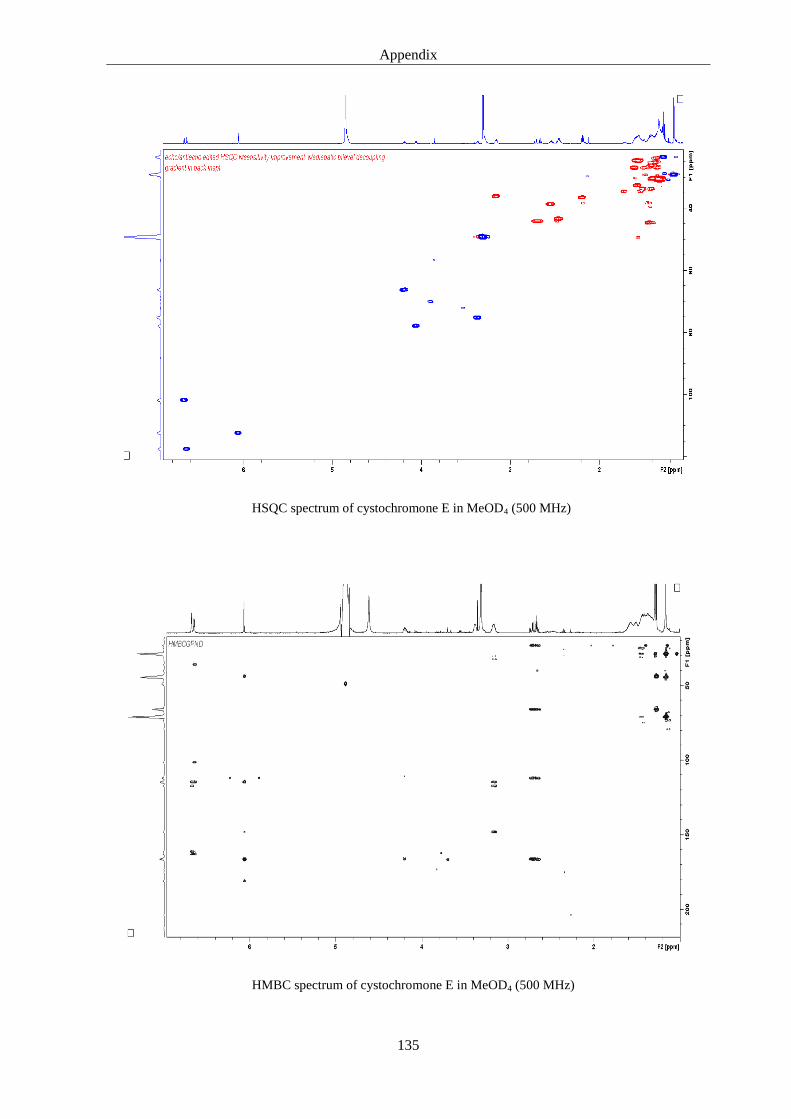
Appendix
135
HSQC spectrum of cystochromone E in MeOD4 (500 MHz)
HMBC spectrum of cystochromone E in MeOD4 (500 MHz)

Appendix
136
HSQC-TOCSY spectrum of cystochromone E in MeOD4 (500 MHz)
COSY spectrum of cystochromone E in MeOD4 (500 MHz)
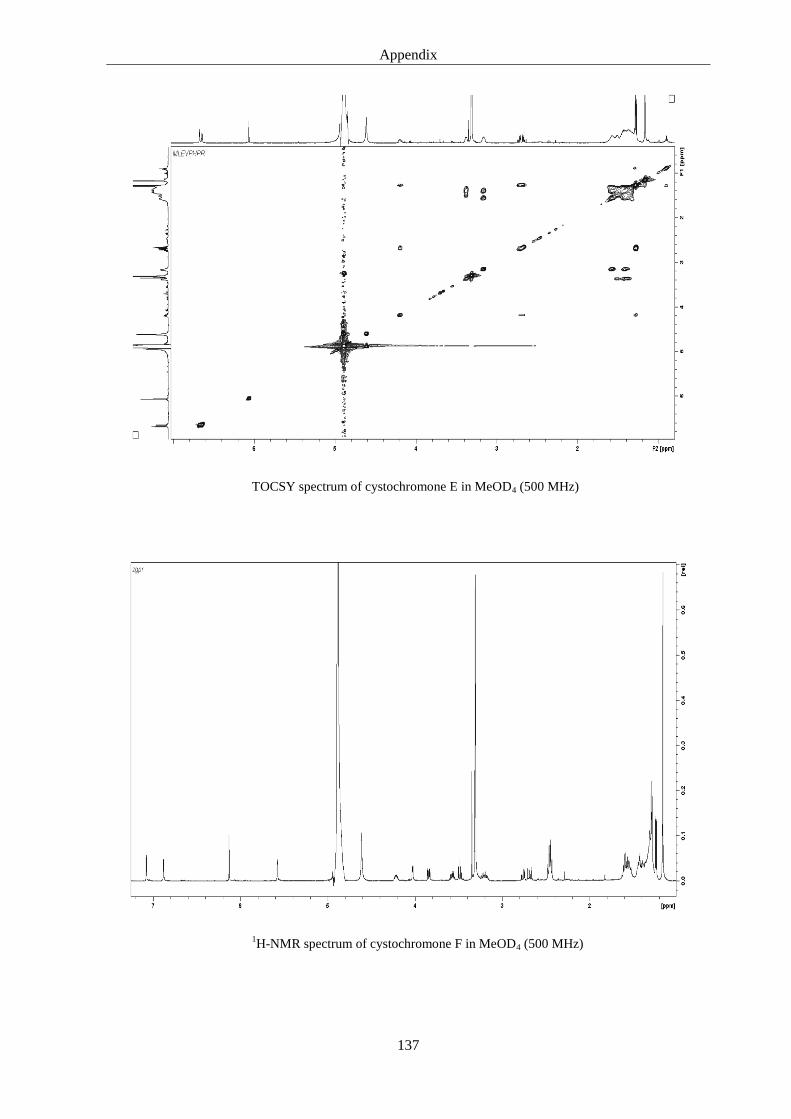
Appendix
137
TOCSY spectrum of cystochromone E in MeOD4 (500 MHz)
1H-NMR spectrum of cystochromone F in MeOD4 (500 MHz)
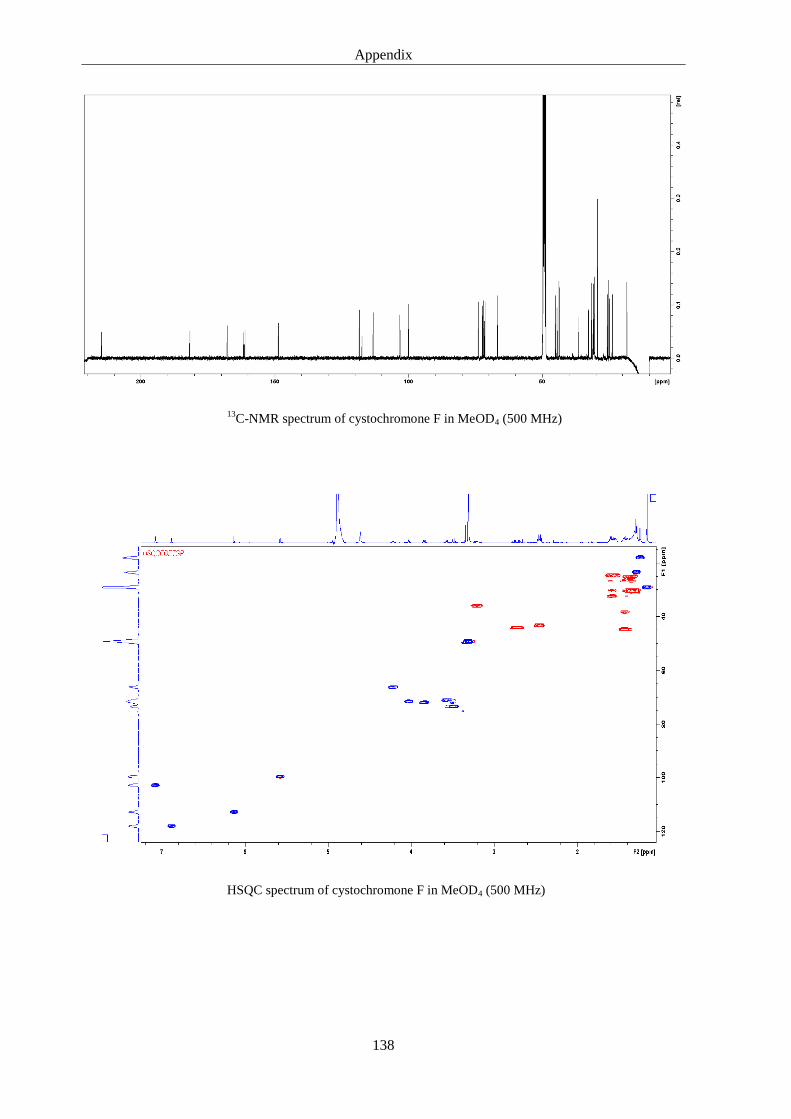
Appendix
138
13C-NMR spectrum of cystochromone F in MeOD4 (500 MHz)
HSQC spectrum of cystochromone F in MeOD4 (500 MHz)

Appendix
139
HMBC spectrum of cystochromone F in MeOD4 (500 MHz)
COSY spectrum of cystochromone F in MeOD4 (500 MHz)

Appendix
140
ROESY spectrum of cystochromone F in MeOD4 (500 MHz)
1H-NMR spectrum of cystochromone G in MeOD4 (700 MHz)
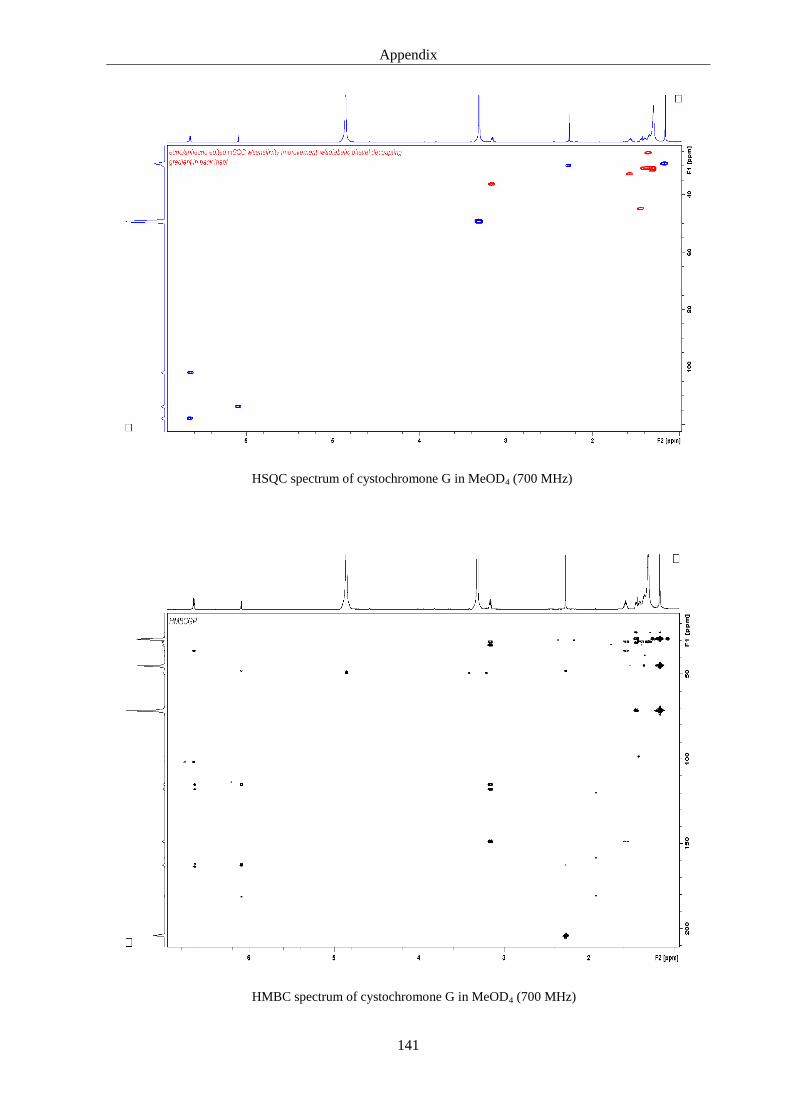
Appendix
141
HSQC spectrum of cystochromone G in MeOD4 (700 MHz)
HMBC spectrum of cystochromone G in MeOD4 (700 MHz)

Appendix
142
13C-NMR spectrum of cystochromone A in CDCl3enriched with a) non labeled, b) [1-
13C]-acetate, c) [2-
13C]-
acetate and d) [1,2-13
C]-acetate (normalized with non-labeled signal at δ 44.1)
1H-NMR spectrum of di-(S)-MTPA ester of 7-OMe-cystochromone D in MeOD4 (700 MHz)
D.
C.
B.
A.

Appendix
143
HSQC spectrum of di-(S)-MTPA ester of 7-OMe-cystochromone D in MeOD4 (700 MHz)
COSY spectrum of di-(S)-MTPA ester of 7-OMe-cystochromone D in MeOD4 (700 MHz)

Appendix
144
Expanded HSQC spectrum of di-(S)-MTPA ester of 7-OMe-cystochromone D showing two sets of methylene
signals
Expanded COSYspectrum of di-(S)-MTPA ester of 7-OMe-cystochromone D showing two sets of COSY
correlations corresponding to single signal
δ 5.24-1.76 δ 5.22-1.67
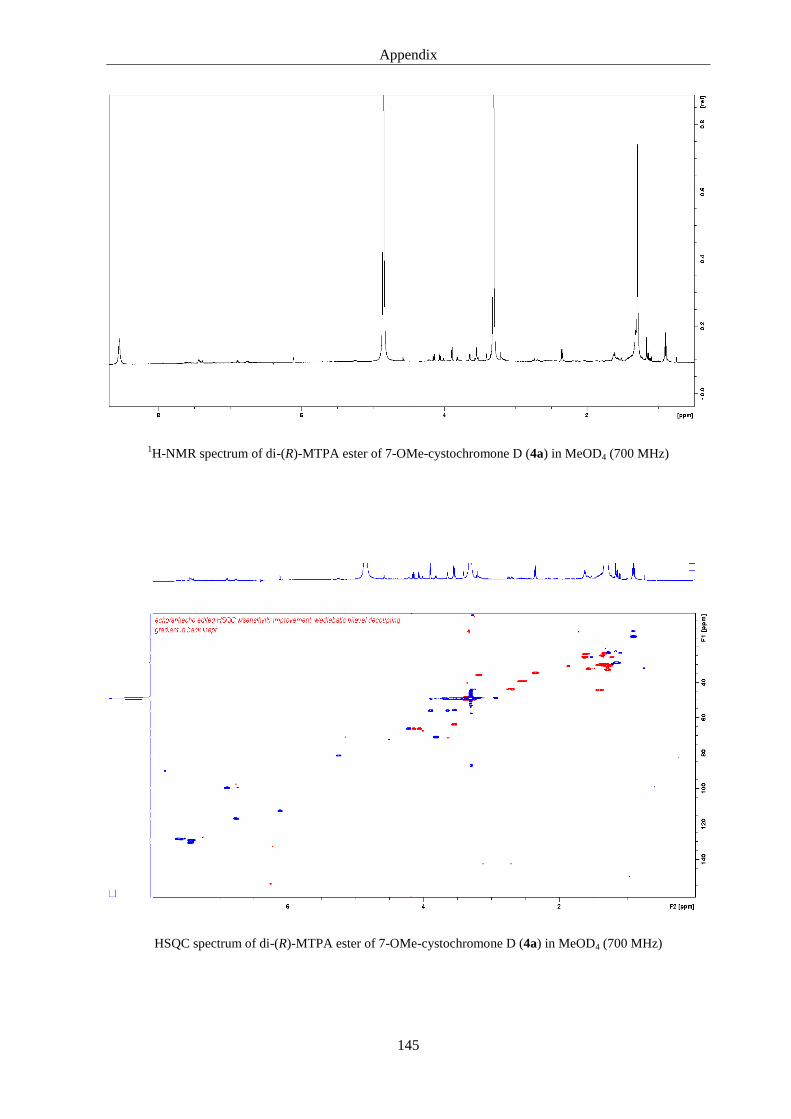
Appendix
145
1H-NMR spectrum of di-(R)-MTPA ester of 7-OMe-cystochromone D (4a) in MeOD4 (700 MHz)
HSQC spectrum of di-(R)-MTPA ester of 7-OMe-cystochromone D (4a) in MeOD4 (700 MHz)

Appendix
146
COSY spectrum of di-(R)-MTPA ester of 7-OMe-cystochromone D (4a) in MeOD4 (700 MHz)