Embed Size (px)
Citation preview
ISO New England
Energy-Efficiency Forecast
for 2019 to 2024
ISO New England Inc.
System Planning
May 1, 2015
ISO-NE PUBLIC

Energy Efficiency Forecast 2019–2024 page iii ISO-NE PUBLIC
Disclaimer
ISO New England (ISO) has been developing the energy-efficiency forecast at the request of stakeholders, who recognize the ongoing nature of energy-efficiency (EE) investment in the New England region. The ISO uses the energy-efficiency forecast for planning purposes only; the forecast does not affect any market activity pursuant to Market Rule 1, Section III.13, of the ISO’s Transmission, Markets, and Services Tariff (ISO tariff).1 The ISO does not endorse any assumptions or conclusions made by readers of this report, including but not limited to assumptions and conclusions on market behavior or market pricing. The ISO publishes this report for informational purposes only, and readers should not construe it as anticompetitive. As with any forecast, the users of this information must be aware of the limitations of all assumptions used to develop the forecast and make prudent decisions based on all available information and sound business judgment.
1 ISO New England Inc. Transmission, Markets, and Services Tariff (ISO tariff), Market Rule 1 (2014), http://www.iso-ne.com/regulatory/tariff/sect_3/index.html.
Energy Efficiency Forecast 2019–2024 page iv ISO-NE PUBLIC
Acknowledgment
The ISO New England Energy-Efficiency Forecast is a collaborative effort between ISO New England
and its stakeholders. The outcome of the EE forecast process is informed by the EE Forecast
Working Group and its members, utility program administrators, and state regulators. We wish to
thank all those who provided input to the process. The principal authors also wish to specifically
acknowledge the contributions of the New England States Committee on Electricity in promoting
this process and supporting the effort.
ISO New England Principal Authors:
Eric Winker, Ph.D., System Planning
David Ehrlich, System Planning
Eric Wilkinson, External Affairs

Energy Efficiency Forecast 2019–2024 page v ISO-NE PUBLIC
Contents
Disclaimer ............................................................................................................................................................. iii
Acknowledgment .................................................................................................................................................. iv
Figures ................................................................................................................................................................. vii
Tables .................................................................................................................................................................... x
Section 1 Executive Summary ............................................................................................................................................... 1
1.1 Overview ............................................................................................................................................................. 1
1.2 EE Forecast Methodology.................................................................................................................................... 1
1.3 Results ................................................................................................................................................................. 2
Section 2 Introduction ........................................................................................................................................................... 5
2.1 Background.......................................................................................................................................................... 5
2.2 Energy Efficiency in New England ....................................................................................................................... 6
2.3 Early Development of the Energy-Efficiency Forecast ........................................................................................ 8
2.4 Energy-Efficiency Forecast Working Group ......................................................................................................... 9
Section 3 Forecast Methodology ......................................................................................................................................... 10
3.1 EE Forecast Model ............................................................................................................................................. 10
3.1.1 Calculations for Future Energy Reductions ................................................................................................ 10
3.1.2 Model Uncertainty Factors ........................................................................................................................ 11
3.2 Budget Model .................................................................................................................................................... 11
Section 4 Data Collection .................................................................................................................................................... 15
4.1 Data-Collection Process ..................................................................................................................................... 15
4.2 Data-Collection Results ..................................................................................................................................... 17
4.3 EE Forecast Input Data ...................................................................................................................................... 27
Section 5 Results of New England’s 2014 Energy-Efficiency Forecast .................................................................................. 34
5.1 Regional Load Forecast ..................................................................................................................................... 35
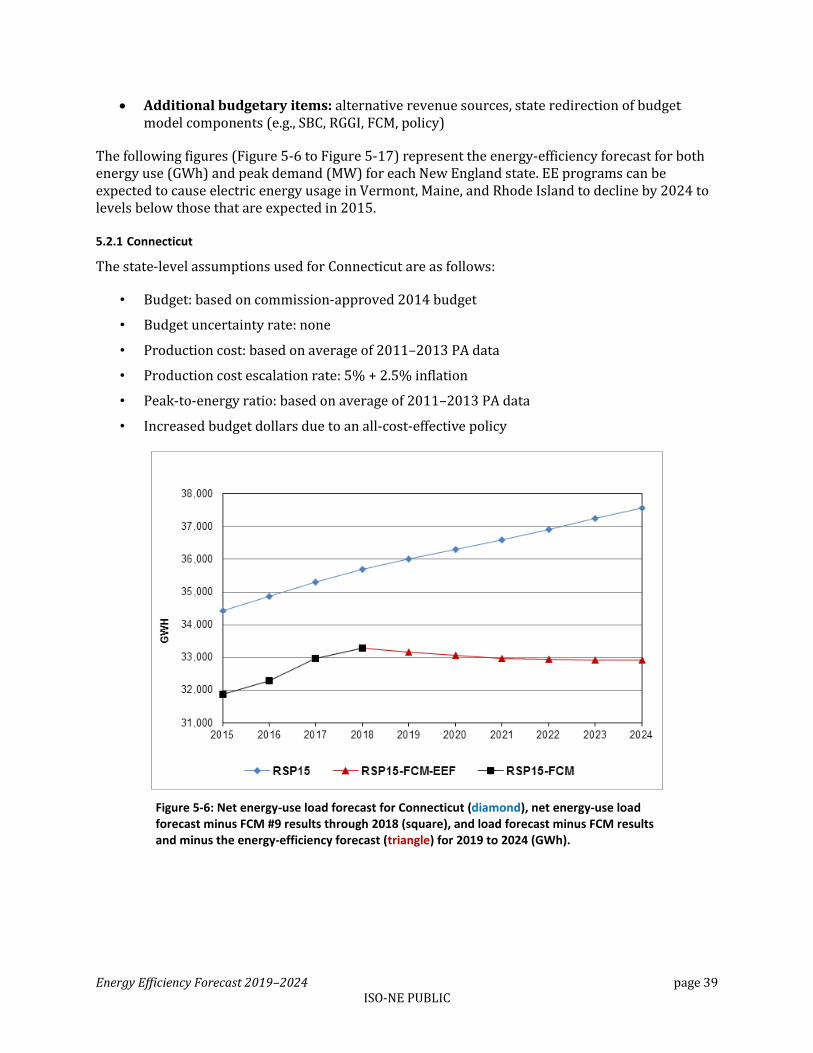
5.2 State-Level EE Forecasts .................................................................................................................................... 38
5.2.1 Connecticut ................................................................................................................................................ 39
5.2.2 Massachusetts ........................................................................................................................................... 40
5.2.3 Maine ......................................................................................................................................................... 42
5.2.4 New Hampshire ......................................................................................................................................... 43
5.2.5 Rhode Island .............................................................................................................................................. 45
Energy Efficiency Forecast 2019–2024 page vi ISO-NE PUBLIC
5.2.6 Vermont ..................................................................................................................................................... 46
Section 6 Appendix B: Energy-Efficiency Measure Data ...................................................................................................... 48
6.1 State-Level Measure Trends .............................................................................................................................. 51
6.1.1 Connecticut ................................................................................................................................................ 51
6.1.2 Massachusetts ........................................................................................................................................... 52
6.1.3 Maine ......................................................................................................................................................... 52
6.1.4 Rhode Island .............................................................................................................................................. 53
6.1.5 New Hampshire ......................................................................................................................................... 53
6.1.6 Vermont ..................................................................................................................................................... 54
6.2 Production Cost Savings by Energy-Efficiency Measure.................................................................................... 54
Energy Efficiency Forecast 2019–2024 page vii ISO-NE PUBLIC
Figures
Figure 2-1: Trends in EE funding for the six New England states, 2004 to 2013. ....................................................... 7
Figure 2-2: Growth of energy efficiency in the Forward Capacity Market (Capacity Supply Obligation; MW) .......... 8
Figure 2-3: Timeline for the development of the 2015 energy-efficiency forecast. .................................................. 9
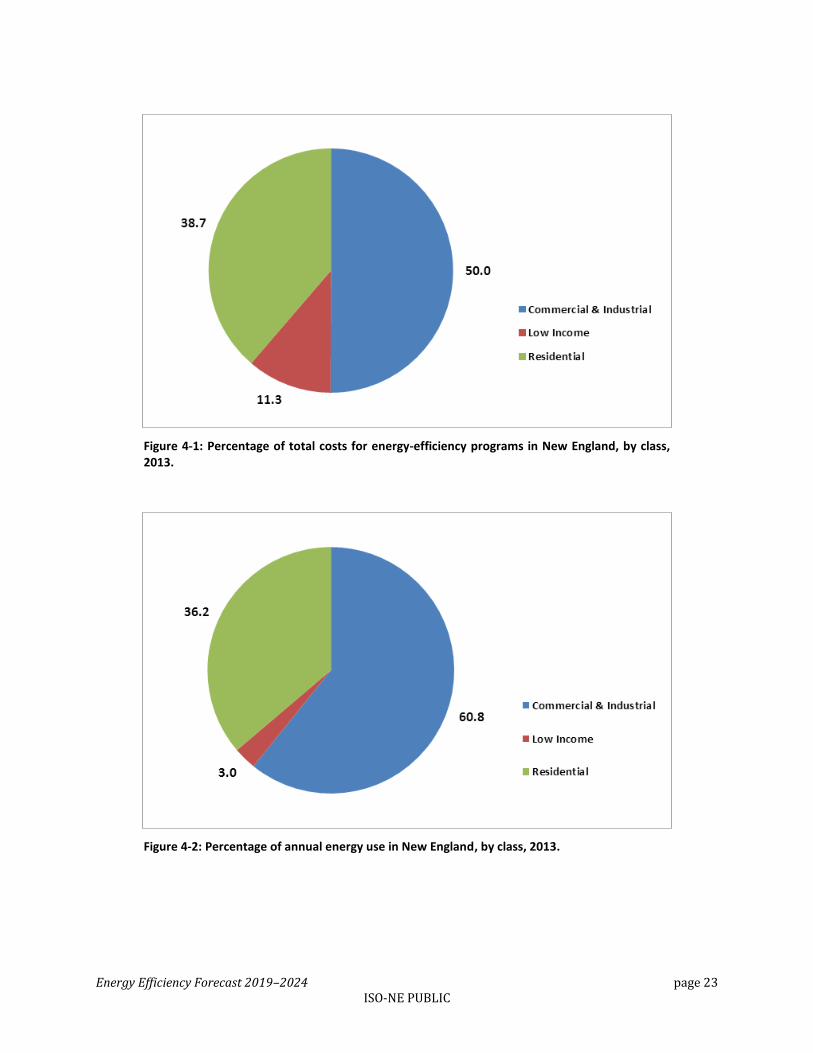
Figure 4-1: Percentage of total costs for energy-efficiency programs in New England, by class, 2013. .................. 23
Figure 4-2: Percentage of annual energy use in New England, by class, 2013. ........................................................ 23
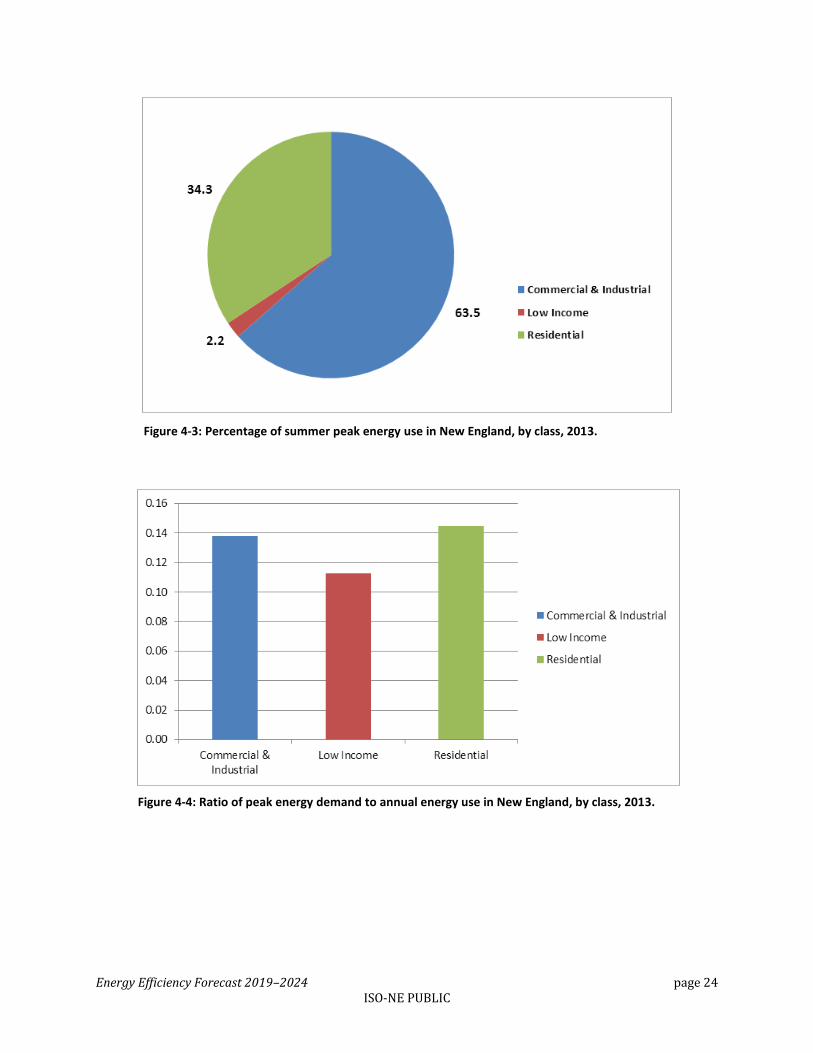
Figure 4-3: Percentage of summer peak energy use in New England, by class, 2013. ............................................. 24
Figure 4-4: Ratio of peak energy demand to annual energy use in New England, by class, 2013. .......................... 24
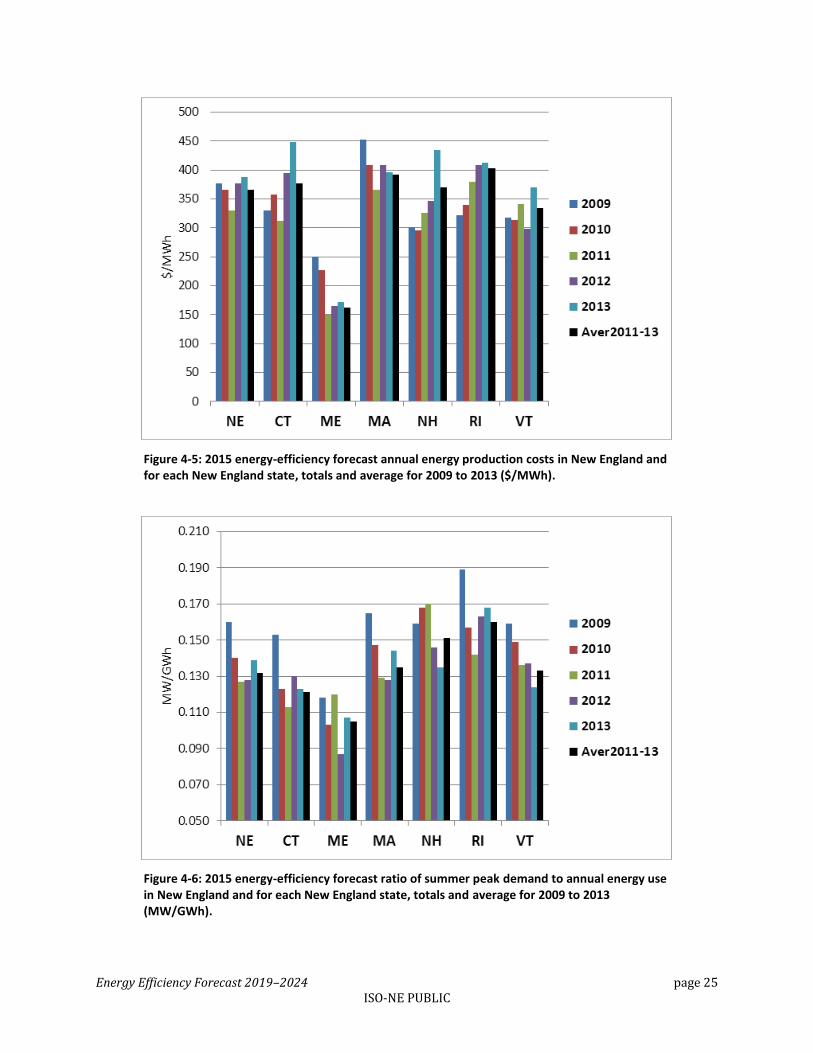
Figure 4-5: 2015 energy-efficiency forecast annual energy production costs in New England and for each New England state, totals and average for 2009 to 2013 ($/MWh). ..................................................... 25
Figure 4-6: 2015 energy-efficiency forecast ratio of summer peak demand to annual energy use in New England and for each New England state, totals and average for 2009 to 2013 (MW/GWh). ...... 25
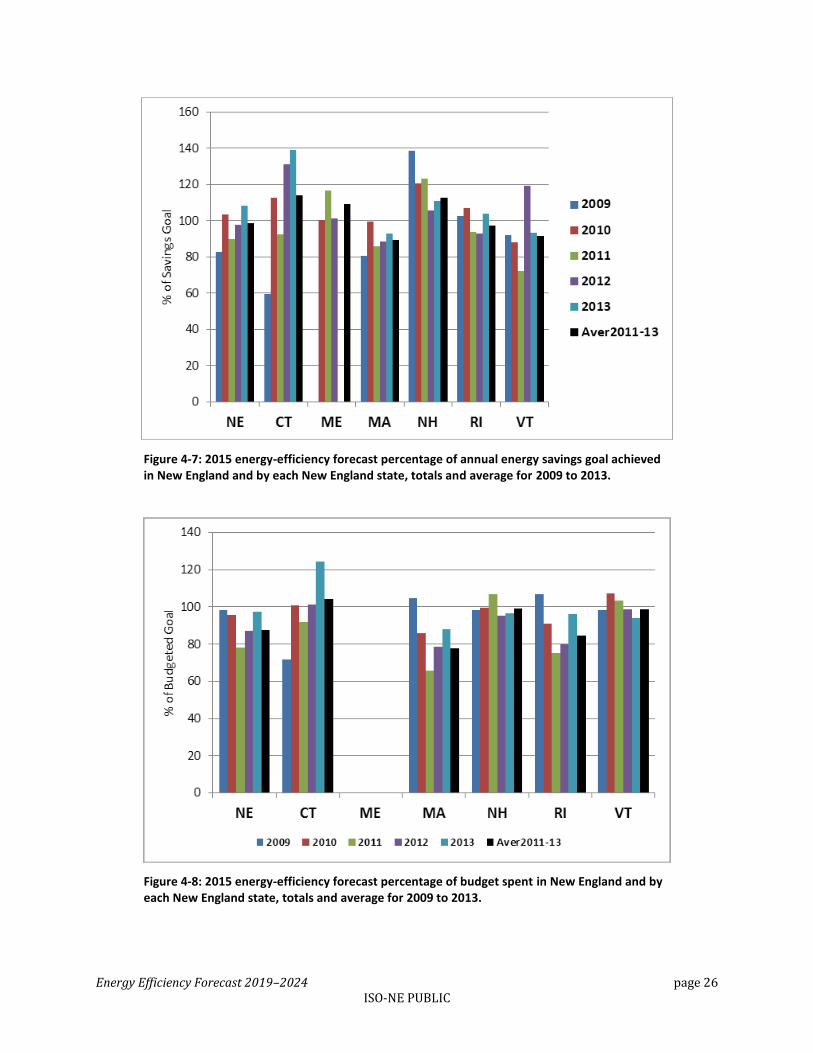
Figure 4-7: 2015 energy-efficiency forecast percentage of annual energy savings goal achieved in New England and by each New England state, totals and average for 2009 to 2013. ........................... 26
Figure 4-8: 2015 energy-efficiency forecast percentage of budget spent in New England and by each New England state, totals and average for 2009 to 2013. ..................................................................... 26
Figure 4-9: 2015 energy-efficiency forecast percentage of summer peak reduction goal achieved for New England and by each New England state, totals and average for 2009 to 2013. ........................... 27
Figure 5-1: Net energy-use load forecast (diamond), net energy-use load forecast minus FCM #9 results through 2018 (square), and load forecast minus FCM results and minus the energy-efficiency forecast (triangle) for 2019 to 2024 (GWh)............................................................................................ 35
Figure 5-2: Summer peak demand forecast (90/10) (diamond), load forecast minus FCM #9 results through 2018 (square), and load forecast minus FCM results and minus the energy-efficiency forecast (triangle) for 2019 to 2024 (MW). .......................................................................................................... 36
Figure 5-3: Summer peak demand forecast (50/50) (diamond), load forecast minus FCM #9 results through 2018 (square), and load forecast minus FCM results and minus the energy-efficiency forecast (triangle) for 2019 to 2024 (MW). .......................................................................................................... 36
Figure 5-4: Winter peak demand forecast (90/10) (diamond), load forecast minus FCM #9 results through 2018 (square), and load forecast minus FCM results and minus the energy-efficiency forecast (triangle) for 2019 to 2024 (MW). .......................................................................................................... 37
Figure 5-5: Winter peak demand forecast (50/50) (diamond), load forecast minus FCM #9 results through 2018 (square), and load forecast minus FCM results and minus the energy-efficiency forecast (triangle) for 2019 to 2024 (MW). .......................................................................................................... 38
Figure 5-6: Net energy-use load forecast for Connecticut (diamond), net energy-use load forecast minus FCM #9 results through 2018 (square), and load forecast minus FCM results and minus the energy-efficiency forecast (triangle) for 2019 to 2024 (GWh). .............................................................. 39
Figure 5-7: Summer peak demand forecast (90/10) for Connecticut (diamond), load forecast minus FCM #9 results through 2018 (square), and load forecast minus FCM results and minus the energy-efficiency forecast (triangle) for 2019 to 2024 (MW). ............................................................... 40
Energy Efficiency Forecast 2019–2024 page viii ISO-NE PUBLIC
Figure 5-8: Net energy-use load forecast for Massachusetts (diamond), net energy-use load forecast minus FCM #9 results through 2018 (square), and load forecast minus FCM results and minus the energy-efficiency forecast (triangle) for 2019 to 2024 (GWh). ............................................. 41
Figure 5-9: Summer peak demand forecast (90/10) for Massachusetts (diamond), load forecast minus FCM #9 results through 2018 (square), and load forecast minus FCM results and minus the energy-efficiency forecast (triangle) for 2019 to 2024 (MW). ......................................................... 41
Figure 5-10: Net energy-use load forecast for Maine (diamond), net energy-use load forecast minus FCM #9 results through 2018 (square), and load forecast minus FCM results and minus the energy-efficiency forecast (triangle) for 2019 to 2024 (GWh). ........................................................ 42
Figure 5-11: Summer peak demand forecast (90/10) for Maine (diamond), load forecast minus FCM #9 results through 2018 (square), and load forecast minus FCM results and minus the energy-efficiency forecast (triangle) for 2019 to 2024 (MW). ............................................................... 43
Figure 5-12: Net energy-use load forecast for New Hampshire (diamond), net energy-use load forecast minus FCM #9 results through 2018 (square), and load forecast minus FCM results and minus the energy-efficiency forecast (triangle) for 2019 to 2024 (GWh). ............................................. 44
Figure 5-13: Summer peak demand forecast (90/10) for New Hampshire (diamond), load forecast minus FCM #9 results through 2018 (square), and load forecast minus FCM results and minus the energy-efficiency forecast (triangle) for 2019 to 2024 (MW). ............................................................... 44
Figure 5-14: Net energy-use load forecast for Rhode Island (diamond), net energy-use load forecast minus FCM #9 results through 2018 (square), and load forecast minus FCM results and minus the energy-efficiency forecast (triangle) for 2019 to 2024 (GWh). .............................................................. 45
Figure 5-15: Summer peak demand forecast (90/10) for Rhode Island (diamond), load forecast minus FCM #9 results through 2018 (square), and load forecast minus FCM results and minus the energy-efficiency forecast (triangle) for 2019 to 2024 (MW). ......................................................... 46
Figure 5-16: Net energy-use load forecast for Vermont (diamond), net energy-use load forecast minus FCM #9 results through 2018 (square), and load forecast minus FCM results and minus the energy-efficiency forecast (triangle) for 2019 to 2024 (GWh). ........................................................ 47
Figure 5-17: Summer peak demand forecast (90/10) for Vermont (diamond), load forecast minus FCM #8 results through 2018 (square), and load forecast minus FCM results and minus the energy-efficiency forecast (triangle) for 2019 to 2024 (MW). ............................................................... 47
Figure 6-1: Percentage of costs ($), demand (kW), and lifetime energy reduction (kWh), for each type of energy-efficiency measure used by programs in the New England states, total for 2009 to 2013. ...... 48
Figure 6-2: Percentage of annual energy use (kWh) in New England, by type of energy-efficiency measure and sector, total for 2009 to 2013. ........................................................................................................ 49
Figure 6-3: Percentage of demand (kW) in New England, by type of energy-efficiency measure and sector, total for 2009 to 2013. ........................................................................................................................... 50
Figure 6-4: Percentage investment ($) in energy-efficiency measures in New England, by type of measure and sector, total for 2009 to 2013. ........................................................................................................ 50
Figure 6-5: Percentage contributions to energy savings (kWh) in Connecticut by various measures, 2009 to 2013. ......................................................................................................................................... 51
Figure 6-6: Percentage contributions to energy savings (kWh) in Massachusetts by various measures, 2008 to 2013. ......................................................................................................................................... 52
Figure 6-7: Percentage contributions to energy savings (MWh) in Maine by various measures, 2008 to 2012. ......................................................................................................................................... 52
Energy Efficiency Forecast 2019–2024 page ix ISO-NE PUBLIC
Figure 6-8: Percentage contributions to energy savings (kWh) in Rhode Island by various measures, 2008 to 2013. ......................................................................................................................................... 53
Figure 6-9: Percentage contributions to energy savings (MWh) in New Hampshire by various measures, 2008 to 2012. ......................................................................................................................................... 53
Figure 6-10: Percentage contributions to energy savings (MWh) in Vermont by various measures, 2008 to 2013. ......................................................................................................................................... 54
Energy Efficiency Forecast 2019–2024 page x ISO-NE PUBLIC
Tables
Table 1-1 ISO New England Energy-Efficiency Forecast of Total Electric Energy Savings for the Region and Each New England State, 2019 to 2024 (GWh) ................................................................................. 3
Table 1-2 ISO New England Energy-Efficiency Forecast of Total Savings in Peak Energy Use for the Region and Each New England State, 2019 to 2024 (MW) .................................................................................. 3
Table 4-1 Sample EE Data Collection Worksheet (partial data) ............................................................................. 16
Table 4-2 Types of Energy-Efficiency Programs of the New England States .......................................................... 17
Table 4-3 Program Summary of the ISO New England 2015 Energy-Efficiency Forecast ...................................... 19
Table 4-4 ISO New England 2015 Energy-Efficiency Forecast Data Summary by Class.......................................... 21
Table 4-5 Forecast of RGGI and FCM Dollars to Be Spent on EE Measures by Each New England State and Total for New England and 2018 to 2024 for the FCM (1,000 $) .................................................... 28
Table 4-6 2014 Regional System Plan Forecast of Annual Energy Use, the Forecast Minus FCM Passive Demand Resources, and the Amount of Energy Eligible for Systems Benefits Charge, for Each New England State and Total for New England, 2019 to 2024 (GWh) ..................................... 29
Table 4-7 2014 Forecast of Energy Sales (GWh) and System Benefit Charge ($) for Each New England State and the Total for New England, 2019 to 2024 .............................................................................. 30
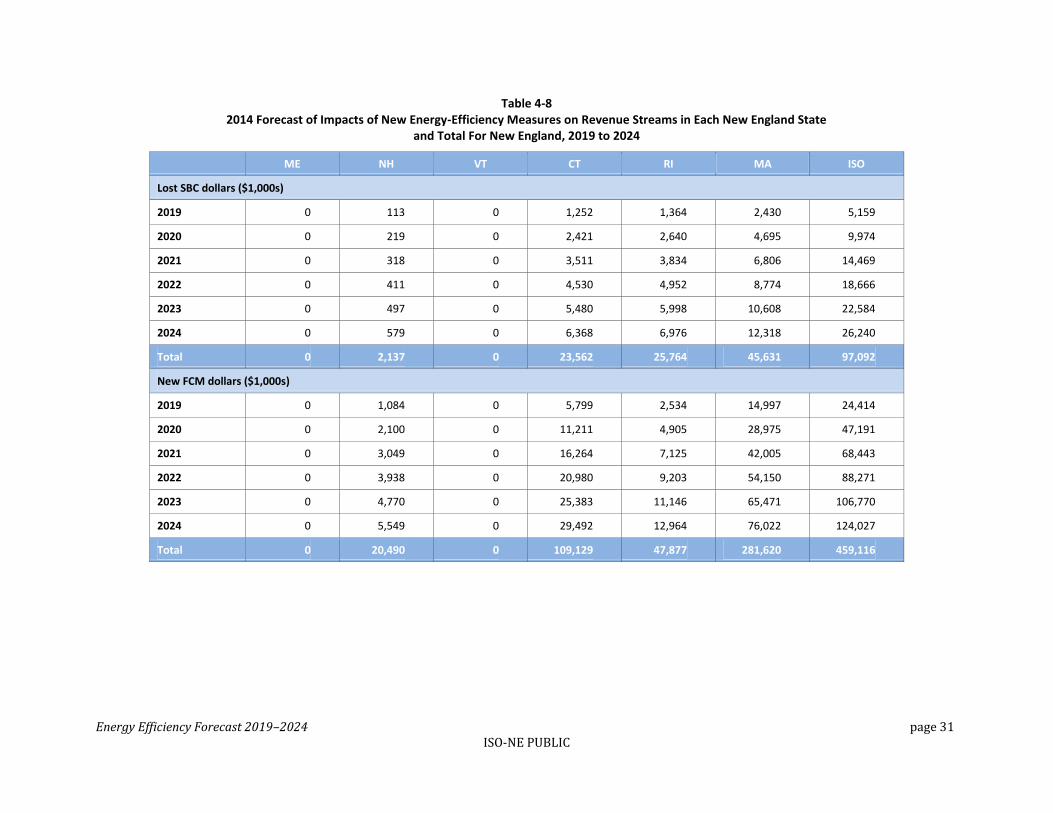
Table 4-8 2014 Forecast of Impacts of New Energy-Efficiency Measures on Revenue Streams in Each New England State and Total For New England, 2019 to 2024 .............................................................. 31
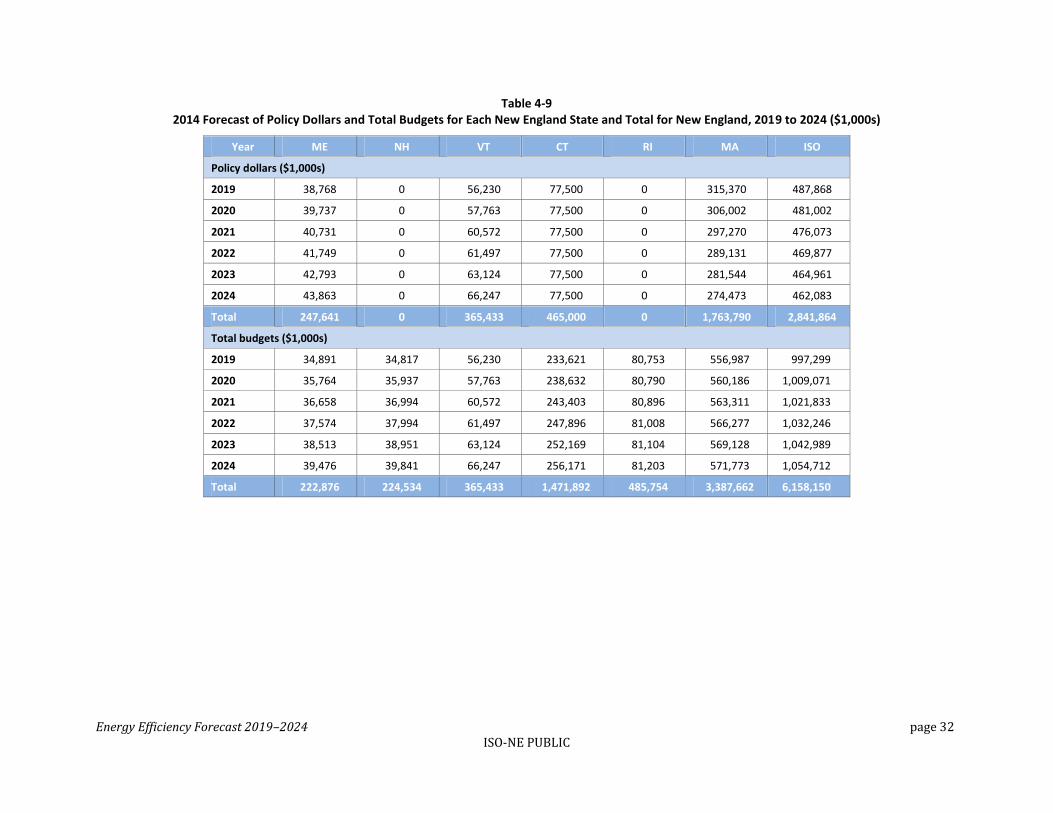
Table 4-9 2014 Forecast of Policy Dollars and Total Budgets for Each New England State and Total for New England, 2019 to 2024 ($1,000s) .............................................................................................. 32
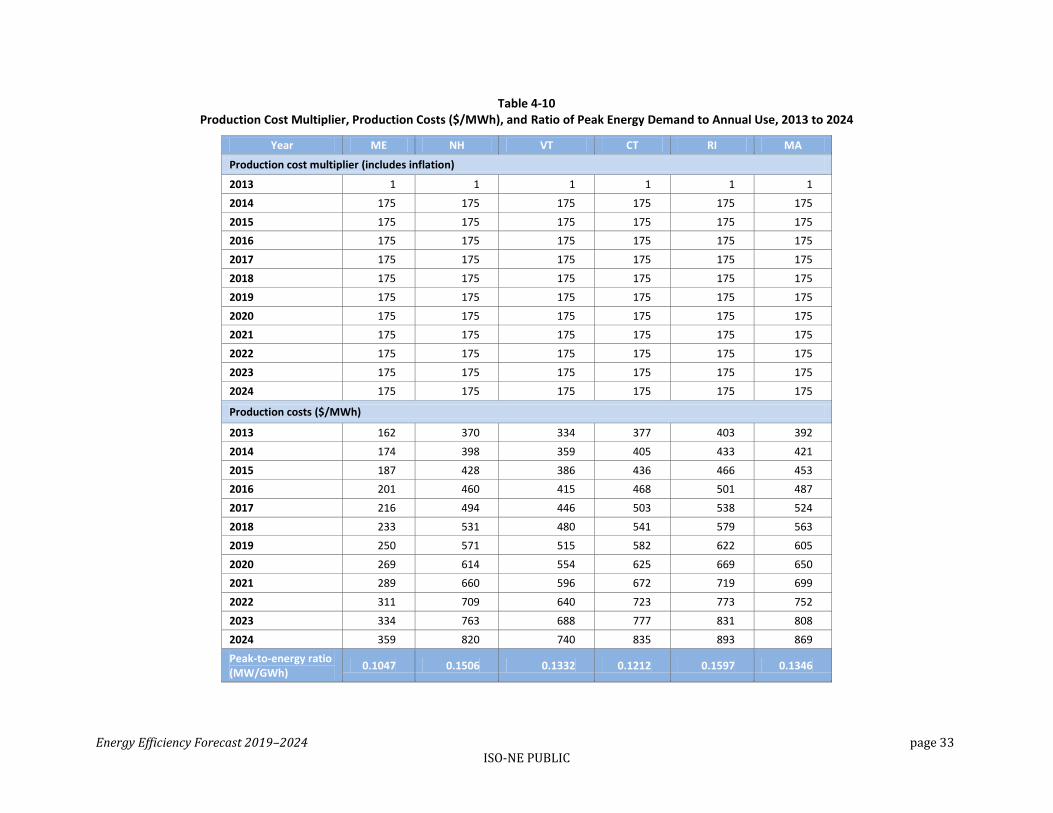
Table 4-10 Production Cost Multiplier, Production Costs ($/MWh), and Ratio of Peak Energy Demand to Annual Use, 2013 to 2024 .................................................................................................................. 33
Table 5-1 ISO New England’s Final Energy-Efficiency Forecast for 2019 to 2024 (GWh, MW) .............................. 34
Table 6-1 Net Annualized Production Costs for 2013 Reported Energy-Efficiency Measures for Each New England State (Sum of $/MWh) ..................................................................................................... 55
Table 6-2 Cost Based on Net Annualized Savings for 2013 Reported Energy-Efficiency Measures for Each New England State ($/kW) ..................................................................................................................... 55
Energy Efficiency Forecast 2019–2024 page 1 ISO-NE PUBLIC
Section 1 Executive Summary
ISO New England Inc. (ISO) is the not-for-profit corporation responsible for the reliable operation of New England’s electric power system. It also administers the region’s wholesale electricity markets and manages the comprehensive planning of the regional power system. In 2012, the ISO developed a process to forecast the future impacts from energy efficiency (EE) delivered by state-sponsored EE programs. This EE forecast supplements the ISO annual 10-year load forecast. This report contains the results of the most recent EE forecasting process for 2019 to 2024.
1.1 Overview
By statute, rule, and policy, the New England states have made EE a priority for the region. Each state has its own structure for planning and implementing EE programs, although all the programs generally cover the residential, commercial, and industrial sectors. In general, EE programs range from consumer incentives, such as rebates for purchasing new efficient equipment, process improvements, and energy management systems, to energy audits. Some states also have established aggressive long-term energy-efficiency goals tied to reductions in greenhouse gas emissions and global-warming solutions. In New England, lighting and mixed lighting measures normally constitute a majority of the energy and peak demand savings, and the commercial and industrial sectors provide most of the overall savings.
Compared with the rest of the nation, the New England states’ EE programs rank among the most ambitious. The energy savings resulting from EE programs constitutes capacity that can be bid into the ISO-administered Forward Capacity Market (FCM). Since the inception of the FCM, the region’s EE program administrators (PAs) typically have bid their EE portfolios into this market. By this mechanism, EE resources are compensated for providing capacity three years into the future the same way as traditional generating resources. Data on EE participation in the FCM provides the ISO with a solid understanding of the amount of EE available in the region in the one- to three-year timeframe.
But by all indications, state-sponsored EE programs are not static. In fact, the states communicated their general intention for long-term growth of EE programs. The purpose of the ISO’s EE forecast is to estimate this longer-term (four- to 10-year) growth in EE. The ISO’s long-term planning processes generally estimate system needs 10 years into the future. The goal of the EE forecast is to provide ISO system planners and regional stakeholders with information about the amount of EE anticipated to be deployed over this 10-year planning horizon.
To get assistance in developing an EE forecast, the ISO organized and chairs the Energy-Efficiency Forecast Working Group (EEFWG). This broad stakeholder group supplies and verifies data on the nature of EE programs in New England.
1.2 EE Forecast Methodology
After researching potential EE forecasting techniques and finding little or no precedents to follow, the ISO created its own forecasting methodology. At a high level, the EE forecasting methodology is based on the projected costs of energy savings (expressed in dollars per megawatt-hours; $/MWh) and projected future state-sponsored EE budgets. By projecting the amount states will authorize PAs to spend in future years and the amount of energy savings achieved per dollar spent, future

Energy Efficiency Forecast 2019–2024 page 2 ISO-NE PUBLIC
energy savings can be calculated. The ISO also uses a “peak to energy” ratio to estimate how the projections of energy use (i.e., savings in energy use) (in MWh) will affect future peak demand (in megawatts; MW).
A simplified representation of the calculation for the ISO’s EE forecast methodology is as follows:
Where:
BSR is budget spend rate (%).
Budget $ is an estimate of the dollars to be spent on EE ($).
$/MWh is production cost.
PCINCR is production cost increase (%).
Where:
PER is the ratio of the peak energy demand to the annual energy use (“peak-to-
energy” ratio) (MW/MWh)
1.3 Results
The EE forecast shows that the energy savings resulting from state-sponsored EE programs can be expected to cause electric energy usage to remain flat in New England as a whole, with energy use in Maine, Massachusetts, Rhode Island, and Vermont, declining by 2024 to levels below those that had been expected in the 2014 EE forecast. The EE forecast also projects that the EE savings will slow the growth in peak demand across the region.
When the EE savings are factored into the region’s load forecast, energy usage is expected to barely grow at an average annual rate of 0.1% rather than the 1% in the baseline load forecast. Similarly, peak demand growth is slower, decreasing from 1.3% to 0.7% annually, when factoring in both the savings from EE measures committed through the FCM and the projected future EE measures.
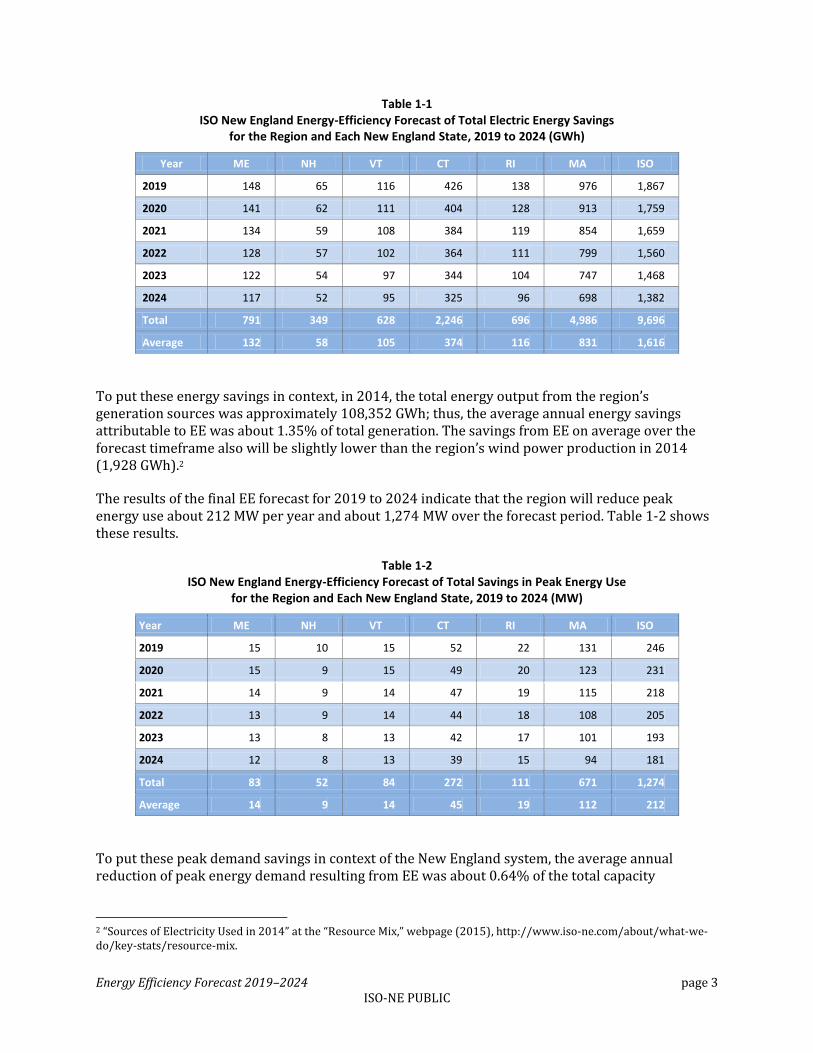
The results of the final EE forecast for 2019 to 2024, as shown in Table 1-1, indicate that the region will save about 1,616 gigawatt-hours (GWh) of electric energy per year and about 9,696 GWh of energy over the forecast period.
2) MW = MWh * PER
1) MWh = [ (1 - BSR) * Budget $ ] / [ $/MWh * PCINCR ]
Energy Efficiency Forecast 2019–2024 page 3 ISO-NE PUBLIC
Table 1-1 ISO New England Energy-Efficiency Forecast of Total Electric Energy Savings
for the Region and Each New England State, 2019 to 2024 (GWh)
Year ME NH VT CT RI MA ISO
2019 148 65 116 426 138 976 1,867
2020 141 62 111 404 128 913 1,759
2021 134 59 108 384 119 854 1,659
2022 128 57 102 364 111 799 1,560
2023 122 54 97 344 104 747 1,468
2024 117 52 95 325 96 698 1,382
Total 791 349 628 2,246 696 4,986 9,696
Average 132 58 105 374 116 831 1,616
To put these energy savings in context, in 2014, the total energy output from the region’s generation sources was approximately 108,352 GWh; thus, the average annual energy savings attributable to EE was about 1.35% of total generation. The savings from EE on average over the forecast timeframe also will be slightly lower than the region’s wind power production in 2014 (1,928 GWh).2
The results of the final EE forecast for 2019 to 2024 indicate that the region will reduce peak energy use about 212 MW per year and about 1,274 MW over the forecast period. Table 1-2 shows these results.
Table 1-2 ISO New England Energy-Efficiency Forecast of Total Savings in Peak Energy Use
for the Region and Each New England State, 2019 to 2024 (MW)
Year ME NH VT CT RI MA ISO
2019 15 10 15 52 22 131 246
2020 15 9 15 49 20 123 231
2021 14 9 14 47 19 115 218
2022 13 9 14 44 18 108 205
2023 13 8 13 42 17 101 193
2024 12 8 13 39 15 94 181
Total 83 52 84 272 111 671 1,274
Average 14 9 14 45 19 112 212
To put these peak demand savings in context of the New England system, the average annual reduction of peak energy demand resulting from EE was about 0.64% of the total capacity
2 “Sources of Electricity Used in 2014” at the “Resource Mix,” webpage (2015), http://www.iso-ne.com/about/what-we-do/key-stats/resource-mix.
Energy Efficiency Forecast 2019–2024 page 4 ISO-NE PUBLIC
requirement for the region in the 2014/2015 period, roughly 33,000 MW.3 The total peak savings from EE over the 10-year forecast timeframe also will be roughly equivalent to some of the region’s largest generation resources, when comparing EE peak capacity reductions and the seasonal claimed capability of generator output.4
3 The 33,000 MW is the ISO’s net Installed Capacity Requirement (ICR)(i.e., the ICR minus 954 MW of Hydro-Québec’s (HQ) Interconnection Capability Credits, which reflects the annual installed capacity benefits of the HQ Interconnection). ISO New England Installed Capacity Requirement, Local Sourcing Requirements, and Maximum Capacity Limit for the 2014/15 Capability Year, (April 2011), http://www.iso-ne.com/static-assets/documents/genrtion_resrcs/reports/nepool_oc_review/2011/icr_2014_2015_final_report.pdf.
4 Seasonal claimed capability is a generator's maximum production or output during a particular season, adjusted for physical and regulatory limitations.

Energy Efficiency Forecast 2019–2024 page 5 ISO-NE PUBLIC
Section 2 Introduction
ISO New England Inc. (ISO) is the not-for-profit corporation responsible for the reliable operation of New England’s electric power system. It also administers the region’s wholesale electricity markets and manages the comprehensive planning of the regional power system. In 2012, at the request of stakeholders, the ISO developed a process for forecasting the impacts of energy efficiency (EE), delivered by state-sponsored EE programs, on future loads and incorporated the EE forecast into system planning studies.5 The development of the EE forecast followed a multiyear stakeholder outreach and data-collecting effort spearheaded by the ISO.6 This initial effort was necessary because no single source of information was available on the size and scope of the six New England states’ EE programs.
This report contains the results of the most recent EE forecasting process for 2019 to 2024, for the region and each New England state.7 The report first summarizes the rationale for developing the EE forecast and the methodology used. Appendices provide information on the milestones for the next EE forecast, as well as specific EE measure data the ISO collected. EE measures are components of a program administrator’s (PA’s) EE portfolio offered to customers to reduce energy usage.8
2.1 Background
The six New England states—Connecticut, Maine, Massachusetts, New Hampshire, Rhode Island, and Vermont—have led the charge nationally for enhancing energy efficiency through the deployment of statewide ratepayer-funded programs. By statute, rule, and policy, the New England states have made EE a priority for the region. Each state has its own structure for planning and implementing EE programs, although all the programs generally cover the residential, commercial, and industrial sectors. In general, EE programs range from consumer incentives, such as rebates for purchasing new efficient equipment, process improvements, and energy management systems, to energy audits. In addition, most states have EE programs designed to assist low-income residents and “hard-to-reach” customers, as well as goals to achieve all cost-effective savings. Some states also have established aggressive long-term energy-efficiency goals tied to reductions in greenhouse gas emissions and global-warming solutions.
5 As defined in Section I of the ISO’s tariff, energy efficiency is installed measures (e.g., any combination of products, equipment, systems, services, practices, and strategies) on end-use customer facilities that reduce the total amount of electrical energy needed while delivering a comparable or improved level of end-use service. Such measures include, but are not limited to, the installation of more energy-efficient lighting, motors, refrigeration, HVAC (heating, ventilation, and air conditioning) equipment and control systems, envelope measures, operations and maintenance procedures, and industrial process equipment. See http://www.iso-ne.com/static-assets/documents/regulatory/tariff/sect_1/sect_i.pdf.
6 Background information on the ISO’s Regional Energy-Efficiency Initiative is available at http://www.iso-ne.com/static-assets/documents/committees/comm_wkgrps/inactive/reei/mtrls/reei_background.pdf.
7 “ISO-NE Final 2015 EE Forecast for 2019–2024” (April 20, 2015), http://www.iso-ne.com/system-planning/system-forecasting/energy-efficiency-forecast. Additional background information and data that went into the creation of the EE forecast is available at http://www.iso-ne.com/eefwg.
8 The ISO collects data on EE measures to help analyze future trends in EE policy and funding. The ISO takes no position on state policy decisions regarding the selection of measure types or the focus of EE programs.
Energy Efficiency Forecast 2019–2024 page 6 ISO-NE PUBLIC
Generally, the state public utilities commissions (PUCs) are responsible for approving EE program scope, costs, and implementation.9 Investor-owned utilities, “efficiency” utilities, and community-choice aggregators often serve as program administrators and manage the state-sponsored EE programs.10 States fund EE programs via several sources. The majority of funds are accrued through a system benefits charge (SBC), which appears as a line item on ratepayer bills. EE funds also are generated by other sources, such as proceeds from the Regional Greenhouse Gas Initiative (RGGI) auctions, the ISO New England Forward Capacity Market (FCM), and EE reconciliation funds established to support all cost-effective EE policies.11
2.2 Energy Efficiency in New England
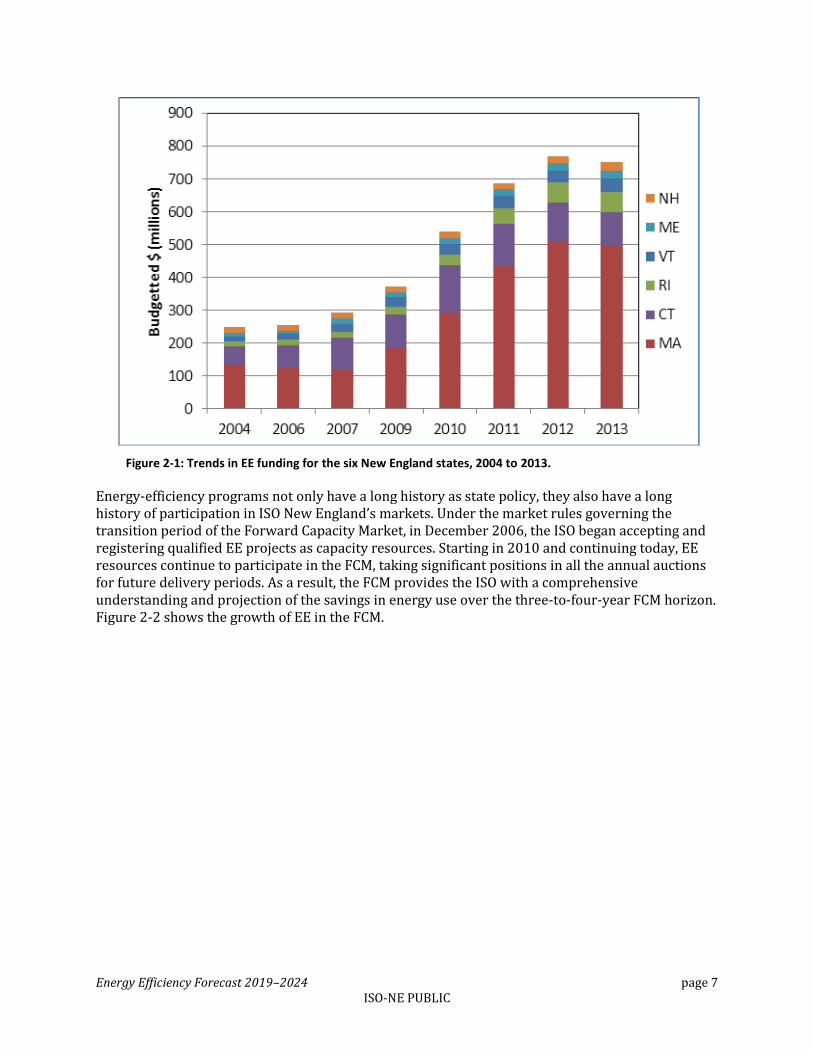
State-sponsored EE programs have a long history in the region, with programs in Massachusetts going back over 20 years.12 In recent years, the New England state-sponsored EE programs have grown to unprecedented levels. The New England states are nationally recognized for their EE programs.13 The growth in EE regionally is supported by significant changes in policy and funding. Vermont began the trend in supporting all cost-effective EE measures in 2007, earning it the top spot in the American Council for an Energy-Efficient Economy (ACEEE) scorecard for that year. In subsequent years, Rhode Island, Massachusetts, Maine, and Connecticut adopted all-cost-effective policies with funding mechanisms to match the state goals. All four states continue to rank in the top 10 nationally, with Massachusetts taking top spot for four years running. Figure 2-1 depicts the trends in EE funding for the six New England states as reported by either PAs or the states.
9 More specific information about state EE programs is available at http://www.dsireusa.org.
10 Most of the energy efficiency implemented in Maine and Vermont is by energy-efficiency utilities, Efficiency Maine Trust, and Efficiency Vermont, respectively.
11 For information on RGGI, see www.rggi.org. The FCM is a locational capacity market for which the ISO projects the needs of the power system three years in advance and then holds an annual auction to purchase power resources to satisfy the future capacity needs, regionwide and in local areas. The aim of the FCM is to send appropriate price signals to attract new investment and maintain existing resources where and when they are needed, including during shortage events, thus ensuring the reliability of the New England electricity grid.
12 Massachusetts Department of Energy Resources, Efficiency as Our First Fuel: Strategic Investments in Massachusetts’ Energy Future: the 2010 Report of the Massachusetts Energy Efficiency Advisory Council (June 2011), http://www.mass.gov/eea/docs/doer/energy-efficiency/eeac-2010-report-ee-advisory-council.pdf.
13 See the American Council for an Energy-Efficient Economy’s annual scorecard ranking states on their EE programs. In 2014, Massachusetts was ranked first nationally for the fourth time in a row (http://aceee.org/state-policy/scorecard).
Energy Efficiency Forecast 2019–2024 page 7 ISO-NE PUBLIC
Figure 2-1: Trends in EE funding for the six New England states, 2004 to 2013.
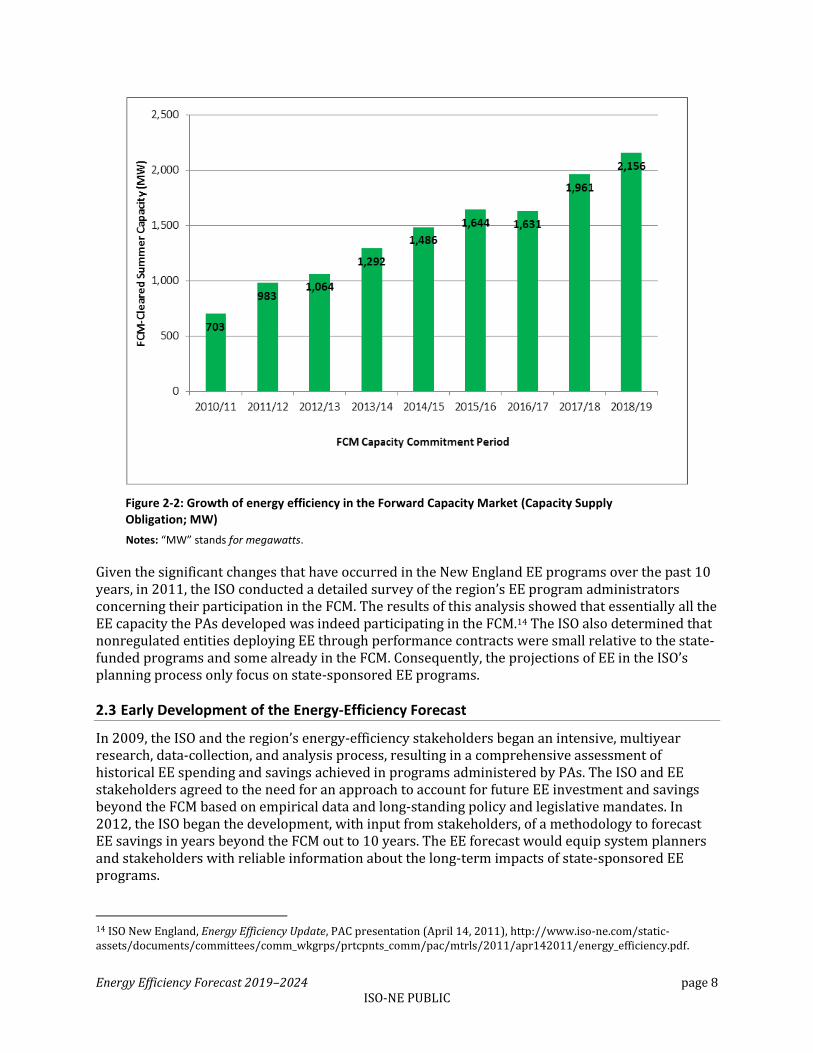
Energy-efficiency programs not only have a long history as state policy, they also have a long history of participation in ISO New England’s markets. Under the market rules governing the transition period of the Forward Capacity Market, in December 2006, the ISO began accepting and registering qualified EE projects as capacity resources. Starting in 2010 and continuing today, EE resources continue to participate in the FCM, taking significant positions in all the annual auctions for future delivery periods. As a result, the FCM provides the ISO with a comprehensive understanding and projection of the savings in energy use over the three-to-four-year FCM horizon. Figure 2-2 shows the growth of EE in the FCM.
Energy Efficiency Forecast 2019–2024 page 8 ISO-NE PUBLIC
Figure 2-2: Growth of energy efficiency in the Forward Capacity Market (Capacity Supply Obligation; MW)
Notes: “MW” stands for megawatts.
Given the significant changes that have occurred in the New England EE programs over the past 10 years, in 2011, the ISO conducted a detailed survey of the region’s EE program administrators concerning their participation in the FCM. The results of this analysis showed that essentially all the EE capacity the PAs developed was indeed participating in the FCM.14 The ISO also determined that nonregulated entities deploying EE through performance contracts were small relative to the state-funded programs and some already in the FCM. Consequently, the projections of EE in the ISO’s planning process only focus on state-sponsored EE programs.
2.3 Early Development of the Energy-Efficiency Forecast
In 2009, the ISO and the region’s energy-efficiency stakeholders began an intensive, multiyear research, data-collection, and analysis process, resulting in a comprehensive assessment of historical EE spending and savings achieved in programs administered by PAs. The ISO and EE stakeholders agreed to the need for an approach to account for future EE investment and savings beyond the FCM based on empirical data and long-standing policy and legislative mandates. In 2012, the ISO began the development, with input from stakeholders, of a methodology to forecast EE savings in years beyond the FCM out to 10 years. The EE forecast would equip system planners and stakeholders with reliable information about the long-term impacts of state-sponsored EE programs.
14 ISO New England, Energy Efficiency Update, PAC presentation (April 14, 2011), http://www.iso-ne.com/static-assets/documents/committees/comm_wkgrps/prtcpnts_comm/pac/mtrls/2011/apr142011/energy_efficiency.pdf.
Energy Efficiency Forecast 2019–2024 page 9 ISO-NE PUBLIC
2.4 Energy-Efficiency Forecast Working Group
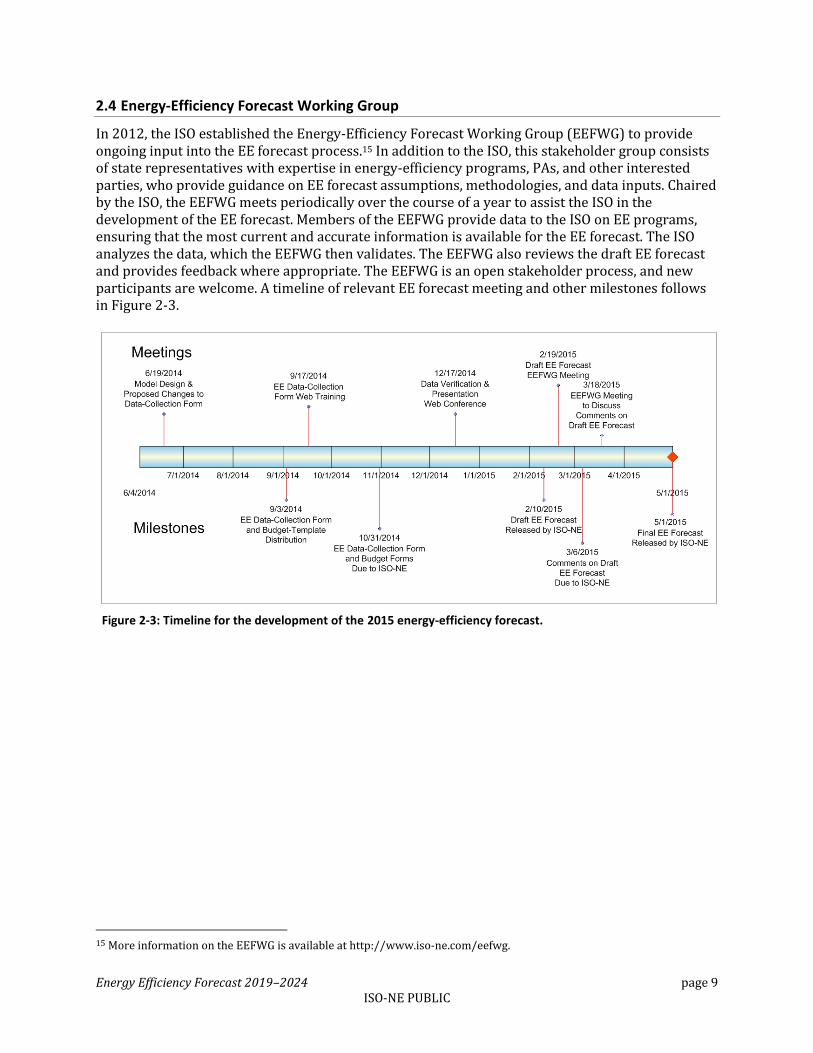
In 2012, the ISO established the Energy-Efficiency Forecast Working Group (EEFWG) to provide ongoing input into the EE forecast process.15 In addition to the ISO, this stakeholder group consists of state representatives with expertise in energy-efficiency programs, PAs, and other interested parties, who provide guidance on EE forecast assumptions, methodologies, and data inputs. Chaired by the ISO, the EEFWG meets periodically over the course of a year to assist the ISO in the development of the EE forecast. Members of the EEFWG provide data to the ISO on EE programs, ensuring that the most current and accurate information is available for the EE forecast. The ISO analyzes the data, which the EEFWG then validates. The EEFWG also reviews the draft EE forecast and provides feedback where appropriate. The EEFWG is an open stakeholder process, and new participants are welcome. A timeline of relevant EE forecast meeting and other milestones follows in Figure 2-3.
Figure 2-3: Timeline for the development of the 2015 energy-efficiency forecast.
15 More information on the EEFWG is available at http://www.iso-ne.com/eefwg.
Energy Efficiency Forecast 2019–2024 page 10 ISO-NE PUBLIC
Section 3 Forecast Methodology
To create a quantitative, data-driven forecast of future EE, the ISO needed a forecast methodology. To determine whether such a methodology existed, ISO New England surveyed other ISOs and Regional Transmission Organizations (RTOs). The survey gathered information about whether other regions were dealing with these issues and, if so, if they had an EE forecast methodology. Results of this survey concluded that only the New York ISO (NYISO) had a basic EE forecast tool primarily based on the cost of EE measures and the state’s EE budget. Building on this basic concept, the ISO developed its own EE forecast methodology with stakeholder input. It first vetted a proof-of-concept forecast with stakeholders and then released a draft EE forecast for review on February 24, 2012.16 This draft used budget data and production costs provided by the PAs and included a range of scenarios for addressing various levels of uncertainty for consideration by the EEFWG. After consultation with the EEFWG, a final draft was released on March 19, 2012.17 As a result of input provided by the EEFWG, the ISO revised the EE forecast methodology to incorporate the states’ near-term approved EE budgets. The ISO bases its forecast methodology estimates of future EE budgets on projections of current EE revenue sources, including system benefits charges, revenues from RGGI auctions, the FCM, and other sources. The ISO relies on the states to provide accurate information about the sources of funding for EE programs.
This section includes the calculations for the EE forecast model and the budget model.
3.1 EE Forecast Model
The ISO’s EE forecast calculates future energy reductions and peak demand savings based on three major elements:
EE program budgets
Production costs (expressed as dollars per megawatt-hours; $/MWh)
A ratio of peak demand to the annual savings in energy use (MW/MWh)
3.1.1 Calculations for Future Energy Reductions
A simplified representation of the calculation for the ISO’s EE forecast methodology is as follows:
16 ISO New England, Energy Efficiency Forecast 2015–2012, EEFWG presentation (February 24, 2012), http://www.iso-ne.com/static-assets/documents/committees/comm_wkgrps/othr/enrgy_effncy_frcst/mtrls/ee_forecast_work_group_2_24_12_final.pdf.
17 ISO New England, Draft Final Energy-Efficiency Forecast 2015–2021 (March 19, 2012), http://www.iso-ne.com/committees/comm_wkgrps/othr/enrgy_effncy_frcst/mtrls/draft_final_ee_forecast_3_16_12.pdf.
Energy Efficiency Forecast 2019–2024 page 11 ISO-NE PUBLIC
Where:
BSR is budget spend rate (%).
Budget $ is an estimate of the dollars to be spent on EE ($).
$/MWh is production cost.
PCINCR is production cost increase (%).
Where:
PER is the ratio of the peak energy demand to the annual energy use (“peak-to-
energy” ratio) (MW/MWh)
3.1.2 Model Uncertainty Factors
The ISO applies modest and reasonable uncertainty factors to future EE budgets to reflect the vagaries of predicting future policy trends. For example, in Massachusetts and Rhode Island, EE programs continue expanding rapidly. Also, in the 2015 program year, Connecticut’s program will expand significantly in size. To reflect the uncertainty regarding whether or not these states will be able to spend the full budgeted amount for these newly expanded EE goals, the ISO discounted the budget for Massachusetts and Rhode Island by 10%. These factors are developed from actual percentage spend rates observed in prior reporting years (and reflected in Section 4.2, Table 4-3, “Program Summary of the ISO New England 2014 Energy-Efficiency Forecast”). With Connecticut’s projected expansion, the ISO determined that the Connecticut utilities have significant demand for services and will spend their full budget, a factor that may be reassessed in the 2016 forecast. The ISO also adjusts the final EE forecast to account for the impacts of inflation on the program costs and assumed increases in production costs.18 For all states, production costs were escalated by 5% each year to account for the increasing costs of energy-efficiency measures. In addition, the ISO applied a 2.5% inflation rate on all states.
A description of the regional and state-specific EE forecast model uncertainty factors and other assumptions precede the forecast data presented in Section 5.2.
3.2 Budget Model
The following equations were used to estimate the projected budgets through the forecast period. As previously noted, program administrators, state regulatory personnel, or their representatives provided certain data used in the equations. The balance of parameters originates from other ISO
18 In future EE forecasts, a longer EE data record may allow for the refinement of the uncertainty factors.
2) MW = MWh * PER
1) MWh = [ (1 - BSR) * Budget $ ] / [ $/MWh * PCINCR ]
Energy Efficiency Forecast 2019–2024 page 12 ISO-NE PUBLIC
reports, such as the Capacity, Energy, Load, and Transmission (CELT) Report and Forward Capacity Market results.19
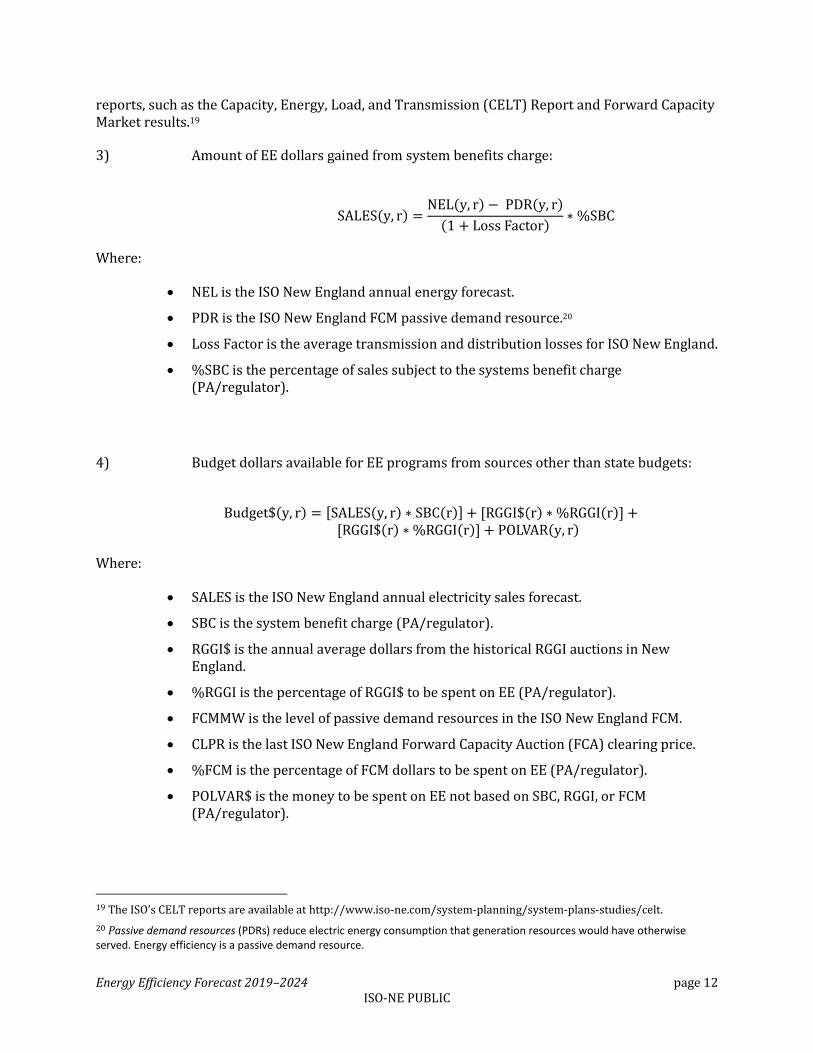
3) Amount of EE dollars gained from system benefits charge:
Where:
NEL is the ISO New England annual energy forecast.
PDR is the ISO New England FCM passive demand resource.20
Loss Factor is the average transmission and distribution losses for ISO New England.
%SBC is the percentage of sales subject to the systems benefit charge (PA/regulator).
4) Budget dollars available for EE programs from sources other than state budgets:
Where:
SALES is the ISO New England annual electricity sales forecast.
SBC is the system benefit charge (PA/regulator).
RGGI$ is the annual average dollars from the historical RGGI auctions in New England.
%RGGI is the percentage of RGGI$ to be spent on EE (PA/regulator).
FCMMW is the level of passive demand resources in the ISO New England FCM.
CLPR is the last ISO New England Forward Capacity Auction (FCA) clearing price.
%FCM is the percentage of FCM dollars to be spent on EE (PA/regulator).
POLVAR$ is the money to be spent on EE not based on SBC, RGGI, or FCM (PA/regulator).
19 The ISO’s CELT reports are available at http://www.iso-ne.com/system-planning/system-plans-studies/celt.
20 Passive demand resources (PDRs) reduce electric energy consumption that generation resources would have otherwise served. Energy efficiency is a passive demand resource.
Energy Efficiency Forecast 2019–2024 page 13 ISO-NE PUBLIC
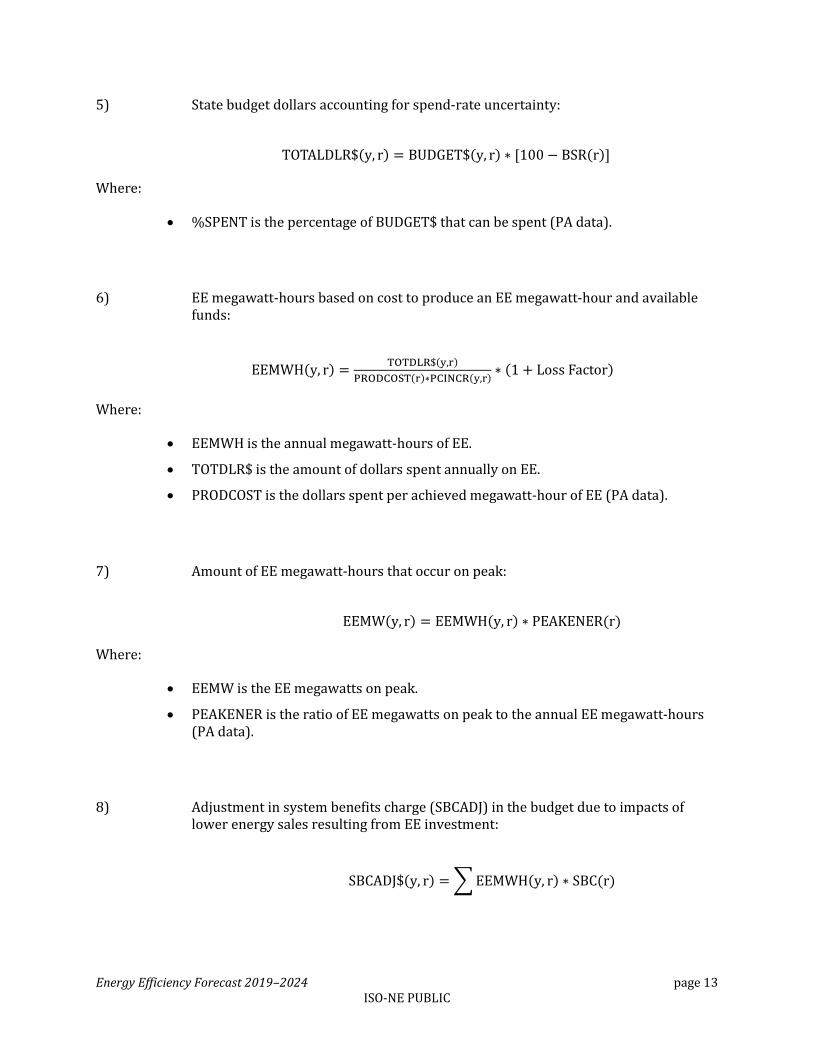
5) State budget dollars accounting for spend-rate uncertainty:
Where:
%SPENT is the percentage of BUDGET$ that can be spent (PA data).
6) EE megawatt-hours based on cost to produce an EE megawatt-hour and available funds:
Where:
EEMWH is the annual megawatt-hours of EE.
TOTDLR$ is the amount of dollars spent annually on EE.
PRODCOST is the dollars spent per achieved megawatt-hour of EE (PA data).
7) Amount of EE megawatt-hours that occur on peak:
Where:
EEMW is the EE megawatts on peak.
PEAKENER is the ratio of EE megawatts on peak to the annual EE megawatt-hours (PA data).
8) Adjustment in system benefits charge (SBCADJ) in the budget due to impacts of lower energy sales resulting from EE investment:
Energy Efficiency Forecast 2019–2024 page 14 ISO-NE PUBLIC
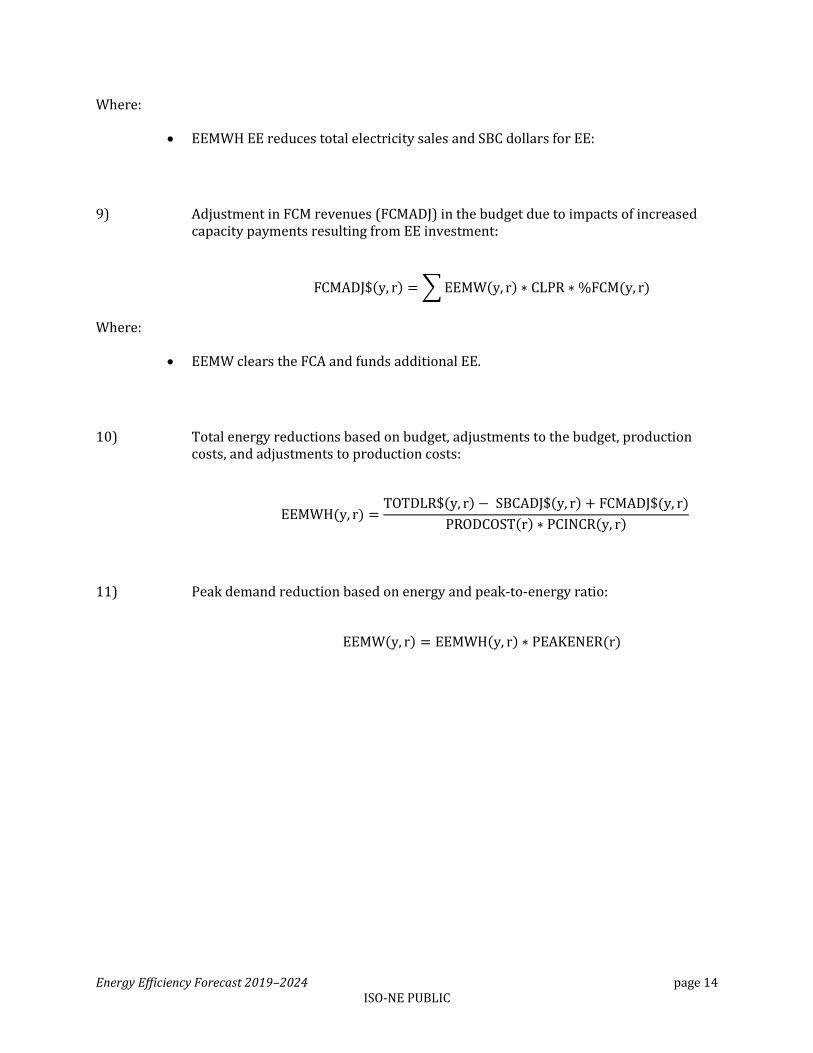
Where:
EEMWH EE reduces total electricity sales and SBC dollars for EE:
9) Adjustment in FCM revenues (FCMADJ) in the budget due to impacts of increased capacity payments resulting from EE investment:
Where:
EEMW clears the FCA and funds additional EE.
10) Total energy reductions based on budget, adjustments to the budget, production costs, and adjustments to production costs:
11) Peak demand reduction based on energy and peak-to-energy ratio:
Energy Efficiency Forecast 2019–2024 page 15 ISO-NE PUBLIC
Section 4 Data Collection
This section summarizes the process used to gather data and the data collected for the forecast years. The detailed data from state-sponsored EE programs, included in this section, were used to implement the EE forecast methodology and produce the EE forecast.
4.1 Data-Collection Process
The ISO collects data for the EE forecast by annually distributing an EE data-gathering worksheet to the PAs.21
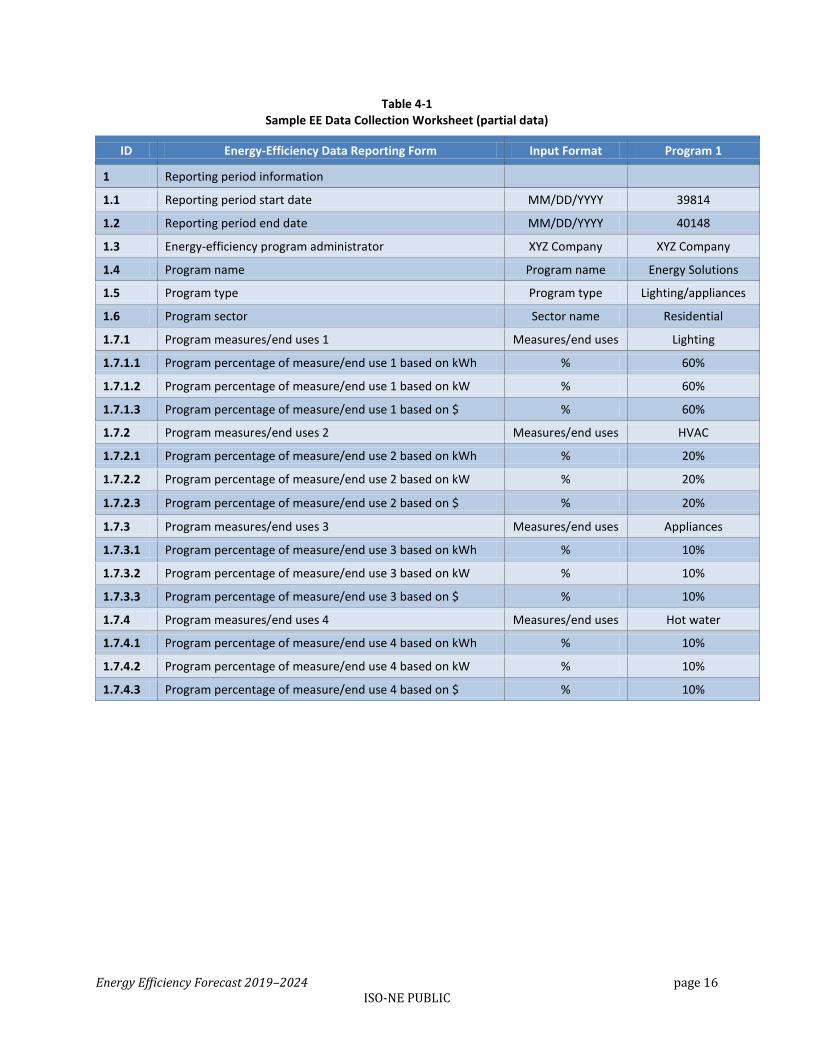
Via the worksheet, the ISO receives data from all the region’s PAs, who report on approximately 136 unique EE programs aimed at commercial/industrial (C&I), residential, and low-income customers.22 For each EE program, a PA can provide information on the type of EE program, the size and cost of the program, and the actual energy saved. Of these programs, lighting measures and mixed lighting normally constitute a majority of the energy and demand savings, and the commercial and industrial sectors provide most of the overall savings.23
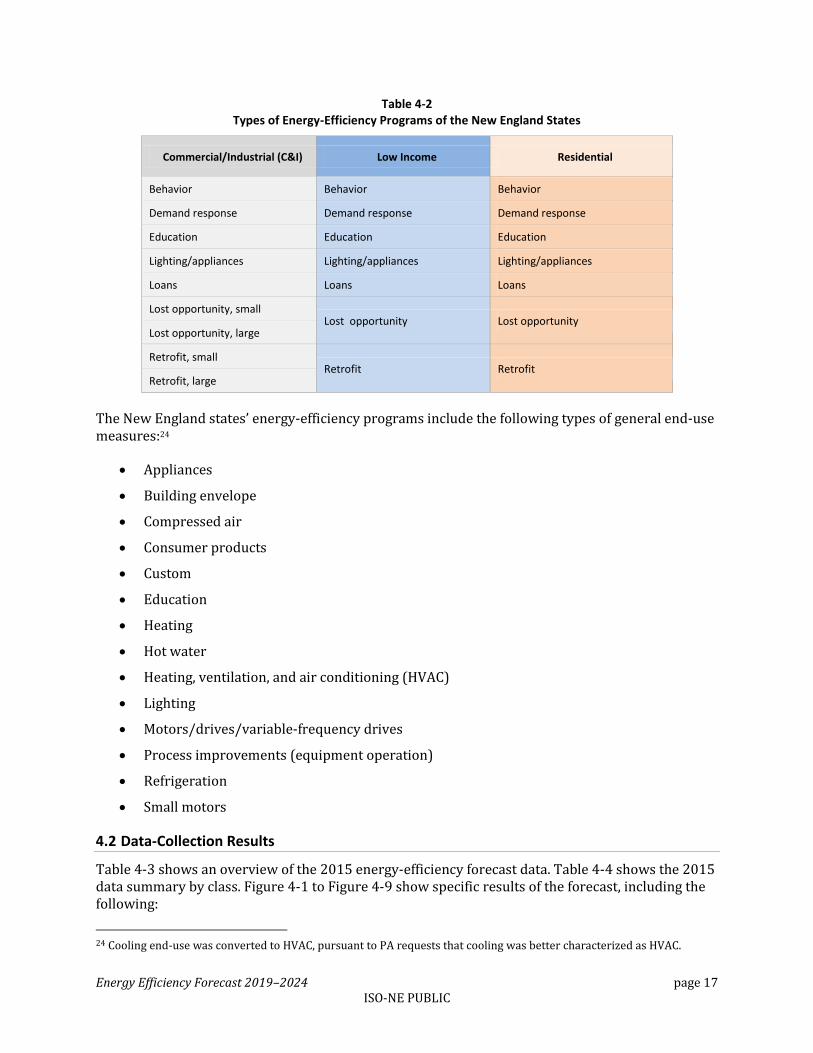
Table 4-1 is a sample of the blank EE data collection worksheet the ISO provides to the PAs each year. Table 4-2 shows the types of EE programs of the New England states for each class.
21 EE data submitted to the ISO by the PAs is available at http://www.iso-ne.com/committees/planning/energy-efficiency-forecast.
22 The ISO did not request data from municipal electric entities and merchant energy-efficiency providers.
23 Mixed lighting refers to programs that include lighting and other measures, such as mechanical systems, building envelope, process improvements, and appliances. See Energy Efficiency Forecast 2015–2020, EEFWG presentation, slide 28 (February 24, 2012), http://www.iso-ne.com/static-assets/documents/committees/comm_wkgrps/othr/enrgy_effncy_frcst/mtrls/ee_forecast_work_group_2_24_12_final.pdf.
Energy Efficiency Forecast 2019–2024 page 16 ISO-NE PUBLIC
Table 4-1 Sample EE Data Collection Worksheet (partial data)
ID Energy-Efficiency Data Reporting Form Input Format Program 1
1 Reporting period information
1.1 Reporting period start date MM/DD/YYYY 39814
1.2 Reporting period end date MM/DD/YYYY 40148
1.3 Energy-efficiency program administrator XYZ Company XYZ Company
1.4 Program name Program name Energy Solutions
1.5 Program type Program type Lighting/appliances
1.6 Program sector Sector name Residential
1.7.1 Program measures/end uses 1 Measures/end uses Lighting
1.7.1.1 Program percentage of measure/end use 1 based on kWh % 60%
1.7.1.2 Program percentage of measure/end use 1 based on kW % 60%
1.7.1.3 Program percentage of measure/end use 1 based on $ % 60%
1.7.2 Program measures/end uses 2 Measures/end uses HVAC
1.7.2.1 Program percentage of measure/end use 2 based on kWh % 20%
1.7.2.2 Program percentage of measure/end use 2 based on kW % 20%
1.7.2.3 Program percentage of measure/end use 2 based on $ % 20%
1.7.3 Program measures/end uses 3 Measures/end uses Appliances
1.7.3.1 Program percentage of measure/end use 3 based on kWh % 10%
1.7.3.2 Program percentage of measure/end use 3 based on kW % 10%
1.7.3.3 Program percentage of measure/end use 3 based on $ % 10%
1.7.4 Program measures/end uses 4 Measures/end uses Hot water
1.7.4.1 Program percentage of measure/end use 4 based on kWh % 10%
1.7.4.2 Program percentage of measure/end use 4 based on kW % 10%
1.7.4.3 Program percentage of measure/end use 4 based on $ % 10%
Energy Efficiency Forecast 2019–2024 page 17 ISO-NE PUBLIC
Table 4-2 Types of Energy-Efficiency Programs of the New England States
Commercial/Industrial (C&I) Low Income Residential
Behavior Behavior Behavior
Demand response Demand response Demand response
Education Education Education
Lighting/appliances Lighting/appliances Lighting/appliances
Loans Loans Loans
Lost opportunity, small Lost opportunity Lost opportunity
Lost opportunity, large
Retrofit, small Retrofit Retrofit
Retrofit, large
The New England states’ energy-efficiency programs include the following types of general end-use measures:24
Appliances
Building envelope
Compressed air
Consumer products
Custom
Education
Heating
Hot water
Heating, ventilation, and air conditioning (HVAC)
Lighting
Motors/drives/variable-frequency drives
Process improvements (equipment operation)
Refrigeration
Small motors
4.2 Data-Collection Results
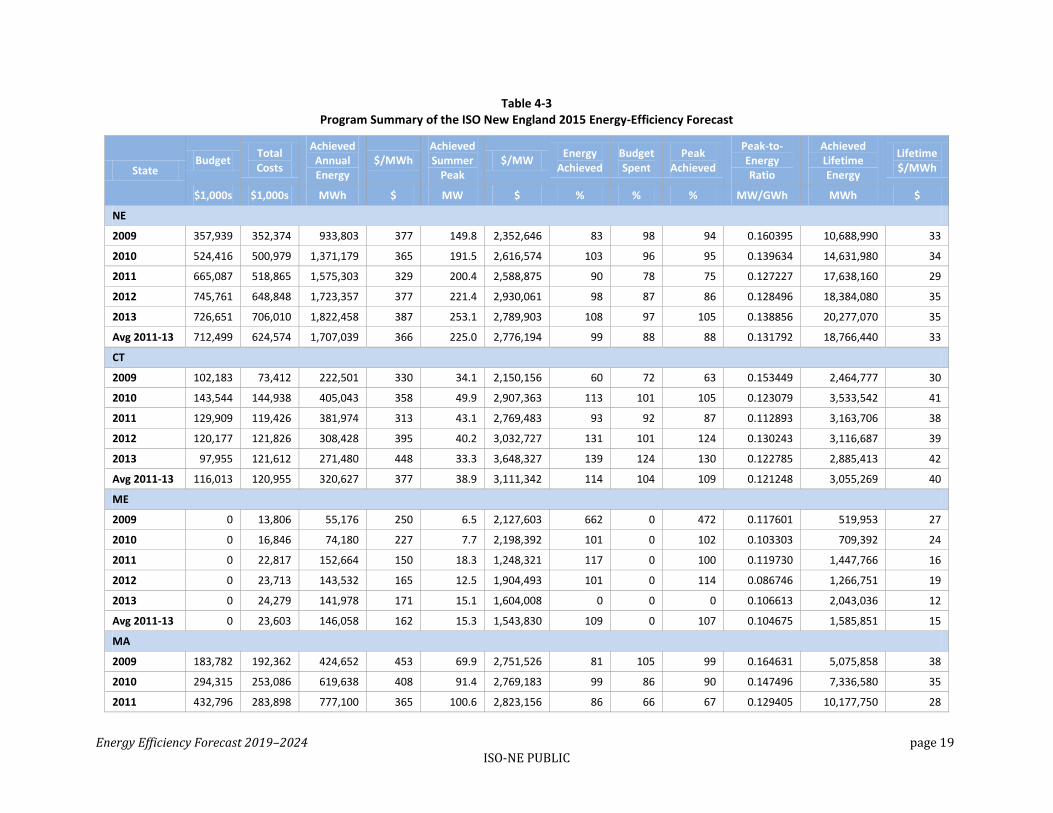
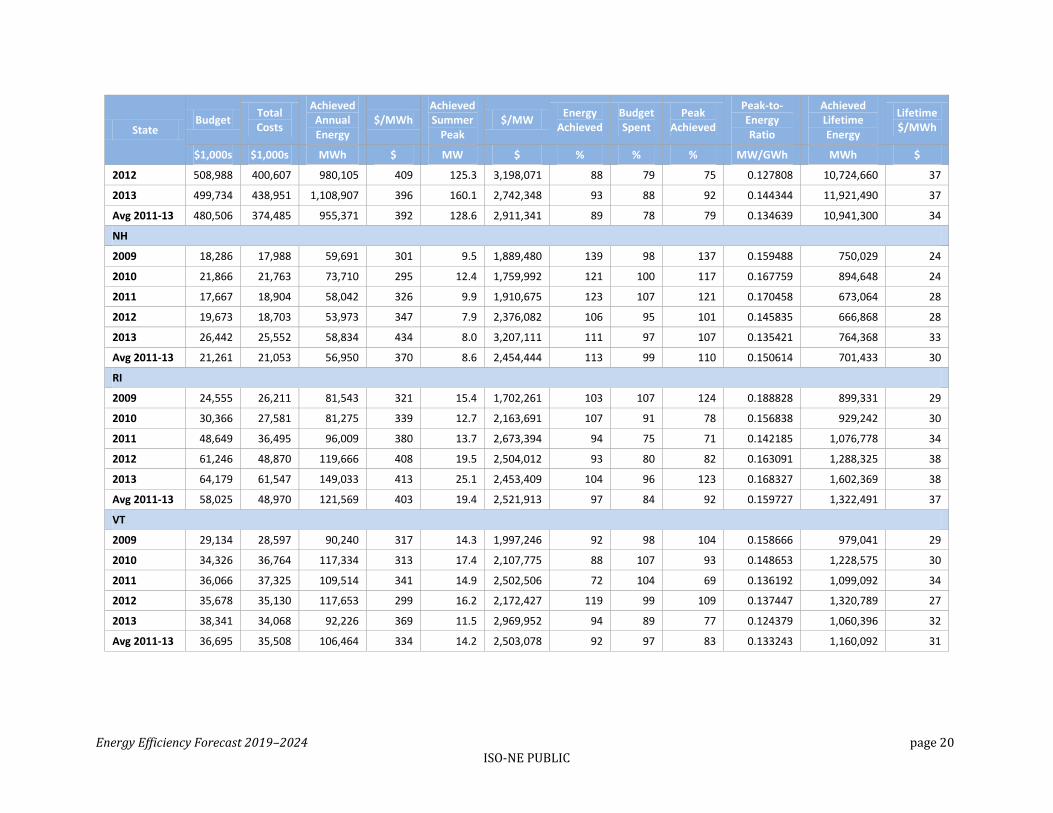
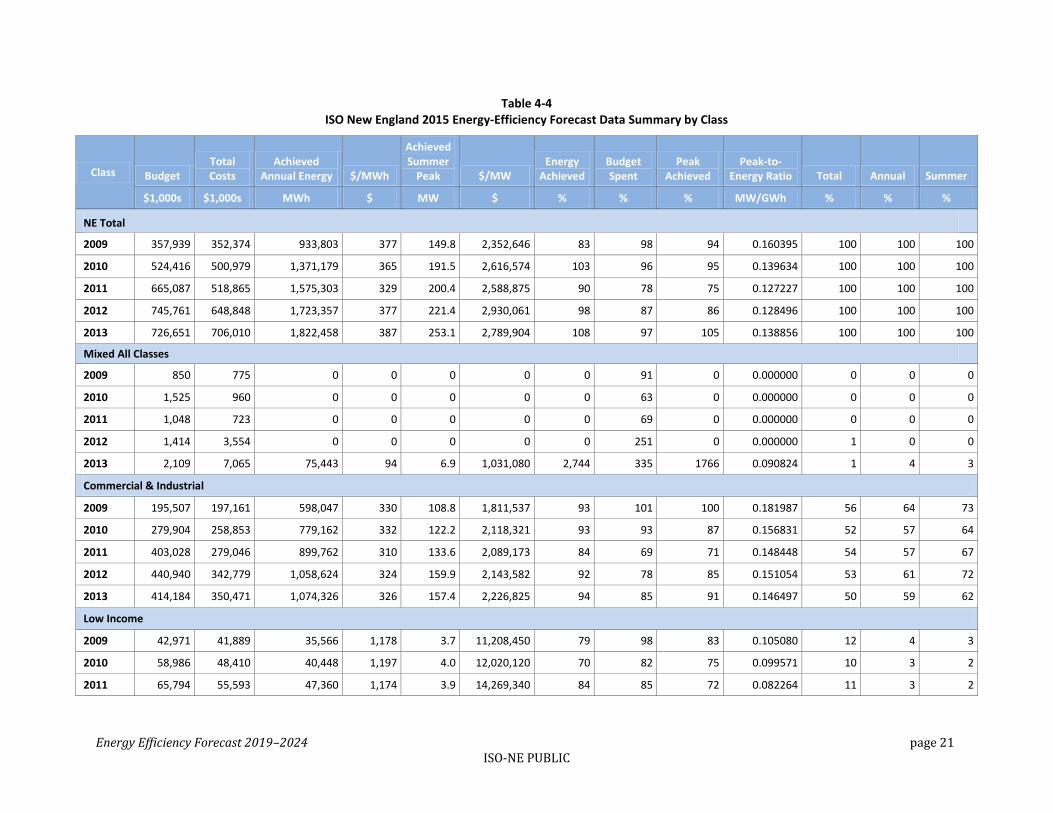
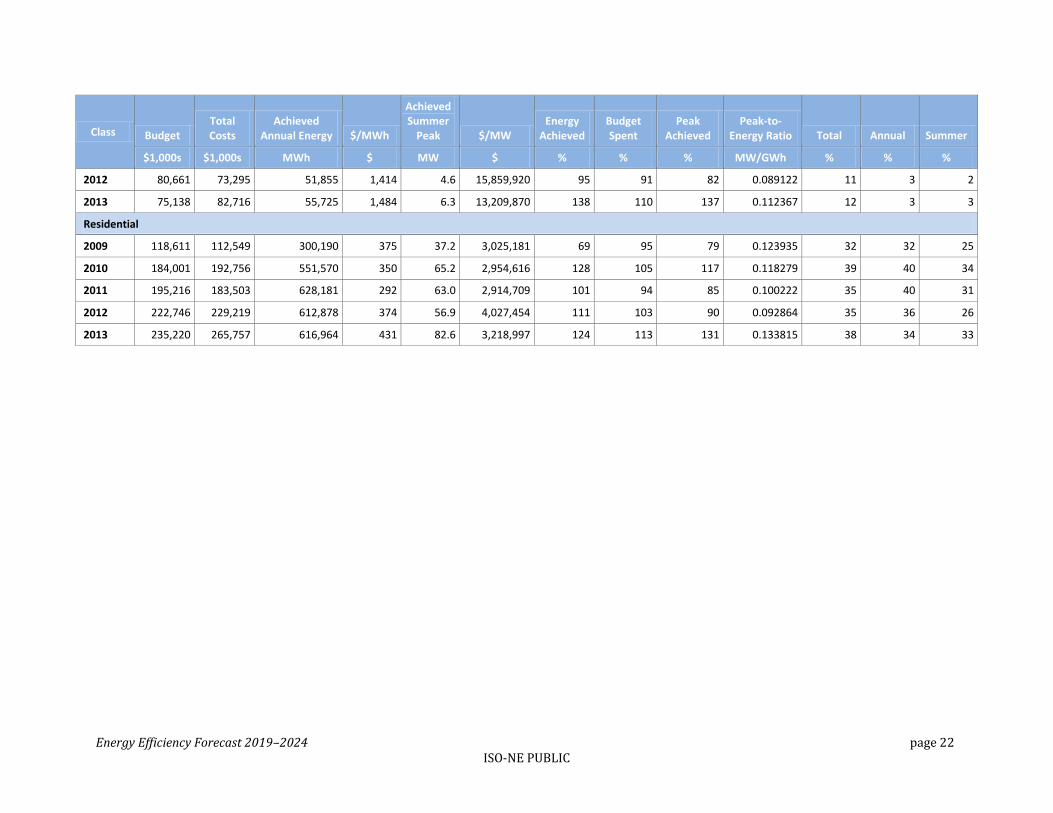
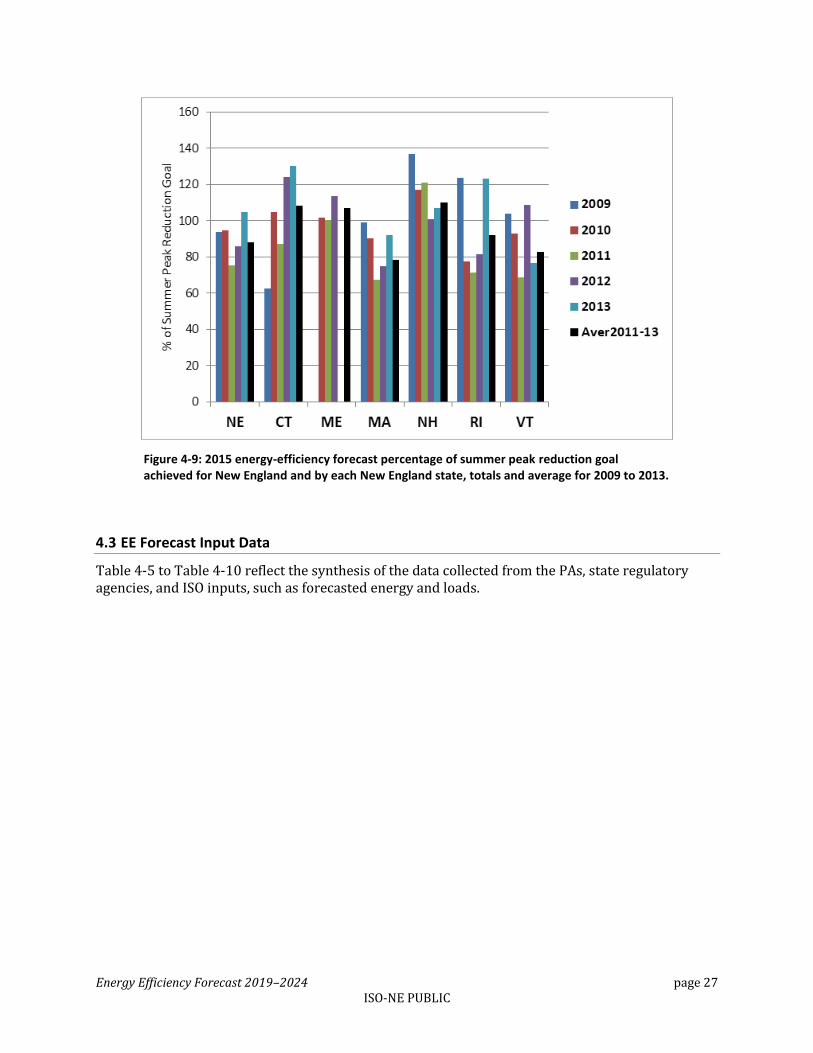
Table 4-3 shows an overview of the 2015 energy-efficiency forecast data. Table 4-4 shows the 2015 data summary by class. Figure 4-1 to Figure 4-9 show specific results of the forecast, including the following:
24 Cooling end-use was converted to HVAC, pursuant to PA requests that cooling was better characterized as HVAC.
Energy Efficiency Forecast 2019–2024 page 18 ISO-NE PUBLIC
For 2013, the percentage of total costs, annual energy use, and summer peak energy use for New England’s EE programs by class (C&I, low income, residential) and the ratio of peak energy demand to annual energy use for each class
For 2009 to 2013, the totals and averages of the following statistics for New England and for each New England state:
o Annual energy production costs
o Ratio of summer peak demand to annual energy use
o Percentage of the annual energy savings goal achieved
o Percentage of the budget spent
o Percentage of the summer peak reduction goal achieved
Energy Efficiency Forecast 2019–2024 page 19 ISO-NE PUBLIC
Table 4-3 Program Summary of the ISO New England 2015 Energy-Efficiency Forecast
State Budget
Total Costs
Achieved Annual Energy
$/MWh Achieved Summer
Peak $/MW
Energy Achieved
Budget Spent
Peak Achieved
Peak-to-Energy Ratio
Achieved Lifetime Energy
Lifetime $/MWh
$1,000s $1,000s MWh $ MW $ % % % MW/GWh MWh $
NE
2009 357,939 352,374 933,803 377 149.8 2,352,646 83 98 94 0.160395 10,688,990 33
2010 524,416 500,979 1,371,179 365 191.5 2,616,574 103 96 95 0.139634 14,631,980 34
2011 665,087 518,865 1,575,303 329 200.4 2,588,875 90 78 75 0.127227 17,638,160 29
2012 745,761 648,848 1,723,357 377 221.4 2,930,061 98 87 86 0.128496 18,384,080 35
2013 726,651 706,010 1,822,458 387 253.1 2,789,903 108 97 105 0.138856 20,277,070 35
Avg 2011-13 712,499 624,574 1,707,039 366 225.0 2,776,194 99 88 88 0.131792 18,766,440 33
CT
2009 102,183 73,412 222,501 330 34.1 2,150,156 60 72 63 0.153449 2,464,777 30
2010 143,544 144,938 405,043 358 49.9 2,907,363 113 101 105 0.123079 3,533,542 41
2011 129,909 119,426 381,974 313 43.1 2,769,483 93 92 87 0.112893 3,163,706 38
2012 120,177 121,826 308,428 395 40.2 3,032,727 131 101 124 0.130243 3,116,687 39
2013 97,955 121,612 271,480 448 33.3 3,648,327 139 124 130 0.122785 2,885,413 42
Avg 2011-13 116,013 120,955 320,627 377 38.9 3,111,342 114 104 109 0.121248 3,055,269 40
ME
2009 0 13,806 55,176 250 6.5 2,127,603 662 0 472 0.117601 519,953 27
2010 0 16,846 74,180 227 7.7 2,198,392 101 0 102 0.103303 709,392 24
2011 0 22,817 152,664 150 18.3 1,248,321 117 0 100 0.119730 1,447,766 16
2012 0 23,713 143,532 165 12.5 1,904,493 101 0 114 0.086746 1,266,751 19
2013 0 24,279 141,978 171 15.1 1,604,008 0 0 0 0.106613 2,043,036 12
Avg 2011-13 0 23,603 146,058 162 15.3 1,543,830 109 0 107 0.104675 1,585,851 15
MA
2009 183,782 192,362 424,652 453 69.9 2,751,526 81 105 99 0.164631 5,075,858 38
2010 294,315 253,086 619,638 408 91.4 2,769,183 99 86 90 0.147496 7,336,580 35
2011 432,796 283,898 777,100 365 100.6 2,823,156 86 66 67 0.129405 10,177,750 28
Energy Efficiency Forecast 2019–2024 page 20 ISO-NE PUBLIC
State Budget
Total Costs
Achieved Annual Energy
$/MWh Achieved Summer
Peak $/MW
Energy Achieved
Budget Spent
Peak Achieved
Peak-to-Energy Ratio
Achieved Lifetime Energy
Lifetime $/MWh
$1,000s $1,000s MWh $ MW $ % % % MW/GWh MWh $
2012 508,988 400,607 980,105 409 125.3 3,198,071 88 79 75 0.127808 10,724,660 37
2013 499,734 438,951 1,108,907 396 160.1 2,742,348 93 88 92 0.144344 11,921,490 37
Avg 2011-13 480,506 374,485 955,371 392 128.6 2,911,341 89 78 79 0.134639 10,941,300 34
NH
2009 18,286 17,988 59,691 301 9.5 1,889,480 139 98 137 0.159488 750,029 24
2010 21,866 21,763 73,710 295 12.4 1,759,992 121 100 117 0.167759 894,648 24
2011 17,667 18,904 58,042 326 9.9 1,910,675 123 107 121 0.170458 673,064 28
2012 19,673 18,703 53,973 347 7.9 2,376,082 106 95 101 0.145835 666,868 28
2013 26,442 25,552 58,834 434 8.0 3,207,111 111 97 107 0.135421 764,368 33
Avg 2011-13 21,261 21,053 56,950 370 8.6 2,454,444 113 99 110 0.150614 701,433 30
RI
2009 24,555 26,211 81,543 321 15.4 1,702,261 103 107 124 0.188828 899,331 29
2010 30,366 27,581 81,275 339 12.7 2,163,691 107 91 78 0.156838 929,242 30
2011 48,649 36,495 96,009 380 13.7 2,673,394 94 75 71 0.142185 1,076,778 34
2012 61,246 48,870 119,666 408 19.5 2,504,012 93 80 82 0.163091 1,288,325 38
2013 64,179 61,547 149,033 413 25.1 2,453,409 104 96 123 0.168327 1,602,369 38
Avg 2011-13 58,025 48,970 121,569 403 19.4 2,521,913 97 84 92 0.159727 1,322,491 37
VT
2009 29,134 28,597 90,240 317 14.3 1,997,246 92 98 104 0.158666 979,041 29
2010 34,326 36,764 117,334 313 17.4 2,107,775 88 107 93 0.148653 1,228,575 30
2011 36,066 37,325 109,514 341 14.9 2,502,506 72 104 69 0.136192 1,099,092 34
2012 35,678 35,130 117,653 299 16.2 2,172,427 119 99 109 0.137447 1,320,789 27
2013 38,341 34,068 92,226 369 11.5 2,969,952 94 89 77 0.124379 1,060,396 32
Avg 2011-13 36,695 35,508 106,464 334 14.2 2,503,078 92 97 83 0.133243 1,160,092 31
Energy Efficiency Forecast 2019–2024 page 21 ISO-NE PUBLIC
Table 4-4 ISO New England 2015 Energy-Efficiency Forecast Data Summary by Class
Class Budget Total Costs
Achieved Annual Energy $/MWh
Achieved Summer
Peak $/MW Energy
Achieved Budget Spent
Peak Achieved
Peak-to-Energy Ratio Total Annual Summer
$1,000s $1,000s MWh $ MW $ % % % MW/GWh % % %
NE Total
2009 357,939 352,374 933,803 377 149.8 2,352,646 83 98 94 0.160395 100 100 100
2010 524,416 500,979 1,371,179 365 191.5 2,616,574 103 96 95 0.139634 100 100 100
2011 665,087 518,865 1,575,303 329 200.4 2,588,875 90 78 75 0.127227 100 100 100
2012 745,761 648,848 1,723,357 377 221.4 2,930,061 98 87 86 0.128496 100 100 100
2013 726,651 706,010 1,822,458 387 253.1 2,789,904 108 97 105 0.138856 100 100 100
Mixed All Classes
2009 850 775 0 0 0 0 0 91 0 0.000000 0 0 0
2010 1,525 960 0 0 0 0 0 63 0 0.000000 0 0 0
2011 1,048 723 0 0 0 0 0 69 0 0.000000 0 0 0
2012 1,414 3,554 0 0 0 0 0 251 0 0.000000 1 0 0
2013 2,109 7,065 75,443 94 6.9 1,031,080 2,744 335 1766 0.090824 1 4 3
Commercial & Industrial
2009 195,507 197,161 598,047 330 108.8 1,811,537 93 101 100 0.181987 56 64 73
2010 279,904 258,853 779,162 332 122.2 2,118,321 93 93 87 0.156831 52 57 64
2011 403,028 279,046 899,762 310 133.6 2,089,173 84 69 71 0.148448 54 57 67
2012 440,940 342,779 1,058,624 324 159.9 2,143,582 92 78 85 0.151054 53 61 72
2013 414,184 350,471 1,074,326 326 157.4 2,226,825 94 85 91 0.146497 50 59 62
Low Income
2009 42,971 41,889 35,566 1,178 3.7 11,208,450 79 98 83 0.105080 12 4 3
2010 58,986 48,410 40,448 1,197 4.0 12,020,120 70 82 75 0.099571 10 3 2
2011 65,794 55,593 47,360 1,174 3.9 14,269,340 84 85 72 0.082264 11 3 2
Energy Efficiency Forecast 2019–2024 page 22 ISO-NE PUBLIC
Class Budget Total Costs
Achieved Annual Energy $/MWh
Achieved Summer
Peak $/MW Energy
Achieved Budget Spent
Peak Achieved
Peak-to-Energy Ratio Total Annual Summer
$1,000s $1,000s MWh $ MW $ % % % MW/GWh % % %
2012 80,661 73,295 51,855 1,414 4.6 15,859,920 95 91 82 0.089122 11 3 2
2013 75,138 82,716 55,725 1,484 6.3 13,209,870 138 110 137 0.112367 12 3 3
Residential
2009 118,611 112,549 300,190 375 37.2 3,025,181 69 95 79 0.123935 32 32 25
2010 184,001 192,756 551,570 350 65.2 2,954,616 128 105 117 0.118279 39 40 34
2011 195,216 183,503 628,181 292 63.0 2,914,709 101 94 85 0.100222 35 40 31
2012 222,746 229,219 612,878 374 56.9 4,027,454 111 103 90 0.092864 35 36 26
2013 235,220 265,757 616,964 431 82.6 3,218,997 124 113 131 0.133815 38 34 33
Energy Efficiency Forecast 2019–2024 page 23 ISO-NE PUBLIC
Figure 4-1: Percentage of total costs for energy-efficiency programs in New England, by class, 2013.
Figure 4-2: Percentage of annual energy use in New England, by class, 2013.
Energy Efficiency Forecast 2019–2024 page 24 ISO-NE PUBLIC
Figure 4-3: Percentage of summer peak energy use in New England, by class, 2013.
Figure 4-4: Ratio of peak energy demand to annual energy use in New England, by class, 2013.
Energy Efficiency Forecast 2019–2024 page 25 ISO-NE PUBLIC
Figure 4-5: 2015 energy-efficiency forecast annual energy production costs in New England and for each New England state, totals and average for 2009 to 2013 ($/MWh).
Figure 4-6: 2015 energy-efficiency forecast ratio of summer peak demand to annual energy use in New England and for each New England state, totals and average for 2009 to 2013 (MW/GWh).
Energy Efficiency Forecast 2019–2024 page 26 ISO-NE PUBLIC
Figure 4-7: 2015 energy-efficiency forecast percentage of annual energy savings goal achieved in New England and by each New England state, totals and average for 2009 to 2013.
Figure 4-8: 2015 energy-efficiency forecast percentage of budget spent in New England and by each New England state, totals and average for 2009 to 2013.
Energy Efficiency Forecast 2019–2024 page 27 ISO-NE PUBLIC
Figure 4-9: 2015 energy-efficiency forecast percentage of summer peak reduction goal achieved for New England and by each New England state, totals and average for 2009 to 2013.
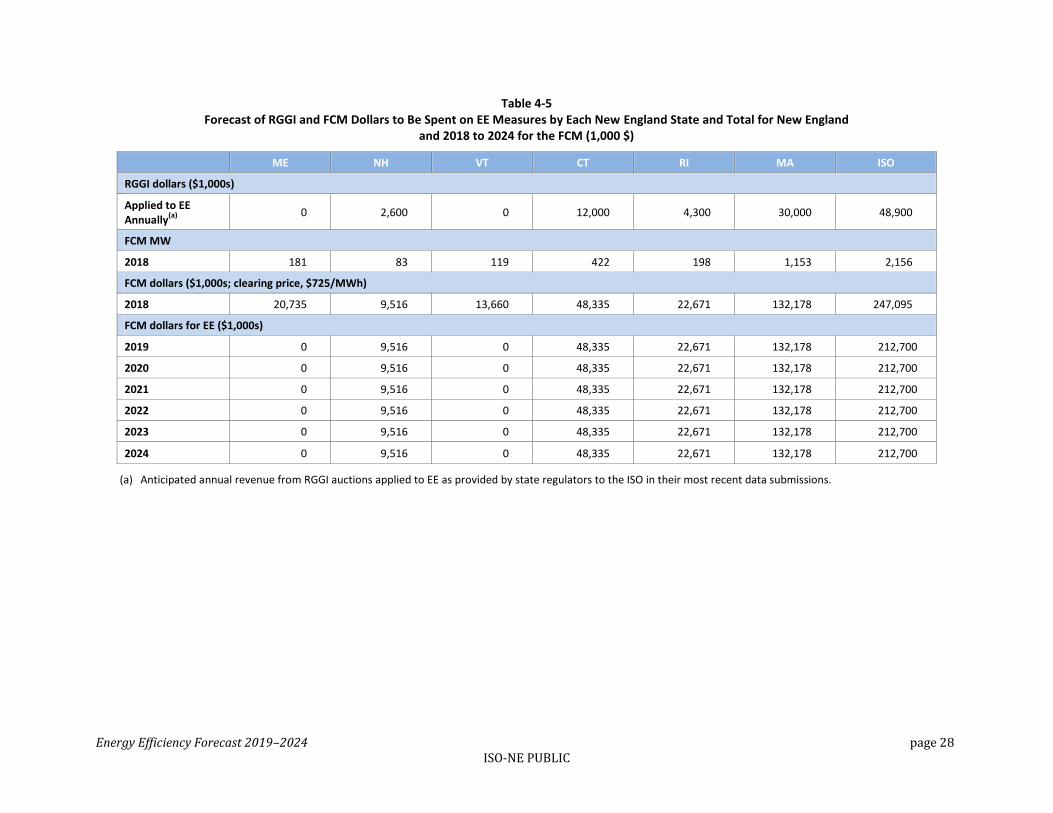
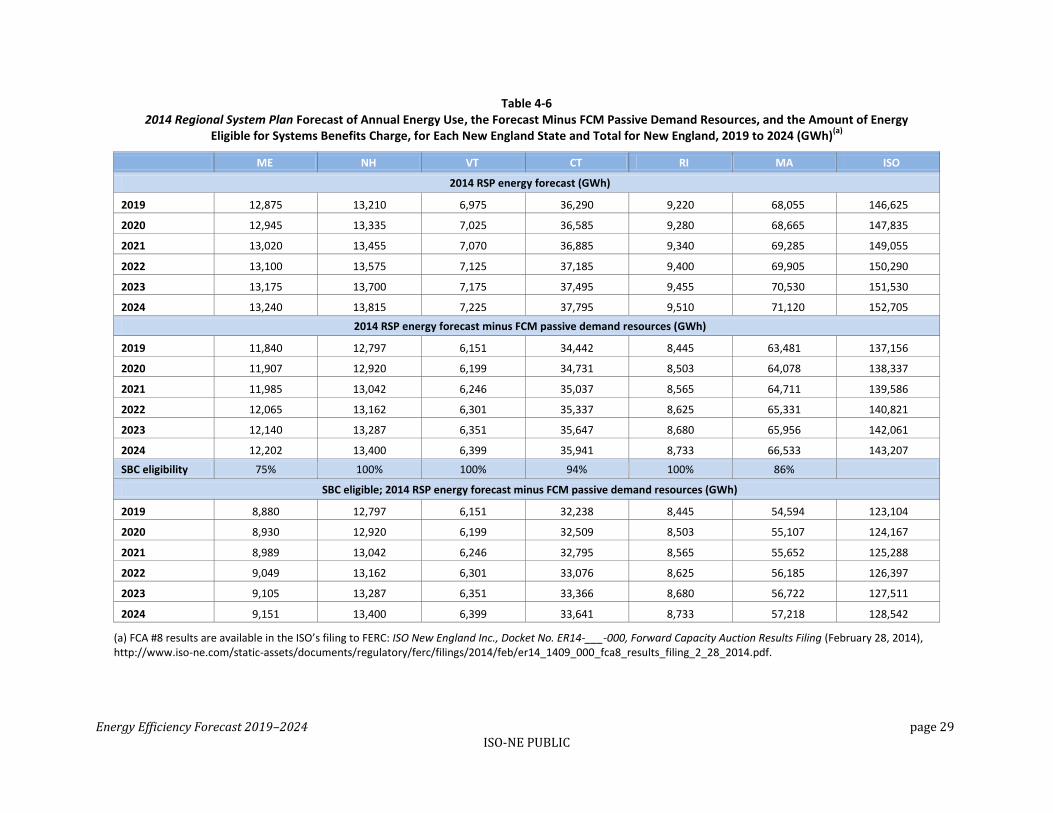
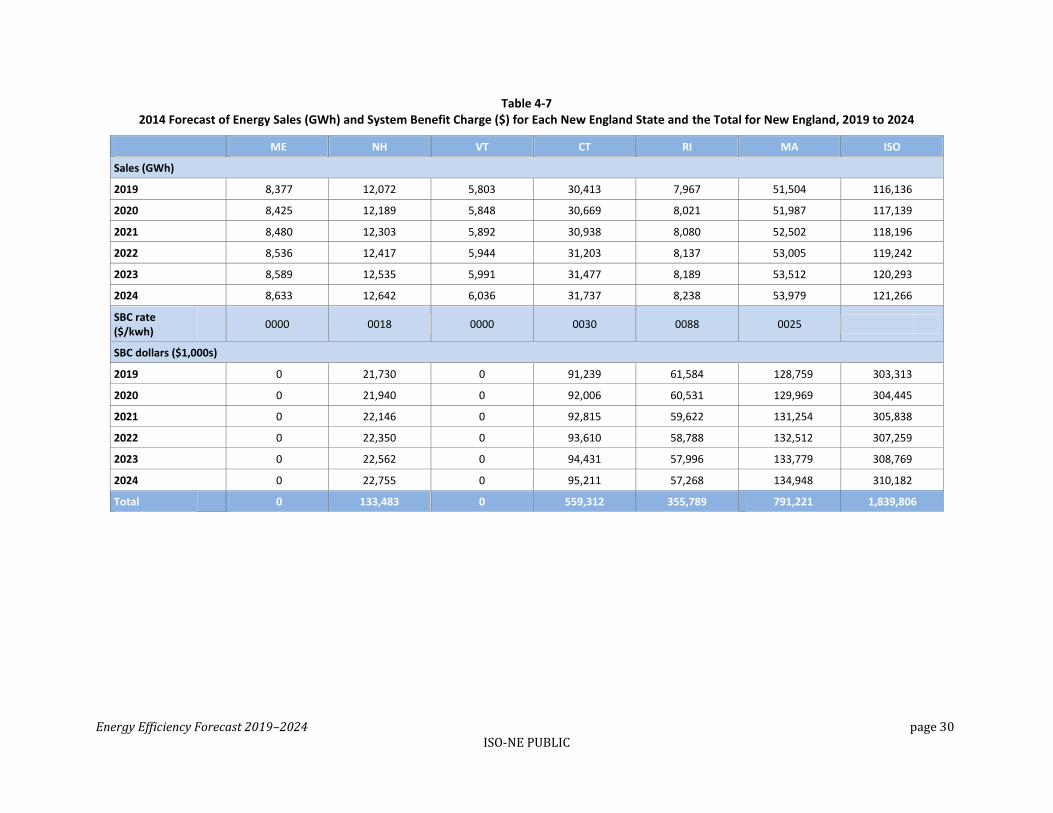
4.3 EE Forecast Input Data
Table 4-5 to Table 4-10 reflect the synthesis of the data collected from the PAs, state regulatory agencies, and ISO inputs, such as forecasted energy and loads.
Energy Efficiency Forecast 2019–2024 page 28 ISO-NE PUBLIC
Table 4-5 Forecast of RGGI and FCM Dollars to Be Spent on EE Measures by Each New England State and Total for New England
and 2018 to 2024 for the FCM (1,000 $)
ME NH VT CT RI MA ISO
RGGI dollars ($1,000s)
Applied to EE Annually
(a)
0 2,600 0 12,000 4,300 30,000 48,900
FCM MW
2018 181 83 119 422 198 1,153 2,156
FCM dollars ($1,000s; clearing price, $725/MWh)
2018 20,735 9,516 13,660 48,335 22,671 132,178 247,095
FCM dollars for EE ($1,000s)
2019 0 9,516 0 48,335 22,671 132,178 212,700
2020 0 9,516 0 48,335 22,671 132,178 212,700
2021 0 9,516 0 48,335 22,671 132,178 212,700
2022 0 9,516 0 48,335 22,671 132,178 212,700
2023 0 9,516 0 48,335 22,671 132,178 212,700
2024 0 9,516 0 48,335 22,671 132,178 212,700
(a) Anticipated annual revenue from RGGI auctions applied to EE as provided by state regulators to the ISO in their most recent data submissions.
Energy Efficiency Forecast 2019–2024 page 29 ISO-NE PUBLIC
Table 4-6 2014 Regional System Plan Forecast of Annual Energy Use, the Forecast Minus FCM Passive Demand Resources, and the Amount of Energy
Eligible for Systems Benefits Charge, for Each New England State and Total for New England, 2019 to 2024 (GWh)(a)
ME NH VT CT RI MA ISO
2014 RSP energy forecast (GWh)
2019 12,875 13,210 6,975 36,290 9,220 68,055 146,625
2020 12,945 13,335 7,025 36,585 9,280 68,665 147,835
2021 13,020 13,455 7,070 36,885 9,340 69,285 149,055
2022 13,100 13,575 7,125 37,185 9,400 69,905 150,290
2023 13,175 13,700 7,175 37,495 9,455 70,530 151,530
2024 13,240 13,815 7,225 37,795 9,510 71,120 152,705
2014 RSP energy forecast minus FCM passive demand resources (GWh)
2019 11,840 12,797 6,151 34,442 8,445 63,481 137,156
2020 11,907 12,920 6,199 34,731 8,503 64,078 138,337
2021 11,985 13,042 6,246 35,037 8,565 64,711 139,586
2022 12,065 13,162 6,301 35,337 8,625 65,331 140,821
2023 12,140 13,287 6,351 35,647 8,680 65,956 142,061
2024 12,202 13,400 6,399 35,941 8,733 66,533 143,207
SBC eligibility 75% 100% 100% 94% 100% 86%
SBC eligible; 2014 RSP energy forecast minus FCM passive demand resources (GWh)
2019 8,880 12,797 6,151 32,238 8,445 54,594 123,104
2020 8,930 12,920 6,199 32,509 8,503 55,107 124,167
2021 8,989 13,042 6,246 32,795 8,565 55,652 125,288
2022 9,049 13,162 6,301 33,076 8,625 56,185 126,397
2023 9,105 13,287 6,351 33,366 8,680 56,722 127,511
2024 9,151 13,400 6,399 33,641 8,733 57,218 128,542
(a) FCA #8 results are available in the ISO’s filing to FERC: ISO New England Inc., Docket No. ER14-___-000, Forward Capacity Auction Results Filing (February 28, 2014), http://www.iso-ne.com/static-assets/documents/regulatory/ferc/filings/2014/feb/er14_1409_000_fca8_results_filing_2_28_2014.pdf.
Energy Efficiency Forecast 2019–2024 page 30 ISO-NE PUBLIC
Table 4-7 2014 Forecast of Energy Sales (GWh) and System Benefit Charge ($) for Each New England State and the Total for New England, 2019 to 2024
ME NH VT CT RI MA ISO
Sales (GWh)
2019 8,377 12,072 5,803 30,413 7,967 51,504 116,136
2020 8,425 12,189 5,848 30,669 8,021 51,987 117,139
2021 8,480 12,303 5,892 30,938 8,080 52,502 118,196
2022 8,536 12,417 5,944 31,203 8,137 53,005 119,242
2023 8,589 12,535 5,991 31,477 8,189 53,512 120,293
2024 8,633 12,642 6,036 31,737 8,238 53,979 121,266
SBC rate ($/kwh)
0000 0018 0000 0030 0088 0025
SBC dollars ($1,000s)
2019 0 21,730 0 91,239 61,584 128,759 303,313
2020 0 21,940 0 92,006 60,531 129,969 304,445
2021 0 22,146 0 92,815 59,622 131,254 305,838
2022 0 22,350 0 93,610 58,788 132,512 307,259
2023 0 22,562 0 94,431 57,996 133,779 308,769
2024 0 22,755 0 95,211 57,268 134,948 310,182
Total 0 133,483 0 559,312 355,789 791,221 1,839,806
Energy Efficiency Forecast 2019–2024 page 31 ISO-NE PUBLIC
Table 4-8 2014 Forecast of Impacts of New Energy-Efficiency Measures on Revenue Streams in Each New England State
and Total For New England, 2019 to 2024
ME NH VT CT RI MA ISO
Lost SBC dollars ($1,000s)
2019 0 113 0 1,252 1,364 2,430 5,159
2020 0 219 0 2,421 2,640 4,695 9,974
2021 0 318 0 3,511 3,834 6,806 14,469
2022 0 411 0 4,530 4,952 8,774 18,666
2023 0 497 0 5,480 5,998 10,608 22,584
2024 0 579 0 6,368 6,976 12,318 26,240
Total 0 2,137 0 23,562 25,764 45,631 97,092
New FCM dollars ($1,000s)
2019 0 1,084 0 5,799 2,534 14,997 24,414
2020 0 2,100 0 11,211 4,905 28,975 47,191
2021 0 3,049 0 16,264 7,125 42,005 68,443
2022 0 3,938 0 20,980 9,203 54,150 88,271
2023 0 4,770 0 25,383 11,146 65,471 106,770
2024 0 5,549 0 29,492 12,964 76,022 124,027
Total 0 20,490 0 109,129 47,877 281,620 459,116
Energy Efficiency Forecast 2019–2024 page 32 ISO-NE PUBLIC
Table 4-9 2014 Forecast of Policy Dollars and Total Budgets for Each New England State and Total for New England, 2019 to 2024 ($1,000s)
Year ME NH VT CT RI MA ISO
Policy dollars ($1,000s)
2019 38,768 0 56,230 77,500 0 315,370 487,868
2020 39,737 0 57,763 77,500 0 306,002 481,002
2021 40,731 0 60,572 77,500 0 297,270 476,073
2022 41,749 0 61,497 77,500 0 289,131 469,877
2023 42,793 0 63,124 77,500 0 281,544 464,961
2024 43,863 0 66,247 77,500 0 274,473 462,083
Total 247,641 0 365,433 465,000 0 1,763,790 2,841,864
Total budgets ($1,000s)
2019 34,891 34,817 56,230 233,621 80,753 556,987 997,299
2020 35,764 35,937 57,763 238,632 80,790 560,186 1,009,071
2021 36,658 36,994 60,572 243,403 80,896 563,311 1,021,833
2022 37,574 37,994 61,497 247,896 81,008 566,277 1,032,246
2023 38,513 38,951 63,124 252,169 81,104 569,128 1,042,989
2024 39,476 39,841 66,247 256,171 81,203 571,773 1,054,712
Total 222,876 224,534 365,433 1,471,892 485,754 3,387,662 6,158,150
Energy Efficiency Forecast 2019–2024 page 33 ISO-NE PUBLIC
Table 4-10 Production Cost Multiplier, Production Costs ($/MWh), and Ratio of Peak Energy Demand to Annual Use, 2013 to 2024
Year ME NH VT CT RI MA
Production cost multiplier (includes inflation)
2013 1 1 1 1 1 1
2014 175 175 175 175 175 175
2015 175 175 175 175 175 175
2016 175 175 175 175 175 175
2017 175 175 175 175 175 175
2018 175 175 175 175 175 175
2019 175 175 175 175 175 175
2020 175 175 175 175 175 175
2021 175 175 175 175 175 175
2022 175 175 175 175 175 175
2023 175 175 175 175 175 175
2024 175 175 175 175 175 175
Production costs ($/MWh)
2013 162 370 334 377 403 392
2014 174 398 359 405 433 421
2015 187 428 386 436 466 453
2016 201 460 415 468 501 487
2017 216 494 446 503 538 524
2018 233 531 480 541 579 563
2019 250 571 515 582 622 605
2020 269 614 554 625 669 650
2021 289 660 596 672 719 699
2022 311 709 640 723 773 752
2023 334 763 688 777 831 808
2024 359 820 740 835 893 869
Peak-to-energy ratio (MW/GWh)
0.1047 0.1506 0.1332 0.1212 0.1597 0.1346
Energy Efficiency Forecast 2019–2024 page 34 ISO-NE PUBLIC
Section 5 Results of New England’s 2014 Energy-Efficiency Forecast
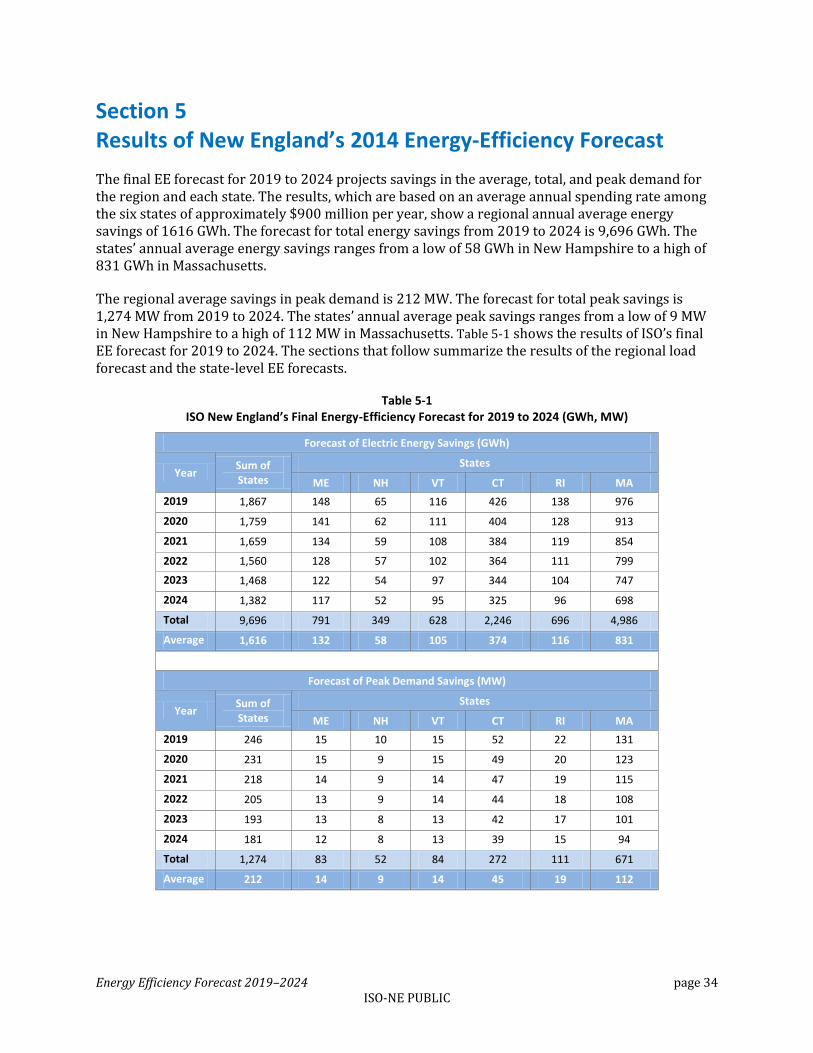
The final EE forecast for 2019 to 2024 projects savings in the average, total, and peak demand for the region and each state. The results, which are based on an average annual spending rate among the six states of approximately $900 million per year, show a regional annual average energy savings of 1616 GWh. The forecast for total energy savings from 2019 to 2024 is 9,696 GWh. The states’ annual average energy savings ranges from a low of 58 GWh in New Hampshire to a high of 831 GWh in Massachusetts.
The regional average savings in peak demand is 212 MW. The forecast for total peak savings is 1,274 MW from 2019 to 2024. The states’ annual average peak savings ranges from a low of 9 MW in New Hampshire to a high of 112 MW in Massachusetts. Table 5-1 shows the results of ISO’s final EE forecast for 2019 to 2024. The sections that follow summarize the results of the regional load forecast and the state-level EE forecasts.
Table 5-1 ISO New England’s Final Energy-Efficiency Forecast for 2019 to 2024 (GWh, MW)
Forecast of Electric Energy Savings (GWh)
Year Sum of States
States
ME NH VT CT RI MA
2019 1,867 148 65 116 426 138 976
2020 1,759 141 62 111 404 128 913
2021 1,659 134 59 108 384 119 854
2022 1,560 128 57 102 364 111 799
2023 1,468 122 54 97 344 104 747
2024 1,382 117 52 95 325 96 698
Total 9,696 791 349 628 2,246 696 4,986
Average 1,616 132 58 105 374 116 831
Forecast of Peak Demand Savings (MW)
Year Sum of States
States
ME NH VT CT RI MA
2019 246 15 10 15 52 22 131
2020 231 15 9 15 49 20 123
2021 218 14 9 14 47 19 115
2022 205 13 9 14 44 18 108
2023 193 13 8 13 42 17 101
2024 181 12 8 13 39 15 94
Total 1,274 83 52 84 272 111 671
Average 212 14 9 14 45 19 112
Energy Efficiency Forecast 2019–2024 page 35 ISO-NE PUBLIC
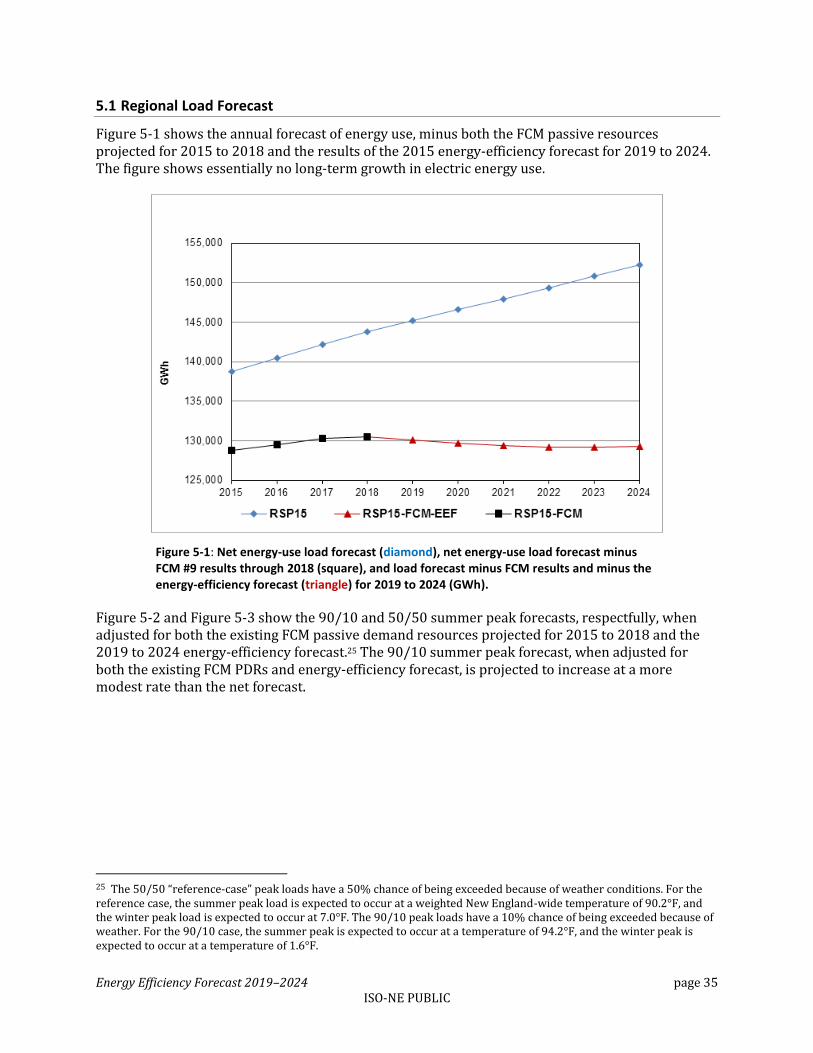
5.1 Regional Load Forecast
Figure 5-1 shows the annual forecast of energy use, minus both the FCM passive resources projected for 2015 to 2018 and the results of the 2015 energy-efficiency forecast for 2019 to 2024. The figure shows essentially no long-term growth in electric energy use.
Figure 5-1: Net energy-use load forecast (diamond), net energy-use load forecast minus FCM #9 results through 2018 (square), and load forecast minus FCM results and minus the energy-efficiency forecast (triangle) for 2019 to 2024 (GWh).
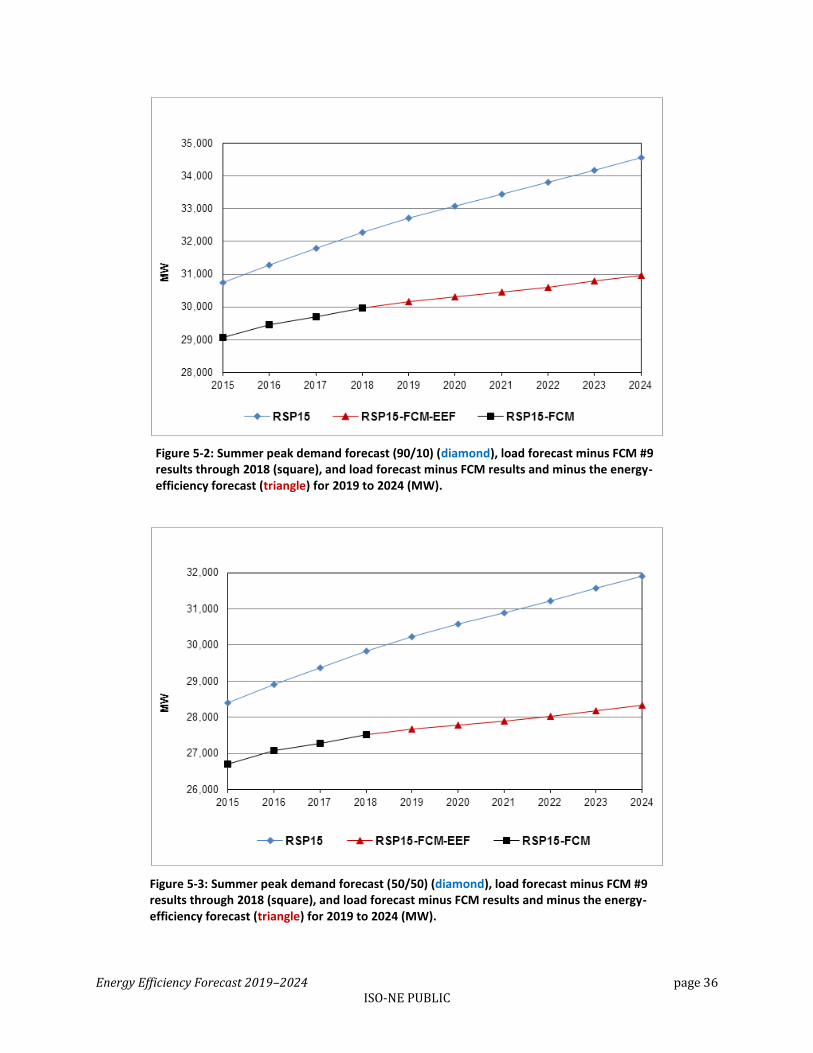
Figure 5-2 and Figure 5-3 show the 90/10 and 50/50 summer peak forecasts, respectfully, when adjusted for both the existing FCM passive demand resources projected for 2015 to 2018 and the 2019 to 2024 energy-efficiency forecast.25 The 90/10 summer peak forecast, when adjusted for both the existing FCM PDRs and energy-efficiency forecast, is projected to increase at a more modest rate than the net forecast.
25 The 50/50 “reference-case” peak loads have a 50% chance of being exceeded because of weather conditions. For the reference case, the summer peak load is expected to occur at a weighted New England-wide temperature of 90.2°F, and the winter peak load is expected to occur at 7.0°F. The 90/10 peak loads have a 10% chance of being exceeded because of weather. For the 90/10 case, the summer peak is expected to occur at a temperature of 94.2°F, and the winter peak is expected to occur at a temperature of 1.6°F.
Energy Efficiency Forecast 2019–2024 page 36 ISO-NE PUBLIC
Figure 5-2: Summer peak demand forecast (90/10) (diamond), load forecast minus FCM #9 results through 2018 (square), and load forecast minus FCM results and minus the energy-efficiency forecast (triangle) for 2019 to 2024 (MW).
Figure 5-3: Summer peak demand forecast (50/50) (diamond), load forecast minus FCM #9 results through 2018 (square), and load forecast minus FCM results and minus the energy-efficiency forecast (triangle) for 2019 to 2024 (MW).
Energy Efficiency Forecast 2019–2024 page 37 ISO-NE PUBLIC
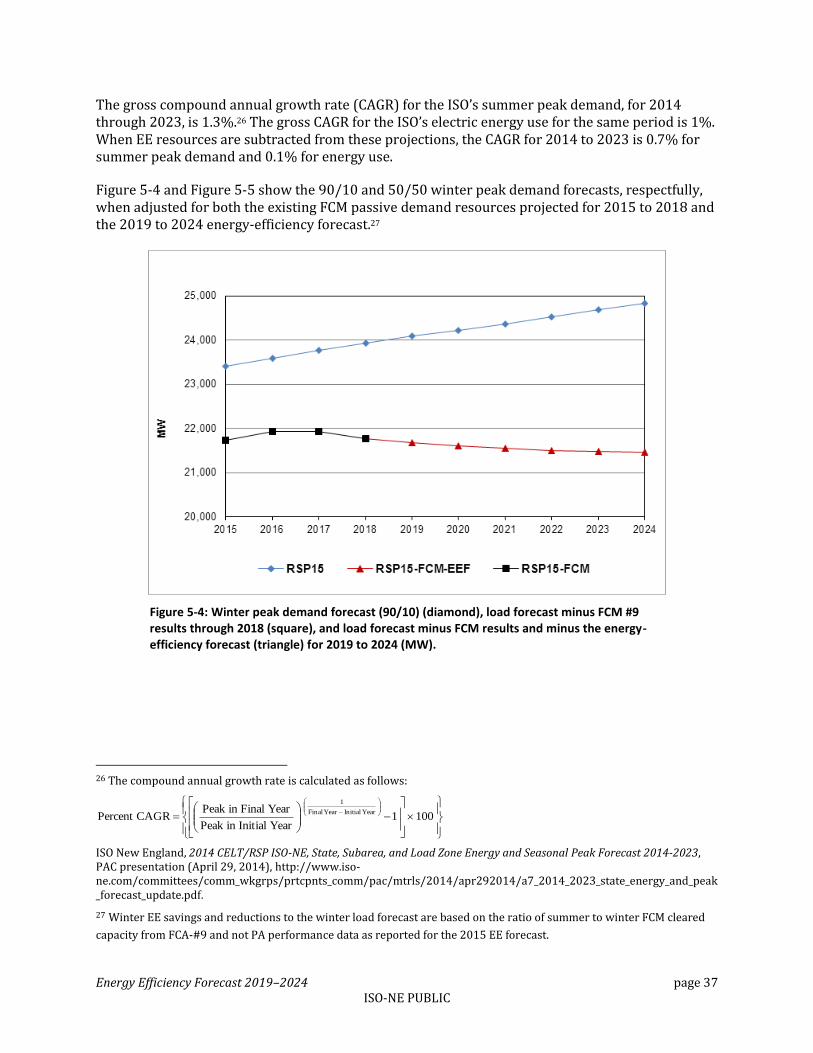
The gross compound annual growth rate (CAGR) for the ISO’s summer peak demand, for 2014 through 2023, is 1.3%.26 The gross CAGR for the ISO’s electric energy use for the same period is 1%. When EE resources are subtracted from these projections, the CAGR for 2014 to 2023 is 0.7% for summer peak demand and 0.1% for energy use.
Figure 5-4 and Figure 5-5 show the 90/10 and 50/50 winter peak demand forecasts, respectfully, when adjusted for both the existing FCM passive demand resources projected for 2015 to 2018 and the 2019 to 2024 energy-efficiency forecast.27
Figure 5-4: Winter peak demand forecast (90/10) (diamond), load forecast minus FCM #9 results through 2018 (square), and load forecast minus FCM results and minus the energy-efficiency forecast (triangle) for 2019 to 2024 (MW).
26 The compound annual growth rate is calculated as follows:
ISO New England, 2014 CELT/RSP ISO-NE, State, Subarea, and Load Zone Energy and Seasonal Peak Forecast 2014-2023, PAC presentation (April 29, 2014), http://www.iso-ne.com/committees/comm_wkgrps/prtcpnts_comm/pac/mtrls/2014/apr292014/a7_2014_2023_state_energy_and_peak_forecast_update.pdf.
27 Winter EE savings and reductions to the winter load forecast are based on the ratio of summer to winter FCM cleared
capacity from FCA-#9 and not PA performance data as reported for the 2015 EE forecast.
1001
YearInitialin Peak
YearFinalin PeakCAGRPercent
YearInitialYearFinal
1
Energy Efficiency Forecast 2019–2024 page 38 ISO-NE PUBLIC
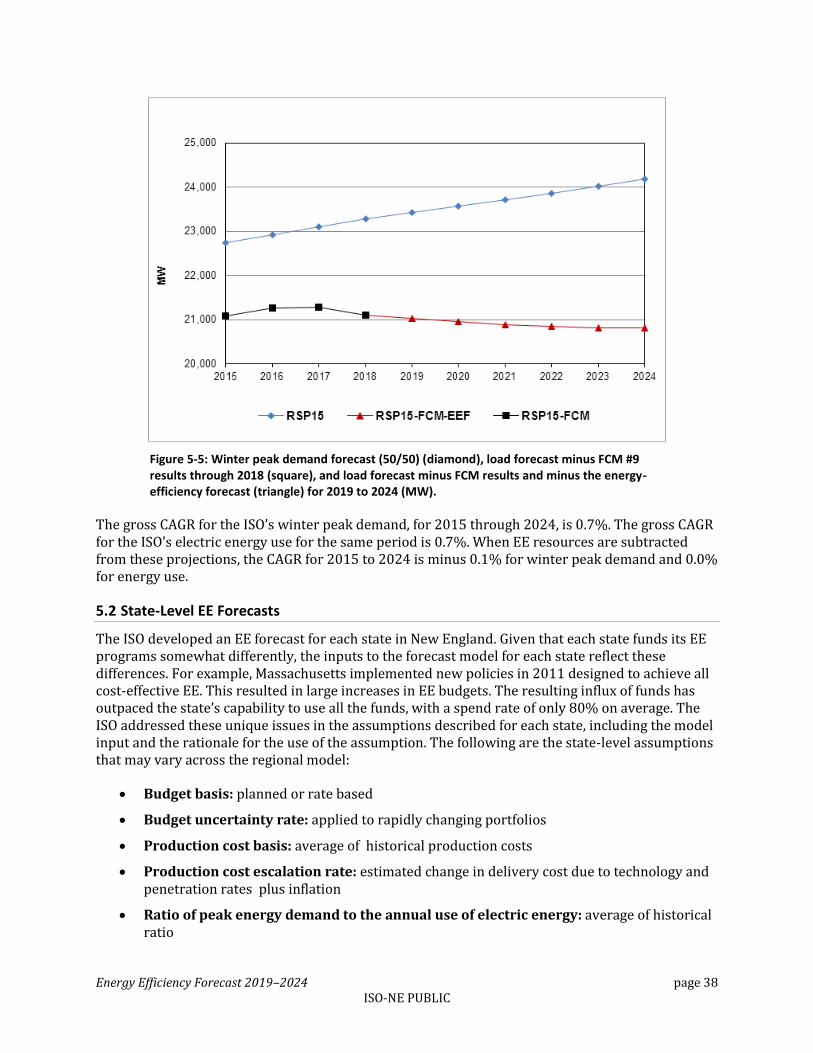
Figure 5-5: Winter peak demand forecast (50/50) (diamond), load forecast minus FCM #9 results through 2018 (square), and load forecast minus FCM results and minus the energy-efficiency forecast (triangle) for 2019 to 2024 (MW).
The gross CAGR for the ISO’s winter peak demand, for 2015 through 2024, is 0.7%. The gross CAGR for the ISO’s electric energy use for the same period is 0.7%. When EE resources are subtracted from these projections, the CAGR for 2015 to 2024 is minus 0.1% for winter peak demand and 0.0% for energy use.
5.2 State-Level EE Forecasts
The ISO developed an EE forecast for each state in New England. Given that each state funds its EE programs somewhat differently, the inputs to the forecast model for each state reflect these differences. For example, Massachusetts implemented new policies in 2011 designed to achieve all cost-effective EE. This resulted in large increases in EE budgets. The resulting influx of funds has outpaced the state’s capability to use all the funds, with a spend rate of only 80% on average. The ISO addressed these unique issues in the assumptions described for each state, including the model input and the rationale for the use of the assumption. The following are the state-level assumptions that may vary across the regional model:
Budget basis: planned or rate based
Budget uncertainty rate: applied to rapidly changing portfolios
Production cost basis: average of historical production costs
Production cost escalation rate: estimated change in delivery cost due to technology and penetration rates plus inflation
Ratio of peak energy demand to the annual use of electric energy: average of historical ratio
Energy Efficiency Forecast 2019–2024 page 39 ISO-NE PUBLIC
Additional budgetary items: alternative revenue sources, state redirection of budget model components (e.g., SBC, RGGI, FCM, policy)
The following figures (Figure 5-6 to Figure 5-17) represent the energy-efficiency forecast for both energy use (GWh) and peak demand (MW) for each New England state. EE programs can be expected to cause electric energy usage in Vermont, Maine, and Rhode Island to decline by 2024 to levels below those that are expected in 2015.
5.2.1 Connecticut
The state-level assumptions used for Connecticut are as follows:
• Budget: based on commission-approved 2014 budget
• Budget uncertainty rate: none
• Production cost: based on average of 2011–2013 PA data
• Production cost escalation rate: 5% + 2.5% inflation
• Peak-to-energy ratio: based on average of 2011–2013 PA data
• Increased budget dollars due to an all-cost-effective policy
Figure 5-6: Net energy-use load forecast for Connecticut (diamond), net energy-use load forecast minus FCM #9 results through 2018 (square), and load forecast minus FCM results and minus the energy-efficiency forecast (triangle) for 2019 to 2024 (GWh).

Energy Efficiency Forecast 2019–2024 page 40 ISO-NE PUBLIC
Figure 5-7: Summer peak demand forecast (90/10) for Connecticut (diamond), load forecast minus FCM #9 results through 2018 (square), and load forecast minus FCM results and minus the energy-efficiency forecast (triangle) for 2019 to 2024 (MW).
5.2.2 Massachusetts
The state-level assumptions used for Massachusetts are as follows:
• Budget: based on commission-approved 2013-15 budget
• Budget uncertainty rate: 10%
• Production cost: based on average of 2011–2013 PA data
• Production cost escalation rate: 5% + 2.5% inflation
• Peak-to-energy ratio: based on average of 2011–2013 PA data
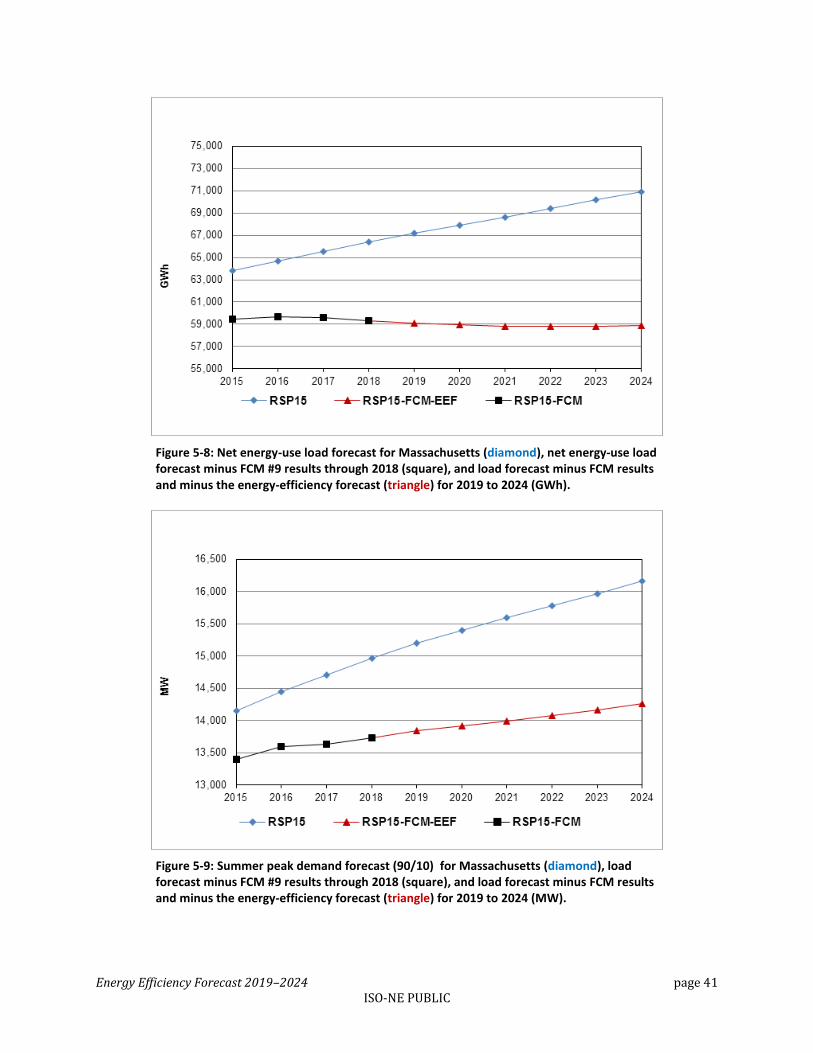
Energy Efficiency Forecast 2019–2024 page 41 ISO-NE PUBLIC
Figure 5-8: Net energy-use load forecast for Massachusetts (diamond), net energy-use load forecast minus FCM #9 results through 2018 (square), and load forecast minus FCM results and minus the energy-efficiency forecast (triangle) for 2019 to 2024 (GWh).
Figure 5-9: Summer peak demand forecast (90/10) for Massachusetts (diamond), load forecast minus FCM #9 results through 2018 (square), and load forecast minus FCM results and minus the energy-efficiency forecast (triangle) for 2019 to 2024 (MW).
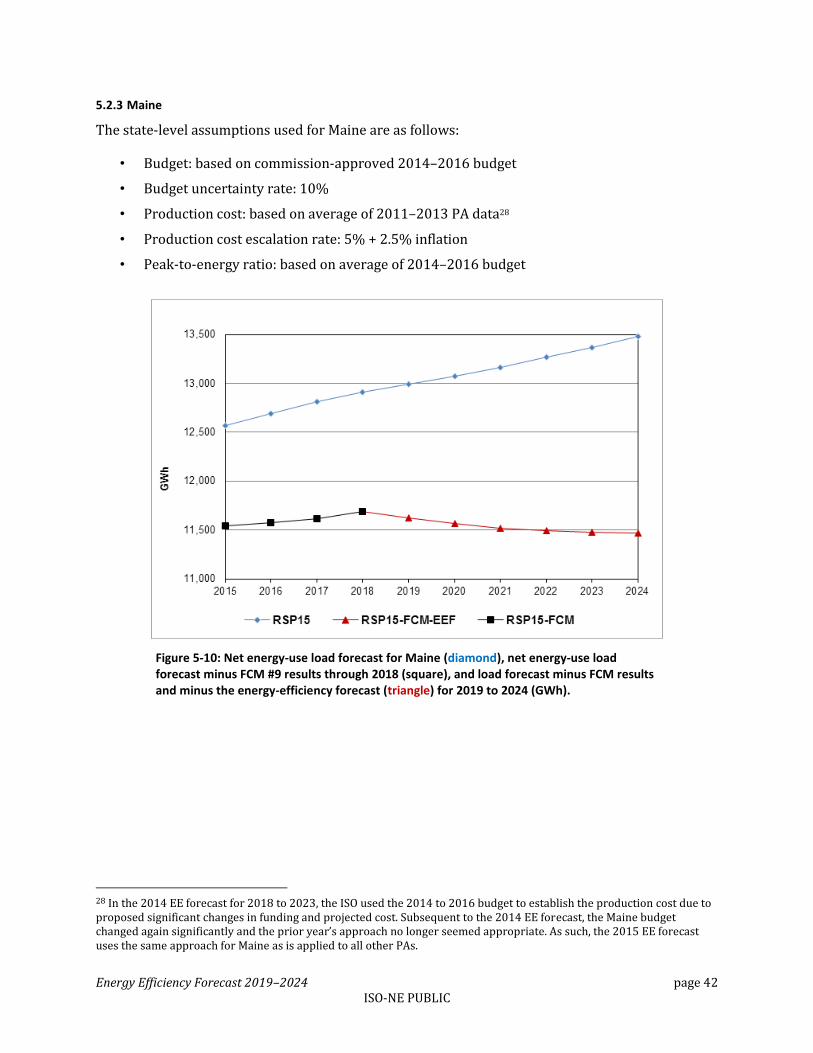
Energy Efficiency Forecast 2019–2024 page 42 ISO-NE PUBLIC
5.2.3 Maine
The state-level assumptions used for Maine are as follows:
• Budget: based on commission-approved 2014–2016 budget
• Budget uncertainty rate: 10%
• Production cost: based on average of 2011–2013 PA data28
• Production cost escalation rate: 5% + 2.5% inflation
• Peak-to-energy ratio: based on average of 2014–2016 budget
Figure 5-10: Net energy-use load forecast for Maine (diamond), net energy-use load forecast minus FCM #9 results through 2018 (square), and load forecast minus FCM results and minus the energy-efficiency forecast (triangle) for 2019 to 2024 (GWh).
28 In the 2014 EE forecast for 2018 to 2023, the ISO used the 2014 to 2016 budget to establish the production cost due to proposed significant changes in funding and projected cost. Subsequent to the 2014 EE forecast, the Maine budget changed again significantly and the prior year’s approach no longer seemed appropriate. As such, the 2015 EE forecast uses the same approach for Maine as is applied to all other PAs.
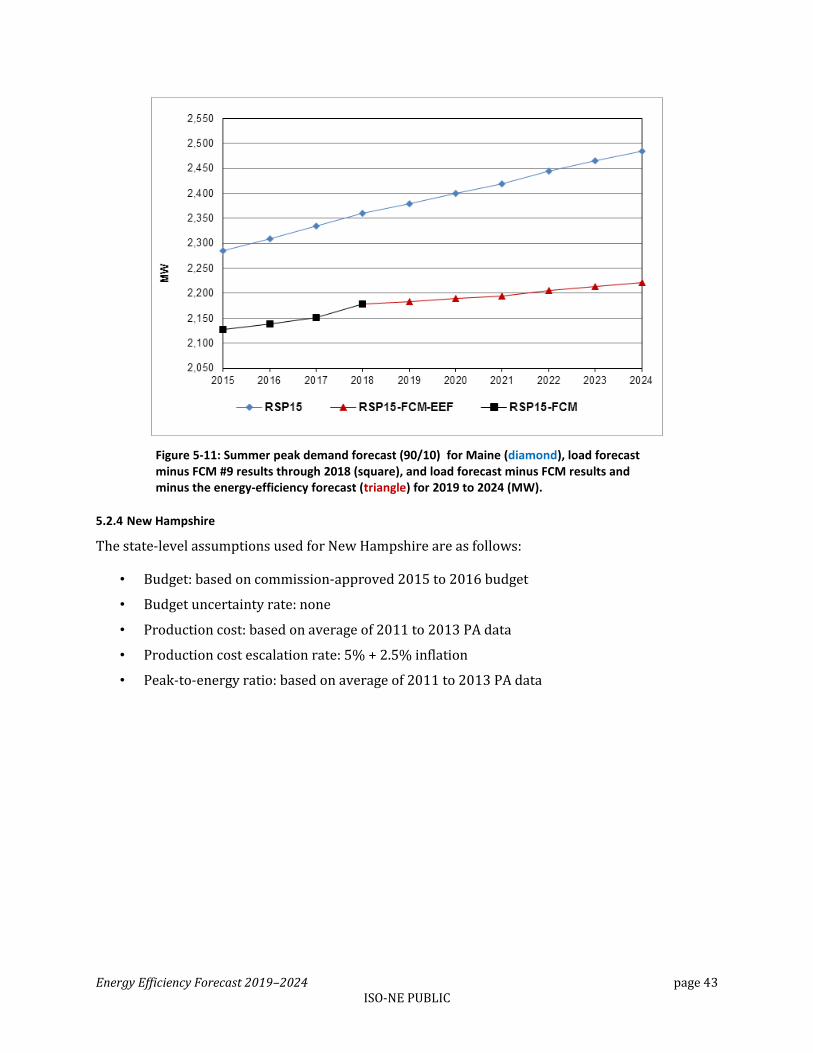
Energy Efficiency Forecast 2019–2024 page 43 ISO-NE PUBLIC
Figure 5-11: Summer peak demand forecast (90/10) for Maine (diamond), load forecast minus FCM #9 results through 2018 (square), and load forecast minus FCM results and minus the energy-efficiency forecast (triangle) for 2019 to 2024 (MW).
5.2.4 New Hampshire
The state-level assumptions used for New Hampshire are as follows:
• Budget: based on commission-approved 2015 to 2016 budget
• Budget uncertainty rate: none
• Production cost: based on average of 2011 to 2013 PA data
• Production cost escalation rate: 5% + 2.5% inflation
• Peak-to-energy ratio: based on average of 2011 to 2013 PA data
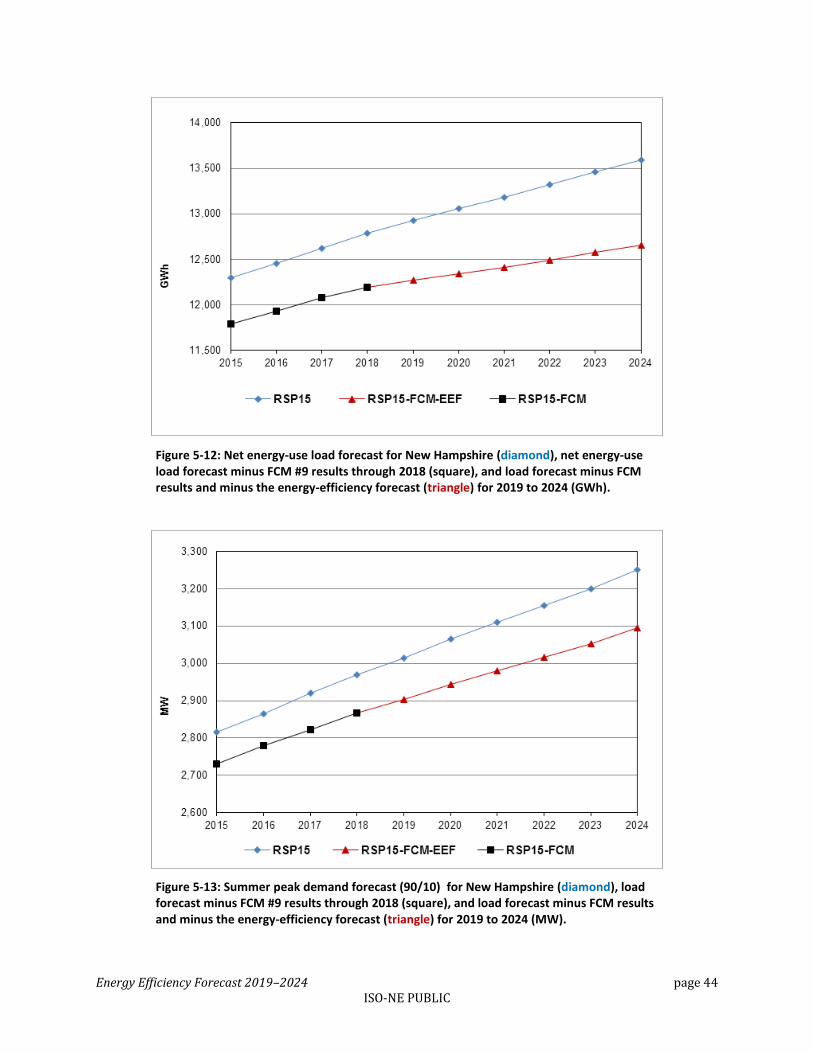
Energy Efficiency Forecast 2019–2024 page 44 ISO-NE PUBLIC
Figure 5-12: Net energy-use load forecast for New Hampshire (diamond), net energy-use load forecast minus FCM #9 results through 2018 (square), and load forecast minus FCM results and minus the energy-efficiency forecast (triangle) for 2019 to 2024 (GWh).
Figure 5-13: Summer peak demand forecast (90/10) for New Hampshire (diamond), load forecast minus FCM #9 results through 2018 (square), and load forecast minus FCM results and minus the energy-efficiency forecast (triangle) for 2019 to 2024 (MW).
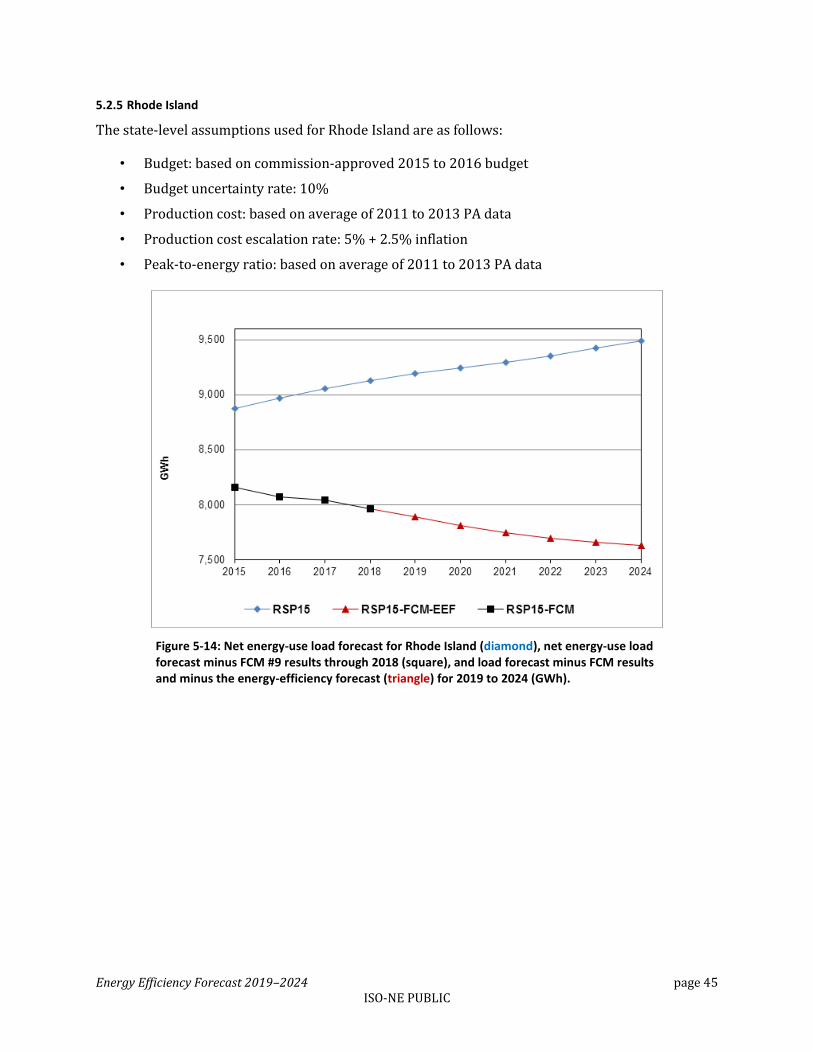
Energy Efficiency Forecast 2019–2024 page 45 ISO-NE PUBLIC
5.2.5 Rhode Island
The state-level assumptions used for Rhode Island are as follows:
• Budget: based on commission-approved 2015 to 2016 budget
• Budget uncertainty rate: 10%
• Production cost: based on average of 2011 to 2013 PA data
• Production cost escalation rate: 5% + 2.5% inflation
• Peak-to-energy ratio: based on average of 2011 to 2013 PA data
Figure 5-14: Net energy-use load forecast for Rhode Island (diamond), net energy-use load forecast minus FCM #9 results through 2018 (square), and load forecast minus FCM results and minus the energy-efficiency forecast (triangle) for 2019 to 2024 (GWh).
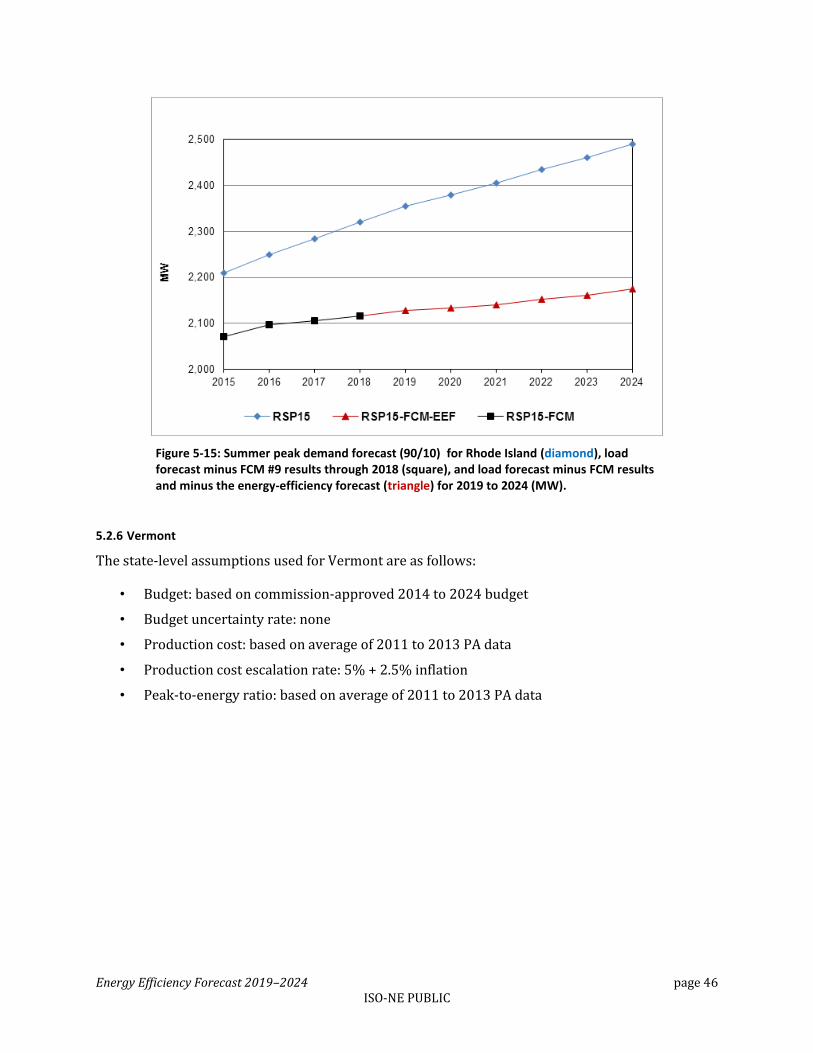
Energy Efficiency Forecast 2019–2024 page 46 ISO-NE PUBLIC
Figure 5-15: Summer peak demand forecast (90/10) for Rhode Island (diamond), load forecast minus FCM #9 results through 2018 (square), and load forecast minus FCM results and minus the energy-efficiency forecast (triangle) for 2019 to 2024 (MW).
5.2.6 Vermont
The state-level assumptions used for Vermont are as follows:
• Budget: based on commission-approved 2014 to 2024 budget
• Budget uncertainty rate: none
• Production cost: based on average of 2011 to 2013 PA data
• Production cost escalation rate: 5% + 2.5% inflation
• Peak-to-energy ratio: based on average of 2011 to 2013 PA data
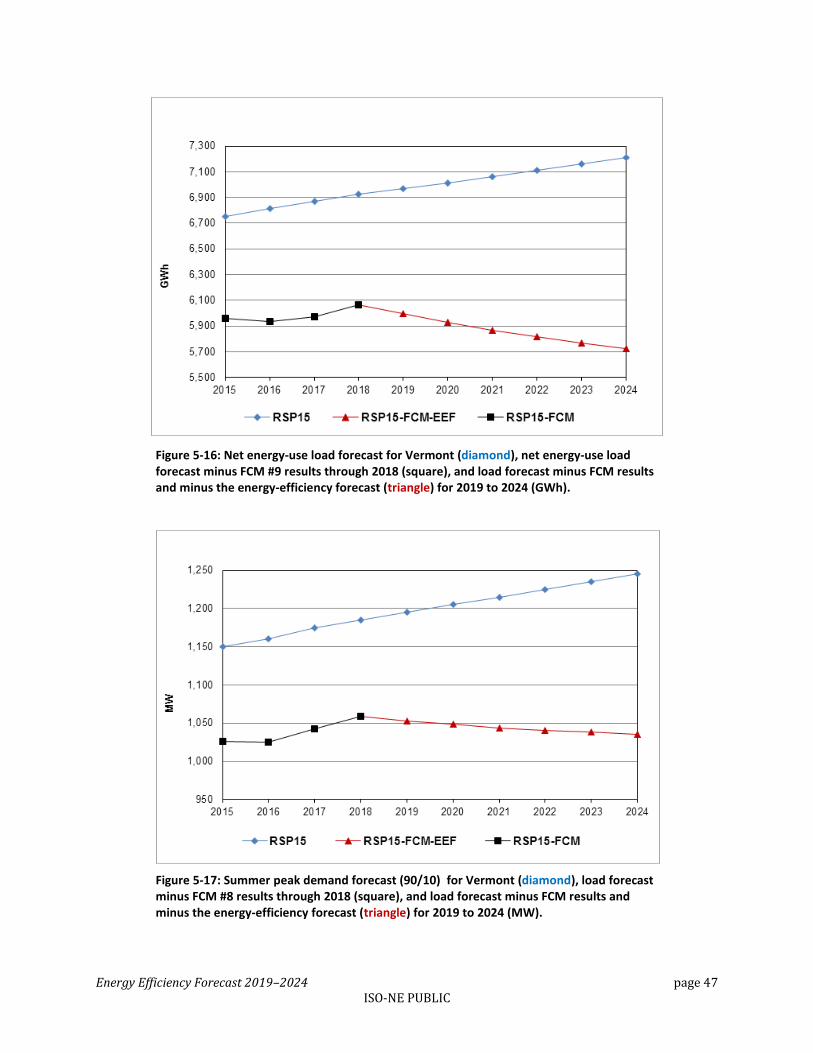
Energy Efficiency Forecast 2019–2024 page 47 ISO-NE PUBLIC
Figure 5-16: Net energy-use load forecast for Vermont (diamond), net energy-use load forecast minus FCM #9 results through 2018 (square), and load forecast minus FCM results and minus the energy-efficiency forecast (triangle) for 2019 to 2024 (GWh).
Figure 5-17: Summer peak demand forecast (90/10) for Vermont (diamond), load forecast minus FCM #8 results through 2018 (square), and load forecast minus FCM results and minus the energy-efficiency forecast (triangle) for 2019 to 2024 (MW).
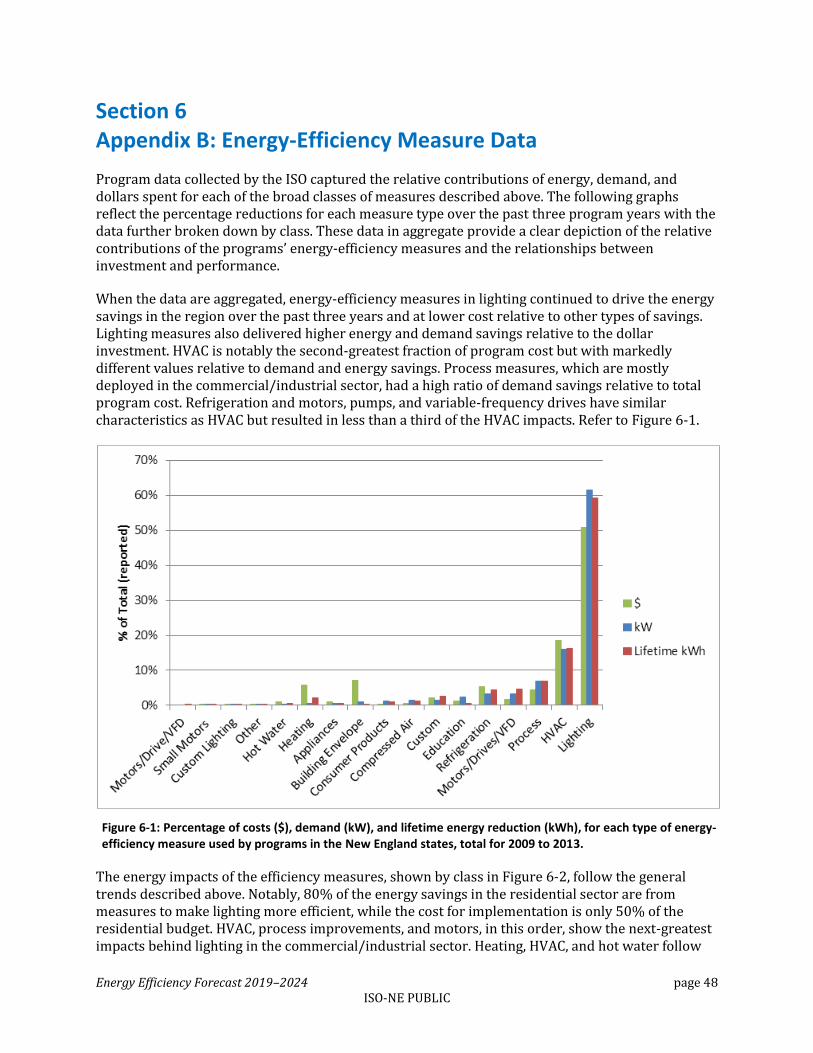
Energy Efficiency Forecast 2019–2024 page 48 ISO-NE PUBLIC
Section 6 Appendix B: Energy-Efficiency Measure Data
Program data collected by the ISO captured the relative contributions of energy, demand, and dollars spent for each of the broad classes of measures described above. The following graphs reflect the percentage reductions for each measure type over the past three program years with the data further broken down by class. These data in aggregate provide a clear depiction of the relative contributions of the programs’ energy-efficiency measures and the relationships between investment and performance.
When the data are aggregated, energy-efficiency measures in lighting continued to drive the energy savings in the region over the past three years and at lower cost relative to other types of savings. Lighting measures also delivered higher energy and demand savings relative to the dollar investment. HVAC is notably the second-greatest fraction of program cost but with markedly different values relative to demand and energy savings. Process measures, which are mostly deployed in the commercial/industrial sector, had a high ratio of demand savings relative to total program cost. Refrigeration and motors, pumps, and variable-frequency drives have similar characteristics as HVAC but resulted in less than a third of the HVAC impacts. Refer to Figure 6-1.
Figure 6-1: Percentage of costs ($), demand (kW), and lifetime energy reduction (kWh), for each type of energy-efficiency measure used by programs in the New England states, total for 2009 to 2013.
The energy impacts of the efficiency measures, shown by class in Figure 6-2, follow the general trends described above. Notably, 80% of the energy savings in the residential sector are from measures to make lighting more efficient, while the cost for implementation is only 50% of the residential budget. HVAC, process improvements, and motors, in this order, show the next-greatest impacts behind lighting in the commercial/industrial sector. Heating, HVAC, and hot water follow
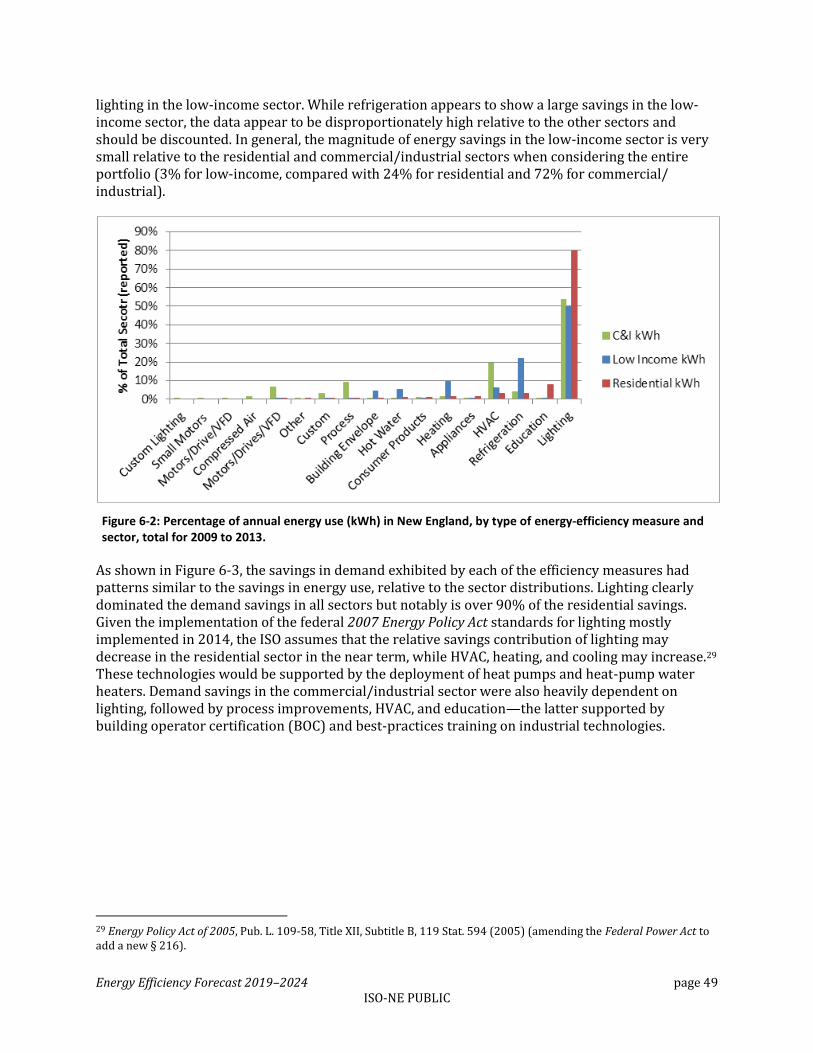
Energy Efficiency Forecast 2019–2024 page 49 ISO-NE PUBLIC
lighting in the low-income sector. While refrigeration appears to show a large savings in the low-income sector, the data appear to be disproportionately high relative to the other sectors and should be discounted. In general, the magnitude of energy savings in the low-income sector is very small relative to the residential and commercial/industrial sectors when considering the entire portfolio (3% for low-income, compared with 24% for residential and 72% for commercial/ industrial).
Figure 6-2: Percentage of annual energy use (kWh) in New England, by type of energy-efficiency measure and sector, total for 2009 to 2013.
As shown in Figure 6-3, the savings in demand exhibited by each of the efficiency measures had patterns similar to the savings in energy use, relative to the sector distributions. Lighting clearly dominated the demand savings in all sectors but notably is over 90% of the residential savings. Given the implementation of the federal 2007 Energy Policy Act standards for lighting mostly implemented in 2014, the ISO assumes that the relative savings contribution of lighting may decrease in the residential sector in the near term, while HVAC, heating, and cooling may increase.29 These technologies would be supported by the deployment of heat pumps and heat-pump water heaters. Demand savings in the commercial/industrial sector were also heavily dependent on lighting, followed by process improvements, HVAC, and education—the latter supported by building operator certification (BOC) and best-practices training on industrial technologies.
29 Energy Policy Act of 2005, Pub. L. 109-58, Title XII, Subtitle B, 119 Stat. 594 (2005) (amending the Federal Power Act to add a new § 216).
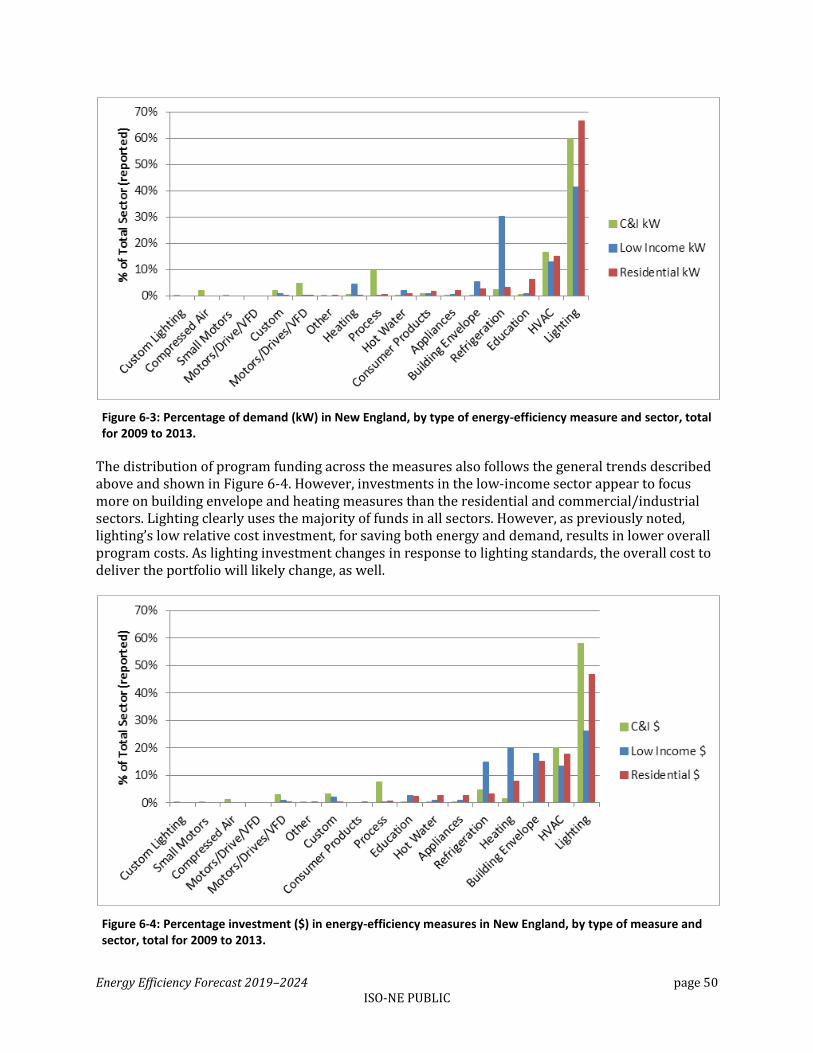
Energy Efficiency Forecast 2019–2024 page 50 ISO-NE PUBLIC
Figure 6-3: Percentage of demand (kW) in New England, by type of energy-efficiency measure and sector, total for 2009 to 2013.
The distribution of program funding across the measures also follows the general trends described above and shown in Figure 6-4. However, investments in the low-income sector appear to focus more on building envelope and heating measures than the residential and commercial/industrial sectors. Lighting clearly uses the majority of funds in all sectors. However, as previously noted, lighting’s low relative cost investment, for saving both energy and demand, results in lower overall program costs. As lighting investment changes in response to lighting standards, the overall cost to deliver the portfolio will likely change, as well.
Figure 6-4: Percentage investment ($) in energy-efficiency measures in New England, by type of measure and sector, total for 2009 to 2013.
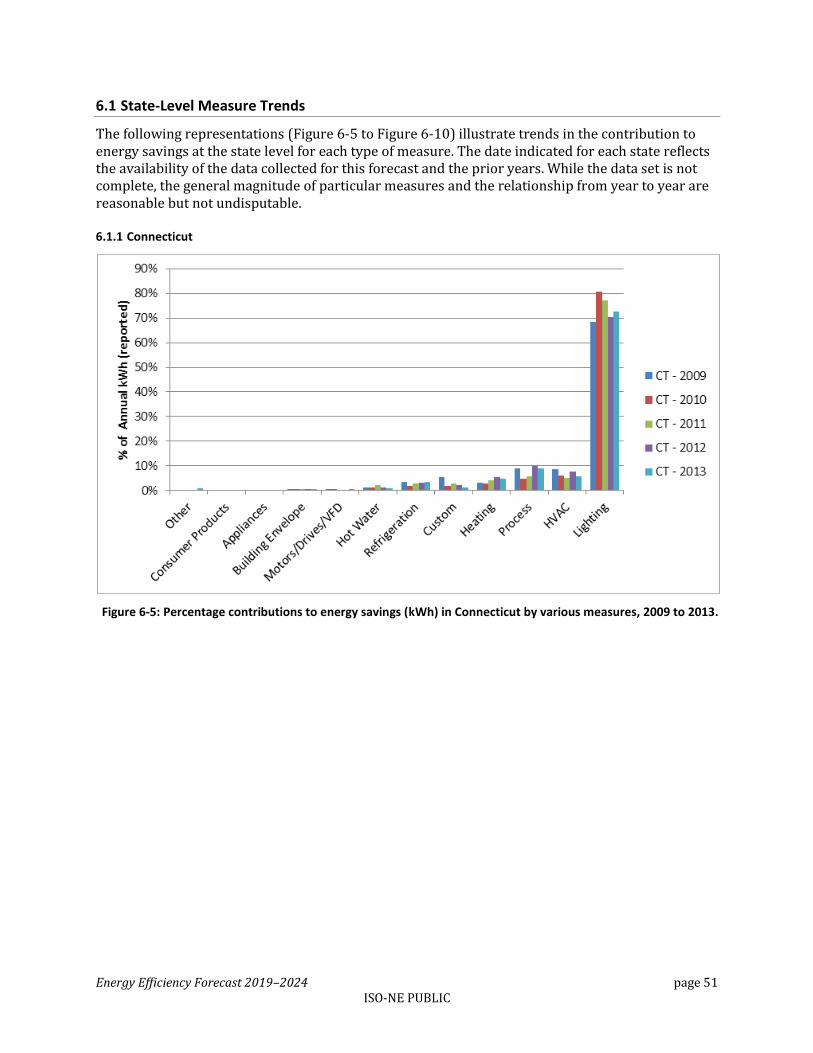
Energy Efficiency Forecast 2019–2024 page 51 ISO-NE PUBLIC
6.1 State-Level Measure Trends
The following representations (Figure 6-5 to Figure 6-10) illustrate trends in the contribution to energy savings at the state level for each type of measure. The date indicated for each state reflects the availability of the data collected for this forecast and the prior years. While the data set is not complete, the general magnitude of particular measures and the relationship from year to year are reasonable but not undisputable.
6.1.1 Connecticut
Figure 6-5: Percentage contributions to energy savings (kWh) in Connecticut by various measures, 2009 to 2013.
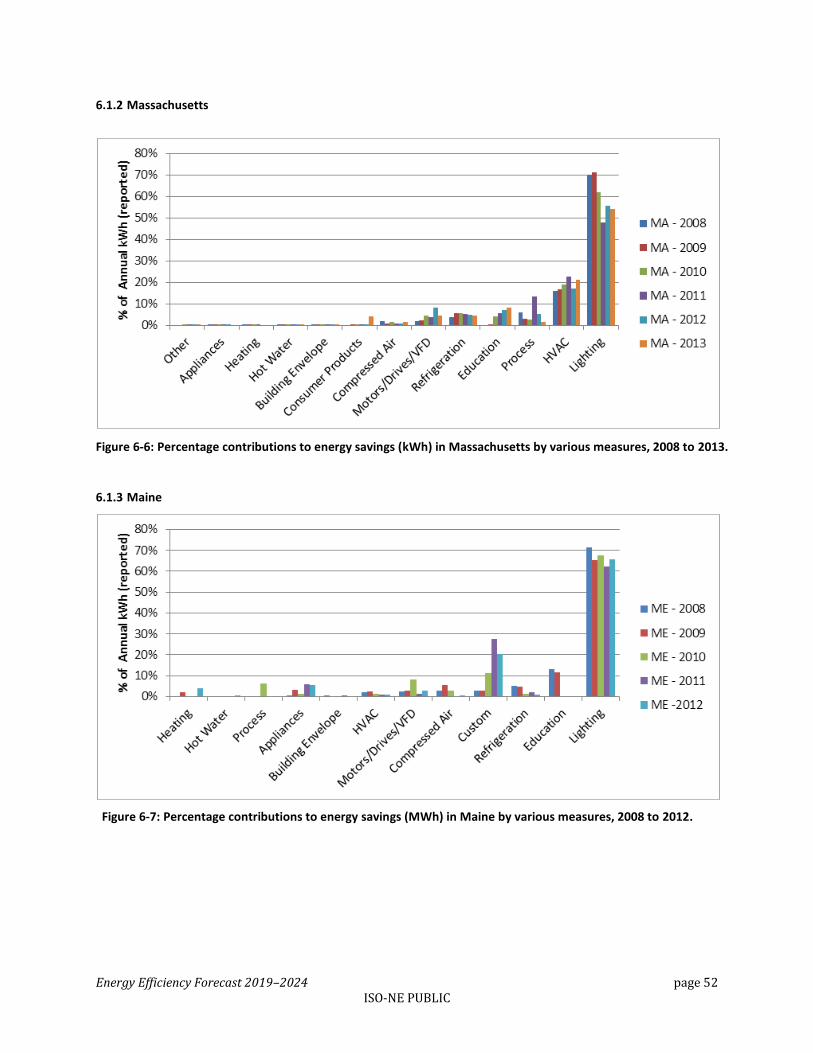
Energy Efficiency Forecast 2019–2024 page 52 ISO-NE PUBLIC
6.1.2 Massachusetts
Figure 6-6: Percentage contributions to energy savings (kWh) in Massachusetts by various measures, 2008 to 2013.
6.1.3 Maine
Figure 6-7: Percentage contributions to energy savings (MWh) in Maine by various measures, 2008 to 2012.
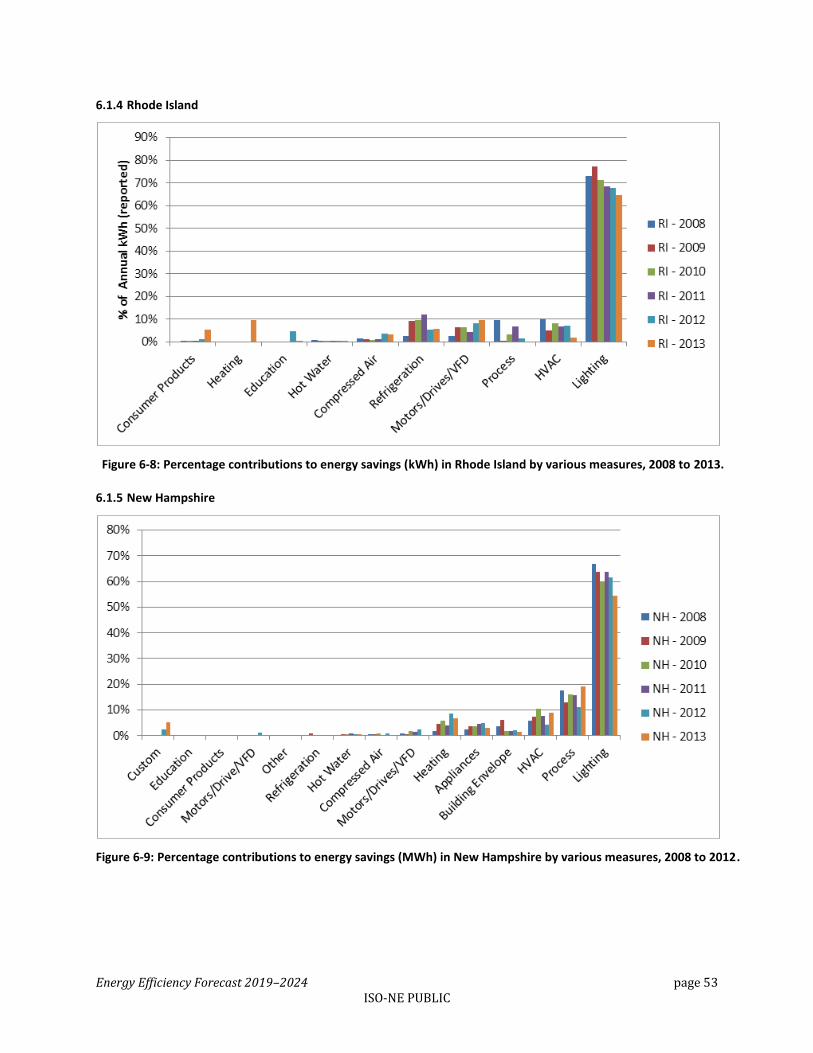
Energy Efficiency Forecast 2019–2024 page 53 ISO-NE PUBLIC
6.1.4 Rhode Island
Figure 6-8: Percentage contributions to energy savings (kWh) in Rhode Island by various measures, 2008 to 2013.
6.1.5 New Hampshire
Figure 6-9: Percentage contributions to energy savings (MWh) in New Hampshire by various measures, 2008 to 2012.
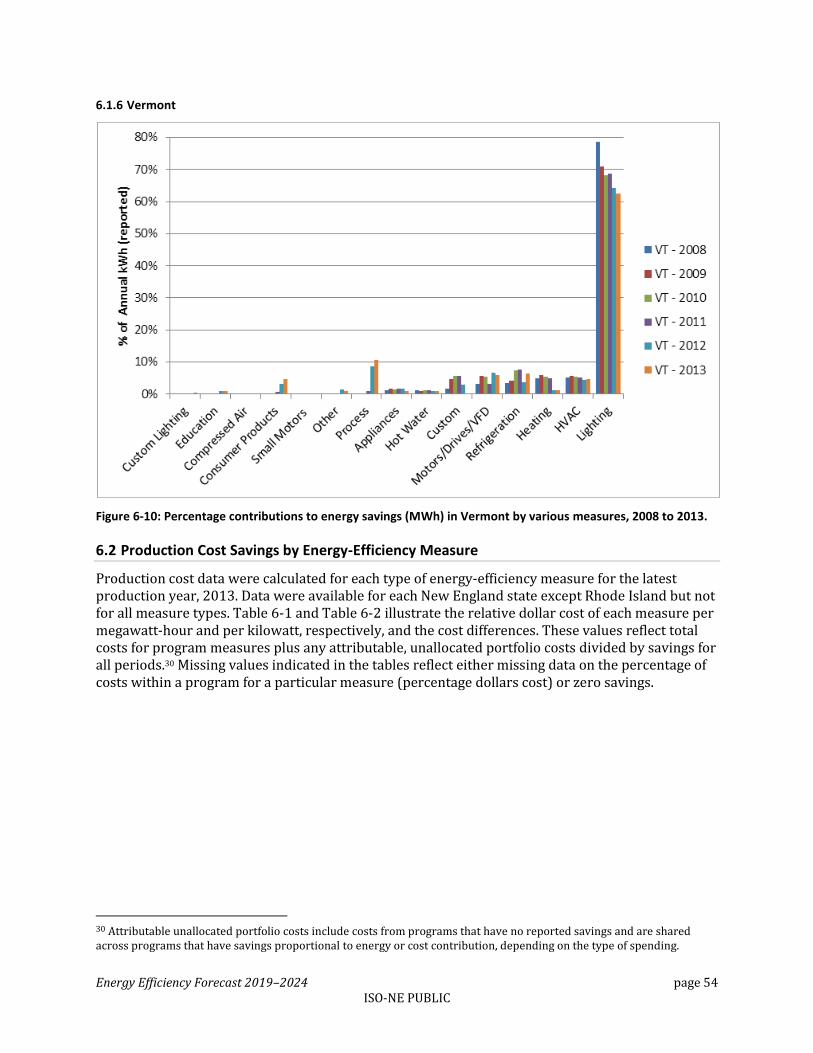
Energy Efficiency Forecast 2019–2024 page 54 ISO-NE PUBLIC
6.1.6 Vermont
Figure 6-10: Percentage contributions to energy savings (MWh) in Vermont by various measures, 2008 to 2013.
6.2 Production Cost Savings by Energy-Efficiency Measure
Production cost data were calculated for each type of energy-efficiency measure for the latest production year, 2013. Data were available for each New England state except Rhode Island but not for all measure types. Table 6-1 and Table 6-2 illustrate the relative dollar cost of each measure per megawatt-hour and per kilowatt, respectively, and the cost differences. These values reflect total costs for program measures plus any attributable, unallocated portfolio costs divided by savings for all periods.30 Missing values indicated in the tables reflect either missing data on the percentage of costs within a program for a particular measure (percentage dollars cost) or zero savings.
30 Attributable unallocated portfolio costs include costs from programs that have no reported savings and are shared across programs that have savings proportional to energy or cost contribution, depending on the type of spending.
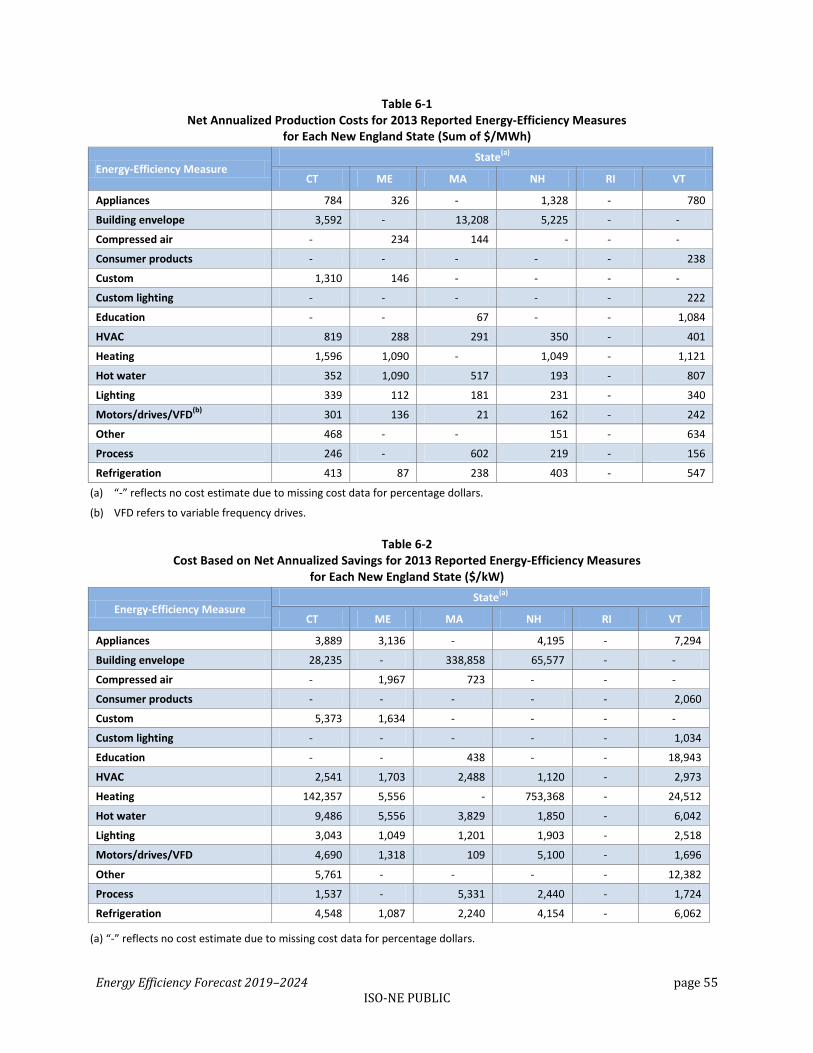
Energy Efficiency Forecast 2019–2024 page 55 ISO-NE PUBLIC
Table 6-1 Net Annualized Production Costs for 2013 Reported Energy-Efficiency Measures
for Each New England State (Sum of $/MWh)
Energy-Efficiency Measure State
(a)
CT ME MA NH RI VT
Appliances 784 326 - 1,328 - 780
Building envelope 3,592 - 13,208 5,225 - -
Compressed air - 234 144 - - -
Consumer products - - - - - 238
Custom 1,310 146 - - - -
Custom lighting - - - - - 222
Education - - 67 - - 1,084
HVAC 819 288 291 350 - 401
Heating 1,596 1,090 - 1,049 - 1,121
Hot water 352 1,090 517 193 - 807
Lighting 339 112 181 231 - 340
Motors/drives/VFD(b)
301 136 21 162 - 242
Other 468 - - 151 - 634
Process 246 - 602 219 - 156
Refrigeration 413 87 238 403 - 547
(a) “-” reflects no cost estimate due to missing cost data for percentage dollars.
(b) VFD refers to variable frequency drives.
Table 6-2 Cost Based on Net Annualized Savings for 2013 Reported Energy-Efficiency Measures
for Each New England State ($/kW)
Energy-Efficiency Measure State
(a)
CT ME MA NH RI VT
Appliances 3,889 3,136 - 4,195 - 7,294
Building envelope 28,235 - 338,858 65,577 - -
Compressed air - 1,967 723 - - -
Consumer products - - - - - 2,060
Custom 5,373 1,634 - - - -
Custom lighting - - - - - 1,034
Education - - 438 - - 18,943
HVAC 2,541 1,703 2,488 1,120 - 2,973
Heating 142,357 5,556 - 753,368 - 24,512
Hot water 9,486 5,556 3,829 1,850 - 6,042
Lighting 3,043 1,049 1,201 1,903 - 2,518
Motors/drives/VFD 4,690 1,318 109 5,100 - 1,696
Other 5,761 - - - - 12,382
Process 1,537 - 5,331 2,440 - 1,724
Refrigeration 4,548 1,087 2,240 4,154 - 6,062
(a) “-” reflects no cost estimate due to missing cost data for percentage dollars.
Energy Efficiency Forecast 2019–2024 page 56 ISO-NE PUBLIC
As shown in Table 6-1, the 2013 data available from the states, as represented in the 2015 forecast for 2019 to 2024, are not conclusive and do not illustrate any trends in the costs of energy-efficiency measures by state.31 Rather, they illustrate the relative magnitude of the production cost differences across the different types of measures within the programs and across the states. The states that had the most complete data sets—CT, NH, and VT—tended to have the highest overall costs.
The costs based on net annualized savings, as shown in Table 6-2, exhibit wide variation across the states. Some of the notable costs indicated in this table, including those with costs in excess of $100,000/MW, are more likely artifacts of singular projects with relatively low savings compared with the overall portfolio. Refer to Table 4-4 and Table 4-10 for state-level historical production costs and EE forecast production costs, respectively, to compare overall portfolio costs and savings by state.
The lack of a complete data set and the limited trends reflected in the data prevented the ISO from drawing any conclusions. A more complete data set would support the ISO’s making better comparisons and identifying trends in the measures used by the states compared with changes in cost over time.
31 The data for prior years, not presented in this report, showed that lighting measures tended to have lower production costs, while building envelope and heating measures had the highest production costs. The Initial Energy-Efficiency Forecast 2017–2023—Measure Data Analysis (February 11, 2014) is available at http://www.iso-ne.com/static-assets/documents/committees/comm_wkgrps/othr/enrgy_effncy_frcst/2014mtrls/iso_ne_prelim_2014_ee_measures_2017_2023_final_2_21_14.pdf.