Embed Size (px)
DESCRIPTION
Is There a Bubble in the Housing Market Excerpt
Citation preview
IS THERE A BUBBLE IN THE HOUSING MARKET?
BY
KARL E. CASE and ROBERT J. SHILLER
COWLES FOUNDATION PAPER NO. 1089
COWLES FOUNDATION FOR RESEARCH IN ECONOMICS YALE UNIVERSITY
Box 208281 New Haven, Connecticut 06520-8281
2004
http://cowles.econ.yale.edu/

314 Brookings Papers on Economic Activity, 2:2003
The 1988 Survey
In our 1988 paper we presented the results of a survey of a sample of 2,000 households who bought homes in May 1988 in four markets: Orange County, California (suburban Los Angeles); Alameda County, California (suburban San Francisco); Middlesex County, Massachusetts (suburban Boston); and Milwaukee County, Wisconsin.I3 The four loca- tions were chosen to represent hot (California), cooling (Boston), and steady (Milwaukee) markets. The survey was inspired in part by an article on page 1 of the June 1, 1988, Wall Street Journal, which described the current "frenzy in California's big single family home market" and included colorful stories of angst and activity in the housing market there.I4 We wanted to find out what was going on in California and com- pare it with other places in a systematic way.
The results of that survey provide strong evidence for some parame- ters of a theory that a housing bubble did exist in 1988: that buyers were influenced by an investment motive, that they had strong expectations about future price changes in their housing markets, and that they per- ceived little risk. Responses to a number of questions revealed that emo- tion and casual word of mouth played a significant role in home purchase decisions. In addition, there was no agreement among buyers about the causes of recent home price movements and no cogent analysis of the fundamentals.
One additional finding in our 1988 paper lends support to an important stylized fact about the U.S. housing market that has not been well docu- mented in the literature, namely, that home prices are sticky downward. That is, when excess supply occurs, prices do not immediately fall to clear the market. Rather, sellers have reservation prices below which they tend not to sell. This tendency not to accept price declines is connected with a belief that prices never do decline, and with some of the parameters of thinking that underlie a housing bubble.
13. Case and Shiller (1988). 14. A. Nomani, Sr., "Nesting Fever: Buyers' Panic Sweeps California's Big Market in
One-Family Homes," Wall Street Journal, June 1, 1988, p. 1.

Karl E. Case and Robert J. Shiller 315
Homebuyer Behavior in Four Metropolitan Areas, 1988 and 2003
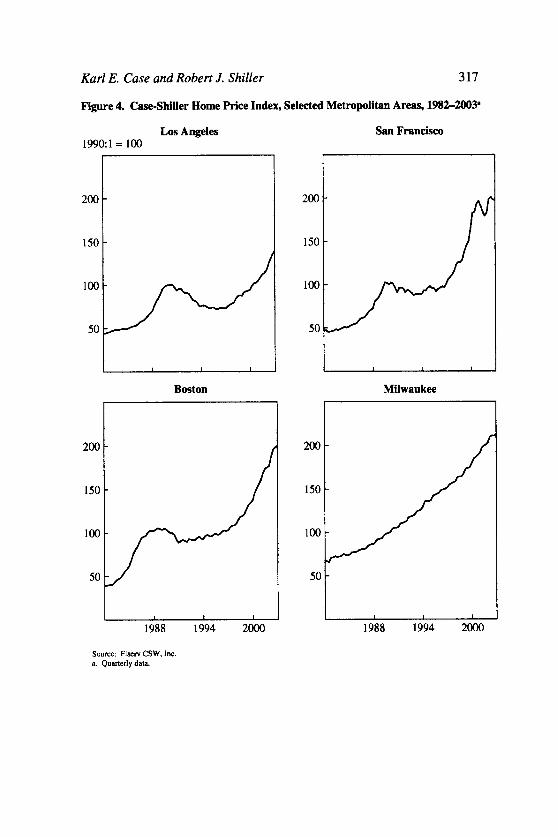
Before we present the results of a virtually identical survey done in 2003, we describe home price behavior in the four survey areas. Although the timing was not identical, Los Angeles, San Francisco, and Boston have experienced two boom cycles and a bust in housing prices over the last twenty years. Table 4 describes the timing and the extent of these cycles, which are also shown in nominal terms in figure 4.
The first boom in California was similar in Los Angeles and San Fran- cisco. Prices in both metropolitan areas peaked in the second quarter of 1990 after a 125 percent nominal (55 percent real) run-up, which began slowly, gradually accelerated into 1988, and then slowed as it approached the peak. The first boom in Boston was also similar, but it accelerated ear- lier and actually peaked in the third quarter of 1988 after a 143 percent nominal (more than 100 percent real) increase.
The bust that followed was most severe and longest lived in Los Ange- les, where prices dropped 29 percent in nominal terms (40 percent in real terms) from the peak to a trough in the first quarter of 1996. Prices in San Francisco dropped only 14 percent (20 percent real) from the 1990 peak and began rising again in the first quarter of 1993, three years earlier than in Los Angeles. Boston was on the mend two years earlier than that.
All three metropolitan areas have seen a prolonged boom ever since, although San Francisco has shown some volatility since mid-2002. Home prices during this boom rose 129 percent in nominal terms in San Fran- cisco, 94 percent in Los Angeles, and 126 percent in Boston, despite very low overall inflation. At the time participants in the second survey sample were buying their homes, prices were still rising in all four metropolitan areas.
The price index for Milwaukee could not be more different. It shows a very steady climb at a rate of 5.6 percent annually, essentially the same rate of growth as income per capita. Interestingly, over the entire cycle, Milwaukee did about as well as Los Angeles, but not as well as Boston or San Francisco. Home prices in Boston increased more than fivefold in nominal terms over the cycle, while prices in San Francisco quadrupled and prices in both Milwaukee and Los Angeles tripled.
Three of the four metropolitan areas-Los Angeles, San Francisco, and Boston-show pronounced cycles. These three might be called glamour

316 Brookings Papers on Economic Activity, 2:2003
Table 4. Change in Average Home Price in Survey Cities during Boom and Bust, 1982-2003" Percent Period Los Angeles Sun Francisco Boston Milwaukee
1982-peak Peak quarter
Peak to trough Trough quarter
Trough to peak Peak quarter
Whole period At annual rate
Source: Fiserv CSW Inc. repeat-sales indexes. a. Data cover the period 1982:l-2003:l. b. Home prices displayed no clear peak or trough during the penod
cities, in that they are the home of either international celebrities, or the entertainment industry, or world-class universities, or high-technology industries, and the prices of homes in these metropolitan areas are high as well as volatile.15
Table 5 looks at the latest boom cycle in a bit more detail. Using the state data described in the earlier section, the table makes two points. First, in all three states, home price increases outpaced income growth. (Note that the price increases are not as great as in the metropolitan area data because the indexes are for the entire state.) All three states had increases in their ratios of home price to annual income, but the changes were dramatically larger in the boom-and-bust states.
After peaking at nearly 10 percent in early 1995, the thirty-year fixed rate dropped below 7 percent by mid-1999. During 2000 rates spiked back to 8.5 percent but then fell steadily from mid-2000 until 2003, when they briefly went below 5 percent.
15. Differences in glamour across cities is a sensitive topic, but one that is nonetheless very real and ought to be taken note of here. Some of our respondents were very opinion- ated about these differences. One Milwaukee respondent wrote on the questionnaire: "I was laid off and forced to expand my job search nationwide. I did not want to leave Chicago and certainly did not want to relocate to Milwaukee, a second rate city with high unemploy- ment. . . . However, the upside is that the housing prices in Chicago are so much higher than Milwaukee County and I was able to sell my tiny Cape Cod for a beautiful 4 bedroom his- toric house on a prime residential street."
317 Karl E. Case and Robert J. Shiller
Figure 4. Case-Shiller Home Price Index, Selected Metropolitan Areas, 19822003"
Los Angeles San Francisco 1990:l = 100
Boston Milwaukee
Source: Fisew CSW. Inc. a. Quarterly data.

318 Brookings Papers on Economic Activity, 2:2003
Table 5. Home Prices, Personal Income, and Mortgage Payments, Selected States, 1995and2002 Current dollars except where stated otherwise Measure
Home prices 1995: 1 2002:3 Total change (percent) At annual rate (percent)
Personal income per capita 1995:l 2002:3 Total change (percent) At annual rate (percent)
California
24,044 33,362
+39 4.5
Massachusetts Wisconsin
Ratio of home price to income per capita 1995: 1 6.61 2002:3 8.29
Annual mortgage payment" 1995: 1 12,145 2002:3 15,908
Ratio of mortgage payment to income per capita 1995:l 0.5 1 2002:3 0.47
Sources: Bureau of Economic Analysis. Economy.com, Fannie Mae, U.S. Bureau of the Census data adjusted using CSW or blended repeat-sales indexes.
a Assumes thirty-year fixed rate mongage at 80 percent loan to value at annual interest rate of 8.8 percent (February 1995) or 6 0 percent (August 2002).
Table 5 also shows the effect of declining mortgage rates on the cash costs of buying a home. In 1995, at the beginning of the current run-up, the thirty-year fixed rate was 8.8 percent. It had fallen to 6 percent at the time the sample was drawn, keeping the monthly payment required to buy the median home from rising faster than income. The ratio of annual pay- ment to income per capita actually fell in California and Wisconsin and stayed constant in Massachusetts. This fact adds weight to the argument that fundamental factors have an important effect on current home prices.
Survey Method
A random sample of 500 home sales was drawn from each of the same four counties as in our 1988 survey, and so we can make comparisons

Karl E. Case and Robert J. Shiller 319
with these earlier results.We also used the very same questionnaire as in our 1988 survey, adding only several new questions at the end so that there was no change in the context of any questions. The accompanying letters were essentially similar to those of 1988.
Survey methods followed guidelines outlined elsewhere.16 Ordinary mail was used because we judged that the use of e-mail was still not wide- spread enough to produce a representative sample. The questionnaire was ten pages long and included questions on a number of topics. The focus was on the homebuyers' expectations, understandings of the market situ- ation, and behavior. The questionnaire encouraged respondents to "write comments anywhere on the questionnaire," and their comments were indeed helpful to us in interpreting the significance of the answers.
During the first survey, in 1988, two of the four markets were booming (the California counties), one market was at its peak and showing excess supply (Boston), and one was drifting (Milwaukee). This time three of the four markets were in remarkable booms, and Milwaukee again served as a control city, where no real boom was taking place.
The survey was sent to 2,000 persons who had bought homes between March and August 2002. These dates fall just before the peak in media usage of the term "housing bubble" in October 2002. Questionnaires with personalized letters to the respondents were mailed in January 2003, a reminder postcard was sent in February, and replacement questionnaires with personalized letters were again sent to those who had not responded in March. These dates were just after the peak in media use of the term "housing bubble." Thus we managed to get our questionnaire survey out at a time when attention to the possibility of a housing bubble must have been close to its maximum. Our respondents had the opportunity to par- ticipate in the real estate market at a time of intense public attention to the possibility of a bubble and had the opportunity to read and think about this experience for some months afterward. This is what we wanted to do, since our purpose is to gauge human behavior during a purported bubble.
Just under 700 questionnaires were returned completed and usable in the 2003 survey, for a somewhat lower response rate than in the 1988 sur- vey. Response rates for each county are given in table 6.
At the time of the 2003 survey, the economy was recovering from the recession that had ended in November 2001, but the recovery was slow,
16. Dillman (1978).

--
320 Brookings Papers on Economic Activity, 2:2003
Table 6. Survey Sample Sizes and Response Rates in 1988 and 2003 Returns Response rate
Sample size tabulated (percent)
Metropolitan area 1988 2003 1988 2003 1988 2003
Los Angeles 500 500 24 1 143 48.2 28.6 San Francisco 530 500 199 164 37.5 32.8 Boston 500 500 200 203 40.0 40.6 M~lwaukee 500 500 246 187 49.2 37.4
Total 2,030 2,000 886 697 43.9 34.9 Source Authors' survey descnbed In the text
and the National Bureau of Economic Research had not yet announced that the recession was over. In contrast, at the time of our 1988 survey, there had been no recession for several years. In addition, the Federal Reserve had reduced interest rates to historic lows at the time the buyers in our 2003 survey were signing purchase and sale agreements. In 1988, in contrast, interest rates were on the rise.
Table 7 describes the sample. A substantial majority of buyers were buying as a primary residence, and only a small minority were buying to rent. First-time buyers were a majority of the sample in Milwaukee. The lowest percentage of first-time buyers was in Los Angeles. We were sur- prised to see that, in the 2003 survey, more than 90 percent of the homes purchased in all four markets were single-family homes, a much larger share than in the 1988 survey. We have no explanation as yet for this.
Table 7. Characteristics of Respondents' Home Purchases Percent of responses except where stated otherwise
Sun Los Angeles Francisco Boston Milwaukee
Description 1988 2003 1988 2003 1988 2003 1988 2003
Single-family home 70.0 95.2 55.9 96.4 39.7 97.5 71.1 91.6 First-time purchase 35.8 31.7 36.2 46.0 51.5 41.6 56.9 53.1 Bought as primary 88.4 95.6 72.7 93.3 92.0 97.1 88.2 90.0
residence Bought to rent to others 3.7 2.8 12.1 3.0 3.0 0.9 4.1 5.3
Source: Authors' survey described in the text.

Karl E. Case and Robert J. Shiller 321
Survey Results
The results of the 2003 survey, presented in tables 8 through 14, shed light on a number of aspects of homebuying behavior-including invest-ment motivations and the expectation of further price rises, the amount of local excitement and discussion about real estate, the sense of urgency in buying a home, adherence to simplistic theories about housing markets, the occurrence of sales above asking prices, and perceptions of risk-that suggest the presence or absence of a bubble in home prices.
Housing as an Investment
A tendency to view housing as an investment is a defining characteris- tic of a housing bubble. Expectations of future appreciation of the home are a motive for buying that deflects consideration from how much one is paying for housing services. That is what a bubble is all about: buying for the future price increases rather than simply for the pleasure of occupying the home. And it is this motive that is thought to lend instability to bub- bles, a tendency to crash when the investment motive weakens.
Table 8 presents the responses to questions about housing as an invest- ment. For the vast majority of buyers, either investment was "a major consideration" or they at least "in part" thought of their purchase as an investment. In Milwaukee and San Francisco investment was a major consideration for a majority of buyers. This tendency to view housing as an investment is similar to what it was in the boom period that we observed in our 1988 survey, although somewhat weaker. Far fewer of the homebuyers in 2003 said that they were buying "strictly for investment purposes." Thus conditions reported in 2003 would appear to be consis- tent with a bubble story, although less so than they were in 1988.
The apparent attractiveness of housing as an investment is further enhanced if the buyer perceives that the investment entails only very little risk. As table 8 also shows, in all cities in both 1988 and 2003, only a small percentage of buyers thought that housing involved a great deal of risk, although the fraction seeing a great deal of risk rose (perhaps not sur- prisingly) to a fairly high level (14.8 percent) in San Francisco in 2003. In three of the four cities (Milwaukee being the exception), there was more perception of risk in 2003 than there had been in 1988, which is what one

- -
Brookings Papers on Economic Activity, 2:2003322
Table 8. Survey Responses on Housing as an Investment, 1988and2003 Percent of responses except where stated otherwise
Los Angeles Sun
Francisco Boston Milwaukee
Question 1988 2003 1988 2003 1988 2003 1988 2003
In deciding to buy your property, did you think of the purchase as an investment?
It was a major consideration
In part Not at all No. of responses
Why did you buy the home that you did?
Strictly for investment purposes
No. of responses
Buying a home in [city] today involves
A great deal of risk Some risk Little or no risk No. of responses
56.3 46.8 63.8
40.3 46.2 31.7 4.2 7.0 4.5
238 143 199
19.8 7.5 37.2
238 142 199
3.4 7.9 4.2 33.3 47.5 40.1 63.3 44.6 55.7 237 143 192
Source: Authors' survey described in the text.
would expect given all the media attention to bubbles in 2003. Even so, the perception of risk of price decline is small: one may say that home- buyers did not perceive themselves to be in a bubble.
Exaggerated Expectations, Excitement, and Word of Mouth
Table 9 gets to the meat of the housing bubble issue: the role of price expectations, the emotional charge, and the extent of talk about real estate. Expectations about the future price performance of homes were high in both 1988 and 2003. In both of these housing booms, roughly 90 percent or more of respondents expected an increase in home prices over the next several years, and the average expected increase over the

Karl E. Case and Robert J. Shiller 323
Table 9. Survey Responses on Price Expectations, Sense of Excitement, and Talk, 1988 and 2003 Percent of responses except where stated otherwise
Sun Las Angeles Francisco
Question 1988 2003 1988 2003
Do you think that housing prices in the [city] area will increase or decrease over the next several years?
Increase 98.3 89.7 99.0 90.5 Decrease 1.7 10.3 1.0 9.5 No. of responses 240 145 199 158
How much of a change do you expect there to be in the value of your home over the next 12 months?
Mean response 15.3 10.5 13.5 9.8 (percent)
Standard error 0.8 0.6 0.6 0.6 No. of responses 217 139 185 147
On average over the next 10 years, how much do you expect the value of your property to change each year?
Mean response 14.3 13.1 14.8 15.7 (percent)
Standard error 1.2 1.2 1.4 1.8 No. of responses 208 137 181 152
Which of the following best describes the trend in home prices in the [city] area since January 1988?
Rising rapidly 90.8 76.2 83.7 28.6 Rising slowly 8.8 22.4 12.8 51.0 Not changing 0.4 1.4 3.1 14.3 Falling slowly 0.0 0.0 0.5 6.2 Falling rapidly 0.0 0.0 0.0 0.0 No. of responses 239 143 196 161
It's a good time to buy because housing prices are likely to rise in the future.
Agree 93.2 77.0 95.0 82.1 Disagree 6.8 23.0 5.0 17.9 No. of responses 206 126 180 145
Housing prices are booming. Unless I buy now, I won't be able to afford a home later.
Agree 79.5 48.8 68.9 59.7 Disagree 20.5 51.2 31.1 40.3 No. of responses 200 124 167 134
Boston Milwaukee
1988 2003 1988 2003
90.2 9.8
194
7.4
0.6 176
8.7
0.6 177
3.0 34.3 37.4 22.2 3.0
198
77.8 22.2 171
40.8 59.2 169
(continued)

- -
324 Brookings Papers on Economic Activity, 2:2003
Table 9. Survey Responses on Price Expectations, Sense of Excitement, and Talk, 1988 and 2003 (continued) Percent of responses except where stated otherwise
San Los Angeles Francisco Boston Milwaukee
Question 1988 2003 1988 2003 1988 2003 1988 2003
There has been a good deal of excitement surrounding recent housing price changes. I sometimes think that I may have been influenced by it.
Yes 54.3 46.1 56.5 38.5 45.3 29.6 21.5 34.8 No 45.7 53.9 43.5 61.5 54.7 70.4 78.5 65.2 No. of responses 230 141 191 156 181 199 233 184
In conversations with friends and associates over the last few months, conditions in the housing market were discussed.. .
Frequently 52.9 32.9 49.7 37.4 30.3 31.0 20.0 27.6 Sometimes 38.2 50.3 39.0 43.6 55.1 53.7 50.2 40.5 Seldom 8.0 14.7 9.7 17.2 12.1 14.3 25.1 28.1 Never 0.8 2.1 1.5 1.8 2.5 1.0 4.7 3.8 No. of responses 238 143 195 163 198 203 235 185
Source: Authors' survey described in the text.
next twelve months was very high, even surpassing 9.8 percent in San Francisco in 2003.l 7
But it is the long-term (ten-year) expectations that are most striking. When asked what they thought would be the average rate of increase per year over the next ten years, respondents in Los Angeles gave an average reply of 13.1 percent (versus 14.3 percent in 1988); in San Francisco they were even more optimistic, at 15.7 percent (14.8 percent in 1988); in Boston the answer was 14.6 percent (8.7 percent in 1988); and in Mil- waukee it was 11.7 percent (7.3 percent in 1988). Note that even a rate of increase of only 11.7 percent a year means a tripling of value in ten years. Thus, although the one-year expectations in the glamour cities were lower
17. In 2003 the median expected twelve-month price increases were 10 percent for Los Angeles, 7 percent for San Francisco, 5 percent for Boston, and 5 percent for Milwaukee. The lower values for the medians than for the corresponding means reflect the fact that the high expectations for future price increase were especially concentrated among a relatively few respondents."

Karl E. Case and Robert J. Shiller 325
in 2003 than they had been in 1988, the ten-year expectations were even higher.I8
Fewer respondents in 2003 said that it was a good time to buy a home because prices may be rising in the future, but at least two-thirds agreed with the statement in all four cities. Many thought not only that now was a good time to buy, but also that there was a risk that delay might mean not being able to afford a home later.
The number who admitted to being influenced by "excitement" about home prices was still high, close to 50 percent in Los Angeles, but lower than in 1988.The amount of talk was nearly as high as in 1988,and talk is an important indicator of a bubble, since word-of-mouth transmission of the excitement is a hallmark.
We conclude that these general indicators of the defining characteris- tics of bubbles were fairly strong in 2003. However, they were generally less strong than in 1988 in the glamour cities and stronger than in 1988 in Milwaukee.
Simple (or Simplistic) Theories
Table 10 shows results on respondents' agreement with a number of simple, popular theories or stories about speculative price movements that might influence how their interpretation of recent events translated into bubble expectations. Our survey results indicate that these simplistic the- ories are quite a powerful force and, moreover, a bit different in the glam- our or bubble cities of Los Angeles, San Francisco, and Boston than in cities generally thought less exciting, like Milwaukee.
The most simplistic theory is one that we have often heard expressed in casual conversation: that desirable real estate just naturally appreciates rapidly. The theory expressed seems to confuse the level of prices with the rate of change. The most elementary economic theory would say that properties that people find most attractive will be highly priced, but not necessarily increasing more rapidly in price than other properties. We tried to gauge agreement with this theory by asking whether people agreed with the statement "Housing prices have boomed in [city] because
18. The median ten-year expectations were 8 percent in Los Angeles, 7 percent in San Francisco, 5 percent in Boston, and 5 percent in Milwaukee; once again the medians show less strikingly high expectations.

Table 10. Survey Responses on Homebuyers' Agreement with Simple Theories of Housing Prices, 1988 and 2003 Percent of responses except where stated otherwise
Los Angeles Sun Francisco Boston Milwaukee
Question 1988 2003 1988 2003 1988 2003 1988 2003
Housing prices have boomed in [city] because lots of people want to live here. Agree 98.6 Disagree 1.4 No. of responses 210
93.8 6.2 128
93.3 6.7 178
The real problem in [city] is that there is just not enough land available. Agree 52.8 Disagree 47.2 No. of responses 197
60.3 39.7 121
83.9 16.1 174
When there is simply not enough housing available, price becomes unimportant. Agree 34.0 31.9 Disagree 66.0 68.1 No. of responses 197 116
40.6 59.4 165
In a hot real estate market, sellers often get more than one offer on the day they list the property. Some are even over the asking price. There are also stories about people waiting in line to make offers. Which is the best explanation?
There is panic buying and price becomes irrelevant. 73.3 63.7 71.2 Asking prices have adjusted slowly or sluggishly to increasing
demand. 26.7 36.2 28.8 No. of responses 210 135 177
Which of the following better describes your theory about recent trends in home prices in [city]? It is a theory about the psychology of homebuyers and sellers. 11.9 10.8 16.7 It is a theory about economic or demographic conditions such as
population changes, changes in interest rates, or employment. 88.1 89.2 83.3 No. of responses 226 130 180
Source: Authors' survey described in the text.

Karl E. Case and Robert J. Shiller 327
lots of people want to live here." There was overwhelming agreement with this statement in all the glamour cities, but not in Milwaukee.
An even more outrageous fallacy that we detect in popular conversa- tion about home prices is that "When there is simply not enough housing available, price becomes unimportant." To our respondents' credit, most did not agree with this statement. But from 20 to 40 percent did agree, particularly in the glamour cities.
Another fallacy we think we have detected is in the interpretation of prices closing above asking prices. Homeowners sometimes seem to think that this phenomenon is a sign of a crazy boom that suspends the eco- nomic laws of supply and demand. Indeed, most homebuyers in the glam- our cities thought that at such a time "there is panic buying and price becomes irrelevant."
These results do not firmly prove that people are guilty of economic fallacies, because the questions admit of alternative interpretations, and people were probably not focusing clearly on their exact wording. How- ever, we do believe that the strong agreement with some of these state- ments is at least suggestive of such fallacies. We believe that there is a sort of knee-jerk reaction to stories about boom markets in real estate that does not accord with economic theory, but that does affect the prices people are willing to pay for their homes. We leave clearer proof that people adhere to such fallacies to further work. A closer study of such popular fallacies is difficult to carry out, for if we draw out the fallacy clearly enough to reveal their belief in it to our satisfaction, respondents may be educated out of the fallacy by the very questioning intended to reveal it.
All these theories about panic buying and the irrelevance of price do not, however, indicate that people generally believe that markets are driven by psychology. The results of the last question in table 10 show that people generally do not believe that markets are driven primarily by psychology, even in a booming real estate market. We interpret this as further confirming our general conclusion that most homeowners do not perceive themselves to be in a bubble even at the height of a bubble.
Popular Themes in Interpreting Recent Price Movements
We have documented that people talked a lot about the housing market both in 1988 and in 2003. What is it that they are likely to have talked

Brookings Papers on Economic Activity, 2:2003 328
about? We need to know the news stories that are on their mind if we are to understand the origins of the purported housing bubble.
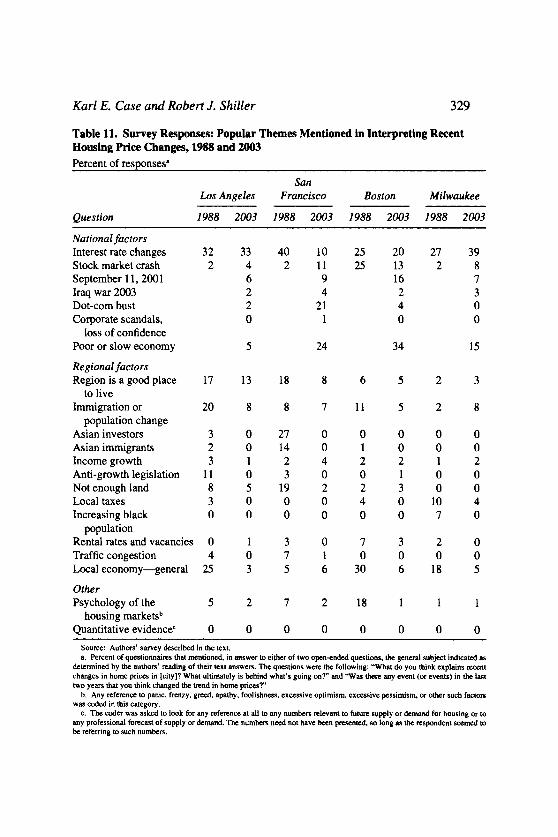
Table 11 shows some results from two open-ended questions that were put on the questionnaire, along with a space for the respondent to write in answers in his or her own words. Responses to these questions are espe- cially interesting because they elicit themes that are already on the minds of respondents, rather than putting words in their mouths.
One would perhaps not expect any one theme to dominate in answers to such questions, since people are so different and such broad questions allow so many different interpretations. But we do see what appears to be a dominating theme both in 1988 and in 2003, namely, interest rates. Clearly, interest rates have fallen substantially and have contributed to the run-up in prices since 1995, at least in the cities where, in our regressions, the interest rate variable was significant. Although, according to basic economic theory, interest rates should be more important in regions where the elasticity of supply of housing is relatively low or the likely growth of future demand relatively high, there is little evidence of this effect in state-by-state regressions.
Many of the answers to these questions are disappointing. Typically the answers read like random draws from the business section of the newspaper, or else the respondents refer to casual observations that one might make just driving around town. Respondents presented no quantita- tive evidence and made no reference to professional forecasts. One should not be surprised at this, however. After all, the single-family home market is a market of amateurs, generally with no economic training.
Once more we see evidence that in neither period did many homebuy- ers perceive themselves to be in a housing bubble. References to market psychology were quite rare.
Relation of Investment Demand in 2003 to the Stock Market Boom and Bust
The appearance of the real estate bubble right after the stock market drop has lent support to the notion that the two are somehow connected. One popular theory is that the stock market drop was followed by investor disgust with the stock market and a "flight to quality," as people sought safer investments in real assets like homes. There has been a lot of discussion about people shifting their assets toward housing because
Karl E. Case and Robert J. Shiller 329
Table 11. Survey Responses: Popular Themes Mentioned in Interpreting Recent Housing Price Changes, 1988 and 2003 Percent of responsesa
Sun Los Angeles Francisco Boston Milwaukee
Question 1988 2003 1988 2003 1988 2003 1988 2003
National factors Interest rate changes Stock market crash September 11,2001 Iraq war 2003 Dot-com bust Corporate scandals,
loss of confidence Poor or slow economy
Regional factors Region is a good place
to live Immigration or
population change Asian investors Asian immigrants Income growth Anti-growth legislation Not enough land Local taxes Increasing black
population Rental rates and vacancies Traffic congestion Local economy-general Other Psychology of the
housing marketsb Quantitative evidencec
~-~
Source: Authors' survey described in the text. a. Percent of questionnaires that mentioned, in answer lo either of two open-ended questions. the general subject indicated as
determined by the authors' reading of their text answers. The questions were the following: "What do you think explains recent changes in home prices in [city]? What ultimately is behind what's going on?" and "Was there any event (or events) in the last two years that you think chaneed the trend in home orices?"
b. Any reference to panic, frenzy, greed, apathy, foolishness, excessive optimism excessive pessimism, or other such factors was coded in this category.
c. The coder was asked to look for any reference at all lo any numbers relevant to future supply or demand for housing or to any profess~onal forecast of supply or demand. The numbers need not have been presented, so long as the respondent seemed to be referring to such numbers.

330 Brookings Papers on Economic Activity, 2:2003
the stock market has performed so poorly since 2000. On the other hand, a falling stock market could have a negative wealth effect on home buy- ing decisions.19
Table 12 presents the responses to three questions that we did not ask in 1988but were added at the end of the questionnaire in 2003. Recall that the survey was virtually finished before the stock market rally (25 percent on the S&P500) of March 11-July 8, 2003, and that the respondents had purchased their homes several months before.
The answers to the last question in table 12, about whether the experi- ence with the stock market encouraged purchase of a home, show that for the vast majority of people in all four counties the performance of the stock market "had no effect on my decision to buy my house." However, one should not discard the notion that the stock market's behavior was at least partly responsible for the boom in the real estate market. Judging from their additional comments, it appears that some of the majority who said the stock market had no effect on the decision to buy a home said so only because they would have bought some home in any event, even if perhaps a smaller home. More significantly, many other respondents (roughly between a quarter and a third) said that the stock market's per- formance "encouraged" them to buy a home, whereas only a small per- centage found it discouraging.
Immediately after this question we included an open-ended question, "Please explain your thinking here," followed by an open space. Although most left this space blank, the answers we did get were all over the map, as respondents apparently viewed the question as an opportunity to vent on any subject.
Some of the answers from those who said they were encouraged by the stock market did refer to the drop in the stock market after 2000 as a rea- son to buy a home now. Quoting a few of their answers verbatim will illustrate: "Housing costs continue to increase. Value of home investment to increase. Stock market not so promising." "Could be better investment than stock market." "I lost $400,000 in my pension and personal stock portfolio-at least buying this big beautiful home I know it's a hard asset that would hold its value & appreciate while it gives me great enjoyment." "Money that we had saved for a house was starting to become a loss in the market." "I have only made money in real estate and lost a lot in the stock
19. See Case, Quigley, and Shiller (2001).

Karl E. Case and Robert J. Shiller
Table 12. Survey Responses on Real Estate versus Stock Market Investment, 2003 Percent of responses except where stated otherwise
San Question Los Angeles Francisco Boston Milwaukee
Do you agree with the following statement: "Real estate is the best investment for long-term holders, who can just buy and hold through the ups and downs of the market"?
Strongly agree 53.7 Somewhat agree 33.1 Neutral 10.3 Somewhat disagree 2.7 Strongly disagree 0.0 No. of responses 145
Do you agree with the following statement: "The stock market is the best investment for long-term holders, who can just buy and hold through the ups and downs of the market"?
Strongly agree 8.2 Somewhat agree 32.4 Neutral 32.4 Somewhat disagree 20.0 Strongly disagree 6.8 No. of responses 145
The experience with the stock market in the past few years.. .
Much encouraged me to buy my 13.9 house
Somewhat encouraged me to buy 11.1 my house
Had no effect on my decision to 74.1 buy my house
Somewhat discouraged me from 0.0 buying my house
Much discouraged me from buying 0.6 my house
No. of responses 143 Source: Authors' survey described in the text.
market." "The stock market at my age is not helping me. Short-term real estate is the strongest investment you can make short or long term." "Stock market went down. House market is still going up." "Renting is not cheap, stock is declining, this implies our total assets is [sic] not going anywhere." "The value of my condo had increased significantly compared to the gains to my portfolio. With interest rates low a new home seemed
332 Brookings Papers on Economic Activity, 2:2003
more likely to increase than a comparable investment in the stock market and brings tax & quality of life benefits."
Some respondents referred to the increased volatility or other uncer- tainty in the stock market since 2000, rather than its changed level, as a reason to shift their portfolio: "It seemed that shifting some of our net worth to cash and homeownership was a wise move in the face of the mar- ket volatility in 2000-2002." "I'm buying the house for the long term. The house will probably depreciate in the next couple years, but it will certainly appreciate over 10+ years. This is because it is a good house in a good community. This is information that I am confident of. In contrast, there is no confidence that I have full (or even good) information about the stock market (or that even my mutual fund managers have good infor- mation about the companies they invest in). So, I buy the house." "A house seems like a more solid investment than stocks. Less volatile."
Although this evidence is far from proof of a connection between the stock market and the housing market, we interpret it as confirming the notion that people got fed up with the stock market after the decline and high volatility following the 2000 peak and became more positive about real estate.
Excess Demand and Upward Rigidity in Asking Prices
In the boom cities, newspaper articles feature stories of homes that sold well above the asking price. We have already noted that it was an article in the Wall Street Journal referring to "frenzy in California's big single family home market" that inspired our original survey. In fact, such frenzy seems to be a fairly common occurrence in boom cities. As table 13 shows, quite a large number of people reported selling above the asking price in both the 1988 and 2003 surveys. An amazing 45 percent of respondents in San Francisco in the 2003 survey reported selling at above the asking price in 2002, well after the sharp decline in employment fol- lowing the NASDAQ collapse, which began in 2000. Sellers in Los Angeles reported that about 20 percent of properties sold for more than the asking price, as did a slightly smaller share in Milwaukee, which had no boom.
Many of those who sold felt that if they had charged 5 or 10 percent more, the property would have sold just as quickly. This was the sense of