Embed Size (px)
Citation preview
25
Is Long-Horizon Abnormal Performance after Seasoned Equity Offerings
Illusory? New Evidence from the UK *
by
Abhay Abhyankar Warwick Business School, University of Warwick,
Coventry, CV4 7AL, UK
Tel: +44-2476-522842
Fax: +44-2476-523779
Email: [email protected]
Keng-Yu Ho Doctoral Programme,
Warwick Business School, University of Warwick,
Coventry, CV4 7AL, UK
Tel: +44-2476-524691
Fax: +44-2476-524650
Email: [email protected]
This Draft: 25 July 2001
* We would like to thank Soha Maad for assistance with obtaining the data.

26
Is Long-Horizon Abnormal Performance after Seasoned Equity Offerings
Illusory? New Evidence from the UK
Abstract
We study the long-horizon abnormal performance of a large sample of UK firms following rights issues
and placings over the period 1989-1997. We make the following contributions relative to prior research.
First, we extend the existing literature on long-horizon performance after seasoned equity offerings to
rights issues by exploiting the institutional framework in the UK that explicitly favors rights issues
compared to other national markets. Second, we study the long-run performance after both rights issues
and placings complementing Slovin, Sushka and Lai (2000) who focus on announcement day wealth
effects. We find that long-run performance after rights issues and placings is sensitive to the methodology
and benchmarks used. We find that in contrast to the announcement day effects, neither category of issue
shows on average negative abnormal performance after the seasoned equity offerings using a
calendar-time approach.
Keywords: Rights Issues, Placings, Long-Run Performance, Market Efficiency.
JEL Classification: G00, G14, G30
27
1. Introduction
There is mounting evidence of long-horizon security price under-performance following corporate events
like initial public offerings (IPOs) and seasoned equity offerings (SEOs). Using US data, Spiess and
Affeck-Graves (1995), Loughran and Ritter (1995), Brav, Geczy and Gompers (2000), Eckbo, Masulis
and Norli (2000), Jegadeesh (2000) and Mitchell and Stafford (2000) all find poor stock market
performance 3-5 years after a SEO. Cai and Loughran (1998) and Kang, Kim and Stulz (1999) also find
evidence of post-SEO underperformance using Japanese data. Similar long-horizon underperformance of
SEOs is also reported for UK firms by Levis (1995) and Suzuki (2000). This evidence of systematic and
predictable post-event underperformance violates market efficiency.
Fama (1998), addressing the anomalous findings of long-horizon event studies, highlights two main issues
relating to their methodology used. The first is that models commonly used to estimate expected returns
are incomplete descriptions of the systematic patterns of average returns. The second relates to the
methodology used in these studies to measure long-horizon returns which results in the introduction of a
number of biases. Several authors, for example Lyon, Barber and Tsai (1999) and Mitchell and Stafford
(2000), suggest ways in which these statistical biases could be mitigated. Fama (1998) concludes however
that evidence of abnormal performance in long-horizon event studies is not a robust stylized fact and these
anomalies may fade away if appropriate corrections for risk are used.
Our study contributes to the literature, on long-horizon stock price performance of firms after seasoned
equity offerings, in two ways. As far as we are aware, we are the first to consider different categories of
seasoned equity offerings in the UK market. We exploit the UK institutional framework which, unlike the
US, favors rights issues to study both rights issues and placings. Our extension complements the work of
Slovin, Sushka and Lai (2000) who focus on announcement day effects of UK SEOs. Second, we apply a
range of metrics to measure long-horizon performance and find, as in previous research, that abnormal
performance is very sensitive to the methodology used. For example, using matched size/industry and
book-to-market/industry benchmarks, firms making rights issues and placings have negative post-event
abnormal performance on a three-year period. However, using a calendar-time portfolio approach and the
Fama-French 3-factor model to measure average abnormal return, we find that post-event abnormal
performance disappears.
The paper is organized as follows. Section 2 provides a detail description of the institutional features of the
UK market. Next, in Section 3 we briefly review the prior literature. Section 4 describes the data and
methodology used. The empirical results are discussed in Section 5 and Section 6 concludes.

28
2. Institutional Background
Rights issues are commonly used by companies listed in the London Stock Exchange (LSE) to issue new
equity. A rights issue is defined as “an offer to existing shareholders of securities to subscribe or purchase
further securities in proportion to their holdings”. It is designed to protect the existing shareholders’
wealth from being diluted by seasoned equity issuance. The regulatory and institutional environment in
the UK favors rights issues and makes them more common than in the US (see, for example, Hansen
(1988)). Specifically, rights issues have a legal basis in the UK Company Act, 19851 and the Listing Rules
of the London Stock Exchange2 also provide for similar provisions. Over the period of 1989 to 1997,
about 52% of total amount of equity raised by UK firms were through rights issues (about £50,593 million
out of a total of £98,210 million)3. Thus, the UK stock market provides a unique opportunity to study
rights issues. The sequence of activities followed by UK firms to raise capital through rights issues is
described in Appendix A.
There are two other methods for issuing seasoned equity in the UK: open offers and placings. An open
offer is an invitation to existing shareholders to subscribe or purchase securities in proportion to their
holdings. The difference between an open offer and a rights issue is that an open offer is not done by
means of a renounceable letter or other negotiable documents. Therefore, existing shareholders cannot
trade the right. The London Stock Exchange requires that the discount of the offer price in an open offer
not exceed 10% and the offer period should be no less than 15 business days. In general, an open offer
meets the pre-emption requirements in section 89 of the UK Company Act, 1985.
In the case of seasoned equity offerings through a placing, the placed shares are offered to new
shareholders on a non-pro rata basis. However, to avoid violation of pre-emption requirements in this case,
an Extraordinary General Meeting needs to be called to have a special resolution approved by more than
75% of shareholders. An exception to the above rule is when the proceeds of a placing amount to less than
5% of the outstanding shares of the issuer. In this case, the company can make a placing as long as the
issue amount is within the authorized capital. In addition, similar guidelines, which are not legal
1 The legal basis for rights issues is provided in the European Community’s (EU) Second Council Directive on Company Law of 1976 (see Article 29) and the UK Company Act, 1985 (see Section 89, 90, 95). The provisions of the UK Company Act, 1985 requires the offers of shares to shareholders must be on a pre-emptive basis. 2 The LSE Listing Rules Clause 9.18 states: “Unless shareholders otherwise permit, a company proposing to issue equity securities for cash must first offer those securities to existing shareholders and to holders of other equity securities of the company who are entitled to be offered them in proportion to their existing holdings. Only to the extent that the securities are not taken up by such persons under the offer may they then be issued for cash to others or otherwise than in proportion mentioned above.” See The listing Rules, 2000 for details. 3 The data is obtained from Underwriting Services for Share Offers: A Report on the Supply in the UK of Underwriting Services

29
requirements, have been issued by the Association of British Insurers and the National Association of
Pension Funds for placings 4. These stipulate that the placings should be limited to 5 % of the existing
capital in any one year and 7.5 % in any three years. As a consequence of these rules and guidelines, it is
common for UK firms to combine a placing with an open offer. In this case, seasoned equities are first
offered to existing shareholders on a pre-emptive basis and the “rump” is then being placed to new
shareholders. This is called “a placing with clawback”.
3. Review of Prior Research
The long-horizon performance of firms after seasoned equity offerings has been the subject of much
research. This research, summarized in Table 1, finds negative average abnormal returns in the three to
five years after a seasoned equity offering. The period prior to the issue of the SEO, on the other hand, is
marked by positive returns to investors5. Most empirical studies compute abnormal performance in two
ways. First, they compare buy-and-hold returns (BHRs) of the event firm relative to a benchmark. The
second method is to compute calendar-time abnormal returns using a suitable asset pricing model such as
the Fama-French 3-factor model.
Using the first approach, Spiess and Affleck-Graves (1995), for example, find an average annualized
BHAR of -6.1% five years after the SEOs using a sample of 1,247 SEOs over the 1975-1989 period.
Loughran and Ritter (1995) show an annualized BHAR of –9.1% using 3,702 SEOs over the period of
1970-1990. Brav, Geczy and Gompers (2000) use size, book-to-market and momentum portfolios as
benchmarks. Using a sample of 3,775 SEOs from 1975 to 1992, they find average annualized 5-year
BHARs are -3.9% for equal-weighted portfolio and -3.4% for a value-weighted portfolio. Eckbo, Masulis
and Norli (2000), using a sample of 3,315 SEOs from 1964 to 1995, find that annualized equal-weighted
BHAR is -4.8% and –2.2% for the value-weighted case. Jegadeesh (2000) reports an annualized BHAR
of –4.9% using a sample of 2,992 firms over the 1970-1993 period. Finally, Mitchell and Stafford (2000)
use a sample of 4,439 SEOs from 1961-1993 and find the annualized equal-weighted and value-weighted
BHARs are –2.7% and –1.1% respectively.
Starting from Loughran and Ritter (1995), the calendar-time portfolio approach has become a commonly
used method to measure long-horizon abnormal performance. Based on Fama-French 3-factor model,
Loughran and Ritter (2000) report an average monthly abnormal return of –0.47% (-5.64% annually)
for Share Offers, 1999. 4 See Underwriting Services for Share Offers: A Report on the Supply in the UK of Underwriting Services for Share Offers, 1999 for details. 5 Loughran and Ritter (1995) report an average return in the year prior to SEO issue of 72%.

30
and –0.32% (-3.84% annually) for equal weighted and value weighted portfolios. Further, Brav, Geczy
and Gompers (2000) find an average monthly abnormal return is –0.37% (-4.44% annually) for an
equal-weighted portfolio and –0.14% (-1.68% annually) for a value-weighted portfolio. Eckbo, Masulis
and Norli (2000) also find that, using NYSE/Amex firms, the monthly abnormal performance is –0.12%
(-1.44% annually) for equal-weighted portfolio and –0.17% (-2.04% annually) for the value-weighted
case. They use Fama-French 3-factor model with both unconditional factors and conditional factors.
Jagadeesh (2000) finds that the monthly abnormal return is –0.45% (-5.40% annually) for SEO firms.
Finally, Mitchell and Stafford (2000) find a –0.33% (-3.96% annually) equal-weighted abnormal return
and a –0.03% (-0.36% annually) value-weighted abnormal return per month in the three years after the
SEO.
Marsh (1979) is the first study of rights issues in the UK market. He uses data from 1962-1975 and finds
that he cannot reject the hypothesis that the UK market is efficient with respect to rights issue
announcements6. Levis (1995) is perhaps the first to study long-term abnormal performance using UK
data. His sample consists of 713 initial public offerings (IPO) firms and the subsequent rights issues by the
same firms within 5 years of the IPOs over the 1980-1988 period. He uses firms from both the main and
unlisted securities markets (USM)7 of the London Stock Exchange and the Financial Times Actuaries
(FTA) index, the Hoare Govett Smaller Companies (HGSC) index8 and size-controlled portfolios 9 as
benchmarks. He finds that firms having seasoned equity offerings after the IPOs show positive average
abnormal returns in the 12 months prior to the announcement of rights issues and negative abnormal
returns in the 18 months period after the announcement. The main focus of his paper however is the
relation between IPO underpricing and subsequent rights issues.
Slovin, Sushka and Lai (2000) study wealth effects around the announcement of rights issues and placings
by UK firms over the 1986-1994 period. Their sample has 200 insured rights issues, 20 uninsured rights
issues 10 and 76 placings11. They find an average 2-day excess return of -2.9% around announcement for
insured rights issues and –5% for uninsured rights issues. In contrast, they find a positive average excess
6 Marsh (1980) and its follow-up Marsh (1994) focus on the role of underwriters and their excess profit and are not directly related to our study. 7 This market was set up in 1980 mainly for smaller companies. It is a step stone for small companies to be listed in the main market of LSE. In the early 1990s, there were mo re than 400 companies dealt in USM. However, the number of listed firm fell to 275 on 1993. This market has only met limited success and was closed in the end of 1996. Its function is replaced by Alternative Investment Market (AIM) opened in 1995. 8 HGSC index is a value-weighted index consisting the lowest 10% by capitalisation of the main and USM markets of the LSE. There are about 1600 firms in the index. 9 The control portfolios are constructed by all firms in the same size decile of each sample firm. The size deciles are formed on the basis of market value of equity in the end of previous calendar year. 10 For insured rights issues, the underwriters guarantee to purchase any unsubscribed shares at the expiration data, while uninsured underwriters do not.

31
return of 3.3% for placings. They also use a sample of SEOs from 1982-1985, a period when rights issues
were effectively the only flotation method, as an out-of-sample test. They find that after the deregulation
of flotation methods in 1985, the decision of avoiding rights issues together with going through a placing
is taken as a positive signal by the market. They conclude therefore that placings can be used as an
alternative method by high quality UK firms seeking other financing methods.
Suzuki (2000) also studies price reaction during the announcement period for the UK SEOs and relates
this to the use of proceeds and flotation methods. He uses a sample of 826 SEOs from 1991-1996 and finds
that right issues have significant negative abnormal returns while open offers have positive abnormal
returns during the announcement period. His evidence is consistent with Slovin, Sushka and Lai (2000).
Though long-horizon performance is not the main focus of his study, he reports a significant negative
average abnormal return of -15%, during the two years following a rights issue.
4. Data and Methodology
4.1 Data
We use data on seasoned equity offerings made by UK firms from 1989 to 1997. The details of the
offerings are taken from Extel Takeovers, Offers and New Issues. The following criteria are used in
selecting our final sample:
(1) Seasoned equity offerings have to be common equities issues offered in Pound Sterling.
(2) Issuing firms are non-financial12 and non-utility13 firms 14.
(3) Issuing firms are listed on the London Stock Exchange but not on the Third Market15 (3rd), the Unlisted
Securities Market16 (USM) or the Alternative Investment Market (AIM) 17.
(4) Stock price/return data for issuers is available on the London Share Price Database (LSPD).
(5) Market capitalization and accounting data for issuers is available on the LSPD and the Worldscope
databases.
11 A placing is not a private placement, but it is a method of public security issuance comparable to a firm commitment offering in the US. 12 Financial firms include banks, insurance companies, investment companies, investment trusts and property firms. 13 Utility firms include electricity, gas distribution, telecommunication and water industries. 14 This criterion follows the convention of empirical finance study. The industrial groups of the issuing firms are checked from LSPD and then double-checked with the Worldscope Database. 15 The 3rd market was closed in the end of 1990. 16 USM was set up in 1980 and was closed in the end of 1996. 17 AIM was set up in 1995 to replace the role of USM.

32
We provide, in Table 2, details of our sample of SEOs selected on the above criteria. The sample consists
of 670 rights issues and 392 placings. Our data differs from Levis (1995), who is the first to study long-run
performance after SEOs by UK firms, in two ways. First, we use firms listed on the main market of the
London Stock Exchange while Levis (1995) uses firms from both the main market and unlisted securities
market. Second, Levis (1995) considers seasoned offerings by firms that form part of his initial IPO
sample and importantly he does not distinguish between rights issues and placings.
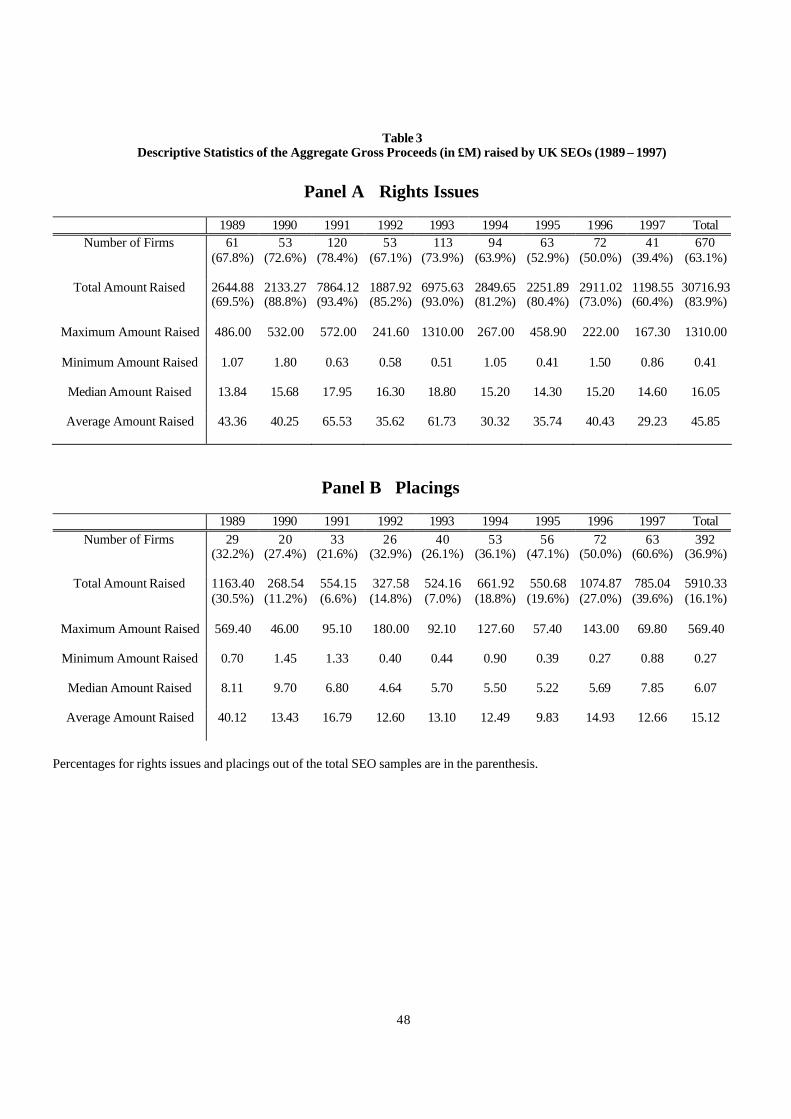
Next, Table 3 provides details of the amount of proceeds raised by UK SEOs in our sample for rights
issues and placings. We find that the rights issues dominate the UK equity issue market. For example, of
the total amount of £36,627 million raised from 1989 to 1997, £30,717 million (84%) was through rights
issues, while £5,910 million (16%) was through placings. The average amount per rights issues is £46
million and £15 million for placings. It is therefore clear from this that rights issues are the most popular
method of seasoned equity issue in the UK. It should also be noted that the average size of each rights
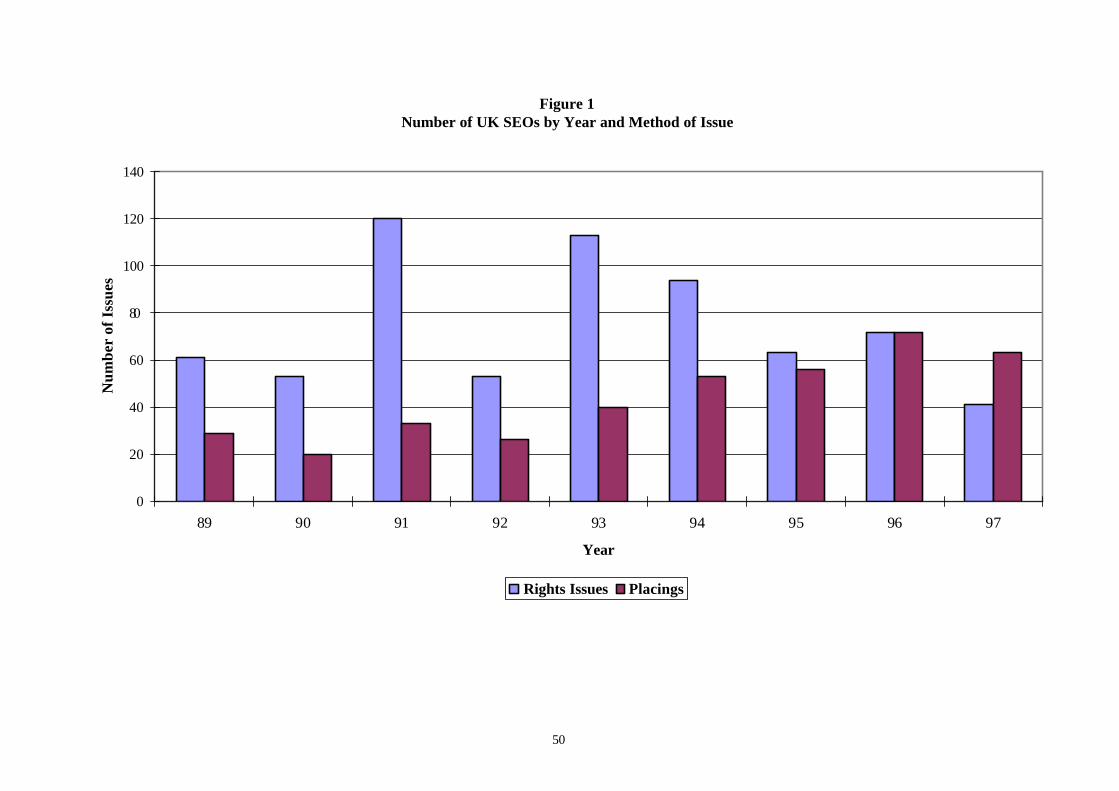
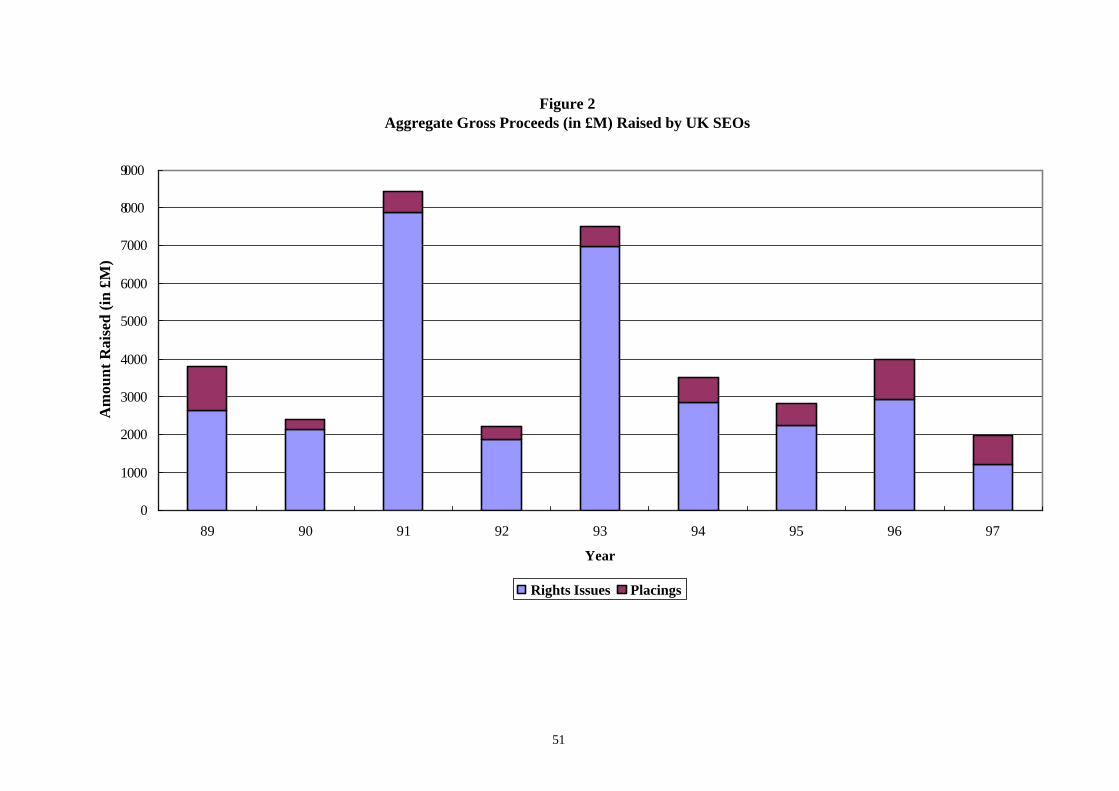
issue is larger than a typical placing. Figure 1, depicts the relative number of issues between the two SEOs
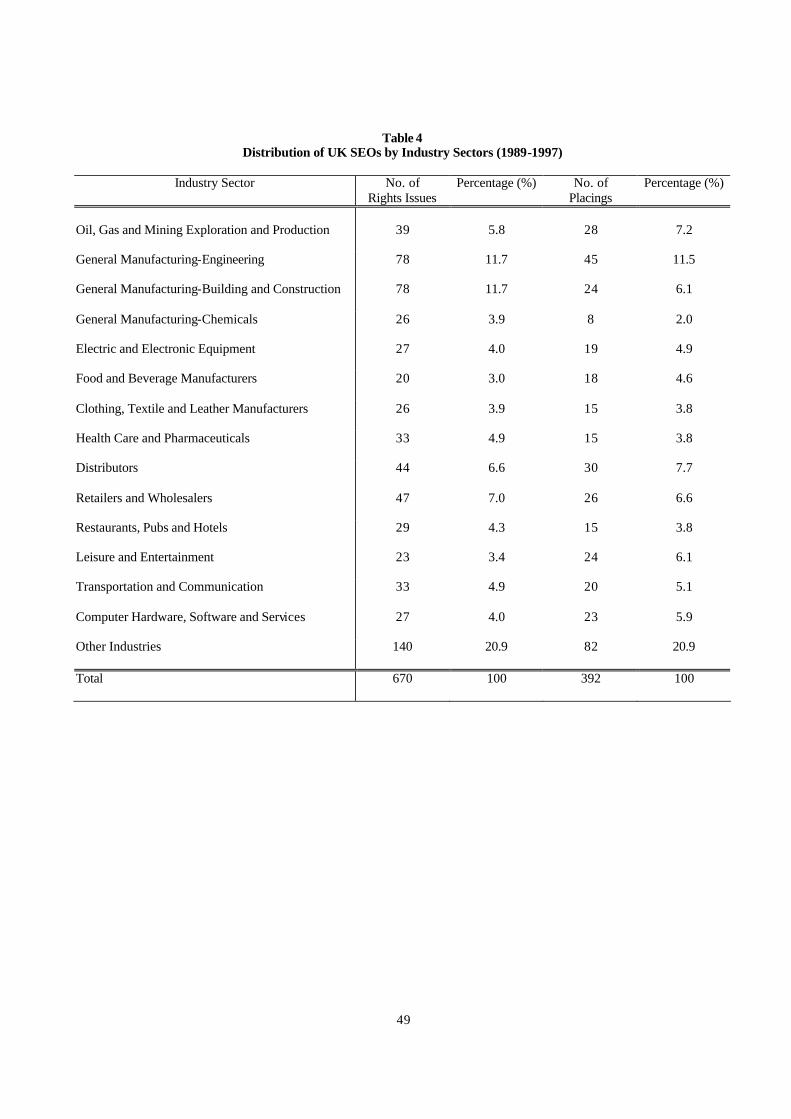
categories, while Figure 2 compares the amount raised between the two methods. We indicate in Table 4
the industry distribution of the UK SEOs samples used in our study. Although our data spans a wide range
of industries, we can still find evidence of clustering. For both rights issues and placings, more than 50%
of the sample firms belong to seven industry groups. In order to address this issue, we control industry for
the matching firm approaches in our empirical analysis.
4.2 Methodology
There are three main methods to measure long-horizon abnormal returns. The first is buy-and-hold
abnormal returns (BHARs) that compute the difference between the compounded return of the event firm
and that of the benchmark over a period of say 3-5 years after the event. Next are cumulative abnormal
returns (CARs) that simply add up the returns of the event firm and their benchmark and compute their
difference as in a traditional event study. The third is a calendar-time abnormal return (see Jaffe (1974) and
Mandelker (1974)) which measures abnormal returns relative to expected returns from an asset pricing
model. We now provide details of how we apply these methods to our data.
4.2.1 Buy and Hold Abnormal Return (BHAR)
We use the BHAR methodology to measure the pre- and post-event abnormal performance for the i’th firm
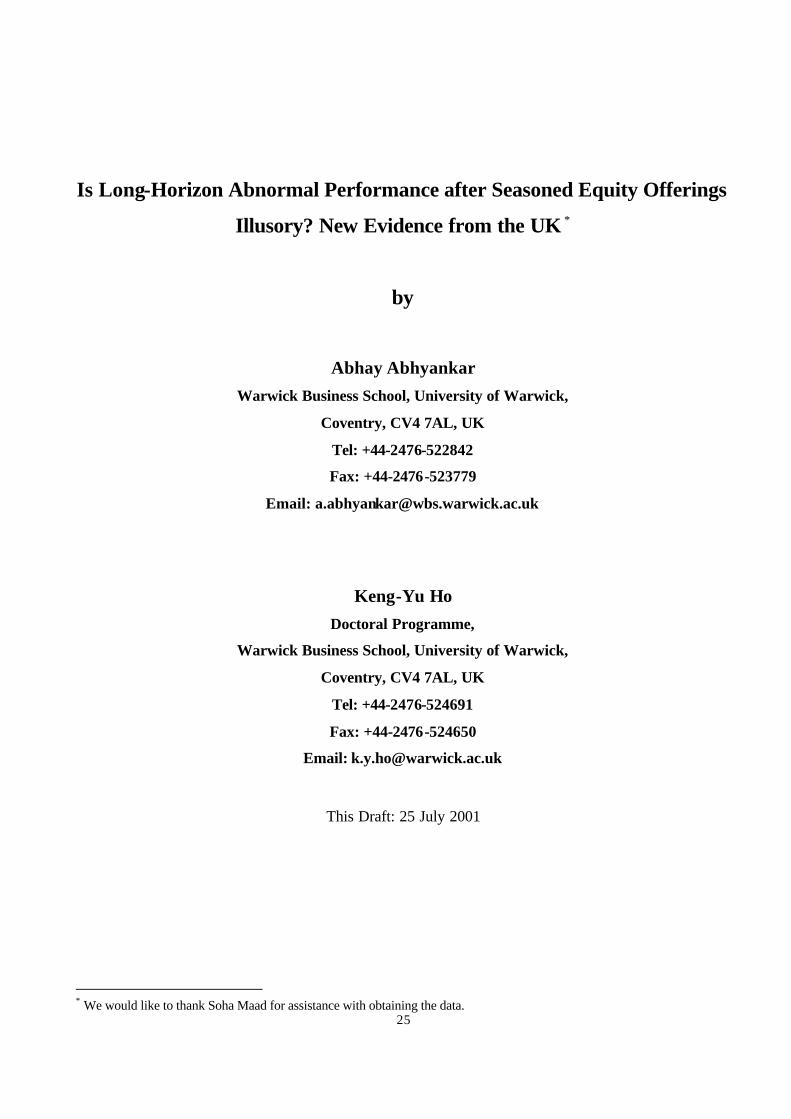
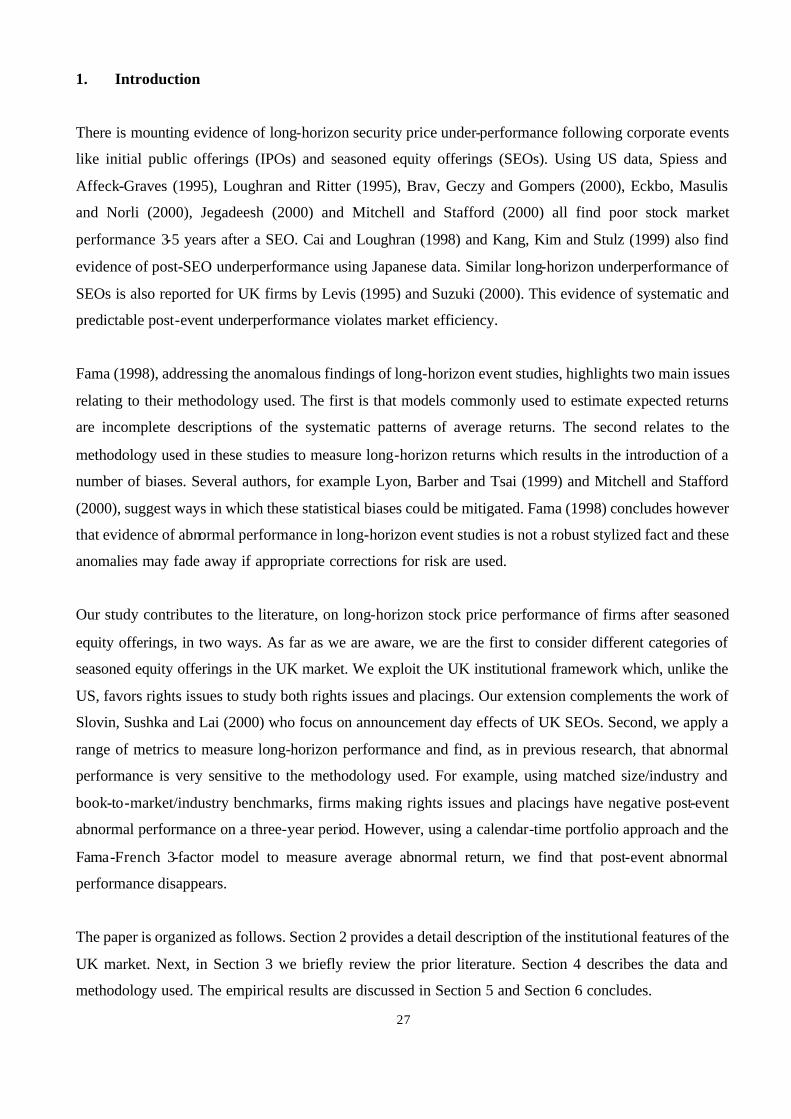
from period T1 to T2 as:
33
∏∏==
+−+=2
1
2
1
)1()1( ,,,
T
Tttb
T
Tttiti RRBHAR (1)
where Ri,t is the total return of the sample firm in event month t, Rb,t is the total return of the benchmark
over the same period. The test statistics used is the traditional t-statistic:
)(/ ,, titi BHARnBHARt σ×= (2)
where tiBHAR , is the average across firms for BHAR, )( ,tiBHARσ is the cross-sectional standard
deviation of BHAR for all sample firms, and n is number of firms.
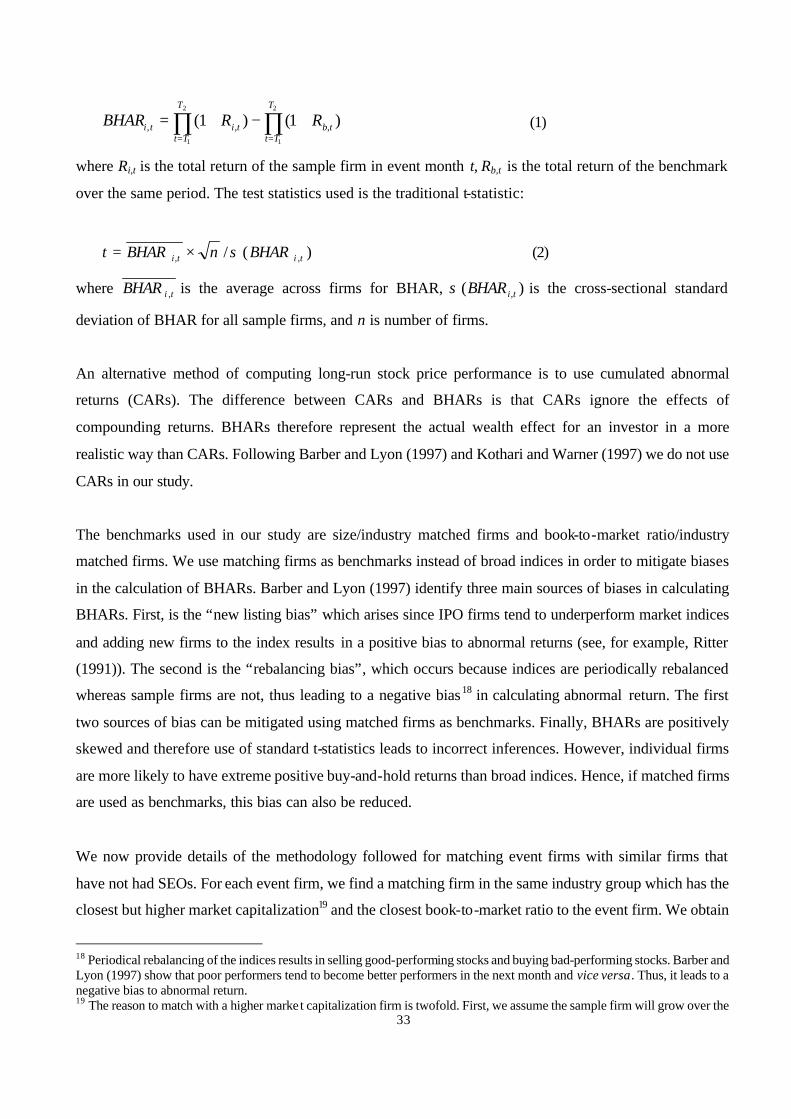
An alternative method of computing long-run stock price performance is to use cumulated abnormal
returns (CARs). The difference between CARs and BHARs is that CARs ignore the effects of
compounding returns. BHARs therefore represent the actual wealth effect for an investor in a more
realistic way than CARs. Following Barber and Lyon (1997) and Kothari and Warner (1997) we do not use
CARs in our study.
The benchmarks used in our study are size/industry matched firms and book-to-market ratio/industry
matched firms. We use matching firms as benchmarks instead of broad indices in order to mitigate biases
in the calculation of BHARs. Barber and Lyon (1997) identify three main sources of biases in calculating
BHARs. First, is the “new listing bias” which arises since IPO firms tend to underperform market indices
and adding new firms to the index results in a positive bias to abnormal returns (see, for example, Ritter
(1991)). The second is the “rebalancing bias”, which occurs because indices are periodically rebalanced
whereas sample firms are not, thus leading to a negative bias18 in calculating abnormal return. The first
two sources of bias can be mitigated using matched firms as benchmarks. Finally, BHARs are positively
skewed and therefore use of standard t-statistics leads to incorrect inferences. However, individual firms
are more likely to have extreme positive buy-and-hold returns than broad indices. Hence, if matched firms
are used as benchmarks, this bias can also be reduced.
We now provide details of the methodology followed for matching event firms with similar firms that
have not had SEOs. For each event firm, we find a matching firm in the same industry group which has the
closest but higher market capitalization19 and the closest book-to-market ratio to the event firm. We obtain
18 Periodical rebalancing of the indices results in selling good-performing stocks and buying bad-performing stocks. Barber and Lyon (1997) show that poor performers tend to become better performers in the next month and vice versa. Thus, it leads to a negative bias to abnormal return. 19 The reason to match with a higher market capitalization firm is twofold. First, we assume the sample firm will grow over the
34
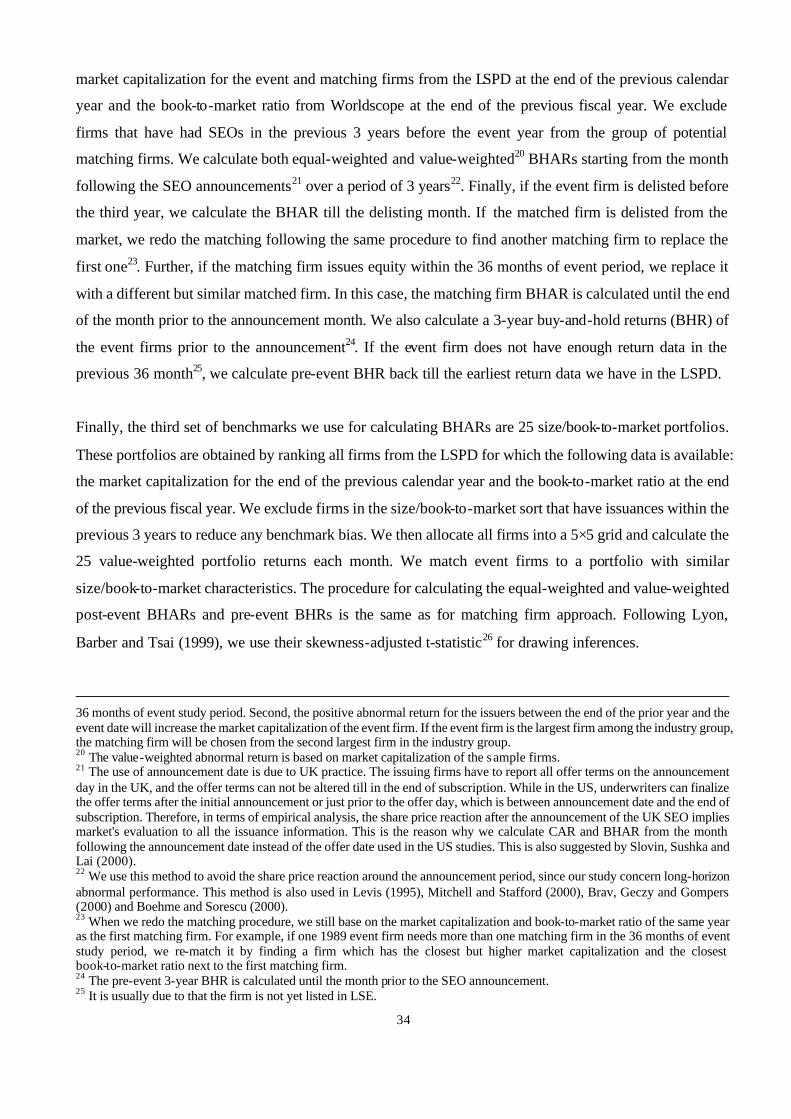
market capitalization for the event and matching firms from the LSPD at the end of the previous calendar
year and the book-to-market ratio from Worldscope at the end of the previous fiscal year. We exclude
firms that have had SEOs in the previous 3 years before the event year from the group of potential
matching firms. We calculate both equal-weighted and value-weighted20 BHARs starting from the month
following the SEO announcements21 over a period of 3 years22. Finally, if the event firm is delisted before
the third year, we calculate the BHAR till the delisting month. If the matched firm is delisted from the
market, we redo the matching following the same procedure to find another matching firm to replace the
first one23. Further, if the matching firm issues equity within the 36 months of event period, we replace it
with a different but similar matched firm. In this case, the matching firm BHAR is calculated until the end
of the month prior to the announcement month. We also calculate a 3-year buy-and-hold returns (BHR) of
the event firms prior to the announcement24. If the event firm does not have enough return data in the
previous 36 month25, we calculate pre-event BHR back till the earliest return data we have in the LSPD.
Finally, the third set of benchmarks we use for calculating BHARs are 25 size/book-to-market portfolios.
These portfolios are obtained by ranking all firms from the LSPD for which the following data is available:
the market capitalization for the end of the previous calendar year and the book-to-market ratio at the end
of the previous fiscal year. We exclude firms in the size/book-to-market sort that have issuances within the
previous 3 years to reduce any benchmark bias. We then allocate all firms into a 5×5 grid and calculate the
25 value-weighted portfolio returns each month. We match event firms to a portfolio with similar
size/book-to-market characteristics. The procedure for calculating the equal-weighted and value-weighted
post-event BHARs and pre-event BHRs is the same as for matching firm approach. Following Lyon,
Barber and Tsai (1999), we use their skewness-adjusted t-statistic26 for drawing inferences.
36 months of event study period. Second, the positive abnormal return for the issuers between the end of the prior year and the event date will increase the market capitalization of the event firm. If the event firm is the largest firm among the industry group, the matching firm will be chosen from the second largest firm in the industry group. 20 The value-weighted abnormal return is based on market capitalization of the sample firms. 21 The use of announcement date is due to UK practice. The issuing firms have to report all offer terms on the announcement day in the UK, and the offer terms can not be altered till in the end of subscription. While in the US, underwriters can finalize the offer terms after the initial announcement or just prior to the offer day, which is between announcement date and the end of subscription. Therefore, in terms of empirical analysis, the share price reaction after the announcement of the UK SEO implies market's evaluation to all the issuance information. This is the reason why we calculate CAR and BHAR from the month following the announcement date instead of the offer date used in the US studies. This is also suggested by Slovin, Sushka and Lai (2000). 22 We use this method to avoid the share price reaction around the announcement period, since our study concern long-horizon abnormal performance. This method is also used in Levis (1995), Mitchell and Stafford (2000), Brav, Geczy and Gompers (2000) and Boehme and Sorescu (2000). 23 When we redo the matching procedure, we still base on the market capitalization and book-to-market ratio of the same year as the first matching firm. For example, if one 1989 event firm needs more than one matching firm in the 36 months of event study period, we re-match it by finding a firm which has the closest but higher market capitalization and the closest book-to-market ratio next to the first matching firm. 24 The pre-event 3-year BHR is calculated until the month prior to the SEO announcement. 25 It is usually due to that the firm is not yet listed in LSE.

35
4.2.2 Calendar-Time Portfolio Approach
It is possible that firms may undergo another event over the period when abnormal returns are computed
resulting in overlapping of long-horizon returns as well as cross-correlation across event firms. We
therefore use a calendar-time portfolio approach (see Jaffe (1974) and Mandelker (1974)) to reduce this
bias following Loughran and Ritter (1995), Brav, Geczy and Gompers (2000), Mitchell and Stafford (2000)
and Jegadeesh (2000) among many others.
The calculation of the calendar-time portfolio abnormal returns requires use of an asset pricing model. We
use a Fama-French 3-factor model27 for the UK market. We estimate the intercept, αi, in the following
regression:
ittitiftmtiiftpt HMLhSMBsRRRR ξβα +++−+=− )( (3)
Rpt is the monthly return on the equal-weighted or value-weighted calendar-time portfolio of the
event firms.
Rft is the monthly return on one-month treasury bills.
Rmt is the return on the return of the value-weighted portfolio of all firms in the market.
SMBt is the difference in the returns of the value-weighted portfolios of small stocks and big stocks.
HMLt is the difference in the returns of the value-weighted portfolios of high book-to-market stocks
and low book-to-market stocks.
We form the calendar-time portfolios, for each month of our sample period, by including all firms that
have more than one SEOs within 3 years. The calendar-time portfolio methodology can control for
cross-sectional correlation due to clustering of events and overlapping event returns.
We also use a 4-factor model28 to measure the monthly abnormal return following the SEOs. We estimate
the intercept in the following model as in Carhart (1997):
ittititiftmtiiftpt PRpHMLhSMBsRRRR ξβα ++++−+=− 12)( (4)
where PR12t is the difference in the return on an equal-weighted portfolio of high momentum (winners)
stocks and low momentum (losers) stocks29.
26 See Lyon, Barber and Tsai (1999). 27 See Fama and French (1993) for details. 28 See Carhart (1997) for details. 29 We follow Carhart (1997) in calculating this momentum factor.
36
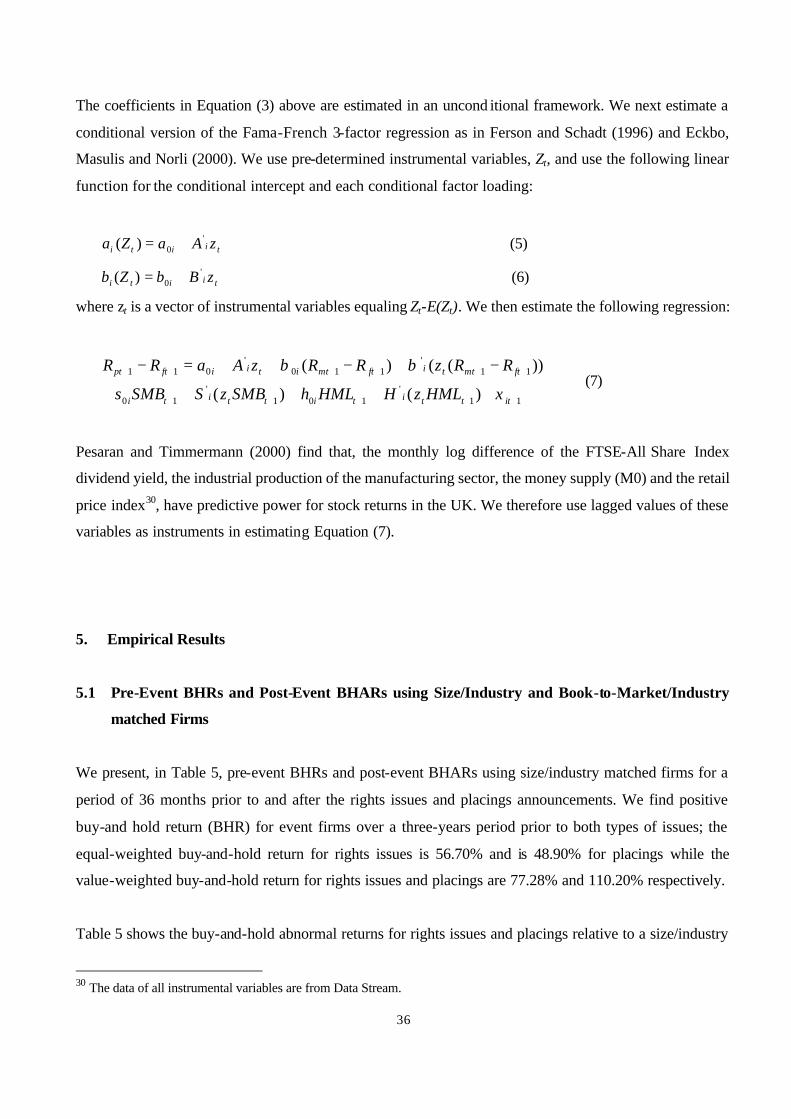
The coefficients in Equation (3) above are estimated in an uncond itional framework. We next estimate a
conditional version of the Fama-French 3-factor regression as in Ferson and Schadt (1996) and Eckbo,
Masulis and Norli (2000). We use pre-determined instrumental variables, Zt, and use the following linear
function for the conditional intercept and each conditional factor loading:
tiiti zAaZa '0)( += (5)
tiiti zBbZb '0)( += (6)
where zt is a vector of instrumental variables equaling Zt-E(Zt). We then estimate the following regression:
11'
101'
10
11'
110'
011
)()(
))(()(
+++++
++++++
+++++
−+−++=−
itttitittiti
ftmttiftmtitiiftpt
HMLzHHMLhSMBzSSMBs
RRzRRzAaRR
ξ
ββ (7)
Pesaran and Timmermann (2000) find that, the monthly log difference of the FTSE-All Share Index
dividend yield, the industrial production of the manufacturing sector, the money supply (M0) and the retail
price index30, have predictive power for stock returns in the UK. We therefore use lagged values of these
variables as instruments in estimating Equation (7).
5. Empirical Results
5.1 Pre-Event BHRs and Post-Event BHARs using Size/Industry and Book-to-Market/Industry
matched Firms
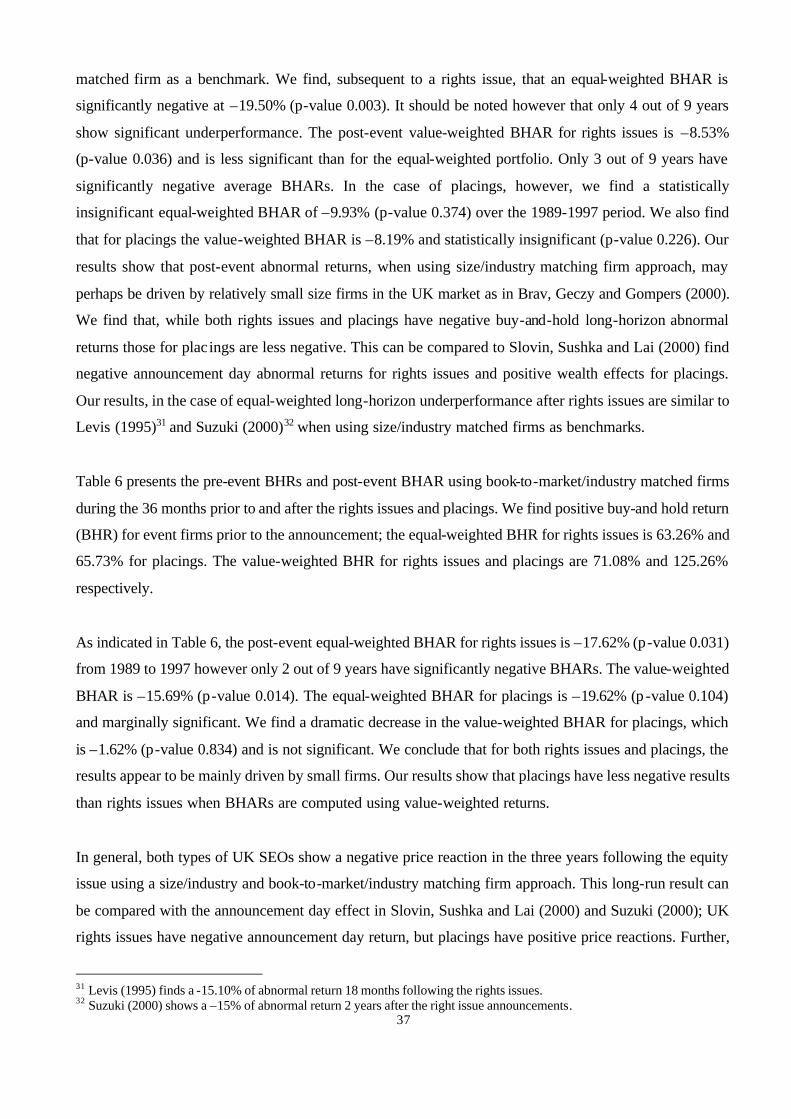
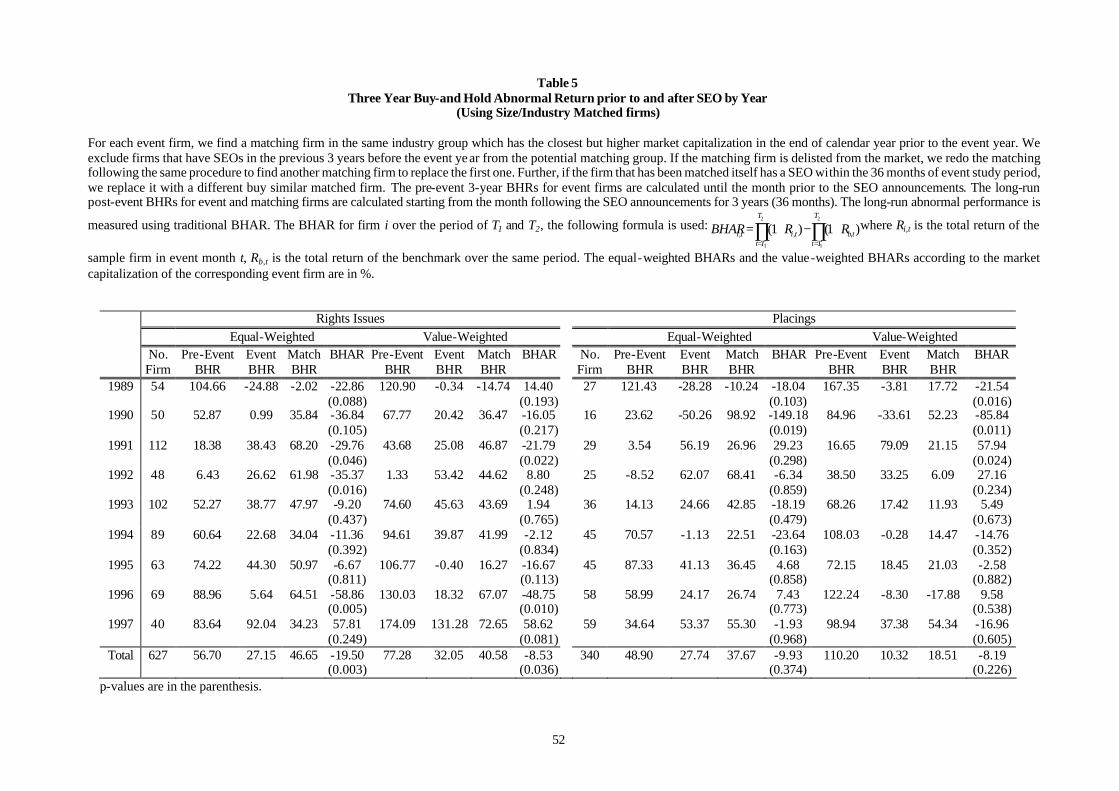
We present, in Table 5, pre-event BHRs and post-event BHARs using size/industry matched firms for a
period of 36 months prior to and after the rights issues and placings announcements. We find positive
buy-and hold return (BHR) for event firms over a three-years period prior to both types of issues; the
equal-weighted buy-and-hold return for rights issues is 56.70% and is 48.90% for placings while the
value-weighted buy-and-hold return for rights issues and placings are 77.28% and 110.20% respectively.
Table 5 shows the buy-and-hold abnormal returns for rights issues and placings relative to a size/industry
30 The data of all instrumental variables are from Data Stream.
37
matched firm as a benchmark. We find, subsequent to a rights issue, that an equal-weighted BHAR is
significantly negative at –19.50% (p-value 0.003). It should be noted however that only 4 out of 9 years
show significant underperformance. The post-event value-weighted BHAR for rights issues is –8.53%
(p-value 0.036) and is less significant than for the equal-weighted portfolio. Only 3 out of 9 years have
significantly negative average BHARs. In the case of placings, however, we find a statistically
insignificant equal-weighted BHAR of –9.93% (p-value 0.374) over the 1989-1997 period. We also find
that for placings the value-weighted BHAR is –8.19% and statistically insignificant (p-value 0.226). Our
results show that post-event abnormal returns, when using size/industry matching firm approach, may
perhaps be driven by relatively small size firms in the UK market as in Brav, Geczy and Gompers (2000).
We find that, while both rights issues and placings have negative buy-and-hold long-horizon abnormal
returns those for placings are less negative. This can be compared to Slovin, Sushka and Lai (2000) find
negative announcement day abnormal returns for rights issues and positive wealth effects for placings.
Our results, in the case of equal-weighted long-horizon underperformance after rights issues are similar to
Levis (1995)31 and Suzuki (2000)32 when using size/industry matched firms as benchmarks.
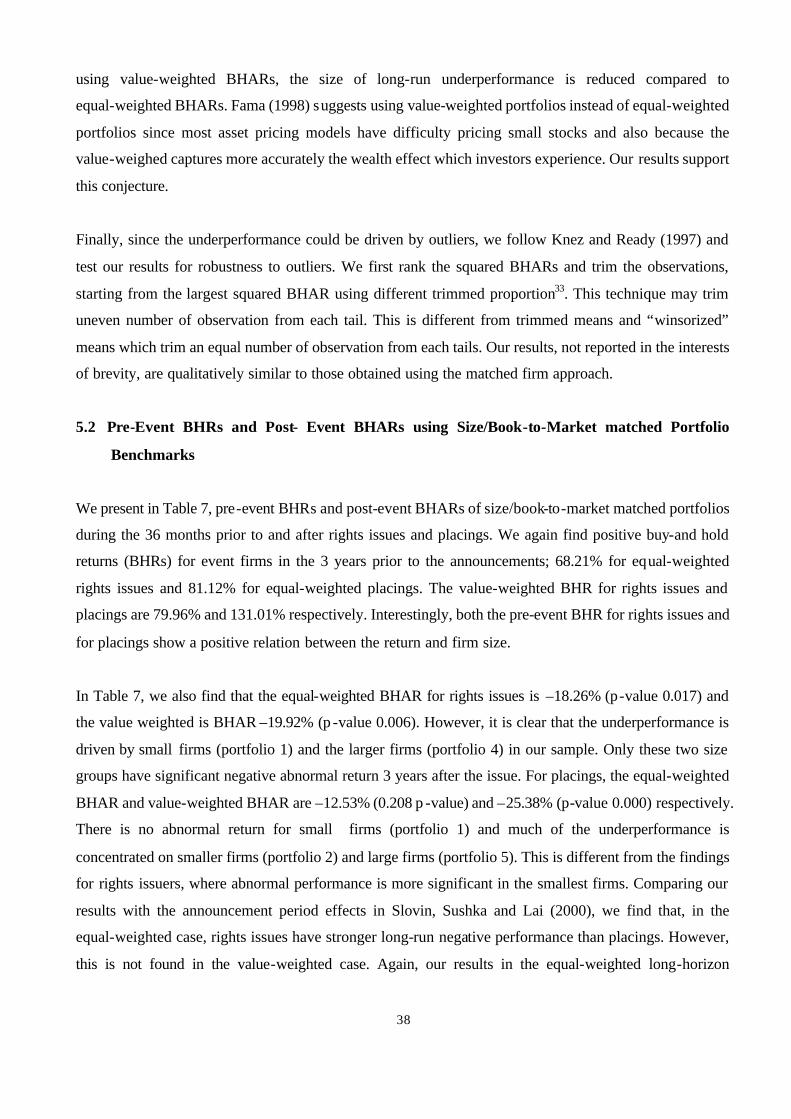
Table 6 presents the pre-event BHRs and post-event BHAR using book-to-market/industry matched firms
during the 36 months prior to and after the rights issues and placings. We find positive buy-and hold return
(BHR) for event firms prior to the announcement; the equal-weighted BHR for rights issues is 63.26% and
65.73% for placings. The value-weighted BHR for rights issues and placings are 71.08% and 125.26%
respectively.
As indicated in Table 6, the post-event equal-weighted BHAR for rights issues is –17.62% (p-value 0.031)
from 1989 to 1997 however only 2 out of 9 years have significantly negative BHARs. The value-weighted
BHAR is –15.69% (p-value 0.014). The equal-weighted BHAR for placings is –19.62% (p -value 0.104)
and marginally significant. We find a dramatic decrease in the value-weighted BHAR for placings, which
is –1.62% (p-value 0.834) and is not significant. We conclude that for both rights issues and placings, the
results appear to be mainly driven by small firms. Our results show that placings have less negative results
than rights issues when BHARs are computed using value-weighted returns.
In general, both types of UK SEOs show a negative price reaction in the three years following the equity
issue using a size/industry and book-to-market/industry matching firm approach. This long-run result can
be compared with the announcement day effect in Slovin, Sushka and Lai (2000) and Suzuki (2000); UK
rights issues have negative announcement day return, but placings have positive price reactions. Further,
31 Levis (1995) finds a -15.10% of abnormal return 18 months following the rights issues. 32 Suzuki (2000) shows a –15% of abnormal return 2 years after the right issue announcements.
38
using value-weighted BHARs, the size of long-run underperformance is reduced compared to
equal-weighted BHARs. Fama (1998) suggests using value-weighted portfolios instead of equal-weighted
portfolios since most asset pricing models have difficulty pricing small stocks and also because the
value-weighed captures more accurately the wealth effect which investors experience. Our results support
this conjecture.
Finally, since the underperformance could be driven by outliers, we follow Knez and Ready (1997) and
test our results for robustness to outliers. We first rank the squared BHARs and trim the observations,
starting from the largest squared BHAR using different trimmed proportion33. This technique may trim
uneven number of observation from each tail. This is different from trimmed means and “winsorized”
means which trim an equal number of observation from each tails. Our results, not reported in the interests
of brevity, are qualitatively similar to those obtained using the matched firm approach.
5.2 Pre-Event BHRs and Post- Event BHARs using Size/Book-to-Market matched Portfolio
Benchmarks
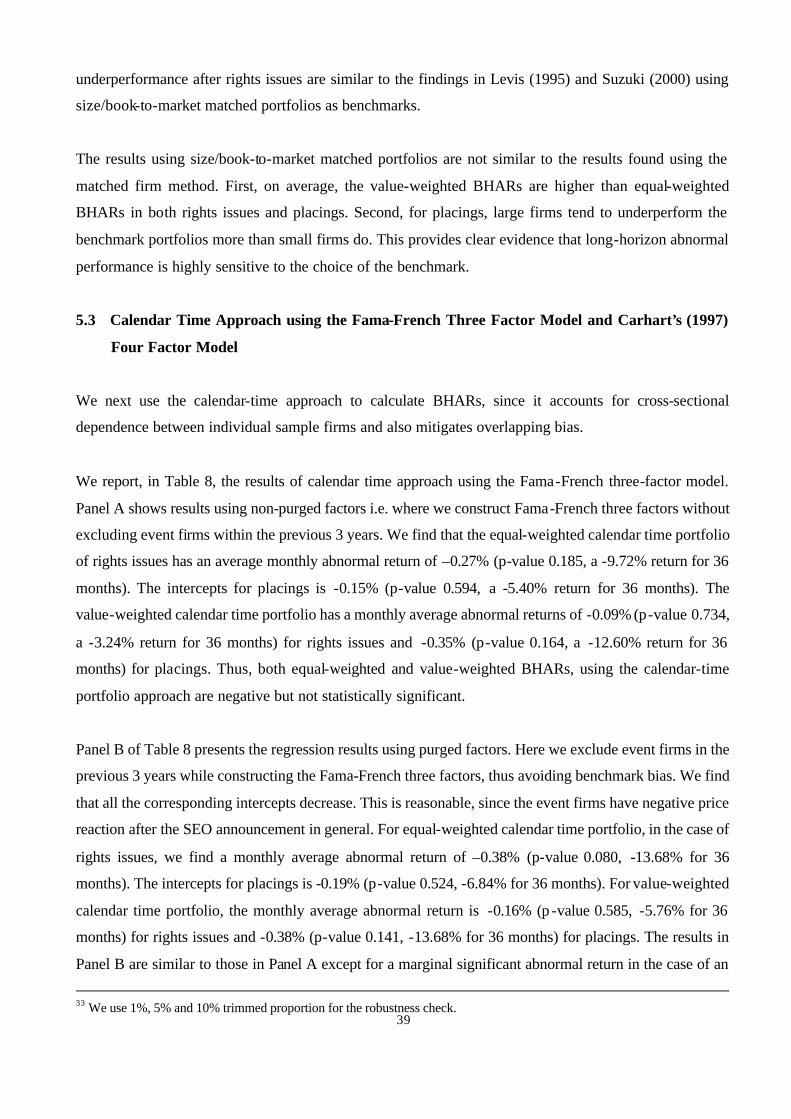
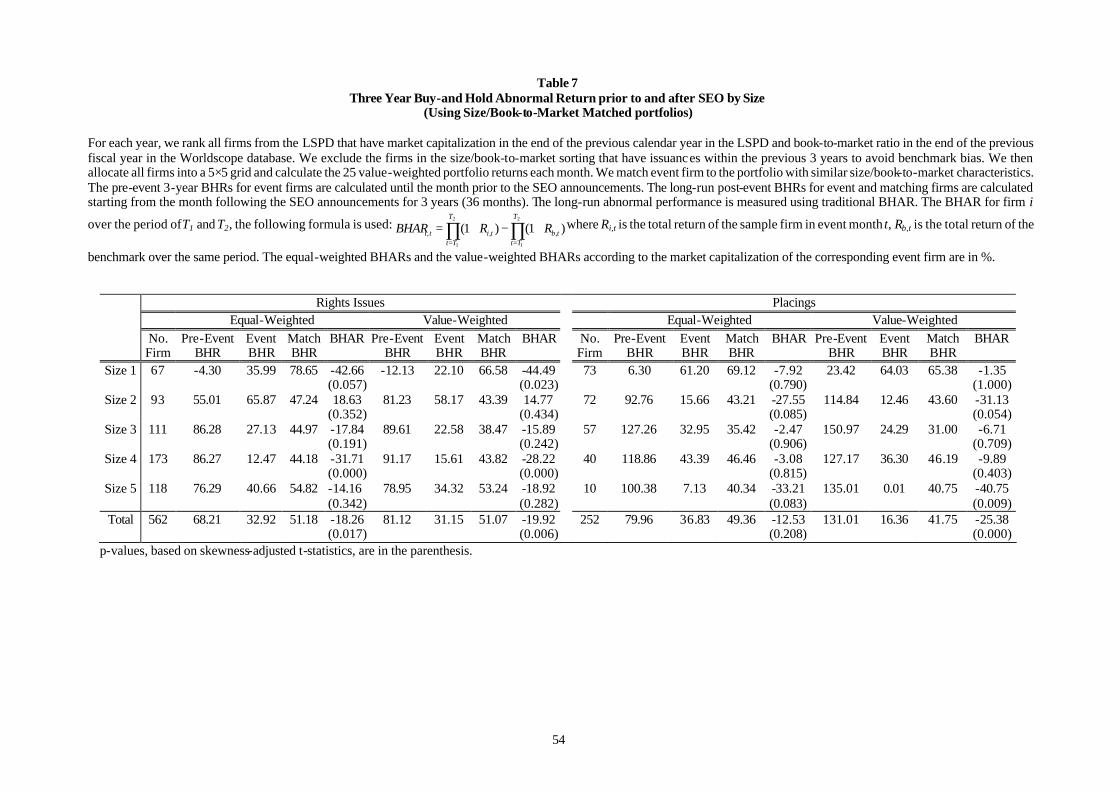
We present in Table 7, pre-event BHRs and post-event BHARs of size/book-to-market matched portfolios
during the 36 months prior to and after rights issues and placings. We again find positive buy-and hold
returns (BHRs) for event firms in the 3 years prior to the announcements; 68.21% for equal-weighted
rights issues and 81.12% for equal-weighted placings. The value-weighted BHR for rights issues and
placings are 79.96% and 131.01% respectively. Interestingly, both the pre-event BHR for rights issues and
for placings show a positive relation between the return and firm size.
In Table 7, we also find that the equal-weighted BHAR for rights issues is –18.26% (p-value 0.017) and
the value weighted is BHAR –19.92% (p -value 0.006). However, it is clear that the underperformance is
driven by small firms (portfolio 1) and the larger firms (portfolio 4) in our sample. Only these two size
groups have significant negative abnormal return 3 years after the issue. For placings, the equal-weighted
BHAR and value-weighted BHAR are –12.53% (0.208 p -value) and –25.38% (p-value 0.000) respectively.
There is no abnormal return for small firms (portfolio 1) and much of the underperformance is
concentrated on smaller firms (portfolio 2) and large firms (portfolio 5). This is different from the findings
for rights issuers, where abnormal performance is more significant in the smallest firms. Comparing our
results with the announcement period effects in Slovin, Sushka and Lai (2000), we find that, in the
equal-weighted case, rights issues have stronger long-run negative performance than placings. However,
this is not found in the value-weighted case. Again, our results in the equal-weighted long-horizon
39
underperformance after rights issues are similar to the findings in Levis (1995) and Suzuki (2000) using
size/book-to-market matched portfolios as benchmarks.
The results using size/book-to-market matched portfolios are not similar to the results found using the
matched firm method. First, on average, the value-weighted BHARs are higher than equal-weighted
BHARs in both rights issues and placings. Second, for placings, large firms tend to underperform the
benchmark portfolios more than small firms do. This provides clear evidence that long-horizon abnormal
performance is highly sensitive to the choice of the benchmark.
5.3 Calendar Time Approach using the Fama-French Three Factor Model and Carhart’s (1997)
Four Factor Model
We next use the calendar-time approach to calculate BHARs, since it accounts for cross-sectional
dependence between individual sample firms and also mitigates overlapping bias.
We report, in Table 8, the results of calendar time approach using the Fama-French three-factor model.
Panel A shows results using non-purged factors i.e. where we construct Fama-French three factors without
excluding event firms within the previous 3 years. We find that the equal-weighted calendar time portfolio
of rights issues has an average monthly abnormal return of –0.27% (p-value 0.185, a -9.72% return for 36
months). The intercepts for placings is -0.15% (p-value 0.594, a -5.40% return for 36 months). The
value-weighted calendar time portfolio has a monthly average abnormal returns of -0.09% (p-value 0.734,
a -3.24% return for 36 months) for rights issues and -0.35% (p-value 0.164, a -12.60% return for 36
months) for placings. Thus, both equal-weighted and value-weighted BHARs, using the calendar-time
portfolio approach are negative but not statistically significant.
Panel B of Table 8 presents the regression results using purged factors. Here we exclude event firms in the
previous 3 years while constructing the Fama-French three factors, thus avoiding benchmark bias. We find
that all the corresponding intercepts decrease. This is reasonable, since the event firms have negative price
reaction after the SEO announcement in general. For equal-weighted calendar time portfolio, in the case of
rights issues, we find a monthly average abnormal return of –0.38% (p-value 0.080, -13.68% for 36
months). The intercepts for placings is -0.19% (p-value 0.524, -6.84% for 36 months). For value-weighted
calendar time portfolio, the monthly average abnormal return is -0.16% (p -value 0.585, -5.76% for 36
months) for rights issues and -0.38% (p-value 0.141, -13.68% for 36 months) for placings. The results in
Panel B are similar to those in Panel A except for a marginal significant abnormal return in the case of an
33 We use 1%, 5% and 10% trimmed proportion for the robustness check.

40
equal-weighted rights issue portfolio.
The results of calendar time approach using Carhart’s (1997) four-factor model are shown in Table 9.
Panel A indicates results using non-purged factors, i.e. where we construct the four factors without
excluding event firms within the previous 3 years. In this case, the equal-weighted calendar time portfolio
shows that rights issues have an average monthly abnormal return of –0.16% (p-value 0.492, -5.76% for
36 months). The intercepts for placings is -0.36% (p-value 0.233, -12.96% for 36 months). The
value-weighted calendar time portfolio has monthly average abnormal returns of -0.43% (p-value 0.159,
-15.48% for 36 months) for rights issues and -0.70% (p-value 0.010, -25.20% for 36 months) for placings.
Panel B of Table 9 presents the regression results using purged factors. Here we exclude event firms in the
previous 3 years while constructing the four factors, thus avoiding benchmark bias. We find again that all
the corresponding intercepts decrease. For equal-weighted calendar time portfolio, in the case of rights
issues, we find a monthly average abnormal return of –0.29% (p -value 0.238, -10.44% for 36 months).
The intercepts for placings is -0.56% (p-value 0.077, -20.16% for 36 months). For value-weighted
calendar time portfolio, the monthly average abnormal return is -0.50% (p-value 0.123, -18.00% for 36
months) for rights issues and -0.80% (p-value 0.004, -28.80% for 36 months) for placings. The results in
Panel B are similar to those in Panel A.
The results of the calendar-time approach using the Fama-French three-factor model provide clear
evidence that there is no statistically significant negative abnormal underperformance in UK firms
following both rights issues and placings. Further, the findings show that after allowing cross-sectional
dependence and overlapping bias, the abnormal returns found using the BHAR methodology fade away.
However, when the Carhart (1997) four-factor model is used, the monthly abnormal returns become more
significant. The different findings between the three and four factor models implies that, in the UK market,
adding a momentum factor may not improve the explanatory power of the Fama-French 3-factor model.
We also estimate a conditional version of Fama-French 3-factor regression using four instrumental
variables; the FTSE-All Share Index dividend yield, industrial production of manufacturing section,
money supply (M0) and retail price index. We can now control for unconditional model misspecifcation
due to factor loadings varying over time. We can also account for a time-varying intercept in a conditional
model. Table 10 reports the intercept of both unconditional and conditional models. The results show
confirm the results of the unconditional tests and we find no evidence of abnormal performance after
rights issues and placings for the equal- and value-weighted portfolios. The only exception is the
value-weighted average monthly abnormal return for placings, which is now significantly negative.

41
6. Summary and Conclusion
Our study contributes to the literature on long-horizon stock price performance of firms that have had
seasoned equity offerings through rights issues and placings. While there are several studies of
long-horizon returns after SEOs, ours is the first to consider rights issues and placings by UK firms. We
exploit the UK institutional framework that favors seasoned equity offerings through rights issues. Next,
we apply a range of metrics to measure long-horizon performance. We find, as in previous studies, that
abnormal performance is very sensitive to the metric used. In order to ascertain whether long-horizon
underperformance is an artifact of the estimation methodology used, we first use size/industry and
book-to-market/industry matching firm approach and size/book-to-market matching portfolio approach to
measure BHARs. We find, consistent with the US findings, that firms making rights issues and placings
have positive BHRs 3 years prior to the event announcements. We find negative abnormal performance in
the 3 years following both categories of seasoned equity offerings. Most of the statistically significant
underperformance however occurs in rights issues rather than placings. We also analyze the BHARs by
event firm size and find that most of the underperformance is driven by small firms in the case of right
issues while the negative returns are driven by larger firms in the case of placings. Finally, based on a
calendar-time portfolio approach using Fama-French 3-factor model, we find, for both equal-weighted
and value-weighted portfolios, the abnormal returns are negative but not statistically significant for both
rights issues and placings. Thus, we conclude that the abnormal negative stock price performance after
seasoned equity offerings is not a robust feature of our data and that this abnormal performance fade away
when alternate techniques to correct for risk are utilized.
Our findings show that long-horizon abnormal performance following UK rights issues and placings is
highly sensitive to the methodology used. We can conclude, following Fama (1998), that the apparent
anomalous underperformance after seasoned equity offerings may be an artifact of the methodology used
and that long-horizon abnormal return may disappear with reasonable changes in techniques. Our study
also underlies the need to adjust correctly for risk in measuring long-horizon security returns.

42
Appendix A
The sequence of activities followed by UK firms seeking to raise capital through rights issues is as
follows:
(1) The London Stock Exchange (LSE) requires listing particularsA1 to include a statement of recent
borrowings of the issuing group which must, in the absence of exceptional circumstances, be not more
than 42 days prior to the publication of the listing particulars.
(2) Following the announcement of a rights issue, a renounceable allotment letter or other negotiable
documents is sent to existing shareholders, which may be traded as nil-paid rights for at least 21 days
before the payment of the new equities is made.
(3) Where the company has insufficient unissued capital available, an extraordinary general meeting
(EGM) is required to obtain approval from a majority of the shareholders to increase the authorized
capital. A notice period of 14 days is required for an EGM, but if the business includes a special
resolution then the notice period is increased to 21 days. The periods in (2) and (3) cannot be
concurrent, since dealings in nil-paid rights cannot be done on the basis of partial allocation.
(4) At the close of the offer period, the new shares are entered into a register, and certificates are sent out.
Rights issues in the UK are usually underwritten in full or part by investing institutions at a discounted
offer priceA2. The underwriters are the responsible for taking up the “rump” at the end of the offer
period.
A1 The LSE Listing Rules Clause 5.1 requires companies issuing new equities to produce listing particulars or a prospectus, which must be submitted to and approved by the Exchange. .” See The listing Rules, 2000 for details. A2 Usually the offer price is 80-85% of the market price on the day before announcement.

43
Reference
Barber, B.M., Lyons, J.D., 1997, Detecting Long-Run Abnormal Stock Returns: The Empirical Power and
Specification of Test Statistics. Journal of Financial Economics 43, 341-372.
Boehme, R.D. and Sorescu, S.M., 2000, Seven Decades of Long-Term Abnormal Return Persistence: The
Case of Dividend Initiations and Resumptions. Working Paper, Sam Houston State University and
Houston University.
Brav, A., Geczy C., Gompers, P.A., 2000, Is the Abnormal Return Following Equity Issuances Anomalous?
Journal of Financial Economics 56, 209-249.
Cai, J., Loughran, T., 1998, The Performance of Japanese Seasoned Equity Offerings, 1971-1992.
Pacific-Basin Finance Journal 6, 395-425.
Carhart, M.M., 1997, On Persistence in Mutual Fund Performance. Journal of Finance 52, 57-82.
Christopherson, J.A., Ferson, W.E., Glassman, D.A., 1998, Conditioning Manager Alphas on Economic
Information: Another Look at the Persistence of Performance. Review of Financial Studies 11, 111-142.
Eckbo, B.E., Masulis, R.W., 1992, Adverse Selection and the Rights Offer Paradox. Journal of Financial
Economics 32, 193-332.
Eckbo, B.E., Masulis, R.W., Norli, O., 2000, Seasoned Public Offerings: Resolution of the “New Issue
Puzzle”. Journal of Financial Economics 56, 251-291.
Fama, E.F., 1998, Market Efficiency, Long-Term Returns, and Behavioral Finance. Journal of Financial
Economics 49, 283-306.
Fama, E.F., Fisher, L., Jensen, M., Roll, R., 1969, The Adjustment of Stock Prices to New Information.
International Economics Review 10, 1-21.
Fama, E.F., French, K.R., 1993, Common Risk Factors in the Returns on Stocks and Bonds. Journal of
Financial Economics 33, 3-56.
Ferson, W.E. and Schadi, R.W., 1996, Measuring Fund Strategy and Performance in Changing Economic
Conditions. Journal of Finance 51, 425-461.
Financial Services Authority, 2000, The Listing Rules. The Financial Services Authority.
Hansen, R.S., 1988, The Demise of the Rights Issue. Review of Financial Studies 1, 289-309.
Heinkel, R., Schwartz, E.S., 1986, Rights versus Underwritten Offerings: An Asymmetric Information
Approach. Journal of Finance 41, 1-18.
Jaffe, J.F., 1974, Special Information and Insider Trading. Journal of Business 47, 410-428.
Jegadeesh, N., 2000, “Long-Run Performance of Seasoned Equity Offerings: Benchmark Errors and
Biases in Expectations. Financial Management 29 (3), 5-30.
Kang, J-K, Kim, Y-C and Stulz, R.M., 1999, The Underreaction Hypothesis and the New Issue Puzzle:

44
Evidence from Japan. Review of Financial Studies 12, 519-534.
Knez, P.J., Ready, M.J., 1997, On the Robustness of Size and Book-to-Market in Cross-Sectional
Regressions. Journal of Finance 52, 1355-1382.
Kothari, S.P., Warner, J.B., 1997, Measuring Long-Horizon Security Price Performance. Journal of
Financial Economics 43, 301-339.
Levis, M., 1995, Seasoned Equity Offerings and the Short- and Long-Term Performance of Initial Public
Offerings in the UK. European Financial Management 1 (2), 125-146.
Loughan, T. and Ritter, J.R., 1995, The New Issues Puzzle. Journal of Finance 50, 23-51.
Loughan, T. and Ritter, J.R., 2000, Uniformly Least Powerful Tests of Market Efficiency. Journal of
Financial Economics 55, 361-389.
Lyon, J.D., Barber, B.M., Tsai, C-L, 1999, Improved Methods for Tests of Long-Run Abnormal Stock
Returns. Journal of Finance 54, 165-201.
Mandelker, G., 1974, Risk and Return: The Case of Merging Firms. Journal of Financial Economics 1,
303-335.
Marsh, P., 1979, Equity Rights Issues and the Efficiency of the UK Stock Market. Journal of Finance 34,
839-862.
Marsh, P., 1980, Valuation of Underwriting Agreements for UK Rights Issues. Journal of Finance 35,
693-716.
Marsh, P., 1994, Underwriting of Rights Issues: A Study of the Returns Earned by sub -underwriters from
UK Rights Issues. Office of Fair Trading Research Paper (6).
Mitchell, M.L., Stafford, E., 2000, Managerial Decisions and Long-Term Stock Price Performance.
Journal of Business 73, 287-320.
Monopolies and Mergers Commission, 1999, Underwriting Services for Share Offers: A Report on the
Supply in the UK of Underwriting Services for Share Offers. The Stationery Office Limited.
Myers, S.C., Majluf, N.S., 1984, Corporate Financing and Investment Decisions When Firms Have
Information that Investors Do Not Have. Journal of Financial Economics 13, 187-221.
Pesaran, M.H., Timmermann, A., 2000, A recursive Modeling Approach to Predicting UK Stock Returns.
Economic Journal 110, 159-191
Ritter, J.R., 1991, The Long-Run Performance of Initial Public Offerings. Journal of Finance 46, 3-27.
Ritter, J.R., 2001, Investment Banking and Securities Issuance. Working Paper, University of Florida.
Slovin, M.B., Sushka, M.E., Lai, W.L., 2000, Alternative Flotation Methods, Adverse Selection, and
Ownership Structure: Evidence from Seasoned Equity Issuance in the UK. Journal of Financial
Economics 57, 157-190.
Spiess, D.K., Affleck-Graves, J., 1995, Underperformance in Long-Run Stock Returns Following
Seasoned Equity Offerings. Journal of Financial Economics 38, 243-267.

45
Suzuki, K., 2000, Seasoned Equity Offerings in the UK, Usage of Funds, Method of Issue and Share Price
Reaction of Issuers. Working Paper, London Business School.

46
Table 1 Recent Studies in Long -Horizon Abnormal Performance following SEOs
Panel A US Data Study
Sample Period Main Results
Spiess and Affleck-Graves (1995)
1975-1989 5-year EW BHAR is –6.1% on size/industry matched firms.
Loughran and Ritter (1995)
1970-1990 5-year EW BHAR is –9.1% on size matched firms.
Loughran and Ritter (2000)
1973-1996
EW FF is –5.64%, and VW FF is –3.84%.
Brav, Geczy and Gompers (2000)
1975-1992 5-year EW BHAR is –3.9%, and 5-year VW BHAR is –3.4%. EW FF is –4.44%, and VW FF is –1.68%. EW 4F is –2.28%, and VW 4F is –3.36%.
Eckbo, Masulis and Norli (2000)
1964-1995 5-year EW BHAR is –4.8%, and 5-year VW BHAR is –2.2%. EW FF is –1.44%, and VW FF is –2.04% for NYSE/Amex firms. EW FF is –5.04%, and VW FF is –1.44% for Nasdaq firms.
Jegadeesh (2000)
1970-1993 5-year EW BHAR is –4.9%. EW FF is –5.40%. EW 4F is –3.72%.
Mitchell and Stafford (2000)
1961-1993 3-year EW BHAR is –2.7%, and 3-year VW BHAR is –1.1%. EW FF is –3.96%, and VW FF is -0.36%.
Panel B Japanese Data
Study
Sample Period Main Results
Cai and Loughran (1998)
1971-1992 5-year EW BHAR is –3.5%.
Kang, Kim and Stulz (1999)
1980-1988 5-year EW BHAR is –9.8%.
Panel C UK Data Study
Sample Period Main Results
Levis (1995)
1980-1988 18-month CAR is –15.1% for rights issues on size matched portfolios.
Slovin, Sushka and Lai (2000)
1986-1994 2-day CAR is –3.09% for rights issues and is 3.31% for placings.
Suzuki (2000)
1991-1996 2-year BHAR is –15% for rights issues on size matched portfolios.
* All returns are annualized returns based on the assumption in Ritter (2001), except for the UK studies. * Buy-and hold abnormal returns are based on the size/book-to-market matched firms/portfolios, if not otherwise stated. In
Slovin, Sushka and Lai (2000), the cumulative abnormal return is a 2-day on traditional event study period. * EW stands for equal-weighted portfolio and VW stands for value-weighted portfolio. * CAR is cumulative abnormal return, BHAR is the buy-and hold abnormal return, FF is the calendar-time abnormal return
using Fama-French 3-factor model and 4F is the calendar-time abnormal return using Carhart’s (1997) 4-factor model.

47
Table 2 Distribution of Event Sample SEO firms by Year and Method of Issue
Panel A Rights Issues
1989 1990 1991 1992 1993 1994 1995 1996 1997 Total
Original Samplesa
61
53
120
53
113
94
63
72
41
670
Size/Industry Matched Firmsb
54
50
112
48
102
89
63
69
40
627
Book-to-Market/Industry Matched Firmsc
38
41
99
45
90
78
49
56
35
531
Size/Book-to-Market Matched Portfoliosb,c
40
44
104
49
97
83
51
59
35
562
Panel B Placings
1989 1990 1991 1992 1993 1994 1995 1996 1997 Total
Original Samplesa
29
20
33
26
40
53
56
72
63
392
Size/Industry Matched Firmsb
27
16
29
25
36
45
45
58
59
340
Book-to-Market/Industry Matched Firmsc
19
9
28
20
29
33
31
35
41
245
Size/Book-to-Market Matched Portfoliosb,c
20
10
28
21
29
35
34
34
41
252
aThis includes firms listed in the London Stock Exchange but excludes foreign currency issues, non-common equity issues, financial and utility firms. bThis excludes firms that do not have market capitalisation and return data in the LSPD database. cThis figure is smaller than the original sample due to non-inclusion of firms that do not have return data and book-to-market ratio in the LSPD and Worldscope database or firms with negative book-to-market ratio.
48
Table 3 Descriptive Statistics of the Aggregate Gross Proceeds (in £M) raised by UK SEOs (1989 – 1997)
Panel A Rights Issues
1989 1990 1991 1992 1993 1994 1995 1996 1997 Total
Number of Firms
61 (67.8%)
53 (72.6%)
120 (78.4%)
53 (67.1%)
113 (73.9%)
94 (63.9%)
63 (52.9%)
72 (50.0%)
41 (39.4%)
670 (63.1%)
Total Amount Raised
2644.88 (69.5%)
2133.27 (88.8%)
7864.12 (93.4%)
1887.92 (85.2%)
6975.63 (93.0%)
2849.65 (81.2%)
2251.89 (80.4%)
2911.02 (73.0%)
1198.55 (60.4%)
30716.93 (83.9%)
Maximum Amount Raised
486.00 532.00 572.00 241.60 1310.00 267.00 458.90 222.00 167.30 1310.00
Minimum Amount Raised
1.07 1.80 0.63 0.58 0.51 1.05 0.41 1.50 0.86 0.41
Median Amount Raised
13.84 15.68 17.95 16.30 18.80 15.20 14.30 15.20 14.60 16.05
Average Amount Raised
43.36 40.25 65.53 35.62 61.73 30.32 35.74 40.43 29.23 45.85
Panel B Placings
1989 1990 1991 1992 1993 1994 1995 1996 1997 Total Number of Firms
29
(32.2%) 20
(27.4%) 33
(21.6%) 26
(32.9%) 40
(26.1%) 53
(36.1%) 56
(47.1%) 72
(50.0%) 63
(60.6%) 392
(36.9%)
Total Amount Raised
1163.40 (30.5%)
268.54 (11.2%)
554.15 (6.6%)
327.58 (14.8%)
524.16 (7.0%)
661.92 (18.8%)
550.68 (19.6%)
1074.87 (27.0%)
785.04 (39.6%)
5910.33 (16.1%)
Maximum Amount Raised
569.40 46.00 95.10 180.00 92.10 127.60 57.40 143.00 69.80 569.40
Minimum Amount Raised
0.70 1.45 1.33 0.40 0.44 0.90 0.39 0.27 0.88 0.27
Median Amount Raised
8.11 9.70 6.80 4.64 5.70 5.50 5.22 5.69 7.85 6.07
Average Amount Raised
40.12 13.43 16.79 12.60 13.10 12.49 9.83 14.93 12.66 15.12
Percentages for rights issues and placings out of the total SEO samples are in the parenthesis.
49
Table 4 Distribution of UK SEOs by Industry Sectors (1989-1997)
Industry Sector
No. of
Rights Issues Percentage (%) No. of
Placings Percentage (%)
Oil, Gas and Mining Exploration and Production
39
5.8
28
7.2
General Manufacturing-Engineering
78 11.7 45 11.5
General Manufacturing-Building and Construction
78 11.7 24 6.1
General Manufacturing-Chemicals
26 3.9 8 2.0
Electric and Electronic Equipment
27 4.0 19 4.9
Food and Beverage Manufacturers
20 3.0 18 4.6
Clothing, Textile and Leather Manufacturers
26 3.9 15 3.8
Health Care and Pharmaceuticals
33 4.9 15 3.8
Distributors
44 6.6 30 7.7
Retailers and Wholesalers
47 7.0 26 6.6
Restaurants, Pubs and Hotels
29 4.3 15 3.8
Leisure and Entertainment
23 3.4 24 6.1
Transportation and Communication
33 4.9 20 5.1
Computer Hardware, Software and Services
27 4.0 23 5.9
Other Industries
140 20.9 82 20.9
Total
670 100 392 100
50
Figure 1Number of UK SEOs by Year and Method of Issue
0
20
40
60
80
100
120
140
89 90 91 92 93 94 95 96 97
Year
Num
ber
of I
ssue
s
Rights Issues Placings
51
Figure 2Aggregate Gross Proceeds (in £M) Raised by UK SEOs
0
1000
2000
3000
4000
5000
6000
7000
8000
9000
89 90 91 92 93 94 95 96 97
Year
Am
ount
Rai
sed
(in
£M)
Rights Issues Placings
52
Table 5 Three Year Buy-and Hold Abnormal Return prior to and after SEO by Year
(Using Size/Industry Matched firms)
For each event firm, we find a matching firm in the same industry group which has the closest but higher market capitalization in the end of calendar year prior to the event year. We exclude firms that have SEOs in the previous 3 years before the event year from the potential matching group. If the matching firm is delisted from the market, we redo the matching following the same procedure to find another matching firm to replace the first one. Further, if the firm that has been matched itself has a SEO within the 36 months of event study period, we replace it with a different buy similar matched firm. The pre-event 3-year BHRs for event firms are calculated until the month prior to the SEO announcements. The long-run post-event BHRs for event and matching firms are calculated starting from the month following the SEO announcements for 3 years (36 months). The long-run abnormal performance is
measured using traditional BHAR. The BHAR for firm i over the period of T1 and T2, the following formula is used: ∏∏==
+−+=2
1
2
1
)1()1( ,,,
T
Tttb
T
Tttiti RRBHAR where Ri,t is the total return of the
sample firm in event month t, Rb,t is the total return of the benchmark over the same period. The equal-weighted BHARs and the value-weighted BHARs according to the market capitalization of the corresponding event firm are in %.
Rights Issues Placings Equal-Weighted Value-Weighted Equal-Weighted Value-Weighted No. Firm
Pre-Event BHR
Event BHR
Match BHR
BHAR Pre-Event BHR
Event BHR
Match BHR
BHAR No. Firm
Pre-Event BHR
Event BHR
Match BHR
BHAR Pre-Event BHR
Event BHR
Match BHR
BHAR
1989 54 104.66 -24.88 -2.02 -22.86 (0.088)
120.90 -0.34 -14.74 14.40 (0.193)
27 121.43 -28.28 -10.24 -18.04 (0.103)
167.35 -3.81 17.72 -21.54 (0.016)
1990 50 52.87 0.99 35.84 -36.84 (0.105)
67.77 20.42 36.47 -16.05 (0.217)
16 23.62 -50.26 98.92 -149.18 (0.019)
84.96 -33.61 52.23 -85.84 (0.011)
1991 112 18.38 38.43 68.20 -29.76 (0.046)
43.68 25.08 46.87 -21.79 (0.022)
29 3.54 56.19 26.96 29.23 (0.298)
16.65 79.09 21.15 57.94 (0.024)
1992 48 6.43 26.62 61.98 -35.37 (0.016)
1.33 53.42 44.62 8.80 (0.248)
25 -8.52 62.07 68.41 -6.34 (0.859)
38.50 33.25 6.09 27.16 (0.234)
1993 102 52.27 38.77 47.97 -9.20 (0.437)
74.60 45.63 43.69 1.94 (0.765)
36 14.13 24.66 42.85 -18.19 (0.479)
68.26 17.42 11.93 5.49 (0.673)
1994 89 60.64 22.68 34.04 -11.36 (0.392)
94.61 39.87 41.99 -2.12 (0.834)
45 70.57 -1.13 22.51 -23.64 (0.163)
108.03 -0.28 14.47 -14.76 (0.352)
1995 63 74.22 44.30 50.97 -6.67 (0.811)
106.77 -0.40 16.27 -16.67 (0.113)
45 87.33 41.13 36.45 4.68 (0.858)
72.15 18.45 21.03 -2.58 (0.882)
1996 69 88.96 5.64 64.51 -58.86 (0.005)
130.03 18.32 67.07 -48.75 (0.010)
58 58.99 24.17 26.74 7.43 (0.773)
122.24 -8.30 -17.88 9.58 (0.538)
1997 40 83.64 92.04 34.23 57.81 (0.249)
174.09 131.28 72.65 58.62 (0.081)
59 34.64 53.37 55.30 -1.93 (0.968)
98.94 37.38 54.34 -16.96 (0.605)
Total 627 56.70 27.15 46.65 -19.50 (0.003)
77.28 32.05 40.58 -8.53 (0.036)
340 48.90 27.74
37.67 -9.93 (0.374)
110.20 10.32 18.51 -8.19 (0.226)
p-values are in the parenthesis.

53
Table 6 Three Year Buy-and Hold Abnormal Return prior to and after SEO by Cohort Year
(Using Book-to-Market/Industry Matched firms)
For each event firm, we find a matching firm in the same industry group which has the closest book-to-market in the end of the previous fiscal year. We exclude firms that have SEOs in the previous 3 years before the event year from the potential matching group. If the matching firm is delisted from the market, we redo the matching following the same procedure above to find the another matching firm to replace the first one. Further, if the firm that has been matched itself has a SEO within the 36 months of event study period, we replace it with a different but similar matched firm. The pre-event 3-year BHRs for event firms are calculated until the month prior to the SEO announcements. The long-run post-event BHRs for event and matching firms are calculated starting from the month following the SEO announcements for 3 years (36 months). The long-run abnormal performance is measured using traditional
BHAR. The BHAR for firm i over the period of T1 and T2, the following formula is used: ∏∏==
+−+=2
1
2
1
)1()1( ,,,
T
Tttb
T
Tttiti RRBHAR where Ri,t is the total return of the sample firm in event month
t, Rb,t is the total return of the benchmark over the same period. The equal-weighted BHARs and the value-weighted BHARs according to the market capitalization of the corresponding event firm are in %.
Rights Issues Placings Equal-Weighted Value-Weighted Equal-Weighted Value-Weighted No. Firm
Pre-Event BHR
Event BHR
Match BHR
BHAR Pre-Event BHR
Event BHR
Match BHR
BHAR No. Firm
Pre-Event BHR
Event BHR
Match BHR
BHAR Pre-Event BHR
Event BHR
Match BHR
BHAR
1989 38 130.90 -11.75 -9.20 -2.55 (0.843)
128.72 3.27 6.04 -2.77 (0.721)
19 88.68 -18.73 -17.61 -1.12 (0.960)
189.30 0.98 -25.46 26.44 (0.008)
1990 41 58.15 3.18 102.87 -99.69 (0.034)
54.45 24.64 92.69 -68.05 (0.091)
9 75.90 -41.05 -11.45 -29.60 (0.308)
115.31 -19.79 -52.93 33.14 (0.162)
1991 99 25.43 43.14 63.82 -22.68 (0.142)
40.65 21.69 42.30 -20.60 (0.012)
28 7.03 54.03 46.91 7.12 (0.782)
26.66 80.33 36.10 44.23 (0.068)
1992 45 3.21 26.51 84.46 -57.95 (0.017)
-1.04 53.68 103.34 -49.66 (0.013)
20 -6.89 80.91 24.44 56.47 (0.138)
49.23 63.16 -9.00 72.17 (0.011)
1993 90 61.75 45.17 59.35 -14.19 (0.355)
75.07 45.47 52.25 -6.78 (0.524)
29 16.23 43.44 109.42 -65.98 (0.079)
68.42 25.03 51.06 -26.02 (0.158)
1994 78 70.91 35.94 37.92 -1.98 (0.897)
84.52 42.26 37.80 4.46 (0.705)
33 112.93 7.76 46.55 -38.79 (0.193)
121.68 11.98 43.90 -31.91 (0.280)
1995 49 91.37 57.22 61.21 -3.99 (0.905)
92.48 -0.71 -1.61 0.90 (0.952)
31 80.45 63.38 40.14 23.23 (0.430)
65.57 29.84 48.89 -19.05 (0.656)
1996 56 85.62 2.46 10.88 -8.42 (0.544)
86.98 16.62 32.38 -15.76 (0.341)
35 92.40 44.83 96.95 -52.12 (0.266)
134.12 -8.83 37.02 -45.85 (0.041)
1997 35 91.80 107.96 57.16 50.80 (0.424)
190.58 135.11 126.26 8.85 (0.913)
41 91.47 29.27 67.06 -37.79 (0.269)
142.16 41.36 72.79 -31.43 (0.338)
Total 531 63.26 35.28 52.91 -17.62 (0.031)
71.08 31.86 47.55 -15.69 (0.014)
245 65.73 35.33 54.94 -19.62 (0.104)
125.26 17.86 19.48 -1.62 (0.834)
p-values are in the parenthesis.
54
Table 7 Three Year Buy-and Hold Abnormal Return prior to and after SEO by Size
(Using Size/Book-to-Market Matched portfolios)
For each year, we rank all firms from the LSPD that have market capitalization in the end of the previous calendar year in the LSPD and book-to-market ratio in the end of the previous fiscal year in the Worldscope database. We exclude the firms in the size/book-to-market sorting that have issuances within the previous 3 years to avoid benchmark bias. We then allocate all firms into a 5×5 grid and calculate the 25 value-weighted portfolio returns each month. We match event firm to the portfolio with similar size/book-to-market characteristics. The pre-event 3-year BHRs for event firms are calculated until the month prior to the SEO announcements. The long-run post-event BHRs for event and matching firms are calculated starting from the month following the SEO announcements for 3 years (36 months). The long-run abnormal performance is measured using traditional BHAR. The BHAR for firm i
over the period of T1 and T2, the following formula is used: ∏∏==
+−+=2
1
2
1
)1()1( ,,,
T
Tttb
T
Tttiti RRBHAR where Ri,t is the total return of the sample firm in event month t, Rb,t is the total return of the
benchmark over the same period. The equal-weighted BHARs and the value-weighted BHARs according to the market capitalization of the corresponding event firm are in %.
Rights Issues Placings Equal-Weighted Value-Weighted Equal-Weighted Value-Weighted No. Firm
Pre-Event BHR
Event BHR
Match BHR
BHAR Pre-Event BHR
Event BHR
Match BHR
BHAR No. Firm
Pre-Event BHR
Event BHR
Match BHR
BHAR Pre-Event BHR
Event BHR
Match BHR
BHAR
Size 1 67 -4.30 35.99 78.65 -42.66 (0.057)
-12.13 22.10 66.58 -44.49 (0.023)
73 6.30 61.20 69.12 -7.92 (0.790)
23.42 64.03 65.38 -1.35 (1.000)
Size 2 93 55.01 65.87 47.24 18.63 (0.352)
81.23 58.17 43.39 14.77 (0.434)
72 92.76 15.66 43.21 -27.55 (0.085)
114.84 12.46 43.60 -31.13 (0.054)
Size 3 111 86.28 27.13 44.97 -17.84 (0.191)
89.61 22.58 38.47 -15.89 (0.242)
57 127.26 32.95 35.42 -2.47 (0.906)
150.97 24.29 31.00 -6.71 (0.709)
Size 4 173 86.27 12.47 44.18 -31.71 (0.000)
91.17 15.61 43.82 -28.22 (0.000)
40 118.86 43.39 46.46 -3.08 (0.815)
127.17 36.30 46.19 -9.89 (0.403)
Size 5 118 76.29 40.66 54.82 -14.16 (0.342)
78.95 34.32 53.24 -18.92 (0.282)
10 100.38 7.13 40.34 -33.21 (0.083)
135.01 0.01 40.75 -40.75 (0.009)
Total 562 68.21 32.92 51.18 -18.26 (0.017)
81.12 31.15 51.07 -19.92 (0.006)
252 79.96 36.83 49.36 -12.53 (0.208)
131.01 16.36 41.75 -25.38 (0.000)
p-values, based on skewness-adjusted t-statistics, are in the parenthesis.

55
Table 8 Calendar-Time Portfolio Returns for SEOs using Fama-French 3-Factor Model (1989-1997)
We form the calendar-time portfolios for each month by including all firms that have SEOs within the last 3 years. We use the Fama-French 3-factor model: Rpt-Rft=ai+ßi(Rmt-Rft)+siSMBt+hiHMLt+eit, where Rpt is the monthly return on the equally-weighted or value-weighted calendar-time portfolio, Rft is the monthly return on one-month treasury bills, Rmt is the return on the value-weighted market portfolio, SMBt is the difference in the returns of the portfolios of small stocks and big stocks and HMLt is the difference in the returns of the portfolios of high book-to-market stocks and low book-to-market stocks. Panel A includes all firms in the market that have data to form the Fama-French factors, while Panel B excludes event firms within the previous 3 years when constructing the Fama-French factors.
Panel A Non-Purged Factors
Rights Issues Placings Equal-Weighted Value-Weighted Equal-Weighted Value-Weighted
Intercept
-0.0027 (0.185) -0.0009 (0.734) -0.0015 (0.594) -0.0035 (0.164)
RMRF
1.1961(0.000)+++ 1.1367 (0.000)+++ 1.2160 (0.000)+++ 1.1207 (0.000)+++
SMB
1.0304(0.000)+++ 0.4893 (0.000)+++ 1.1622 (0.000)+++ 0.6923 (0.000)+++
HML
0.0567 (0.593) -0.3760 (0.015)++ -0.2377 (0.100) -0.3036 (0.021)++
Adjusted R2
83.65 67.27 75.47 72.40
Panel B Purged Factors
Rights Issues Placings Equal-Weighted Value-Weighted Equal-Weighted Value-Weighted
Intercept
-0.0038 (0.080)+ -0.0016 (0.585) -0.0019 (0.524) -0.0038 (0.141)
RMRF
1.2375 (0.000)+++ 1.1564 (0.000)+++ 1.2165 (0.000)+++ 1.1305 (0.000)+++
SMB
1.0500 (0.000)+++ 0.5285 (0.000)+++ 1.1664 (0.000)+++ 0.7079 (0.000)+++
HML
0.0970 (0.406) -0.2842 (0.072) + -0.1707 (0.288) -0.2546 (0.074)+
Adjusted R2
81.59 64.67 72.28 70.48
* p-values are in the parenthesis. +++denotes 1% significant level, ++denotes 5% significant level and +denotes 10% significant level.

56
Table 9 Calendar-Time Portfolio Returns for SEOs using Carhart’s (1997) 4-Factor Model (1989-1997)
We form the calendar-time portfolios for each month by including all firms that have SEOs within the last 3 years. We use the Carhart’s (1997) 4-factor model: Rpt-Rft=ai+ßi(Rmt-Rft)+siSMBt+hiHMLt+piPR12t+eit, where Rpt is the monthly return on the equally-weighted or value-weighted calendar-time portfolio, Rft is the monthly return on one-month treasury bills, Rmt is the return on the value-weighted market portfolio, SMBt is the difference in the returns of the portfolios of small stocks and big stocks, HMLt is the difference in the returns of the portfolios of high book-to-market stocks and low book-to-market stocks and PR12t is the difference in the return of the portfolio of winners and losers. Panel A includes all firms in the market that have data to form the 4 factors, while Panel B excludes event firms within the previous 3 years when constructing the 4 factors.
Panel A Non-Purged Factors
Rights Issues Placings Equal-Weighted Value-Weighted Equal-Weighted Value-Weighted
Intercept
-0.0016 (0.492) -0.0043 (0.159) -0.0036 (0.233) -0.0070 (0.010) ++
RMRF
1.1721 (0.000)+++ 1.2086 (0.000)+++ 1.2625 (0.000)+++ 1.1967 (0.000)+++
SMB
0.9922 (0.000)+++ 0.6039 (0.000)+++ 1.2363 (0.000)+++ 0.8136 (0.000)+++
HML
-0.0031 (0.980) -0.1785 (0.269) -0.1219 (0.449) -0.1141 (0.424)
PR12 -0.1054 (0.273)
0.3161 (0.016) ++ 0.2044 (0.116) 0.3343 (0.004) +++
Adjusted R2
83.68 68.50 75.76 73.93
Panel B Purged Factors
Rights Issues Placings Equal-Weighted Value-Weighted Equal-Weighted Value-Weighted
Intercept
-0.0028 (0.238) -0.0050 (0.123) -0.0056 (0.077)+ -0.0080 (0.004)+++
RMRF
1.2187 (0.000)+++ 1.2261 (0.000)+++ 1.3053 (0.000)+++ 1.2201 (0.000)+++
SMB
1.0196 (0.000)+++ 0.6410 (0.000)+++ 1.2890 (0.000)+++ 0.8473 (0.000)+++
HML
0.0510 (0.694) -0.1138 (0.507) 0.0276 (0.872) -0.0293 (0.843)
PR12
-0.0861 (0.412)
0.3190 (0.023) ++ 0.3616 (0.005) +++ 0.4110 (0.000)+++
Adjusted R2
81.54 65.82 73.72 73.19
* p-values are in the parenthesis. +++denotes 1% significant level, ++denotes 5% significant level and +denotes 10% significant level.
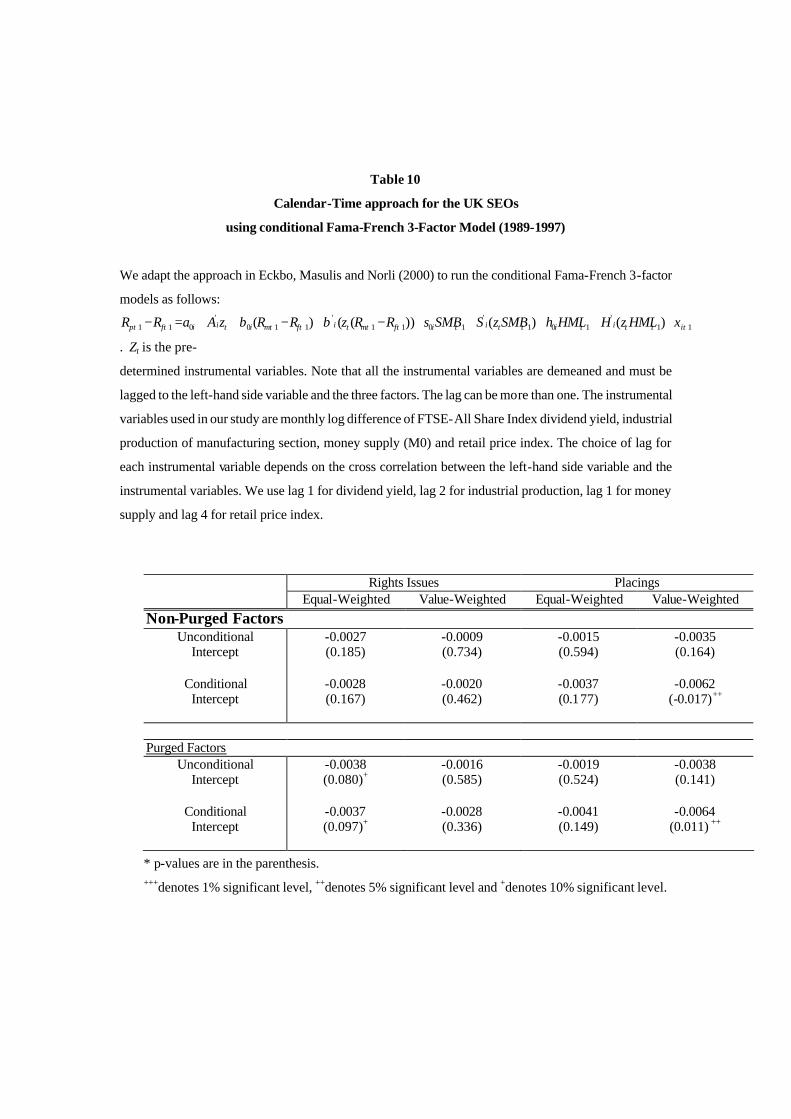
Table 10
Calendar-Time approach for the UK SEOs
using conditional Fama-French 3-Factor Model (1989-1997)
We adapt the approach in Eckbo, Masulis and Norli (2000) to run the conditional Fama-French 3-factor
models as follows:
11'
101'
1011'
110'
011 )()())(()( +++++++++++ +++++−+−++=− itttitittitiftmttiftmtitiiftpt HMLzHHMLhSMBzSSMBsRRzRRzAaRR ξββ
. Zt is the pre-
determined instrumental variables. Note that all the instrumental variables are demeaned and must be
lagged to the left-hand side variable and the three factors. The lag can be more than one. The instrumental
variables used in our study are monthly log difference of FTSE-All Share Index dividend yield, industrial
production of manufacturing section, money supply (M0) and retail price index. The choice of lag for
each instrumental variable depends on the cross correlation between the left-hand side variable and the
instrumental variables. We use lag 1 for dividend yield, lag 2 for industrial production, lag 1 for money
supply and lag 4 for retail price index.
Rights Issues Placings Equal-Weighted Value-Weighted Equal-Weighted Value-Weighted
Non-Purged Factors Unconditional
Intercept -0.0027 (0.185)
-0.0009 (0.734)
-0.0015 (0.594)
-0.0035 (0.164)
Conditional
Intercept -0.0028 (0.167)
-0.0020 (0.462)
-0.0037 (0.177)
-0.0062 (-0.017)++
Purged Factors Unconditional
Intercept -0.0038 (0.080)+
-0.0016 (0.585)
-0.0019 (0.524)
-0.0038 (0.141)
Conditional
Intercept -0.0037 (0.097)+
-0.0028 (0.336)
-0.0041 (0.149)
-0.0064 (0.011) ++
* p-values are in the parenthesis. +++denotes 1% significant level, ++denotes 5% significant level and +denotes 10% significant level.