Embed Size (px)
Citation preview

Electronic copy available at: http://ssrn.com/abstract=2683314
Saïd Business School
Research Papers
Saïd Business School RP 2015-19
The Saïd Business School’s working paper series aims to provide early access to high-quality and rigorous academic research. Oxford Saïd’s working papers reflect a commitment to excellence, and an interdisciplinary scope that is appropriate to a business school embedded in one of the world’s major research universities.. This paper is authorised or co-authored by Oxford Saïd faculty. It is circulated for comment and discussion only. Contents should be considered preliminary, and are not to be quoted or reproduced without the author’s permission.
Is It What You Say or How You Say It? How Content Characteristics Affect Consumer
Engagement with Brands on Facebook
Andrew T. Stephen Saïd Business School, University of Oxford
Michael R. Sciandra Dolan School of Business, Fairfield University
J. Jeffrey Inman Joseph M Katz Graduate School of Business, University of Pittsburgh
October 2015

Electronic copy available at: http://ssrn.com/abstract=2683314
1
Is It What You Say or How You Say It? How Content Characteristics Affect Consumer
Engagement with Brands on Facebook
ANDREW T. STEPHEN
MICHAEL R. SCIANDRA
J. JEFFREY INMAN

Electronic copy available at: http://ssrn.com/abstract=2683314
2
Andrew T. Stephen is the L’Oréal Professor of Marketing, Saïd Business School, University of
Oxford, Park End Street, Oxford OX1 1HP, United Kingdom ([email protected]).
Michael R. Sciandra is an Assistant Professor of Marketing at the Dolan School of Business,
Fairfield University, Fairfield, CT 06824, United States ([email protected]). J. Jeffrey
Inman is the Albert Wesley Frey Professor of Marketing and Associate Dean for Research and
Faculty at the Joseph M. Katz Graduate School of Business, University of Pittsburgh, Mervis
Hall, Pittsburgh, PA 15260 ([email protected]). The authors thank the Marketing Science
Institute for generously supporting this research (grant #4-1847), and appreciate the feedback
received from seminar participants at Erasmus University, Southern Methodist University,
Temple University, Tilburg University, University of Connecticut, and VU University
Amsterdam.

3
Contribution Statement
This research shows how consumer engagement with brands in social media is affected
by various characteristics of the content that marketers create and disseminate on social media
platforms. We build on the limited prior literature on this topic by considering a broader set of
content characteristics (fourteen types), a more comprehensive set of social media engagement
behaviors reflecting meaningfully different types of engagement (six), and investigate the
response of different types of consumers. We use a novel dataset of brands’ Facebook posts over
18 months, covering nine different brands from four distinct industries, and find that many social
media content characteristics have little influence on consumer engagement with branded
content. The characteristics that are important are predominantly associated with how brands
communicate their messages with respect to a post’s persuasive elements (e.g., the extent to
which a branded Facebook post feels like an advertisement, and how clear the communicated
message is). Interestingly, however, persuasive elements result in less engagement. Our findings
suggest that branded content that is less like advertising is more likely to engage members of a
brands’ social media audience. Thus, core principles of traditional advertising may not apply in
social media, at least not directly. In general, this research advances our understanding of how
consumers process and interact with brands in social media.

4
Abstract
The popularity of social media has led to many brands using platforms such as Facebook
for marketing communications, typically whereby brands post content (text, images, and/or
videos) on their social media pages for their consumer “fans” to see and, hopefully, engage with.
Despite the widespread use of social media marketing, relatively little is known about how
various characteristics of branded social media content affect different types of consumer
engagement (e.g., liking, commenting, sharing) with brands on social media. The authors analyze
4,284 Facebook posts made by nine brands during an 18-month period. A theory-based typology
of fourteen content characteristics covering aspects of what brands say and how they say it is
developed and these are linked to different types of consumer engagement with brands’ posts.
Various drivers of engagement are found, with the most important being those associated with
persuasion. Contrary to traditional marketing communications, persuasive content characteristics
are found to lower engagement in the social media context. This research sheds light on how
consumers process and interact with branded content in social media, and has implications for
how marketers should design content to maximize consumer engagement with their brands.

5
The popularity of social media has led to many brands using platforms such as Facebook
for marketing communications. The most common approach typically involves brands designing
and then posting content (text, images, and/or videos) on their social media pages for their
consumer “fans” to see and, hopefully, interact with. This is often referred to as social media
content marketing, and has become a very common part of major brands’ media mixes (e.g.,
approximately 80% of Fortune 500 companies use Facebook for this purpose; Barnes and
Lescault 2014). Using content, marketers strive to pique the interest of consumers and engender
higher levels of consumer engagement with their brands. Increasing consumer engagement is
desirable because it is thought to be associated with positive consequences such as stronger
consumer-brand relationships and brand affinity, increased satisfaction and loyalty, and more
purchasing (e.g., Brodie, Ilic, Juric, and Hollebeek 2013; Calder, Malthouse, and Schaedel 2009;
van Doorn et al. 2010; Laroche, Habibi, and Richard 2013; Sprott, Czellar, and Spangenberg
2009). Additionally, due to the socially networked nature of social media platforms such as
Facebook and Twitter, encouraging consumers to share branded content with friends by clicking
“Share” or “Retweet” can help amplify marketing messages through word-of-mouth (WOM)
communications.
Despite the prevalence of branded content on major social media platforms such as
Facebook, Instagram, and Twitter, little is known about why consumers respond to some types of
content but not to others. For example, does content that possesses characteristics similar to those
present in traditional communications channels (e.g., persuasive and/or informative messages in
advertising) work well in social media? Or does the two-way, interactive, and informal nature of
social media require brands to rethink the types of content that will be effective in engaging
consumers in that channel? In this research we consider how various characteristics of the

6
content created and then disseminated by brands on social media are related to different types of
consumer engagement with brands, as indicated by standard social media metrics such as
“liking” a post, “commenting” on it, or “sharing” it with others. We are particularly interested in
whether what branded content says or how it is said plays a bigger role in driving consumer
engagement in this context. Specifically, we focus on understanding how different content
characteristics, all of which are under the control of marketers and include informative and
persuasive elements, influence consumer engagement with brands’ social media posts.
To address this, we develop a comprehensive typology of content characteristics for
branded social media posts and use it to classify a unique set of 4,284 branded Facebook posts
made over an 18-month period by nine brands from four distinct industries (consumer-packaged
goods, restaurants, retail, and sports), and with Facebook audiences at the time of data collection
ranging from approximately 130,000 to 30 million people. Using this post-level data, we
estimate the effects of the classified content characteristics on Facebook-provided metrics for
consumer engagement. Post-level engagement metrics are used as indicators of consumers’
attitudinal responses to content (e.g., positive responses indicated by “likes”) and meaningful
marketing outcomes triggered by content that are stronger and more volitional indicators of
underlying consumer-brand engagement and interest (e.g., website traffic referrals indicated by
“clicks” and WOM indicated by “shares”).
To preview our findings, we find that how—more than what—brands communicate to
consumers through Facebook posts influences consumer engagement in the form of consumers’
attitudinal responses (e.g., likes) as well as actions associated with meaningful marketing
outcomes (e.g., sharing, clicks). Persuasive characteristics of branded content are particularly
important. Interestingly, however, the presence of persuasive characteristics in posts tends to

7
decrease engagement, and messages conveyed in a less clear and less formal manner—which is
uncommon in traditional advertising—engender greater engagement. We argue that this is
because, on social media, brands tend to communicate mostly with consumers who are already
relatively highly interested in the brand because of the opt-in nature of following brands on
platforms such as Facebook (i.e., they chose to follow the brand and receive advertising-like
messages). Accordingly, content that is more informal and feels less like conventional marketing
communications may resonate more with this already-interested consumer type, which leads to
higher engagement. These findings contribute to the nascent literature on consumer behavior in
social media settings by developing a more comprehensive understanding of how different types
of content characteristics affect consumers’ engagement actions toward brands in social media.
Additionally, this research follows recent calls for more research on consumer responses to
social media marketing actions (Lamberton and Stephen 2015; Stephen 2016).
BACKGROUND AND CONCEPTUAL DEVELOPMENT
Prior Research on Content Effects in Marketing Communications
Which types of content—or content characteristics—influence if and how consumers
engage with brands on social media platforms such as Facebook? Prior research in the context of
social media platforms offers only a limited perspective on how different types of branded social
media content (i.e., content characteristics: what is said and how it is said) affect different forms
of consumers’ engagement behaviors in response to that content. Previous studies in the social
media marketing literature tend to consider limited, narrow sets of content characteristics and/or

8
engagement. However, two recent studies are important for the current research. First, De Vries,
Gensler, and Leeflang (2012) show how content vividness, interactivity, page position, and
valence affect the popularity of Facebook posts as measured by the numbers of likes and
comments received. Among other things, they find that vividness plays an important role in
affecting the two engagement behaviors they observed. Second, Lee, Hosanagar, and Nair (2015)
test how branded Facebook posts’ numbers of likes and comments are influenced by two
linguistic characteristics of the text of brands’ posts (informativeness and persuasiveness) that
are identified with machine learning techniques. They find that both general linguistic
characteristics matter. Their findings are limited, however, because they do not consider the non-
textual characteristics of posts—images and/or videos—that, following from De Vries et al.’s
(2012) vividness finding, should be relevant and important to consider (the presence or absence
of non-textual characteristics is instead merely controlled for).
Two other recent studies also warrant discussion in light of the current research. Kumar,
Bhaskaran, Mirchandani, and Shah (2013) discuss the importance of marketing messages in
social media campaigns, however they focus primarily on social influence-related factors in a
framework for measuring the value of social media marketing. They therefore do not closely
examine the role of various types of content or specific content characteristics with respect to
driving consumer engagement with brands in social media. Finally, although not in the context of
social media per se, Berger and Milkman (2012) consider how certain content characteristics are
associated with word-of-mouth sharing (i.e., one particular type of engagement with content).
This is considered in a different context to ours, however (newspaper articles published in the
New York Times). They show that the arousal generated by a newspaper article can be positively
associated with article sharing popularity measured by whether or not an article makes a “most

9
emailed” list. It is unclear, however, if this finding generalizes beyond news articles on a
newspaper’s website to our broader context of branded content on a social media platform where
consumers can engage with content in a variety of ways, not only by sharing via email.
Despite limited prior research on how marketers communicate with consumers in social
media, understanding marketers’ attempts to communicate with consumers through various
forms of content or messaging (including advertising) is a well-researched topic. The content of
a marketing communication, which refers to what is said and/or shown in a marketing message
and how the message is conveyed, has been linked to persuasion-related outcomes in prior work
(e.g., Frazier and Summers 1984; Mohr and Nevin 1990). Traditionally, researchers have taken
conventional marketing communications such as television commercials, classified them on
various dimensions, and then linked those dimensions or content characteristics to marketing
outcomes. For example, Resnik and Stern (1977) focused on the information contained in
advertising messages, specifically for television ads, and attempted to measure the informational
value of these messages using a typology of 14 types of “informational cues” that could be
present in a television ad. They found that only half of the 378 ads they assessed contained these
cues and were thus deemed to have some informational value. Hence, brands’ marketing
messages are not purely informational, and other characteristics therefore need to be considered.
If informational cues in the tradition of Resnik and Stern (1977) reflect what is conveyed
in branded content, then how it is said may be encapsulated by other dimensions related to
affective and tonal qualities of the communication. Prior research such as Olney, Holbrook, and
Batra (1991) and Singh and Cole (1993) studied how the emotional aspects of television ads (in
addition to informational cues) impact effectiveness and consumer engagement with the
advertising (e.g., Olney and colleagues test how ad content characteristics ultimately affect ad

10
viewing time as a measure of consumer attention). Similar work has been done for other types of
advertising media, such as print advertisements (e.g., Turley and Kelley 1997) and, more
recently, for digital advertising in both website display and mobile settings (e.g., Bart, Stephen,
and Sarvary 2014; Danaher, Smith, Ranasinghe, and Danaher 2015; Drossos et al. 2007;
Goldfarb and Tucker 2011; Lohtia, Donthu, and Hershberger 2003). In general, advertising
research outside the social media context finds that what is said (informational cues, calls to
action, specific claims) and how it is said (arousal-, emotion-, and persuasion-related elements)
both affect how consumers engage with advertising. Beyond this, research also links traditional
advertising message characteristics to consumers’ purchasing behaviors (e.g., Bertrand et al.
2010; Liaukonyte et al. 2014).
In sum, although research on social media content marketing by brands is scant, the
literature on advertising content and brand messaging in marketing communications provides a
useful foundation for the current research. We do not presume that advertising content effects on
consumer engagement with brands found for traditional media will be the same in social media.
However, the general set of findings indicating that marketing message characteristics—what is
said and how it is said—are important provides a basis for the current study. Additionally, classic
studies such as Resnick and Stern (1977) and Olney et al. (1991) provide an important
foundation because they consider branded content (in their case, television ads) as a bundle of
characteristics or dimensions. We adopt this perspective, and note that it is distinct from recent
related work such as Lee et al. (2015) that focuses on more abstract and general characterizations
of social media posts (e.g., informativeness and persuasiveness) determined by automated
machine learning algorithms instead of decomposing posts into their underlying attributes
according to a typology of branded social media content characteristics.

11
A Typology of Content Characteristics for Branded Content in Social Media
Our conceptual framework has two parts. First, in this section, we develop a typology of
content characteristics that we use for decomposing brands’ posts along various dimensions. We
draw these dimensions from prior research on advertising content and from reviewing brands’
social media (Facebook) posts to identify common recurring characteristics. Second, in the next
section, we argue how the content characteristics in this typology are related to consumer
engagement with branded content in social media.
Because of the flexibility afforded to marketers when designing branded social media
content for platforms such as Facebook, content can take on many forms and, thus, there are
many content characteristics that could be considered. As we mentioned earlier, the prior
research on social media marketing content is limited and only a small set of content
characteristics have been considered. For example, De Vries et al. (2012) consider factors such
as vividness and valence, and Lee et al. (2015) consider the general use of words associated with
informativeness and persuasiveness. Also, in related literature on social sharing, Berger (2011)
and Berger and Milkman (2012) consider arousal and emotionality related to content (or pieces
of information). Although these characteristics are relevant, they represent only a fraction of
what could be considered. A more comprehensive typology of content characteristics for branded
social media content is needed. Given that our empirical setting is branded posts on Facebook,
we focus primarily on Facebook but expect that our typology of content characteristics is
applicable to other social media channels where brands’ posts can have textual and/or visual
(images, videos) elements.

12
Some classic studies on advertising content provide a useful starting point for developing
our typology (e.g., Olney et al. 1991; Resnick and Stern 1977). Based on that stream of literature,
the recent work on social media content and social sharing, and our own observations of
hundreds of branded Facebook posts, we advance a typology of content characteristics that
considers six general categories, each with a set of more specific component characteristics (with
a total of 14 components across the six categories). Generally, our typology incorporates both
what is said in a branded post and how it is said. Thus, we include informational cues following
work such as Resnick and Stern (1977), as well as cues that are more emotion-based in line with
Olney et al. (1991) for television ads and Berger and Milkman (2012) for newspaper articles.
Additionally, since branded posts are marketing messages intended to persuade or influence
consumers, we also incorporate persuasion-related aspects. Persuasion-related aspects are
important because a key question of this research lies in determining whether branded content on
social media is effective in engaging consumers when messages are conveyed in a manner akin
to conventional marketing communications (e.g., persuasive advertising messaging); that is, we
assess whether the lack of certain hallmarks of persuasive marketing communications is better in
this context. We now describe the dimensions of our typology.
Arousal-oriented. This category refers to the extent to which branded content possesses
characteristics that may arouse positive affective responses from consumers. This includes
generating positive emotional reactions (Berger and Milkman 2012), having positive valence (De
Vries et al. 2012), or being humorous. We consider two components of arousal-oriented content:
(1) positivity (how positive the post’s tone is), and (2) humor (how funny or humorous the post
is). Note that it is also possible to consider negativity but for branded content it is unlikely that
managers would intentionally develop content intended to arouse negative emotions in

13
consumers. For this reason, we exclude it from this typology but acknowledge that it may have a
place in a broader typology for branded and non-branded social media content. In sum, arousal-
oriented characteristics relate to how a brand conveys its marketing messages to its social media
audiences through the use of linguistic and visual devices designed to positively arouse or
generate positive affect.
Persuasion-oriented. This category refers to the extent to which branded content
possesses characteristics that may persuade or influence consumers’ attitudes, opinions, or
behaviors. While using persuasive language has been considered in prior work (Lee et al. 2015),
our perspective is more specific and our typology includes three components related to the extent
to which content is persuasion oriented: (1) relevance, or how appropriate the content is to, and
fits with, the focal brand’s image, (2) message clarity, or how clear and fluent the post’s message
appears to be, and (3) advertising tone, or how much the post feels like or comes across as an
advertisement in the “traditional” sense of advertising. Conventional marketing communications
(e.g., traditional advertising) are typically designed to be high on each of these components.
Whether this works well for branded social media content, however, is unclear.
These components were selected because they are related to three key mechanisms
through which persuasive messages can affect consumers’ attitudes and/or behaviors: processing
motivation and processing ability from the elaboration likelihood literature (e.g., Petty and
Cacioppo 1979; Petty, Wells, and Brock 1976), and psychological reactance (Brehm 1966). First,
relevance is important because content that seems to be incongruent with the focal brand could
block information processing altogether (e.g., the message is ignored). This persuasion-oriented
dimension is related to processing motivation (Petty and Cacioppo 1979, 1981) in the sense that
messages that are apparently relevant to the associated brand likely engender higher processing

14
motivation in consumers, which could result in higher attention and thus a greater chance of
engagement actions taking place. Also, observations of branded Facebook posts suggests that
there is high variance in message-brand relevance, thus also making it a practically important
content characteristic.
Second, message clarity is important because in traditional advertising and marketing
communications, messages that are clearer or more fluent tend to be more persuasive (Lee and
Aaker 2004). This is related to processing ability (Petty et al. 1976; Petty and Cacioppo 1981)
because messages that are easier to read, interpret, or understand increase a consumer’s ability to
process them (particularly along the “central route” to persuasion in the elaboration likelihood
model) and thus require fewer cognitive resources for processing. On the other hand, less-clear
messages, while being harder to process, might motivate consumers to actively process them and
thus pay more attention (e.g., the point of the message is not immediately obvious so a consumer
is motivated to “figure it out”).
Additionally, whereas clear, easy-to-process marketing messages might be more
persuasive and influential in one-way communications channels (e.g., television advertising), in
newer two-way channels like social media where consumers interactively socialize with others,
less-clear messages from brands might, paradoxically, be better because they are more consistent
with the predominant style of communication taking place in the channel. In other words, to the
extent that social-interpersonal communication on social media comprises relatively less clear
and less polished messages than conventional marketing communication, it may be that clear
messages from brands on social media appear inconsistent with the conversational norms of
social media platforms. Thus, very clear messages from brands on social media platforms such as
Facebook might stand out as persuasive marketing messages, which could activate persuasion

15
knowledge (Friestad and Wright 1994) and possibly trigger a reactance-like response against the
message and brand (Brehm 1966; Fitzsimons and Lehmann 2004).
Finally, the extent to which a post has an “advertising tone” or feels like a traditional
advertisement is expected to be important for a similar reason. If a message comes across as
overtly persuasive in the sense that it feels (and/or looks) like a traditional advertisement it might
look out of place in the social media environment and violate the prevailing communication
norms in the social media context. As with clear messages (which tend to be found in
advertisements), content that feels like an ad or has an apparent “advertising tone” might activate
persuasion knowledge and lead to reactance against the brand.
Information. This category refers to the extent to which branded content possesses
characteristics associated with particular informational cues. Note that we focus on the presence
of specific types of information (e.g., price information, details about a promotional campaign, or
mentioning particular product attributes), similar to Resnick and Stern (1977), instead of a more
general assessment of how “informative” a piece of content may or may not be (which is
arguably less precise; cf. Lee et al. 2015). Prior work in advertising has considered very large
sets of informational cues. In our case, three relatively general marketing-related informational
components are considered: (1) product-related, or whether the post mentions product-related
information such as how a product can be used, its benefits, and whether it is new, (2) value-
related, or whether the post mentions value- or price-related information such as discounts or
coupons, and (3) brand-related, or whether the post mentions brand-related promotional
information such as general news about the brand or brand-related events. We note that in prior
advertising research the norm has been to consider larger numbers of very specific informational
cues (e.g., over ten informational cues are listed in Resnick and Stern’s exhibit 1). Our three

16
components subsume many of the more specific components in prior work, and, from a more
practical perspective, correspond to marketing mix elements (i.e., product, price, promotion).
Calls to action. The fourth category is calls to action. This refers to the extent to which
branded content explicitly encourages consumers to undertake specific engagement actions such
as “liking” a post, answering a question or leaving a comment, or following a link to a webpage.
Social media marketers often use calls to action in their attempts to increase their post-level
engagement metrics, and prior research has touched on certain types of calls to action by
considering how asking questions affects engagement (De Vries et al. 2012). Whether calls to
action are effective, however, is unclear. While asking consumers to take specific engagement
actions could lead to compliance (i.e., positive effects), it seems equally plausible that consumers
would instead either just ignore such calls or react against them. We consider two types of calls
to action: (1) calls to engage (whether the post directly solicits engagement by requesting likes,
comments, or shares, or by asking a question to be answered in the comment box), and (2) calls
to enter a competition (whether the post asks consumers to enter into a competition or
sweepstakes, which usually requires clicking a link to an external website). We consider calls to
enter a competition separately because it is sufficiently common in practice to treat it as such,
and, more importantly, because it requires more effort from consumers than the within-page calls
to engage such as simply clicking on the like button or answering a question in the comment box.
References. The fifth category is references. This captures whether branded content refers
to entities or events that are not central to the brand itself but are related to it in some way.
References are common in practice and have been linked to purchase attitudes (Dean 1999) and
memory (Johar and Pham 1999). We consider two types: (1) non-brand references (whether the
post mentions non-brand entities such as charities or sponsored sporting teams), and (2) holidays

17
(whether the post mentions a major holiday such as Thanksgiving or Christmas, or a pseudo-
holiday such as International Talk Like A Pirate Day). Conventional wisdom among social
media marketers is that references lift engagement because they allow brands to “piggyback” on
current topics or causes of which their audiences are already aware or thinking about, thus
making it more likely for audiences to pay attention to and engage with posts. Whether this logic
is correct, however, is questionable because non-brand references could also dilute or obfuscate a
post’s message, leading some consumers to find the message irrelevant or confusing.
Media elements. The final category is media elements. This refers to whether branded
content is comprised of only text or also includes other types of media such as images, videos,
and links to external webpages (Keller 2009; Venkatachari 2013). We consider two kinds of
media elements: (1) rich media (whether a post includes an image/photo or video), and (2) URLs
(whether a post includes one or more links to websites).
Linking Content Characteristics to Consumer Engagement with Branded Content
We now consider how the six categories of content characteristics in our typology are
related to consumer engagement with branded content in social media. Figure 1 provides an
overview of how we expect branded social media content characteristics to be related to various
post-level engagement actions taken by consumers. These actions are grouped into two sets:
those that reflect consumers’ attitudinal responses to content, and those that are more closely
aligned with meaningful marketing outcomes.

18
Figure 1: Conceptual Framework

19
Figure 1 shows two sets of variables that are expected to be affected by content
characteristics. Collectively, attitudinal responses and marketing outcomes in this framework are
“engagement” outcomes with respect to branded posts. Engagement with content is an oft-stated
objective for social media marketing (Dubois 2014; Hemley 2013; Leung 2014), and prior work
has considered subsets of the variables considered here (e.g., both De Vries et al. [2012] and Lee
et al. [2015] consider “likes” and “comments”). Conceptually, consumer-brand engagement in a
social media context has been conceptualized as a multidimensional construct reflecting
consumers’ brand-related cognitive, affective, and behavioral actions (Hollebeek, Glynn, and
Brodie 2014), with dimensions indicating various levels of intensity of consumers’ interactions
with brands (Vivek, Beatty, and Morgan 2012; Wang and Calder 2006).
Consistent with this perspective, we break engagement into multiple dimensions (and
indicators). We categorize these dimensions in the manner shown in Figure 1 because some
engagement actions taken by consumers in social media, particularly Facebook, are more
attitudinal in nature, whereas others are more meaningful, particularly for marketers. We
consider the measurable engagement actions taken by consumers in response to branded
Facebook posts (e.g., likes, comments, shares) to be indicators of underlying constructs,
attitudinal responses and marketing outcomes, which are posited to be consequences of
marketers’ content design decisions. We now discuss these consequences and how they are
related to observed post-level actions.
Consumers’ attitudinal responses to branded Facebook posts in general signal their
thoughts and feelings about the content, both in terms of what is specifically communicated in
the post, as well as more general concepts such as the associated brand. Attitudinal responses are
valenced; that is, they can be positive or negative. On Facebook, two marketer-observable

20
engagement metrics indicate, respectively, positive and negative attitudinal responses to content:
the number of times a post has been liked (Likes), and the number of times a post has received
negative feedback (Negatives). Although not as common as actions such as liking, Facebook
users can mark a post as negative. Some users treat this as a way to “dislike” posts or signal a
“thumbs down” reaction. On other social media platforms, related measures include the number
of times a post has been “favorited” (e.g., Twitter), “loved” (e.g., Instagram), or “thumbed up” or
“thumbed down” (e.g., Reddit). We posit that attitudinal responses occur in reaction to branded
content, and in turn can influence other types of post-level engagement that we consider to be
indicators of actual marketing outcomes.
An issue with attitudinal responses such as likes and negatives is that they convey only a
small amount of information about what a consumer thinks. This is because it is very easy to
click “like” on a post and it is thus a fairly low-level form of engagement. A number of other
measurable engagement actions, however, are relatively less easy for consumers to take and also
represent outcomes of interest to marketers. We consider four such outcomes. First, brand
exposure, which is indicated by a post’s total audience size (Reach). Second, feedback, which is
indicated by the number of comments received by a post (Comments). Third, WOM, which is
indicated by the number of times a post is shared with other people on Facebook (Shares).
Finally, website traffic referrals, which is indicated by the number of times posts (including
embedded links) are clicked on (Clicks).
We allow for the possibility that each of these outcomes could be influenced indirectly by
content characteristics through consumers’ attitudinal responses. Specifically, we argue that if
content prompts consumers to take an action of interest to marketers such as spreading WOM or
visiting a website, the content first will induce changes in consumers’ attitudes. That is, at a
21
conceptual level we hypothesize that marketers’ content characteristic decisions influence
marketer-desired behaviors (i.e., marketing outcomes) through consumers’ attitudinal responses.
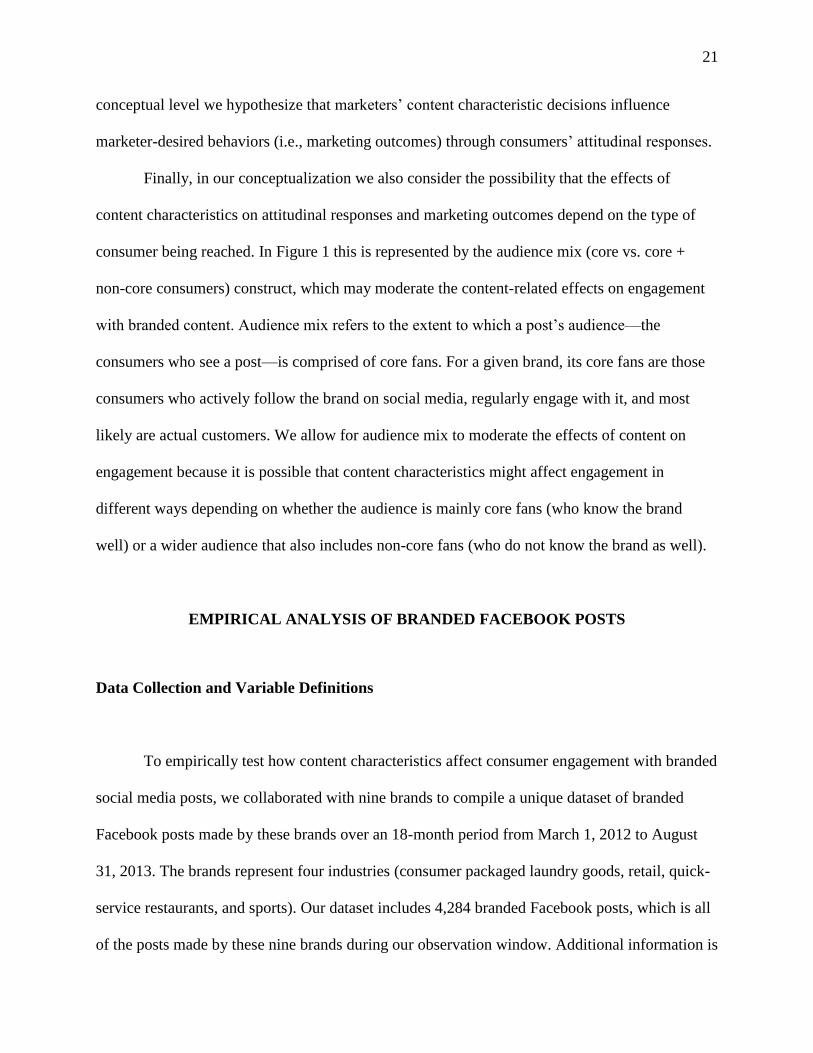
Finally, in our conceptualization we also consider the possibility that the effects of
content characteristics on attitudinal responses and marketing outcomes depend on the type of
consumer being reached. In Figure 1 this is represented by the audience mix (core vs. core +
non-core consumers) construct, which may moderate the content-related effects on engagement
with branded content. Audience mix refers to the extent to which a post’s audience—the
consumers who see a post—is comprised of core fans. For a given brand, its core fans are those
consumers who actively follow the brand on social media, regularly engage with it, and most
likely are actual customers. We allow for audience mix to moderate the effects of content on
engagement because it is possible that content characteristics might affect engagement in
different ways depending on whether the audience is mainly core fans (who know the brand
well) or a wider audience that also includes non-core fans (who do not know the brand as well).
EMPIRICAL ANALYSIS OF BRANDED FACEBOOK POSTS
Data Collection and Variable Definitions
To empirically test how content characteristics affect consumer engagement with branded
social media posts, we collaborated with nine brands to compile a unique dataset of branded
Facebook posts made by these brands over an 18-month period from March 1, 2012 to August
31, 2013. The brands represent four industries (consumer packaged laundry goods, retail, quick-
service restaurants, and sports). Our dataset includes 4,284 branded Facebook posts, which is all
of the posts made by these nine brands during our observation window. Additional information is

22
given in Appendix A, however confidentiality agreements limit the information we can provide.
We now explain how each of the constructs in our conceptual framework were measured and the
data collection process for each one.
Post-level engagement and reach. Facebook provides brands with a detailed set of post-
level engagement and reach metrics through the “Facebook Insights” tool. We measure
attitudinal responses by the numbers of likes (unique users clicking “like” under a post; Likes)
and instances of negative feedback (unique users indicating they do not like a post; Negatives)
received for each post. Marketing outcomes are measured for each post as follows. First,
exposure is measured by a post’s total reach, which is the number of unique users that were
shown a post (Reach). Second, feedback is measured by the number of comments received
(unique users writing comments; Comments). Third, WOM is measured by the number of shares
received (unique users clicking “share” under a post; Shares). Finally, website traffic referrals is
measured by the number of clicks received (unique users clicking posts; Clicks).
Each of these measures is cumulative. This means that we do not have, for example, daily
measures for each of these variables, per post. Instead, we have the total counts for each of these
variables taken at the time the data were provided to us by the companies, which was a number
of months after the end data of our data-observation window. Thus, we assume that each
engagement or reach measure for each post is the “terminal” or final value of the underlying time
series; i.e., each one is the maximum cumulative level reached for that post. Facebook does not
provide time series data for post-level engagement and reach. Given that companies downloaded
this data some time after the observation window for posts closed, it is reasonable to assume that
our engagement and reach data represents the final levels of those variables achieved by each
post during its run on Facebook. Although brands rarely remove posts in order to stop them from

23
being seen in the future, Facebook’s algorithms heavily prioritize recently posted content, and
therefore the likelihood of a user being served older posts decreases with the time since posting.
Audience mix. As mentioned above, we use a post’s reach as a measure of the marketing
outcome of brand exposure. Facebook also decomposes the total reach metric into three
components based on how people were reached (total reach = paid + organic + viral), which we
use to measure audience mix (core vs. core + non-core fans). Paid reach is the number of unique
users who saw a post because the brand paid to increase or “boost” the post’s reach. Organic
reach is the number of unique users who saw a post because Facebook’s EdgeRank algorithm
showed them the post based on their recent engagement (i.e., they have recently engaged with
the brand on Facebook, and probably are fans of the brand’s page). Viral reach is the number of
unique users who saw a post because one of their “friends” engaged with that post by liking it,
commenting on it, or sharing it. We use this decomposition of total reach, particularly paid reach,
to construct a measure of audience mix. Paid reach is a direct consequence of a marketer’s
“boosting” decision (i.e., paying to increase reach) and is thus related to content dissemination
with respect to audience mix (narrower vs. wider).
The audience mix for brand i’s jth
post is equal to the proportion of a post’s total reach
that is due to boosting (i.e., paid): AudienceMixij = PaidReachij / TotalReachij. Paid reach is
greater than zero only when a post is boosted, meaning that when a post is not boosted,
AudienceMix = 0 and the post’s audience is likely mostly be core fans who are organically
reached (due to EdgeRank). We note that viral reach is also possible in the absence of paid
boosting, meaning that some non-core consumers will also be reached when AudienceMix = 0,
but, at least in our data, viral reach is very small relative to organic reach. Lower values of

24
AudienceMix (closer to 0) indicate a narrower audience of mostly core consumers, and higher
values (closer to 1) indicate a wider audience that includes non-core consumers.
Given that more precise measures for the composition of a post’s audience are not
revealed to marketers by Facebook and are unavailable through third-party sources (e.g.,
analytics agencies), this measure is the best available indicator of audience mix. Note that an
alternative measure would be a dummy variable indicating if a post was boosted (paid reach > 0)
or not (paid reach = 0). Although possible, this would not account for the extent of boosting,
which increases with increasing paid reach relative to total reach, and is a direct consequence of
how much money a manager wishes to spend on post boosting (which is not revealed in data
provided by these companies).
Content characteristics. The fourteen content characteristics defined earlier were
measured for each post using a comprehensive content-coding undertaking involving human
judges (as opposed to, for example, machine learning algorithms). Multiple human judges
assessed each post and used a coding instrument with items designed to measure each specific
content characteristic. This procedure had two stages.
The first stage involved developing the coding instrument. This was an iterative process
in which we tested and retested question items for measuring each content characteristic. Our
goal was to develop valid and reliable measures, while at the same time minimizing the length of
the coding instrument as much as possible given the relatively large number of specific
characteristics that judges needed to assess. To begin, we looked at a series of branded Facebook
posts from major brands (some of which were in our dataset) in order to develop a list of
potential content characteristics. We then refined this list with assistance from a group of
marketing doctoral students who were heavy Facebook users. Following this, we constructed

25
items to measure each characteristic on the refined list and tested this preliminary coding
instrument on judges recruited from Amazon Mechanical Turk, who were shown 30 randomly
selected posts from our dataset. Five judges coded each post and provided feedback on the
instrument. Items with low inter-judge reliability were carefully scrutinized and either refined or
replaced. Following this, we randomly selected another 30 posts and had three undergraduate
research assistants code the posts using the updated instrument. The research assistants coded the
posts independently and then met together with the authors to provide feedback. This identified
redundant items that could be dropped and ambiguous items that required rewording or clearer
instructions. At the conclusion of this process, we arrived at a final coding instrument that was
then used in the second stage of this process for coding all posts, which resulted in the content
characteristics data used in our analysis.
The list of variables for each content characteristic is shown in Table 1. Through the
coding instrument, 38 variables were measured (note that some extra measures were captured but
not used because those characteristics turned out to be very uncommon). We collapsed these into
the 14 variables in Table 1. For the perceptual items measured on five-point scales (e.g., the
extent to which a post feels like an advertisement), when the characteristic had multiple items we
collapsed these into a single item by averaging (scale reliabilities were high; see Table 1). For
items measured on binary (0/1) scales (e.g., whether or not a post mentioned a charity as an
indicator of non-brand references), we grouped the component items and collapsed them into
single binary items that took on a value of 1 if at least one of the underlying components was
present in the post, and 0 if none of the underlying components were present (as a robustness
check, we also tested an alternative specification averaging the multiple binary items and found
no differences in our findings).

26
Table 1: Content Characteristics Used in Analysis
Variable Description Measurement Mean
(St. Dev.)
Arousal-oriented
Positivity Post is perceived as positive 6 items, 1-5,
averaged, .91
3.24
(.52)
Humorous Post is perceived as humorous/funny 1 item, 1-5 2.21
(.66)
Persuasion-oriented
Relevance Post is perceived as being relevant to the brand 4 items, 1-5,
averaged, .98
4.05
(.60)
ClearMessage Post is perceived as having a clear message 2 items, 1-5,
averaged, r = .87
4.17
(.40)
AdvertisingTone Post is perceived as feeling like an advertisement 1 item, 1-5 3.66
(.87)
Information
Product Post mentions product-related information, including
uses (how or when), benefits, and new products or
extensions
4 items, 0/1 .16
(.37)
Value Post mentions value-related information, including
pricing and discounts/coupons
2 items, 0/1 .08
(.27)
Brand Post mentions news about the brand that promotes
the brand in general and/or promotes brand-related
events
2 items, 0/1 .39
(.49)
Calls to Action
Engage Post asks for engagement, including by asking a
question or requesting
likes/comments/shares/clicks/photos
5 items, 0/1 .38
(.49)
Competition Post asks for entry into competition
(contests/sweepstakes or giveaways)
2 items, 0/1 .09
(.28)
References
NonbrandRefs Post refers to non-brand entities, such as mentioning
sponsorships or promoting/mentioning charities
3 items, 0/1 .09
(.29)
Holiday Post refers to a major or minor holiday (Christmas,
etc.)
2 item, 0/1 .12
(.33)
Media elements
RichMedia Post includes either an image or a video 3 items, 0/1 .66
(.47)
URLs Post includes one or more links (URLs) to websites
outside of Facebook
1 item, 0/1 .39
(.17)

27
The second stage used human judges to assess each post using the coding instrument. A
combination of eleven undergraduate research assistants and thousands of members of Amazon
Mechanical Turk handled this workload. Each post was coded by between two and five judges
(M = 3.04, SD = .52). For any given post, if two judges completely agreed on the binary items
(e.g., Does this post include a photo?) or inter-judge reliability () was greater than .70 for the
interval-scaled items, we used only those two judges. If not, we added a third judge and in the
vast majority of cases this resulted in sufficiently high levels of inter-judge agreement and
reliability. In a small number of cases this did not, and we therefore added a fourth or (if needed)
fifth judge. This incremental approach was taken for practical reasons; that is, we had a large
number of posts to code, coding was costly, and we therefore wanted to use only the necessary
number of judges for each post. To assess inter-judge reliability, we used Fleiss’ Kappa for
binary-scaled items (Fleiss 2003; Fleiss, Nee, and Landis 1979; Landis and Koch 1977) and
Cronbach’s Alpha for interval-scaled items. The average reliability across posts was good for the
binary-scaled items (M = .601, SD = .237) and very good for the interval-scaled items (M = .917,
SD = .048). For the binary items, when there was disagreement we used the majority opinion
among the judges. For scale items, we averaged judges’ scores.
Empirical Considerations and Model Specification
Modeling considerations. Our modeling effort focuses on testing the conceptual
framework in Figure 1. Our goal is to estimate effects of content characteristics on attitudinal
responses (Likes, Negatives) and marketing outcomes (Reach, Comments, Shares, Clicks), the
effects of each attitudinal response on each marketing outcome, and audience mix interactions.

28
However, this cannot be achieved by estimating a set of basic regression models due to factors
related to data characteristics and the possible underlying data-generation processes. The
following five considerations are therefore accommodated in our empirical modeling approach.
First, the six dependent variables are counts with large variances (see descriptive
statistics reported in Table 2). The ranges of the data and extreme values make the use of count
distributions (e.g., Poisson, negative binomial) less appropriate. Instead, we use logarithmic
transformations of these variables in our analysis. Specifically, for dependent variable y, the
transformation is log(1 + y) where 1 is added to prevent taking logs of 0.
Table 2: Engagement and Reach Descriptive Statistics
Variable Mean St. Dev. Median Minimum Maximum
Engagement:
Likes 2,752.63 11,134.07 122.00 0 314,112
Negatives 270.29 1,369.24 10.00 0 37,248
Comments 205.37 945.48 26.00 0 24,378
Shares 139.15 864.09 6.00 0 32,896
Clicks 200.26 1,520.62 2.00 0 39,066
Reach:
Total 486,510.11 2,620,272.46 24,011.00 1 49,874,776
Organic 140,466.75 369,632.71 21,615.50 0 6,560,693
Paid 340,273.53 2,492,608.58 0.00 0 49,214,580
Viral 5,769.83 57,430.64 94.50 0 1,444,352
Second, the dependent variables are likely to be interdependent, i.e., correlated. Thus, we
model them jointly in a system-of-equations multivariate model. Interdependence among them
not directly captured by effects specified in the model is captured through correlated errors.
Third, because of Facebook’s EdgeRank algorithm, we need to control for effects of
previous posts’ outcomes on current posts. Facebook does not reveal the details of how
EdgeRank works, but it is known that the engagement and reach a brand receives for previous

29
posts can affect the reach and engagement of subsequent posts. We accommodate this with state-
dependent effects; i.e., each equation includes lags of all dependent variables.
Fourth, a brand’s social media marketing prowess or the ability and expertise of its social
media marketing team plausibly could affect the dependent variables. This is because these
outcomes are influenced by marketers’ content design and dissemination decisions, which are
likely to be functions of marketer (or overall brand) expertise, at least to some extent. We treat
this as brand-level unobserved heterogeneity and assume that it is correlated with the content-
related variables. Brand fixed effects are used to help control for this possible relationship. Note
that the typical alternative to fixed effects when modeling panel data, random effects, would not
help because brand random effects would be uncorrelated with content variables in the model.
Finally, the content variables could be endogenous. Brand fixed effects help address this
to the extent that endogeneity could come from marketers’ decisions being correlated with latent
marketer expertise. However, brand fixed effects cannot handle endogeneity due to marketers’
decisions being driven by other unobserved factors. In particular, we expect that marketers’
decisions will be functions of what they have previously done (e.g., using a consistent style or
switching styles frequently due, for instance, learning attempts). Note that we are not suggesting
that the content-related decisions made by marketers should be modeled as a formal learning
process (cf. Erdem and Keane 1996). That would be an overly strong claim about how marketers
develop branded social media content. Although little is systematically known regarding these
processes, anecdotal evidence from our conversations with some brands’ social media managers
suggests that a formal learning model would be inappropriate. Instead, managers try many
approaches and test out new ideas without much structure, and they sometimes repeat previously
used approaches due to beliefs—often unfounded—in their effectiveness. Because of this, we

30
assume that there is some carryover from post to post, and therefore the content variables could
be correlated with lagged content variables. To accommodate this we adopt a two-stage
procedure based on Petrin and Train’s (2010) control function method for handling endogeneity
that has been recently used by Che, Chen, and Chen (2012) and Danaher et al. (2015).
Additionally, as Danaher et al. (2015) note, this approach is related to the residual-based
approach used by Stephen and Toubia (2010). Details of this are described next.
Model specification: First-stage control functions. The first part of our model involves
estimating a set of control functions (i.e., first-stage regressions), one for each managerial
decision, that is, the content variables. We closely followed Danaher et al.’s (2015)
implementation of Petrin and Train’s (2010) control function method. Each control function is a
regression in which a content variable is regressed on its lag, the lags of all other content
variables, and, consistent with prior implementations of this approach and convention, the other
covariates that appeared in the response functions (see below). Lagged content variables are
similar to instruments in an instrumental variables model. They are conceptually valid because
prior and current content variables for the same brand are related, but it is implausible for prior
content-related decisions to be (direct) drivers of current-post dependent variables because
engaging with today’s post cannot logically be due to something seen in yesterday’s post. Thus,
for content variable xk,ij, where k indexes the content variables (from 1 to L), i indexes the brand
(from 1 to N) and j indexes the post (from 1 to Ji), the control function is:
(1) xk,ij =gk,0 + g k,lxl,ij-1
l=1
L
å + lk,mzm,ij
m=1
M
å +dk,ij
Where j -1 refers to the previous post made by brand i, zm,ij is the mth
(out of M) exogenous
covariates (control variables) used in the response functions, and δk,ij is the residual. For content

31
characteristics measured on 1-5 scales we used Tobit models with censoring below at 1 and
above at 5 to estimate Equation 1. For all other decision variables we used binary probit models
(for audience mix, which is continuous in [0,1], the model was binomial with a probit link).
The control functions partition each content variable into endogenous and exogenous
parts (Danaher et al. 2015). Both xk,ij and δk,ij are then entered as explanatory variables in the
response functions that represent the conceptual model to be tested and that are estimated in the
second stage of this procedure (see next section). For the binary-scaled endogenous content
variables, the predicted value used in the second-stage model is the predicted probability from a
binary probit model, following Petrin and Train (2010) and Danaher et al. (2015). The inclusion
of the residuals in the second-stage response functions means that each content variable’s effect
on the dependent variables is decomposed into exogenous and endogenous components (Danaher
et al. 2015). Excluding the first-stage control-function residuals in the second-stage response
function model means that these components are not decomposed, resulting in biased parameter
estimates for the effects of the various content characteristics on the multiple engagement
outcomes. Note that an alternative approach would be to replace content-related variables with
predicted values from Equation 1 (e.g., similar to two-stage least squares). However, Terza,
Basu, and Rathouz (2008) show that the use of control residuals is superior, particularly in our
case where many of our endogenous content variables are binary.
Model specification: Second-stage response functions. The main part of our model
involves estimating the effects of the content variables on the six dependent variables, including
interactions between audience mix and content characteristics, as well as the mediating effects of
the two attitudinal response dependent variables on the four marketing outcomes. In this part of
the model we treat each dependent variable as a response variable, and we model the effects of

32
content characteristics and audience mix, as well as other control variables and the residuals
from the first-stage control functions, on each response for brand i’s jth
post as follows:
(2) log(Y*
ij +1) =A0 + A1,i
i=1
N-1
å +A2 log(Y*
ij +1)+A3 log(Y*
ij-1 +1)
+B1Xij +B2Wij +B3Zij +B4Dij + eij
(3) log(Yij +1) =log(Y*
ij +1) if log(Y*
ij +1) > 0
0 if log(Y*
ij +1) £ 0
ìíï
îï
Equations 2 and 3 are a fixed effects dynamic multivariate Tobit model. Yij = [Likesij,
Negativesij, Reachij Commentsij, Sharesij, Clicksij]’. 1 is a vector of ones. A0 are intercepts and
A1,j are brand fixed effects for N = 9 brands. A2 are effects of attitudinal responses on marketing
outcomes (i.e., effects of Likes and Negatives on Reach, Comments, Shares, and Clicks). A3 are
state-dependent effects of lagged dependent variables on themselves and each other. B1 are
effects of the decision variables Xij (content characteristics and audience mix) on the dependent
variables. B2 are interaction effects between audience mix and each content characteristic
(product terms Wij). B3 are effects of control variables Zij (logged inter-post time and month). B4
are effects of control function residuals (∆ij). Finally, eij ~ N(0,) and is a full error variance-
covariance matrix. We were concerned about multicollinearity given the many content variables,
but this was not a problem: the mean correlation among content variables is .04 (SD = .14; see
Appendix C), and variance inflation factors are small (M = 1.29, SD = .32, max. = 2.14).
Results
Model fit and selection. First, we consider a set of four nested models: (1) a baseline with
no effects of content characteristics or audience mix, (2) a version with only audience mix

33
effects, (3) a mediation model corresponding to our conceptual framework (Figure 1) where
managerial decisions affect attitudinal responses directly and marketing outcomes only indirectly
through attitudinal responses, and (4) a full model that is the same as the mediation model but
also allows for direct effects of managerial decisions on marketing outcomes. Fit statistics are
reported in Table 3.
We find that models 3 and 4 (i.e., with mediation/process) both fit well. Model 4 (full
model, allowing for direct and mediated content effects on marketing outcomes through
attitudinal responses) has slightly better fit, and thus we report those results. The superior fit of
model 4 over model 3 simply means that some of the effects of content characteristics on
marketing outcomes are only partially mediated by attitudinal responses. Additionally,
significant and relatively large error covariances (see Appendix D) support using a multivariate
model instead of estimating a model for each dependent variable separately.
Table 3: Models and Fit
Model Content Audience
Mix -2 LL AIC BIC
Pseudo
R2
Mean
Abs.
Error
Root
Mean Sq.
Error
1 Base model No No 74,590 74,836 75,618 .83 6.28 6.44
2 No content effects No Yes 71,552 71,822 72,680 .85 5.99 5.99
3 Mediation model Yes Yes 69,674 70,144 71,639 .86 5.62 3.67
4 Full model Yes Yes 68,652 69,398 71,771 .89 4.78 3.75
How do content characteristics affect attitudinal responses (Likes, Negatives)? We first
consider the effects of content characteristics on Likes and Negatives. Table 4 reports the
unstandardized parameters for effects on Likes and Negatives. Figure 2 shows spotlight analysis
plots of the standardized effects at narrow (AudienceMix = 0) and wide (AudienceMix = 1)

34
audiences (error bars are 95% confidence intervals). Several content characteristics significantly
affected Likes and Negatives, and audience mix moderated some of these effects.
Table 4: Effects of Content Characteristics and Audience Mix on Attitudinal Responses
Likes
Negatives
Est. SE
Est. SE
Arousal-
oriented
Positivity -.88 .77
1.92 .53 ***
Positivity x Mix .04 .22
-.02 .14
Humorous -2.89 .87 ***
-1.73 .54 ***
Humorous x Mix -.19 .16
.20 .10 **
Persuasion-
oriented
Relevance 7.05 1.87 ***
1.54 1.14
Relevance x Mix -.48 .30
-.15 .19
ClearMessage -9.42 2.09 ***
-4.25 1.24 ***
ClearMessage x Mix .62 .34 *
.23 .22
AdvertisingTone -2.68 .77 ***
-.09 .50
AdvertisingTone x Mix -.16 .20
.24 .13 *
Information Product 4.01 1.52 ***
1.55 1.02
Product x Mix .28 .23
-.09 .14
Value -2.54 1.21 **
-1.09 .81
Value x Mix .26 .29
-.17 .18
Brand 1.01 .58 *
-.80 .43 *
Brand x Mix -.41 .22 *
-.08 .14
Calls to
Action
Engage .35 .63
.79 .40 **
Engage x Mix .37 .23
-.30 .15 **
Competition -.90 .68
.89 .44 **
Competition x Mix .29 .27
-.25 .17
References NonbrandRefs 3.38 1.52 **
-1.01 1.04
NonbrandRefs x Mix -.04 .39
.21 .25
Holiday .40 .67
.16 .43
Holiday x Mix -.31 .44
-.12 .28
Media
Elements
RichMedia -.02 .70
-2.52 .51 ***
RichMedia x Mix .26 .26
.12 .17
URLs 2.78 .60 ***
2.50 .38 ***
URLs x Mix .70 .20 ***
.31 .12 **
Other
Variables
Mix .97 1.31 -1.50 .83 *
Lag log(Likes + 1) .32 .01 *** – – –
Lag log(Negatives + 1) – – – .39 .02 ***
log(Interpost Time) .18 .05 *** .13 .03 ***
Month -.04 .02 ** -.04 .01 ***

35
Likes
Negatives
Est. SE
Est. SE
Intercept 33.84 6.30 *** 12.78 3.78 ***
Brand 1 -1.84 .44 *** -.79 .27 ***
Brand 2 -1.81 .42 *** -.36 .27
Brand 3 -4.64 .81 *** -1.64 .51 ***
Brand 4 1.29 .49 *** 1.19 .32 ***
Brand 5 .08 .71 .83 .45 *
Brand 6 -6.06 1.19 *** -1.82 .74 **
Brand 7 -1.75 .45 *** -.65 .28 **
Brand 8 -3.79 .47 *** -.86 .30 ***
Control residuals Yes Yes
* p < .10, ** p < .05, *** p < .01. Audience mix (“Mix”) ranges from 0 to 1. For brand
fixed effects, Brand 9 is the reference brand.

36
Figure 2: Standardized Effects of Content Characteristics at Different Levels of Audience
Mix on Likes and Negatives
-3.00 -2.00 -1.00 .00 1.00 2.00 3.00
Positivity
Humorous
Relevance
ClearMessage
AdvertisingTone
Product
Value
Brand
Engage
Competition
NonbrandRefs
Holiday
Richmedia
URLs
AudienceMix = 0
AudienceMix = 1
-1.50 -1.00 -.50 .00 .50 1.00 1.50
Positivity
Humorous
Relevance
ClearMessage
AdvertisingTone
Product
Value
Brand
Engage
Competition
NonbrandRefs
Holiday
Richmedia
URLs
AudienceMix = 0
AudienceMix = 1
Positive Attitudinal Response (Likes)
Negative Attitudinal Response (Negatives)

37
With respect to positive attitudinal responses to content (Likes), based on effect sizes the
most important content characteristics are the three persuasion-related dimensions: relevance,
advertising tone, and message clarity. Relevance and message clarity were the strongest effects.
The relevance and advertising tone effects were as expected (positive and negative, respectively).
The more a post is perceived as relevant to the brand, the more Likes that post will receive
because it likely encourages consumers to process the information (whereas irrelevant posts are
probably just ignored). And, as we argued earlier, posts that have more of an “advertising feel”
receive fewer Likes, probably because it triggers some psychological reactance.
Arguably the most interesting persuasion-related effect here is the negative effect of
message clarity on Likes. Unlike branded messages in traditional advertising or conventional
marketing communications where high message clarity is important, it appears that the opposite
is true in this context. Lower message clarity—posts that are less clear, less fluent, less easily
understood—trigger more positive attitudinal responses. Why is this the case? Earlier we
mentioned that a negative effect of message clarity on any form of engagement is conceivable if
brands’ social media audiences prefer communications that are more consistent with the
social/conversational nature of the medium. In other words, messages that are not very clear or
not highly polished (i.e., lower message clarity) may be favored because they are more consistent
with the social communication norms on Facebook. This should be particularly the case among
those consumers who see a brand’s post who know the brand well, or who are relatively highly
involved with that brand in social media. These individuals—core fans—are more likely than
others to have a stronger relationship with the brand they follow and regularly engage with, and
thus their expectations may be higher with respect to a brand communicating with them in a less
formal, more conversational manner. Thus, we should expect audience mix to moderate the

38
effect of message clarity on Likes, such that the negative effect is stronger as the audience mix
gets narrower (i.e., mostly core fans). This was the case (albeit the interaction was only
marginally significant).
Other content characteristics also drive Likes. Regardless of audience mix, avoiding
humor helps, as does providing product-related information but not value- or price-related
information. Providing general brand-related information also helps, but only for narrow
audience mixes. Thus, while being informative can help increase favorable attitudes toward
content, it depends on the type of information and, to a lesser extent, the type of audience
reached. Finally, references to non-brand entities and including links to external websites
increase Likes (and the positive effect of URLs gets stronger with increasing audience mix).
For negative attitudinal responses, a number of the characteristics that increase Likes
(positive attitudes) also increase Negatives (negative attitudes). In particular, having less
message clarity also increases Negatives, as does including links to external websites. On the
other hand, including rich media, having humor in posts, and reducing the positivity of posts (or
using a more neutral tone) reduces Negatives. Consumers appear to be less likely to signal their
negative attitudes toward content when the content is interesting and arousing, although the type
of arousing tone used matters (i.e., less positive, more humorous), even though the difference
may be subtle. Finally, the often-used device of explicitly calling for engagement-related action
(e.g., “Please like this post”) increases Negatives, particularly when the audience is narrower.
Asking consumers to enter a competition also has a similar undesirable effect.
In sum, to generate favorable attitudinal responses (increasing Likes and decreasing
Negatives), content should be relevant to the brand but not come across as overt marketing
attempts in the persuasive style of, for example, traditional advertisements. Having lower

39
message clarity, in addition to making a post seem less overtly persuasive and instead more
conversational (and thus in line with the norms on Facebook), could also be effective because a
message that is not extremely easy to follow might draw consumers in and generate interest,
which is indicated by increased Likes (however, this will also increase Negatives, probably
because some consumers will be frustrated or annoyed). In terms of differences in content effects
due to changes in audience mix, it seems that narrower audience mixes of mostly core consumers
are slightly more sensitive to persuasive or “pushy” posts (e.g., indicated by the stronger effect of
engagement calls to action on Negatives at lower audience mix). This is consistent with our
argument that posts violating the social communication norms of Facebook are likely to lead to
less engagement, which should be most pronounced for core fans who “know” the brand well.
How do content characteristics affect marketing outcomes (Reach, Comments, Shares,
Clicks)? We now consider the effects of content characteristics on the four engagement-related
marketing outcomes: exposure (Reach), feedback (Comments), WOM (Shares), and website
traffic referrals (Clicks). Content characteristics could affect these directly, as well as indirectly
through attitudinal responses (Likes, Negatives). We report standardized total effects, where a
variable’s total effect is the sum of its direct and indirect effects (standard errors for the total
effects were computed using the delta method; e.g., Greene 2003). Table 5 reports the total
effects (see Appendix E for the direct effects on marketing outcomes). Figures 3 and 4 are
spotlight analysis plots of the standardized effects at narrow (AudienceMix = 0) and wide
(AudienceMix = 1) audiences (error bars are 95% confidence intervals). We found that a number
of content characteristics affected these marketing outcomes, directly and indirectly through
attitudinal responses. Also, the characteristics that have the strongest effects on these outcomes
tend to have their effects mediated by attitudinal responses.

40
Table 5: Standardized Total Effects of Content Characteristics and Audience Mix on Marketing Outcomes
Reach
Comments
Shares
Clicks
Est. SE
Est. SE
Est.
SE
Est.
SE
Arousal-
oriented
Positivity .25 .13 *
-.34 .21
-.03 .24 .56 .37
Positivity x Mix .08 .05
.02 .08
.04
.09
-.07
.13
Humorous -.57 .18 ***
-.40 .29
-.62 .34 * .99 .72
Humorous x Mix .09 .03 ***
-.02 .04
-.05 .05 -.03 .07
Persuasion-
oriented
Relevance 1.09 .34 ***
1.90 .56 ***
2.40
.66
***
-1.12
1.24
Relevance x Mix -.02 .09
-.30 .14 **
-.15
.16
-.26
.22
ClearMessage -1.10 .25 ***
-1.43 .43 ***
-2.32 .50 *** .17 .86
ClearMessage x Mix -.11 .10
.21 .16
.16
.19
.14
.26
AdvertisingTone -.55 .21 **
-1.07 .34 ***
-1.23
.39
***
.66
.75
AdvertisingTone x Mix .00 .06
.05 .09
.04 .11 .29 .15 *
Information Product .86 .19 ***
.45 .29
.44
.33
.65
.51
Product x Mix .01 .01 *
.02 .01
.00
.02
-.04
.02
*
Value .12 .11
-.45 .17 **
-.31
.20
-.49
.29
*
Value x Mix .01 .01
.01 .01
.02
.01
-.03
.02
Brand .03 .10
.41 .16 **
.39 .18 ** .12 .29
Brand x Mix -.02 .01 **
-.01 .01
-.01
.02
-.04
.02
Calls to Action Engage .07 .10
.38 .15 **
.19 .18 .46 .26 *
Engage x Mix -.03 .01 ***
-.01 .01
.00 .02 -.01 .02
Competition .05 .06
-.32 .10 ***
-.20 .11 * -.76 .17 ***
Competition x Mix .00 .01
.01 .01
.02
.02
-.03
.02
References NonbrandRefs .03 .15
.83 .23 ***
.85
.26
***
1.02
.40
**
NonbrandRefs x Mix .00 .01
.00 .01
.00
.01
-.01
.02
Holiday .07 .07
.01 .11
.01
.13
.29
.19
Holiday x Mix .00 .01
-.01 .01
-.01
.01
-.05
.02
**
Media
Elements
RichMedia .03 .12
-.15 .18
-.30 .21 -.54 .33
RichMedia x Mix .07 .02 ***
.06 .03 **
.20
.03
***
-.12
.05
**
URLs .44 .09 ***
.50 .15 ***
.54 .17 *** .16 .33
URLs x Mix .06 .01 ***
.09 .02 ***
.07 .02 *** -.03 .03
* p < .10, ** p < .05, *** p < .01. Total effect = direct effect + indirect effects through attitudinal responses. Standard errors computed using the delta method.

41
Figure 3: Standardized Total Effects of Content Characteristics at Different Levels of
Audience Mix on Reach and Comments
-4.00 -3.00 -2.00 -1.00 .00 1.00 2.00 3.00 4.00
Positivity
Humorous
Relevance
ClearMessage
AdvertisingTone
Product
Value
Brand
Engage
Competition
NonbrandRefs
Holiday
Richmedia
URLs
AudienceMix = 0
AudienceMix = 1
-2.00 -1.50 -1.00 -.50 .00 .50 1.00 1.50 2.00
Positivity
Humorous
Relevance
ClearMessage
AdvertisingTone
Product
Value
Brand
Engage
Competition
NonbrandRefs
Holiday
Richmedia
URLs
AudienceMix = 0
AudienceMix = 1
Exposure (Reach)
Feedback (Comments)

42
Figure 4: Standardized Total Effects of Content Characteristics at Different Levels of
Audience Mix on Shares and Clicks
-4.00 -3.00 -2.00 -1.00 .00 1.00 2.00 3.00 4.00
Positivity
Humorous
Relevance
ClearMessage
AdvertisingTone
Product
Value
Brand
Engage
Competition
NonbrandRefs
Holiday
Richmedia
URLs
AudienceMix = 0
AudienceMix = 1
-4.00 -3.00 -2.00 -1.00 .00 1.00 2.00 3.00 4.00
Positivity
Humorous
Relevance
ClearMessage
AdvertisingTone
Product
Value
Brand
Engage
Competition
NonbrandRefs
Holiday
Richmedia
URLs
AudienceMix = 0
AudienceMix = 1
Word of Mouth (Shares)
Website Traffic Referrals (Clicks)

43
Similar to our findings for positive attitudinal responses, the three persuasion-oriented
content characteristics have relatively strong effects on the majority of the marketing outcomes
(except for Clicks, which were largely unaffected by the many content characteristics tested). As
we saw for Likes, relevance of the message to the brand had a positive effect on Reach
(exposure), Comments (feedback), and Shares (WOM). Similarly, advertising tone and message
clarity both had negative effects on these three outcomes. Taken together with the findings
reported above for attitudinal responses, it appears that branded content on Facebook that
attempts to overly persuade consumers through the inclusion of certain hallmarks of traditional
advertising will not be effective in generating a variety of important consumer engagement
actions. As mentioned earlier, this could be because such content violates social communication
norms and is inconsistent with consumers’ expectations in that setting.
In addition to the effects of persuasion-oriented content characteristics, we find a number
of other interesting influences on marketing outcomes that should be highlighted. First,
information- and arousal-oriented content characteristics are important for increasing Reach.
Including product-related information increases Reach, but providing other types of information
(value- or brand-related) has no effect. Providing specific, concrete product information seems to
be important for generating exposure. In terms of arousal and Reach, using a positive tone
slightly increased Reach, and humor decreases Reach (although the negative effect is mitigated
by increasing audience mix, suggesting that non-core consumers are more forgiving when it
comes to brands’ attempts to be funny).
Second, information-oriented characteristics also influences the amount of feedback posts
received (Comments) and the tendency for consumers to spread WOM (Shares). However,
unlike for Reach, where more concrete and specific product-related information have a positive

44
effect, for Comments and Shares we find that the inclusion of more general brand-related
information lifts these two engagement behaviors. This suggests that consumers seem to be more
inclined to talk about—either through commenting on a post or spreading WOM to their
friends—branded content that is more general. Content that is more specific (product-related
information) seems to increase exposure but not these more involved forms of engagement. Also,
we find a negative effect of the inclusion of value-related information (e.g., about pricing) on
Comments. This is consistent with our earlier argument that violations of social communication
norms on Facebook results in less engagement, since talking about money or pricing is not
normally done in social contexts.
Finally, also consistent with this argument is the finding that calls to action affects the
amount of feedback (Comments) received by posts. On the negative front, encouraging
consumers to enter a competition has a negative effect on Comments. This is probably a
reactance-type response and is consistent with the notion that asking (or telling) people to do
something is not normal in social communications. On the positive front, however, it is normal to
ask questions and for people to answer those questions. In line with this, we find a positive effect
of asking for feedback (questions, comments) on Comments.
GENERAL DISCUSSION
Our research seeks to understand how characteristics of content posted by brands on
social media, specifically Facebook, affects various types of consumer engagement. Despite the
widespread use of social media marketing, and the growing body of literature on social media
marketing and consumer behavior, surprisingly little is known about how branded content affects

45
consumer behavior. From a substantive perspective, this is an important issue because social
media is a fast-growing marketing communications channel and consumers are increasingly
turning to social media platforms for not only social information (e.g., about friends’ lives) but
also news and brand information. Theoretically, we need a better understanding of consumer
engagement with brands in social media because of the central role brands play in many
consumers’ lives and the fact that social media is now where many consumer-brand interactions
occur. Specific to this research, it is theoretically interesting to identify the types of branded
content that are more effective at engendering consumer engagement, and to see if it is what
brands say (e.g., information characteristics) or how they say it (e.g., persuasion characteristics)
that impacts engagement the most. We find that it is how brands communicate with consumers in
social media that appears to be more influential in driving engagement behaviors.
More specifically, across engagement actions—attitudinal responses and marketing
outcomes (except Clicks)—we consistently find that the persuasion-oriented content
characteristics have relatively large effects. The findings about persuasion-oriented content
characteristics shed light on how consumers expect brands to communicate with them in social
media. Consumers appear to respond most favorably to content that is relevant to the brand (i.e.,
“on brand” or “on topic”), does not come across as an overt advertising-like persuasion attempt,
and that is not overly polished or fluent in terms of the clarity of the message being conveyed.
The positive relevance effect is not surprising, given that persuasion theory would suggest that
content that is relevant (i.e., “on brand” or “on topic”) should engender a higher level of
processing motivation. Similarly, the negative effect of advertising tone is consistent with our
arguments about persuasion knowledge and psychological reactance, and thus indicates that
branded content that departs from norms of social communication on Facebook and is instead

46
more like marketing communication tends to generate a variety of unfavorable engagement
responses from consumers.
This is also the case for the negative effect of message clarity on almost all engagement
actions considered here, which is a particularly interesting finding. A hallmark of conventional
persuasive marketing communications or traditional advertising is fairly clear, fluent, and easily
understood messages. Basically, advertising copy tries to convey information in a manner such
that it can be quickly and easily understood. This is not the same for social communications,
however. Instead, messages communicated between people often are not as polished or precise,
particularly in social settings, including those online (e.g., Facebook). Thus, our finding that
various types of consumer engagement with branded content increases when that content has
less message clarity suggests that messages that are more like social communications and less
like marketing communications are favored.
Combined with the negative effect of advertising tone, this suggests that the some of the
hallmarks of conventional marketing communications—persuasive advertising copy, specific
and clear messages—may not work well for brands in channels such as Facebook. Instead,
brands may be better off acting more like a social person and communicating to consumers on
social media in a less formal, less advertising-like style. Further evidence for this was found with
respect to the effects of certain types of “calls to action” on Comments. If a call to action in a
post was consistent with social communication norms, such as asking a question or asking for
consumers’ thoughts or ideas, the post received more Comments. On the other hand, if a call to
action was inconsistent with such norms, such as telling consumers to enter a competition, there
was a negative effect on Comments (i.e., a reactance-type response). More research is needed to
better understand this, however the findings reported here suggest that a key reason for why

47
branded content will or will not drive consumer engagement in social media lies in the extent to
which the branded content is consistent with the social communication norms of the social media
channel in which the content is disseminated.
Although not the primary focus of this research, we included a number of content
characteristics that were not central to testing if what is said versus how it is said matters more
for consumer engagement with branded content. These were included because they are fairly
common in branded social media content that we observed and/or are considered by industry
experts to be important drivers of engagement (i.e., “best practices”). Interestingly, we found
many of these content characteristics consistently did not affect engagement. One example is
posts that mention holidays. This is a common content characteristic used by marketers, however
there is no evidence in our analysis that it affects engagement at all. Another example is the
inclusion of rich media elements such as images or videos. Marketers consider this to be
extremely important and devote costly resources to producing higher-quality images and videos.
However, there was little evidence to suggest that this affected engagement. Consistent with this,
some social media managers have recognized the limits of costly-to-produce rich media elements
(Hutchinson 2015). In general, it seems that much of what social media marketers do is either
ineffective or, worse, backfires on them.
In addition to testing the effects of content characteristics on engagement, recall that we
also sought to see if the type of consumer audience moderated these effects. As discussed earlier,
we used audience mix—narrow/core fans versus wide/core and non-core fans—as a proxy for
the extent to which a post was seen by only those consumers who know the brand well and
interact with it a lot on Facebook (core fans, narrow audience mix) or instead by a broader
audience that extended to include non-core fans and thus a wider mix. Our initial thinking was

48
that some types of content might work best for core fans and other types of content might work
best for non-core fans. This did not appear to be the case, and the majority of the interaction
effects with audience mix in our model were not significant. Those that were significant simply
strengthened or attenuated an effect, instead of turning it on or off or reversing its sign. We did
find, however, that some of the moderating effects of audience mix that strengthened or
attenuated an effect were informative in the sense that they corroborated our arguments about
content generating more engagement if it was consistent with social communication norms on
Facebook. Nevertheless, audience mix (which is influenced by brands’ decisions to pay
Facebook to reach wider audiences) does not appear to play a major role here. This could be for
many different reasons (and is an interesting avenue for future research), though a simple
explanation is that regardless of a post’s audience, the only consumers who really pay attention
to it are the core fans. Hence, even if audience mix is wider and encompasses non-core fans in
addition to core fans, content will only be attended to by the core fans. If this is true, this casts
serious doubt over the value that brands get from paying Facebook to widen a post’s audience.
To conclude, we consider a number of limitations of this study and suggest some
directions for future work in this area. First, we considered only Facebook. Brands conduct
social media content marketing across a range of platforms (e.g., Facebook, Twitter, Instagram,
Pinterest) and use different content and styles on different platforms. We focused on Facebook
because of data availability and, more critically, its popularity as the major social media platform
used by both consumers and brands in the world. We have no reason to suspect that our findings
would not hold in other social media platforms that allow brands to post content with text and/or
visual elements (images, videos) and that allow consumers to engage with that content in similar

49
ways as on Facebook. Nevertheless, an interesting extension of this research would be to look at
branded content on other types of social media platforms.
Second, the dependent variables are imperfect measures of engagement and, specifically,
consumers’ attitudinal responses to content and the four marketing outcomes. We used these
variables because they are measured by Facebook and provided to all brand page owners for
free; that is, they are standard measures in this industry. They cannot, however, capture all
marketing outcomes triggered by posts because they do not account for off-Facebook behaviors
(e.g., WOM on Facebook is measured by Shares but WOM outside of Facebook due to branded
content on Facebook is obviously not captured in the Shares measure). They also do not measure
consumer-brand engagement more deeply. Nevertheless, we believe that these measures are
good indicators of off-Facebook actions as well as more abstract constructs.
Finally, our results are limited to a set of nine brands in a finite time window. Although
not a representative sample, the nine brands included in our data cover a broad set of industries
and are different sizes (e.g., one brand is one of the world’s best-known brands, whereas another
is well known only within the geographic region it serves). Thus, we feel that there is sufficient
variation between the brands to make this a reasonable sample. Nevertheless, we do not make
claims about broad generalizability of our findings to other industries.

50
REFERENCES
Barnes, Nora Ganim and Ava M. Lescault (2014), "The 2014 Fortune 500 and Social Media:
LinkedIn Dominates As Use of Newer Tools Explodes," Center for Marketing Research.
University of Massachusetts Dartmouth.
Bart, Yakov, Andrew T. Stephen, and Miklos Sarvary (2014), "Which Products are Best Suited
to Mobile Advertising? A Field Study of Mobile Display Advertising Effects on
Consumer Attitudes and Intentions," Journal of Marketing Research, 51 (3), 270-85.
Berger, Jonah (2011), "Arousal Increases Social Transmission of Information," Psychological
Science, 22 (7), 891-93.
Berger, Jonah and Katherine L. Milkman (2012), "What Makes Online Content Viral?," Journal
of Marketing Research, 49 (2), 192-205.
Bertrand, Marianne, Dean S. Karlan, Sendhil Mullainathan, Eldar Shafir, and Jonathan Zinman
(2010), "What's Advertising Content Worth? Evidence from a Consumer Credit
Marketing Field Experiment," The Quarterly Journal of Economics,, 125 (1), 263-306.
Brehm, Jack W. (1966), A Theory of Psychological Reactance. New York, NY: Academic Press.
Brodie, Roderick J., Ana Illic, Biljana Juric, and Linda D. Hollebeek (2013), “Consumer
Engagement in a Virtual Brand Community: An Exploratory Analysis,” Journal of
Business Research, 66 (1), 105-114.
Calder, Bobby J., Edward C. Malthouse, and Ute Schaedel (2009), “An Experimental Study of
the Relationship Between Online Engagement and Advertising Effectiveness,” Journal of
Interactive Marketing, 23 (4), 321-331.
Che, Hai, Xinlei Chen, and Yuxin Chen (2012), "Investigating Effects of Out-of-Stock on
Consumer Stockkeeping Unit Choice," Journal of Marketing Research, 49 (4), 502-13.
Danaher, Peter, Michael Smith, Kulan Ranasinghe, and Tracey Danaher (2015), "Where, When
and How Long: Factors that Influence the Redemption of Mobile Phone Coupons,"
Journal of Marketing Research, (In press).
De Vries, Lisette, Sonja Gensler, and Peter S.H. Leeflang (2012), "Popularity of Brand Posts on
Brand Fan Pages: An Investigation of the Effects of Social Media Marketing," Journal of
Interactive Marketing, 26 (2), 83-91.
Dean, Dwane Hal (1999), "Brand Endorsement, Popularity, and Event Sponsorship as
Advertising Cues Affecting Consumer Pre-purchase Attitudes," Journal of
Advertising, 28 (3), 1-12.
Drossos, Dimitris, Geroge M. Giaglis, George Lekakos, Flora Kokkinaki, and Maria G. Stavraki
(2007), "Determinants of Effective SMS Advertising: An Experimental Study," Journal
of Interactive Advertising, 7 (2), 16-27.

51
Dubois, David (2014), "Content Strategy is King in Social Media," (accessed September, 2014),
[available at http://knowledge.insead.edu/marketing-advertising/content-strategy-is-king-
in-social-media-3135].
Erdem, Tülin and Michael P. Keane (1996), “Decision-making Under Uncertainty: Capturing
Dynamic Brand Choice Processes in Turbulent Consumer Goods Markets,” Marketing
Science, 15 (1), 1-20.
Fleiss, Joseph L. (2003), Statistical Methods for Rates and Proportions (Third Edition). New
York: John Wiley & Sons, Inc.
Fleiss, Joseph L., John C. Nee, and J. Richard Landis (1979), "Large Sample Variance of Kappa
in the Case of Different Sets of Raters," Psychological Bulletin, 86 (5), 974-77.
Frazier, Gary L. and John O. Summers (1984), "Interfirm Influence Strategies and Their
Application within Distribution Channels," Journal of Marketing, 48 (1), 43-55.
Fitzsimons, Gavan J. and Donald R. Lehmann (2004), “Reactance to Recommendations: When
Unsolicited Advice Yields Contrary Responses,” Marketing Science, 23 (1), 82-94.
Friestad, Marian and Peter Wright (1994), "The Persuasion Knowledge Model: How People
Cope with Persuasion Attempts," Journal of Consumer Research, 21 (1), 1-31.
Goldfarb, Avi and Catherine Tucker (2011), "Online Display Advertising: Targeting and
Obtrusiveness," Marketing Science, 30 (3), 389-404.
Greene, William H. (2003), Econometric Analysis, Fifth Edition. Upper Saddle River, NJ:
Prentice Hall.
Hemley, Debbie (2013), "26 Ways to Engage Your Fans on Facebook," (accessed September,
2014), [available at http://www.socialmediaexaminer.com/26-facebook-fan-engagement-
tips/].
Hollebeek, Linda D., Mark S. Glynn, and Roderick J. Brodie (2014), “Consumer Brand
Engagement in Social Media: Conceptualization, Scale Development and Validation,”
Journal of Interactive Marketing, 28 (2), 149-65.
Hutchinson, Andrew (2015), “Do You Have to Produce Video Content to Suceed in Social
Media Marketing?,” (accessed April 2015), [available at
http://www.socialmediatoday.com/social-business/2015-04-09/do-you-have-produce-
video-content-succeed-social-media-marketing].
Johar, Gita V. and Michal T.Pham (1999), “Relatedness, Prominence, and Constructive Sponsor
Identification,” Journal of Marketing Research, 36 (3), 299-312.
Keller, Kevin L. (2009), "Building Strong Brands in a Modern Marketing Communications
Environment," Journal of Marketing Communications, 15 (2-3), 139-155.

52
Kumar, V., Vikram Bhaskaran, Rohan Mirchandani, and Milap Shah (2013), “Creating a
Measurable Social Media Marketing Strategy: Increasing the Value and ROI of
Intangibles and Tangibles for Hokey Pokey,” Marketing Science, 32 (2), 194-212.
Lamberton, Cait and Andrew T. Stephen (2015), “Taking Stock of the Digital Revolution: A
Critical Analysis and Agenda for Digital, Social Media, and Mobile Marketing
Research,” working paper, University of Oxford.
Laroche, Michel, Mohammad Reza Habibi, and Marie-Odile Richard (2013), “To Be Or Not To
Be In Social Media: How Brand Loyalty is Affected By Social Media?” International
Journal of Information Management, 33 (1), 76-82.
Landis, J. Richard and Gary G. Koch (1977), "The Measurement of Observer Agreement for
Categorical Data," Biometrics, 33 (1), 159-74.
Lee, Angela Y. and Jennifer L. Aaker. (2004), "Bringing the Frame into Focus: The Influence of
Regulatory Fit on Processing Fluency and Persuasion," Journal of Personality and Social
Psychology, 86 (2), 205 - 18.
Lee, Dokyun, Kartik Hosanagar, and Harikesh S. Nair (2015), "The Effect of Social Media
Marketing Content on Consumer Engagement: Evidence from Facebook,” working
paper, Carnegie Mellon University.
Leung, Stuart (2014), "Template For Success: 5 Keys to Creating A Winning Social Media
Plan," (accessed September, 2014), [available at
http://www.forbes.com/sites/salesforce/2014/09/03/creating-winning-social-media-plan/].
Liaukonyte, Jura, Thales Teixeira, and Kenneth C. Wilbur (2014), "How TV Ads Influence
Online Shopping," working paper. Cornell University, Ithaca, NY.
Lohtia, Ritu, Naveen Donthu, and Edmund K. Hershberger (2003), "The Impact of Content and
Design Elements on Banner Advertising Click-through Rates," Journal of Advertising
Research, 43 (4), 410-18.
Mohr, Jakki and John R. Nevin (1990), "Communication Strategies in Marketing Channels: A
Theoretical Perspective," Journal of Marketing, 54 (4), 36-51.
Olney, Thomas J., Morris B. Holbrook, and Rajeev Batra (1991), "Consumer Responses to
Advertising: The Effects of Ad Content, Emotions, and Attitude toward the Ad on
Viewing Time," Journal of Consumer Research, 17 (4), 440-53.
Petrin, Amil and Kenneth Train (2010), "A Control Function Approach to Endogeneity in
Consumer Choice Models," Journal of Marketing Research, 47 (1), 3-13.
Petty, Richard E. and John T. Cacioppo (1979), "Issue Involvement Can Increase or Decrease
Persuasion by Enhancing Message-relevant Cognitive Responses," Journal of Personality
and Social Psychology, 37 (10), 1915-1926.
Petty, Richard E. and John T. Cacioppo (1981), Attitudes and Persuasion: Classic and
Contemporary Approaches. Dubuque, IA: William C. Brown

53
Petty, Richard E., Gary L. Wells, and Timothy C. Brock (1976), "Distraction Can Enhance or
Reduce Yielding to Propaganda: Thought Disruption Versus Effort Justification,"
Journal of Personality and Social Psychology, 34 (5), 874-884.
Resnik, Alan and Bruce L. Stem (1977), "An Analysis of Information Content in Television
Advertising," Journal of Marketing, 41 (1), 50-53.
Singh, Surendra N. and Catherine A. Cole (1993), "The Effects of Length, Content, and
Repetition on Television Commercial Effectiveness," Journal of Marketing Research, 30
(1), 91-104.
Sprott, David, Sandor Czellar, and Eric Spangenberg (2009), “The Importance of a General
Measure of Brand Engagement on Market Behavior: Development and Validation of a
Scale,” Journal of Marketing Research, 46 (1), 92-104.
Stephen, Andrew T. (2016), “The Role of Digital and Social Media Marketing in Consumer
Behavior,” Current Opinion in Psychology, forthcoming.
Stephen, Andrew T. and Olivier Toubia (2010), "Deriving Value from Social Commerce
Networks," Journal of Marketing Research, 47 (2), 215-28.
Terza, Joseph V., Anirban Basu, and Paul J. Rathouz (2008), "Two-stage Residual Inclusion
Estimation: Addressing Endogeneity in Health Econometric Modeling," Journal of
Health Economics, 27 (3), 531-43.
Turley, L. W. and Scott W. Kelley (1997), "A Comparison of Advertising Content: Business to
Business versus Consumer Services," Journal of Advertising, 26 (4), 39-48.
van Doorn, Jenny, Katherine N. Lemon, Vikas Mittal, Stephan Nass, Doreen Peck, Peter Priner,
and Peter C. Verhoef (2010), “Customer Engagement Behavior: Theoretical Foundations
and Research Directions,” Journal of Service Research, 13 (3), 253-266.
Venkatachari, Dilip (2013), "Rich Media and Social Media: A Match Made in Marketing
Heaven," (accessed December, 2014), [available at
http://www.clickz.com/clickz/column/2268058/rich-media-and-social-media-a-match-
made-in-marketing-heaven].
Vivek, Shiri D., Sharon E. Beatty, and Robert M. Morgan (2012), "Customer Engagement:
Exploring Customer Relationships Beyond Purchase," The Journal of Marketing Theory
and Practice, 20 (2), 122-46.
Wang, Jing and Bobby J. Calder (2006), “Media Transportation and Advertising,” Journal of
Consumer Research, 33 (2), 151-162.

54
Appendix A: Brand Information
Industry Description Number
of Posts
Approximate
Audience
CPG Laundry Laundry detergent for sensitive skin 249 300,000
CPG Laundry All purpose laundry detergent 246 300,000
Retail Wholesale warehouse club 414 150,000
Quick-service restaurants Fast-food dessert/ice-cream chain 551 7,000,000
Quick-service restaurants Fast-food burger chain 542 30,000,000
Sports Collegiate sports team 1,189 130,000
CPG Laundry Fabric softener 598 700,000
CPG Laundry All purpose laundry detergent 419 300,000
Retail Gas and convenience store chain 76 200,000
Appendix B: Items Used For Content Coding
Variable Items Measurement
Arousal-oriented
Positivity The post makes me feel enthusiastic.
The post is motivational/inspirational.
The post makes me feel happiness.
This post was engaging.
I thought the post was entertaining.
The post captured my attention.
1 = SD to 5 =
SA,
.91
Humorous The post is funny/humorous. 1 = SD to 5 =
SA
Persuasion-
oriented
Relevance The post is consistent with the brand.
The post fits with the brand.
The post makes sense for this brand.
The post is relevant to the brand.
1 = SD to 5 =
SA
ClearMessage The post makes sense.
The message being conveyed is clear and easy to grasp.
1 = SD to 5 =
SA
AdvertisingTone This post feels like an advertisement for the brand. 1 = SD to 5 =
SA

55
Information
Product This post provides information on how to use the product/brand.
This post provides information on a benefit or feature of the
product/brand.
This post provides information on occasions to use the product/brand.
The post directly promotes a new product.
0 = no, 1 =
yes
Value The post provides information on pricing.
The post includes or mentions a coupon.
0 = no, 1 =
yes
Brand The post provides news about the firm, product, or brand.
The post directly promotes an event.
0 = no, 1 =
yes
Calls to Action
Engage The post poses a question for users to respond.
The post explicitly requests users to post a picture.
The post explicitly requests users to “like” the post.
The post explicitly requests users to “share” the post.
The post explicitly requests users to click on a link.
0 = no, 1 =
yes
Competition The post mentions or includes a contest or sweepstakes.
The post includes or mentions a product give-away.
0 = no, 1 =
yes
References
NonbrandRefs The post directly promotes a charity or charitable cause.
The post mentions a charitable fund, foundation, institution, or day.
The post mentions or highlights the sponsorship of another
organization, brand, or event.
0 = no, 1 =
yes
Holiday The post mentions a major holiday or mentions “holidays” in general
(e.g., major holidays would include New Years Day, Memorial
Day…).
The post highlights or mentions a special occasion NOT considered a
major holiday or special day (e.g., minor holidays such as “national
bosses day” or “national cake day”)
0 = no, 1 =
yes
Media elements
RichMedia The post contains a picture (NOT including a thumbnail image for
videos or links).
The post contains a link to a video (a video that would open in a new
tab or window to play).
The post contains an embedded video (a video that plays within the
post and DOES NOT open in a new tab or window).
0 = no, 1 =
yes
URLs The post contains a link to another webpage (i.e., NOT a video link). 0 = no, 1 =
yes

56
Appendix C: Correlations Between Content Characteristics
1 2 3 4 5 6 7 8 9 10 11 12 13 14
Positivity 1 1.00
Humorous 2 .31 1.00
Relevance 3 .16 -.06 1.00
ClearMessage 4 .24 -.09 .48 1.00
AdvertisingTone 5 .03 -.01 .61 .26 1.00
Product 6 .00 -.02 .16 .09 .29 1.00
Value 7 .00 -.06 .11 .09 .24 .12 1.00
Brand 8 -.02 -.19 .20 .07 .12 .07 .02 1.00
Engage 9 .00 .07 -.15 .02 -.08 -.02 -.06 -.28 1.00
Competition 10 .03 -.05 .00 .00 .07 -.02 .03 .04 .03 1.00
NonbrandRefs 11 .09 -.09 -.06 .01 -.04 -.03 -.03 .21 -.07 .08 1.00
Holiday 12 .05 .06 -.17 .05 -.11 .02 -.02 -.11 .05 -.06 -.04 1.00
Richmedia 13 .21 .09 .18 .06 .20 .07 .00 .09 -.15 -.02 -.01 -.02 1.00
URLs 14 .01 -.13 .15 .06 .15 .03 .10 .27 -.14 .12 .17 -.10 .00 1.00
Appendix D: Error Variance-Covariance Matrix
Likes Negatives Reach Comments Shares Clicks
Likes 1.35
Negatives .55 .85
Reach .31 .40 .54
Comments .28 .27 .24 1.06
Shares .36 .49 .24 .35 1.08
Clicks -.06ns
-.06ns
-.07 -.04ns
.14 2.18
All error variance and covariance parameters are significant (all p < .05) unless indicated by ns.

57
Appendix E: Direct Effects of Content Characteristics, Audience Mix, and Attitudinal Responses on Marketing Outcomes
Reach
Comments
Shares
Clicks
Est. SE
Est. SE
Est.
SE
Est.
SE
Attitudinal
Responses
log(Likes + 1) .10 .03 ***
.54 .06 *** .75 .05 *** .24 .13 *
log(Likes + 1) x Mix -.13 .02 ***
.11 .05 ** .06 .05 .45 .10 ***
log(Negatives + 1) .35 .06 ***
.07 .10 -.37 .10 *** .61 .19 ***
log(Negatives + 1) x Mix -.08 .02 ***
.00 .05 -.04 .05 -.35 .11 ***
Arousal-
oriented
Positivity .32 .40
-1.11 .80
1.27 .80 1.37 1.68
Positivity x Mix .20 .09 **
.04 .17
.06
.18
-.20
.36
Humorous -.73 .38 *
.35 .75
-.39 .79 4.97 2.17 **
Humorous x Mix .24 .07 ***
.00 .13
.05 .14 -.20 .28
Persuasion-
oriented
Relevance 2.22 .72 ***
3.10 1.47 **
3.40
1.58
**
-6.65
3.92
*
Relevance x Mix .05 .12
-.43 .24 *
-.02
.25
-.40
.50
ClearMessage -2.79 .83 ***
-2.56 1.60
-6.23 1.86 *** 5.77 3.94
ClearMessage x Mix -.37 .14 ***
.15 .28
-.03
.28
.03
.58
AdvertisingTone -.89 .32 ***
-1.28 .65 **
-.89
.66
2.31
1.70
AdvertisingTone x Mix -.07 .08
.19 .17
.29 .17 * .55 .35
Information Product 3.54 .71 ***
.49 1.34
.02
1.36
1.94
2.87
Product x Mix .23 .09 **
.17 .19
-.31
.19
-.72
.39
*
Value 1.44 .52 ***
-2.31 1.08 **
-.84
1.07
-2.63
2.22
Value x Mix .23 .12 **
.20 .23
.13
.24
-.59
.48
Brand .31 .32
1.36 .63 **
.57 .64 .79 1.34
Brand x Mix -.26 .09 ***
.07 .18
.18
.19
-.50
.38
Calls to Action Engage -.04 .27
1.51 .53 ***
.80 .53 1.48 1.12
Engage x Mix -.36 .10 ***
-.42 .20 **
-.37 .21 * -.15 .43
Competition .09 .32
-2.12 .65 ***
-.42 .64 -6.12 1.40 ***
Competition x Mix .11 .11
-.03 .23
.17
.23
-.60
.47

58
Reach
Comments
Shares
Clicks
Est. SE
Est. SE
Est.
SE
Est.
SE
References NonbrandRefs .24 .74
4.62 1.39 ***
3.10
1.39
**
7.40
2.99
**
NonbrandRefs x Mix .02 .16
-.17 .34
.26
.34
-.65
.69
Holiday .31 .27
-.18 .58
-.18
.56
1.70
1.19
Holiday x Mix -.02 .18
-.20 .37
.00
.38
-1.65
.78
**
Media
Elements
RichMedia 1.01 .44 **
-.53 .84
-2.19 .86 ** -.91 1.78
RichMedia x Mix .59 .11 ***
.55 .23 **
1.84
.23
***
-1.41
.46
***
URLs .57 .28 **
.59 .60
1.10 .61 * -1.48 1.41
URLs x Mix .53 .08 ***
.83 .17 ***
.44 .17 ** -.69 .35 **
Other
Variables
Mix 3.05 .54 *** -.90 1.11 -3.36 1.13 *** 1.49 2.29
Lag log(Reach + 1) .13 .01 *** – – – – – – – – –
Lag log(Comments + 1) – – – .14 .02 *** – – – – – –
Lag log(Shares + 1) – – – – – – .14 .02 *** – – –
Lag log(Clicks + 1) – – – – – – – – – .17 .04 ***
log(Interpost Time) .05 .02 *** .09 .04 ** .19 .05 *** -.15 .09 *
Month -.02 .01 *** -.01 .02 -.02 .02 .18 .03 ***
Intercept 11.59 2.44 *** 5.43 4.71 13.03 5.45 ** -27.73 11.08 **
Brand 1 .99 .18 *** -.92 .34 *** -.95 .37 ** 2.83 .81 ***
Brand 2 1.16 .19 *** -1.52 .34 *** -1.18 .36 *** 1.12 .74
Brand 3 -1.10 .31 *** -1.67 .63 *** -1.25 .70 * 3.51 1.51 **
Brand 4 1.71 .24 *** -.69 .46 .18 .47 .47 1.05
Brand 5 2.25 .31 *** -.33 .61 -.57 .63 3.12 1.37 **
Brand 6 .10 .47 -3.26 .95 *** -2.79 .99 *** 6.31 2.54 **
Brand 7 1.28 .21 *** -2.19 .35 *** -1.80 .37 *** .02 .78
Brand 8 1.47 .21 *** -2.11 .40 *** -1.80 .43 *** 1.02 .81
Control residuals Yes Yes Yes Yes
* p < .10, ** p < .05, *** p < .01. Mix ranges from 0 to 1. For brand fixed effects, Brand 9 is the reference brand


![[2012] FWAA 5837 - Corsec Services€¦ · [2012] FWAA 5837 DECISION Fair Work Act 2009 s.185—Enterprise agreement Corsec Services Pty Ltd (AG2012/9529) CORSEC SERVICES ENTERPRISE](https://img.dokumen.tips/doc/110x75/5eadddc57bc1a728f9559e8d/2012-fwaa-5837-corsec-2012-fwaa-5837-decision-fair-work-act-2009-s185aenterprise.jpg)


