Embed Size (px)
Citation preview

RESEARCH Open Access
Is comprehensiveness critical? Comparingshort and long format cognitiveassessments in preclinical AlzheimerdiseaseJason Hassenstab1,2*, Jessica Nicosia1, Megan LaRose1, Andrew J. Aschenbrenner1, Brian A. Gordon2,3,Tammie L. S. Benzinger3, Chengjie Xiong1,4 and John C. Morris1
Abstract
Background: Comprehensive testing of cognitive functioning is standard practice in studies of Alzheimer disease(AD). Short-form tests like the Montreal Cognitive Assessment (MoCA) use a “sampling” of measures, administeringkey items in a shortened format to efficiently assess cognition while reducing time requirements, participantburden, and administrative costs. We compared the MoCA to a commonly used long-form cognitive battery inpredicting AD symptom onset and sensitivity to AD neuroimaging biomarkers.
Methods: Survival, area under the receiver operating characteristic (ROC) curve (AUC), and multiple regressionanalyses compared the MoCA and long-form measures in predicting time to symptom onset in cognitively normalolder adults (n = 6230) from the National Alzheimer’s Coordinating Center (NACC) cohort who had, on average, 2.3± 1.2 annual assessments. Multiple regression models in a separate sample (n = 416) from the Charles F. andJoanne Knight Alzheimer Disease Research Center (Knight ADRC) compared the sensitivity of the MoCA and long-form measures to neuroimaging biomarkers including amyloid PET, tau PET, and cortical thickness.
Results: Hazard ratios suggested that both the MoCA and the long-form measures are similarly and modestlyefficacious in predicting symptomatic conversion, although model comparison analyses indicated that the long-form measures slightly outperformed the MoCA (HRs > 1.57). AUC analyses indicated no difference between themeasures in predicting conversion (DeLong’s test, Z = 1.48, p = 0.13). Sensitivity to AD neuroimaging biomarkerswas similar for the two measures though there were only modest associations with tau PET (rs = − 0.13, ps < 0.02)and cortical thickness in cognitively normal participants (rs = 0.15–0.16, ps < 0.007).
© The Author(s). 2021 Open Access This article is licensed under a Creative Commons Attribution 4.0 International License,which permits use, sharing, adaptation, distribution and reproduction in any medium or format, as long as you giveappropriate credit to the original author(s) and the source, provide a link to the Creative Commons licence, and indicate ifchanges were made. The images or other third party material in this article are included in the article's Creative Commonslicence, unless indicated otherwise in a credit line to the material. If material is not included in the article's Creative Commonslicence and your intended use is not permitted by statutory regulation or exceeds the permitted use, you will need to obtainpermission directly from the copyright holder. To view a copy of this licence, visit http://creativecommons.org/licenses/by/4.0/.The Creative Commons Public Domain Dedication waiver (http://creativecommons.org/publicdomain/zero/1.0/) applies to thedata made available in this article, unless otherwise stated in a credit line to the data.
* Correspondence: [email protected] F. and Joanne Knight Alzheimer Disease Research Center,Department of Neurology, Washington University School of Medicine, St.Louis, MO, USA2Department of Psychological & Brain Sciences, Washington University in St.Louis, St. Louis, MO, USAFull list of author information is available at the end of the article
Hassenstab et al. Alzheimer's Research & Therapy (2021) 13:153 https://doi.org/10.1186/s13195-021-00894-5

Conclusions: Both test formats showed weak associations with symptom onset, AUC analyses indicated lowdiagnostic accuracy, and biomarker correlations were modest in cognitively normal participants. Alternativeassessment approaches are needed to improve how clinicians and researchers monitor cognitive changes anddisease progression prior to symptom onset.
Keywords: Alzheimer disease, Cognitive decline, Cognitive assessment
IntroductionDetecting changes in cognition in the earliest stages ofAlzheimer disease (AD) in longitudinal studies requiresthat assessment measures meet several criteria. Assess-ments must be psychometrically valid and reliable andtest relevant domains of cognition such as episodicmemory, executive function, attentional control, pro-cessing speed, language, and orientation. For both over-all scores and domain-specific scores, these measuresshould have good retest reliability and inter-rater reli-ability. Of particular importance, especially for studiesthat enroll large asymptomatic cohorts, is that the testsincluded are sensitive enough to detect subtle changes incognition that characterize the preclinical asymptomaticstages of AD [1, 2]. Attempting to maximize sensitivity,AD cohort studies and clinical trials typically involve ex-tensive cognitive testing sessions including dozens of in-dividual measures. The comprehensiveness of acognitive evaluation is often valued as a method to pro-vide more nuanced and sensitive insights into cognitivechanges commonly associated with AD pathology [3, 4].However, this comprehensiveness comes at a cost aslengthier evaluations can be problematic for multiplereasons. First, longer assessments increase participantburden and require significant personnel time for testadministration, scoring, quality control, and data entry1.Second, day-to-day variability in stress and mood cansignificantly impact participants’ attention and fatigue,factors which have been shown to particularly influenceolder adults’ cognitive performance [5]. Finally, the testswhich tap into the domains of cognition that decline inthe earliest stages of AD, including episodic memory, at-tention, and working memory, are perceived as mosttaxing and effortful [6, 7] and often have suboptimal reli-ability [8].Short-form cognitive assessment tools, sometimes re-
ferred to as cognitive screening measures, have beenused for decades in clinical studies to provide a snapshotof overall cognitive and functional abilities and require afraction of the time it takes to complete their long-formcounterparts. The brevity and simplicity of these assess-ments make them popular tools among researchers and
clinicians when assessing cognitive decline. The mostcommon short-form measure in the AD literature is theMini-Mental State Examination (MMSE) [9]. TheMMSE requires approximately 10 min to administer andhas high sensitivity and specificity for detecting symp-tomatic AD [10]. However, at milder stages of dementia,this test has exhibited poor sensitivity [11]. Specifically,due to ceiling effects, individuals with preclinical AD orearly symptomatic AD (e.g., mild cognitive impairment[MCI] due to AD) are more likely to score within the“normal” range [12–14]. Beyond these validity and reli-ability issues, the MMSE is subject to copyright restric-tions and carries fees for its use [15, 16], making itcostly for large-scale studies and restricts research to in-vestigators with sufficient resources.For these reasons, the MMSE was not included in the
National Alzheimer’s Coordinating Center (NACC) Uni-form Data Set (UDS) in its third iteration (UDS 3) [17,18] in lieu of the Montreal Cognitive Assessment(MoCA) [19], a short-form cognitive assessment similarto the MMSE with several advantages. The MoCA re-quires approximately 10–15min to administer and testsseven domains of cognition: memory, visuospatial func-tion, naming, attention, language, orientation, and ab-straction. The most unique feature of the MoCA is that,apart from simple assessments of orientation and ab-straction like those included in the MMSE, it uses itemsand test concepts drawn from classic long-form neuro-psychological test batteries. The MoCA includes con-densed versions, or a “sampling,” of morecomprehensive measures including the trail making test,letter fluency, confrontation naming, digit span, and ver-bal list learning and recall. Like the MMSE, it is highlysensitive to dementia, but unlike the MMSE, it is moresensitive to early symptomatic AD [14, 20]; has shownsensitivity to AD biomarkers [21]; and is available at nocost for non-profit use, although its publisher has re-cently begun requiring training and certification fees(https://www.mocatest.org/training-certification/).The goal of the current study was to determine how
the short-form MoCA measure compares to standardlong-form neuropsychological tests in terms of predict-ing the onset of symptomatic dementia in the NACC co-hort. The NACC cohort is a large, well-characterizedsample of older adults enrolled in ongoing studies ofaging and dementia at ~ 30 Alzheimer's Disease
1Additionally, in light of the COVID-19 pandemic, it is worth notingthat the length of long-form cognitive assessments may also makethem less adaptable to remote testing.
Hassenstab et al. Alzheimer's Research & Therapy (2021) 13:153 Page 2 of 14
Research Centers across the USA. Additional analyseswere done using participants enrolled in studies at theCharles F. and Joanne Knight Alzheimer Disease Re-search Center (Knight ADRC) to determine the sensitiv-ity of the short-form and long-form measures to ADneuroimaging biomarkers, including amyloid positronemission tomography (PET), tau PET, and magnetic res-onance imaging (MRI) structural measures. We hypothe-sized that, in comparison with the MoCA, the long-formcognitive measures from the UDS 3 would show super-ior specificity and sensitivity in predicting conversion tosymptomatic AD and would be more sensitive to ADneuroimaging biomarkers.
Study 1MethodsParticipantsThe NACC UDS 3 is a standardized evaluation consistingof clinical and cognitive measures administered to partici-pants enrolled in ongoing studies of aging and dementiaat ~ 30 centers funded by the National Institute on Aging(NIA) Alzheimers Disease Research Center (ADRC) pro-gram. Written informed consent is obtained at the indi-vidual ADRCs and approved by individual InstitutionalReview Boards (IRBs). We included participant visits sub-mitted to NACC by the ADRCs from March of 2015 toAugust 2019. This time period reflects when the MoCAand other UDS 3 measures were introduced into theADRCs and submitted to NACC. Because we were inter-ested in determining the utility of the MoCA as comparedto the long-form UDS 3 cognitive battery in predictingdisease progression from cognitive normality to onset ofsymptomatic disease, we included only participants whowere cognitively normal at their first visit when MoCAwas introduced into the ADRCs. Participants were re-quired to have a Clinical Dementia Rating™ (CDR™) [22] of0 at their first visit and have at least one follow-up visit.
Clinical and cognitive measuresClinical status was determined with the CDR which usesa 5-point scale to characterize six domains of cognitiveand functional performance that are applicable to ADand other dementias [22]. The domains include memory,orientation, judgment and problem solving, communityaffairs, home and hobbies, and personal care. CDRscores are determined through semi-structured inter-views with the participant and a reliable informant suchas a family member or friend. A CDR score of 0 indi-cates cognitive normality, 0.5 = very mild dementia, 1 =mild dementia, 2 = moderate dementia, and 3 = severedementia.The UDS 3 cognitive battery includes measures of epi-
sodic memory (Craft Story 21, Benson Complex FigureRecall), language (the Multilingual Naming Test
(MINT)), visuospatial functioning (Benson Complex Fig-ure Copy), immediate attention (Trails A, Number SpanForward), working memory (Number Span Backwards),and executive functioning (Trails B; see Weintraub et al.,2018 for a detailed description and associated referencesfor individual measures). Each test was standardizedusing the mean and standard deviation from the firstvisit for individuals who remained CDR 0 (i.e., non-converters) to form Z-scores. Z-scores from each testwere then averaged together to form domain scores (i.e.,memory, visual, attention, language) which were then av-eraged together to form a simple global composite score.Because the MoCA total score is commonly used in thediagnosis of cognitive impairment [23], our analyses fo-cused on comparing the MoCA total score with theUDS 3 global composite score.
Statistical analysesTime to symptomatic conversion was operationalized asthe time, in years, from participants’ initial study timepoint to the time point in which they were first deter-mined to have a non-zero CDR score (or, in the case ofindividuals who never converted to a non-zero CDR,their final time point in the study). Individuals who diedduring follow-up were not included in the analyses (i.e.,148 non-converters and 31 converters). Two cut points,one at − 1 SD and one at − 1.5 SDs, were used for boththe MoCA (scores of 23 and 21, respectively) and theUDS 3 global composite score. Similar cut points havebeen used in the literature to indicate the presence orabsence of cognitive impairment [24–28]. Log-rank testswere used to compare the Kaplan-Meier survival curvesfor high and low groups for each measure (i.e., theMoCA and the UDS 3 global composite). Adjusted haz-ard ratios (HRs) and their 95% confidence intervals wereestimated using a Cox proportional hazards model withcovariates including baseline age, self-reported gender,years of education, and presence of one or more apoli-poprotein ε4 (APOE4) alleles with the survival packageversion 3.2 in the R statistical computing environment[29].To obtain measures of the two tests’ diagnostic dis-
crimination abilities [30], the scales were subjected to anarea under the curve (AUC) analysis of receiver operat-ing characteristics (ROC) curves using the pROC pack-age version 1.17 in R [30]. This analysis focused onexamining which score provided better diagnostic accur-acy in predicting conversion status using baseline datafrom individuals who were CDR 0 at their initial visit.The ROC analysis results were interpreted following thediagnostic accuracy guidelines from Swets (1996) suchthat an AUC < 0.70 indicates low diagnostic accuracy,an AUC in the range of 0.70–0.90 indicates moderatediagnostic accuracy, and an AUC ≥ 0.90 indicates high
Hassenstab et al. Alzheimer's Research & Therapy (2021) 13:153 Page 3 of 14

diagnostic accuracy [30]. DeLong’s test for correlatedROC curves was used to test whether the two areasunder the curve were significantly different from oneanother.Finally, multiple regression model comparison ana-
lyses were used to directly compare the efficacy ofthe baseline, continuous MoCA, and UDS 3 globalcomposite scores in predicting the time to symptom-atic conversion. Because the MoCA and UDS 3 globalcomposite were correlated with one another, r = 0.70,p < 0.001, a single multiple regression model includ-ing both variables would be subject to potential mul-ticollinearity issues. Therefore, non-nested modelswere used, and model fit was evaluated based on theR2, Akaike information criterion (AIC), Bayesian in-formation criterion (BIC), and deviance values. For allmodels, males served as the reference group for thegender variable, and APOE negative served as the ref-erence groups for the APOE variable.
ResultsDemographicsSix thousand two hundred thirty cognitively normalolder adults aged 72.9 ± 10.4 years from the NACC
cohort were followed for an average of 2.3 ± 1.2 annualassessments (range = 1–5 assessments). As expected,converters had more assessments than non-converters,t(746.92) = 12.90, p < 0.001, d = 0.55. Participants thatenroll as cognitively normal that are observed for longerperiods are more likely to convert due to advancing age(see Table 1 for additional demographic information).
Survival model resultsSurvival analyses were conducted using outcomes fromthe short-form MoCA and the long-form UDS 3 globalcomposite to predict the time to symptomatic onset (de-fined as a change from CDR 0 to CDR > 0). Percentagesof high- and low-scoring converters and non-convertersfor each cut point are presented in Table 2. Outcomeswere contrasted on HR magnitude and their confidenceintervals. For reference, higher HRs are interpreted asrepresenting a better prediction of future conversion andnarrower confidence intervals suggest less variability inprediction. Primary analyses contrasted individuals whoscored above vs. below the − 1 SD and − 1.5 SDs cutpoints on the MoCA and UDS 3 global composite. HRsfor symptomatic conversion by the cut point criteria de-scribed above, adjusted for demographic covariates, are
Table 1 Study 1 demographic data
Converter No, N = 56221 Yes, N = 6081 p-value2
Age 73 (7) 76 (8) < 0.001
Gender 0.002
Female 3709 (66%) 362 (60%)
Male 1913 (34%) 246 (40%)
Education (years) 16.24 (2.81) 16.08 (3.09) 0.24
APOE status 0.4
Neg. 2608 (70%) 351 (68%)
Pos. 1134 (30%) 167 (32%)
Race 0.21
White 4499 (80%) 480 (79%)
Black or African American 853 (15%) 107 (18%)
Asian 148 (2.6%) 10 (1.6%)
American Indian or Alaska Native 40 (0.7%) 7 (1.2%)
Native Hawaiian or other Pacific Islander 6 (0.1%) 0 (0%)
Others 32 (0.6%) 2 (0.3%)
Unknown 44 (0.8%) 2 (0.3%)
Number of visits 2.25 (1.2) 3.21 (0.94) < 0.001
MoCA 26.1 (2.9) 24.6 (3.3) < 0.001
UDS 3 global composite 0.05 (0.57) − 0.25 (0.59) < 0.0011Mean (SD); n (%)2Welch two-sample t-test; Pearson’s chi-squared test
Hassenstab et al. Alzheimer's Research & Therapy (2021) 13:153 Page 4 of 14

presented in Table 3. For all models, the adjusted cumu-lative incidence of time to symptomatic conversion wasincreased in the individuals who scored below the cutpoint after controlling for demographic covariates ascompared to individuals who scored above the cut point,HRs > 1.57, ps < 0.001. Comparison of HRs indicatedthat the UDS 3 global composite was slightly better atpredicting symptomatic conversion than the MoCA withthe − 1 SD cut point. However, the opposite was true(MoCA HR > UDS 3 global composite HR) with the −1.5 SD cut point (see Table 3). Overall, these results ul-timately suggest that both the MoCA and the UDS 3global composite show relatively equivalent HRs and arethus similarly, yet modestly, efficacious in predictingsymptomatic conversion. Kaplan-Meier curves for theMoCA and UDS 3 global composite at the two differentcut points are presented in Fig. 1.
ROC resultsROC analyses in the NACC sample indicated an areaunder the curve (AUC) estimate for the MoCA of0.64 and an AUC estimate for the UDS 3 global com-posite of 0.66. DeLong’s test for two correlated ROCcurves was non-significant, Z = 1.48, p = 0.13, indi-cating that these measures demonstrate similarly lowdiagnostic accuracy in predicting conversion to symp-tomatic AD [31].
Model comparison resultsThe multiple regression models predicting the time tosymptomatic conversion indicated that both the con-tinuous MoCA and UDS 3 global composite scoressignificantly predicted time to symptomatic conver-sion after covarying out effects of age, self-reportedgender, years of education, and APOE4 status. Theresults of the model comparison analyses suggestedthat the model including the UDS 3 global compositescore outperformed the model including the MoCAscore in predicting time to symptomatic conversion.This was indicated by the larger R2 and smaller AIC,BIC, and deviance values (see Table 4).
Study 2MethodsParticipantsParticipants were community-residing volunteers en-rolled in longitudinal studies of memory and aging atthe Knight ADRC at Washington University in St. Louis.We were interested in determining the associations be-tween the MoCA and long-form measures with AD neu-roimaging biomarkers, so we selected participants basedon the availability of at least 1 amyloid PET scan, 1 tauPET scan, and a volumetric MRI that were collected
Table 2 Study 1 cut point Ns
Converter No, N = 56221 Yes, N = 6081
MoCA − 1 SD cut point
High 4710 (84%) 416 (68%)
Low 912 (16%) 192 (32%)
Global composite − 1 SD cut point
High 5381 (96%) 543 (89%)
Low 241 (4.3%) 65 (11%)
MoCA − 1.5 SD cut point
High 5204 (93%) 505 (83%)
Low 418 (7.4%) 103 (17%)
Global composite − 1.5 SD cut point
High 5537 (98%) 591 (97%)
Low 85 (1.5%) 17 (2.8%)1n (%)
Table 3 HRs for time to symptomatic conversion by task score adjusted for covariates
Predictor MoCA − 1 SD cut point MoCA − 1.5 SD cut point Composite − 1 SD cut point Composite − 1.5 SD cut point
HR 95% CI p HR 95% CI p HR 95% CI p HR 95% CI p
Age 1.02 1.01, 1.04 < 0.001 1.03 1.01, 1.04 < 0.001 1.03 1.02, 1.04 < 0.001 1.03 1.02, 1.04 < 0.001
Gender 0.76 0.64, 0.91 0.003 0.72 0.60, 0.86 < 0.001 0.74 0.62, 0.89 0.001 0.74 0.62, 0.88 < 0.001
Education 1.00 0.97, 1.03 > 0.9 1.00 0.97, 1.04 0.90 0.99 0.96, 1.02 0.40 0.97 0.94, 1.00 0.035
APOE 1.22 1.01, 1.47 0.04 1.20 0.99, 1.44 0.06 1.23 1.02, 1.49 0.03 1.22 1.01, 1.47 0.038
MoCA
High – – – – – –
Low 2.99 2.45, 3.65 < 0.001 3.87 3.00, 4.99 < 0.001
Global composite
High – – – – –
Low 4.06 2.95, 5.58 < 0.001 2.69 1.57, 4.61 < 0.001
HR hazard ratio, CI confidence interval
Hassenstab et al. Alzheimer's Research & Therapy (2021) 13:153 Page 5 of 14

within 1 year of each other. We also sought to determinethe sensitivity of the MoCA and long-form measures intracking disease progression from the asymptomatic tosymptomatic stages; thus, data were analyzed in twogroups: participants who were CDR 0 and participantswho were CDR > 0. All participants signed a standard in-formed consent document, and all procedures were
approved by the Institutional Review Board at Washing-ton University in St. Louis.
Clinical and cognitive measuresMeasures included the CDR (as described in study 1),MoCA, and UDS 3 (as described in study 1). The UDS 3
Fig. 1 Survival curves for the MoCA and UDS 3 global composite for the two different cut points (− 1 SD and − 1.5 SDs)
Table 4 Study 1 model comparisonsPredictor MoCA model Global composite model
Beta 95% CI p Beta 95% CI p
Age 0.00 − 0.01, 0.01 0.60 0.00 − 0.01, 0.01 0.80
Gender 0.13 − 0.02, 0.28 0.09 0.11 − 0.04, 0.26 0.14
Education − 0.03 − 0.06, 0.00 0.05 − 0.03 − 0.06, − 0.01 0.01
APOE 0.06 − 0.10, 0.22 0.40 0.06 − 0.09, 0.22 0.40
Standardized MoCA 0.11 0.04, 0.18 0.003
Global composite 0.30 0.17, 0.44 < 0.001
R2 0.028 0.05
AIC 1292 1280
BIC 1322 1310
Deviance 362 353
CI confidence interval
Hassenstab et al. Alzheimer's Research & Therapy (2021) 13:153 Page 6 of 14

global composite was calculated in the same way as de-scribed in study 1.
NeuroimagingAmyloid PET imaging was performed with either florbe-tapir (18F-AV-45) or Pittsburgh Compound B (PiB) andwas acquired on a Biograph mMR (Siemens Medical So-lutions, Malvern, PA). All florbetapir PET scans includedata 50- to 70-min post-injection, and all PiB PET scansinclude data 30- to 60-min post-injection. All data wereconverted to standardized uptake value ratios (SUVRs)with the cerebellar cortex used as a reference region be-fore then being converted to the Centiloid scale [32, 33].PET data were processed with an in-house pipelineusing regions of interest derived from FreeSurfer(https://github.com/ysu001/PUP) [34]. This approachcorrects for the spillover signal from adjacent regions ofinterest and non-brain tissue on the basis of the scannerpoint spread function and the relative distance betweenregions. This partial volume correction approach ac-counts not only for spillover from different areas in thebrain but also for spillover from the non-brain regionsinto the brain. Amyloid deposition was quantified withthe average across the left and right lateral orbitofrontal,medial orbitofrontal, rostral middle frontal, superiorfrontal, superior temporal, middle temporal, and precu-neus regions. Tau PET imaging used the tracer 18F-AV-1451 (flortaucipir) and was acquired on a Biograph 40PET/CT scanner (Siemens Medical Solutions). Datafrom the 80- to 100-min post-injection window wereconverted to SUVRs using a cerebellar cortex referenceand partial volume corrected. Deposition was summa-rized with the average of the bilateral entorhinal cortex,amygdala, inferior temporal lobe, and lateral occipitalcortex [35]. MRI data were acquired on a Siemens Bio-graph mMR or Trio 3T scanner. T1-weighted imageswere acquired with a magnetization-prepared rapid ac-quisition gradient echo sequence acquired in the sagittalorientation with a repetition time of 2300 ms, an echotime of 2.95 ms, a flip angle of 9°, 176 slices, an in-planeresolution of 240 × 256, and a slice thickness of 1.2 mm.Images underwent volumetric segmentation with Free-Surfer 5.3 (freesurfer.net) to identify the regions of inter-est for further analysis [36, 37]. Cortical thickness valueswere obtained for each hemisphere for a limited numberof regions of interest (ROIs) reflecting the brain atrophypatterns in AD [38]. Cortical thickness was calculated asthe shortest distance between the cortical gray/whiteboundary to the gray/CSF boundary [39].
Statistical analysesThe relationships between the AD neuroimaging bio-markers (at baseline) and the MoCA/UDS3 global com-posite in CDR 0 and CDR 0.5 individuals were examined
using multiple regression models in the R statisticalcomputing environment. As in study 1, due to the highdegree of correlation between the MoCA and UDS 3global composite scores, non-nested model comparisonmetrics (i.e., R2, AIC, BIC, and deviance) were used inlieu of a single, nested multiple regression model toavoid potential confounding multicollinearity issues.Separate models were run predicting each biomarkerand separately for each subset of the data (i.e., CDR 0 s,CDR 0.5 s) using demographic predictor variables as thecovariates and either the MoCA or the UDS 3 globalcomposite as the key independent variable. For allmodels, males served as the reference group for the gen-der variable, and APOE negative served as the referencegroup for the APOE variable.
ResultsDemographicsParticipants included 416 mostly older adults aged 45 to92 years old enrolled in ongoing studies at the KnightADRC (see Table 5 for the complete demographic infor-mation) and who had completed at least one relevant bio-marker scan and a clinical assessment. Most participants(n = 365) were cognitively normal with a CDR of 0.
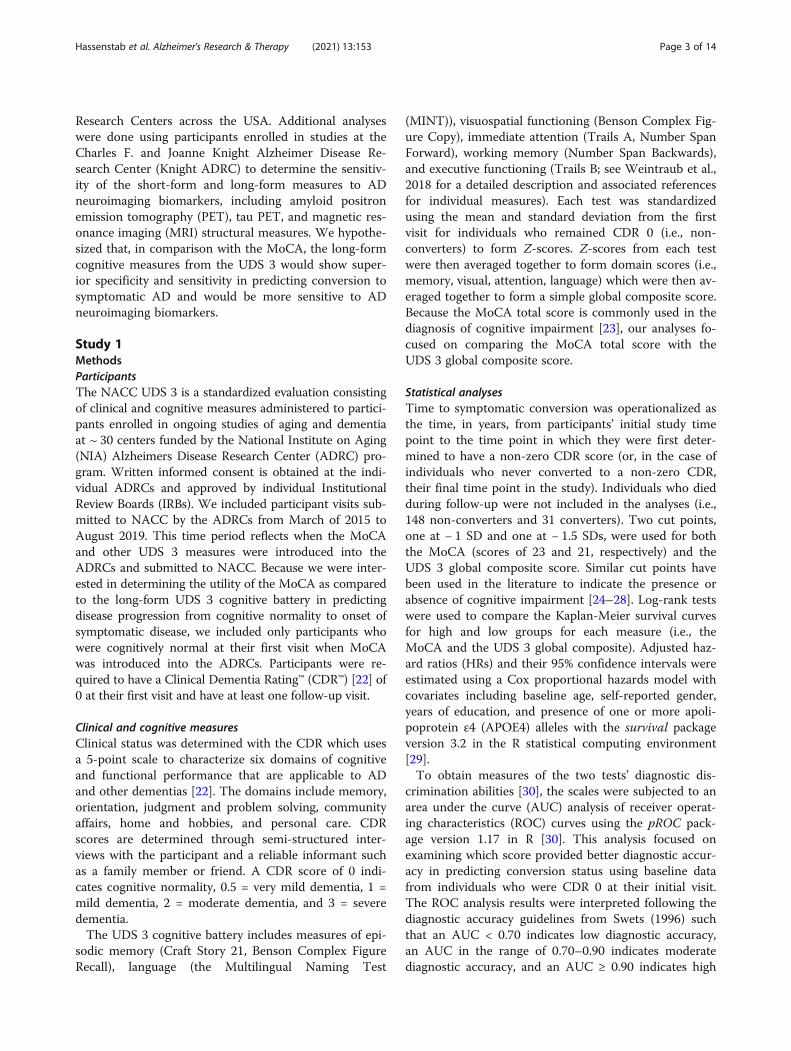
Regression resultsAs shown in Table 6, analyses of CDR 0 participants in-dicated small but significant relationships between bothshort- and long-form scores (i.e., the MoCA and UDS 3global composite) and tau PET and cortical thickness (ps0.007–0.03). Model comparison results indicated thatthe MoCA and UDS 3 global composite were relativelysimilarly sensitive in predicting biomarker values as indi-cated by the R2, AIC, BIC, and deviance values (seeTable 6). As expected, in the CDR 0.5 subsample, therewere stronger relationships between the MoCA andUDS 3 global composite and all of the neuroimagingbiomarkers, including amyloid PET, as compared to theCDR 0 sample (see Table 7). Model comparison analysesindicated that the MoCA was a better predictor of bio-marker levels as compared to the UDS 3 global compos-ite in the CDR 0.5. Scatterplots showing therelationships between the MoCA and UDS 3 globalcomposite score and the three neuroimaging biomarkers,with separate regression lines for CDR 0 and 0.5 s, aredisplayed in Fig. 2. As shown in the scatterplots, and asmade evident by the regression models, both the MoCAand UDS 3 global composite were essentially equivalentin their associations with the neuroimaging ADbiomarkers.
General discussionThe present study compared the efficacy of a popularshort-form cognitive measure (MoCA) against a global
Hassenstab et al. Alzheimer's Research & Therapy (2021) 13:153 Page 7 of 14

composite score created from the more comprehensivelong-form UDS3 cognitive battery in predicting AD pro-gression. AD progression was operationalized as thetime to the onset of initial symptoms. Additionally, wecompared the short- and long-form measures on theirsensitivity to AD neuroimaging biomarkers. Using datafrom the NACC, we compared the survival analyses,ROC curves, and multiple regression models using theMoCA total score and a global cognitive composite toinvestigate whether one measure outperformed theother. In a sample of data from the Knight ADRC, whichincluded several neuroimaging biomarkers in addition toboth the MoCA and UDS 3 cognitive battery, we furtherinvestigated the predictive power of each score in pre-dicting biomarker levels in participants who were cogni-tively normal (CDR 0) and in those with very milddementia (CDR 0.5).Our first hypothesis, that the long-form measure
would outperform the MoCA in predicting diseaseprogression, was supported, although both measuresproduced only modest associations. We comparedcommonly used standard deviation (SD) cut points, at− 1.0 SD and − 1.5 SD, for both measures. Similar cutpoints have been used in the literature to indicate thepresence or absence of cognitive impairment [24–28].HRs from the survival analyses indicated that boththe MoCA and UDS 3 global composite were rela-tively equivalent in their sensitivity to symptomaticconversion, though ROC analyses indicated that
neither reached the threshold for acceptable diagnos-tic accuracy. Model comparison analyses in theNACC sample indicated that the UDS 3 global com-posite outperformed the MoCA by only a slimmargin.It appears that longer, more comprehensive cogni-
tive assessments may afford a marginal benefit overshorter cognitive screening measures like the MoCAwhen used to predict the time to symptomatic dis-ease onset. In contrast, when stricter cut points wereused (i.e., − 1.5 SDs), the MoCA outperformed thelong-form composite score. These findings should beinterpreted with caution, however, because there arefar fewer cases at this low-performance threshold forthe long-form global composite than the MoCA (seeTable 2 and confidence interval magnitude in Fig. 1),which was expected given that the sample was se-lected based on a baseline CDR of 0. These data alsocorroborate existing studies which find that cutoffscores, which purportedly identify individuals at thegreatest risk for cognitive decline and symptom on-set [2], have unacceptably poor predictive power,even when coupled with AD biomarker information[40].We also hypothesized that the long-form global
composite would prove superior to the MoCA in as-sociations with AD neuroimaging biomarkers includ-ing amyloid PET, tau PET, and an AD-specific ROIcortical thickness measure. However, analyses in the
Table 5 Study 2 demographic data
CDR 0, N = 3651 0.5, N = 511 p2
Age 71 (6) 74 (6) < 0.001
Gender 0.12
Female 211 (58%) 23 (45%)
Male 154 (42%) 28 (55%)
Education (years) 16 (2) 16 (3) 0.076
APOE 0.001
Neg. 245 (67%) 22 (43%)
Pos. 119 (33%) 29 (57%)
Race 0.83
White 320 (88%) 45 (88%)
Black or African American 41 (11%) 5 (9.8%)
Others (American Indian, Alaska Native, Native Hawaiian, Pacific Islander, or Asian) 4 (1.1%) 1 (2.0%)
MoCA 26 (2) 22 (4) < 0.001
UDS 3 global composite 0.22 (0.58) − 0.62 (0.73) < 0.001
Amyloid PET (Centiloid) 17 (24) 59 (40) < 0.001
Tau PET SUVR 1.22 (0.19) 1.64 (0.56) < 0.001
AD ROI cortical thickness (mm) 2.82 (0.14) 2.64 (0.21) < 0.0011Mean (SD); n (%)2Welch two-sample t-test; Pearson’s chi-squared test
Hassenstab et al. Alzheimer's Research & Therapy (2021) 13:153 Page 8 of 14

Table
6Biom
arkermultip
leregression
mod
elsforCDR0s
Pred
ictor
AmyloidPE
T(Cen
tiloid)
TauPE
T(SUVR)
ADRO
ICorticalT
hickne
ss
Beta
95%
CI
pBeta
95%
CI
pBeta
95%
CI
pBeta
95%
CI
pBeta
95%
CI
pBeta
95%
CI
p
Age
0.04
0.03,0.06
<0.001
0.04
0.03,0.06
<0.001
0.05
0.03,0.06
<0.001
0.05
0.03,0.06
<0.001
−0.05
−0.06,−
0.03
<0.001
−0.05
−0.06,−
0.03
<0.001
Gen
der
0.14
−0.07,0.35
0.20
0.12
−0.09,0.33
0.30
0.57
0.35,0.78
<0.001
0.52
0.31,0.73
<0.001
0.21
−0.01,0.42
0.056
0.24
0.03,0.45
0.028
Educ
ation
0.02
−0.03,0.06
0.50
0.01
−0.03,0.06
0.60
0.04
−0.01,0.09
0.087
0.04
−0.01,0.08
0.12
−0.06
−0.11,−
0.01
0.013
−0.06
−0.10,−
0.01
0.013
APO
E0.56
0.34,0.78
<0.001
0.56
0.34,0.78
<0.001
0.32
0.10,0.54
0.004
0.32
0.10,0.54
0.005
−0.10
−0.32,0.12
0.40
−0.10
−0.32,0.12
0.40
MoC
A−0.05
−0.16,0.06
0.30
−0.15
−0.26,−
0.04
0.007
0.13
0.02,0.24
0.024
Global
composite
−0.01
−0.18,0.17
>0.9
−0.2
−0.38,−
0.02
0.028
0.22
0.03,0.40
0.02
R20.128
0.126
0.165
0.158
0.133
0.134
AIC
916
917
864
867
881
880
BIC
942
943
891
893
907
907
Deviance
291
292
267
269
278
278
Imag
ingbiom
arkers
stan
dardized
usingCDR0means
andSD
s.Be
tascanbe
interpretedas
thede
gree
ofbiom
arkerchan
gein
SDsforevery1-un
itchan
gein
thepred
ictor
CIconfiden
ceinterval
Hassenstab et al. Alzheimer's Research & Therapy (2021) 13:153 Page 9 of 14

Table
7Biom
arkermultip
leregression
mod
elsforCDR0.5s
Pred
ictor
AmyloidPE
T(Cen
tiloid)
TauPE
T(SUVR)
ADRO
ICorticalT
hickne
ss
Beta
95%
CI
pBeta
95%
CI
pBeta
95%
CI
pBeta
95%
CI
pBeta
95%
CI
pBeta
95%
CI
p
Age
0.03
−0.04,0.10
0.40
0.03
−0.04,0.10
0.40
−0.12
−0.23,−
0.01
0.026
−0.13
−0.26,−
0.01
0.041
−0.05
−0.12,0.01
0.11
−0.05
−0.12,0.02
0.13
Gen
der
0.61
−0.24,1.5
0.20
0.63
−0.24,1.5
0.15
1.10
−0.24,2.3
0.11
1.10
−0.44,2.6
0.20
−0.02
−0.85,0.81
>0.9
−0.05
−0.94,0.84
>0.9
Educ
ation
0.02
−0.18,0.21
0.90
0.03
−0.19,0.25
0.80
0.22
−0.08,0.52
0.14
0.19
−0.20,0.58
0.30
−0.18
−0.37,0.02
0.073
−0.11
−0.33,0.12
0.40
APO
E1.2
0.37,2.1
0.006
1.3
0.45,2.2
0.004
0.85
−0.48,2.2
0.2
1.30
−0.29,2.8
0.11
−0.04
−0.90,0.81
>0.9
−0.2
−1.1,0.70
0.70
MoC
A−0.33
−0.61,−
0.06
0.018
−1.2
−1.6,−0.74
<0.001
0.36
0.09,0.63
0.009
Global
composite
−0.85
−1.7,−0.04
0.041
−2.4
−3.8,−1.0
0.002
0.45
−0.39,1.3
0.30
R20.383
0.362
0.572
0.406
0.206
0.088
AIC
171
173
206
221
169
175
BIC
184
185
218
233
182
188
Deviance
77.6
80.2
173
241
7485
Imag
ingbiom
arkers
stan
dardized
usingCDR0means
andSD
s.Be
tascanbe
interpretedas
thede
gree
ofbiom
arkerchan
gein
SDsforevery1-un
itchan
gein
thepred
ictor
CIconfiden
ceinterval
Hassenstab et al. Alzheimer's Research & Therapy (2021) 13:153 Page 10 of 14

Knight ADRC sample did not support this hypothesis.There were only minor associations between theMoCA and long-form global composite measures andtau PET SUVR and cortical thickness in CDR 0 indi-viduals. As expected, and consistent with prior workin this cohort [41, 42], more robust relationships wereseen in CDR 0.5 s and significant effects extended toall three imaging markers, including amyloid PET. Al-though it may be somewhat surprising that amyloidPET was not significantly associated with either cog-nitive measure in the CDR 0 participants, this hasbeen observed in previous studies. Specifically,
relationships with amyloid and cognition are relativelyinconsistent [43–45], and accumulating evidence sug-gests that changes in cognition in the preclinicalstages of AD are predominantly driven by tau path-ology and structural changes, rather than by amyloidalone [41, 46, 47].
LimitationsThe findings of this study should be considered in lightof a number of limitations, which may be addressed infuture studies. First, although it would be optimal to dir-ectly compare the performance of the short-form and
Fig. 2 Biomarker correlations with MoCA/UDS 3 global composite by CDR group
Hassenstab et al. Alzheimer's Research & Therapy (2021) 13:153 Page 11 of 14

long-form measures to one another in a single multipleregression, the high degree of correlation between themeasures would result in potential multicollinearity is-sues if included in a single model together. Thus, ouranalyses were restricted to non-nested model compari-son techniques. Second, we only compare baseline per-formance of the short-form and long-form measureshere; it is possible that the long-form battery is moresensitive to decline than the short-form MoCA whenassessing longitudinal change. Third, only a limitednumber of demographic covariates were included in themodels presented. It is, of course, possible that the re-sults may differ if other covariates were included. Finally,the participants included in the NACC cohort and theKnight ADRC cohort are composed of mostly highlymotivated older adults who are comprehensively pheno-typed and often engaged in imaging and fluid biomarkerstudies and therefore are not representative of the gen-eral population. Although a primary goal of the NIAADRC programs and the Knight ADRC is to diversifyenrollment to include underrepresented persons in agingand dementia research, the participants in these studiesare primarily White and highly educated (see Tables 1and 5).
ConclusionsUltimately, the MoCA and UDS 3 global composite ex-hibit relatively equivalent, but limited, sensitivity tosymptomatic conversion. Thus, depending on the usecase, choosing the MoCA over longer cognitive batteriesmay afford sufficient sensitivity while also reducing ad-ministration time, costs, and participant burden. On theother hand, longer and more comprehensive measuresdo provide some unique power in predicting diseaseprogression, depending on the cutoff point used. Ashortcoming of both approaches is that neither demon-strated acceptable classification accuracy nor robust bio-marker relationships in cognitively normal participants.In order for researchers and clinicians to reliably detectAD pathology in preclinical individuals, novel assess-ment methodologies with increased sensitivity and reli-ability (such as ecological momentary assessment studiesor paradigms which move away from the traditional“one-shot” approach [48]) are necessary.
AcknowledgementsThe NACC database is funded by NIA/NIH Grant U24 AG072122. NACC dataare contributed by the NIA-funded ADRCs: P30 AG019610 (PI Eric Reiman,MD), P30 AG013846 (PI Neil Kowall, MD), P50 AG008702 (PI Scott Small, MD),P50 AG025688 (PI Allan Levey, MD, PhD), P50 AG047266 (PI Todd Golde, MD,PhD), P30 AG010133 (PI Andrew Saykin, PsyD), P50 AG005146 (PI Marilyn Al-bert, PhD), P50 AG005134 (PI Bradley Hyman, MD, PhD), P50 AG016574 (PIRonald Petersen, MD, PhD), P50 AG005138 (PI Mary Sano, PhD), P30AG008051 (PI Thomas Wisniewski, MD), P30 AG013854 (PI Robert Vassar,PhD), P30 AG008017 (PI Jeffrey Kaye, MD), P30 AG010161 (PI David Bennett,MD), P50 AG047366 (PI Victor Henderson, MD, MS), P30 AG010129 (PI CharlesDeCarli, MD), P50 AG016573 (PI Frank LaFerla, PhD), P50 AG005131 (PI James
Brewer, MD, PhD), P50 AG023501 (PI Bruce Miller, MD), P30 AG035982 (PIRussell Swerdlow, MD), P30 AG028383 (PI Linda Van Eldik, PhD), P30AG053760 (PI Henry Paulson, MD, PhD), P30 AG010124 (PI John Trojanowski,MD, PhD), P50 AG005133 (PI Oscar Lopez, MD), P50 AG005142 (PI HelenaChui, MD), P30 AG012300 (PI Roger Rosenberg, MD), P30 AG049638 (PI Su-zanne Craft, PhD), P50 AG005136 (PI Thomas Grabowski, MD), P50 AG033514(PI Sanjay Asthana, MD, FRCP), P30 AG066444 (PI John C. Morris, MD), andP50 AG047270 (PI Stephen Strittmatter, MD, PhD).
Authors’ contributionsJH, MLR, JN, and AA were responsible for the study concept and design anddrafting of the manuscript. JH, JN, and AA completed all the statisticalanalyses with critical input from CX. JH, TB, and JM acquired funding andwere responsible for the data collection. All authors provided criticalfeedback on the analyses and manuscript. All authors read and approved thefinal manuscript.
FundingStudy 1: See Acknowledgements.Study 2: This work was supported by NIA Grants P01AG03991, P01AG026276,K01AG053474, and P30AG066444.
Availability of data and materialsThe datasets used and/or analyzed during the current study are availablefrom the corresponding author upon reasonable request.
Declarations
Ethics approval and consent to participateParticipants provided written informed consent, and all study procedureswere approved by the individual ADRCs and approved by InstitutionalReview Boards as required for participation in NACC.
Consent for publicationNot applicable.
Competing interestsNeither Dr. Morris nor his family owns stock or has equity interest (outside ofmutual funds or other externally directed accounts) in any pharmaceutical orbiotechnology company. The other authors declare that they have nocompeting interests.
Author details1Charles F. and Joanne Knight Alzheimer Disease Research Center,Department of Neurology, Washington University School of Medicine, St.Louis, MO, USA. 2Department of Psychological & Brain Sciences, WashingtonUniversity in St. Louis, St. Louis, MO, USA. 3Department of Radiology,Washington University School of Medicine, St. Louis, MO, USA. 4Division ofBiostatistics, Washington University School of Medicine, St. Louis, MO, USA.
Received: 8 July 2021 Accepted: 24 August 2021
References1. Twamley EW, Ropacki SA, Bondi MW. Neuropsychological and
neuroimaging changes in preclinical Alzheimer’s disease. J Int NeuropsycholSoc. 2006;12(5):707–35. https://doi.org/10.1017/S1355617706060863.
2. Vos SJ, Xiong C, Visser PJ, Jasielec MS, Hassenstab J, Grant EA, et al.Preclinical Alzheimer’s disease and its outcome: a longitudinal cohort study.Lancet Neurol. 2013;12(10):957–65. https://doi.org/10.1016/S1474-4422(13)70194-7.
3. Edmonds EC, Delano-Wood L, Galasko DR, Salmon DP, Bondi MW. Subtlecognitive decline and biomarker staging in preclinical Alzheimer’s disease. JAlzheimers Dis. 2015;47(1):231–42. https://doi.org/10.3233/JAD-150128.
4. Jack CR Jr, Bennett DA, Blennow K, Carrillo MC, Dunn B, Haeberlein SB, et al.NIA-AA research framework: toward a biological definition of Alzheimer’sdisease. Alzheimers Dement. 2018;14(4):535–62. https://doi.org/10.1016/j.jalz.2018.02.018.
5. Sliwinski MJ, Smyth JM, Hofer SM, Stawski RS. Intraindividual coupling ofdaily stress and cognition. Psychol Aging. 2006;21(3):545–57. https://doi.org/10.1037/0882-7974.21.3.545.
Hassenstab et al. Alzheimer's Research & Therapy (2021) 13:153 Page 12 of 14

6. Bambrah V, Hsu CF, Toplak ME, Eastwood JD. Anticipated, experienced, andremembered subjective effort and discomfort on sustained attention versusworking memory tasks. Conscious Cogn. 2019;75:102812. https://doi.org/10.1016/j.concog.2019.102812.
7. McGuire JT, Botvinick MM. Prefrontal cortex, cognitive control, and theregistration of decision costs. Proc Natl Acad Sci. 2010;107(17):7922–6.https://doi.org/10.1073/pnas.0910662107.
8. Calamia M, Markon K, Tranel D. The robust reliability of neuropsychologicalmeasures: meta-analyses of test–retest correlations. Clin Neuropsychol. 2013;27(7):1077–105. https://doi.org/10.1080/13854046.2013.809795.
9. Folstein MF, Folstein SE, McHugh PR. “Mini-mental state.” A practicalmethod for grading the cognitive state of patients for the clinician. JPsychiatr Res. 1975;12(3):189–98. https://doi.org/10.1016/0022-3956(75)90026-6.
10. Mitchell AJ. A meta-analysis of the accuracy of the mini-mental stateexamination in the detection of dementia and mild cognitive impairment. JPsychiatr Res. 2009;43(4):411–31. https://doi.org/10.1016/j.jpsychires.2008.04.014.
11. Arevalo-Rodriguez I, Smailagic N, i Figuls MR, Ciapponi A, Sanchez-Perez E,Giannakou A, et al. Mini-Mental State Examination (MMSE) for the detectionof Alzheimer’s disease and other dementias in people with mild cognitiveimpairment (MCI). Cochrane Database Syst Rev. 2015;3:1–68.
12. Lacy M, Kaemmerer T, Czipri S. Standardized mini-mental state examinationscores and verbal memory performance at a memory center: implicationsfor cognitive screening. Am J Alzheimers Dis Other Demen®. 2015;30(2):145–52.
13. Spencer RJ, Wendell CR, Giggey PP, Katzel LI, Lefkowitz DM, Siegel EL, et al.Psychometric limitations of the mini-mental state examination amongnondemented older adults: an evaluation of neurocognitive and magneticresonance imaging correlates. Exp Aging Res. 2013;39(4):382–97. https://doi.org/10.1080/0361073X.2013.808109.
14. Trzepacz PT, Hochstetler H, Wang S, Walker B, Saykin AJ. Relationshipbetween the Montreal Cognitive Assessment and Mini-mental StateExamination for assessment of mild cognitive impairment in older adults.BMC Geriatr. 2015;15(1):1–9.
15. Newman JC, Feldman R. Copyright and open access at the bedside. N EnglJ Med. 2011;365(26):2447–9. https://doi.org/10.1056/NEJMp1110652.
16. de Silva V, Hanwella R. Why are we copyrighting science? BMJ. 2010;341:c4738.17. Weintraub S, Besser L, Dodge HH, Teylan M, Ferris S, Goldstein FC, et al.
Version 3 of the Alzheimer Disease Centers’ neuropsychological test batteryin the Uniform Data Set (UDS). Alzheimer Dis Assoc Disord. 2018;32(1):10–7.https://doi.org/10.1097/WAD.0000000000000223.
18. Besser L, Kukull W, Knopman DS, Chui H, Galasko D, Weintraub S, et al.Version 3 of the National Alzheimer’s Coordinating Center’s Uniform DataSet. Alzheimer Dis Assoc Disord. 2018;32(4):351–8. https://doi.org/10.1097/WAD.0000000000000279.
19. Nasreddine ZS, Phillips NA, Bédirian V, Charbonneau S, Whitehead V, Collin I,et al. The Montreal Cognitive Assessment, MoCA: a brief screening tool formild cognitive impairment. J Am Geriatr Soc. 2005;53(4):695–9. https://doi.org/10.1111/j.1532-5415.2005.53221.x.
20. Pinto TC, Machado L, Bulgacov TM, Rodrigues-Júnior AL, Costa ML, XimenesRC, et al. Is the Montreal Cognitive Assessment (MoCA) screening superiorto the Mini-Mental State Examination (MMSE) in the detection of mildcognitive impairment (MCI) and Alzheimer’s Disease (AD) in the elderly? IntPsychogeriatr. 2019;31(4):491–504. https://doi.org/10.1017/S1041610218001370.
21. Eguchi A, Kimura N, Aso Y, Yabuuchi K, Ishibashi M, Hori D, et al.Relationship between the Japanese version of the Montreal CognitiveAssessment and PET imaging in subjects with mild cognitive impairment.Curr Alzheimer Res. 2019;16(9):852–60. https://doi.org/10.2174/1567205016666190805155230.
22. Morris JC. The clinical dementia rating (CDR): current version and scoringrules. Neurology. 1993;41:1588–92.
23. Carson N, Leach L, Murphy KJ. A re-examination of Montreal CognitiveAssessment (MoCA) cutoff scores. Int J Geriatr Psychiatry. 2018;33(2):379–88.https://doi.org/10.1002/gps.4756.
24. Holtzer R, Goldin Y, Zimmerman M, Katz M, Buschke H, Lipton RB. Robustnorms for selected neuropsychological tests in older adults. Arch ClinNeuropsychol. 2008;23(5):531–41. https://doi.org/10.1016/j.acn.2008.05.004.
25. Jak AJ, Bondi MW, Delano-Wood L, Wierenga C, Corey-Bloom J, Salmon DP,et al. Quantification of five neuropsychological approaches to defining mild
cognitive impairment. Am J Geriatr Psychiatry. 2009;17(5):368–75. https://doi.org/10.1097/JGP.0b013e31819431d5.
26. Petersen RC, Smith GE, Waring SC, Ivnik RJ, Tangalos EG, Kokmen E. Mildcognitive impairment: clinical characterization and outcome. Arch Neurol.1999;56(3):303–8. https://doi.org/10.1001/archneur.56.3.303.
27. Storandt M, Morris JC. Ascertainment bias in the clinical diagnosis ofAlzheimer disease. Arch Neurol. 2010;67(11):1364–9. https://doi.org/10.1001/archneurol.2010.272.
28. Winblad B, Palmer K, Kivipelto M, Jelic V, Fratiglioni L, Wahlund LO, et al. Mildcognitive impairment–beyond controversies, towards a consensus: report ofthe International Working Group on Mild Cognitive Impairment. J Intern Med.2004;256(3):240–6. https://doi.org/10.1111/j.1365-2796.2004.01380.x.
29. Therneau TM, Lumley T. Package ‘survival’. R Top Doc. 2015;128(10):28–33.30. Robin X, Turck N, Hainard A, Tiberti N, Lisacek F, Sanchez JC, et al. pROC: an
open-source package for R and S+ to analyze and compare ROC curves.BMC Bioinformatics. 2011;12(1):1–8.
31. Swets JA. Signal detection theory and ROC analysis in psychology anddiagnostics: collected papers. New York: Psychology Press; 2014. https://doi.org/10.4324/9781315806167.
32. Su Y, Flores S, Hornbeck RC, Speidel B, Vlassenko AG, Gordon BA, et al.Utilizing the Centiloid scale in cross-sectional and longitudinal PiB PETstudies. NeuroImage Clin. 2018;19:406–16. https://doi.org/10.1016/j.nicl.2018.04.022.
33. Su Y, Flores S, Wang G, Hornbeck RC, Speidel B, Joseph-Mathurin N, et al.Comparison of Pittsburgh compound B and florbetapir in cross-sectionaland longitudinal studies. Alzheimers Dement Diagn Asses Dis Monit. 2019;11(1):180–90.
34. Su Y, D’Angelo GM, Vlassenko AG, Zhou G, Snyder AZ, Marcus DS, et al.Quantitative analysis of PiB-PET with freesurfer ROIs. PLoS One. 2013;8(11):e73377. https://doi.org/10.1371/journal.pone.0073377.
35. Mishra S, Gordon BA, Su Y, Christensen J, Friedrichsen K, Jackson K, et al. AV-1451 PET imaging of tau pathology in preclinical Alzheimer disease:defining a summary measure. Neuroimage. 2017;161:171–8. https://doi.org/10.1016/j.neuroimage.2017.07.050.
36. Head D, Rodrigue KM, Kennedy KM, Raz N. Neuroanatomical and cognitivemediators of age-related differences in episodic memory. Neuropsychology.2008;22(4):491–507. https://doi.org/10.1037/0894-4105.22.4.491.
37. Raz N, Lindenberger U, Ghisletta P, Rodrigue KM, Kennedy KM, Acker JD.Neuroanatomical correlates of fluid intelligence in healthy adults andpersons with vascular risk factors. Cereb Cortex. 2008;18(3):718–26. https://doi.org/10.1093/cercor/bhm108.
38. Singh V, Chertkow H, Lerch JP, Evans AC, Dorr AE, Kabani NJ. Spatialpatterns of cortical thinning in mild cognitive impairment andAlzheimer’s disease. Brain. 2006;129(11):2885–93. https://doi.org/10.1093/brain/awl256.
39. Fischl B, Dale AM. Measuring the thickness of the human cerebral cortexfrom magnetic resonance images. Proc Natl Acad Sci. 2000;97(20):11050–5.https://doi.org/10.1073/pnas.200033797.
40. Hassenstab J, Monsell SE, Mock C, Roe CM, Cairns NJ, Morris JC, et al.Neuropsychological markers of cognitive decline in persons with Alzheimerdisease neuropathology. J Neuropathol Exp Neurol. 2015;74(11):1086–92.https://doi.org/10.1097/NEN.0000000000000254.
41. Aschenbrenner AJ, Gordon BA, Benzinger TL, Morris JC, Hassenstab JJ.Influence of tau PET, amyloid PET, and hippocampal volume on cognitionin Alzheimer disease. Neurology. 2018;91(9):e859–66. https://doi.org/10.1212/WNL.0000000000006075.
42. Brier MR, Gordon B, Friedrichsen K, McCarthy J, Stern A, Christensen J, et al.Tau and Aβ imaging, CSF measures, and cognition in Alzheimer’s disease.Sci Transl Med. 2016;8(338):338ra66.
43. Dang C, Harrington KD, Lim YY, Ames D, Hassenstab J, Laws SM, et al.Relationship between amyloid-β positivity and progression to mildcognitive impairment or dementia over 8 years in cognitively normalolder adults. J Alzheimers Dis. 2018;65(4):1313–25. https://doi.org/10.3233/JAD-180507.
44. Baker JE, Lim YY, Pietrzak RH, Hassenstab J, Snyder PJ, Masters CL, et al.Cognitive impairment and decline in cognitively normal older adults withhigh amyloid-β: a meta-analysis. Alzheimers Dement Diagn Asses Dis Monit.2017;6:108–21.
45. Han SD, Nguyen CP, Stricker NH, Nation DA. Detectable neuropsychologicaldifferences in early preclinical Alzheimer’s disease: a meta-analysis.Neuropsychol Rev. 2017;27(4):305–25.
Hassenstab et al. Alzheimer's Research & Therapy (2021) 13:153 Page 13 of 14

46. Mattsson-Carlgren N, Leuzy A, Janelidze S, Palmqvist S, Stomrud E,Strandberg O, et al. The implications of different approaches to define AT(N) in Alzheimer disease. Neurology. 2020;94(21):e2233–44. https://doi.org/10.1212/WNL.0000000000009485.
47. Hanseeuw BJ, Betensky RA, Jacobs HI, Schultz AP, Sepulcre J, Becker JA,et al. Association of amyloid and tau with cognition in preclinical Alzheimerdisease: a longitudinal study. JAMA Neurol. 2019;76(8):915–24. https://doi.org/10.1001/jamaneurol.2019.1424.
48. Hassenstab J, Aschenbrenner AJ, Balota DA, McDade E, Lim YY, Fagan AM,et al. Remote cognitive assessment approaches in the Dominantly InheritedAlzheimer Network (DIAN) Using digital technology to drive clinicalinnovation in brain-behavior relationships: a new era in neuropsychology.Alzheimers Dement. 2020;16:e038144.
Publisher’s NoteSpringer Nature remains neutral with regard to jurisdictional claims inpublished maps and institutional affiliations.
Hassenstab et al. Alzheimer's Research & Therapy (2021) 13:153 Page 14 of 14