Embed Size (px)
Citation preview

Republic of the Philippines
Irrigated Rice Production Enhancement Project (IRPEP)
Authors:
Aslihan Arslan, Daniel Higgins, Paul Winters, Fabrizio Bresciani

The opinions expressed in this publication are those of the authors and do not necessarily represent those of the
International Fund for Agricultural Development (IFAD). The designations employed and the presentation of
material in this publication do not imply the expression of any opinion whatsoever on the part of IFAD concerning
the legal status of any country, territory, city or area or of its authorities, or concerning the delimitation of its
frontiers or boundaries. The designations “developed” and “developing” countries are intended for statistical
convenience and do not necessarily express a judgement about the stage reached in the development process by a
particular country or area.
This publication or any part thereof may be reproduced without prior permission from IFAD, provided that the
publication or extract therefrom reproduced is attributed to IFAD and the title of this publication is stated in any
publication and that a copy thereof is sent to IFAD.
A. Arslan, D. Higgins, P. Winters and F. Bresciani. 2018. Impact Assessment of the Irrigated Rice Production
Enhancement Project, Philippines. Rome: IFAD.
Cover image: ©IFAD/ GMB Akash
© IFAD 2018
All rights reserved.

Acknowledgements
The authors thank Jerry Jing Pacturan, Yolando Arban and Tawfiq el-Zabri for comments and
suggestions on earlier versions of this document. Walfredo Rola and Filma Calao of the Southeast
Asian Regional Center for Graduate Study and Research in Agriculture (SEARCA) have provided
excellent supervision and management of data collection activities as part of the Impact Assessment
(IA). This report benefited significantly from the feedback received during the IRPEP Results
Sharing Workshop and the Knowledge Learning Market and Policy Engagement (KLMPE) event in
November 2017 in Manila. We are especially grateful to the staff members of the Philippines
Department of Agriculture (DA), the National Irrigation Administration (NIA) and the Local
Government Unit (LGU) assigned to support the RaFPEP and IRPEP implementation for their
technical and field support during the activities conducted for this IA.

Table of Contents
Executive summary ................................................................................................................................ 1
1. Introduction ........................................................................................................................................ 3
2. Theory of change and research questions ........................................................................................... 5
3. Impact assessment design: Data and methodology .......................................................................... 11
4. Profile of the project area and sample .............................................................................................. 17
5. Results .............................................................................................................................................. 22
6. Conclusions ...................................................................................................................................... 33
Appendices ........................................................................................................................................... 40

1
Executive summary
Smallholder rice farming is central to poverty reduction, food security, and rural development in the
Philippines. Currently, rice affordability is threatened by the country's protectionist approach to rice
imports and low production efficiency. One key issue is that around 41 percent of the country's
irrigable land is not irrigated. Moreover, many irrigation systems are suggested to be poorly
managed with unequal water distribution.
The Irrigated Rice Production Enhancement Project (IRPEP) was implemented in three regions (VI,
VII and X) of the Philippines between 2010-2015. It was designed to improve rice productivity and
smallholder livelihoods by strengthening canal irrigation infrastructure of Communal Irrigation
Systems (CIS), improving the capacity of the Irrigators' Associations (IAs) that manage the CIS, and
offering complementary marketing support, Farmer Field Schools, and emergency seed buffer
stocks. As the government provides FFS and buffer stocks to farmers across the country, we focus
the assessment on the irrigation and marketing activities only. We define the impact indicators based
on IRPEP's theory of change, which maps the inputs and activities of the project to outcomes and
impacts through various channels.
The analysis is based on quantitative data from 2,104 households and 113 IAs covering beneficiary
and non-beneficiary groups, along with qualitative data from project and IA staff. We estimate
IRPEP's impact by comparing beneficiary and non-beneficiary households and IAs using statistical
matching techniques to ensure a clean and unbaised comparison. We then use the qualitative data to
try to identify the underlying factors that shaped the results. We particularly focus our analysis on
regional heterogeneities in impacts because of the considerable differences between the three project
regions. The main difference between regions stems from their varying levels of exposure to extreme
weather events (e.g. super typhoons), as Region VIII, and to a lesser extent Region VI, experienced
significant extreme weather damage during the project's implementation.
We find that IRPEP significantly increased household incomes by 11 percent, but project impact
differed significantly across the three regions. The reliability of irrigation was improved across
regions, but only in regions VI and X did this transfer into increased rice yields and income. In
Region VI, increased yields were driven by increased input use, but capital constraints meant that
these inputs were often purchased on credit, meaning households had to use a lot of their harvest to
pay back production costs rather than for sales. However, we find that overall household income was
still increased as households were able to diversify their income sources (mainly towards livestock
activities) through IRPEP support. The income and livestock effects in this region were also
transferred into improved nutrition outcomes measured by dietary diversity scores. In Region X,
improved yields were driven more by increased efficiency, which is transferred into increase rice
sales and rice revenues. However, the positive overall income effect in this region was curtailed
somewhat because households did not diversify their incomes. In Region VIII, extreme weather
damage during the project's implementation prevented households from taking advantage of
improved irrigation to improve their livelihoods.
One of the key expected sources of heterogeneity in impacts of improved irrigation is the distance of
parcels from the irrigation source: downstream parcels, which are usually cultivated by poorer
households, are expected to benefit more than upstream households. We find that downstream
parcels benefitted more from improved irrigation and rice yields, suggesting that IRPEP was
successful in improving the outcomes more for vulnerable households. However, improved yields

2
were not transferred into increased rice sales for this group. Another source of expected
heterogeneity is the size of the IA: smaller irrigation systems are perceived as easier to organise and
more efficient. The Philippines government has an ongoing policy of prioritising smaller IAs, we
therefore analyzed whether and how IRPEP impact changes by IA size. We find that impacts on
irrigation, yields and income were all more favourable for smaller systems, supporting the
aforementioned policy.
Our mixed-methods approach allows us to draw lessons from the seeming lack of effect of IRPEP's
marketing support based on quantitative data. Oualitative data highlighted a lack of suitability and
uptake of the market information services provided by IRPEP, and a lack of engagement in the
collective marketing encouraged by IRPEP. This was deemed to be due to households' existing
established relationships with individual traders, who often provide them with credit for inputs
partially addressing cresit constraints.
Finally, we find positive effects of IRPEP on the IA level outcomes, including IA membership,
income and expenditure. IRPEP's encouragement of women's involvement in IAs led to a significant
increase in the number of female IA officers. Most significantly given the recent abolishment of
water user fees, IRPEP served to increase IA income from sources other than water user fees,
suggesting they are now better situated to operate sustainably despite the loss of user fee income.
Several lessons for policy and practice can be drawn from this impact assessment. Firstly, we can
conclude that providing support to CIS in the Philippines can produce positive effects on rice yields
over a relatively short period of time. The study particularly highlights the value of combining
infrastructure and IA capacity building activities, something which could be taken on-board by the
government's irrigation administration and others providing irrigation interventions. Negative
outcomes from irrigation management decentralisation are commonly attributed to poor performance
of IAs, and the positive findings of this study show that, with appropriate support, IAs are able to
effectively conduct operation and maintenance of the systems to promote water- and gender-based
equity and sustainable agricultural benefits. It should be said, however, that careful consideration of
the institutional context should be prioritised if IRPEP-type intervention approaches receive more
investment. The success of decentralised irrigation and irrigation in general is highly dependent upon
sufficiently conducive institutions.
The study suggests that this type of support can help to shield farmers from extreme weather shocks,
as we find in Region VI. This has relevance for ongoing discussions about post-shock support to
CIS. As well as showing that support to CIS can serve as a useful tool in shielding farmers against
climate shocks, the lack of effect in Region VIII shows that the shield breaks down under
particularly extreme weather events and requires further support to aid recovery. This finding
provides evidence to support the case for the implementation of planned but long-delayed CIS fund
for post-shock rehabilitation.

3
1. Introduction
The Philippines 2017-2022 Development Plan has set a target for eradicating poverty by 2040,
where agricultural development plays a key role (NEDA, 2017). Agriculture generates around 11
percent of GDP in the country and provides livelihoods for 30 percent of the population (OECD,
2017). In rural areas, 70 percent of the population is poor and depends on agriculture – primarily rice
farming. Rice is also the single biggest source of energy and protein in Filipino diets, providing 46
percent of the calorie availability and 34 percent of protein (WFP 2017). With 99 percent of the
country's farms being family owned, and 88 percent of landholdings below three hectares, improving
smallholder rice farming is central to rural development in the Philippines (PSA, 2015).
Increasing rice production and improving productivity are major policy priorities in the Philippines,
which has one of the largest yield gaps in South Asia, and one of the highest rice import rates (FAO;
2010a; NEDA, 2017). The Government of the Philippines (GoP) has a stated goal of keeping rice
prices down, but has also implemented quantitative restrictions on rice imports in recent years,
preceding a current shift to tariffication (OECD, 2017; SEPO, 2017). Given this environment, rice
production must be improved by improving production efficiency. Particular challengenges
regarding productivity include low mechanisation and labour productivity in the face of frequent
typhoons and El-Niño-induced droughts, and rapid conversion of land away from agriculture, in
order to meet the rising demand from a fast-growing population (Bordey et al., 2016; Rosegrant et
al., 2016; NEDA, 2017; NEDA, 2011). In order to address these challenges, the National Irrigation
Administration (NIA) has made substantial investments to improve irrigation , but the effectiveness
of these investments has been questioned and around 41 percent of irrigable land in the country
remains unreached (Inocencio et al., 2016; PSA, 2016). Questions also remain over the extent to
which irrigation management should be decentralised to Communal Irrigation Systems (CIS), and
how best to ensure the sustainability of Irrigators' Associations (IA) that run the systems given the
recently announced abolishment of water user fees (NEDA, 2017).
As a response to the country's rice production challenges, the International Fund for Agricultural
Development (IFAD) in cooperation with the GoP has financed the Irrigated Rice Production
Enhancement Project (IRPEP) aimed at improving the productivity and incomes of smallholder rice
farmers in three regions of the Philippines. IRPEP was a sub-project of the Rapid Food Production
Enhancement Project (RaFPEP), along with the two-year Rapid Seed Supply Financing Project
(RaSSFiP), which provided emergency seeds in response to the 2008 food price spike. IRPEP was
implemented in Regions VI, VIII and X between 2010 and 2015 and had a total budget of US$22
million. The project sought to improve irrigation so as to increase rice productivity and farmer
incomes sustainably. IRPEP activities covered the expansion and improvement of the irrigation
infrastructure of CIS and building the capacity of their IAs through the provision of rice marketing
support and seed buffer stocks, as well as supplementary Farmer Field Schools. This report presents
the results of the IRPEP impact assessment that was conducted in 2017 as part of the IFAD 10 series
of impact assessments.1
Promoting decentralised irrigation system management to reduce monitoring and maintenance costs
has been a policy priority in the Philippines since the 1970s, reflecting similar policies worldwide
(Araral, 2011). The impacts of this policy are debated. Critics suggest that collective action failures
1 IFAD has committed to assessing the impact of 15 percent of its portfolio and reporting corporate level
impact during the IFAD10 replenishment period.

4
and weak capacity of local management has often resulted in ineffective operation, leading to
ineffective and unequal water distribution and low water user fee collection (Hayami and Kikuchi,
2000; Bandyopadhyay et al., 2007; Maleza and Nishimura, 2007; Kakuta, 2014). They add that the
limited support for capacity building provided to the decentralized systems has been ineffective
(Fujiie et al., 2005). Notwithstanding, the government still sees management transfer as central to its
rural development strategy, specifically focusing on smaller-scale systems, which are seen as more
cost efficient and easier to organize. The central government has recently abolished water user fee
payments from farmers to their IAs in order to address water access issues within IAs (NEDA,
2017). Given the focus of the policy discourse on the two main types of irrigation systems (National
Irrigation Systems (NIS) and CIS), which account for around 80 percent of the country's irrigated
land (PSA, 2016), the insights from a project like IRPEP, which targeted users of these systems to
improve their incomes and management capacities are timely.
The Philippines is one of the most natural disaster-prone countries in the world, and building
farmers' resilience to climate shocks is another key part of the country's development strategy (Kreft
et al., 2017; NEDA, 2017). Although irrigation plays a central role in this effort, the government's
support to irrigation systems after recent shocks has been questioned (NEDA, 2017; World Bank,
2017). One key policy debate is the different support provided to CIS and NIS. CIS are managed by
users through IAsthat can make payments to eventually become owners, while the NIS are
government-owned and -managed, with IAs performing some operation and maintenance tasks
(Decena, 2016). Importantly, only NIS receive government funds for rehabilitation after a shock, and
the discussions to create a similar fund for CIS rehabilitation have never been concluded (Gonzales,
1993)2. By testing the effectiveness of CIS, in areas severely affected by climate shocks, this study
provides insights into the potential of CIS to improve farmers' resilience, and therefore the extent to
which additional investment is justified.
This assessment particularly focuses on important contextual factors within each of the three project
regions. The Philippines is characterized by social, economic, political, and environmental
heterogeneities across regions, with each requiring its own specific strategy for stimulating rural
development (Balisacan et al., 2006). This assessment aims to provide evidence on the specific
contextual factors shaping the impacts of interventions that need to be considered in each region,
thus helping to formulate region-specific policies and practices going forward.
IRPEP was one of 22 projects with an irrigation component that were approved and financed by
IFAD worldwide between 2000-2015 for a total allocation of US$1.3 billion. The Asian
Development Bank has invested in over 200 irrigation projects to-date and aims to invest US$2-2.5
billion per year in irrigation projects until 2020 (ADB, 2017). In addition to testing the effectiveness
of IFAD's project, this impact assessment therefore represents an opportunity to generate lessons on
a linchpin of rural development strategies that can be used to improve future projects.
The next section of this report provides the details of the project including it's theory of change and
the research questions asked in the impact assessment. Section 3 explains the data and the methods
used to get an unbiased estimate of project impact, including descriptive statistics. Results and a
corresponding discussion are provided in section 5, followed by conclusions in section 6.
2 A Communal Irrigation Development Fund was established by Presidential Decree No. 552 in 1974, stating that the Fund would
support the rehabilition of CIS and the training of IAs.

5
2. Theory of change and research questions
Adequately identifying whether a project has the intended impact requires carefully considering the
theory of change (ToC) of the project—that is, how project investments are expected to lead to the
intended impact—and the corresponding questions that should be addressed in an impact assessment.
This section provides an overview of the ToC, with some notes on how the project was implemented,
and the research questions
2.1 IRPEP theory of change
As noted, IRPEP was a sub-project of RaFPEP, along with RaSSFiP and both of these sub-
programmes sought to address the fundamental development issue of low agricultural productivity
amongst smallholder rice farmers. While RaSSFIP offered short-term support by providing seeds, in
order to urgently address the food price crisis that was affecting many low income countries at the
time of implementation (Headey & Fan, 2008), IRPEP was designed to stimulate a sustainable, long-
term increase in productivity by providing multi-faceted support relating to inputs, capacity and
organisation.
Figure 1 presents the ToC for IRPEP. The diagram maps the main intended causal mechanisms
expected to be activated by the activities of the project (See White, 2009), and was constructed using
project documents, the surrounding literature, and input from project staff.
Working through interlinked causal pathways, the two main direct targets of IRPEP's activities are
increased rice productivity and greater benefits from rice market participation for beneficiary
households. IRPEP's primary component, CIS rehabilitation, is expected to expand the amount of
land covered by the systems and to improve the quantity, reliability and timely delivery of water
supply, with a key element being the cementing of irrigation canals to prevent loss of water through
seepage. This is expected to improve supply particularly during the dry season when water is scarce.
Improved irrigation is also expected to enhance fertiliser absorption and reduce vulnerability to
pests, improving the efficient use of related inputs and labour (IFC, 2003). As a result, more efficient
farming activities are expected to increase productivity and marketable surplus, leading to increased
income from crop sales, and improved food security and nutrition (Bhattarai et al., 2002; Godfray et
al., 2010; Knox et al., 2013).

6
Figure 1: Theory of change
Rehabilitation of CIS
Investment in canal
infrastructure – improved
water delivery and
expansion of area
Strengthening of
Irrigation Association
Strengthening of IA rules
Training of IA leadership
Inclusion of women
Farmer capacity building
Training on water and crop
management and provision
of buffer stocks
Improvement of post‑harvest management
CIS area expanded and
timely water delivery to
farmers improved
Irrigation associations
are established and
functioning with
greater membership
including women
Farmers trained on
water management and
in new rice production
technologies and
techniques
Availability of seeds
during natural disasters
is improved
Farmers provided with
information and skills
on post-harvest
management
Solar dryers, storage
warehouses and other
post-harvest facilities
are established
Household Level
Increased and more
efficient input use
Two season planting
and harvesting
Increased rice
productivity
Increased rice market
participation
Increased rice
profitability
Household Level
Increased income
Increased food
security/nutrition
Increased resilience of
production
Empowerment of
women
Increased schooling
IA Level
Ability to mobilise IA
owned implements
Ability to mobilise
additional resources
Ability to expand
activities
IA Level
Increased membership
and participation
Sustained management
structure
Collection and adequate
management of water
user fees
Increased involvement
of women in IAs
There is room to
improve canal
infrastructure
There is sufficient
support for the
establishment of IAs
There is sufficient
demand for training and
other supports
Engineers can improve
infrastructure
IAs can effectively
manage CIS
Training is appropriate
and will lead to adoption
Inputs are available to
take advantage of water
availability
Farm Level
Markets for inputs, credit, output, etc. exist and function well
Farmers face no other barriers to improving productivity such
as land access, soil quality, capital, weather conditions etc.
IA Level
Sufficient ability to govern the IAs by members
Reasonable support to IAs by national and local government
INPUTS AND ACTIVITIES
OUTPUTS OUTCOMES IMPACTS
AS
SU
MP
TIO
N

7
The IA capacity building component is expected to improve the quality of water supply and its
subsequent benefits through improved management and leadership of the CIS (Bagadion & Korten,
1991; Hamdy et al., 2009). As well as being better equipped to ensure the system is well-maintained,
the IAs are expected to become more sustainable through improved capacities of financial
management and resource mobilisation. The project benefits are expected to be sustainabile through
the virtuous cycle of strengthened CIS and IAs helping to create more active and productive farmers,
who then pay more in fees and maintenance assistance to further strengthen the CIS and IA. Also as
part of this component, the project encouraged the participation of women in IAs, which is expected
to increase female participation within the CIS and to empower them in their communities and
households (Jalal, 2014). Improved female empowerment is a goal in itself and one which also has
the potential to stimulate further economic progress in the household (World Bank, 2001; Duflo,
2012).
Beyond improving the amount of water supplied, the project aimed to make this supply more
equitable. In gravitational irrigation systems, especially those covering large areas with many
members, a major problem is the overuse of water by upstream households to the detriment of those
further downstream. In addition to causing an unequal distribution of the benefits of water supply,
this can also lead to increased water-related conflicts and a reduction in the collective action needed
for CIS to operate effectively (Fujiie et al., 2005; Kakuta, 2017). IRPEP's CIS rehabilitation
activities address this issue by implementing more sophisticated systems that often have water gates,
which ease the monitoring and control of water use. In addition, the capacity building component is
expected to better equip IAs to conduct this monitoring and to set and enforce rules of water use.
Supplementary effects on rice productivity and its subsequent benefits are also expected from the
provision of Farmer Field Schools (FFS), which provide training on the Palay Check System, and
through seed buffer stocks. The FFS training consists of eight checks for rice farmers that encourage
efficiency-enhancing use of technologies and practices relating to seeds, planting, nutrient and pest
management, water use, land levelling, and harvest timing (Mataia et al., 2015).
In addition to increasing agricultural income for beneficiaries by boosting productivity, IRPEP
directly aimed to increase market participation with its marketing support and post-harvest
processing components that aim to improve the prices received for rice crops. Smallholder rice
marketing in the Philippines is characterised by poor information access, high transaction costs and
power imbalances (Kürschner et al., 2016).By providing market information services and
encouraging collective sales, IRPEP's marketing component is expected to help farmers identify
where and when to sell for the best price (Shepherd, 1997), and to work together to improve their
bargaining power and benefit from economies of scale (Markelova et al, 2009; Arouna et al., 2016).
Post-harvest processing facilities – the increased use of which are identified as key to driving
agricultural development in the country's 2017-2022 Development Plan (NEDA, 2017) – are
expected to add value to cropsand reduce post-harvest losses (Hodges et al., 2011).
There are also a number of indirect benefits expected from IRPEP as a by-product of increased
productivity, production efficiency and income. First, increased farm activity is expected to increase
demand for on-farm waged labour (Bhattarai et al., 2002), thus enhancing household incomes as well
as livelihood diversity. In addition, richer, more productive and more food secure households are
expected to be more resilient to shocks such as extreme weather and crop diseases (Frankenberger et
al., 2012). Finally, increased income and a reduced need for child labour is expected to lead to
greater investment in childhood education and increased enrollment rates, which was highlighted on
the scoping mission for this impact assessment (Huisman & Smits, 2009).

8
IRPEP's various impact mechanisms are contingent upon a number of important assumptions. The
assumptions mainly revolve around the activities being context-suitable, there being demand and
subsequent uptake of these activities, and the beneficiaries facing no additionalbarriers preventing
the intended impacts. In addition to the expected impact mechanisms outlined above, these
assumptions will be tested as part of the impact assessment in order to clarify the processes that
shaped the project's effectiveness, thus giving a full picture of the project's impact.
2.2 Project coverage and targeting
Based on this ToC, IRPEP was implemented in six provinces of the Philippines across three regions.
The project started in Regions VIII and X in 2010. Region VI was not originally included in the
project, but as it became clear that additional funds would be available to expand the project
coverage, it was brought into the project in 2012. While Regions VII and X received the full range of
IRPEP support, Region VI only received the irrigation infrastructure and IA capacity building
components, along with some post-harvest processing support.
In all regions, the first step in selecting beneficiaries was to identify suitable CIS. Then, project
support was offered to the smallholder rice farmers and the IAs in the selected CIS. IRPEP used the
following criteria to select beneficiary CIS:
Baseline annual average paddy productivity below 3.78 t/ha
Average landholding size below 0.76 ha
Low and/or inadequate supply of water through CIS
High poverty incidence
Irrigation potential of CIS
Feasibility of implementing agency to provide support
Willingness and capacity of the local government to provide timely counterpart funding
At the design stage, it was intended that all households within the selected CIS be reached by IRPEP
support, at least being covered by improved irrigation infrastructure. However, the Project
Completion Report and the qualitative research conducted for this assessment note that budget
constraints prevented IRPEP from covering all households in the selected CIS (IFAD, 2017). Both
sources add that IRPEP activities were therefore rationed according to need, however no further
quantitative or qualitative details are available on which households were reached within each CIS.
Table 2.1 presents the geographic distribution of selected CIS, the amount of land covered by the
irrigation improvements and the number of members of all the CIS covered by IRPEP support. The
contextual heterogeneity of the project sites across the three regions mentioned above is one of the
key areas of focus of this assessment.
In addition to the late incorporation of Region VI into the project, another important source of
heterogeneity stems from the fact that all three regions had varying levels of exposure to extreme
weather events (e.g. super typhoons) throughout the course of IRPEP's implementation period.
Seemingly, Region VIII was the worst affected, having suffered the full force of the particularly
severe Typhoon Haiyan in 2013, followed by Region VI (Belen, 2015). However, Bukidnon
province in Region X also suffered and as a result received top-up financing from the project to
rehabilitate additional CIS damaged by Typhoon Washi in 2011.

9
Table 2.1: CIS, land and farmer coverage of IRPEP
Location Nr. IRPEP
CIS
Land covered by irrigation
infrastructure improvement (Ha.)
Nr. CIS
farmers
Region VI
Antique 63 4,221 7,199
Region VIII
Northern Leyte 12 1,809
3,881 Northern Samar 4 355
Western Samar 11 1,009
Region X
Bukidnon 18 1,218 3,154
Lanao del Norte 4 695
2.3 Research questions
The literature on irrigation effectiveness in South Asia is limited and this impact assessment adds to
a small number of recent in-depth studies conducted on similar projects in the region. Within the
Philippines, an assessment of an irrigation project in the province of Bohol found positive yield and
income effects (JICA, 2012). However, it adds that downstream households may have benefited less,
highlighting the need for strong system management to accompany infrastructure improvements to
avoid unequal water distribution (Darko et al., 2016). The Bohol study also suggests that downsizing
IAs led to increased benefits through reduced water conflict.
Support for smaller systems is also found in a study of the Communal Groundwater Irrigation Sector
project in Nepal (ADB, 2012), which found that the project's positive yield effects were stronger for
smaller water user groups, echoing similar findings from Mali (Dillon, 2011). An assessment of
small scale irrigation investment in Vietnam found positive land use and wealth effects but no
change in waged employment (Nguyen et al., 2015). Both the Nepal and Vietnam studies also
observe an increase in livestock ownership, which they suggest could be due to increased crop by-
product availability for animal feed, or as a result of time saved from not having to fetch water for
agriculture. There is also a suggestion that improved irrigation can help to improve grazing pasture
(Volesky and Clark, 2003), which may have also produced this effect.
Finally, an impact assessment of the Mao Lao Irrigation project in Thailand produced inconclusive
findings as large numbers of prospective comparison households had received similar support from
elsewhere (Palmer-Jones et al., 2012). As with IRPEP, the study was conducted in an environment
where similar support was being provided by other parties, and highlights the importance of
obtaining a well-defined control group, avoiding households who have received similar support from
elsewhere.
This impact assessment focuses only on the impact of the irrigation, IA capacity building and market
support activities of IRPEP. This is because similar FFS and buffer stock support was offered to all
non-IRPEP smallholder households in the project regions. Thus, no suitable comparison group could
be found to assess the impact of these components. This assessment is effectively comparing
households that have received only FFS and buffer stock support with those that have also received
irrigation, IA capacity building and marketing support. It also mainly focuses on the production of
rice, as this is the target crop of the project and is the only crop cultivated by the majority of

10
households (97 percent). Finally, a key focus is on the regional effects of the project, given the
distinct contextual heterogeneity mentioned above.
This impact assessment aims to test whether the project was effective, and to draw rich insights and
lessons in the process. Based on the IRPEP theory of change, the country context, and the
surrounding literature, four main research questions were identified in consultation with the project
management unit and are addressed:
1. Did IRPEP have the intended household impacts on irrigation water supply, rice productivity,
market participation, and other expected benefits? Are there constraints that limit farmers from
achieving these improvements that should be addressed?
2. Did IRPEP strengthen IA participation and the capacity of IAs to support its members, including
female empowerment, and to sustain smallholder livelihood improvement?
3. Did the impact of IRPEP vary by region, parcel location, or by CIS size? What factors may have
caused these differential impacts?
4. What other lessons can be learned from the implementation and impact of the project that can be
used for future policy and practice?

11
3. Impact assessment design: Data and methodology
3.1 Data
Answering the research questions requires a mixed methods approach. Towards that end, this ex-
post impact assessment uses quantitative and qualitative data collected 18 months after project
completion. Cross-sectional quantitative data were collected from beneficiary and non-beneficiary
households and IAs. This covered a range of areas, with a particularly extensive set of questions on
household agricultural production, and IA finances.3
Quantitative data were supplemented with qualitative data collected through Key Informant
Interviews (KIIs) and Focus Group Discussions (FGDs) with treatment and control IA officers, and
national, regional and provincial project staff. These focused on how the project was implemented,
plus experiences and perceptions of the project's impact and how this may have been shaped by
different factors. With officers from the control IAs, the sessions focused on how the experiences
and livelihood practices of IAs and their farmers may have differed from treated IAs during the
project period and how this was shaped by any support they received from elsewhere. The insights
from this data provided a better understanding of the context underpinning the project and enriched
the interpretation of the results.4
The key to effectively assessing a project's impact on a set of indicators is to compare treatment
(beneficiary) units with control (non-beneficiary) units who have a similar range of pre-project
characteristics. In doing so, the analysis can separate progress caused by the project from progress
over time for other reasons (Gertler et al., 2011). Ideally these sets of units would be identified in
real-time before the project is implemented, but given the ex-post nature of this impact assessment
baseline data on treated and control households are not available. We therefore create treatment and
control groups using careful data collection and non-experimental methods to ensure that estimates
of impact are unbiased.
To identify a well-matched set of treatment and control CISs and households, the sample selection
for the impact assessment sought to mirror IRPEP's beneficiary selection process by initially
conducting the identification at the CIS level. At the start of the process there were a number of non-
beneficiary CIS in the project provinces, allowing for control CIS to be selected from within the
same provinces. Using these IRPEP and non-IRPEP CIS, a two-stage process was used to select the
final set of treatment and control CIS. This involved both data analysis and the knowledge of local
staff.
First, some CISs which did not have data had to be dropped, slightly reducing the number of CISs.
Then, using the CISs with relevant pre-project variables, a propensity score matching procedure was
conducted to create propensity scores that could be assigned to each CIS. The propensity scores
represent the likelihood of a CIS being selected for project inclusion based on the set of pre-project
variables, and are commonly used in impact assessment to identify treatment and control units that
were similar before project implementation in the absence of baseline data.5 Similar scores suggest
3 The full versions of the household and IA questionnaires are available upon request from the authors
4 Copies of the guiding questions used in FGDs and KIIs are available upon request from the authors.
5 Specifically, the propensity scores were created by running a logistic regression model where the dependent variable is the binary
treatment status and the independent variables are variables linked to IRPEP selection and/or livelihood capacity from 2010 (i.e.
before the project), and deriving the scores, representing the probability of treatment, using the coefficients for each of the
independent variables in the model, which represent their effect on the likelihood of being treated (See Caliendo and Kopeinig,
2008).

12
that a potential control CIS has a similar range of characteristics as the treatment CISs. Table 3.1
presents the set of variables used to create the scores for each region.6
Table 3.1: Variables used for CIS propensity scores
Region
VI
Percent of CIS members who are members of the IA
Total service area of CIS (ha)
Distance from CIS to regional capital (mins)
Region
VIII
Average yield of CIS users
Percent of land covered by the CIS that is operational
Amount of land covered by irrigation in the wet season (ha)
Distance from CIS to regional capital (mins)
Region
X
Total service area of CIS (ha)
Average yield of CIS users
Number of farmers using the CIS
Distance from CIS to regional capital (mins)
Using the generated propensity scores, the treatment and control CISs were trimmed of CIS
considered as outliers. Specifically, trimming was done using the following criteria: (i) control CIS
with a score that was not within a specified distance of at least one treatment CIS score (no match),
and (ii) treatment CIS with a score that was above the highest control CIS score—for Region VI only
due to its higher number of treatment CIS.
The second step was to use the knowledge of regional project staff to ensure the quality of the
statistical matching procedure. The staff were asked to verify the validity of the matches and, based
on their knowledge of the field, identify possible problems with treatment and control CISs that
could lead to potential biases. The purpose was to rule out treatment communities that were so
unique that a reasonable counterfactual could not be found and control communities that had
differences compared to treatment communities that were not captured in the statistical procedures
(due to unobservable variables). Regional project staff identified a few problems (18 in total) leaving
the final set of 58 treatment and 55 control CISs (total of 113 CISs) based on their contextual
knowledge. Table 3.2 provides an overview of each step in the selection of the final set of CISs and
the observations that were removed at each step.
6 The matching was done separately for each region given the differences between them and the different sets of data available in
each region.

13
Table 3.2: Breakdown of sample CIS selection process
Stage Region VI Region VIII Region X
Treatment Control Treatment Control Treatment Control
Start 62 56 26 100 18 17
Removed as no
baseline data
available
6 6 3 16 0 0
Trimmed for
having no match 19 28 0 53 1 1
Trimmed for
having higher score
than highest control
15 - - - - -
Removed by
project staff 1 3 3 11 0 0
Final set 21 19 20 20 17 16
Sample size calculations computed as part of the planning of the impact assessment indicated a
sample size of approximately 2,100 observations that would be evenly divided between treatment
and control.7 The calculation factored in a two stage sampling with the selection of CISs and then
households within the CISs. With 113 CISs included in the impact assessment, 19 households would
have been selected from each CIS to achieve the desired sample size, but since some of the CISs had
less than 19 members, some larger CISs within the same region were slightly oversampled. 8 From
within each CIS, households were randomly sampled from a list of all households obtained from
NIA and the final data collection covered 2,104 households, as shown in Table 3.3.
Table 3.3: Distribution of CIS and household data collection
Treatment Control
CIS Households CIS Households
Region VI 21 361 19 360
Region VIII 20 359 20 361
Region X 17 362 16 301
Total 58 1,082 55 1,022
As is normal practice during the data cleaning process, we checked data on treatment and control
households to verify their validity. To ensure treatment households had actually been covered by
IRPEP, all households in treated CIS who reported not having any irrigation coverage on any of their
parcels in any season were removed from the analysis. For control households, those who reported
having over 50 percent of their land covered by concrete-lined canal irrigation were also removed.
We assume that treatment households would not have received similar support without IRPEP,
therefore the control sample should also be free from having received similar support. Concrete-lined
irrigation canals are the most desirable irrigation infrastructure in the project areas and the most
expensive to implement, meaning it was very unlikely to have been developed by smallholder
7 Power calculations for how this intended sample size was reached is detailed in the Impact Assessment Plan.
8 Full lists of the sampled CIS and the number of households sampled within each are available upon request from the authors

14
households and their IAs with their own resources. Thus coverage with this infrastructure was
deemed the most reliable indicator of having received IRPEP-level external support. Through this
process, a total of 67 treatment and 358 control households were dropped from the analysis, leaving
a final sample size of 1,015 treatment and 664 control households.
3.2 Questionnaire and impact indicators
The household and IA questionnaires collected a wide range of information, which was then used to
create the impact indicators and other variables to be used in the data analysis. The household
questionnaire included detailed questions on agricultural production and marketing collected by
season, parcel and crop for the previous 12 months, as well as socio-demographic characteristics,
other income generating activities, asset ownership, experience of shocks, access to credit, and
receipt of external support from various sources. The IA questionnaire gathered information on their
structure and facilities, irrigation water coverage, gender differentiated membership, and income and
expenditures over the past 12 months, including irrigation fee collection and operation and
maintenance spending.9
To answer the impact assessment research questions, a variety of impact indicators were used based
on the expected causal chains within the project's ToC (Figure 1).
3.2.1 Irrigation water supply
Three measures of irrigation water supply and coverage were used to assess this key impact area.
One subjective measure was used based on farmers' ratings of the sufficiency of water supply to each
of their parcels: proportion of parcels with sufficient irrigation across the two main cropping seasons.
For the two additional subjective measures, data on the primary source of irrigation and on water
user fees were used to create the following indicators: (i) proportion of household's cultivated land
covered by canal irrigation in both seasons, and (ii) the total expenditure per hectare on irrigation.
3.2.2 Rice yields, market participation and food security
Rice yields were measured in metric tonnes per hectare and market participation was measured by
the income received per hectare from selling rice, along with the proportion of the total harvest that
was sold. These indicators focused solely on rice as the project was predominantly focused on
improving rice productivity, and descriptive statistics show that only a small proportion of sample
households grew any other crops (See Table 4.3 in the next section). Also, there was a concern that
during the data collection some enumerators may have dedicated less time to collecting non-rice crop
data, believing that the main focus of the survey was rice production, potentially decreasing the
reliability of data on other crops. Accordingly, so as not to distort results by including households
with potentially incomplete data, all households who grew non-rice crops were removed from the
rice production analyses.
The impact on rice yields was also used as the main indicator of the project's impact on food
security. Rice yields are presumed to serve as a reliable food security indicator as it is the staple crop
of sample households and increased production is a close proxy for household food consumption
(European Commission, 2015), something that is supported by this dataset, with sampled households
using 33% of all rice harvest for home consumption.
9 See Appendix I and II for complete household and IA questionnaires used in quantitative data collection.

15
3.2.3 Input use and production efficiency
To measure the level of investment in agricultural production, the amount spent per hectare on seeds,
fertiliser, hired labour, weed and pest control, machinery, and land rental were assessed in the
analysis. In order to provide further insights on total labour use, the number of household labour
days per hectare was also used to capture unpaid labour input. Production efficiency was assessed
using expenditure on each of these inputs per metric tonne of output, along with an overall value-
cost ratio (VCR). The VCR measures the value of total harvest produced by each peso spent on
inputs, and is the value of the total harvest (calculated using the median price received for sold rice
for the sample) divided by the total expenditure on all inputs (not including land rental but including
a valuation of unpaid labour and use of own machinery using the median cost of rental) (Ragasa and
Chapoto 2016).
3.2.4 Household wealth
Income from selling rice was combined with all other sources to give a measure of total household
income, with this analysis also excluding households who grew non-rice crops for the reason
mentioned above. To assess livelihood diversity effects, the analysis used the number of household
income sources and the amount earned through each individual source – wage labour, household
enterprises, sale of livestock and livestock products, other sources such as remittances and gifts.
Poverty reduction is one of the main objectives of all IFAD interventions, therefore a set of relative
and absolute poverty line indicators were used to assess the IRPEP's impact on the likelihood of a
project household being above a given poverty threshold. As well as helping to assess how many
beneficiaries the project may have moved out of poverty, using different lines allows us to assess
whether the project had differential impacts on households at different wealth levels. For the
absolute indicators, the new World Bank international poverty line of US$1.90 was used (See World
Bank, 2015) along with lower thresholds of US$1, US$1.25, all calculated in international dollars. In
addition, relative measures were used that set thresholds at the 40th and 60
th percentiles of control
households' incomes. By design, the income of control households should represent the income of
treated households that would have prevailed in the absence of IRPEP; hence, these percentiles allow
us to assesses the degree to which IRPEP has helped households to overcome local poverty levels
(See Garbero, 2016).
Finally, indicators of asset ownership were used to complete the holistic assessment of IRPEP's
impact on household wealth. An index that incorporates ownership of large household items and
productive assets, plus homestead characteristics was calculated using principle component analysis.
This is a data reduction technique that assigns weights to each index component based on their
variation within the sample, and is recommended as an effective way to calculate wealth indicators
in the absence of expenditure data (Filmer & Pritchett, 2001). As households were asked to recall
information on their pre-project asset ownership, the same method was used to create a baseline
wealth index which was used as a matching variable. In addition, an index to measure livestock
ownership was created using Tropical Livestock Units (TLUs), which assigns weights to each
livestock type based on their weight (Jahnke, 1982).
3.2.5 Other impacts
IRPEP was also expected to affect household nutrition and educational outcomes. For the former, the
Household Dietary Diversity Score was used, which assigns a score based on the consumption of
different food groups in the past 24 hours (FAO, 2010b). For educational outcomes, using only
sample households with school-age children, three indicators were created: (i) proportion of school

16
age children (aged 6-17) enrolled in school; (ii) household expenditure on school fees and associated
costs; and (iii) average number of school days missed by school age children in household.
At the IA level, indicators of IA participation, income, and expenditures collected through the IA
survey were used. For income and expenditures, these were summed across different income and
expenditure categories and were assessed per member. The anticipated gender effects of IRPEP were
measured using women's membership of IAs and the percentage of IA officers who are women.
3.3 Impact estimation
Econometric analyses to estimate IRPEPs impact on the above indicators were conducted at three
levels: (i) Household level analysis on the full set of household impact indicators for the sample as a
whole, for each region, and by the size of the IA in which the household is based, using data
aggregated across parcels and seasons for the agriculture-related indicators10
, (ii) Parcel level
analysis on the agriculture-related indicators by parcel's location from the irrigation source, using
household data aggregated across seasons, and (iii) IA level analysis using the IA dataset, with no
heterogeneity analysis conducted due to the small sample size for this dataset.
There are a number of analytical models available for minimising bias in impact assessment analyses
without the benefit of baseline data (See Baser, 2006). We chose to use the Inverse Probability
Weighted Regression Adjustment (IPWRA) model because of the level of analytical rigour it affords
and based on its effective use for similar project assessments (See Ring et al,. 2017). The average
treatment effect (ATE) with the IPWRA model11
is estimated by first assigning a weight to each unit
in the analysis—in this case each household or IA—that represents the inverse of the probability of
their receiving the treatment that they actually received (beneficiary or control), with the probability
calculated based on variables representing pre-project treatment propensity and livelihood capacity.
For the average treatment effect on the treated (ATET) version of the model, all treatment units
receive a weight of one. If a control unit has a high likelihood of receiving the treatment they
received based on the matching indicators, they will have a score close to one, and those with a low
likelihood receive a score higher than one. Formally, these weights are calculated as follows:
𝐼𝑃𝑊ATET = T +𝑃(1−T)
1−𝑃 (1)
where T = the treatment status (1 = treated, 0 = control), and P = the probability of receiving the
treatment they received given the set of matching variables.
The next step is to run a regression adjustment model with the weights applied to each IA or
household. Using the specification below, the model estimates the average expected value of the
outcome if all units in the sample received IRPEP and if all units in the sample did not, controlling
for a set of relevant covariates, with the final impact estimate being calculated by subtracting the
control outcome estimate from the treatment estimate. The formal specification of the regression
model is as follows:
𝑌𝑖 = 𝛽0 + 𝛽1𝑇𝑖 + 𝛴 − 𝑋𝑖𝑗𝛽2𝑗 + 𝑒𝑖 (2)
10
All agriculture indicators will focus solely on rice, so to avoid distorting the data, the small number of households who grew
other crops will not have any of their parcels included in the analysis of impact on these indicators. Accordingly, they will also not
be included in the analyses of the impact of IRPEP on total household income. However, these households will still be included for
assessing impact on income from other sources and other indicators not related to agriculture. 11
The explanation of the model in the text draws from the following references: Wooldrige (2010), Austin and Stuart (2015)

17
Where Y is the outcome for unit i, Ti is the treatment status for unit i, Xij represents an I x j matrix of
control variables used in the model, 𝛽1 is the coefficient of the treatment indicator and 𝛽2𝑗 is a j x 1
vector of coefficients to be estimated, βo is the constant, and ei is the error term, which was calculated
using a cluster robust estimator at the province level (See Cameron & Miller, 2015). The set of
control variables used in the model cover household socio-economic characteristics, land fertility
and location, geographic area, exogenous shock exposure and external support received. Control
variables were chosen based on their likelihoods to have influenced the outcome variable, while not
having been affected by the project; thus different sets of control variables were used depending on
the outcome variable being analysed.
The final estimated impact, i.e. the ATET, is calculated as follows:
𝐴𝑇𝐸𝑇 = �̂�1 − �̂�𝑜 (3)
where �̂�1 is the average expected outcome for the treatment group, and �̂�𝑜is the average expected
outcome for non-treatment group obtained from the estimates of equation 2 above.
Both inverse probability weighting and regression adjustment can be used individually for this type
of causal analysis, but to produce consistent estimates, the former is dependent on the scores being
correctly specified and the latter is dependent on the correct-specification of the regression model.
However, the IPWRA estimator requires that one of the two to be correctly specified for the
estimates to be consistent, therefore the model is classified as a doubly-robust estimator, which is the
main reason why it was chosen as the primary model for this analysis.
The secondary model used to test the robustness of the IPWRA results was another propensity score-
based model that employs a nearest neighbour (NN) matching algorithm to estimate impact (See
Khandker et al., 2010; Austin, 2011). With propensity scores being created in the same way as the
primary model, this model estimates the average treatment effect by creating matched pairs of
treatment and control households. There are a variety of methods to match treatment and control
units, and the NN method we use matches each treatment household with its three closest control
group neighbours in terms of their propensity score. In order to ensure the quality of the matches,
this model also sets a maximum distance between the scores of the matched pairs. The NN matching
model was selected mainly as it allows for exact matching on specific variables of particular
importance, however it was not chosen as the primary model as it does not allow for a regression
adjustment, nor does it allow for standard errors to be clustered at a specified level. Based on the set
of outcome variables, baseline wealth was seen as the factor with the most potential to bias the
comparison, therefore households were matched on their propensity scores within a strata of the
number of hectares of land owned. 12
Land ownership was deemed to be a reliable wealth proxy that
was not expected to have been affected by the project, given that land ownership is relatively fixed in
the short term and because the project did not target changes in land ownership. Given the
heterogeneities among regions, regional strata were also used in exact matching when analysing
impact on the sample as a whole.
12
The strata were defined as follows: (i) Does not own any land with a title (ii) Owns land with a title covering less than 0.5
hectares (iii) Owns land with a title covering between 0.5 and one hectare; (iii) Own land with a title, covering between one and
two hectares; (iv) Own land with a title, covering over two hectares.

18
4. Profile of the project area and sample
This section profiles the regions, households and IAs covered by this impact assessment using
primary and secondary data. Its aim is to deepen the understanding of the context and the collected
data so as to frame the results of the impact analysis.
4.1 Project regions
Table 4.1 presents descriptive statistics of the three regions covered by IRPEP and included in this
study. Based on income, Region X is clearly the wealthiest region, although all three are below the
average GDP per capita of the country's 17 regions of PHP140,259. Perhaps conversely, agriculture
comprises the largest share of the regional economy in Region X. While Region VI and X
experienced healthy economic growth during the project's implementation (around 7 percent), the
extreme weather damage in Region VIII is seemingly reflected by a much lower average annual
growth rate for 2010-15 (1.7 percent), which includes an annual rate of -6.3 percent for 2011-12. The
strategic importance of the three regions to the country's overall rice production is clear from this
data, with the three together contributing around 20 percent of the country's total rice production. In
crop production Region X also stands out, contributing just 4 percent to the country's rice
production, but 19 percent of other crops, mainly including bananas, coconuts and pineapples.
Finally, livestock is an important activity in all three regions, particularly in Region VI, where its 15
percent contribution to the national supply is the highest in the country.
In their respective Regional Development Plans, Region VI reports limited input availability and
high input prices, particularly for fertiliser, as the main hindrances to rice production, while Region
VIII cites low labour productivity and pest issues, in addition to extreme weather, for their poor rice
production performance (NEDA, 2011; NEDA, 2017). Across the country, improving low levels of
mechanisation as well as post-harvest processing are seen as keys to improving labour productivity
and production efficiency as a whole (NEDA, 2017).
Table 4.1: Macroeconomic data for the three project regions (2016 unless otherwise stated)
Region VI Region VIII Region X
GDP per capita (2016, current prices) 76,459 67,638 120,799
Average annual GDP per capita growth during
project period (2010-2015, current prices) 7.5 1.7 6.8
GDP by Industry (% of total):
Agriculture, forestry and fishing
Industry
Services
20.6
24.1
55.3
17.6
42.1
40.3
24.3
32.8
42.9
Proportion of country's total supply of (%):
Rice production
Other major crops
Livestock
11.3
11.7
15.1
5.27
1.8
7.9
4.0
18.9
6.3
Source: PSA (2016)

19
4.2 Household data
Table 4.2 presents livelihood indicators of the household sample. The statistics on land cultivation
show that smallholder farmers dominate the sample, whilst rice yields show that Region X is the best
performing in terms of productivity. Somewhat surprisingly given the extreme weather damage in
the latter, rice yields in Region VI and Region VIII are similar. Not shown in the table is that the
share of households that cultivate crops other than rice ranges between 0 and just 4 percent, but this
may not be reflective of reality due to the aforementioned data collection issues. In terms of crop sale
we again see much higher levels in Region X, and again a surprisingly higher proportion sold in
Region VIII compared to Region VI. Not shown in the table is that, in all three regions, the majority
of rice was sold unprocessed, highlighting the aforementioned barriers to maximising market
participation benefits faced by smallholders in the country. Finally, we see that income from rice sale
is proportional to this difference in selling practices across regions.
The household income composition reflects the crop production data in suggesting that crops other
than rice play a very minor part in sample households' livelihoods, however, only in Region X is
agricultural production by far the main source of income. In the other two regions, waged labour,
household enterprises and other non-farm income all serve as key sources of income. The other non-
farm income category contains government support, something which is likely to have spiked in the
wake of natural disasters in regions VI and VIII.
Table 4.2: Characteristics of household sample by region.
All Region VI Region VIII Region X
Rice production
Land cultivated (ha.) 1.95 1.67 1.88 2.26
Harvest (t/ha) 3.43 3.33 3.29 3.71
Proportion of harvest sold (%) 29.24 16.89 23.26 42.58
Total income from rice sale per ha. 19,062.72 9,321.06 14,324.51 32,692.40
Overall income per capita 50,601.33 47,209.46 35,867.44 68,232.70
Income sources (% of total):
Rice sale
Other crop sale
Waged labour
Household enterprise
Sale of livestock or livestock
products
Other (remittances, inheritance,
pension, interest, etc.)
29.71
0.44
22.12
14.99
6.85
25.89
14.12
0.38
25.02
19.19
7.92
33.35
28.08
0.25
18.95
15.58
8.76
28.37
45.98
0.67
22.51
10.44
3.96
16.45
Table 4.3 shows how key rice farming indicators differ by parcel location. There is a clear wealth
disparity between those cultivating land closer to the irrigation source and those located downstream.
Households cultivating downstream parcels use less land and own less of the land they use, they also
report lower harvests and lower revenue per hectare from crop sale.

20
Table 4.3: Agricultural livelihoods of household sample by parcel location
Up/Midstream Downstream
Total cropping area (ha.) 1.71 1.49
Parcel owned (% of sample) 53.18 42.13
Total harvest per ha (kg) 3.52 3.35
Rice revenue per ha. (PHP) 19,805 17,023
Table 4.4 presents data on the household sample separated by the size of their IAs. On average,
sample households located in larger systems own and cultivate more land, have higher yields and
rice sale incomes, as well as overall incomes, suggesting that these contain wealthier households
than smaller systems. Perhaps counterintuitively, households located in smaller IAs are shown to be
less reliant on rice sale income, making up only around one fifth of total household income
compared to almost one third for larger IA households.
Table 4.4: Characteristics of household sample by IA size
Large IA Small IA
Land owned (ha.) 0.68 0.38
Total cropping area (ha.) 2.10 1.81
Harvest (t/ha) 3.62 3.27
Rice revenue per ha. (PHP) 54,129 32,373
Total income per capita (PHP) 55,035 45,994
Proportion of income from rice sale
(%) 30.09 21.60
4.3 Irrigators' Associations data
Table 4.5 presents data on the land coverage, participation, and finances of the IA sample.
Whilst Region VIII has the largest IAs both in terms of CIS land coverage and membership, a lower
proportion of their land is operational, another likely example of the extreme weather damage in the
region. Region X has the second highest CIS coverage but the lowest membership size, reflecting the
differential land holding sizes across regions.
Breaking down IA membership, there are noticeably less female members in Region X IAs, but
across regions the data suggests most IAs are male-dominated in terms of members and officers.
There is also noticeably low (less than 3 percent) participation of young people in IAs across
regions. Looking back at the socio-economic characteristics of the household sample, the average
age of household members who report their primary or secondary occupation as farming is 55 years
old, so it is perhaps unsurprising that such a low proportion of members are below age 30.
The IAs in Region VI have a surprisingly high average income level given the relatively low average
land cover of their CIS and the lower wealth of households in the region. The income data shows
that across regions, IA user fees are the main source of income, especially in Region X, whilst for

21
Region VI and VIII, external donations are also an important income source. Finally, only in Region
VI had any IAs accessed credit in the past 12 months.
For IA expenditures, Region VIII is the only region where IAs do not spend much less than they
earn, which is a concern for their sustainability. Breaking down the expenditure shows that in this
region a much larger proportion of spending goes to government fees compared to the other regions,
which seems to be at the expense of operation and maintenance spending. The expenditure
breakdown also provides evidence that IAs, particularly in Regions VI and VIII, are either
conducting their own agricultural activities or supporting their farmers by buying inputs and other
facilities.
Table 4.5: Characteristics of IA sample by region
Region VI Region VIII Region X
Land
Land covered by CIS (ha) 99.53 189.96 132.25
Proportion of land that is operational (%) 83.88 69.27 94.26
Participation
Nr. IA members 110.28 129.30 89.88
Proportion of members who are female (%) 26.55 27.15 16.31
Proportion of IA officers who are female (%) 25.93 35.24 29.22
Proportion of members who are under age 30
(%) 1.60 3.04 2.41
Income
Total income 347,285.70 120,605.40 281,789.00
Total income per member 3,518.07 1,315.37 3,651.68
Have received loan in past 12 months (%) 23.08 0.00 0.00
Composition of income (%):
CIS user fees
IA facility user fees
Other fees (incl. fines)
External donations
Non-ag. business income
Other
46.97
12.25
0.22
39.01
0.00
1.55
53.41
6.49
7.06
19.16
7.24
6.65
90.27
3.01
1.84
3.05
0.96
0.88
Expenditure
Total expenditure 243,990 120,459 126,313
Total expenditure per member 2,100 1,019 1,694
Composition of expenditure (%):
Operation and maintenance of Irrigation System
Government user fees and loan amortization
Building/Maintaining/Improving IA Office
Agricultural Inputs, machinery and other
facilities
Non-agricultural Income Generating Machinery
Training
Meetings/Parties
Travel
Other Activities and Expenses
34.06
19.29
8.44
10.68
0.37
1.08
8.20
12.71
5.17
19.02
34.93
3.70
9.55
0.19
0.14
10.77
8.09
13.58
18.54
19.02
4.88
2.15
0.00
0.30
19.37
15.77
19.56

22
5. Results We present the impact estimates from the IPWRA model in this section and refer the interested
reader to Appendix I for the results of the secondary model for robustness checks. The impact
estimates are either reported in percentages or absolute values. We will occasionally convert
percentage effects into their absolute equivalents or vice-versa to aid interpretation, for which we use
the control group mean as the base. 13
5.1 Model diagnostics
The IPWRA model weights observations using a set of matching variables, aiming to balance these
variables across the treatment and control groups in order to reduce bias. We assess success of the
IPWRA model in reducing bias by comparing the standardised mean difference (SMD) and the
variance ratio (VR) for each variable used in the weighting for the unweighted sample and the
sample with the weights applied (Austin, 2009). The SMD measures the difference in the treatment
and control means of a variable by the difference in standard deviations, allowing for differences
across variables to be compared in the same unit. Overall, the average size of the SMD for the full
set of matching variables was halved from 0.08 standard deviations to 0.04 for the household level
analysis, and from 0.08 to 0.01 for the IA level analysis. Graphs 5.1 and 5.2 present the change in the
SMD for some of the key matching variables for the household and IA samples. The VRs give a
picture of how the relative variation across the treatment and control groups for each matching
variable has been altered. We find that the average VR was reduced from 1.19 to 1.05 for the
household level analysis, and from 1.38 to 1.35 for the IA level analysis. The results for these two
diagnostic tests suggest that the weighting was able to reduce the treatment and control imbalance
significantly (Appendix III contains the SMDs and VRs for the weighted and unweighted samples
for the full set of matching variables).
13
See Appendix II for the treatment and control group mean values for all the impact indicators

23
Graph 5.1: Change in SMD for weighted and unweighted household sample
Graph 5.2: Change in SMD for weighted and unweighted IA sample
●
●
●
●
●
●
●
●
●
●
●
●
●
●
●
●
●
●
●
●
X
X
X
X
X
X
X
X
X
X
X
X
X
X
X
X
X
X
X
X
-0.2 -0.1 0 0.1 0.2 0.3
Amount of land owned (hectares)
Social capital measure (2010)
Nr economically active household members (2010)
Nr female IA members in household (2010)
Nr IA members in household (2010)
Nr floods experienced since 2010
Asset index score (2010)
Nr small livestock owned (2010)
Nr medium livestock owned (2010)
Nr large livestock owned (2010)
Nr droughts experienced since 2010
Distance to market
Nr rooms in home (2010)
Nr adults in household
Household size
Education of household head (years)
Gender of household head (Female = 1)
Age of household head
Maximum education in household (years)
Average age in household
Standardised mean difference Unweighted Weighted
●
●
●
●
●
●
●
●
●
●
●
●
●
X
X
X
X
X
X
X
X
X
X
X
X
X
-0.4 -0.3 -0.2 -0.1 0 0.1 0.2 0.3
Percent rainfed cover (Dry season, 2010)
Percent concrete canal cover (Dry season, 2010)
Percent earthen canal cover (Dry season, 2010)
Percent rainfed cover (Wet season, 2010)
Percent pipe/drip cover (Wet season, 2010)
Percent earthen canal cover (Wet season, 2010)
Percent concrete canal cover (Wet season, 2010)
Nr. IA members under 30 (2010)
Nr. female IA members (2010)
Nr. IA members (2010)
IA had an office (2010)
IA income (2010)
IA age
Standardised mean difference Unweighted WeightedX
X ●
●

24
5.2 Overall and regional household impacts
5.2.1 Irrigation water supply
We find that IRPEP significantly improved both the amount of land covered by irrigation and the
seasonal coverage (Table 5.1). The proportion of cultivated land irrigated in the two main cropping
seasons increased by 34 percentage points, and the number of seasons with sufficient irrigation
increased by 0.5 on average. Irrigation expenditure per hectare, which is an indicator of irrigation
quality and the capacity of IAs to collect fees, increased by 204.3 percent in the whole sample.
We find similar results for all project regions individually. The one anomaly is a significant 33
percent decrease in irrigation expenditure in Region X, implying that households now have improved
irrigation but are paying less for it. No explanations for this were found in the qualitative data but in
Section 4 we see that CIS user fees constitute around 90 percent of average IA income in Region X
and that households in this region paid the highest fees per member. This implies that, with already
high fees and collection capacity, the combination of improved irrigation infrastructure and IA
capacity has helped CIS users in Region X to get more value for money.
Table 5.1: Results for IRPEP impact on irrigation water supply
All regions Region VI Region VIII Region X
Nr. seasons with
sufficient irrigation 0.51*** 0.79*** 0.44*** 0.29***
Percent of land covered
by canal irrigation†
35.00*** 25.50*** 46.16*** 31.24***
Expenditure on irrigation
per ha. 204.30%*** 315.66%*** 297.08%*** -33.03%***
Nr observations 1,394 441 472 480
Note: *,** and *** indicate that the estimated ATET is statistically significant at the 10, 5 and 1% levels, respectively.
† Coefficient represents a percentage point change.
5.2.2 Rice production and sale
Rice productivity impacts show mixed findings across indicators and regions (Table 5.2). Yields
were significantly improved by 13.3 percent and 8.1 percent in Regions VI and X—equivalent to
0.43t/ha and 0.29 t/ha—but were significantly decreased in Region VIII, producing an overall non-
significant increase of 4.5 percent. The VCR efficiency indicator significantly improved only in
Region X, by 0.66 percent, likely to be linked with their cheaper water supply. Further analysis
showed that, when separating parcels by type of irrigation coverage, only parcels with concrete-lined
canal irrigation experienced positive yield and VCR effects, highlighting that this part of the IRPEP
support package was the driver of the impact on rice productivity. We also found that yield impacts
were highest on owned land (in any form), compared to rented-in or sharecropped land, and that
VCR increases were only significant for land owned with a formal title.
For Region VIII, the regional data and qualitative insights suggest extreme weather events (super
typhoons) were the main cause of households not converting improved irrigation into improved
productivity. Specifically, key themes in the qualitative data were a lack of access to inputs, and
damage to productive equipment and land after shocks. While improved yields were still achieved in
Region VI in spite of less-severe extreme weather, it seems as though the damage in Region VIII
was too much to overcome. That the productivity findings are significantly negative—implying
IRPEP actively hindered farmers—could be explained by IRPEP targeting the worst affected
households in the region and our being unable to fully control for this in the analysis. This would
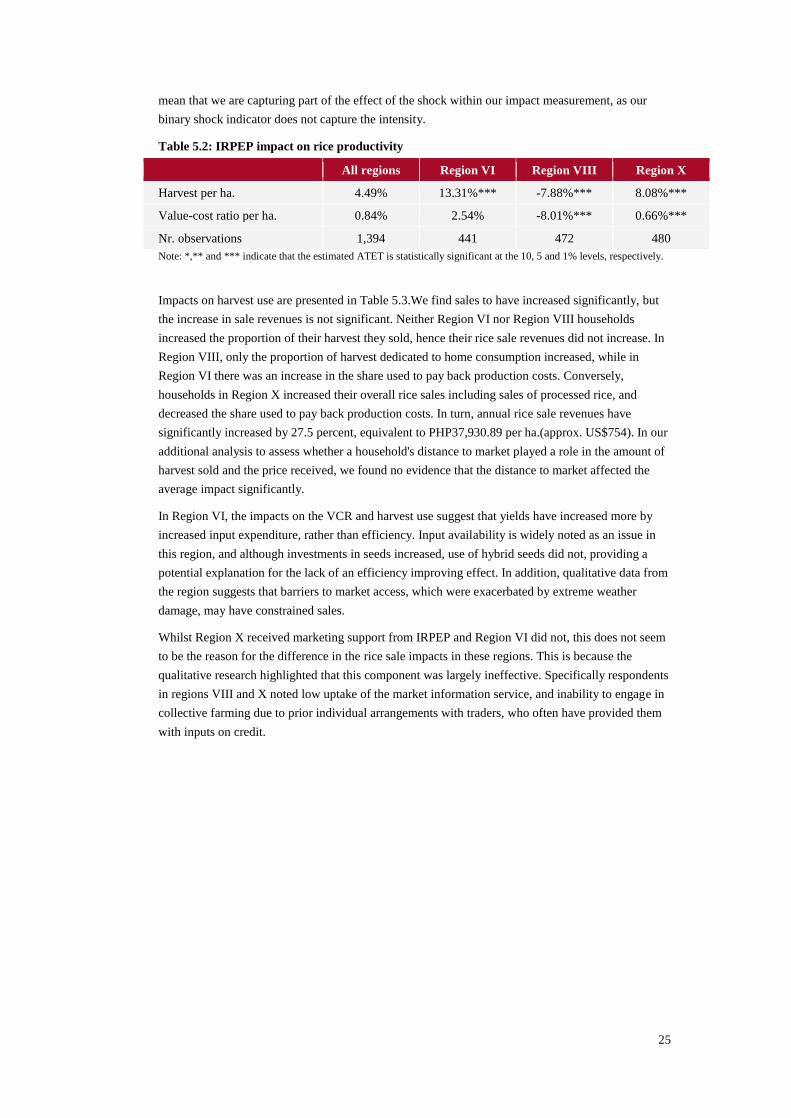
25
mean that we are capturing part of the effect of the shock within our impact measurement, as our
binary shock indicator does not capture the intensity.
Table 5.2: IRPEP impact on rice productivity
All regions Region VI Region VIII Region X
Harvest per ha. 4.49% 13.31%*** -7.88%*** 8.08%***
Value-cost ratio per ha. 0.84% 2.54% -8.01%*** 0.66%***
Nr. observations 1,394 441 472 480
Note: *,** and *** indicate that the estimated ATET is statistically significant at the 10, 5 and 1% levels, respectively.
Impacts on harvest use are presented in Table 5.3.We find sales to have increased significantly, but
the increase in sale revenues is not significant. Neither Region VI nor Region VIII households
increased the proportion of their harvest they sold, hence their rice sale revenues did not increase. In
Region VIII, only the proportion of harvest dedicated to home consumption increased, while in
Region VI there was an increase in the share used to pay back production costs. Conversely,
households in Region X increased their overall rice sales including sales of processed rice, and
decreased the share used to pay back production costs. In turn, annual rice sale revenues have
significantly increased by 27.5 percent, equivalent to PHP37,930.89 per ha.(approx. US$754). In our
additional analysis to assess whether a household's distance to market played a role in the amount of
harvest sold and the price received, we found no evidence that the distance to market affected the
average impact significantly.
In Region VI, the impacts on the VCR and harvest use suggest that yields have increased more by
increased input expenditure, rather than efficiency. Input availability is widely noted as an issue in
this region, and although investments in seeds increased, use of hybrid seeds did not, providing a
potential explanation for the lack of an efficiency improving effect. In addition, qualitative data from
the region suggests that barriers to market access, which were exacerbated by extreme weather
damage, may have constrained sales.
Whilst Region X received marketing support from IRPEP and Region VI did not, this does not seem
to be the reason for the difference in the rice sale impacts in these regions. This is because the
qualitative research highlighted that this component was largely ineffective. Specifically respondents
in regions VIII and X noted low uptake of the market information service, and inability to engage in
collective farming due to prior individual arrangements with traders, who often have provided them
with inputs on credit.

26
Table 5.3: IRPEP impact on rice harvest use
All regions Region VI Region VIII Region X
Revenue per ha. 36.11% -5.90% -37.20% 127.50%***
Percent of harvest sold (%)† 1.91* -0.12 -1.62 9.27***
Percent of harvest sold, processed (%)† -0.19 -4.37*** 1.16 3.26***
Percent of harvest stored for home
consumption (%)†
-1.25 -2.06*** 2.79*** -0.89
Percent of harvest used to pay prod.
costs (incl. water user fees) (%) †
1.52 4.7*** -0.18 -1.71***
Nr. observations 1,394 441 472 480
Note: *,** and *** indicate that the estimated ATET is statistically significant at the 10, 5 and 1% levels, respectively.
†= Coefficients represent percentage point change.
.
5.2.3 Household income and diversification
Household income impacts are presented in Table 5.4, with overall income increasing significantly
by 10.7 percent. Income increased significantly in regions VI and X but with interesting caveats. For
Region VI, increased household income is somewhat surprisingly driven by a large increase in
livestock-related income, equal to PHP3,014.10 per capita (approx. US$60) and an increase in
household enterprise income which is not significant. For Region X, the overall income effect—
equivalent to PHP232.09 per capita (approx. US$4.64), compared to PHP9,120 (US$182.40) in
Region VI—is small compared to the rice income effect14
. The income breakdown shows that
income improvement is curtailed in Region X by large decreases in wage and livestock-related
income, plus a smaller decrease in household enterprise income. In no region is an effect on asset-
based wealth observed, highlighting that this indicator of wealth is reasonably fixed in the shorter
term. However, livestock ownership increased significantly across regions, particularly in Region
VI.
The lack of impact on the number of household income sources suggests that the income source-
specific effects were for activities that households were already involved in. Although only a
minority of households grew any crop other than rice, we find that project households cultivated a
significantly higher number of rice varieties in Region VI, suggesting a positive impact on crop
diversification. We find the opposite in Region VIII, and no significant impact in Region X.
The increases in ownership of and income from livestock in Region VI are similar to the findings in
Nepal and Vietnam in previous literature (ADB, 2012; Nguyen et al, 2015). Livestock related effects
were not mentioned in the qualitative data, therefore we cannot establish the exact channels of this
impact (e.g. having more time because of more timely and reliable water delivery, better-irrigated
grazing pastures, or other mechanisms). The growing evidence for this mechanism, combined with
the lack of impact on wage labour income, suggests the livestock effect should perhaps now be
considered as the main potential by-product of improved irrigation in the region. This is especially
promising in the Philippines given that the 2017-2022 Philippines Development Plan (NEDA, 2017)
cites livestock activities as advantageous for rural development due to their relative resilience to
adverse weather events.
14
It should be noted that this was one of the few results that differed markedly between the two analytical models. In the secondary
model we find a 5.9 percent increased compared to a 0.35 percent increase in the IPWRA model, although the secondary model
effect is not significant.

27
The income findings suggest households in Region VI diversified their incomes through IRPEP,
while households in Region X narrowed their focus on rice production. As noted in Section 4, the
sample of Region X households is different from the rest of the region in terms of their dependency
on rice. A possible explanation for the income diversification result is therefore that IRPEP's target
group in this region is the most different from other households in the region, and their focus on rice
in reaction to the project is representative of their disconnection from the wider regional economy.
Interestingly, this echoes the Bohol Irrigation Project study (JICA, 2012), which found that the
project's impact was curtailed because control households had diversified their incomes more than
beneficiaries, allowing them to keep pace with beneficiary's income improvements. As well as
limiting the income impact, this outcome also raises concerns about potentially increased
susceptibility to rice-specific (climatic or price) shocks in this region.
Table 5.4: IRPEP impact on household income
All regions Region VI Region VIII Region X
Total income per capita 10.77%* 18.23%*** -9.06% 0.35%***
Wage income per capita -11.12% -27.97%*** -56.11% -82.33%***
Household enterprise income per
capita -40.67%** 6.90% -124.14%** -19.97%
Income from sale of livestock and
livestock produce per capita -42.30% 192.59%*** -95.08%*** -111.25%***
Other income per capita 24.87% -5.47% -76.26% 65.49%***
Share of rice revenue in total
income (%)†
3.65** -3.49 -1.35 13.47***
Nr. Income sources -0.11 -0.09 -0.70 -0.21
Nr. Crop varieties grown 0.01 0.04*** -0.07** 0.02
Asset index -0.02 -0.14*** -0.25 0.10
Tropical Livestock Units 0.22 1.14*** 0.15** 0.30***
Nr. observations 1,452 445 487 497
Note: *,** and *** indicate that the estimated ATET is statistically significant at the 10, 5 and 1% levels, respectively.
†= Coefficients represent percentage point change.
5.2.4 Poverty reduction
We find that beneficiaries are around 7 percent more likely to be above the US$1.90 a day poverty
line (Table 5.5). The positive income effects in regions VI and X were translated into a 6 percent
increase in both regions in the likelihood of being above this poverty line. Improvements in the
likelihood of being above all poverty lines except the 60th percentile were found in Region VI. As we
will see, this pro-poor finding is likely due to the sample for this region containing more downstream
households, who are poorer and who we find to have benefitted more from IRPEP. Unsurprisingly
we do not observe any poverty reduction effect in Region VIII. The findings for Region X imply a
less pro-poor impact, with a positive effect only found for the US$1.90 a day poverty line and the
60th percentile threshold.

28
Table 5.5: IRPEP impact on poverty
Likelihood of being above
the… All regions Region VI Region VIII
Region
X
$1 per person per day 2.69 9.81*** -0.94 -4.13***
$1.25 per person per day 4.31 12.56*** 2.47 -4.77***
$1.90 per person per day 6.67* 6.36*** -1.96 6.15***
40th percentile in sample 4.37 5.16** 3.55 4.77
60th percentile in sample -1.22 -4.24 -10.98* 1.32***
Nr. observations 1,409 445 473 490
Note: *,** and *** indicate that the estimated ATET is statistically significant at the 10, 5 and 1% levels, respectively.
All poverty lines are in purchasing power parity terms.
5.2.5 Land and other input use
Impacts on land use are presented in Table 5.6, where we find no overall impact on total cultivated
area or cropping intensity. For the regions individually, only Region X increased their land use (by
0.4 ha or 17 percent), and in Region VI we find a significant decrease. Cropping intensity, which is
an indicator of land utilisation both within and across seasons, significantly increased in regions VIII
and X by around 30 percent, but decreased by 12.5 percent in Region VI.
Table 5.6: IRPEP impact on land use
All regions Region VI Region VIII Region X
Cropping area (ha.) -0.02 -0.13*** 0.05 0.40***
Cropping intensity (%)† 10.10 -12.48*** 27.08** 27.79***
Nr. observations 1,394 441 472 480
Note: *,** and *** indicate that the estimated ATET is statistically significant at the 10, 5 and 1% levels, respectively.
†= Coefficients represent a percentage point change.
Impacts on the use of other inputs are presented in Table 5.7. Only in Region VI do we find an
increase in input expenditure, which averaged 14.4 percent or PHP2,833.95 (approx. US$56) per
hectare. This again highlights how increased yields in Region VI were mainly driven by greater input
use, rather than efficiency. Broken down, the Region VI effect is caused by increased fertiliser, seed
and machinery expenditures, cancelling out significantly reduced labour and pesticide/ herbicide/
insecticide expenditure. In Region VIII, the use of almost all other inputs other than seeds
significantly decreased. Contrastingly, expenditure on labor and seeds increased in Region X, but
expenditure on weed and pest control and machinery decreased. Expenditure on post-harvest
processes decreased across the board.
At the parcel level, we also find reductions across regions in organic fertiliser use and no or negative
effects on hybrid or certified seed use, which may reflect constrained input access highlighted in the
qualitative data. We also tested if seed type affected productivity amongst sample households and
found a that the VCR for parcels using hybrid seed parcels improved significantly by 13 percent,
against a non-significant finding for traditional seeds.
We assess input-specific efficiency using expenditure per metric tonne of output, and find that
irrigation cost efficiency decreased by 10.3 percent, but not significantly. This effect masks an
improvement in efficiency in Region X, reflecting the other irrigation impacts in this region. Other
areas of efficiency improvement were for paid labour, land rental, seeds and crop protection in

29
Region VI, and fertiliser, crop protection and machinery in Region X. Efficiency of expenditure did
not improve in any area in Region VIII.
As noted, rice farming is commonly labour intensive with low mechanisation in the Philippines. The
results in Table 5.7 show that irrigation can help to address this in some cases, such as Region VI
where we see increased machinery expenditure, decreased labour expenditure, and an improvement
in labour productivity. Although the lack of impact on the VCR in Region VI suggests that
households in this region face other barriers to their productivity not addressed by the project.
Table 5.7: IRPEP impact on input use
All regions Region VI Region
VIII Region X
Total input expt. per ha 5.46% 14.37%*** -3.84% -2.01%
Expt. per ha on:
Land rental
Waged labour
Fertiliser
Seeds
Pesticide/herbicide/insecticide
Machinery
Post-harvest processing
-21.33%
-11.84%***
3.08%
8.25%
-30.26%***
31.04%
-50.44%***
-124.37%***
-16.35%***
40.77%***
34.95%***
-13.31%***
102.55%***
-64.54%***
-18.46%
-14.55%*
-29.86%**
32.49%
-59.06%**
-33.70%***
-48.52%
41.61%
16.82%***
-5.62%***
64.03%***
-10.01%
-65.60%**
-43.96%
Expt. per tonne of output on:
Irrigation
Land rental
Waged labour
Fertiliser
Seeds
Pesticide/herbicide/insecticide
Machinery
10.34%**
-2.15%
-3.27%
2.35%
0.16%
-7.31%
2.37%
17.19%***
-13.77%***
-19.25%***
18.35%***
-1.40%*
-3.98%**
5.18%***
15.92%***
-3.90%
3.98%
-1.89%
1.57%***
-10.40%
1.56%
-7.50%***
4.97%
8.62%
-10.16%***
6.93%
-4.90%***
-13.47%***
Nr. observations 1,394 441 472 480
Parcel level
Use of organic fertiliser (% likelihood) -0.48 -6.57*** -11.15*** -3.92***
Use of hybrid/certified seeds (% likelihood) 5.87 2.35 14.05 -5.00***
Nr. observations 1,625 554 572 499
Note: *,** and *** indicate that the estimated ATET is statistically significant at the 10, 5 and 1% levels, respectively.
5.2.6 Other effects
Nutrition and education impacts are presented in Table 5.8. We find that increased yields and income
in regions VI and X were transferred into improvements in nutrition. On the 0-10 scale, dietary
diversity in Region VI significantly increased by 0.28 on average, and no significant effect was
observed in other regions. Further analysis shows that the likelihood of having consumed meat and
eggs in the past 24 hours also increased for the whole sample, which can likely be linked to IRPEP's
livestock ownership impact. The nutrition results in Region VI could also be linked to the pro-poor
impact in this region, with poorer households starting from a lower nutritional base thus generating
greater returns. The less positive nutrition effects in Region X could be linked to the implications for
dietary diversity of focusing mainly on rice production.
No significantimpacts are observed for the education indicators, but this may be due in some cases to
the lower sample size caused by the exclusion of households without school-age children. This may

30
apply particularly to the school expenditure and enrolment impacts in Region VI, which are likely
linked to the increased income in the region.
Table 5.8: IRPEP impact on nutrition and education
All
regions Region VI Region VIII Region X
Nutrition
Dietary diversity (0-10) 0.38** 0.28*** -0.07 0.04
Nr. observations 1,409 445 473 490
Education
Education expenditure per
child -2.04% 74.35% 22.69% 4.80%
Education enrolment rates (%)† 0.08 10.35 -3.51 -2.74
Ave. nr school days missed of
children in h'hold
-0.32 0.05 -0.05 -0.46
Nr. observations 780 236 284 260
Note: *,** and *** indicate that the estimated ATET is statistically significant at the 10, 5 and 1% levels, respectively.
†= Coefficients represent a percentage point change.
5.3 Household impacts by parcel location
Table 5.9 presents results for key impact indicators by parcel location, showing that IRPEP's
irrigation improvements served to disproportionately improve water supply to downstream parcels.
This is transferred into a larger effect on rice yields, with a significant increase of 10.3 percent for
downstream parcels compared to 2.5 percent for up and midstream parcels, a difference equivalent to
0.34 t/ha. However, the effect on rice sale income is higher and significant for up and midstream
parcels. Breaking this down for downstream parcels, increased yields went towards home
consumption and to paying back production costs, highlighting the dynamics observed in Region VI.
Our irrigation and yield findings by parcel location are in contrast to those for the Bohol Irrigation
Project (JICA, 2012), which found less favourable outcomes for downstream parcels. A key
difference between the projects was the IA capacity building provided by IRPEP. This implies that
IRPEP IAs were potentially better equipped to better regulate water use to ensure a fairer
distribution, leading to a wider sharing of the benefits.
Table 5.9: Results for IRPEP impact by parcel location
Up/midstream Downstream
Nr seasons with sufficient irrigation supply 0.19*** 0.45**
Harvest per ha 2.45%*** 10.26%***
Revenue per ha 92.01%*** 18.56%
Nr. observations 520 533
Note: *,** and *** indicate that the estimated ATET is statistically significant at the 10, 5 and 1% levels, respectively.

31
5.4 Household impacts by pre-project IA size
Table 5.10 presents results on key impact indicators by IA size, separated into large and small IAs
using the medium IA membership size of 69. We find a larger impact on irrigation for households in
smaller systems and, in turn, that households in smaller systems had a statistically significant yield
impact. For rice sale revenue, we find an increase equivalent to PHP9,761.78 (approx US$194) per
hectare for small IAs and a decrease for larger IAs, although neither is statistically significant.
The more favourable results for smaller IAs supports the GoP's ongoing policy of prioritising smaller
systems, echoing the findings of previous studies (Dillon, 2011; ADB, 2012). With households in
smaller IAs having lower mean yields and incomes (See Section 4), this also further highlights the
projects pro-poor impact, which unlike for downstream parcels is also reflected in increased rice sale
income. Testing for whether rice income increased for downstream parcels when the sample is
limited to those in small IAs still shows no impact, suggesting there are factors other than IA size
and IA support that are hindering the rice sale revenue of downstream households.
Table 5.10: IRPEP impact by household's IA size
Large IA Small IA
Nr. seasons with sufficient irrigation 0.36*** 0.88***
Harvest per ha. 5.21% 4.56%***
Revenue per ha -58.43% 56.51%
Nr. observations 512 376
Note: *,** and *** indicate that the estimated ATET is statistically significant at the 10, 5 and 1% levels, respectively.
5.5 Impacts on Irrigator Associations
We present the results of the IA level impact analysis, with the caveat that the low sample size
makes it unlikely for us to find statistically significant results. Accordingly, we place greater
emphasis on the size of the effects rather than the significance level.
5.5.1 Membership and participation
We find that the number of IA members improved signficiantly by an average of 31.9, corresponding
to an increase of approximately 34 percent (Table 5.11). Female membership also increased by an
average of 9.1, although not statistically significantly. The number of female IA officers increased
significantly by 1.5 on average, indicating that the encouragement of female involvement in IAs as
part of the IA capacity building activities were successful. The number of members aged under 30
increased by 3.3 on average, although not statistically significant.
Table 5.11: IRPEP impact on IA membership
Whole sample
Nr members 31.91*
Nr female members 9.13
Nr female officers 1.53**
Nr members under 30 years old 3.25
Nr. observations 111
Note: *,** and *** indicate that the estimated ATET is statistically significant at the 10, 5 and 1% levels, respectively.

32
5.5.2 Income, assets and expenditure
The IA income per member increased by 90.1 percent on average, equivalent to PHP1,915.07
(approx. US$38) per member (Table 5.12), an effect partially driven by increased water user fee
collection averaging 49.3 percent per member, or PHP535.61 (approx US$11). Positively in light of
the recent abolishment of water user fees, we also find an increase in income from other sources of
169 percent, equivalent to PHP1,755.36 (approx. US$35) per member. The qualitative data
highlighted the importance of having their own office for IAs for improving their income generating
capacities, with this often being a prerequisite to attract external support. We also find that IRPEP
IAs are 11.7 percent more likely to have their own offices. We find that expenditure per member
increased by an average of 84.6 percent, and expenditure on system maintenance per member
increased by an average of 102.4 percent.
The doubts over the effectiveness of decentralised irrigation system management seem to have been
addressed by the IA capacity building and other activities of IRPEP. In showing that this support can
increase their operation and maintenance expenditure, income, and assets, our findings show that
such policies could produce substantial and sustained returns. The scoping mission and qualitative
research particularly highlighted the importance of the positive effect on IAs having their own office,
which they noted as being key for attracting further external support, as well as being used for non-
agricultural income generating activities.
Table 5.12: IRPEP impact on IA income
Whole sample
Income
Total income per member 90.09%
Income from water user fees per member 49.26%
Income from other sources per member 169.04%
IA has own office (% likelihood) 11.74
Expenditure
Total expenditure 117.93%
Total expenditure per member 84.61%
Expenditure on irrigation system maintenance per member 102.41%
Nr. observations 111
Note: *,** and *** indicate that the estimated ATET is statistically significant at the 10, 5 and 1% levels, respectively.
5.6 Results of robustness checks
Appendix II contains the full set of results from the secondary analytical model that employed
nearest-neighbour matching on the propensity score, used to test the robustness of the impact
estimates presented above. Overall, the results from this model are qualitatively similar to those from
the primary model, thus strengthening their validity, although in some cases some of the positive
findings are not statistically significant.
For the irrigation supply impacts, the same broadly positive results are found, and similar mixed
effects for yields and rice-sale revenues across regions are observed. The impacts on yields for
Region VI and Region X, and on the rice-sale revenues for Region X are of similar magnitudes but
not significant. Household income indicators provide the only other notable differences, with the

33
impact magnitude in Region X being larger at 5.9 percent, but not significant, and for Region VI, the
size is larger and significant for the positive effect on household enterprise income.
6. Conclusions
This impact assessment used quantitative and qualitative data to test the effectiveness of a 5-year
project to improve the livelihoods of smallholder rice farmers in the Philippines. Specifically, it
addressed four main research questions relating to (i) the household level impacts, (ii) the IA level
impacts, (iii) the heterogeneity of impacts by region, parcel location and IA size, and (iv) other
important lessons that can be taken forward to improve future policy and practice.
At the household level, the project was expected to achieve its desired impacts mainly through
improvements in irrigation water supply to smallholder rice farmers in the project regions. Our
results show that this was unequivocally achieved. However, there were large disparities in findings
on the expected subsequent impacts across the three regions. When not hindered by extreme weather,
as in Region VIII, IRPEP was successful in increasing rice yields, and this effect was larger for
smaller irrigation systems. However, there is some concern over the efficient use of water. There
were positive market participation effects where marketing support was provided, but qualitative
insights suggest that the support was largely ineffective and that impact was driven by increased
marketable surplus and increased pre-sale processing. However, issues with input use and production
efficiency in Region VI—compared to the richer Region X—and for downstream parcels, suggests
further input support is required for poorer households to convert increased yields into market
participation benefits. An interesting and unexpected finding was significant increases in livestock
activities suggesting income and dietary diversification benefits, as well as potential improvements
in resilience to shocks.
An additional unanticipated effect of IRPEP was identified through the mixed findings on household
involvement in off-farm income generating activities. The anticipated effect on wage income was not
achieved for sampled households across regions, as also found in a previous similar study (Nguyen
et al., 2015) but opposing effects on other non-farming income sources were found for Region VI
and X. This implies that contextual factors are leading some households to narrow their activities in
response to the improved irrigation and some are choosing to broaden them, something which has
significant implications for household livelihood resilience and is worth further investigation.
At the IA level, positive and strong impacts on IA participation, organisation, income and irrigation
system maintenance expenditure were found. This filtered down to the household level not only
through improvements in irrigation supply but also in improved equity of water distribution, with
downstream parcels disproportionately benefiting in terms of irrigation water supply and yields.
Finally, perhaps the most important finding in terms of sustainability, the project was found to
increase the amount of IA income generated from sources other than now-abolished water user fees.
The project's goal of improving women's empowerment through increased IA involvement was also
found to have been achieved.
Several lessons for policy and practice can be drawn from this impact assessment. Firstly, we can
conclude that providing support to CIS in the Philippines can produce positive effects on rice yields
over a relatively short period of time. The study particularly highlights the value of combining
infrastructure and IA capacity building activities, something which could be taken on-board by the

34
government's irrigation administration and others providing irrigation interventions. The impact of
irrigation management decentralisation is commonly attributed to poor performance of IAs, and the
positive findings of this study show that, with appropriate support, IAs are able to effectively
conduct operation and maintenance of the systems to promote water- and gender-based equity and
sustainable agricultural benefits. Also, in finding more positive effects for smaller systems, the
results justify the prioritisation of smaller systems by the GoP over larger systems. It should be said,
however, that careful consideration of the institutional context is needed if IRPEP-type intervention
approaches receive more investment. The success of decentralised irrigation and irrigation in general
is highly dependent upon sufficiently conducive institutions, as was noted in the qualitative research
and in the literature (See Lingard, 1994).
The study suggests that this type of support can help to shield farmers from extreme weather shocks,
as in Region VI. This has relevance to ongoing discussions about post-shock support to CIS. As well
as showing that CIS can serve as a useful tool in shielding farmers against climatic shocks, the lack
of effect in Region VIII shows that the shield breaks down under particularly extreme weather events
and requires further support to aid recovery. This finding provides evidence to support the case for
the implementation of planned but long-delayed Communal Irrigation Development Fund for post-
shock rehabilitation

35
References
ADB (Asian Development Bank). 2012. Shallow tubewell irrigation in Nepal: Impacts of the
Community Groundwater Irrigation Sector Project. Manila, Philippines: ADB.
https://www.adb.org/sites/default/files/evaluation-document/35900/files/ies-nep-final.pdf.
.2017. Water Financing Plan [Online] Available at:
https://www.adb.org/sectors/water/financing-program
Ahmadvand, M., E. Karami, and M.T. Iman. 2011. Modeling the determinants of the social impacts
of agricultural development projects. Environmental Impact Assessment Review 31(8-16): 8-16
Austin, P. C. 2009. Balance diagnostics for comparing the distribution of baseline covariates
between treatment groups in propensity-score matched samples. Statistics in Medicine, 28(25): 3083-
3107
. 2011. An Introduction to Propensity Score Methods for Reducing the Effects of
Confounding in Observational Studies. Multivariate Behavioral Research, 46: 399–424.
Austin, P.C. and E.A. Stuart. 2015. Moving towards best practice when using inverse probability of
treatment weighting (IPTW) using the propensity score to estimate causal treatment effects in
observational studies. Statistics in Medicine, 34: 3661-3679
Araral, E.K. 2011. The impact of decentralization on large scale irrigation: Evidence from the
Philippines. Water Alternatives, 4(2): 110-123
Arouna, A., W. Yergo, and Adegbola, P. 2016. Impact assessment of collective marketing of rice by
smallholder producers in Benin. Paper prepared for presentation at the 20th ICABR conference
"Transforming the Bioeconomy: Behaviour, Innovation and Science", Ravello, Italy: 26th-29
th June,
2016
Bagadion, B.U. and Korten, F.F., 1991. Developing irrigators’ organizations: A learning process
approach, in Cernea, M eds. Putting people first: Sociological variables in rural development, 2,
pp.73-112.
Balisacan, A.M., H. Hill, and S.F.A. Piza. 2006. The Philippines and regional development. Manila,
Philippines. Asian Development Bank.
https://www.adb.org/sites/default/files/publication/159365/adbi-dynamic-regional-dev.pdf
Bandyopadhyay, S., P. Shyamsundar, and M. Xie. 2007. Yield impact of irrigation management
transfer: Story of the Philippines. Policy Research Working Paper No. 4298. Washington, DC:
World Bank.
Baser, O. 2006. Too much ado about Propensity Score Models? Comparing methods of Propensity
Score Matching. Value in Health 9(6): 377-385.
Belen, R. 2015. Mapping of the Typhoon Haiyan affected areas in the Philippine using geospatial
data and very high resolution satellite images. Paper presented at the Twentieth United Nations

36
Regional Cartographic Conference for Asia and the Pacific, Jeju, 6-9 October 2015.
https://unstats.un.org/unsd/geoinfo/RCC/docs/rccap20/15_paper-
Mapping%20of%20the%20Typhoon%20Haiyan%20Affected%20Areas%20in%20the%20%20Phili
ppines.pdf
Baser, O. 2006. Too much ado about Propensity Score Models? Comparing methods of Propensity
Score Matching. Value in Health 9(6): 377-385.
Bhattarai, M., R. Sakthivadivel, and I. Hussain. 2002. Irrigation impact on income inequality and
poverty alleviation: Policy issues and options for improved management of irrigation systems.
Working Paper 39. Colombo, Sri Lanka: International Water Management Institute.
https://dlc.dlib.indiana.edu/dlc/bitstream/handle/10535/4838/WOR39.pdf?sequence=1
Bordey, F. H., P. F. Moya, J. C. Beltran, and D. C. Dawe, eds. 2016. Competitiveness of Philippine
rice in Asia. Science City of Muñoz, Philippines: Philippine Rice Research Institute.
Caliendo, M. and S. Kopeinig. 2008. Some practical guideance for the implementation of propensity
score matching. Journal of economic surveys, 22(1):31-72
Cameron, A.C. and D.L. Miller. 2015. A practitioner's guide to cluster-robust inference. Journal of
Human Resources, 50:317-372
Darko, R.O., S. Yuan, L. Hong, J. Liu, and H, Yan. 2016. Irrigation, a productive tool for food
security – A review. Acta Agriculturae Scandinavica, Section B – Soil & Plant Science. 66(3): 191-
206
Decena, F. L. C. 2016. Analysis of the effects of various irrigation service fees for national irrigation
systems in the Philippines. FFTC Agricultural Policy Article. Taipei: Food and Fertilizer Technology
Center for the Asian and Pacific Region (FFTC-AP). http://ap.fftc.agnet.org/ap_db.php?id=585 .
Dillon, A. 2011. Do differences in the scale of irrigation projects generate different impacts on
poverty and production? Journal of Agricultural Economics, 62(2): 474-492
Duflo, E. 2012. Women empowerment and economic development. Journal of Economic Literature,
50(4): 1051-1079.
European Commission. 2015. EU Rice Economic Fact Sheet. Brussels. Belgium: European
Commission Directorate-General for Agricultural and Rural Development.
https://ec.europa.eu/agriculture/sites/agriculture/files/cereals/trade/rice/economic-fact-sheet_en.pdf
FAO (Food and Agriculture Organization of the United Nations). 2010a. Global agro-ecological
zones: Yield and production gaps. http://www.fao.org/nr/gaez/about-data-portal/yield-and-
production-gaps/en/.
FAO (Food and Agriculture Organization of the United Nations). 2010b. Guidelines for measuring
household and individual dietary diversity. Rome, Italy: FAO. http://www.fao.org/3/a-i1983e.pdf
Filmer, D. and L.H. Pritchett. 2001. Estimating wealth effects without expenditure data – Or tears:
An application to educational enrollments in states of India. Demography, 38(1): 115-132
Frankenberger, T., Langworthy, M., Spangler, T. & Nelson, S., 2012. Enhancing Resilience to Food
Security Shocks. TANGO Internation White Paper, Tucson
Fujiie, M., Y. Hayami, and M. Kikuchi. 2005. The conditions of collective action for local commons
management: The case of irrigation in the Philippines. Agricultural Economics, 33: 179-189.
Garbero, A. Measuring IFAD's impact. IFAD Research Series Issue 7. Rome, Italy: IFAD

37
Gertler, P., Martinez, S., Premand, P., Rawlings, L. & Vermeersch, C., 2011. Impact Evaluation in
Practice. Washington, DC, USA: World Bank Publications.
Godfray, C., Beddington, J., Crute, I., Haddad, L., Lawrence, D., Muir, J., Pretty, J., Robinson, S.,
Thomas, S. & Toulman, C., 2010. Food security: The challenge of feeding 9 billion people. Science,
Vol 327(5967) pp. 812-818.
Gonzales, L.S. 1993. Management turnover of a pump irrigation system in the Philippines: The
farmers' way. IIMI Country Paper – The Philippines No. 2. Bangkok, Thailand: UN ESCAP
Hamdy, A., Abu-Zeid, M., Lacirignola, C., 2009. Institutional Capacity Building for Water Sector
Development, Water International, Vol 23(3), pp. 126-133.
Hayami, Y. And M. Kikuchi. 2000. A rice village saga: Three decades of Green Revolution in the
Philippines. New York, USA: International Rice Research Institute.
Headey, D. & Fan, S., 2008. Anatomy of a Crisis: The Causes and Consequences of Surging Food
Prices. Agricultural Economics, Vol 39(s1), pp. 375-391
Hodges, R.J., J.C. Busby, B. Bennett. Postharvest losses and waste in developed and less developed
countries: Opportunities to improve resource use. The Journal of Agricultural Science, 149: 37-45
Huisman, J., Smits, J., 2009. Effects of Household and District level factors on primary school
enrolment in 30 developing countries. World Development, Vol 37(1), pp. 179-193
IFAD (International Fund for Agricultural Development). 2017. Project Completion Report:
Irrigated Rice Production Enhancement Project. Rome, Italy: IFAD
IFC (International Finance Corporation). 2003. Impact of efficient irrigation technology on small
farmers. Washington, DC, USA: IFC.
http://www.ifc.org/wps/wcm/connect/d7f6b6004689f35abc8abd9916182e35/Impact+of+Efficient+Ir
rigation+Technology+on+Small+Farmers+-+IFC+Brochure.pdf?MOD=AJPERES
Inocencio, A. B., C. Ureta, A. Baulita, and A. Baulita. 2016. Technical and institutional evaluation
of selected national and communal irrigation systems and characterization of irrigation sector
governance structure. Discussion Paper Series No. 2016-12. Quezon City, Philippines: Philippine
Institute for Development Studies.
Jahnke, H.E. 1982. Livestock production systems and livestock development in tropical Africa. Kiel,
Germany: Kieler Wissenschaftersverlag Vauk
Jalal, I. 2014. Women, water and leadership. ADB Briefs No. 24. Manila, Philippines: ADB.
https://www.womenforwater.org/uploads/7/7/5/1/77516286/2016_adb_women-water-and-
leadership.pdf
JICA (Japan International Cooperation Agency). 2012. Impact evaluation of the Bohol Irrigation
Project (Phase 2) in the Republic of the Philippines. Tokyo.
http://open_jicareport.jica.go.jp/pdf/1000008651.pdf.
Kakuta, I. 2014. Impact of participatory irrigation management on the Bohol Irrigation Project in the
Philippines. Journal of the Institute for Asian Studies 41: 123-162.
Khandker, S. R., Koolwal, G. B. & Samad, H. A. 2010. Handbook on impact evaluation:
Quantitative methods and practice. Washington, DC, USA: World Bank.
Knox, J., Daccache, A., Hess, T., 2013. What is the Impact of Infrastructure Investments in Roads,
Electricity and Irrigation on Agricultural Productivity? Development, Vol 41, pp. 337-366

38
Kürschner, E., D. Baumert, C. Plastrotmann, A-K. Poppe, K. Riesinger, S. Ziesemer. 2016.
Improving market access for smallholder rice producers in the Philippines. SLE Publication Series –
S264. Berlin, Germany: Center for Rural Development.
Kreft, S., D. Eckstein, and I. Melchior. 2017. Global climate risk index 2017. Germany:
Germanwatch. https://germanwatch.org/en/12978
Lingard, J. 1994. Farm mechanisation and rural development in the Philippines. In: Lloyd, T.,
Morrissey, O. (eds) Poverty, inequality and rural development. Case studies in economic
development. London, UK: Palgrave Macmillan
Maleza, M.C. and Y. Nishimura. 2007. Participatory processes and outcomes: The case of national
irrigation system management in Bohol, Philippines. Irrigation and Drainage, 56(1): 21-28
Markelova, H., Meinzen-Dick, R., Hellin, J. & Dohrn, S., 2009. Collective action for smallholder
market access. Food Policy, Vol 34(1), pp. 1-7.
Mataia, A.B., R.O. Olivares, R.G. Manalili, R.B. Malasa, A.C.Litonjua, G.O. Redondo, R.Z. Relado,
S.J. Paran, and C.M. Tolentino. 2015. Impact of Farmer Field School – Palaycheck in the irrigated
rice areas in the Philippines. Philippines Journal of Crop Science, 40(3): 30-42
NEDA (National Economic Development Authority). 2011. Philippine Development Plan 2011-
2016. Manila, Philippines. http://www.neda.gov.ph/2013/10/21/philippine-development-plan-2011-
2016/
.2017. Philippine Development Plan 2017-2022. Manila, Philippines.
http://www.neda.gov.ph/tag/philippine-development-plan-2017-2022/
Nguyen, M. R., A. C. Rola, R. Arcala-Hall, J. C. Lizada, C. L. Abansi, and M. E. David. 2015.
Comparative analysis of the national and communal irrigation systems’ water governance: The
Philippines case. Journal of Public Affairs and Development 2 (2): 1-35.
OECD (Organisation for Economic Co-operation and Development). 2017. Agricultural policies in
the Philippines. Paris: OECD Publishing. http://www.oecd-
ilibrary.org/docserver/download/5117011e.pdf?expires=1513772073&id=id&accname=ocid195767
&checksum=B17BBA91326D0491351C324F8CBA9855.
Palmer-Jones, R., N. Dilokkunanant, B. Phonyiam, S. Punyaratabandhu, T. Sutthiwongse, and S.
Hanpongpandh. 2012. Impact evaluation of Mae Lao Irrigation Improvement project, Thailand. 3ie
Grantee Final Report. Washington, D.C: International Initiative for Impact Evaluation (3ie).
PSA (Philippines Statistics Authority). 2015. Special Report – Highlights of the 2012 census of
agriculture. Manila, Philippines. https://psa.gov.ph/content/special-report-highlights-2012-census-
agriculture-2012-ca
2016. CountrySTAT Philippines. Manila, Philippines.
http://countrystat.psa.gov.ph/?cont=10&pageid=1&ma=P10LUTIA
Ragasa, C. and A. Chapoto. 2016. Limits to Green Revolution in rice in Africa: The case of Ghana.
IFPRI Discussion Paper 01561. Washington, DC., USA: IFPRI
Ring, H., M. Morey, E. Kavanagh, K. Kamto, N. McCarthy, J. Brubaker, and C. Rakotondrafara.
2017. Quasi-experimental impact evaluation (ex-post) of IFAD's AD2M project in Madagascar.
Final report. Washington, DC: American Institutes for Research.

39
Rosegrant, M. W., N. Perez, A. Pradesha, and T. S. Thomas. 2016. The economywide impacts of
climate change on Philippine agriculture. Climate Change Policy Note 1. Washington, DC:
International Food Policy Research Institute.
SEPO (Senate Economic Planning Office). 2017. Rice Tariffication: Why is it a necessary public
policy? SEPO Policy Brief, December, 2017. Manila, Philippines: SEPO
http://www.senate.gov.ph/publications/SEPO/PB_Rice_Tariffication_19Dec2017.pdf
Shepherd, A. 1997. Market information services: Theory and practice. FAO Agricultural Services
Bulletin No. 125. Rome, Italy: FAO
Voleskey, J.D. and R.T. Clark. 2003. Use of irrigated pastures and economics of establishment and
grazing. Range Beef Cow Symposium, 60.
https://digitalcommons.unl.edu/cgi/viewcontent.cgi?referer=https://www.google.it/&httpsredir=1&ar
ticle=1059&context=rangebeefcowsymp
Wooldridge, J.M. 2010. Econometric analysis of cross section and panel data. 2nd
ed. Cambridge,
MA: MIT Press
World Bank, 2001. Engendering development: Through gender equality in rights, resources, and
voice. New York and Oxford: Oxford University Press; Washington D.C: World Bank
Ferreira, F.H.G., Chen, S., Dabalen, A.L., Dikhanov, Y.M., Hamadeh, N., Jolliffe, D.M., Narayan,
A., Prydz, E.B., Revenga, A.L., Sangraula, P., Serajuddin, U., Yoshida, N. 2015. A global count of
the extreme poor in 2012: Data issues, methodology and initial results. Policy Research Paper No
WPS 7432. Washington, DC., USA: World Bank
World Bank. 2017. Philippines lessons learned from Yolanda: An assessment of the post-Yolanda
short- and medium-term recovery and rehabilitation interventions of the Government. Washington,
DC, USA: World Bank. https://openknowledge.worldbank.org/handle/10986/28540
WFP (World Food Programme). 2017. Food security and nutrition in the Philippines. Strategic
Review. https://docs.wfp.org/api/documents/WFP-0000015508/download/
White, H., 2009. Theory-based impact evaluation: Principles and practice, International Initiative for
Impact Evaluation Working Paper No. 3

40
Appendix I – Results from secondary impact estimation model
A1. Irrigation water supply
All regions Region VI Region VIII Region X
Nr. seasons with sufficient
irrigation
0.39*** 0.88*** 0.37*** 0.15*
Percent of land covered by
irrigation (%) †
18.13*** 34.38*** 18.90*** 5.47
Expenditure on irrigation per ha. 162.69%*** 376.59%*
**
239.68%*** -60.48%**
Nr observations 1,390 441 468 480
Note: *,** and *** indicate that the estimated ATET is statistically significant at the 10, 5 and 1% levels, respectively.
† Coefficient represents a percentage point change.
A2. Rice productivity
All regions Region VI Region VIII Region X
Harvest per ha 3.65% 8.89% -5.06% 8.88%
Value-cost ratio per ha. 1.89% 2.36% -0.35% 8.71%**
Nr. Observations 1,390 441 468 480
Note: *,** and *** indicate that the estimated ATET is statistically significant at the 10, 5 and 1% levels, respectively.
A3. Rice harvest use
All regions Region VI Region VIII Region X
Revenue per ha. 6.52% -37.20% -9.34% 41.30%
Percent of harvest sold (%)† 1.31 -2.30 0.35 6.09***
Percent of harvest sold, processed (%)† 0.93 -2.14*** 1.67** 2.24
Percent of harvest stored for home
consumption (%)†
-2.26 -3.04 -0.30 -1.75
Percent of harvest used to pay prod. costs
(incl. water user fees) (%) †
1.48*** 5.09*** -0.70 -0.04
Nr. Observations 1,390 441 468 480
Note: *,** and *** indicate that the estimated ATET is statistically significant at the 10, 5 and 1% levels, respectively.
†= Coefficients represent percentage point change.

41
A4. Household income
All regions Region VI Region VIII Region X
Total income per capita 6.71% 41.76%*** -4.84% 5.90%
Wage income per capita -16.71% -22.52% 31.64% -17.70%
Household enterprise income per
capita 7.34% 105.41%** -80.00% -20.38%
Income from sale of livestock and
livestock produce per capita -30.36% 63.74% -56.25% -56.90%
Other income per capita 22.34% 5.19% 26.93% 77.47%
Share of rice revenue in total
income (%)†
0.55 -2.09 -0.01 3.92
Nr. Income sources -0.02 0.05 -0.06 0.07
Nr. Crop varieties grown 0.05** -0.02 0.03 0.02
Asset index 0.01 -0.03 -0.01 0.04
Tropical Livestock Units 0.23* -0.11 0.27 0.41**
Nr. Observations 1,405 468 487 497
Note: *,** and *** indicate that the estimated ATET is statistically significant at the 10, 5 and 1% levels, respectively.
†= Coefficient represent percentage point change.
A5. Poverty
Likelihood of being above the… All regions Region
VI Region VIII Region X
$1 per person per day -1.99 5.35 -0.28 1.04
$1.25 per person per day 0.01 14.50*** -0.84 0.26
$1.90 per person per day 3.62 18.21*** 2.07 0.49
40th percentile in sample 4.81* 22.70*** 2.72 -3.48
60th percentile in sample -0.34 5.68 -7.13* 1.05
Nr. Observations 1,405 446 469 490
Note: *,** and *** indicate that the estimated ATET is statistically significant at the 10, 5 and 1% levels, respectively.
All poverty lines are in purchasing power parity terms.
A6. Land use
All regions Region VI Region VIII Region X
Cropping area (ha.) -0.08 -0.22* 0.06 -0.29*
Cropping intensity (%)† 1.85 0.35 10.80*** 0.08
Nr. Observations 1,390 441 468 480
Note: *,** and *** indicate that the estimated ATET is statistically significant at the 10, 5 and 1% levels, respectively.
†= Coefficients represent a percentage point change.

42
A7. Input use
All regions Region VI Region VIII Region X
Total input expt. per ha 6.19%** 17.90%*** 5.83% -0.66%
Expt. per ha on:
Land rental
Waged labour
Fertiliser
Seeds
Pesticide/herbicide/insecticide
Machinery
Post-harvest processing
-25.33%
-8.92%
4.51%
26.63%
-13.96%**
34.32%**
-20.65%
-143.03%***
-9.85%
24.99%***
-13.05%
-7.14%
149.50%***
47.96%
17.60%
4.96%
-22.38%
12.22%
-20.99%*
-18.02%
-29.32%
-1.24%
-16.08%
7.33%
25.48%
-1.50%
-45.04%
-56.81%
Expt. per tonne of output on:
Irrigation
Land rental
Waged labour
Fertiliser
Seeds
Pesticide/herbicide/insecticide
Machinery
7.16%***
-4.41%
-3.15%
3.64%
1.65%
-2.08%
3.61%
21.54%***
-16.47%***
-9.77%***
13.36%***
-11.10%**
-1.45%
12.11%**
11.94***
2.15%
13.19%***
-2.05%
2.70%
1.27%
6.16%
-9.32***
-5.01%
-4.73%
-4.33%
6.47%
-5.23%
-6.77%
Nr. Observations 1,390 441 468 480
Parcel level
Use of organic fertiliser (% likelihood) -0.39 -4.36** 0.74 -7.82***
Use of hybrid/certified seeds (%
likelihood)
6.40** 18.27*** 9.36** -11.08**
Nr. Observations 1,620 554 567 499
Note: *,** and *** indicate that the estimated ATET is statistically significant at the 10, 5 and 1% levels, respectively.
A8. Nutrition and education
All regions Region VI Region VIII Region X
Dietary diversity (0-10) 0.30** 0.88*** -0.26 0.09
Nr. Observations 1,405 468 487 497
Education expenditure per child 1.32% 23.29% 15.30% 0.78%
Education enrolment rates (%)† 0.08 0.01 -4.17 -2.05
Ave. nr school days missed of
children in h'hold
-0.10 0.17 -1.14 -0.14
Nr. Observations 752 221 275 256
Note: *,** and *** indicate that the estimated ATET is statistically significant at the 10, 5 and 1% levels, respectively.
†= Coefficients represent a percentage point change.

43
A9. Impact by parcel location
Up/midstream Downstream
Nr seasons with sufficient irrigation supply 0.29*** 0.45***
Harvest per ha 5.50% 18.51%***
Revenue per ha 83.20%** 43.03%
Nr. observations 515 533
Note: *,** and *** indicate that the estimated ATET is statistically significant at the 10, 5 and 1% levels, respectively.
A10. IRPEP by household's IA size
Large IA Small IA
Nr. seasons with sufficient irrigation 0.08 0.71***
Harvest per ha. 15.98%*** 6.71%
Revenue per ha -0.71% 17.94%
Nr. Observations 515 369
Note: *,** and *** indicate that the estimated ATET is statistically significant at the 10, 5 and 1% levels, respectively.
A11. IA membership
Whole sample
Nr members 23.51
Nr female members 6.77
Nr female officers 1.47*
Nr. Observations 111
Note: *,** and *** indicate that the estimated ATET is statistically significant at the 10, 5 and 1% levels, respectively.

44
A12. IA income
Whole sample
Income
Total income per member 67.75%
Income from water user fees per member 116.43%
Income from other sources per member 61.37%
IA has own office (% likelihood) 5.45
Expenditure
Total expenditure 88.49%
Total expenditure per member 60.71%
Expenditure on irrigation system maintenance per member 94.80%
Nr. observations 111
Note: *,** and *** indicate that the estimated ATET is statistically significant at the 10, 5 and 1% levels, respectively.

45
Appendix II – Treatment and control means for outcome indicators
B1. Household level outcome indicators
Treatment mean (standard error) Control mean (standard error) P-score
Irrigation water supply
Nr. seasons with sufficient irrigation 1.57 (0.04) 1.29 (0.05) 0.000***
Land covered by irrigation (%) 94.87 (0.68) 78.21 (1.69) 0.000***
Expenditure on irrigation per ha. (PHP) 1048.45 (24.24) 739.66 (32.98) 0.000***
Rice productivity
Harvest per ha (kg) 3409.86 (54.55) 3,467.09 (64.27) 0.5001
Value-cost ratio per ha. (PHP) 1.22 (0.04) 1.172 (0.05) 0.3903
Rice harvest use
Revenue per ha. (PHP) 19,446.42 (784.30) 18,492.97 (844.46) 0.4194
Percent of harvest sold (%) 29.50 (0.90) 28.90 (1.10) 0.6799
Percent of harvest sold, processed (%) 4.00 (0.50) 3.50 (0.50) 0.4464
Percent of harvest stored for home consumption (%) 33.16 (0.80) 31.18 (0.90) 0.1141
Percent of harvest used to pay prod. costs (incl. water
user fees) (%) 11.35 (0.30) 10.11 (0.35) 0.003***
Household income
Total income per capita (PHP) 49,650.78 (2,427.04) 52,014.12 (2,773.10) 0.5267
Wage income per capita (PHP) 13,198.49 (983.19) 15,772.80 (1,566.51) 0.1431
Household enterprise income per capita (PHP) 7,960.76 (802.85) 8,987.21 (1,081.86) 0.4373

46
Income from sale of livestock and livestock produce per
capita (PHP) 2,165.38 (206.88) 2,560.89 (375.28) 0.3204
Other income per capita (PHP) 12,606.87 (1,165.18) 11,794.44 (1,189.13) 0.6374
Share of rice revenue in total income (%) 30.00 (1.16) 31.02 (1.41) 0.5789
Nr. Income sources 3.42 (0.06) 3.26 (0.07) 0.0757*
Nr. Crop varieties grown 1.19 (0.01) 1.14 (0.02) 0.0159**
Asset index 1.53 (0.04) 1.55 (0.04) 0.6771
Tropical Livestock Units 2.19 (0.10) 1.72 (0.09) 0.0011***
Poverty
Above $1 per person per day (%) 83.64 (1.26) 83.90 (1.52) 0.8939
Above $1.25 per person per day (%) 80.53 (1.34) 79.97 (1.66) 0.7911
Above $1.90 per person per day (%) 72.12 (1.52) 70.21 (1.89) 0.4292
Above 40th percentile in sample (%) 62.33 (1.65) 60.45 (2.03) 0.4701
Above 60th percentile in sample (%) 36.98 (1.64) 40.07 (2.03) 0.2355
Land use
Cropping area (ha.) 1.88 (0.06) 2.05 (0.08) 0.0665*
Cropping intensity (%)† 1.85 (0.01) 1.85 (0.02) 0.9873
Input use
Total input expt. per ha (PHP) 23,485.20 (356.90) 22,842.54 (407.35) 0.2416
Expt. per ha on (PHP):
Land rental
Waged labour
Fertiliser
Seeds
Pesticide/herbicide/insecticide
Machinery
1,301.021 (125.15)
7,419.864 (179.34)
5,630.049 (117.37)
1,093.074 (73.87)
2,715.772 (90.21)
4,149.296 (109.58)
1,428.69 (71.08)
2,237.74 (308.28)
7,276.48 (218.19)
5,251.29 (131.71)
1,029.14 (75.16)
2,911.96 (85.53)
4,110.37 (132.45)
1,523.65 (88.53)
0.0016***
0.6119
0.0348**
0.5580
0.1328
0.8212
0.4011

47
Post-harvest processing
Expt. per tonne of output on (PHP):
Irrigation
Land rental
Waged labour
Fertiliser
Seeds
Pesticide/herbicide/insecticide
Machinery
0.38 (0.02)
0.43 (0.05)
2.64 (0.12)
1.98 (0.06)
0.40 (0.05)
0.98 (0.45)
1.40 (0.05)
0.25 (0.02)
0.62 (0.08)
2.39 (0.08)
1.85 (0.09)
0.32 (0.02)
1.00 (0.04)
1.32 (0.04)
0.000***
0.0398**
0.1052
0.2225
0.2447
0.8363
0.2061
Use of organic fertiliser (%, parcel level) 11.00 (1.00) 11.50 (1.27) 0.8108
Use of hybrid/certified seeds (%, parcel level) 74.95 (1.38) 71.97 (1.78) 0.1827
Other indicators
Dietary diversity (0-10) 7.38 (0.07) 7.13 (0.07) 0.0295**
Education expenditure per capita (PHP) 15,943.06 (1,471.62) 13,452.96 (1,107.33) 0.2151
Education enrolment rates (%) 92.57 (1.03) 90.83 (1.38) 0.3028
Ave. nr school days missed of children in h'hold 3.84 (0.22) 3.98 (0.28) 0.6835
Note: P-score represent result of t-test for difference in the treatment and control means. Asterisks represent level of statistical significance of t-test result.
*,** and *** indicate that the difference in means is statistically significant at the 10, 5 and 1% levels, respectively

48
B2. IA level outcome indicators
Treatment mean (standard error) Control mean (standard error) P-score
Membership
Nr members 127.34 (17.71) 93.64 (14.37) 0.1467
Nr female members 31.64 (5.78) 23.11 (4.38) 0.2487
Nr female officers 4.83 (0.50) 3.79 (0.40) 0.1127
Nr young members 5.59 (3.51) 2.13 (0.71) 0.3574
Income
Total income per member (PHP) 3,337.73 (756.83) 2,125.73 (449.96) 0.1815
Income from water user fees per member (PHP) 1,345.03 (482.06) 1,087.31 (300.21) 0.6579
Income from other sources per member (PHP) 1,992.70 (594.65) 1,038.43 (359.63) 0.1823
IA has own office (%) 62.07 (6.43) 56.60 (6.87) 0.5622
Expenditure
Total expenditure (PHP) 25,1175.00 (6,9810.31) 71,846.55 (1,4951.69) 0.0177**
Total expenditure per member (PHP) 1,956.80 (529.38) 1,213.62 (309.12) 0.2391
Expenditure on irrigation system maintenance
per member (PHP) 417.69 (204.56) 186.56 (62.33) 0.3006
Note: P-score represent result of t-test for difference in the treatment and control means. Asterisks represent level of statistical significance of t-test result.
*,** and *** indicate that the difference in means is statistically significant at the 10, 5 and 1% levels, respectively

49
Appendix III – IPWRA Diagnostic tests: Change in standardised mean different and variance ratio for weighting variables
C1. Household-level analysis
Standardized differences Variance ratio
Raw Weighted Raw Weighted
Average age in household -0.02 0.03 0.85 1.04
Average age in household squared -0.04 0.03 0.85 1.09
Maximum education in household (years) -0.01 -0.01 1.00 1.02
Age of household head 0.03 0.03 0.83 1.04
Age of household head squared 0.01 0.03 0.87 1.09
Gender of household head (Female = 1) -0.01 0.07 0.97 1.19
Education of household head (years) -0.06 0.09 0.86 0.91
Interaction: Gender of household head * Education of household head (years) -0.04 0.07 0.83 1.19
Household size 0.06 -0.03 0.94 1.03
Nr adults in household 0.10 -0.01 1.04 1.04
Nr adults in household squared 0.08 0.00 0.99 0.98
Nr rooms in home (2010) -0.07 -0.03 0.93 1.00

50
Interaction: Nr rooms in home * Home is owned (Home owned = 1) -0.02 -0.05 0.85 0.99
Average distance to market across seasons -0.16 0.06 0.39 0.94
Nr droughts experienced since 2010 0.03 0.01 1.09 0.95
Nr large livestock owned (2010) 0.19 0.05 3.37 1.82
Nr medium livestock owned (2010) 0.00 -0.05 1.38 1.51
Nr small livestock owned (2010) 0.03 0.00 0.94 0.88
Asset index score (2010) -0.03 -0.03 1.02 0.98
Nr floods experienced since 2010 -0.09 -0.03 0.95 1.33
Nr IA members in household (2010) 0.20 0.02 0.88 1.06
Nr female IA members in household (2010) 0.03 0.03 1.07 1.07
Nr economically active household members (2010) 0.14 0.03 1.10 0.99
Nr members of at least one community group in h'hold (2010) 0.03 0.00 1.05 1.04
Household is located in Antique province (1 if located in province) -0.05 -0.02 0.96 0.99
Household is located in Capiz province (1 if located in province) -0.23 -0.04 0.75 0.94
Household is located in N. Leyte province (1 if located in province) 0.13 -0.16 3.76 0.41
Household is located in W. Samar province (1 if located in province) 0.34 -0.05 3.24 0.90
Percent of owned land that is upstream 0.02 -0.03 1.05 0.94
Percent of owned land that is midstream 0.15 0.08 1.36 1.16

51
Percent of owned land that is downstream 0.02 -0.07 1.03 0.93
Percent of owned land that is flat 0.06 -0.06 1.05 0.96
Amount of land owned (hectares) 0.07 0.01 1.56 1.65
Proportion of CIS sample who received loan in past year 0.04 -0.05 0.67 0.69
C2. IA level analysis
Standardized difference Variance ratio
Raw Weighted Raw Weighted
IA income 2010, log) 0.18 -0.06 1.01 0.95
IA had an office in 2010 0.16 0.05 1.12 1.03
Nr. IA members (2010, log) 0.09 -0.04 1.37 1.74
Nr. female IA members (2010, log) 0.13 -0.05 1.32 1.68
Nr. IA members under 30 (2010, log) 0.12 0.06 1.76 1.40
Percent of IA covered by concrete canal irrigation (Wet season, 2010) 0.01 -0.13 1.39 1.21
Percent of IA covered by earthen canal irrigation (Wet season, 2010) 0.17 0.04 1.08 1.21
Percent of IA covered by pipe/drip irrigation (Wet season, 2010) 0.17 0.14 2.52 1.95
Percent of IA covered by no/rainfed irrigation (Wet season, 2010) 0.04 0.06 1.44 1.62
Percent of IA covered by earthen canal irrigation (Dry season, 2010) 0.16 0.08 0.93 1.10
Percent of IA covered by concrete canal irrigation (Dry season, 2010) 0.20 -0.11 1.36 0.99

52
Percent of IA covered by no/rainfed irrigation (Dry season, 2010) 0.09 0.07 1.58 1.65
Years since IA formation -0.38 0.00 1.04 0.97
IA province -0.06 -0.01 1.37 1.45

53

54

1

2