Embed Size (px)
Citation preview

Irrigated
Pasture
Systems
Comparative
Project
Stage 3
Final Report

Irrigated Pasture Systems Comparative Project Final Report Page 2 of 28
Irrigated Pasture Systems Comparative Project
Final Report - Stage 3
This is the final report of stage three of the Irrigated Pasture Systems Comparative Project.
This project was commenced in 2003 and originally consisted of four stages. This report
represents the final data collection and summary of results under the original project, and
contains best practice guidelines and discusses management practices implemented on the
farms taking part in the trial process. At this point in time the goals outlined in stage four
will not be undertaken by this project, but are to be delivered by the stakeholders on an
industry by industry level.
Horizon Farming as project managers through the term of the project, take this opportunity
to thank all of the stakeholders, farmers and industry personnel who have assisted in
bringing this project to fruition.
We trust this report, and the reports and data sets that precede it will help provide the basis
for improving irrigation management and assist in identifying, and quantifying productivity
increases that can result from these practice changes, as per the project goals.
Irrigated Pasture Systems Comparative Project Final Report Page 3 of 28
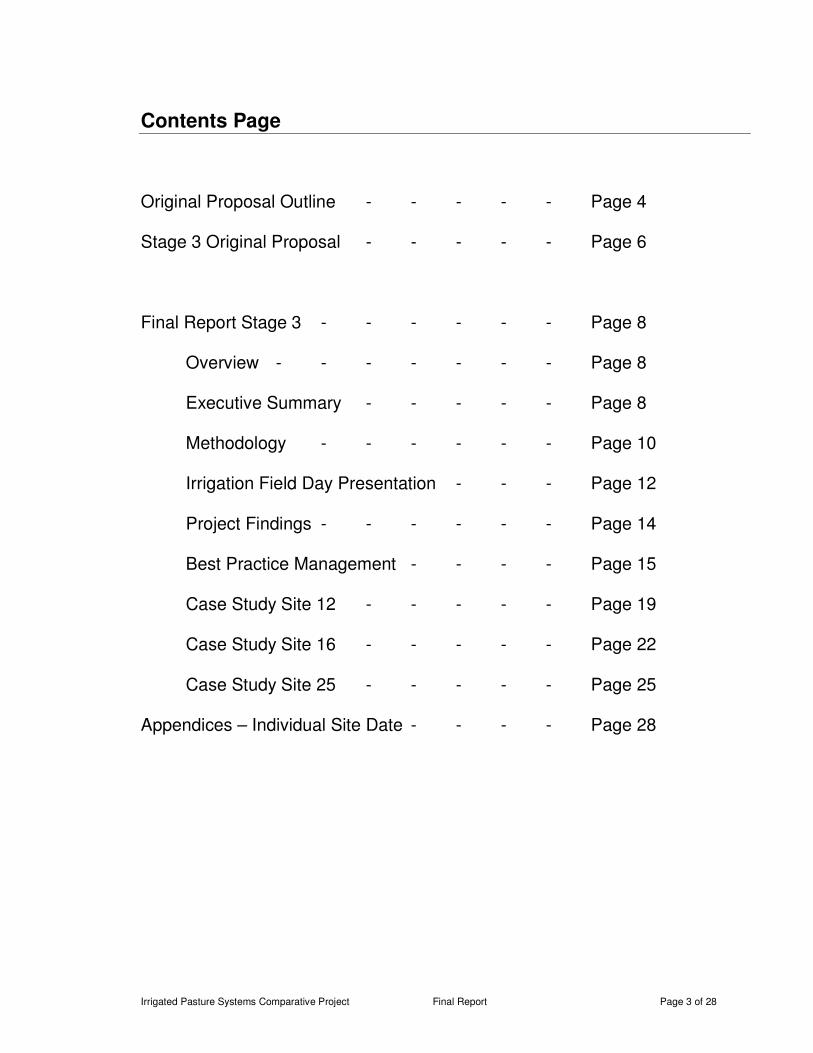
Contents Page
Original Proposal Outline - - - - - Page 4
Stage 3 Original Proposal - - - - - Page 6
Final Report Stage 3 - - - - - - Page 8
Overview - - - - - - - Page 8
Executive Summary - - - - - Page 8
Methodology - - - - - - Page 10
Irrigation Field Day Presentation - - - Page 12
Project Findings - - - - - - Page 14
Best Practice Management - - - - Page 15
Case Study Site 12 - - - - - Page 19
Case Study Site 16 - - - - - Page 22
Case Study Site 25 - - - - - Page 25
Appendices – Individual Site Date - - - - Page 28
Irrigated Pasture Systems Comparative Project Final Report Page 4 of 28
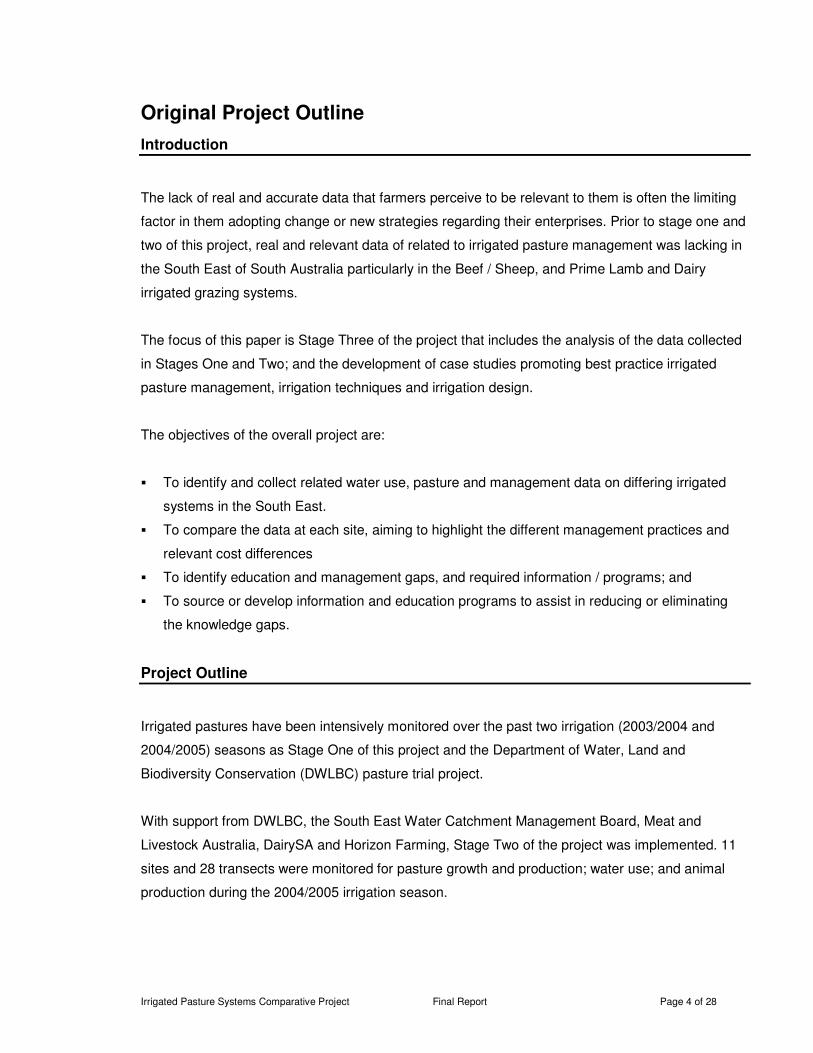
Original Project Outline
Introduction
The lack of real and accurate data that farmers perceive to be relevant to them is often the limiting
factor in them adopting change or new strategies regarding their enterprises. Prior to stage one and
two of this project, real and relevant data of related to irrigated pasture management was lacking in
the South East of South Australia particularly in the Beef / Sheep, and Prime Lamb and Dairy
irrigated grazing systems.
The focus of this paper is Stage Three of the project that includes the analysis of the data collected
in Stages One and Two; and the development of case studies promoting best practice irrigated
pasture management, irrigation techniques and irrigation design.
The objectives of the overall project are:
� To identify and collect related water use, pasture and management data on differing irrigated
systems in the South East.
� To compare the data at each site, aiming to highlight the different management practices and
relevant cost differences
� To identify education and management gaps, and required information / programs; and
� To source or develop information and education programs to assist in reducing or eliminating
the knowledge gaps.
Project Outline
Irrigated pastures have been intensively monitored over the past two irrigation (2003/2004 and
2004/2005) seasons as Stage One of this project and the Department of Water, Land and
Biodiversity Conservation (DWLBC) pasture trial project.
With support from DWLBC, the South East Water Catchment Management Board, Meat and
Livestock Australia, DairySA and Horizon Farming, Stage Two of the project was implemented. 11
sites and 28 transects were monitored for pasture growth and production; water use; and animal
production during the 2004/2005 irrigation season.

Irrigated Pasture Systems Comparative Project Final Report Page 5 of 28
During development of the project, it was reasoned that information collected would ably assist
primary producers managing irrigated pastures for grazing purposes, become more efficient and
effective in both irrigation practices and pasture management. This will result in higher water use
efficiency (WUE) and productivity from current irrigation areas in the mid South East.
Both flood and overhead spray systems were targeted in Stage Two of the project. Each stage of
the project has provided outcomes in its own right. However, it is intended that the four stages
together will deliver an overall program to achieve relevant aims and strategic outcomes for project
stakeholders. The four stages are outlined as follows.
Stage 1 of the proposed four (4) stage project is complete. This involved intensive monitoring of
the DWLBC pasture trials project. Data collected and reported included kilograms of dry matter
grown; growth rate; leaf stage and appearance rate; height; days to grazing; cover at grazing; and
climatic data.
Stage 2 was completed in July of 2005. It involved collecting comparable data from eleven (11)
irrigated pastures sites in the mid South East with 28 transects monitored. The sites were a mix of
flood and overhead irrigated sites; beef (4), lamb (4) and dairy (3) enterprises; and different
production systems. Data collected included pasture as stated in Stage 1, soil moisture for a
number of sites, water use and application, and animal production data from each enterprise.
Stage 4 was proposed to use findings from Stage 3 to identify training, motivational and
information gaps required by district standard practice irrigated pasture managers, to achieve
current district best practice, for sustainable and profitable irrigation management in the mid South
East. Strategies to extend this information were to be developed to incorporate the material into
current and planned training programs, the development of fact sheets or other methods to ensure
that interested farmers had access to the information. – This is no longer proposed to be completed
and is instead incorporated to some degree on this report and is to be undertaken by the
stakeholders within their industry segments.

Irrigated Pasture Systems Comparative Project Final Report Page 6 of 28
Original Project Proposal for this stage – (Stage Three)
Objectives
� To describe the different irrigation and pasture management systems within the trials
undertaken in Stage Two of the Four Stage Project.
� To illustrate the advantages and disadvantages of different irrigated pasture management
systems.
� To determine the cost benefits of growing irrigated pasture under different irrigation and
management systems.
� To document the trial work and results for the three years of the trials.
Outcomes
� Analyse data collected to determine cost benefits of efficient irrigation management and
strategic grazing management.
� Understand the economic and environmental benefits of strategic grazing management
techniques and efficient irrigation management.
� Extraction of key points from the three milestones to be used for the extension of information as
proposed for stage four.
Method
Stage Three, overseen by a steering committee, involves the development and completion of a
Cost Benefit Analysis and from this the extraction of Extension Focus Points based from the data
collection from stage one and two.
It is understood that anonymity is paramount and therefore will be upheld throughout the whole of
the project.
Steering Committee
� Megan Shawyer – Project Manager (Horizon Farming)
� Rick Jordan – Senior Consultant for Horizon Farming
� Joy Cunneen – DWLBC and the Mid South East Irrigation Group
� Jodie Berkfeld – South East Catchment Water Management Board
� Verity Ingham – Dairy SA and Dairy Industry Development Board –
� MLA – Invite to Attend

Irrigated Pasture Systems Comparative Project Final Report Page 7 of 28
Cost Benefit Analysis
The analysis of cost benefits of the different irrigation practices and grazing management strategies
will be developed. This will assist in articulating the economic benefits of changing to “best practice”
irrigated pasture techniques and provide real and quantifiable data relevant to the South East of
South Australia.
It is anticipated that a full report will made available to the stakeholders of stage three of the project.
To uphold the anonymity of the participating farms a second report will be constructed that will be
made available for the participants and be the primary input for stage four of the project.
Duration
It was expected that Stage Three of the project will start in August 2005 and be completed by March
2006. This final report was commenced later than the original start date and was completed in May
2006.
Irrigated Pasture Systems Comparative Project Final Report Page 8 of 28
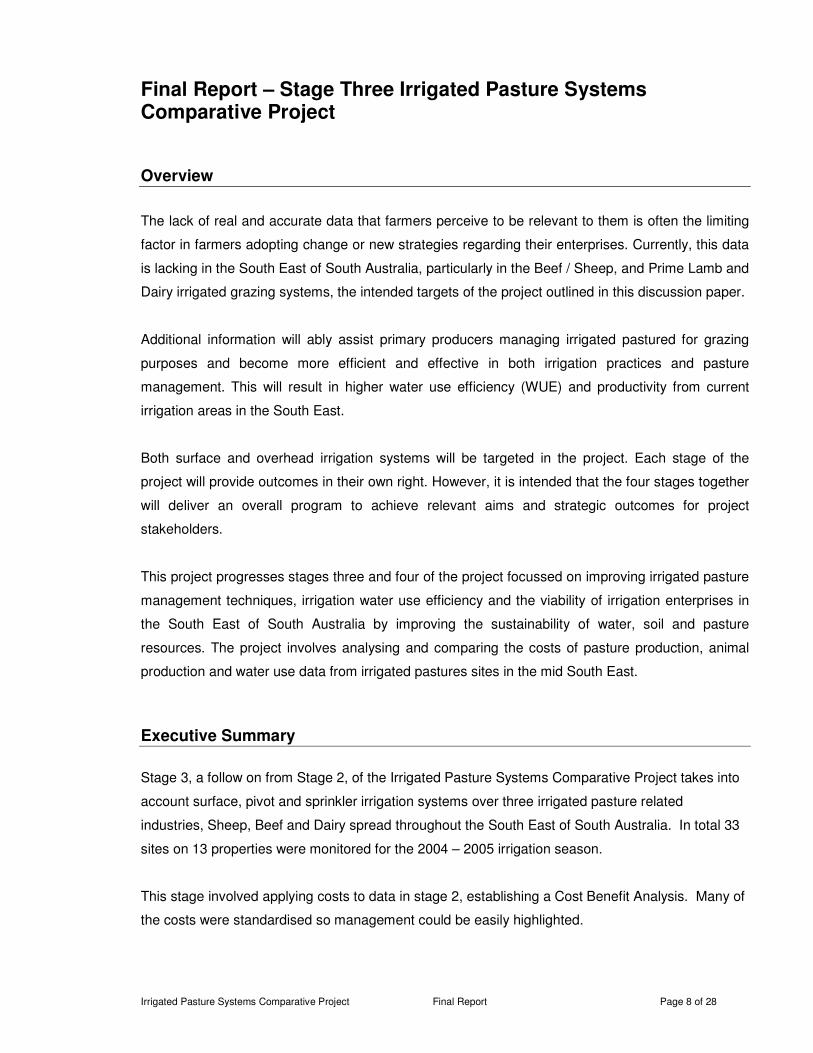
Final Report – Stage Three Irrigated Pasture Systems Comparative Project
Overview
The lack of real and accurate data that farmers perceive to be relevant to them is often the limiting
factor in farmers adopting change or new strategies regarding their enterprises. Currently, this data
is lacking in the South East of South Australia, particularly in the Beef / Sheep, and Prime Lamb and
Dairy irrigated grazing systems, the intended targets of the project outlined in this discussion paper.
Additional information will ably assist primary producers managing irrigated pastured for grazing
purposes and become more efficient and effective in both irrigation practices and pasture
management. This will result in higher water use efficiency (WUE) and productivity from current
irrigation areas in the South East.
Both surface and overhead irrigation systems will be targeted in the project. Each stage of the
project will provide outcomes in their own right. However, it is intended that the four stages together
will deliver an overall program to achieve relevant aims and strategic outcomes for project
stakeholders.
This project progresses stages three and four of the project focussed on improving irrigated pasture
management techniques, irrigation water use efficiency and the viability of irrigation enterprises in
the South East of South Australia by improving the sustainability of water, soil and pasture
resources. The project involves analysing and comparing the costs of pasture production, animal
production and water use data from irrigated pastures sites in the mid South East.
Executive Summary
Stage 3, a follow on from Stage 2, of the Irrigated Pasture Systems Comparative Project takes into
account surface, pivot and sprinkler irrigation systems over three irrigated pasture related
industries, Sheep, Beef and Dairy spread throughout the South East of South Australia. In total 33
sites on 13 properties were monitored for the 2004 – 2005 irrigation season.
This stage involved applying costs to data in stage 2, establishing a Cost Benefit Analysis. Many of
the costs were standardised so management could be easily highlighted.

Irrigated Pasture Systems Comparative Project Final Report Page 9 of 28
Overview of Findings
Comparison of Irrigation Systems
Average
PRODUCTION Pivot Flood Sprinkler
KgDM Grown /Ha 9836 4178 13389 Kg liveweight /ha 586 293 Litres/ha 16269 20567 BUSINESS
Income /ha $ 2,939.29 $ 454.07 $ 5,141.74 Expenses /ha $ 835.31 $ 210.08 $ 1,483.96
Gross profit /ha $ 2,103.98 $ 243.99 $ 3,657.78
WATER USE
KgDM/mm 16.95 4.02 28.61 ME/mm 190.53 40.23 330.42
Comparison of Enterprises
Average
PRODUCTION PL Beef Beef & PL Dairy
KgDM Grown /Ha 4993 5137 6253 11562 kg liveweight /ha 527 358 419 litres/ha 16699 BUSINESS
Income /ha $ 817.12 $ 555.04 $ 649.33 $ 4,174.73
Expenses /ha $ 290.30 $ 126.48 $ 471.40 $ 1,118.84
Gross profit /ha $ 526.82 $ 428.56 $ 177.94 $ 3,055.89
WATER USE
kgDM/mm 4.77 8.89 9.83 20.08
ME/mm 46 101 106 227
Irrigated Pasture Systems Comparative Project Final Report Page 10 of 28
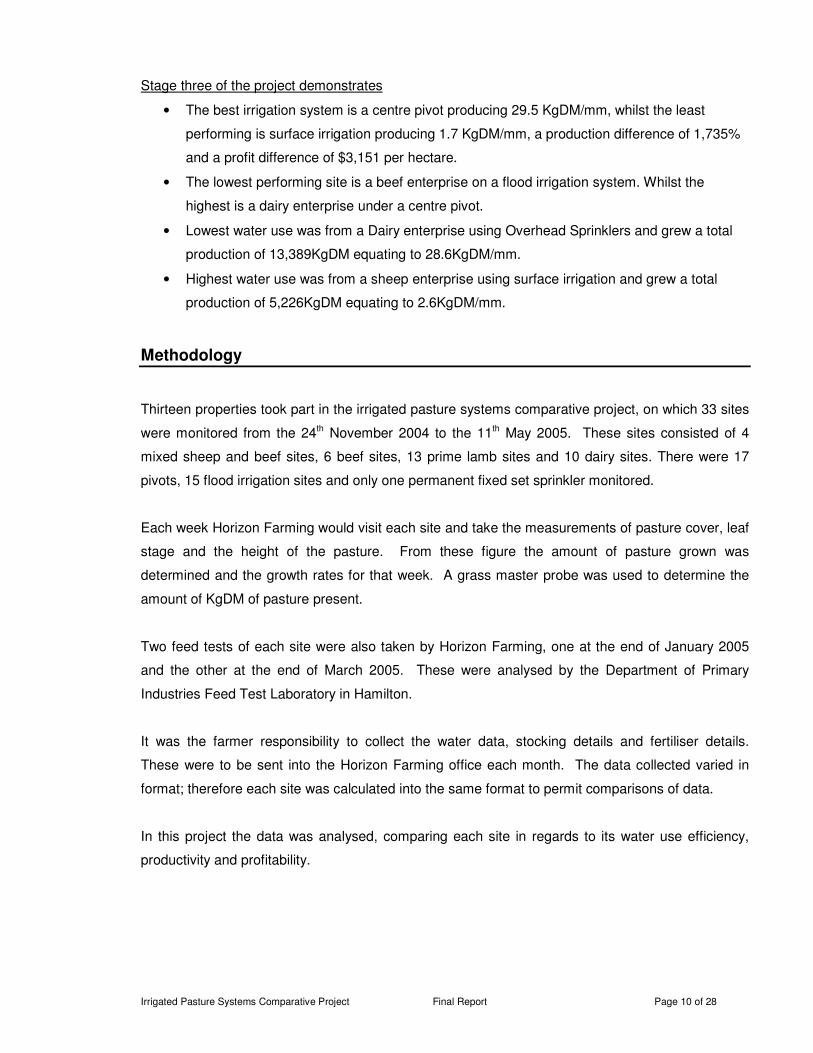
Stage three of the project demonstrates
• The best irrigation system is a centre pivot producing 29.5 KgDM/mm, whilst the least
performing is surface irrigation producing 1.7 KgDM/mm, a production difference of 1,735%
and a profit difference of $3,151 per hectare.
• The lowest performing site is a beef enterprise on a flood irrigation system. Whilst the
highest is a dairy enterprise under a centre pivot.
• Lowest water use was from a Dairy enterprise using Overhead Sprinklers and grew a total
production of 13,389KgDM equating to 28.6KgDM/mm.
• Highest water use was from a sheep enterprise using surface irrigation and grew a total
production of 5,226KgDM equating to 2.6KgDM/mm.
Methodology
Thirteen properties took part in the irrigated pasture systems comparative project, on which 33 sites
were monitored from the 24th November 2004 to the 11th May 2005. These sites consisted of 4
mixed sheep and beef sites, 6 beef sites, 13 prime lamb sites and 10 dairy sites. There were 17
pivots, 15 flood irrigation sites and only one permanent fixed set sprinkler monitored.
Each week Horizon Farming would visit each site and take the measurements of pasture cover, leaf
stage and the height of the pasture. From these figure the amount of pasture grown was
determined and the growth rates for that week. A grass master probe was used to determine the
amount of KgDM of pasture present.
Two feed tests of each site were also taken by Horizon Farming, one at the end of January 2005
and the other at the end of March 2005. These were analysed by the Department of Primary
Industries Feed Test Laboratory in Hamilton.
It was the farmer responsibility to collect the water data, stocking details and fertiliser details.
These were to be sent into the Horizon Farming office each month. The data collected varied in
format; therefore each site was calculated into the same format to permit comparisons of data.
In this project the data was analysed, comparing each site in regards to its water use efficiency,
productivity and profitability.
Irrigated Pasture Systems Comparative Project Final Report Page 11 of 28
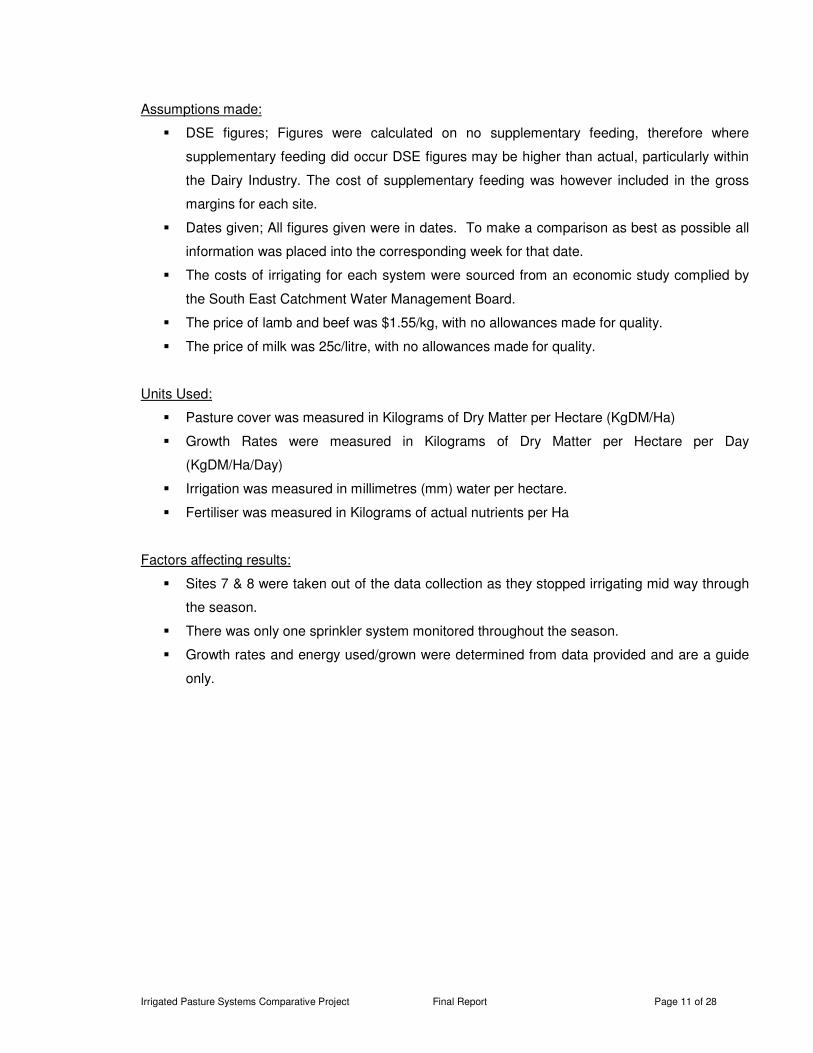
Assumptions made:
� DSE figures; Figures were calculated on no supplementary feeding, therefore where
supplementary feeding did occur DSE figures may be higher than actual, particularly within
the Dairy Industry. The cost of supplementary feeding was however included in the gross
margins for each site.
� Dates given; All figures given were in dates. To make a comparison as best as possible all
information was placed into the corresponding week for that date.
� The costs of irrigating for each system were sourced from an economic study complied by
the South East Catchment Water Management Board.
� The price of lamb and beef was $1.55/kg, with no allowances made for quality.
� The price of milk was 25c/litre, with no allowances made for quality.
Units Used:
� Pasture cover was measured in Kilograms of Dry Matter per Hectare (KgDM/Ha)
� Growth Rates were measured in Kilograms of Dry Matter per Hectare per Day
(KgDM/Ha/Day)
� Irrigation was measured in millimetres (mm) water per hectare.
� Fertiliser was measured in Kilograms of actual nutrients per Ha
Factors affecting results:
� Sites 7 & 8 were taken out of the data collection as they stopped irrigating mid way through
the season.
� There was only one sprinkler system monitored throughout the season.
� Growth rates and energy used/grown were determined from data provided and are a guide
only.

Irrigated Pasture Systems Comparative Project Final Report Page 12 of 28
Irrigation Field Day Presentation
The following data was presented at the DWLBC Irrigation field days held at Struan Research Centre on 21st February 2006 Dairy Enterprises
Average
PRODUCTION Pivot Sprinkler Dairy
Av pasture cover (KgDM/ha) 2316 1926 2277
Av growth rate (KgDM/ha/day) 66 61 65
Av MJME (per Feedtest) 11.39 11.55 11.41
Total irrigated mm/ha
618 468 603
Total KgN/ha 184 134 179
KgDM Grown/Ha 11359 13389 11562
Litres Milk /ha 16269 20567 16699
Litres Milk /mm 27.18 43.95 28.86
BUSINESS
Income /ha $ 4,067.29 $ 5,141.74 $ 4,174.73
Income / mm $ 6.80 $ 10.99 $ 7.22
Expenses /ha Pasture expenses $ 27.81 $ 27.81 $ 27.81
Supplementary feeding $ 576.89 $ 1,011.43 $ 620.35
Fertiliser $ 430.21 $ 402.70 $ 427.46
Water $ 42.02 $ 54.02 $ 43.22
$ 1,076.93 $ 1,495.96 $ 1,118.84
Gross profit /ha $ 2,990.35 $ 3,645.78 $ 3,055.89
WATER USE
KgDM/mm 19.13 28.61 20.08
MJME/mm 216 330 227
� Pasture Cover – measurements of Kilograms of Dry Matter (KgDM) were taken weekly.
� Growth Rate – The difference between pasture measurements divided by the number of
days.
� MJME – Mega joules of Energy of the pasture taken from 2 separate feed tests.
� Mm/Ha – Metered volumes of water divided by the area
� Kg N/Ha – Kilograms of actual nitrogen applied per hectare.
� Litres Milk/mm – Litres of milk production divided by the mm/ha of irrigation applied.
Irrigated Pasture Systems Comparative Project Final Report Page 13 of 28
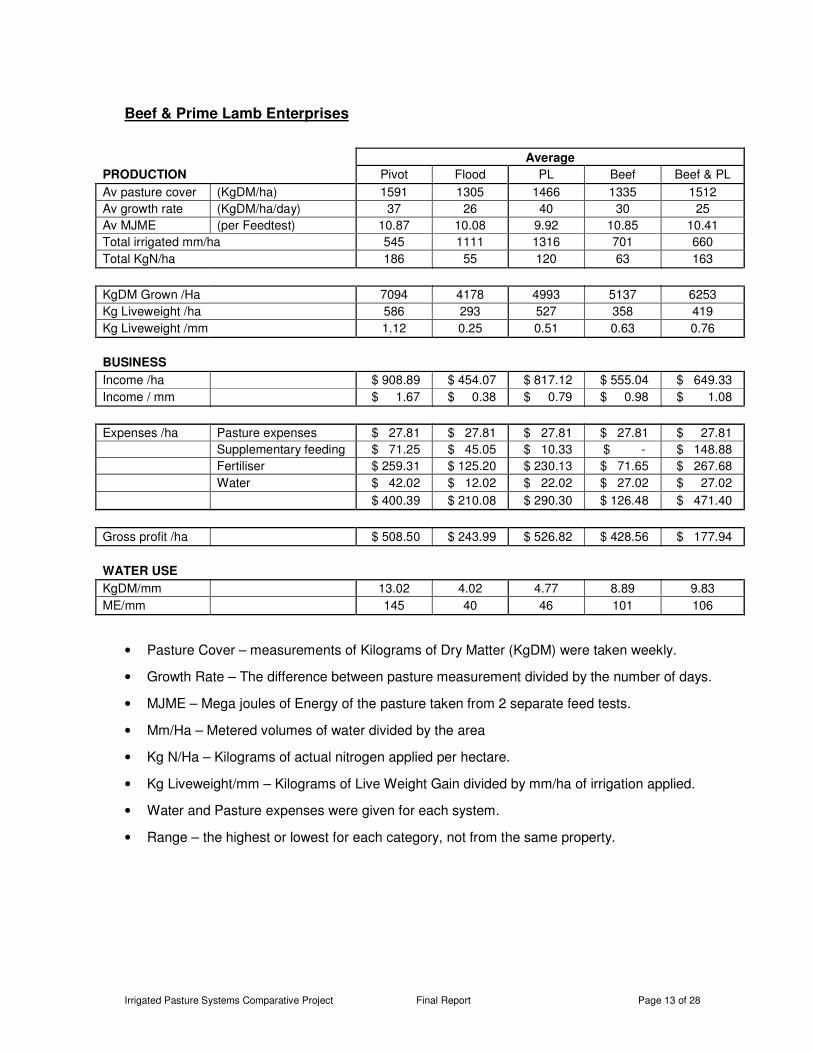
Beef & Prime Lamb Enterprises
Average
PRODUCTION Pivot Flood PL Beef Beef & PL
Av pasture cover (KgDM/ha) 1591 1305 1466 1335 1512
Av growth rate (KgDM/ha/day) 37 26 40 30 25
Av MJME (per Feedtest) 10.87 10.08 9.92 10.85 10.41
Total irrigated mm/ha 545 1111 1316 701 660
Total KgN/ha 186 55 120 63 163
KgDM Grown /Ha 7094 4178 4993 5137 6253
Kg Liveweight /ha 586 293 527 358 419
Kg Liveweight /mm 1.12 0.25 0.51 0.63 0.76
BUSINESS
Income /ha $ 908.89 $ 454.07 $ 817.12 $ 555.04 $ 649.33
Income / mm $ 1.67 $ 0.38 $ 0.79 $ 0.98 $ 1.08
Expenses /ha Pasture expenses $ 27.81 $ 27.81 $ 27.81 $ 27.81 $ 27.81
Supplementary feeding $ 71.25 $ 45.05 $ 10.33 $ - $ 148.88
Fertiliser $ 259.31 $ 125.20 $ 230.13 $ 71.65 $ 267.68
Water $ 42.02 $ 12.02 $ 22.02 $ 27.02 $ 27.02
$ 400.39 $ 210.08 $ 290.30 $ 126.48 $ 471.40
Gross profit /ha $ 508.50 $ 243.99 $ 526.82 $ 428.56 $ 177.94
WATER USE
KgDM/mm 13.02 4.02 4.77 8.89 9.83
ME/mm 145 40 46 101 106
• Pasture Cover – measurements of Kilograms of Dry Matter (KgDM) were taken weekly.
• Growth Rate – The difference between pasture measurement divided by the number of days.
• MJME – Mega joules of Energy of the pasture taken from 2 separate feed tests.
• Mm/Ha – Metered volumes of water divided by the area
• Kg N/Ha – Kilograms of actual nitrogen applied per hectare.
• Kg Liveweight/mm – Kilograms of Live Weight Gain divided by mm/ha of irrigation applied.
• Water and Pasture expenses were given for each system.
• Range – the highest or lowest for each category, not from the same property.
Irrigated Pasture Systems Comparative Project Final Report Page 14 of 28
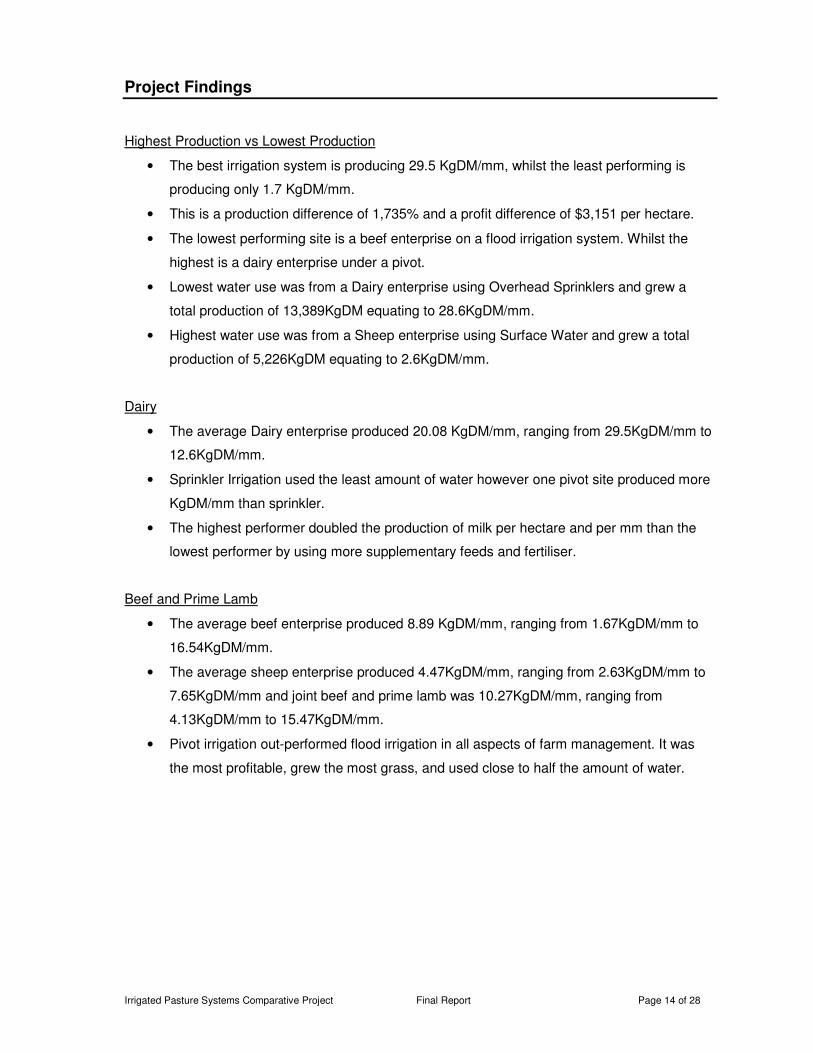
Project Findings
Highest Production vs Lowest Production
• The best irrigation system is producing 29.5 KgDM/mm, whilst the least performing is
producing only 1.7 KgDM/mm.
• This is a production difference of 1,735% and a profit difference of $3,151 per hectare.
• The lowest performing site is a beef enterprise on a flood irrigation system. Whilst the
highest is a dairy enterprise under a pivot.
• Lowest water use was from a Dairy enterprise using Overhead Sprinklers and grew a
total production of 13,389KgDM equating to 28.6KgDM/mm.
• Highest water use was from a Sheep enterprise using Surface Water and grew a total
production of 5,226KgDM equating to 2.6KgDM/mm.
Dairy
• The average Dairy enterprise produced 20.08 KgDM/mm, ranging from 29.5KgDM/mm to
12.6KgDM/mm.
• Sprinkler Irrigation used the least amount of water however one pivot site produced more
KgDM/mm than sprinkler.
• The highest performer doubled the production of milk per hectare and per mm than the
lowest performer by using more supplementary feeds and fertiliser.
Beef and Prime Lamb
• The average beef enterprise produced 8.89 KgDM/mm, ranging from 1.67KgDM/mm to
16.54KgDM/mm.
• The average sheep enterprise produced 4.47KgDM/mm, ranging from 2.63KgDM/mm to
7.65KgDM/mm and joint beef and prime lamb was 10.27KgDM/mm, ranging from
4.13KgDM/mm to 15.47KgDM/mm.
• Pivot irrigation out-performed flood irrigation in all aspects of farm management. It was
the most profitable, grew the most grass, and used close to half the amount of water.

Irrigated Pasture Systems Comparative Project Final Report Page 15 of 28
Best Practice Management Identified within the Project
The project highlighted significant differences in productivity on and from the irrigation systems monitored. These differences occurred across the enterprise mixes but also within similar enterprises and locations. This highlighted the impact of management on the productivity and profitability of the irrigated systems. The system being utilised choice (spray vs. surface) was also significant (and is a management choice), but there were large differences between similar systems that again reinforced management of the system as the productivity driver. The difference between the highest and lowest production figures was 1,735 % (29.5 kg compared with 1.7 kg DM / mm of water applied). This translated into a gross profit difference of $3,151 per Ha ($3248.10 compared with $97.19 gross margin per Ha.). These higher production systems employed a number of similar management and cultural practices with regard to their irrigation systems, these are listed below.
Management
� Set targets and management strategies / plans to achieve them – The higher
production systems had established growth rate and productivity goals and targets. This
focussed management on required outcomes and led to development and
implementation of management plans and activities. These systems were most likely to
achieve results expected and less likely to be influenced by external or “unforeseen”
factors.
Grazing Management
� Rotationally Graze – high yielding pastures occurred where stock were rotated around
paddocks, based on a rotation giving plants required recovery periods between gazing.
All Dairy sites had rotational grazing, and had the highest pasture yields as an enterprise.
� Leave adequate grazing residuals – Ensure pasture is not grazed below optimum
height. Leaving sufficient leaf post grazing, protects the soil from extreme temperatures in
summer, actually lowers water use, and allows for increased regrowth rates post grazing
– Higher production systems had a higher cover of pasture. Target residuals of 1600 in
summer increasing to 2000 kg DM in winter.
� Graze when Paddock is ready to graze – Grazing rotation should be based on pasture
plants being at 2.5 leaf stage or at canopy closure – whichever comes first. This bases
grazing on optimum time for plant to maintain quality, growth rates and persistence.
Grazing at this stage tends to also optimise animal performance.

Irrigated Pasture Systems Comparative Project Final Report Page 16 of 28
Irrigation Scheduling
� Water at night – this tends to be the period with the least evaporation losses. This not
only optimises utilisation by the system of the water applied, but it can minimise leaf burn
or heat related effects of watering on leaves. It also allows benefits from off peak power
usage of day tariffs.
� Water when less windy – wind causes high losses form water being applied to water
being root available.
� Water smaller amounts more frequently – Most high production pasture species tend
to have relatively shallow roots. These shallow root zones dry out and lower growth rates
rapidly if not addressed. Heavy watering regimes may result in water passing the root
zone of the plants. This can result in leaching of nutrients past the root zone.
Irrigation Monitoring
� Know your RAW values – The amount of water available to your pasture is known as
Readily Available Water. RAW is calculated from the soil types moisture holding
capability, and root depth of the plants. This value tells you the amount of water available
to the plants to optimise growth, and the amount of water needed to be maintained in the
profile.
� Use a monitoring system - Using an irrigation monitoring system allows you to gain a
full understanding of the movement and use of irrigation water within your system. This
information can be used in conjunction with weather data to set irrigation intervals and
amounts applied.
� Ensure you are not under or over watering. – Water is the most important plant
requirement during the irrigation season. Too little, and plant growth rates and quality
decline rapidly. Too much and the soil becomes waterlogged. Plant requirements change
dramatically in response to weather conditions and growth rates being experienced. To
optimise growth, these requirements must be met and where possible pre-empted to
optimise growth. The higher production systems in the trial applied significant resources
to optimising soil moisture levels.
� Physically check soil moisture and plant growth regularly. - All of the higher
production systems had a high level of physical monitoring in conjunction with remote
monitoring systems. This involved inspecting the different soil type and or pasture areas
within the system, using a spade or probe to check soil moisture levels and penetration
depth. This physical checking of the system allows you to assess many facets of the
systems at the same time and identify and address issues before they impact on
productivity.

Irrigated Pasture Systems Comparative Project Final Report Page 17 of 28
Fertiliser Applications
� Soil and tissue test your irrigation area each year. – Know the base levels of nutrients
and their availability. Monitor and compare these against plant availability through tissue
testing during the growing season.
� Have a Fertiliser Budget – to build soil nutrient status over time and address system
nutrient requirement to maintain plant growth targets. Should be based on achieving the
yield targets required and replacing nutrients exported while taking into account any
nutrient imports into the system.
� Apply smaller amounts more frequently – Frequency of fertiliser applications should
be based on ensuring nutrient availability is optimised and nutrients required are supplied.
Smaller more frequent applications tend to be more efficient and less likely to result in
leaching of applied nutrients through the soil profile.
Pasture Species
� Select pasture species suited to your system – Different species have different water
requirements and deliver different results. Ensure the species you choose are capable of
delivering the results you require, both from a system and animal production perspective.
� Achieve the results – Know the potential of the species sown and manage the pasture
to achieve these, the results required should then be able to be achieved.
� Ensure pasture management is correct to maximize growth and quality. – Set and
implement weed and insect pest control strategies, as well as the irrigation and grazing
management practices previously discussed.
� Maintain pasture density – Dense pasture is critical to achieving yield targets. Bare soil
grows nothing, and weeds in the pasture will lower yield and animal performance.
Irrigation Design
� Ensure that the irrigation system chosen suits the site selected. -Spend time on site
selection. Ensure site is suited to the enterprise intended to be undertaken. Consider soil
type, water availability, water quality as well as water delivery method & costs when
selecting site.
� Lowest cost initially may be dearest in long run - When designing the irrigation
system, and choosing irrigation method, remember cheapest is not always best. Cheap
systems may not be able to optimise environment for chosen forage species and while
initial and annual variable costs may be low, productivity from the system may also be
low. This lack of dilution of costs can make the feed produced quite expensive from
“cheap” systems, and high output from “expensive” may make them highly profitable. This
was a trend reinforced by the project.

Irrigated Pasture Systems Comparative Project Final Report Page 18 of 28
Irrigation Equipment
� Ensure the irrigation equipment is able to meet the demands of the pasture / forage
crops intended to be grown - This will not only ensure persistence and growth is
optimised, but is critical to optimise forage quality.
� Set up maintenance schedule for equipment and ensure this is adhered to - Poorly
maintained equipment is not only inefficient at water delivery, it also increases irrigation
costs.

Irrigated Pasture Systems Comparative Project Final Report Page 19 of 28
Case Study Site 12
Enterprise Type: A Dairy Operation
Location: Wandilo
Topography: Flat to slightly undulating
Soil Type: Sandy loam over a limestone base
Irrigation Method: A centre pivot irrigation system
Pasture Species: site 12 is a mixture of Perennial Ryegrass and white clover
Pasture Density: The pasture is of a high density
Following are pictures of the site:
Site 12
Site 12 Close
Overview
Site 12 runs a dairying operation consisting of up to 165 dairy cows weighing 600kg each in an
intense rotational grazing system. Over the monitored period their average production was just
over 28Litres/day and they utilised close to 1200kgdm/ha every 15 days, with blended fertiliser
applications being applied every month. The records taken from the site show that it yielded
18150Litres of Milk/ha, had 486mm of irrigation applied and grew 14348kgdm with an average
energy level of 10.6mjme. This equates to 29.52kgdm/mm and 312mjme/mm producing a gross
income profit of $3,248/ha. Out of the 10 dairy sites monitored Site 12 was the best performer.
Irrigated Pasture Systems Comparative Project Final Report Page 20 of 28
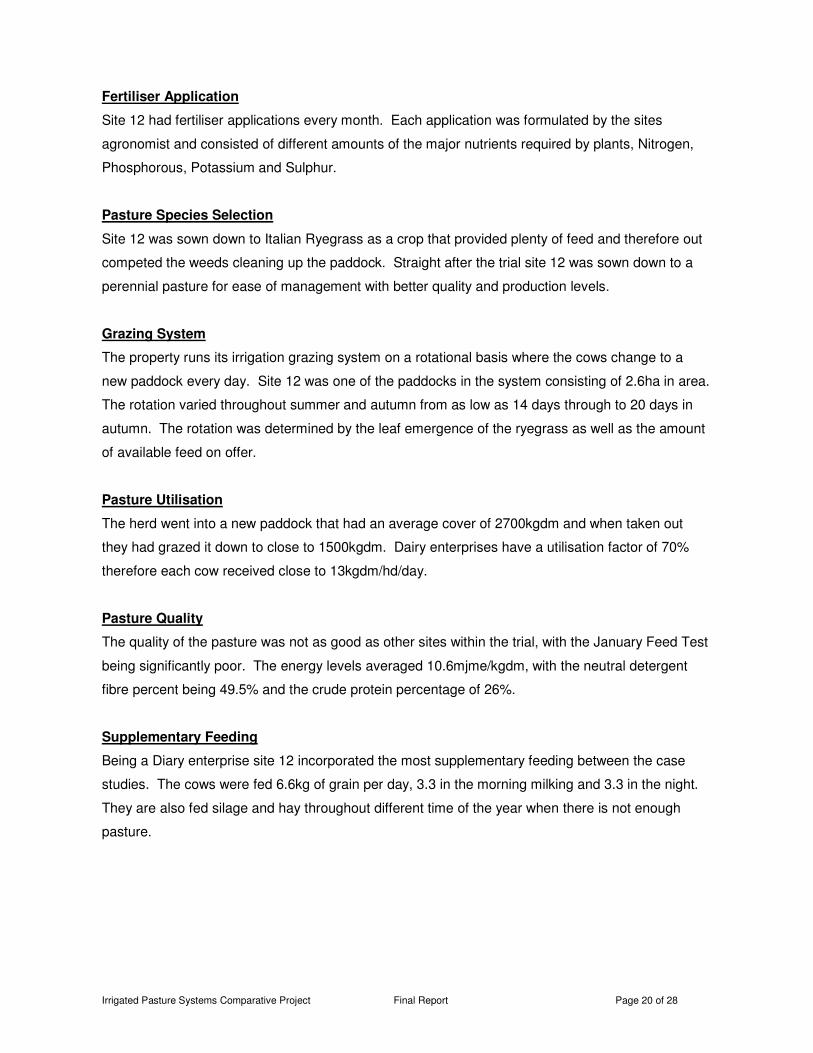
Fertiliser Application
Site 12 had fertiliser applications every month. Each application was formulated by the sites
agronomist and consisted of different amounts of the major nutrients required by plants, Nitrogen,
Phosphorous, Potassium and Sulphur.
Pasture Species Selection
Site 12 was sown down to Italian Ryegrass as a crop that provided plenty of feed and therefore out
competed the weeds cleaning up the paddock. Straight after the trial site 12 was sown down to a
perennial pasture for ease of management with better quality and production levels.
Grazing System
The property runs its irrigation grazing system on a rotational basis where the cows change to a
new paddock every day. Site 12 was one of the paddocks in the system consisting of 2.6ha in area.
The rotation varied throughout summer and autumn from as low as 14 days through to 20 days in
autumn. The rotation was determined by the leaf emergence of the ryegrass as well as the amount
of available feed on offer.
Pasture Utilisation
The herd went into a new paddock that had an average cover of 2700kgdm and when taken out
they had grazed it down to close to 1500kgdm. Dairy enterprises have a utilisation factor of 70%
therefore each cow received close to 13kgdm/hd/day.
Pasture Quality
The quality of the pasture was not as good as other sites within the trial, with the January Feed Test
being significantly poor. The energy levels averaged 10.6mjme/kgdm, with the neutral detergent
fibre percent being 49.5% and the crude protein percentage of 26%.
Supplementary Feeding
Being a Diary enterprise site 12 incorporated the most supplementary feeding between the case
studies. The cows were fed 6.6kg of grain per day, 3.3 in the morning milking and 3.3 in the night.
They are also fed silage and hay throughout different time of the year when there is not enough
pasture.

Irrigated Pasture Systems Comparative Project Final Report Page 21 of 28
Irrigation Monitoring System
Site 12 uses an irrigation monitoring company to come and check their soil water level each week.
The company reads an average of 3 sites using a neutron probe. They then determine the average
soil moisture levels at different depths, a total value and daily water use of the centre pivot. From
those figures they then give irrigation recommendations for the following week.
Soil Nutrient Status
Nutrient Analysis Value
pH (1:5 water) 7.0
pH (1:5 CaCl) 6.6
Organic Carbon %C 2.9
Nitrate Nitrogen mg/kg 11.0
Sulfate Sulfur (KCI40) mg/kg 12.0
Phosphorous (Colwell) mg/kg 230.0
Phosphorous (Olsen) mg/kg 68.5
Phosphorous Buffer Index 71.0
Potassium (Amm-acet) meg/100g 0.36
Calcium (Amm-acet) meg/100g 10.0
Magnesium (Amm-acet) meg/100g 1.3
Sodium (Amm-acet) meg/100g 0.17
Chloride mg/kg 31.0
Elect. Conductivity dS/m 0.12
Copper (DTPA) mg/kg 1.4
Zinc (DTPA) mg/kg 7.5
Manganese (DTPA) mg/kg 11.0
Iron (DTPA) mg/kg 87.0
Boron (HotCaCl2) mg/kg 1.1
Molybdenum -
Amm. Nitrogen (KCI) mg/kg 5.1
Cation Exchange Capacity meg/100g 11.8
Calcium/Magnesium ratio 7.70
Sodium % of cations (ESP) 1.4
Elect. Conductivity (Sat. Ext.) dS/m 1.1
Selenium -

Irrigated Pasture Systems Comparative Project Final Report Page 22 of 28
Case Study Site 16
Enterprise Type: A prime lamb operation
Location: Greenways, Hundred of Smith
Topography: Situated on flat ground
Soil Type: Shallow black clay
Irrigation Method: Site 16 is irrigated with a flood irrigation system
Pasture Species: Site 16 is a pasture trial mixture of Perennial Ryegrass, Fescue, White Clover
and Strawberry Clover
Pasture Density: The pasture is of a high density
Following are pictures taken of the site:
Site 16
Site 16
Overview
Site 16 consists of a prime lamb operation, fattening thousands of lambs on pasture in a rotational
grazing system. Over the monitored period their average weight gain was over 300gms/day and
they utilised close to 1000kgdm/ha every 18 to 20 days, with Nitrogen being applied regularly. The
records taken from the site show that it yielded 895kg of live weight/ha, had 1455mm of surface
irrigation applied and grew 5868kgdm with an average energy level of 11.3mjme. This equates to
4.03kgdm/mm and 45.57mjme/mm producing a gross income profit of $966/ha. Out of the 17 prime
lamb sites monitored Site 16 was the best performer.

Irrigated Pasture Systems Comparative Project Final Report Page 23 of 28
Fertiliser Applications
The decision as to how much fertiliser to apply and of what nutrient is decided considering the
volume of lambs on the pasture. If there are a higher number of lambs then the use of Nitrogen
would increase. Over the monitored period Urea was applied seven times and DAP three putting on
a total of 246kgN and 43kgP per hectare.
Pasture Species Selection
Site 16 is part of a pasture trial that contains many varieties including fescue, cocksfoot, phalaris
and ryegrass. The manager of the property has seen the results of the lambs grazing the different
pasture species and believes that the ryegrass is the best for producing prime lambs under his
system. Therefore all paddocks that are being renovated are being sown down to ryegrass varieties
such as Cordoba.
Grazing System
The property adopts a rotational grazing system; however it is set on the lambs behaviour rather
than number of days in a paddock. The lambs are checked every day; if they are observed to be
mostly sitting down or steadily grazing then there is enough feed in the paddock. However if they
are seen to be walking around more than grazing then they are moved to a fresh paddock. Usually
it takes close to 20days for the lambs to come back onto the same paddock.
Pasture Utilisation
Close to 500kgdm is utilised each grazing, with very little wastage compared to that of cattle. The
lambs would enter a paddock at 2000kgdm/ha and graze it down to close to 1500kgdm/ha. It would
then take 20 days for the pasture to reach 2000kgdm/ha again resulting in a growth rate of
25kgdm/day.
Pasture Quality
The quality of the pasture has to be very good for the lambs to perform off irrigation. Some of the
varieties in the trial were not as good as site 16 that had an energy level of 11.7mjme/ha, a neutral
detergent fibre percentage of 41% and a crude protein percentage of 30%.
Supplementary Feeding
Whether to supplement the pasture with other feeds is also decided upon by observing the lambs’
behaviour. If they preferentially graze ranker feed then the manager will supply a fibre source of
hay to then. If they graze the paddocks down too hard then silage may be added to increase the
quantity of feed available.

Irrigated Pasture Systems Comparative Project Final Report Page 24 of 28
Irrigation System
At present the irrigation system consists of surface irrigation due to the number of trees amongst the
property. However if some of those trees were able to be removed then the manager would
certainly consider a pivot system. The only hassle they will face is the poor drainage of their soil
and possible water logging. At present the flood has a built in drainage system that alleviates this
problem. They do have some underground tapes that they are trialling and will have a better idea of
their success later down the track.
Irrigation Monitoring System
There is no specific irrigation monitoring system on the property that monitors soil moisture levels.
The decision to irrigate is made under consideration of the last irrigation, fertiliser applications,
grazing date and the general look of the pasture.
Soil Nutrient Status
Nutrient Analysis Value
Phosphorous (Olsen) pp/m 8.2
Potassium pp/m 192
Sulfate Sulfur pp/m 10.6
Organic Carbon (%) 3.34
Iron pp/m 410
Elect. Conductivity 0.143
pH (CaCl) 7.5
pH (water) 8.1
Copper (DTPA) 0.7
Zinc (DTPA) 0.86
Manganese (DTPA) 0.79
Iron (DTPA) 26.51
Phosphorous (Ret) 8
Cation Exchange Capacity 24.3
Calcium exchange 15.65
Magnesium exchange 6.38
Sodium exchange 1.71
Potassium exchange 0.56
Boron 1.9
Chloride 96
Potassium Buffer Index (PBI) -

Irrigated Pasture Systems Comparative Project Final Report Page 25 of 28
Case Study Site 25
Enterprise Type: A beef cattle operation
Location: Avenue Range, Hundred of Townsend
Topography: Situated on flat ground
Soil Type: Shallow black clay
Irrigation Method: Irrigation is with a centre pivot
Pasture Species: A mix of Perennial Ryegrass, Plantain and White Clovers
Pasture Density: The pasture is of a medium density
Following are pictures taken of the site:
Site 25
Site 25 Close
Overview
Site 25 runs a steer fattening operation consisting of 240 animals weighing 300kg each in a
rotational grazing system. Over the monitored period their average weight gain was 800gms/day
and they utilised close to 1000kgdm/ha every 42 days, with Nitrogen being applied to the site twice.
The records taken from the site show that it yielded 686kg of live weight/ha, had 544mm irrigation
applied and grew 8999kgdm with an average energy level of 11.75mjme. This equates to
16.54kgdm/mm and 194mjme/mm producing a gross income profit of $890/ha. Out of the 8 beef
sites monitored Site 25 was the best performer.

Irrigated Pasture Systems Comparative Project Final Report Page 26 of 28
Fertiliser Applications
100kg of Urea or 46kg Nitrogen per hectare is applied between 14 and 21 days prior to the
animals coming onto a paddock. This is designed to improve pasture growth rates and minimise
any nitrate effects on the animal. On a 42 day round this indicates fertiliser is applied 3 to 4
times in an irrigation season. Only Urea is used throughout the irrigation season. The
Phosphorous, Potassium and Sulphur nutrient requirements are met during other times of the
year.
Pasture Species Selection
Site 25 is one half of a trial comparing ryegrass with fescue. The ryegrass species planted were
Impact and Bronsyn as the main Ryegrass, sown with prop white clover and a small amount of
plantain. Seeding rates were 20kg/ha. So far the ryegrass is producing more kilograms of live
weight than the fescue.
Grazing System
The whole pivot area consists of 52ha, Site 25 being half of that at 26ha. The pivot is divided
into 8 paddocks 6.5ha in each. The whole mob of 240 animals is run together spending 6 days
in each paddock making up a grazing rotation around the pivot of 42 days.
Pasture Utilisation
The steers enter into a paddock with the pasture quantity close to 1800kgdm/ha. After 6 days
they have grazed it down to 800kgdm/ha, utilising close to 1000kgdm/ha each grazing. It then
takes 42 days for the pasture to regrow to 1800kgdm/ha, averaging a growth rate of 24kgdm/day.
Pasture Quality
There was some difference between the two feed tests taken, with Januarys test being better
than the one taken in March. January had more energy, less fibre and more protein indicating
that the animals could gain and extra 10% of live weight. Overall the average quality of the
ryegrass over both tests was quite good with an energy level average of 11.75mjme/kgdm,
Neutral Detergent Fibre average level 45.6% and Crude Protein average levels of 27.2%.
Supplementary Feeding
There is always a pick of hay around the edge of the pivot for the steers to access some fibre.
This was the only supplementary feeding provided.

Irrigated Pasture Systems Comparative Project Final Report Page 27 of 28
Irrigation Monitoring System
Site 25 is monitored by hand. Occasionally a person physically digs a hole and feels the
moisture levels of the soil.
Soil Nutrient Status
Nutrient Test Analysis Value
pH (1:5 water) 8.2
pH (1:5 CaCl) 7.8
Organic Carbon %C 2.7
Nitrate Nitrogen mg/kg 11.4
Sulphate Sulphur (MCP) mg/kg 63
Phosphorous (Olsen) mg/kg 25
Potassium (Colwell) meg/100g 846.3
Calcium (Amm.Ac) meg/100g 28.37
Magnesium (Amm.Ac) meg/100g 4.79
Calcium/Mg Ratio 5.92
Aluminium -
Sodium ESP % 11.47
Chloride mg/kg 820
Elect. Conductivity (se) dS/m 0.77
Copper (DTPA) mg/kg 0.8
Zinc (DTPA) mg/kg 2.3
Manganese (DTPA) mg/kg 3
Iron (DTPA) mg/kg 22
Boron (DTPA) mg/kg 2.1
Cation ex Capacity meg/100g 39.89
Irrigated Pasture Systems Comparative Project Final Report Page 28 of 28
Appendices Individual Site Data