Embed Size (px)
Citation preview

Iron Ore and Manganese
Anglo American has a unique iron ore resource footprint with large, high quality resource bases in South Africa and Brazil. Anglo American also owns a 40% shareholding in Samancor Manganese, the world’s largest producer of seaborne maganese ore.
Overview of the Minas Rio pipeline area (September 2009)

Share of Group operating profit%
0
5
12
18
24
30
35
30
25
0908
Underlying earnings($m)
0
250
500
750
1000
1250
1500
571
1,15
0
0908
Operating margin(%)
0
14
28
42
56
70
43.6
62.3
0908
Share of Group net operating assets(%)
0
10
20
30
40
27
32
0908
Forecast conceptual production 10+ year outlook
Group potential iron ore production(Mt)
120
150
Year
90
60
30
0
Existing and approvedMajor unapproved growth pipeline
Source: Anglo American
09 11 12 1310 F
F
Group iron ore production(Mt)
40
50
Year
30
20
10
0
SishenThabazimbiAmapa
05 07 08 0906
70 Anglo American plc Fact Book 2009/10
Financial highlights(1)Iron Ore and Manganese
(1) Due to the portfolio and management structure changes announced in October 2009, the segments have changed from those reported at 31 December 2008. 2008 comparatives have been reclassified to align with current year presentation. The segment results include an allocation of corporate costs.

Anglo American plc Fact Book 2009/10 71
Iron Ore and
Manganese
Financial data
US$m 2009 2008
TurnoverSubsidiaries 2,816 2,573 Joint ventures – – Associates 603 1,526 Total turnover 3,419 4,099 Of which:Kumba Iron Ore 2,816 2,573 Samancor 603 1,526 EBITDA 1,593 2,625 Of which:Kumba Iron Ore 1,562 1,632 Iron Ore Brazil (135) (5)Samancor 166 998
Depreciation and amortisation 104 71Operating profit before special items and remeasurements 1,489 2,554Of which:Kumba Iron Ore 1,487 1,583 Iron Ore Brazil (141) (9)Samancor 143 980 Operating special items and remeasurements (1,139) (620)Operating profit after special items and remeasurements 350 1,934
Net interest, tax and minority interests (918) (1,404)
Underlying earnings 571 1,150Of which:Kumba Iron Ore 490 523 Iron Ore Brazil (119) (31)Manganese 200 658
Net operating assets 10,370 10,457
Capital expenditure 1,044 783

72 Anglo American plc Fact Book 2009/10
Iron Ore and Manganese
Iron Ore includes a 62.76% shareholding in Kumba Iron Ore in South Africa. Iron Ore Brazil has a 100% interest in the Minas Rio iron ore project, a 49% shareholding in LLX Minas Rio, which owns the port of Açu (currently under construction) from which iron ore from the Minas Rio project will be exported, and a 70% interest in the Amapá iron ore system.
Kumba, listed on the Johannesburg Stock Exchange, operates two mines – Sishen in the Northern Cape, which produced 39.3 Mt of iron ore in 2009, and Thabazimbi in Limpopo, which had a production of 2.6 Mt in 2009. Kumba is a leading supplier of seaborne iron ore, and exported more than 80% of its total iron ore sales volumes in 2009, with 75% of these exports destined for China and the remainder to Europe, Japan and South Korea.
The Minas Rio iron ore project is located in the states of Minas Gerais and Rio de Janeiro and will include open pit mines and a beneficiation plant in Minas Gerais producing high grade pellet feed. The completion of phase 1 will see transportation of ore through a slurry pipeline more than 500 kilometres to the port of Açu
in Rio de Janeiro state. Amapá, located in Amapá state in northern Brazil, is in the process of ramping up its pellet feed and sinter feed production and expects to produce 4.0 Mt in 2010. Amapá production could increase to 6.5 Mtpa with further capital investment.
Manganese comprises a 40% shareholding in Samancor Holdings, which owns Hotazel Manganese Mines and Metalloys, both situated in South Africa, and a 40% shareholding in each of the Australian-based operations Groote Eylandt Mining Company (GEMCO) and Tasmanian Electro Metallurgical Company (TEMCO), with BHP Billiton owning 60% and having management control. Samancor is the world’s largest producer of seaborne manganese ore and is among the top three global producers of manganese alloy. Its operations produce a combination of ores, alloys and metal from sites in South Africa and Australia. In July 2009, Samancor sold 26% of Hotazel Manganese Mines in a series of transactions designed to comply with South Africa’s black economic empowerment requirements.
Business overview
Financial highlights: Iron Ore and Manganese $ million (unless otherwise stated) 2009 2008
Operating profit 1,489 2,554Kumba Iron Ore 1,487 1,583Iron Ore Brazil (141) (9)Samancor 143 980
EBITDA 1,593 2,625Net operating assets 10,370 10,457Capital expenditure 1,044 783
Share of Group operating profit 30% 25%Share of Group net operating assets 27% 32%
42Mt – iron ore output at Kumba in 2009
>80%Proportion of iron ore for export at Kumba
5.0Bt – Measured, Indicated and Inferred resources for Minas Rio

2
1
1
1
1
2
2
1 3
●
Anglo American plc Fact Book 2009/10 73
Iron Ore and
Manganese
Key Open Cut Port Other●
South America1 100% Minas-Rio (Brazil)2 70% Amapá (Brazil)3 49% LLX Minas-Rio (Brazil)
The Minas-Rio project is located in the state of Minas Gerais, Brazil and will include open pit mines and a beneficiation plant producing high grade pellet feed which will be transported, through a slurry pipeline, over 500 km to the Port of Açu in the state of Rio de Janeiro.
Amapá, located in Amapá state in Northern Brazil, is in the process of ramping up its pellet feed and sinter feed production and expects to produce 4.0 Mt in 2010. Amapá production could increase to 6.5 Mtpa with further capital investment.
South Africa1 63% Kumba Iron Ore –
Sishen, Kolomela and Thabazimbi 2 40% Samancor
Production at Kumba iron ore increased by 14% to 41.9 Mt in 2009 as a result of the ramp up of production from the jig plant (Sishen expansion).
Samancor, which is the world’s largest integrated producer by sales of manganese ore and alloys, is headquartered in South Africa.
Australia1 40% GEMCO2 40% TEMCO
The Australian Manganese operations consist of Groote Eylandt Mining Company (GEMCO), situated off the east coast of the Northern Territory of Australia, and Tasmanian Electro Metallurgical Company (TEMCO), which is based at Bell Bay, approximately 55 km from Launceston, Tasmania.

74 Anglo American plc Fact Book 2009/10
Steel is the most widely used of all metals. In 2009, despite the world economic slowdown, world crude steel production reached 1.2 billion tonnes, a decrease of only 8% on 2008, as China, the world’s principal steelmaker, ratcheted up crude steel production on the back of the Chinese government’s substantial fiscal stimulus package. Chinese crude steel output for 2009 was 567.8 Mt, an increase of 67.5 Mt or 13.5% year on year.
In response to returning demand, steel producers across the industry began bringing dormant production capacity online, with multiple blast furnace restarts being reported in the second half of the year. Global steel capacity utilisation reflected these trends, rising from a low of 58.3% in December 2008 to 71.5% in December 2009 – though still significantly below the peaks of over 90% recorded in early 2008.
In 2009, total seaborne iron ore supply increased by 3% from 797 Mt to 819 Mt, largely driven by strong Chinese steel production, with Chinese imports showing a 41% year-on-year rise to 628 Mt. In the early part of the year, Chinese domestic steel production dropped off drastically for a time when spot prices were insufficient to support the high cost, low quality output, but recovered in the second half of the year on the back of higher iron ore prices.
Spot iron ore fines prices recovered from their lows of late 2008 and early 2009. Prices reached their highest 2009 levels in December 2009 of $112/t (for cost and freight (CFR) 63.5% Fe delivered China), thus applying upward pressure on 2010 price negotiations.
As 96% of manganese ore is smelted to produce manganese ferroalloys (such as ferromanganese and silicomanganese), which are used in steel alloying applications, the performance of the manganese alloy industry is the key determinant of ore demand. The early part of 2009 was characterised by significant demand contraction with underlying demand trends masked by stocking and destocking activities across the value chain. Market conditions progressively recovered during the third quarter and continued to improve as global steel production maintained an upward trend. Manganese ore and alloy prices declined significantly during the first half of the year, but increased progressively in the third and fourth quarter owing to improved market conditions, allied with the restocking phase. Manganese alloy prices, however, will be influenced by supply responses resulting from latent capacity in the industry, and both ore and alloy prices will be influenced by steel production trends and the stocking and destocking cycles.
MarketsWorld crude steel production continued to increase during the second half of 2009 compared with both the first half of 2009 and the second half of 2008, with most major steel producing countries posting an increase in output. World crude steel production of 1.2 billion tonnes was, however, markedly lower than the 1.3 billion tonnes produced in 2008. Steel production in China in 2009 increased by 13.5% to 568 Mt. China’s economic growth continues to be robust on the back of strong domestic focused consumption and infrastructure-based stimulus spending. The increase in steel production, coupled with lower Chinese domestic iron ore production, resulted in record seaborne iron ore imports into China. From the second half of 2009, the European, Japanese and South Korean markets have seen a tentative recovery, with an improvement in iron ore demand following some production increases and restocking by the steel industry.
The manganese ore and alloy market reflected the decline in world crude steel production. The market was characterised by uncertainty in ore and alloy demand, masked by stocking and destocking activities and, consequently, prices for ore and alloy declined significantly during the year. Supply cutbacks swept the manganese sector in an effort to match the reduced levels of demand, which were maintained into the third quarter of 2009. Demand began to improve during the second half of the year, when producers responded to the improved order levels by announcing furnace restarts.
Industry overviewIron Ore and Manganese

World finished steel consumptionTonnes (million)
2,21
1
1,99
0
1,81
5
1,54
8
2,21
3
08070605 09
Source: World Steel Association
0
450
900
1,350
1,800
2,250
GlobalChina
World crude steel productionTonnes (million)
0
250
500
750
1000
1250
1500
1,34
6
1,24
7
1,14
4 1,32
7
1,22
0
08070605 09
Other Japan Australia/NZ Middle East Africa South America North America CISEurope
China
Source: World Steel Association
Pellets Pellet feedFines Lump
Estimated global seaborne iron ore demand by product(Mt)
Source: Anglo American
00Year 01 02 03 04 05 06 07 08 09 10 1211 13
1,200
1,400
1,000
800
400
600
200
0
2009-2013 F[CAGR]
20.2%
20.5%
7.4%
5.7%
0
25
50
75
100
125
150
175
200
Jan 07Year Jan 08 Jan 09 Jan 10
Jan 00 Jan 02 Jan 04 Jan 06 Jan 08
2.0
3.5
2.5
3.0
1.5
1.0
0.5
0
160
310
210
260
110
60
US$
/t
Spot Market Analysis (shown to March 2010)
LME Stocks, weeksPrice
Total LME stocks(1) and base metals price index (shown to April 2008)
(1) Al, Cu, Zn, Pb, Ni, Sn, and Cu Comex
Implied 63.5% Fe FOB Brazil US$/t Implied 63.5% Fe FOB Aus US$/tContract 63.5% Fe FOB Brazil US$/t Contract 63.5% Fe FOB Aus US$/t
Source: CRU
Anglo American plc Fact Book 2009/10 75
Iron Ore and
Manganese
Market information

76 Anglo American plc Fact Book 2009/10
The core strategy of the business is to grow Anglo American’s position in iron ore and to supply premium, high quality iron ore products in the face of the declining quality of global iron ore supplies. Anglo American has a unique iron ore resource footprint, with large, high quality resource bases in South Africa and Brazil.
Kumba produces a leading quality lump and is well positioned to supply the high growth Asia-Pacific and Middle East markets. It is also geographically well positioned to supply European steel markets in the light of an expected decline in lump supplies from other sources. Minas Rio will capture a significant part of the high growth pellet feed market with its premium product featuring high iron content and low impurities.
Significant future growth will come from the expansion projects at Minas Rio and Kolomela (previously Sishen South). Minas Rio phase 1 will produce 26.5 Mtpa, with first production scheduled for the second half of 2012, and has the potential to be expanded to up to 80 Mtpa. Resources have increased from 1.2 billion tonnes in 2007 to 5.0 billion tonnes (Measured, Indicated and Inferred) in 2009, with further resource potential. Studies for the expansion of the project have continued to be evaluated during 2009. The Kolomela project is expected to produce 9 Mtpa of iron ore, with initial production scheduled for the first half of 2012 and ramping up to full capacity in 2013.
The manganese strategy is to focus on upstream resources businesses, despite their low-cost alloy smelters having been significant contributors to profit in recent years. In addition, alloy smelters add value to the overall manganese business as they enable Samancor to access markets with an optimal mix of ore and alloy, to optimise production to best suit market conditions and provide ongoing information on the performance of their ores in the smelting process.
ProjectsThe development of the 9 Mtpa Kolomela mine continues and remains on budget and on schedule to deliver first production during the first half of 2012, ramping up to full capacity in 2013. Mining operations commenced during 2009, with the first blast carried out on 17 September 2009. To date, 6 Mt of material has been moved. Since the start of construction activities on the project in 2008, capital expenditure has totalled $367 million, of which $290 million was incurred during 2009.
The pace of construction and project expenditure at Minas Rio is, in large part, dependent upon receiving a number of environmental licences and other permits. A total of 21 licences and permits were granted in the year, key among these were the first part of the Mine and Beneficiation Plant Installation Licence (granted in December), the federal permit for land clearance at the mine and
the approvals of specific permits for the port road modifications. The second part of the Installation Licence is expected to be approved during the course of 2010. Anglo American continues to work with local, state and federal authorities and landowners to ensure that the timing of licence and permit receipts and land acquisitions does not further impact the overall timing of the project.
Project development on the plant and pipeline in 2009 has been focused on the areas of earthworks and civil works. Filtration plant ground improvement works were commenced.At the port, offshore works have continued with the construction of the main trestle, now 2.5 km in length, and dredging works, while the temporary jetty for breakwater construction is nearing completion. Onshore, the quarry for production of the breakwater rock is operational and the quarry-to-port road modifications and construction are progressing. First iron ore production is scheduled for the second half of 2012, with a planned annual capacity in the first phase of 26.5 Mtpa of iron ore pellet feed.
Anglo American’s forecast attributable share of the post-acquisition capital expenditure for the first phase of the project has increased by
The product screening facility under construction at Kumba Iron Ore’s Kolomela project. The mine is on schedule to start production in the first half of 2012, ramping up to full capacity of 9 Mtpa in 2013.
$1.1 billion, from $2.7 billion to $3.8 billion owing to scoping changes at the mine, pipeline and port, as well as foreign exchange movements.
Studies for the expansion of the Minas Rio project continued during 2009. The latest resource statement resulting from geological work, provides a total resource volume (Measured, Indicated and Inferred) of 5.0 billion tonnes, with further upside potential supporting the envisaged expansion of the project.
Strategy and growthIron Ore and Manganese
Anglo American plc Fact Book 2009/10 77
Iron Ore and
Manganese
Country BrazilOwnership 100%Production volume 26.5 Mtpa iron ore pellet feed (wet base) Full project capex $3,796m(1)
Full production Q3 2013
Country South AfricaOwnership* 46.6%Production volume 0.8 Mtpa iron ore Full project capex TBDFull production 2012
Country South AfricaOwnership* 46.6%Production volume 10 Mtpa iron ore Full project capex TBDFull production 2019
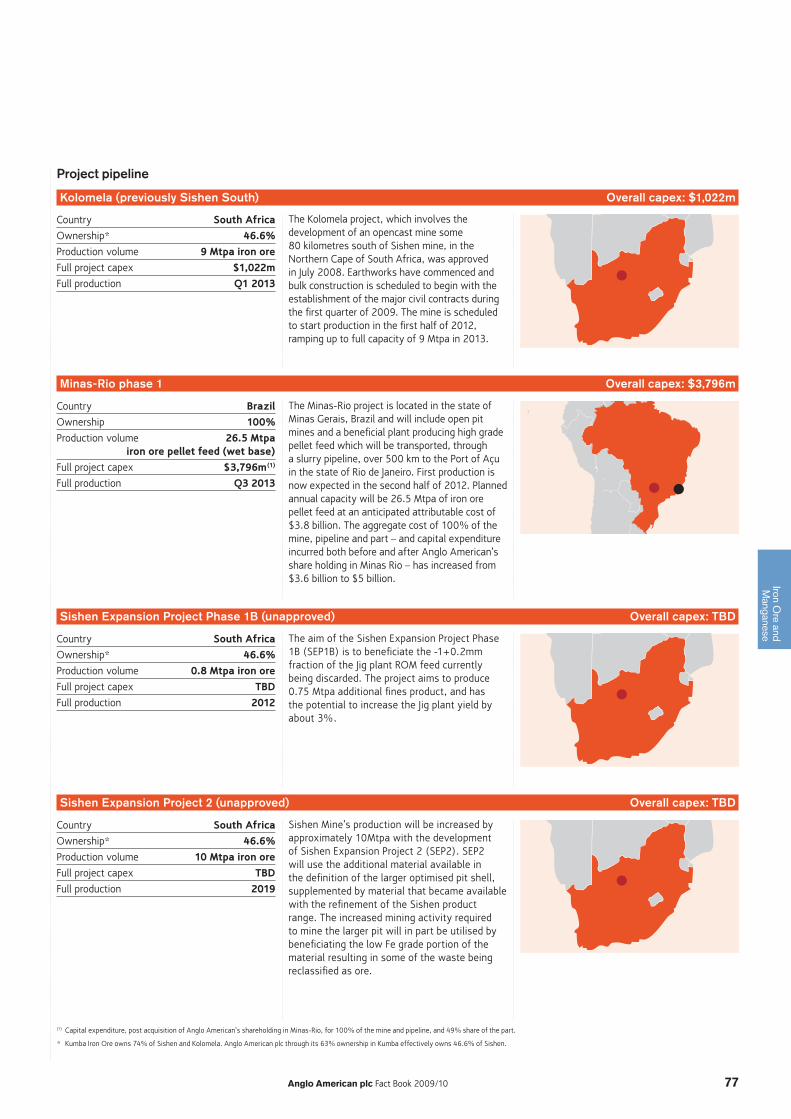
The Minas-Rio project is located in the state of Minas Gerais, Brazil and will include open pit mines and a beneficial plant producing high grade pellet feed which will be transported, through a slurry pipeline, over 500 km to the Port of Açu in the state of Rio de Janeiro. First production is now expected in the second half of 2012. Planned annual capacity will be 26.5 Mtpa of iron ore pellet feed at an anticipated attributable cost of $3.8 billion. The aggregate cost of 100% of the mine, pipeline and part – and capital expenditure incurred both before and after Anglo American’s share holding in Minas Rio – has increased from $3.6 billion to $5 billion.
The aim of the Sishen Expansion Project Phase 1B (SEP1B) is to beneficiate the -1+0.2mm fraction of the Jig plant ROM feed currently being discarded. The project aims to produce 0.75 Mtpa additional fines product, and has the potential to increase the Jig plant yield by about 3%.
Sishen Mine’s production will be increased by approximately 10Mtpa with the development of Sishen Expansion Project 2 (SEP2). SEP2 will use the additional material available in the definition of the larger optimised pit shell, supplemented by material that became available with the refinement of the Sishen product range. The increased mining activity required to mine the larger pit will in part be utilised by beneficiating the low Fe grade portion of the material resulting in some of the waste being reclassified as ore.
* Kumba Iron Ore owns 74% of Sishen and Kolomela. Anglo American plc through its 63% ownership in Kumba effectively owns 46.6% of Sishen.
(1) Capital expenditure, post acquisition of Anglo American’s shareholding in Minas-Rio, for 100% of the mine and pipeline, and 49% share of the part.
The Kolomela project, which involves the development of an opencast mine some 80 kilometres south of Sishen mine, in the Northern Cape of South Africa, was approved in July 2008. Earthworks have commenced and bulk construction is scheduled to begin with the establishment of the major civil contracts during the first quarter of 2009. The mine is scheduled to start production in the first half of 2012, ramping up to full capacity of 9 Mtpa in 2013.
Country South AfricaOwnership* 46.6%Production volume 9 Mtpa iron oreFull project capex $1,022mFull production Q1 2013
Minas-Rio phase 1 Overall capex: $3,796m
Sishen Expansion Project Phase 1B (unapproved) Overall capex: TBD
Sishen Expansion Project 2 (unapproved) Overall capex: TBD
Kolomela (previously Sishen South) Overall capex: $1,022m
Project pipeline

78 Anglo American plc Fact Book 2009/10
Iron Ore and Manganese
2009 2008 2007 2006 2005
Kumba Iron Ore – tonnesLump 25,300,000 22,042,000 19,043,000 18,639,800 18,747,000Fines 16,643,000 14,657,000 13,357,000 12,470,300 12,240,000
41,943,000 36,699,000 32,400,000 31,110,100 30,987,000Amapá(1) – tonnesSinter feed 576,100 128,000 – – –Pellet feed 2,077,100 584,000 – – –
2,653,200 712,000 – – –
Total iron ore production 44,596,200 37,411,000 32,400,000 31,110,100 30,987,000
Samancor(2) – tonnesManganese ore 1,570,000 2,704,000 2,411,000 2,248,000 2,040,000Manganese alloy(3) 129,000 306,000 310,000 256,300 309,000
(1) Production from Amapá is included from 5 August 2008. Amapá production for full year 2008 was 1.2 Mt. At 31 December 2009 Amapá was not in commercial production and therefore to this date all revenue and related costs were capitalised. Commercial production commenced on 1 January 2010.
(2) Saleable production.(3) Production includes Medium Carbon Ferro Manganese.
Production data

Anglo American plc Fact Book 2009/10 79
Iron Ore and
Manganese
Ore Reserve and Mineral Resource estimates as at 31 December 2009
Kumba Iron OreThe Ore Reserve and Mineral Resource estimates were compiled in accordance with The SAMREC Code, 2007. THE MINERAL RESOURCES ARE REPORTED AS ADDITIONAL TO ORE RESERVES.
The figures reported represent 100% of the Ore Reserves and Mineral Resources, the percentage attributable to Anglo American plc is stated separately. Rounding of figures may cause computational discrepancies.
Iron Ore Tonnes Grade Saleable product
Ore Reserves Attributable % LOM Classification 2009 2008 2009 2008 2009 2008
Sishen Mine (OP)(1) 36.5 21 Mt Mt %Fe %Fe Mt Mt
Proved 707.6 709.2 59.2 59.7 [email protected]%Fe [email protected]%Fe
Probable 203.9 247.7 59.2 59.3 [email protected]%Fe [email protected]%Fe
Total 911.5 956.9 59.2 59.6 [email protected]%Fe [email protected]%Fe
Thabazimbi Mine (OP)(2) 46.4 6 %Fe %Fe
Proved 9.5 4.1 61.7 64.5 [email protected]%Fe [email protected]%Fe
Probable 4.7 0.8 61.3 64.9 [email protected]%Fe [email protected]%Fe
Total 14.2 4.9 61.5 64.6 [email protected]%Fe [email protected]%Fe
Kolomela Mine (OP)(3) 46.4 28 %Fe %Fe
Proved 123.1 123.1 64.2 64.2 [email protected]%Fe [email protected]%Fe
Probable 91.0 91.0 63.9 63.9 [email protected]%Fe [email protected]%Fe
Total 214.1 214.1 64.1 64.1 [email protected]%Fe [email protected]%Fe
Iron Ore Tonnes Grade
Mineral Resources Attributable % Classification 2009 2008 2009 2008
Sishen Mine (OP)(4) 36.5 Mt Mt %Fe %Fe
Measured 589.1 758.7 56.0 54.9
Indicated 697.0 715.5 57.6 57.4
Measured and Indicated 1,286.1 1,474.1 56.8 56.1
Inferred (in LOM) 3.7 4.1 58.2 61.8
Inferred (ex. LOM) 148.7 150.2 59.4 59.2
Total Inferred 152.4 154.3 59.4 59.3
Thabazimbi Mine (OP)(5) 46.4 %Fe %Fe
Measured 9.5 18.7 62.7 62.3
Indicated 2.4 4.9 63.7 63.4
Measured and Indicated 11.9 23.6 62.9 62.5
Inferred (in LOM) 1.3 0.3 61.9 61.8
Inferred (ex. LOM) 2.3 2.6 63.4 63.4
Total Inferred 3.6 2.9 62.8 63.3
Kolomela Mine (OP)(3)(6) 46.4 %Fe %Fe
Measured 49.5 49.5 65.0 65.0
Indicated 20.8 20.8 64.9 64.9
Measured and Indicated 70.3 70.3 64.9 64.9
Inferred (in LOM) 35.4 35.4 65.6 65.6
Inferred (ex. LOM) 47.4 47.4 62.5 62.5
Total Inferred 82.9 82.9 63.8 63.8
Mining method: OP = Open Pit. LOM = Life of Mine in years based on scheduled Ore Reserves. The tonnage is quoted as dry metric tonnes and abbreviated as Mt for million tonnes. The Mineral Resources are constrained by a resource pit shell, which defines the spatial limits of eventual economic extraction. Due to the uncertainty that may be attached to some Inferred Mineral Resources, it cannot be assumed that all or part of an Inferred Mineral Resource will necessarily be upgraded to an Indicated or Measured Resource after continued exploration. The Zandrivierspoort Project is not reported as Anglo American’s shareholding (23.2%) is below the internal threshold for reporting. Details of this project are presented in the Kumba Iron Ore Annual Report.(1) Sishen Mine – Ore Reserves: The decrease is mainly as a result of depletion due to mining, marginally negated by a minor correction made for over-estimation of Ore Reserve depletion in 2008 and a small increase in
Ore Reserves based on a revised scheduling process that allows for a slight improvement in resource utilisation.(2) Thabazimbi Mine – Ore Reserves: The primary reason for the net increase is a complete revision of the conversion process of Mineral Resources into Ore Reserves in 2009. The conversion gain was offset by mining
depletion; a correction made for the under-estimation of production in 2008 and the downgrading of Probable Ore Reserves to Inferred Mineral Resources considered for the life-of-mine plan due to an associated geotechnical risk. Geological block model updates in 2009 resulted in a further addition of Ore Reserves. The cut-off grade used for the Thabazimbi Mine life-of-mine scheduling is a Saleable Product %Fe cut-off grade and all material that could be beneficiated to at least this cut-off value was included in the schedule as ROM.
(3) Kolomela Mine: The Sishen South Iron Ore Project has been renamed to Kolomela Mine.(4) Sishen Mine – Mineral Resources: The 2009 Mineral Resources represent the combination of the previously reported Within Pit and Outside Pit resources. The decrease is primarily the result of a downward adjustment of
the in situ %Fe grade estimate of low-grade ore material based on new information. This decrease in iron grade resulted in previously-defined ore material being transferred to waste. The loss is not in the current life of mine plan.
(5) Thabazimbi Mine – Mineral Resources: The 2009 Mineral Resources represent the combination of the previously reported Within Pit and Outside Pit resources. The decrease is primarily due to a conversion to Ore Reserves based on a complete revision of the Ore Reserve estimation in 2009.
(6) Kolomela Mine – Mineral Resources: The 2009 Mineral Resources represent the combination of the previously reported Within Pit and Outside Pit resources.
Audits related to the generation of the Ore Reserve and Mineral Resource statements were carried out by independent consultants during 2009 at the following operations: Kolomela Mine
80 Anglo American plc Fact Book 2009/10
Ore Reserve and Mineral Resource estimates as at 31 December 2009continued
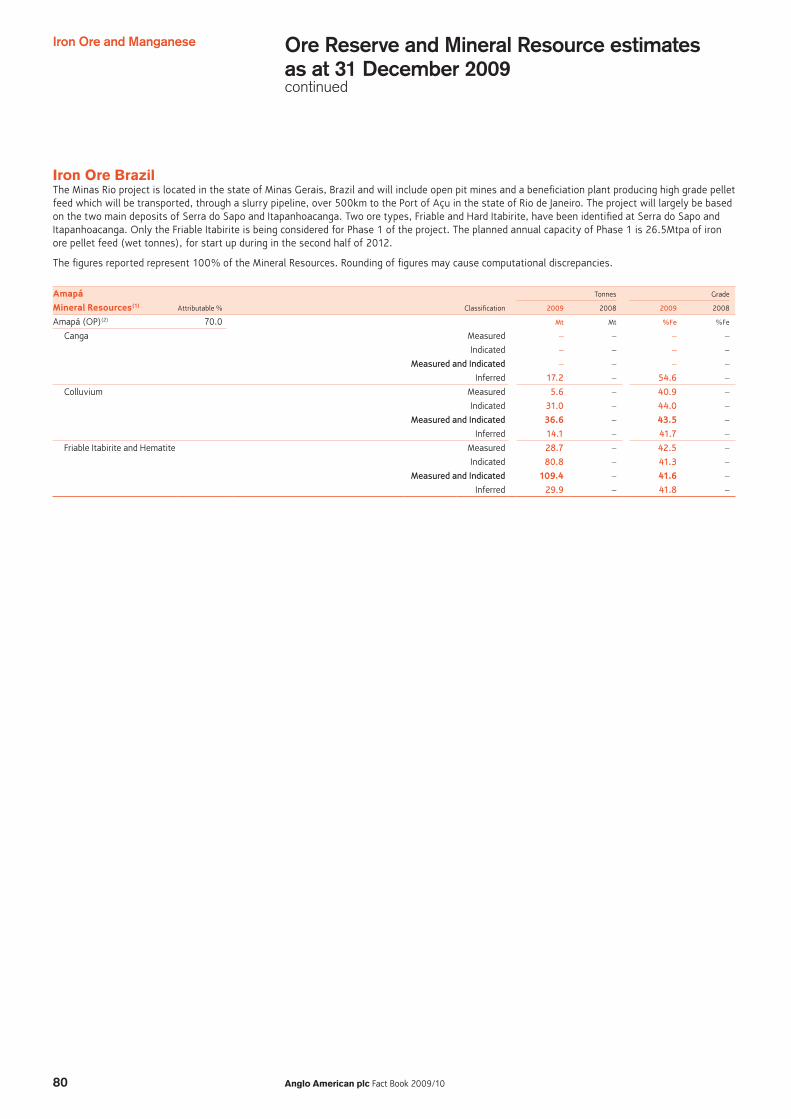
Iron Ore BrazilThe Minas Rio project is located in the state of Minas Gerais, Brazil and will include open pit mines and a beneficiation plant producing high grade pellet feed which will be transported, through a slurry pipeline, over 500km to the Port of Açu in the state of Rio de Janeiro. The project will largely be based on the two main deposits of Serra do Sapo and Itapanhoacanga. Two ore types, Friable and Hard Itabirite, have been identified at Serra do Sapo and Itapanhoacanga. Only the Friable Itabirite is being considered for Phase 1 of the project. The planned annual capacity of Phase 1 is 26.5Mtpa of iron ore pellet feed (wet tonnes), for start up during in the second half of 2012.
The figures reported represent 100% of the Mineral Resources. Rounding of figures may cause computational discrepancies.
Amapá Tonnes Grade
Mineral Resources(1) Attributable % Classification 2009 2008 2009 2008
Amapá (OP)(2) 70.0 Mt Mt %Fe %Fe
Canga Measured – – – –
Indicated – – – –
Measured and Indicated – – – –
Inferred 17.2 – 54.6 –
Colluvium Measured 5.6 – 40.9 –
Indicated 31.0 – 44.0 –
Measured and Indicated 36.6 – 43.5 –
Inferred 14.1 – 41.7 –
Friable Itabirite and Hematite Measured 28.7 – 42.5 –
Indicated 80.8 – 41.3 –
Measured and Indicated 109.4 – 41.6 –
Inferred 29.9 – 41.8 –
Iron Ore and Manganese

Anglo American plc Fact Book 2009/10 81
Iron Ore and
Manganese
Minas Rio Iron Ore Project Tonnes Grade
Mineral Resources(3) Attributable % Classification 2009 2008 2009 2008
Itapanhoacanga (OP)(4) 100 Mt Mt %Fe %Fe
Friable Itabirite and Hematite Measured 25.0 – 42.5 –
Indicated 219.2 90.0 41.6 39.6
Measured and Indicated 244.2 90.0 41.7 39.6
Inferred 74.7 362.0 41.7 38.0
Hard Itabirite Measured 10.9 – 33.2 –
Indicated 95.8 – 33.8 –
Measured and Indicated 106.7 – 33.7 –
Inferred 43.9 51.0 33.2 33.2
Serra do Sapo (OP)(5) 100 %Fe %Fe
Friable Itabirite and Hematite Measured 498.1 462.0 38.6 38.1
Indicated 872.5 565.8 37.0 37.5
Measured and Indicated 1,370.5 1,027.8 37.6 37.8
Inferred 192.2 143.9 33.1 34.3
Hard Itabirite Measured 453.8 – 31.8 –
Indicated 1,968.3 1,650.5 31.2 31.0
Measured and Indicated 2,422.1 1,650.5 31.3 31.0
Inferred 149.4 680.8 30.3 30.3
Serro (OP)(6) 100 %Fe %Fe
Friable Itabirite and Hematite Measured – – – –
Indicated 9.5 46.0 63.6 33.3
Measured and Indicated 9.5 46.0 63.6 33.3
Inferred 74.2 54.0 35.3 28.7
Hard Itabirite Measured – – – –
Indicated – 79.0 – 29.5
Measured and Indicated – 79.0 – 29.5
Inferred 308.2 259.0 31.6 30.7
Mining method: OP = Open Pit. Due to the uncertainty that may be attached to some Inferred Mineral Resources, it cannot be assumed that all or part of an Inferred Mineral Resource will necessarily be upgraded to an Indicated or Measured Resource after continued exploration.(1) Amapá – Mineral Resources: The cut-off grade used is 25% Fe. Assays are on a dry basis. Tonnages are reported on a wet basis with an average moisture content of 10 wt% for Colluvium and 8 wt% for Friable Itabirite
and Hematite ore. (2) Amapá : Includes the Mário Cruz, Martelo, Taboca, Taboca Leste and Vila do Meio areas. The Taboca Leste area comprises the following Inferred Resources: Canga – 1.5Mt @ 42.6% Fe, Colluvium – 10.9Mt @ 41.7% Fe
and Friable Itabirite – 23.8Mt @ 41.4% Fe. Friable Itabirite and Hematite includes Friable Itabirite, Altered Friable Itabirite and Friable Hematite.(3) Minas Rio Project – Mineral Resources: The cut-off grade used is 25% Fe. Assays are on a dry basis. Tonnages are reported on a wet basis with an average moisture content of 5 wt% for Friable ore. Friable Itabirite and
Hematite includes Friable Itabirite, Semi-Compact Itabirite and Friable Hematite. (4) Itapanhoacanga: 2008 figures comprise material above 20% Fe cut-off grade. Low grade Mineral Resources (between 20% Fe and 33% Fe) were included in table footnotes in 2008 and are now combined with the
previously reported high grade Mineral Resources. Friable Itabirite and Hematite includes Friable Itabirite, Semi-Compact Itabirite, Soft Hematite and Hard Hematite. A portion of the adjacent Quartz-X Mineração Ltd property is included in the 2009 figures (Measured = 0.4Mt @ 43.1% Fe, Indicated = 23.8Mt @ 41.2% Fe, Inferred = 22.4Mt @ 41.0% Fe).
(5) Serra do Sapo: Friable Itabirite and Hematite includes Friable Itabirite, Semi-Compact Itabirite and Soft Hematite. The Friable Itabirite and Hematite includes an area containing high Alumina content (28.1Mt). Mineração Trindade Ltd properties are included in the 2009 figures (Indicated = 40.3Mt @ 32.1% Fe, Inferred = 3.2Mt @ 31.7% Fe).
(6) Serro: 2008 figures comprise material above 20% Fe cut-off grade. Low grade Mineral Resources (between 20% Fe and 33% Fe) were included in table footnotes in 2008 and are now combined with the previously reported high grade Mineral Resources. Friable Itabirite and Hematite includes Friable Itabirite, Semi-Compact Itabirite and Hard Hematite (9.5Mt @ 63.6% Fe).
Audits related to the generation of the Mineral Resource statements were carried out by independent consultants during 2009 at the following operations and projects: Amapá, Itapanhoacanga, Serra do Sapo and Serro

82 Anglo American plc Fact Book 2009/10
Samancor ManganeseThe Ore Reserve and Mineral Resource estimates were compiled in accordance with The SAMREC Code, 2007 and The JORC Code, 2004 as applicable. THE MINERAL RESOURCES INCLUDE ORE RESERVES.
The figures reported represent 100% of the Ore Reserves and Mineral Resources (source: BHP Billiton). Rounding of figures may cause computational discrepancies.
Manganese Tonnes Grade Yield
Ore Reserves Attributable % LOM Classification 2009 2008 2009 2008 2009 2008
GEMCO (OP)(1) 40.0 14 Mt Mt %Mn %Mn % %
Proved 67.5 71.9 46.8 48.2 50.8 49.4
Probable 43.2 43.9 46.4 47.1 47.9 47.0
Total 110.7 115.8 46.7 47.8 49.7 48.5
Hotazel – Mamatwan (OP)(2)(3) 36.4 22 %Mn %Mn
Proved 53.6 40.5 37.8 37.7
Probable 24.8 8.1 37.2 36.8
Total 78.4 48.6 37.6 37.6
Hotazel – Wessels (UG)(2)(4) 36.4 49 %Mn %Mn
Proved 5.1 3.9 45.5 46.5
Probable 68.4 14.9 43.0 45.3
Total 73.5 18.8 43.2 45.5
Manganese Tonnes Grade Yield
Mineral Resources Attributable % Classification 2009 2008 2009 2008 2009 2008
GEMCO (OP)(5) 40.0 Mt Mt %Mn %Mn % %
Measured 71.2 74.6 46.3 46.3 44.4 44.2
Indicated 46.6 47.5 46.0 46.0 44.0 44.0
Measured and Indicated 117.9 122.1 46.2 46.2 44.2 44.1
Inferred 39.0 39.1 43.3 43.4 45.2 44.1
Hotazel – Mamatwan (OP)(2)(6) 36.4 %Mn %Mn
Measured 79.6 51.8 35.8 37.6
Indicated 45.3 13.9 34.3 36.3
Measured and Indicated 124.9 65.7 35.3 37.3
Inferred 3.1 1.7 33.1 35.6
Hotazel – Wessels (UG)(2)(7) 36.4 %Mn %Mn
Measured 12.1 6.7 46.3 47.3
Indicated 132.0 119.6 44.2 44.0
Measured and Indicated 144.1 126.3 44.4 44.1
Inferred – – – –
Mining method: OP = Open Pit, UG = Underground. LOM = Life of Mine in years based on scheduled Ore Reserves. Mamatwan tonnages stated as wet metric tonnes. Wessels and GEMCO tonnages stated as dry metric tonnes. Due to the uncertainty that may be attached to some Inferred Mineral Resources, it cannot be assumed that all or part of an Inferred Mineral Resource will necessarily be upgraded to an Indicated or Measured Resource after continued exploration.(1) GEMCO – Ore Reserves: Changes are the result of pricing changes between FY08 and FY09.(2) Hotazel Manganese Mines: An agreement has been reached between Hotazel Manganese Mines and empowerment consortium Ntsimbintle Mining (Pty) Ltd. The Ntsimbintle agreement has been signed by both parties
and approved by the South African Government. This transaction allows for the inclusion of part of the Prospecting Rights held by Ntsimbintle into the Mamatwan and Wessels Mining Area in exchange for 9% equity in Hotazel Manganese Mines, thereby adding the resources within the Ntsimbintle Prospecting Right to the Mamatwan and Wessels Mining Rights through a Section 102 conversion. The rights have been transferred to and are now held by a new company called Hotazel Manganese Mines (Pty) Ltd, effective as at 16 April 2009 subsequent to a section 11 (Act 28/2002) approval by the South African Department of Minerals and Energy (DME). The Anglo American share of Wessels and Mamatwan mines (Hotazel Manganese Mines) therefore drops to 36.4%.
(3) Mamatwan – Ore Reserves: Changes in tonnages are due to a refinement of densities used for various zones within the orebody, inclusion of Ntsimbintle Ore Reserves, changes in final pillar layout (due to inclusion of Ntsimbintle Ore Reserves) resulting in more reserves being available for mining and depletion due to production.(4) Wessels – Ore Reserves: The main reasons for the increase in Ore Reserves are the inclusion of the Upper Body into the LOM Plan, the inclusion of the Ntsimbintle part of the Lower Body, refinement of the geological
model after the addition of new drillhole and geological data and production depletion. New scheduling software and updated modifying factors have been used for the resource to reserve conversion.(5) GEMCO – Mineral Resources: All changes are as a result of depletion due to mining.(6) Mamatwan – Mineral Resources: Mineral Resources have been declared above a 35% Mn cut-off grade and now includes Mineral Resources contributed by Ntsimbintle Mining (Pty) Ltd. A major positive change in
tonnage is due to the inclusion of the balance of the Top Cut (after removal of the X-zone). Changes also due to a refinement in the density methodology used. the X Zone and Top Cut (Balance) are also declared as Mineral Resource. As a matter of course, this material has to be mined in the process of accessing the economic M, C and N Zones and, depending on market conditions, now has potential economic value. Please note that the modelling and tonnage declaration of an area of 118,753 m² on the western side within the Ntsimbinle portion remains outstanding due to insufficient data. This will, following the approval of the South African Government and delineation of official boundaries, be evaluated for inclusion in 2010.
(7) Wessels – Mineral Resources: Figures include those resources contributed by Ntsimbintle Mining (Pty) Ltd. A decrease in the Upper Body resource is reported after a complete rerun of the block model with the addition of new drillhole data and subsequent geological re-interpretation. Changes in the Lower Body Resource are, apart from production depletion, due to a rerun of the block model with the addition of new drillhole and underground face sampling data, geological re-interpretation, adjustment of the sub-outcrop position in places and the addition of re-evaluated remnant ore blocks.
Ore Reserve and Mineral Resource estimates as at 31 December 2009continued
Iron Ore and Manganese